Embed Size (px)
Citation preview

DIMETIC DOctoral School
Pecs, July 11-12, 2007
THE NEW DYNAMICS OF SCIENCE
AND EUROPEAN SCIENTIFICINSTITUTIONS
Prof Andrea Bonaccorsi
University of Pisa

Outline
1. Informational vs search models in economics ofscience
2. The dynamics of search in new leading sciences
• Rate of growth
• Diversity
• Nature of complementarity
3. The performance of European science in the lastthree decades
4. Better institutions vs better policies in Europeanscience

Theoretical background: Economics of science
Nelson (1959), Arrow (1962): information as public good.
Non rivalry and non appropriability responsible forunderinvestment.
Economic implications are derived from intrinsiccharacteristics of information (“science as a good” vs “scienceas a process”)
Informational model
E.g. Search models (Stigler, Marschack, Radner; Evensonand Kislev; David, Mowery, Steinmuller)
Dasgupta and David (1995, 1996): add to the properties ofinformation the dimension of information asymmetry

Informational model plus information asymmetry
- scientists are more informed than any others on the contentof experiments (e.g. other scientists that may want to controland replicate the experiment)
- scientists are agents that work for principals
- norms of science (Mertonian “Republic of science”) solve forthe information asymmetry and incentive problem:
- priority rule (winner takes all)
- full disclosure of the procedures of experimentation
- open science
Main focus on the explanation of general scientific institutionsafter Galileo

Problems with informational model
- difficult to articulate other dimensions of informationasymmetry:
- government, funding agencies- civil society, accountability issues
- the public and/or private nature of knowledge cannot bederived from intrinsic properties of the good produced(coevolution of institutions and type of knowledge produced)
- impossible to address issues of direction and rate ofchange of scientific knowledge
- informational models of topics selection (David, Dalle,Carayol) are an exception

Structural or topological models
- Simon (1962): in order to understand the behavior of agentsin a complex system, there are two possible strategies:
- make very detailed assumptions on agents’ rationalityand build models that predict their behavior on thebasis of an objective function
- make simple assumptions on cognitive abilities ofagents and concentrate on environmental constraints,or the structure of the search space
The ant metaphor.

Topological models in science
- scientists are the best possibly informed people in anygiven field- it is impossible for the modeler to build up arepresentation of the problem which is close (or evenbetter) to the one held by scientists- consequently, predictive models of the informational typewill not be able to add anything to the simple observationof scientists’ behavior- trying to represent the structure of the problem spacethey are searching in is an interesting alternative(Bonaccorsi, 2005)
Models of search dynamics in the problemspace

Dynamics of science
The problem of characterizing the growth of knowledge inscience is an old one in philosophy and sociology of science:
- Popper’s notion of growth via conjectures and confutation
- distinction between context of discovery and context ofjustification
- Kuhnian scientific paradigms
- De Solla Price: the ideal of quantitative laws of growth
- Campbell’s model of evolutionary cultural change (variation,selection, retention)
- Peirce, Rescher: economic laws in growth of knowledge,diminishing returns
- debate on the limits of growth of knowledge (Casti)

New leading sciences
Sciences born in XX century, grown after Second WorldWar, exploded in the last quarter of XX century:
Life sciences
Information sciences
Materials sciences (including Nanoscience)
All these sciences deal with complex, hierarchicalsystems (human body, mind, computer, multilayeredmaterials) and with their intersections (e.g. biorobotics,neurosciences, bioninformatics)
All these sciences share an approach based onmethodological reductionism

Stylized facts in late XX century- early XXIcentury science
Acceleration in the rate of growth of production ofscientific results
Proliferation of diversity in scientificprogrammes
New forms of complementarity in research

Evidence from Nanopublications
0
20000
40000
60000
80000
100000
120000
140000
1988 1989 1990 1991 1992 1993 1994 1995 1996 1997 1998 1999 2000 2001
Cumulate arrivial of publications Cumulate entry of authors Cumulate entry of affiliations
Source: Bonaccorsi and Thoma (2005)

High rate of growth
Average rate of growth of scientific production is 1-2% peryear. Fast moving fields grow 5-15% per year. A growth rateof 5% for many years means destabilisation.
These fields are most likely found in new sciences (information, life, materials,nano).
Implications
• Mechanisms for rapid growth of research labs orinstitutes (funding, staff)
• Formalized postgraduate education and post-doc positions
• Extremely high opportunity costs for junior scientists
• High mobility in research careers
• Need for rapidity of decisions in priority setting atgovernment level

Dynamics of growth
Theoretical background on variety/ diversity in science
Professional norms of science (Merton)
Reduction of variety as a result of internal professionaldynamics (Callon)
Variety and diversity in science mainly comes fromparadigmatic uncertainty (Kuhn)
Within normal science there is limited variety:convergence towards a common framework
Dynamics of growth
Notion of divergent dynamics (or proliferation)
Large intra-paradigmatic diversity
Research programmes sharing fundamentalexplanations but diverging on lower level hypothesesor experimental techniques/ objects
Main reasons:A. reductionism in explanation vs systemicintegration
B. observation vs manipulation
C. new forms of combination between science andengineering

Reductionism in explanation vs systemicintegration
Experimental advancements make it possible to explainphenomena by making reference to variables at lowerlevel of resolution of matter (i.e. molecular and atomiclevel).
Reductionist approach: explaining higher levels oforganization of matter using knowledge of lowerlevels. “One gene, one disease” programme.
Interestingly, when applied to complex objects orsystems (i.e. proteins, or cells, tissues, organs) andtheir behavior (e.g. disease) the reductionist approachdoes not lead to complete explanation- it does notreduce but rather increases epistemic uncertainty.

HIV-1
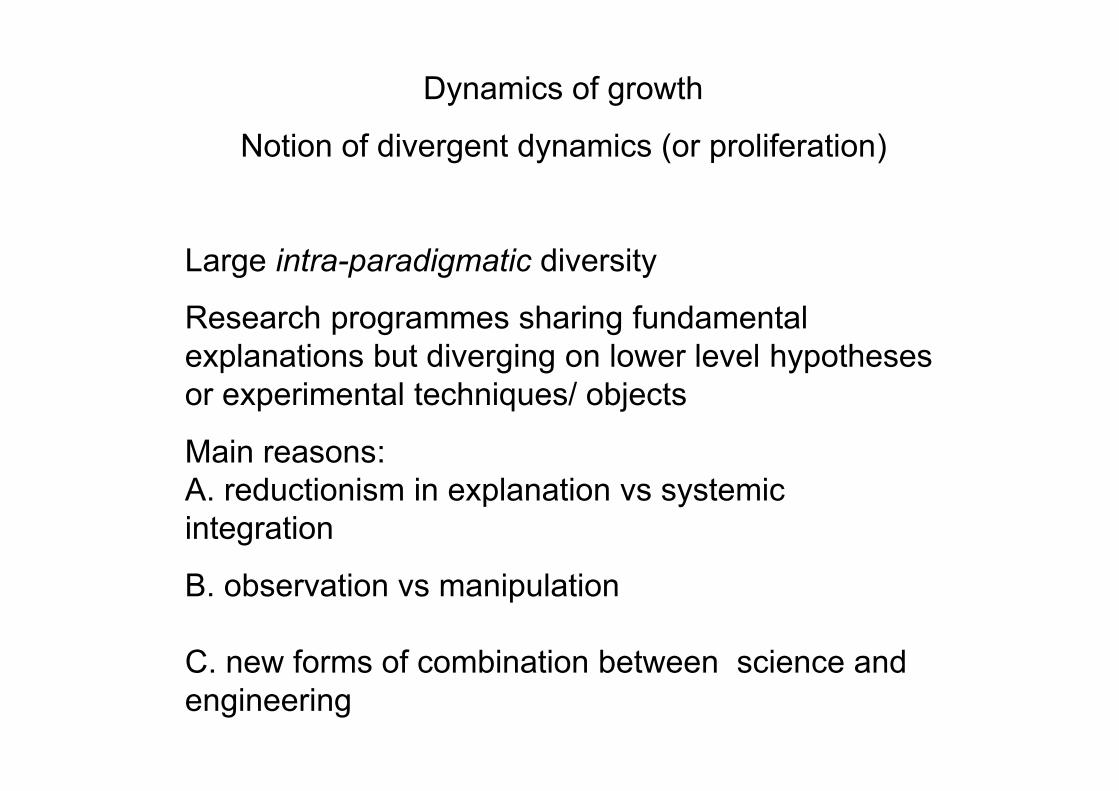
The case of HIV research
The search for a causal explanation of the AIDS diseasewas solved with the discovery of HIV virus.
However, this fundamental explanation (“the cause of thediseases lies in the agent HIV”) over which the scientificconsensus was almost universal, did not reduce theuncertainty over:- the specific biochemical mechanisms of interaction of thevirus with the cell- the entry points of the virus in the cell- the patterns of mutation of HIV, etc.
The reductionist approach did not produce a reduction adunum, but rather opened the way for a proliferation ofdiverse (even competing) sub-hypotheses.

Uncertainty about basicequations
A schematic representation of the degree of uncertainty that exists in theunderlying mathematical equations describing various phenomenarelative to the intrinsic complexity of the phenomena
Complexity of phenomena
QuantumGravity
ParticlePhysics
Chemicalreactions
Dynamics of Meteorology Turbulencesolar system
Appliedsciences
Living systems
Climate
Social scienceEconomicsFinance
Source: Barrow (1998) after Ruelle

Observation vs manipulation
In the development of science there has always beenseparation between the level of resolution at which itcould be possible at any date:- make predictions- observe- manipulate
New experimental technologies, e.g.- scanning tunneling microscope (1981)- polymerase chain reaction (1985)- atomic force microscope (1986)
These technologies make it possible to manipulatebefore observing, or to observe before makingpredictions

Science-driven engineering
New sciences make it possible new combinationsbetween scientific explanation (knowing theproperties of nature) and engineering (manipulatingnature for a purpose)
New relations between natural and artificial, discoveryand invention:- the fundamental properties of matter cannot bediscovered unless a specific configuration is designed- design is an artificial activity oriented towards goals- design goals can be achieved following manypossible directions (design theory)-“scientists become engineers”
Large scale exploration through manipulation

Measuring the dynamics of proliferation
Experimental workNew measure of variety derived from bipartite graphtheory
Dataset:- >100,000 publications in Nano S&T- query from ISI Fraunhofer Karlsruhe expert selection- part of a larger data construction exercise (PRIMEproject)- period 1990-2001- extraction of all keywords- isolation of new keywords per year of birth
References:- Bonaccorsi & Thoma, Research Policy, 2007- Bonaccorsi & Vargas, in progress

1990199119921993199419951996199719981999200020010
1000
2000
3000
4000
5000
6000
7000
8000
9000
10000
11000
12000
Num
ber
of k
eyw
ords
Occurrence year
Birth year
1990 1991 1992 1993 1994 1995 1996 1997 1998 1999 2000

0 250 500 750 1000 1250 1500 1750 2000 2250 2500
1990
1991
1992
1993
1994
1995
1996
1997
1998
1999
2000
2001
Num
ber o
f keyw
ord
s
[11983]
[1601]
[1662]
[1473]
[1568]
[1486]
[1449]
[1350]
[1486]
[1750]
[3181]
[716]
Birth
year
Degree k
150
300
450
600
Degree hW
(Occurrencesin 2001)
FILM
Atomic Force Microscopy
Nanoparticles
Ion Channel
thin film
system
Particleprotein
Biosensor
Nanostructures
FULLERENE

Limit case 1: all new articles share the same set of keywords > no correlationbetween number of articles and degree. Limit case 2: all articles share only onekeyword: perfect correlation between number of articles and degree.

0 100 200 300 400 500 600 700 800
0
500
1000
1500
2000
2500
3000
3500
4000
4500
5000
Deg
ree k
Degree hW (occurrences)
Class A Class B Class A curve
Class B curve
Limit case 1 Limit case 2
Birth year1992≤
Birth year1992≤Class A =

0 50 100 150 200 250 300 350 400 450 500 550 600
0
500
1000
1500
2000
2500
Degree hW (occurrences)
Deg
ree k

Proliferation pattern
• Large cognitive distance between senior scientists andjunior scientists- doctoral education based on competitiveallocation of resources and proposals
• Impossibility to decide research directions in a centralizedway- multilayer governance and funding systems
• Need to finance competing research projects- variety offunding sources (but mainly grant-like)
• Need to mobilize research projects in parallel- welldeveloped post doc system with possibility to apply asprincipal investigators
• Strong epistemic uncertainty- premium given to topquality universities (signaling effect)

An ant model of science
In the paper by Solé et al. (Artificial Life, 2000)“Pattern formation and optimization in Army AntRaids” a model of food search behavior for ants isdeveloped, based on findings from etology.
There are two levels:1. A behavioral model (search algorythms)2. A macromodel, that evaluates the search
strategies through a macroevolutionary algorythm

The ant model of scienceAt each step the ant must evaluate environmental factors P (D, i, j)(=probability to find food of size D in cell i,j) and pheromon signals φ leftby other ants in order to decide whether to move and where.
First of all the ant must decidewhether to move; the probabilityto move Pm depends on theoverall concentration of pheromonin cells ahead.
In moving the ant releasespheromon on the ground. If theant is looking for food, it releasesone unit of pheromon. If the ant isgoing back to the colony it releasesq units.
The threshold of release ofpheromon in the journey forwardis
The threshold in the journey backis
These thresholds govern the trade-off between exploration eexploitation.
1σ2σ

Variables(deterministic part of the model).
The environment is represented by a grid.•P(D,i,j) : probability to find food of size D in the cell(i,j).• 1 , if the ant is searching food;
=
0 , if the ant is going back to the colony• δ : rate of decay of pheromon left by ants
)(tSk

• φ(i,j) : concentration of pheromon in the cell (i,j).The quantity is updated at each step : φ(i,j) (1-δ)φ(i,j).
• : threshold of release of pheromon in the wayforward.• : threshold of release of pheromon in the wayback to the colony.• µ : attractiveness of the empty cells.
• q : quantity of pheromon released at each step inthe way back (in the way forward the quantity isalways 1)
1σ
2σ

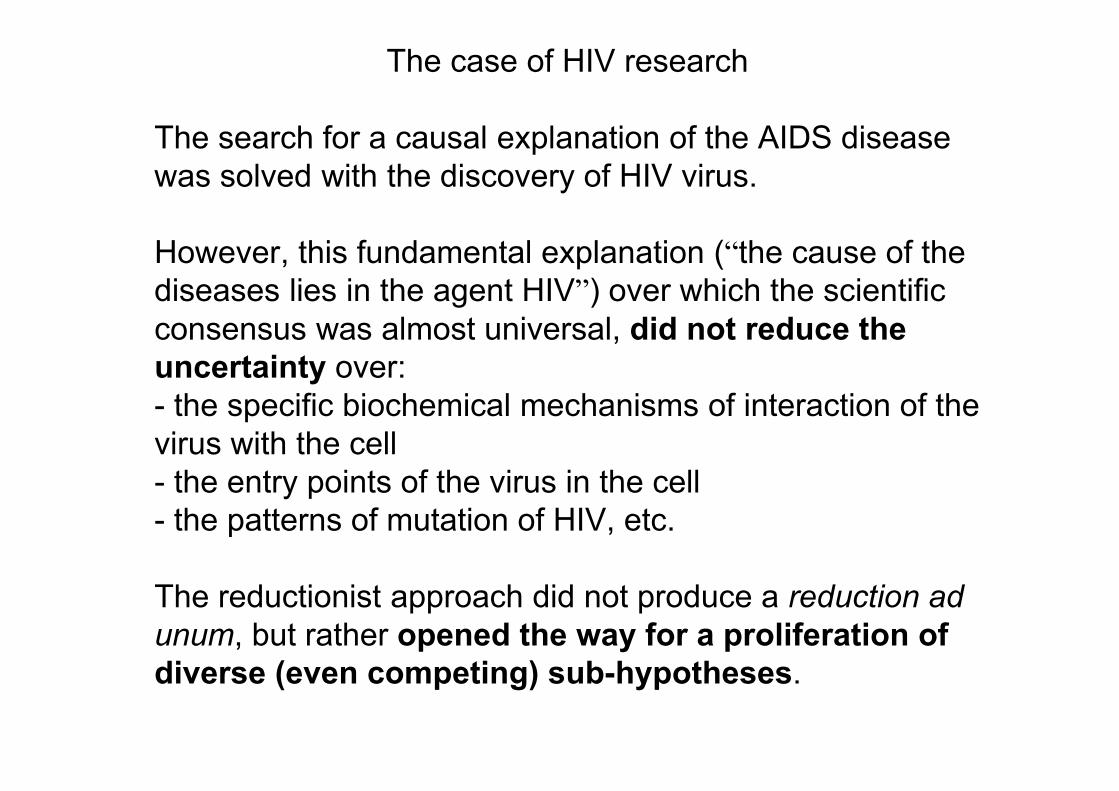
Probabilistic aspects
•
Probability that an ant in the cell (i,j) decides to move.
Probability that the ant decides to move left.
Probability that the ant decides to move right.
•Probability that the ant decides to move centre.
Normalization constant.

2. The evolutionary model
.
.
Search space . .
200200×
Enviromental variables
Search strategy 5-tuple
Search grid
Initialization

Un Modello di Ricerca nella Rete delle Keywords Andrea Bonaccorsi, Juan Sebastian Vargas
For each a simlation of T = 1000 steps is launched,using the criteria defined in the search strategy
For each solution
we can define an efficiency score given by
The macroevolutionary algorythm is run on theefficiency scores.
Quantità di cibo che entranella tana al tempo t.
Numero di formichepresenti nel reticolo altempo t.

Pattern 1 Pattern 2

Two patterns are dominant
(a) convergent or focused search
In environments where the food is concentratedin large quantities in a few places, the optimalstrategy is to focus the search
• pheromon is released in high quantities inthe way back• the decay of pheromon is slow• the attractiveness of empty cells is very low
All ants walk in the same direction and go backto the colony reinforcing the quantity ofpheromon along the path

Two patterns are dominant
(b) proliferation or divergent search
In environments where the food is scattered in smallquantities across the grid the optimal strategy is aproliferation in the directions of search
• pheromon is released in small quantities in theway back so that reinforcing mechanisms are notexceedingly strong• the decay of pheromon is rapid• the attractiveness of empty cells is moderate tohigh
Ants explore in many different directions, branchingon the right or the left after a number of nodes with agiven probability.

Institutional and cognitive complementarity
• Need for rapidly mobilizing heterogeneouscompetences
• Combinatorial opportunities- high mobility ofscientists along their career
• New professional roles (e.g. transfer roles inbiomedical research)
• Flexibility in arranging collaboration betweenacademia and other institutions (industry, hospitals,regulatory agencies, public administration).

New relations between science, technology andinnovation
A recent study on knowledge flows from academic research to firms
Dataset (1981-1999)
- more than 7.000 scientific journals
- approx. 230.000 papers published by top 200 firms(raniking by total expenditure in R&D)
- approx. 2.430.000 papers published by top 110universities
- top 200 firms make approx. 1 million citations topublications of top 110 universities and 600.000citations to industrial publications
Fonte: Adams e Clemmons (2006)

Knowledge flows
% citations
Number Chemistry Computer Engineering Physicsscience
Communications services 26,292 12.1 10.8 22.2 51.4
Software & Businessservices 25,272 15.1 17.7 17.1 46.3
Electrical equipment 22,896 8.2 9.1 50.3 27.9
Computers 9,210 15.3 13.6 26.5 40.5
Totale Industrial sector 217,623 17.7 5.5 22.4 22.4

Slow tomoderate
Rapid
Turbulent/exponential
Focused/ predictable Divergent/proliferating
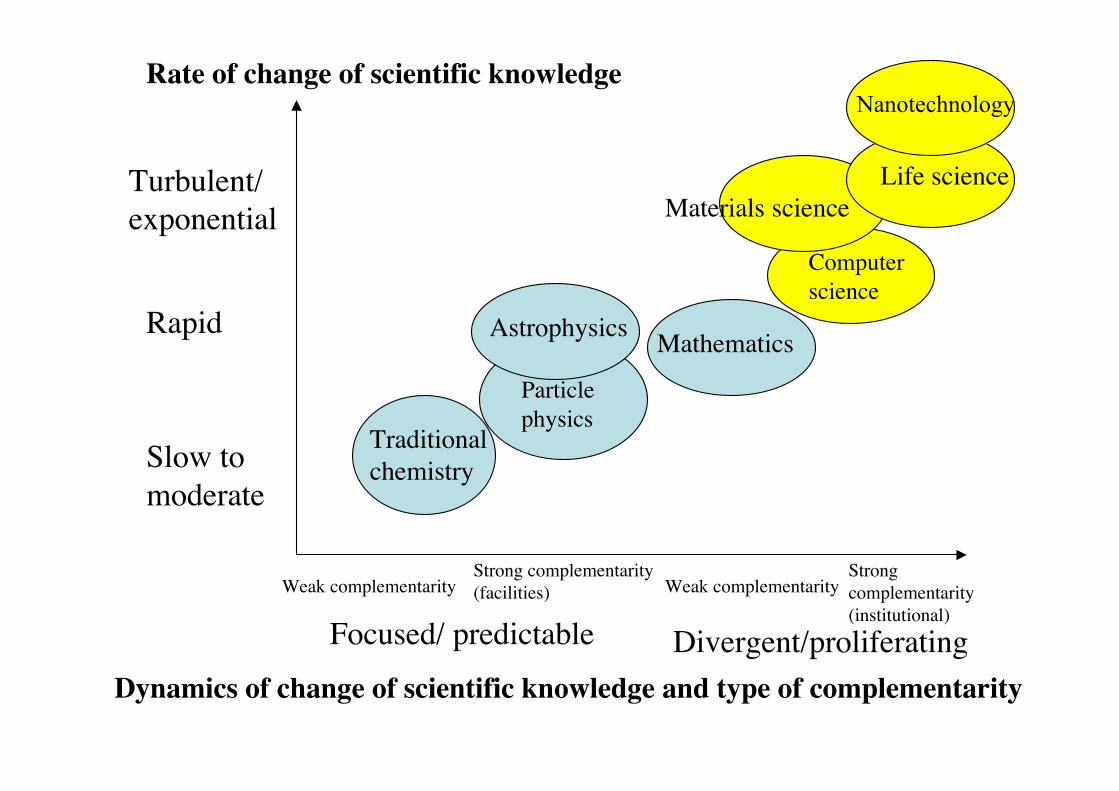
Rate of change of scientific knowledge
Dynamics of change of scientific knowledge and type of complementarity
Weak complementarityStrong complementarity(facilities) Weak complementarity
Strongcomplementarity(institutional)
Traditionalchemistry
Particlephysics
Astrophysics Mathematics
Slow tomoderate
Rapid
Turbulent/exponential
Focused/ predictable Divergent/proliferating
Rate of change of scientific knowledge
Dynamics of change of scientific knowledge and type of complementarity
Weak complementarityStrong complementarity(facilities) Weak complementarity
Strongcomplementarity(institutional)
Traditionalchemistry
Particlephysics
Astrophysics Mathematics
Computerscience
Materials scienceLife science
Nanotechnology

Implications for institutional change in science
European science has developed separateinstitutions at national, intergovernmental andEuropean level, for dealing with search regimes withstrong physical infrastructure complementarities
(e.g. high energy physics, astronomy, space research,oceanography, nuclear technology).
It is much more difficult to provide rapidly emergingfields the required complementarities in terms ofhuman capital within the common institutionalframework.
There are few rapid growth mechanisms inEuropean science.

Slow tomoderate
Rapid
Turbulent/exponential
Focused/ convergent Divergent/proliferating
Rate of change of scientific knowledge
Dynamics of change of scientific knowledge and type of complementarity
Weak complementarityStrong complementarity(facilities) Weak complementarity
Strongcomplementarity(institutional)
Traditionalchemistry
Particlephysics
Astrophysics Mathematics
European science is historically strong in fields characterizedby convergent dynamics, or divergent dynamics but weakforms of complementarity
European model of university
Dedicated intergovernmental institutions

Slow tomoderate
Rapid
Turbulent/exponential
Focused/ predictable Divergent/proliferating
Rate of change of scientific knowledge
Dynamics of change of scientific knowledge and type of complementarity
Weak complementarityStrong complementarity(facilities) Weak complementarity
Strongcomplementarity(institutional)
Traditionalchemistry
Particlephysics
Astrophysics Mathematics
Computerscience
Materials science
Life scienceEuropean science has proved weak in promoting fastmoving fields (new leading sciences)
Difficult to mobilize resources and growrapidly
Difficult to build new formsof complementarity
Nanotechnology

The scientific tradition of XX century
• European academic institutions are perfectly adaptedto scientific fields characterized by:
• moderate rate of growth (controlability, limited cognitive distance betweensenior and junior scientists)
• proliferation pattern only if coupled with low degree of complementarity and/ormoderate rate of growth
• convergent pattern of search
• The European system has performed extremely well inXX century science, while has found it more difficult toadapt to late century new search regimes.

Forecasting the position of Europein the Nobel prize competition
Cesare Marchetti, The Nobel saga, Technology Review, September 1989
• “Actions of society are consequences of culturaldiffusion processes, that can be represented bymeans of epidemiologic mechanisms.
• Lotka-Volterra equations fully represent theseprocesses, although logistics equations areappropriate in most cases, including our own.
• A long experience with this tool shows that theseequations are robustly predictive”.

• “It is possible to calculate how many Nobelprizes Europeans and Americans will win.
• The Americans will be in minority.
• To give an idea, Europeans should receive 20prizes in the period between 1998 and 2000,and Americans only 13”.
And finally:
• “In ten years time we will meet to check thisprediction” (p.11).

8,83
21
17,85
46
0 5 10 15 20 25 30 35 40 45 50
Fractional count
Full count
Premi Nobel Europa Premi Nobel USA
E
Distribution of Nobel prizes in Physics, Chemistry, Medicine.Year 1990-2000

Distribution of Nobel prizes in Physics, Chemistry, Medicine. Year 2001-2006
2,5
7
12,5
31
0 5 10 15 20 25 30 35
Fractional count
Full count
Premi Nobel Europa Premi Nobel USA

Commonly held beliefs in European S&T policy
Proposition 1. European science is quantitatively andqualitatively comparable to US science.
Proposition 2. The technological position of Europe in hightechnology is, on the contrary, much weaker than US.
Hence, the European paradox: European science is good,but the translation of knowledge into commerciallyapplicable solutions is poor.
A number of policy measures are therefore needed, fromuser-based or application-oriented European research to thefunding of technology transfer or intermediaries bodies atregional or local level.

Another look at European science
• European science is only quantitatively comparable to USscience but is weaker in the overall quality and isseverely under-represented in the upper tail of scientificquality;
(b) European science is strong in fields characterized by slowgrowth and weak in fields characterized by turbulentgrowth;
(c) European science is strong in fields characterized byconvergent search regimes and weak in fieldscharacterized by divergent search regimes;
(d) European science is strong in fields characterized by highlevels of infrastructural complementarities while it ismuch less prepared in fields characterized by humancapital and institutional complementarities.

Upper tail in quality of research. Piece of evidence # 1
Data on the most cited scientists worldwide have beenrecently made available by ISI on the basis of the analysis of19 million papers in the period 1981-1999, authored by 5million scientists.They refer to around 5,000 scientists worldwide in all fields, selected asthose 250 that receive the largest number of total citations in any subjectarea (0.1% of the total).In all 21 fields US scientists largely dominate, with aproportion of highly cited scientists ranging from 40% inpharmacology and agricultural sciences to over 90% ineconomics/business and social sciences and an averagearound 60-70% of the total.Among the 21 areas, only in other three areas non-UScountries represent more than 40% of the total: physics,chemistry and plant and animal science

Countrywise distribution of Highly Cited Scientists
0% 20% 40% 60% 80% 100%
Mathematics
Physics
Geosciences
Space Sciences
Materials Science
Engineering
Computer Science
Chemistry
Pharmacology
Biology & BioChemistry
Plant & Animal Science
Molecular Biology & Genetics
Microbiology
Immunology
Clinical medicine
Psychology/ Psychiatry
Neuroscience
Ecology/Environment
Agricultural Sciences
Social Sciences
Economics/Business
US
UK
Germany
Japan
Canada
France
Australia
Switzerland
Netherlands
Italy
Sweden
Israel
Belgium
Denmark
New Zealand
Spain
Austria
PR China
India
Finland
Norway
S. Africa
Russia
Taiwan
US scientists dominate in each of the 21 subject areas of science
USA

Piece of evidence # 2
We examined (with non-ISI sources) the publications oftop 1,000 scientists by citations received along all theirscientific career in
- Computer science- High energy physics
and all publications in nanotechnology for the period1990-2001 (ISI source).We identified the most productive institutions interms of total number of publications in the periodand ranked the first 100.

Share in the list of top 100 affiliations
0
10
20
30
40
50
60
70
80
Computer science High energyphysics
Nanotechnology
Scientific field
%
NAFTA
Europe
East Asia

An examination of the professional career of top 1000scientists in computer science
• Excellence measured by total number of citationsreceived in all published articles in the field (source:www. citeseer. com)
• Well recognized source in the scientific community
• Identify top 1,010 scientists by number of citations
• Download CVs from individual websites, or search CVson the web
• Codify CV data and build the dataset
• Analysis: (a) overall career pattern (b) by cohort of age.

MIT University of California University of CaliforniaUniversity of California MIT Stanford University
Indian Institute ofTechnology Stanford University MIT
National TaiwanUniversity Harvard University Harvard UniversityHarvard University University of Massachusetts University of Illinois
Cambridge University Cornell University Carnegie-Mellon University
Yale University Carnegie-Mellon University Cornell UniversityUniversity of Michigan University of Illinois University of Michigan
Seoul NationalUniversity Purdue University University of WisconsinCalifornia Institute of University of Michigan University of TexasTechnology
Bachelor Master PhD
Piece of evidence # 3
Institutions awarding degrees of the top 1,000 scientists inComputer science. Top 10 list

Prof career Count position
University 2620
University-director 497
Industry 463
Consulting 332
Industry-director 323
Government 183
Professional positions over the career oftop scientists in Computer scienceNumber of scientists: 1010.Number of different positions: 4418.Mean 4,36
More than3,000changes incareerpositions

Institution Count Massachusetts Institute of Technology 174
Stanford University 166
University of California at Berkeley 102
Carnegie-Mellon University 102
University of Illinois 59
University of Maryland 58
Cornell University 52
University of Washington 45
University of Pennsylvania 44
Harvard University 44
Princeton University 44
University of Texas 44
University of Massachusetts 42
Brown University 41
University of Toronto 34
Ranking of top 15 affiliations in the total number ofpositions over the career. Academic positions
Source: Bonaccorsi (2006)
More than 1/6 of thesemobility paths areaccounted for by thetop 4 universities

First, the US system is better able to attract the besttalents worldwide, benefiting from a larger pool of people.In abstract terms, a system like this has superiorsampling properties. Furthermore, the US system hassuperior selection properties.
Second, European countries do not play a great role inthis international competition.
Third, Asian countries seem to have understoodmuch better the rules of the game. By sending theirbrightest students to US, they position themselves to thefrontier of scientific research.

SSpecialisation patterns(Revealed Comparative Advantages, 1981-1994)
oNo European country is specialised in Computer sciencenNo European country is specialised in Engineering;iIn biology and biochemistry small European countries (Netherlands, Sweden,
Denmark, Norway, Finland) exhibit strong specialisation while large countrieshave an index lower than unity;
IIn molecular biology several large countries (United Kingdom, Germany andFrance) and small countries (Netherlands, Finland, in addition to Switzerland) arespecialised
EEurope as a whole is specialised in a few biomedical areas (pharmacology,immunology, microbiology) and in the large traditional disciplines of chemistry,physics and astronomy.

RRate of growth of broad disciplines Over the period 1995-1999 the fastest growing area has been
computer science with a growth rate of almost 10% Earth sciences, engineering and mathematics also show high growth
rates, varying between 4.2 and 4.6% Biology and agriculture have the lowest growth rates with 1.4 and
1.6% respectively The broad field of life sciences as a whole experienced a growth
rate of 2.33% The growth rate for the broad field of engineering was 4.5%, of
which 35% was materials science, that grew at 1.9% per year.EEuropean science is strong in fields characterized by slow
growth and weak in fields characterized by turbulent growth

In materials science EU-15 produce 40,108 papersand receive 83,748 citations, while NAFTA produce31,620 papers but receive 106,841 citations
In the life sciences EU-15 produce 616,212 papersand US 529,608 in the period 1995-1999, but thecitation impact (1993-1999) is 1.35 in USA and only0.90 in EU-15
In computer science the citation impact (1993-1999) is1.33 for Israel, 1.17 for US, but only in the rangebetween 0.81 (Germany) and 0.95 (Italy) for the fourlargest countries
Source: Third European Report on S&T Indicators

European science has developed separateinstitutions at national, intergovernmental andEuropean level, for dealing with search regimes withstrong physical infrastructure complementarities
(e.g. high energy physics, astronomy, space research,oceanography, nuclear technology).
It is much more difficult to provide emerging fields therequired complementarities in terms of human capitalwithin the common institutional framework.
There are few rapid growth mechanisms.

TPERS/INSTAG
543210
T_PERS120
100
80
60
40
20
0
Plot of rate of growth (average number of personnel pereach year of life, T_PERS/INSTAG) against size (number
of personnel, T_PERS). CNR 1957-1997
Source: Bonaccorsi and Daraio (2003)

TRES/INSTAG
3.02.52.01.51.0.50.0
T_RES
50
40
30
20
10
0
Plot of rate of growth (average number of researchers pereach year of life, T_RES/INSTAG) against size (number of
researchers, T_RES). CNR 1957-1997
Source: Bonaccorsi and Daraio (2003)