Embed Size (px)
Citation preview

THE NEW NORMAL
INTERNATIONAL MONETARY FUND 1
March
2015
SD
N/1
5/0
3
I M F S T A F F D I S C U S S I ON N O T E
The New Normal:
A Sector-Level Perspective
on Productivity Trends in
Advanced Economies Era Dabla-Norris, Si Guo, Vikram Haksar, Minsuk Kim, Kalpana Kochhar, Kevin Wiseman, and Aleksandra Zdzienicka
THE NEW NORMAL
2 INTERNATIONAL MONETARY FUND
INTERNATIONAL MONETARY FUND
Strategy, Policy, and Review Department
The New Normal: A Sector-Level Perspective on Growth and Productivity Trends in
Advanced Economies
Prepared by Era Dabla-Norris, Si Guo, Vikram Haksar, Minsuk Kim, Kalpana Kochhar, Kevin
Wiseman, and Aleksandra Zdzienicka*1
Authorized for distribution by Siddharth Tiwari
March 2015
JEL Classification Numbers: O11, O38, O47
Keywords: productivity, structural reforms, growth, structural change
Authors’ E-mail Addresses: [email protected]; [email protected]; [email protected];
[email protected]; [email protected]; [email protected];
* The authors would like to thank Jovana Sljivancanin, Marijn Willem Otte, Tushara Ekanayake, and Xin Guo for excellent
research assistance, and Ricardo Reinoso for editorial assistance.
DISCLAIMER: This Staff Discussion Note represents the views of the authors and does
not necessarily represent IMF views or IMF policy. The views expressed herein should
be attributed to the authors and not to the IMF, its Executive Board, or its
management. Staff Discussion Notes are published to elicit comments and to further
debate.
THE NEW NORMAL
INTERNATIONAL MONETARY FUND 3
EXECUTIVE SUMMARY ____________________________________________________________________________ 4
I. CONTEXT _______________________________________________________________________________________ 5
II. GROWTH AND STRUCTURAL TRANSFORMATION _____________________________________________ 6
III. RESOURCE ALLOCATION AND PRODUCTIVITY _______________________________________________ 16
IV. WHAT REFORMS WILL ENHANCE PRODUCTIVITY? ___________________________________________ 20
V. FINAL REMARKS ______________________________________________________________________________ 32
Annex 1. Stochastic Frontier Analysis ____________________________________________________________ 34
References _______________________________________________________________________________________ 35
Note: The Technical Appendix to this Staff Discussion Note is available as a separate document.
BOX
1. Estimating TFP Gains from Improved Across-Sector Resource Allocation _____________________ 17
FIGURES
1. GDP and Labor Productivity Trend Growth _____________________________________________________ 7
2. Average Labor Supply Growth Contributions __________________________________________________ 8
3. Capital Deepening Contribution to Labor Productivity _________________________________________ 9
4. Trend TFP Growth _____________________________________________________________________________ 10
5. Sources of Total Factor Productivity ___________________________________________________________ 10
6. Value Added and Employment, 1980–2007 ___________________________________________________ 12
7. TFP Growth Rates by Countries and Selected Sectors _________________________________________ 13
8. ICT Diffusion in Services and TFP Growth in ICT-Producing Sectors ___________________________ 14
9. Total Factor Productivity Levels _______________________________________________________________ 15
10. Sectoral Distortions (Wedges) in Selected Countries _________________________________________ 18
11. TFP Annual Growth from Better Input Allocation ____________________________________________ 20
12. Regulation, Skill, ICT, and R&D Indicators Across Industries and Countries (2007) ___________ 22
13. Reform Episodes per Country ________________________________________________________________ 27
14. The Short- and Medium-Term Impact of Structural Reforms on TFP _________________________ 28
15. Medium-Term Impact of Reforms on TFP Growth: Conditional on Initial Settings ___________ 29
16. The Impact of Reform Shocks on Total TFP Across the Business Cycles ______________________ 29
17. The Impact of Reform Shocks on Sectoral Employment______________________________________ 30
18. The Impact of Reform Shocks on Sectoral Output ___________________________________________ 31
TABLES
1. TFP Level from Adjusting Input Allocation across Sectors _____________________________________ 19
2. Impact of Product Market Frictions on Total Factor Productivity Growth ______________________ 23
3. Impact of ICT, Human Capital, and R&D ______________________________________________________ 25
4. TFP Growth Gains from Improvement in Structural Determinants _____________________________ 25
CONTENTS
THE NEW NORMAL
4 INTERNATIONAL MONETARY FUND
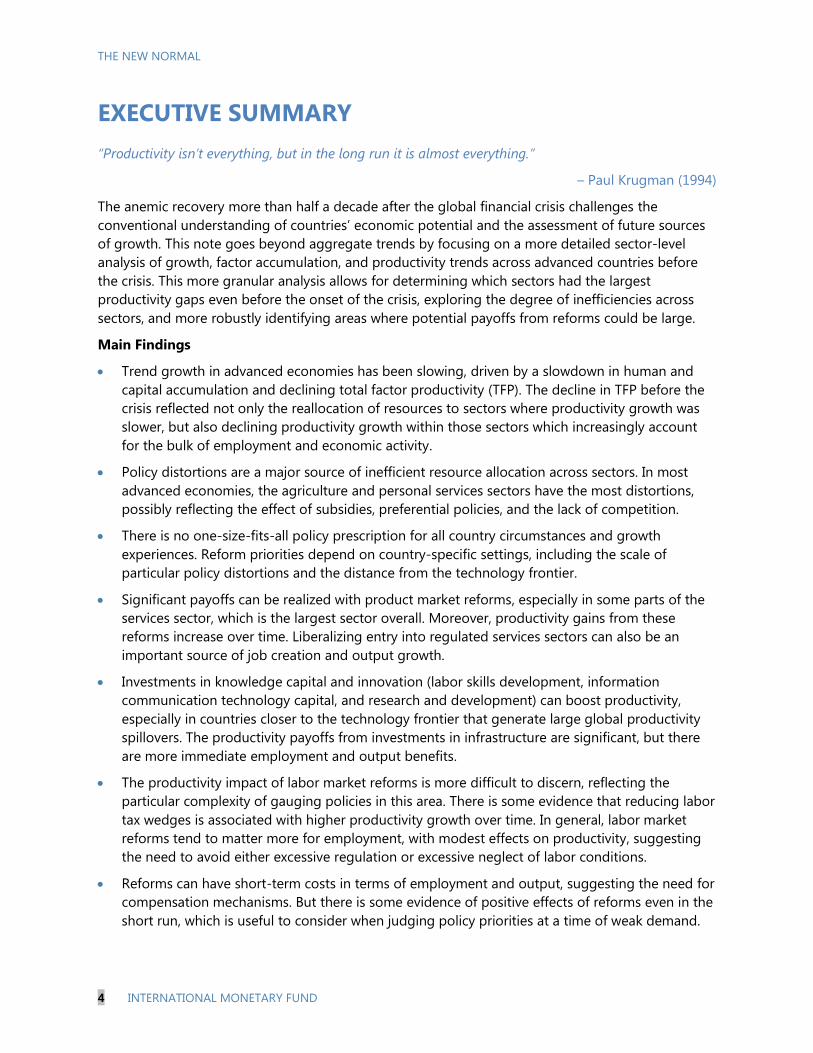
EXECUTIVE SUMMARY
“Productivity isn’t everything, but in the long run it is almost everything.”
– Paul Krugman (1994)
The anemic recovery more than half a decade after the global financial crisis challenges the
conventional understanding of countries’ economic potential and the assessment of future sources
of growth. This note goes beyond aggregate trends by focusing on a more detailed sector-level
analysis of growth, factor accumulation, and productivity trends across advanced countries before
the crisis. This more granular analysis allows for determining which sectors had the largest
productivity gaps even before the onset of the crisis, exploring the degree of inefficiencies across
sectors, and more robustly identifying areas where potential payoffs from reforms could be large.
Main Findings
Trend growth in advanced economies has been slowing, driven by a slowdown in human and
capital accumulation and declining total factor productivity (TFP). The decline in TFP before the
crisis reflected not only the reallocation of resources to sectors where productivity growth was
slower, but also declining productivity growth within those sectors which increasingly account
for the bulk of employment and economic activity.
Policy distortions are a major source of inefficient resource allocation across sectors. In most
advanced economies, the agriculture and personal services sectors have the most distortions,
possibly reflecting the effect of subsidies, preferential policies, and the lack of competition.
There is no one-size-fits-all policy prescription for all country circumstances and growth
experiences. Reform priorities depend on country-specific settings, including the scale of
particular policy distortions and the distance from the technology frontier.
Significant payoffs can be realized with product market reforms, especially in some parts of the
services sector, which is the largest sector overall. Moreover, productivity gains from these
reforms increase over time. Liberalizing entry into regulated services sectors can also be an
important source of job creation and output growth.
Investments in knowledge capital and innovation (labor skills development, information
communication technology capital, and research and development) can boost productivity,
especially in countries closer to the technology frontier that generate large global productivity
spillovers. The productivity payoffs from investments in infrastructure are significant, but there
are more immediate employment and output benefits.
The productivity impact of labor market reforms is more difficult to discern, reflecting the
particular complexity of gauging policies in this area. There is some evidence that reducing labor
tax wedges is associated with higher productivity growth over time. In general, labor market
reforms tend to matter more for employment, with modest effects on productivity, suggesting
the need to avoid either excessive regulation or excessive neglect of labor conditions.
Reforms can have short-term costs in terms of employment and output, suggesting the need for
compensation mechanisms. But there is some evidence of positive effects of reforms even in the
short run, which is useful to consider when judging policy priorities at a time of weak demand.
THE NEW NORMAL
INTERNATIONAL MONETARY FUND 5
I. CONTEXT
1. A new mediocre? Global growth has been anemic in the wake of the balance sheet
recessions that rocked advanced economies during 2008–12. The malaise has spread from advanced
economies to many emerging markets. Not only are recoveries more protracted in spite of large
policy stimulus, questions are being raised about future sources of growth. This, in turn, raises
uncertainty about the understanding of potential output. As a result, the policy debate on dealing
with the weak recovery has been fraught. Attention has shifted from an early focus on demand
stimulus, which is still needed in some key economic areas, to measures to boost global supply amid
slowing trend growth and large persistent output losses (IMF, forthcoming).
2. Should we be surprised? The current debate on the slow recovery could benefit from a
longer-term perspective. While variation exists across countries and time, one clear mega-trend
emerges. Underlying output and productivity growth in advanced economies had already been
slowing well before the global financial crisis. The ups and downs associated with the financial cycle,
along with periods of productivity gains from the adoption of new technologies and efficiency-
enhancing reforms, may have masked this trend. Still, the finding is in line with economic theory that
suggests that some deceleration in economic growth in advanced economies is inevitable as
countries get closer to the technology frontier. Indeed, the experiences of advanced economies that
exhibited convergence in the past (Japan in the 1970s) suggest that during the transition to higher
income levels, catch-up gains from capital deepening, learning and technology transfer, and
structural transformation diminish, and productivity and growth slows. Moreover, working-age
population growth has slowed and old-age dependency ratios have increased. Prospects for
boosting medium-term growth in advanced economies via increasing factor accumulation alone are
likely limited.
3. The challenge to enhance productivity. Increasing productivity growth must remain a
priority for advanced economies to revive growth and maintain living standards. This implies
tackling market and institutional rigidities, and boosting infrastructure and innovation to spur
productivity growth and maintain competitiveness. This is reflected in the increased emphasis in
domestic policy debates on reforms to support productivity and efficiency. This was echoed at the
global level in the Fall 2014 Global Policy Agenda presented by the IMF Managing Director, which
emphasized measures to help increase productive capacity (IMF 2014a). This is a complex and
multidimensional task, requiring reforms and, hence, a granular approach to policy analysis and
application.
4. Focus of this Note. Cross-country narratives of the growth slowdown and future prospects
have focused on aggregate trends in growth, factor accumulation, and productivity. This study
focuses on sector-level productivity developments before the global financial crisis, examining the
period from 1970 to 2007 in order to highlight trends already in progress before the onset of the
crisis and to provide evidence on underlying productivity developments. This allows for identifying
key sector sources of total factor productivity (TFP) gaps that existed even prior to the crisis,
exploring issues of misallocation of resources across sectors, and, importantly, more robustly
THE NEW NORMAL
6 INTERNATIONAL MONETARY FUND
identifying policy requirements than would be possible with aggregate cross-country data. The work
here is based on a unique and rich industry-level dataset across advanced economies.2 The database
provides harmonized input and output series’ suitable for cross-country productivity analysis. But as
with any cross-country datasets, measurement issues and scope of country coverage, particularly at
the detailed industry level, are important caveats.
5. Roadmap. Section II examines trends in aggregate and sectoral growth, productivity, and
structural transformation across advanced economies. This is a useful starting point to see how
economies and the associated growth bottlenecks evolved even prior to the crisis. Section III
presents a quantitative thought experiment on how improved factor allocation across sectors could
boost output levels—the scope for gains by reducing such inefficiencies is large, especially in slow-
growing economies. Section IV then examines how policies—which run the gamut from product
market and labor market reforms to boosting technology development and adoption—matter for
productivity growth across countries. The section also assesses the dynamic effects of reforms on
output and employment as a way of examining potential trade-offs. Policy priorities are derived
from this work to boost productivity and offset the secular slowdown apparent in advanced
economies.
II. GROWTH AND STRUCTURAL TRANSFORMATION
A slowing pace of human and physical capital accumulation and declining TFP contributed to lower
trend growth in the years immediately preceding the global financial crisis. The aggregate decline in
TFP reflected the reallocation of resources to sectors where productivity growth was slower, as well as
declining productivity growth within those sectors, which increasingly account for the bulk of
employment and economic activity. Large sectoral TFP-level gaps across countries, however, point to
opportunities for boosting growth.
A. The Aggregate Story
6. Secular decline in output and productivity growth. Advanced economies have
experienced a secular decline in growth and average labor productivity over the last four decades.
These trends are evident even in pre-crisis data, and were further magnified by the global financial
crisis. Figure 1 shows long-run trend declines in output growth and labor productivity growth before
the crisis.3 Output growth declined from an annual average of more than 3½ percent in the 1970s to
less than 2½ percent in the mid-2000s just before the crisis. This decline was largely driven by labor
productivity. Trend growth in output per hour worked declined from about 3 percent annually in
2 The EU KLEMS database is compiled as a product of a research project financed by the European Commission
(O’Mahony and Timmer 2009).
3 Estimating the trend on the whole sample, and ending roughly at the trough of the economic cycle, biases the
trend growth rates down. By the same token, the pre-crisis sample ends at a cycle peak, meaning that the trends are
biased upward. The true underlying trend is likely to fall somewhere between these two estimates. Figure 1 plots the
growth rates of output- and productivity-level trends, estimated with an HP filter using a smoothing parameter of
100.
THE NEW NORMAL
INTERNATIONAL MONETARY FUND 7
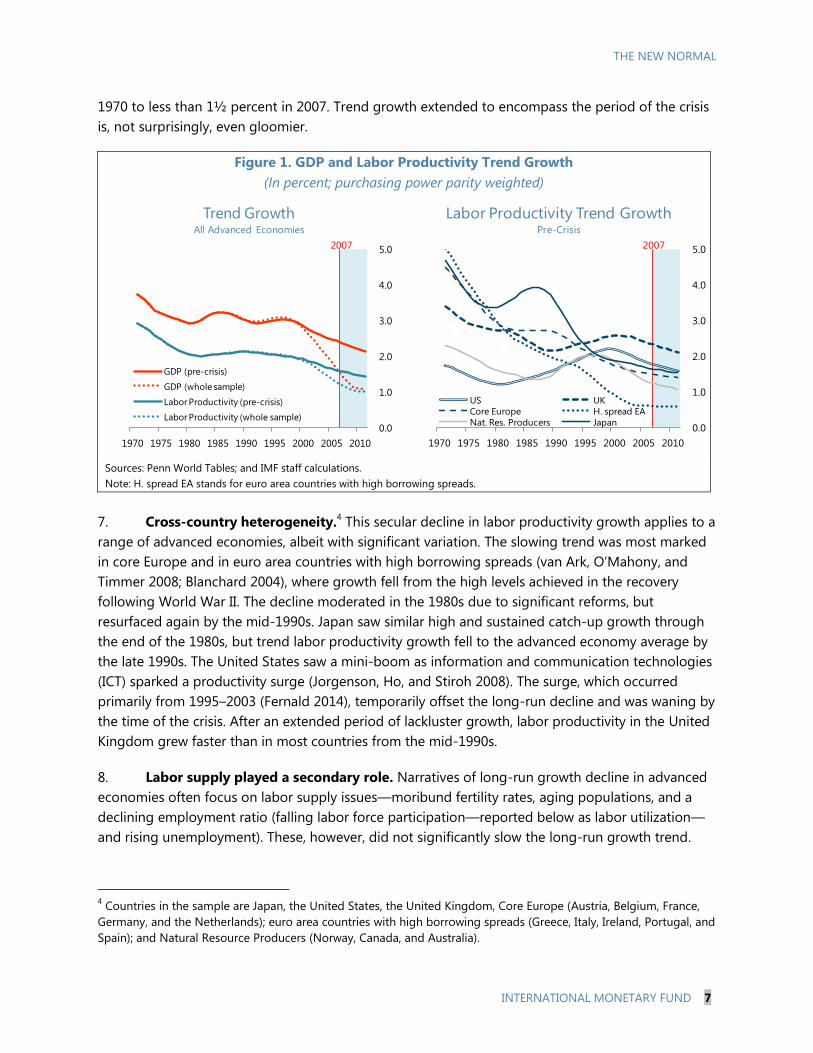
1970 to less than 1½ percent in 2007. Trend growth extended to encompass the period of the crisis
is, not surprisingly, even gloomier.
Figure 1. GDP and Labor Productivity Trend Growth
(In percent; purchasing power parity weighted)
Sources: Penn World Tables; and IMF staff calculations.
Note: H. spread EA stands for euro area countries with high borrowing spreads.
7. Cross-country heterogeneity.4 This secular decline in labor productivity growth applies to a
range of advanced economies, albeit with significant variation. The slowing trend was most marked
in core Europe and in euro area countries with high borrowing spreads (van Ark, O’Mahony, and
Timmer 2008; Blanchard 2004), where growth fell from the high levels achieved in the recovery
following World War II. The decline moderated in the 1980s due to significant reforms, but
resurfaced again by the mid-1990s. Japan saw similar high and sustained catch-up growth through
the end of the 1980s, but trend labor productivity growth fell to the advanced economy average by
the late 1990s. The United States saw a mini-boom as information and communication technologies
(ICT) sparked a productivity surge (Jorgenson, Ho, and Stiroh 2008). The surge, which occurred
primarily from 1995–2003 (Fernald 2014), temporarily offset the long-run decline and was waning by
the time of the crisis. After an extended period of lackluster growth, labor productivity in the United
Kingdom grew faster than in most countries from the mid-1990s.
8. Labor supply played a secondary role. Narratives of long-run growth decline in advanced
economies often focus on labor supply issues—moribund fertility rates, aging populations, and a
declining employment ratio (falling labor force participation—reported below as labor utilization—
and rising unemployment). These, however, did not significantly slow the long-run growth trend.
4 Countries in the sample are Japan, the United States, the United Kingdom, Core Europe (Austria, Belgium, France,
Germany, and the Netherlands); euro area countries with high borrowing spreads (Greece, Italy, Ireland, Portugal, and
Spain); and Natural Resource Producers (Norway, Canada, and Australia).
0
0.2
0.4
0.6
0.8
1
0.0
1.0
2.0
3.0
4.0
5.0
1970 1975 1980 1985 1990 1995 2000 2005 2010
Trend GrowthAll Advanced Economies
GDP (pre-crisis)
GDP (whole sample)
Labor Productivity (pre-crisis)
Labor Productivity (whole sample)
2007
0
0.2
0.4
0.6
0.8
1
0.0
1.0
2.0
3.0
4.0
5.0
1970 1975 1980 1985 1990 1995 2000 2005 2010
Labor Productivity Trend GrowthPre-Crisis
US UK
Core Europe H. spread EA
Nat. Res. Producers Japan
2007
THE NEW NORMAL
8 INTERNATIONAL MONETARY FUND
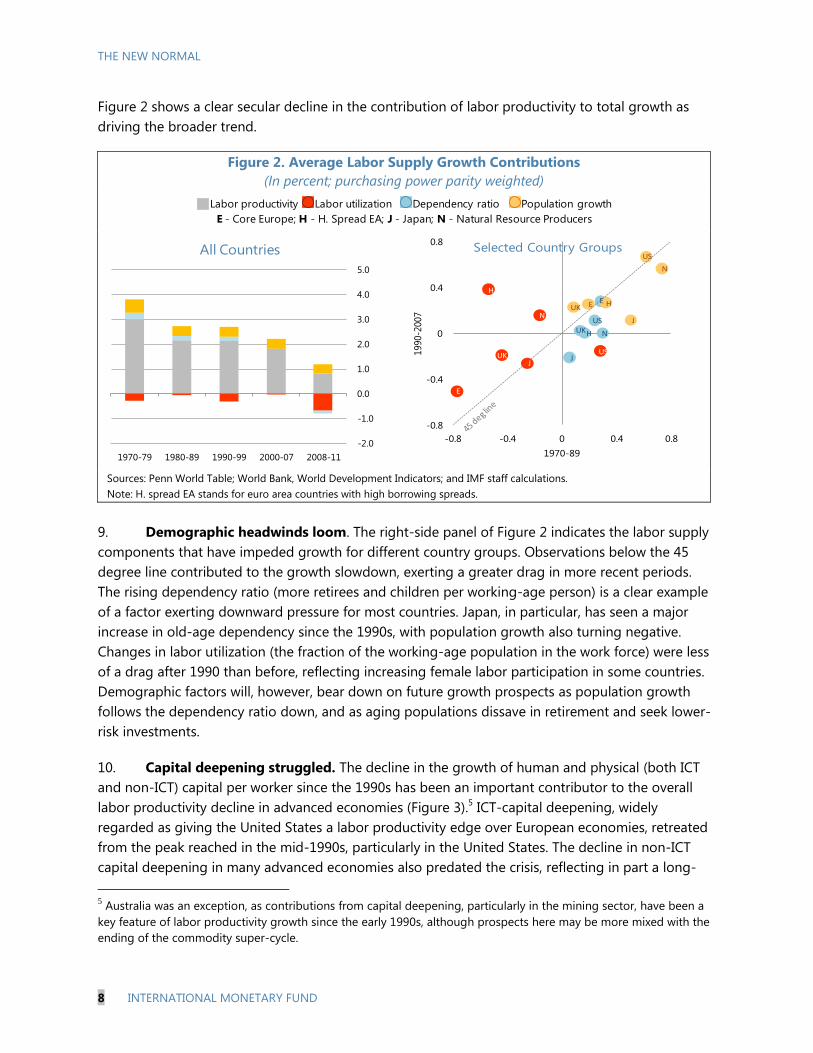
Figure 2 shows a clear secular decline in the contribution of labor productivity to total growth as
driving the broader trend.
Figure 2. Average Labor Supply Growth Contributions
(In percent; purchasing power parity weighted)
Sources: Penn World Table; World Bank, World Development Indicators; and IMF staff calculations.
Note: H. spread EA stands for euro area countries with high borrowing spreads.
9. Demographic headwinds loom. The right-side panel of Figure 2 indicates the labor supply
components that have impeded growth for different country groups. Observations below the 45
degree line contributed to the growth slowdown, exerting a greater drag in more recent periods.
The rising dependency ratio (more retirees and children per working-age person) is a clear example
of a factor exerting downward pressure for most countries. Japan, in particular, has seen a major
increase in old-age dependency since the 1990s, with population growth also turning negative.
Changes in labor utilization (the fraction of the working-age population in the work force) were less
of a drag after 1990 than before, reflecting increasing female labor participation in some countries.
Demographic factors will, however, bear down on future growth prospects as population growth
follows the dependency ratio down, and as aging populations dissave in retirement and seek lower-
risk investments.
10. Capital deepening struggled. The decline in the growth of human and physical (both ICT
and non-ICT) capital per worker since the 1990s has been an important contributor to the overall
labor productivity decline in advanced economies (Figure 3).5 ICT-capital deepening, widely
regarded as giving the United States a labor productivity edge over European economies, retreated
from the peak reached in the mid-1990s, particularly in the United States. The decline in non-ICT
capital deepening in many advanced economies also predated the crisis, reflecting in part a long-
5 Australia was an exception, as contributions from capital deepening, particularly in the mining sector, have been a
key feature of labor productivity growth since the early 1990s, although prospects here may be more mixed with the
ending of the commodity super-cycle.
Labor productivity Labor utilization Dependency ratio Population growth
E - Core Europe; H - H. Spread EA; J - Japan; N - Natural Resource Producers
-2.0
-1.0
0.0
1.0
2.0
3.0
4.0
5.0
1970-79 1980-89 1990-99 2000-07 2008-11
All Countries
US
US
US
UK
UK
UK
E
EE
H
H
H
JJ
JN
N
N
-0.8
-0.4
0
0.4
0.8
-0.8 -0.4 0 0.4 0.8
1990-2
007
1970-89
Selected Country Groups
THE NEW NORMAL
INTERNATIONAL MONETARY FUND 9
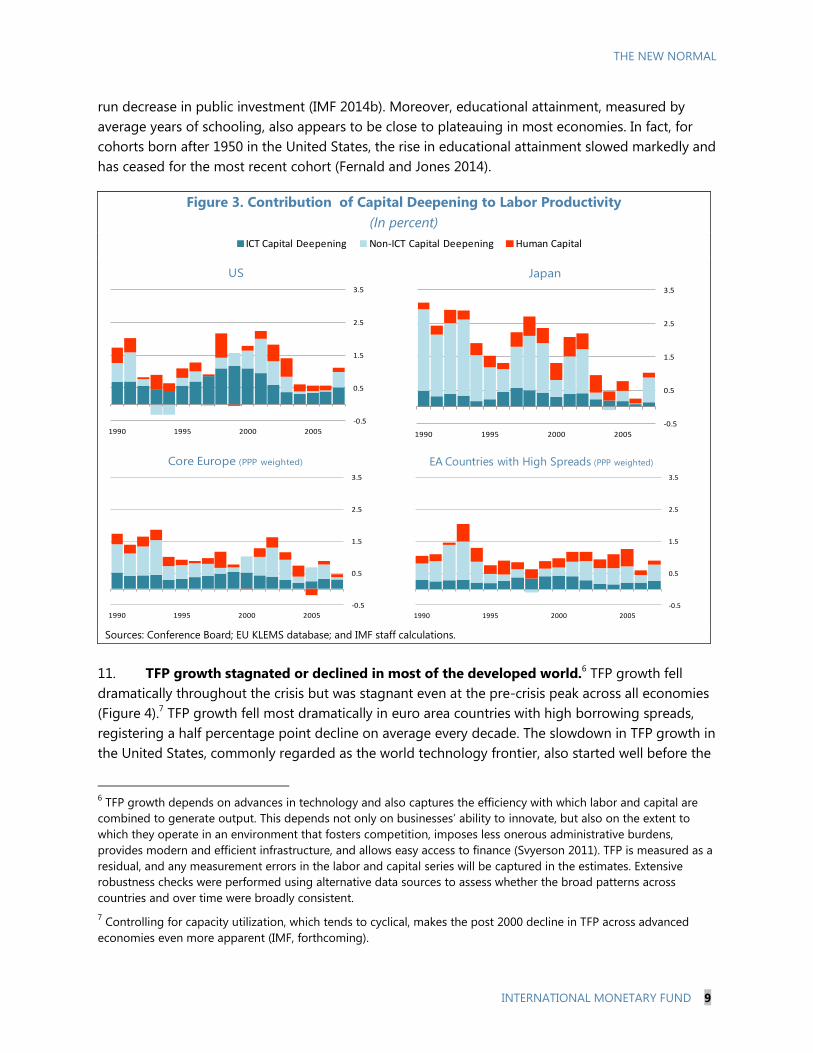
run decrease in public investment (IMF 2014b). Moreover, educational attainment, measured by
average years of schooling, also appears to be close to plateauing in most economies. In fact, for
cohorts born after 1950 in the United States, the rise in educational attainment slowed markedly and
has ceased for the most recent cohort (Fernald and Jones 2014).
Figure 3. Contribution of Capital Deepening to Labor Productivity
(In percent)
Sources: Conference Board; EU KLEMS database; and IMF staff calculations.
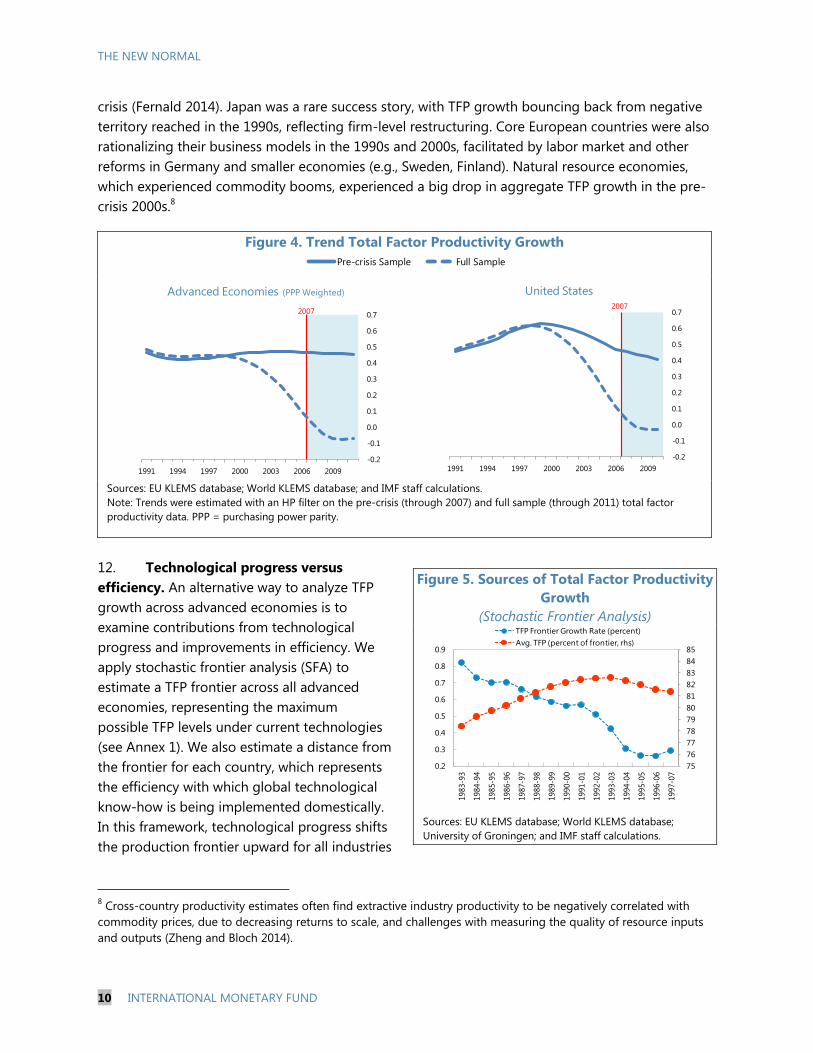
11. TFP growth stagnated or declined in most of the developed world.6 TFP growth fell
dramatically throughout the crisis but was stagnant even at the pre-crisis peak across all economies
(Figure 4).7 TFP growth fell most dramatically in euro area countries with high borrowing spreads,
registering a half percentage point decline on average every decade. The slowdown in TFP growth in
the United States, commonly regarded as the world technology frontier, also started well before the
6 TFP growth depends on advances in technology and also captures the efficiency with which labor and capital are
combined to generate output. This depends not only on businesses’ ability to innovate, but also on the extent to
which they operate in an environment that fosters competition, imposes less onerous administrative burdens,
provides modern and efficient infrastructure, and allows easy access to finance (Svyerson 2011). TFP is measured as a
residual, and any measurement errors in the labor and capital series will be captured in the estimates. Extensive
robustness checks were performed using alternative data sources to assess whether the broad patterns across
countries and over time were broadly consistent.
7 Controlling for capacity utilization, which tends to cyclical, makes the post 2000 decline in TFP across advanced
economies even more apparent (IMF, forthcoming).
-2.0
-1.0
0.0
1.0
2.0
3.0
4.0
1990 1995 2000 2005 2010
Labor Productivity DecompositionUS (PPP weighted)
ICT Capital Deepening Non-ICT Capital Deepening Human Capital
-0.5
0.5
1.5
2.5
3.5
1990 1995 2000 2005
US
-0.5
0.5
1.5
2.5
3.5
1990 1995 2000 2005
Japan
-0.5
0.5
1.5
2.5
3.5
1990 1995 2000 2005
Core Europe (PPP weighted)
-0.5
0.5
1.5
2.5
3.5
1990 1995 2000 2005
EA Countries with High Spreads (PPP weighted)
THE NEW NORMAL
10 INTERNATIONAL MONETARY FUND
crisis (Fernald 2014). Japan was a rare success story, with TFP growth bouncing back from negative
territory reached in the 1990s, reflecting firm-level restructuring. Core European countries were also
rationalizing their business models in the 1990s and 2000s, facilitated by labor market and other
reforms in Germany and smaller economies (e.g., Sweden, Finland). Natural resource economies,
which experienced commodity booms, experienced a big drop in aggregate TFP growth in the pre-
crisis 2000s.8
Figure 4. Trend Total Factor Productivity Growth
Sources: EU KLEMS database; World KLEMS database; and IMF staff calculations.
Note: Trends were estimated with an HP filter on the pre-crisis (through 2007) and full sample (through 2011) total factor
productivity data. PPP = purchasing power parity.
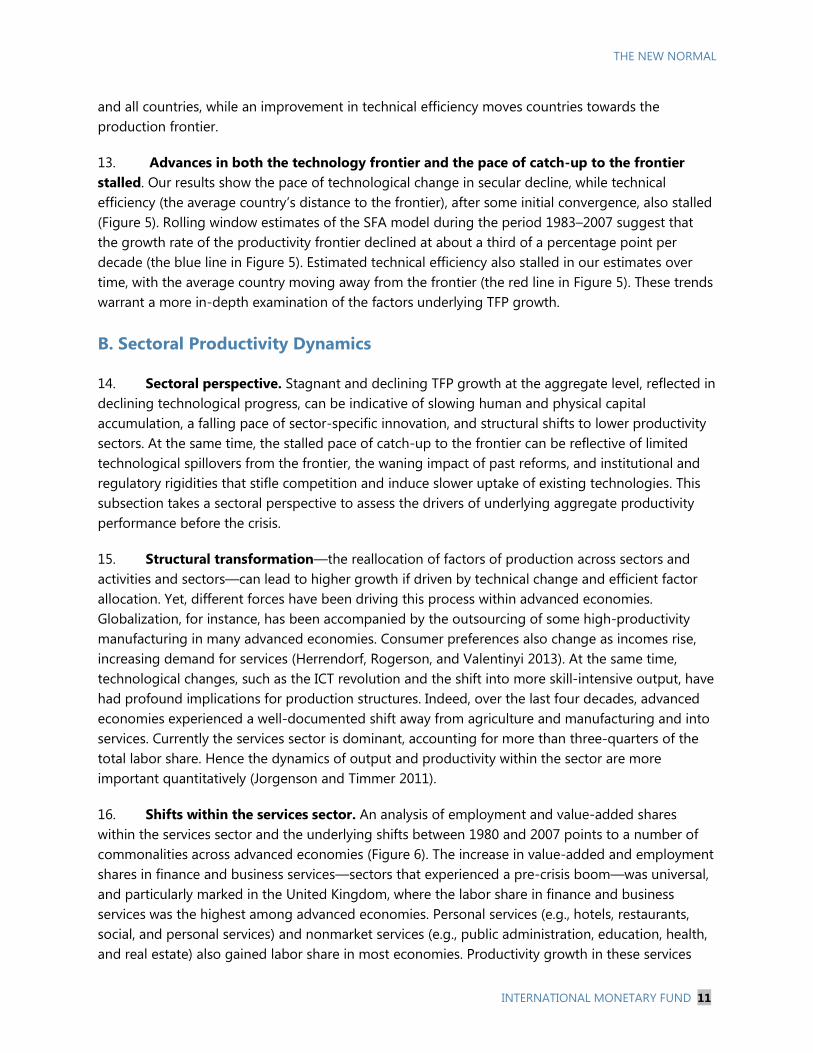
12. Technological progress versus
efficiency. An alternative way to analyze TFP
growth across advanced economies is to
examine contributions from technological
progress and improvements in efficiency. We
apply stochastic frontier analysis (SFA) to
estimate a TFP frontier across all advanced
economies, representing the maximum
possible TFP levels under current technologies
(see Annex 1). We also estimate a distance from
the frontier for each country, which represents
the efficiency with which global technological
know-how is being implemented domestically.
In this framework, technological progress shifts
the production frontier upward for all industries
8 Cross-country productivity estimates often find extractive industry productivity to be negatively correlated with
commodity prices, due to decreasing returns to scale, and challenges with measuring the quality of resource inputs
and outputs (Zheng and Bloch 2014).
0
0.1
0.2
0.3
0.4
0.5
0.6
0.7
0.8
0.9
1
-0.20
-0.10
0.00
0.10
0.20
0.30
0.40
0.50
0.60
1991 1994 1997 2000 2003 2006 2009
Pre-crisis Sample Full Sample
0
0.1
0.2
0.3
0.4
0.5
0.6
0.7
0.8
0.9
1
-0.2
-0.1
0.0
0.1
0.2
0.3
0.4
0.5
0.6
0.7
1991 1994 1997 2000 2003 2006 2009
Advanced Economies (PPP Weighted)
2007
0
0.1
0.2
0.3
0.4
0.5
0.6
0.7
0.8
0.9
1
-0.2
-0.1
0.0
0.1
0.2
0.3
0.4
0.5
0.6
0.7
1991 1994 1997 2000 2003 2006 2009
United States
2007
Figure 5. Sources of Total Factor Productivity
Growth
(Stochastic Frontier Analysis)
Sources: EU KLEMS database; World KLEMS database;
University of Groningen; and IMF staff calculations.
75
76
77
78
79
80
81
82
83
84
85
0.2
0.3
0.4
0.5
0.6
0.7
0.8
0.9
1983-9
3
1984-9
4
1985-9
5
1986-9
6
1987-9
7
1988-9
8
1989-9
9
1990-0
0
1991-0
1
1992-0
2
1993-0
3
1994-0
4
1995-0
5
1996-0
6
1997-0
7
TFP Frontier Growth Rate (percent)
Avg. TFP (percent of frontier, rhs)
THE NEW NORMAL
INTERNATIONAL MONETARY FUND 11
and all countries, while an improvement in technical efficiency moves countries towards the
production frontier.
13. Advances in both the technology frontier and the pace of catch-up to the frontier
stalled. Our results show the pace of technological change in secular decline, while technical
efficiency (the average country’s distance to the frontier), after some initial convergence, also stalled
(Figure 5). Rolling window estimates of the SFA model during the period 1983–2007 suggest that
the growth rate of the productivity frontier declined at about a third of a percentage point per
decade (the blue line in Figure 5). Estimated technical efficiency also stalled in our estimates over
time, with the average country moving away from the frontier (the red line in Figure 5). These trends
warrant a more in-depth examination of the factors underlying TFP growth.
B. Sectoral Productivity Dynamics
14. Sectoral perspective. Stagnant and declining TFP growth at the aggregate level, reflected in
declining technological progress, can be indicative of slowing human and physical capital
accumulation, a falling pace of sector-specific innovation, and structural shifts to lower productivity
sectors. At the same time, the stalled pace of catch-up to the frontier can be reflective of limited
technological spillovers from the frontier, the waning impact of past reforms, and institutional and
regulatory rigidities that stifle competition and induce slower uptake of existing technologies. This
subsection takes a sectoral perspective to assess the drivers of underlying aggregate productivity
performance before the crisis.
15. Structural transformation—the reallocation of factors of production across sectors and
activities and sectors—can lead to higher growth if driven by technical change and efficient factor
allocation. Yet, different forces have been driving this process within advanced economies.
Globalization, for instance, has been accompanied by the outsourcing of some high-productivity
manufacturing in many advanced economies. Consumer preferences also change as incomes rise,
increasing demand for services (Herrendorf, Rogerson, and Valentinyi 2013). At the same time,
technological changes, such as the ICT revolution and the shift into more skill-intensive output, have
had profound implications for production structures. Indeed, over the last four decades, advanced
economies experienced a well-documented shift away from agriculture and manufacturing and into
services. Currently the services sector is dominant, accounting for more than three-quarters of the
total labor share. Hence the dynamics of output and productivity within the sector are more
important quantitatively (Jorgenson and Timmer 2011).
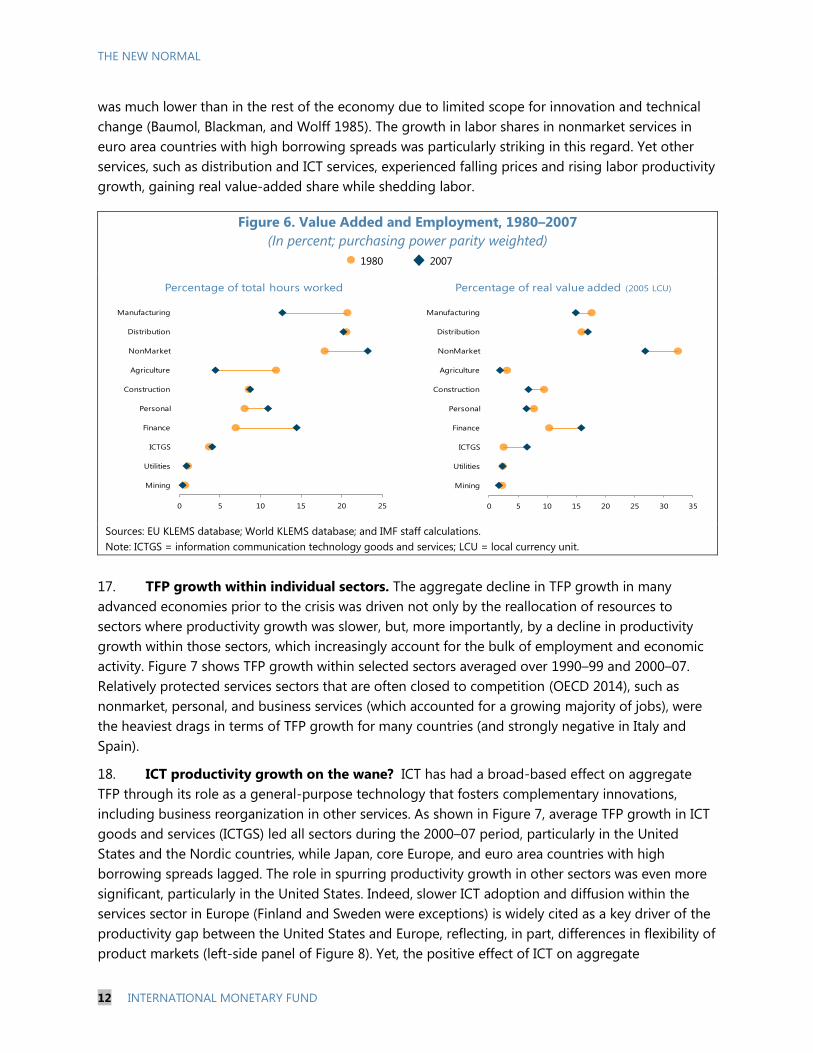
16. Shifts within the services sector. An analysis of employment and value-added shares
within the services sector and the underlying shifts between 1980 and 2007 points to a number of
commonalities across advanced economies (Figure 6). The increase in value-added and employment
shares in finance and business services—sectors that experienced a pre-crisis boom—was universal,
and particularly marked in the United Kingdom, where the labor share in finance and business
services was the highest among advanced economies. Personal services (e.g., hotels, restaurants,
social, and personal services) and nonmarket services (e.g., public administration, education, health,
and real estate) also gained labor share in most economies. Productivity growth in these services
THE NEW NORMAL
12 INTERNATIONAL MONETARY FUND
was much lower than in the rest of the economy due to limited scope for innovation and technical
change (Baumol, Blackman, and Wolff 1985). The growth in labor shares in nonmarket services in
euro area countries with high borrowing spreads was particularly striking in this regard. Yet other
services, such as distribution and ICT services, experienced falling prices and rising labor productivity
growth, gaining real value-added share while shedding labor.
Figure 6. Value Added and Employment, 1980–2007
(In percent; purchasing power parity weighted)
Sources: EU KLEMS database; World KLEMS database; and IMF staff calculations.
Note: ICTGS = information communication technology goods and services; LCU = local currency unit.
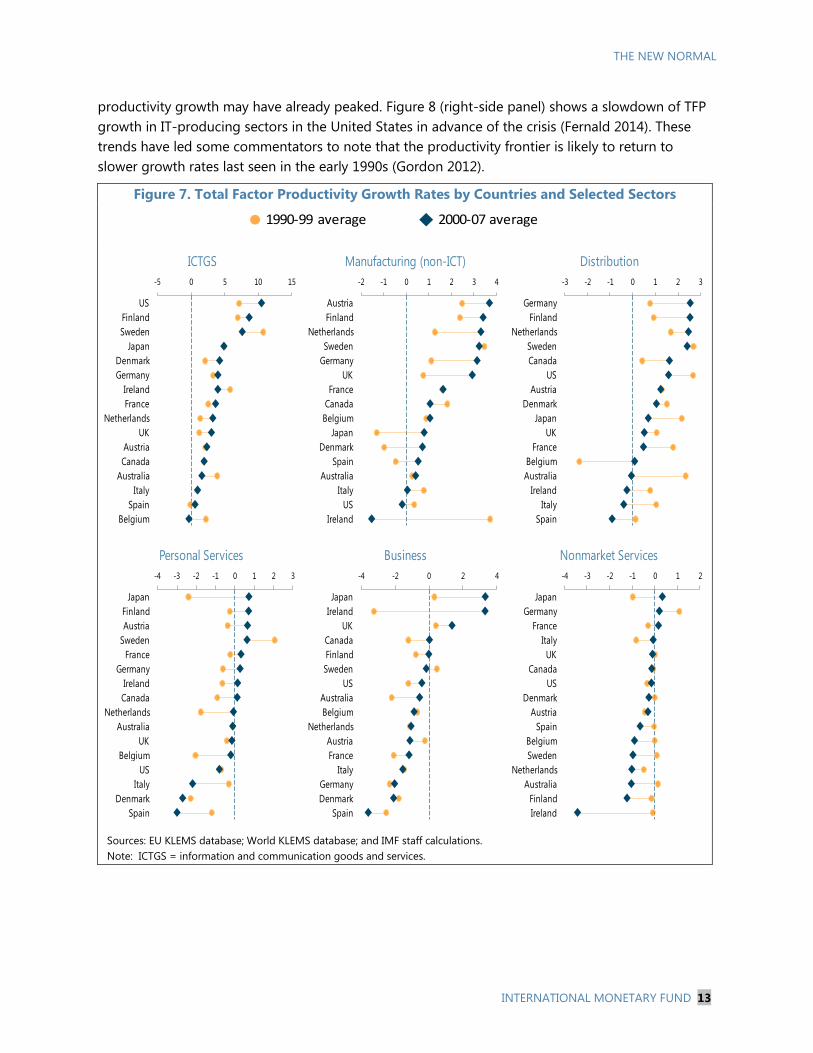
17. TFP growth within individual sectors. The aggregate decline in TFP growth in many
advanced economies prior to the crisis was driven not only by the reallocation of resources to
sectors where productivity growth was slower, but, more importantly, by a decline in productivity
growth within those sectors, which increasingly account for the bulk of employment and economic
activity. Figure 7 shows TFP growth within selected sectors averaged over 1990–99 and 2000–07.
Relatively protected services sectors that are often closed to competition (OECD 2014), such as
nonmarket, personal, and business services (which accounted for a growing majority of jobs), were
the heaviest drags in terms of TFP growth for many countries (and strongly negative in Italy and
Spain).
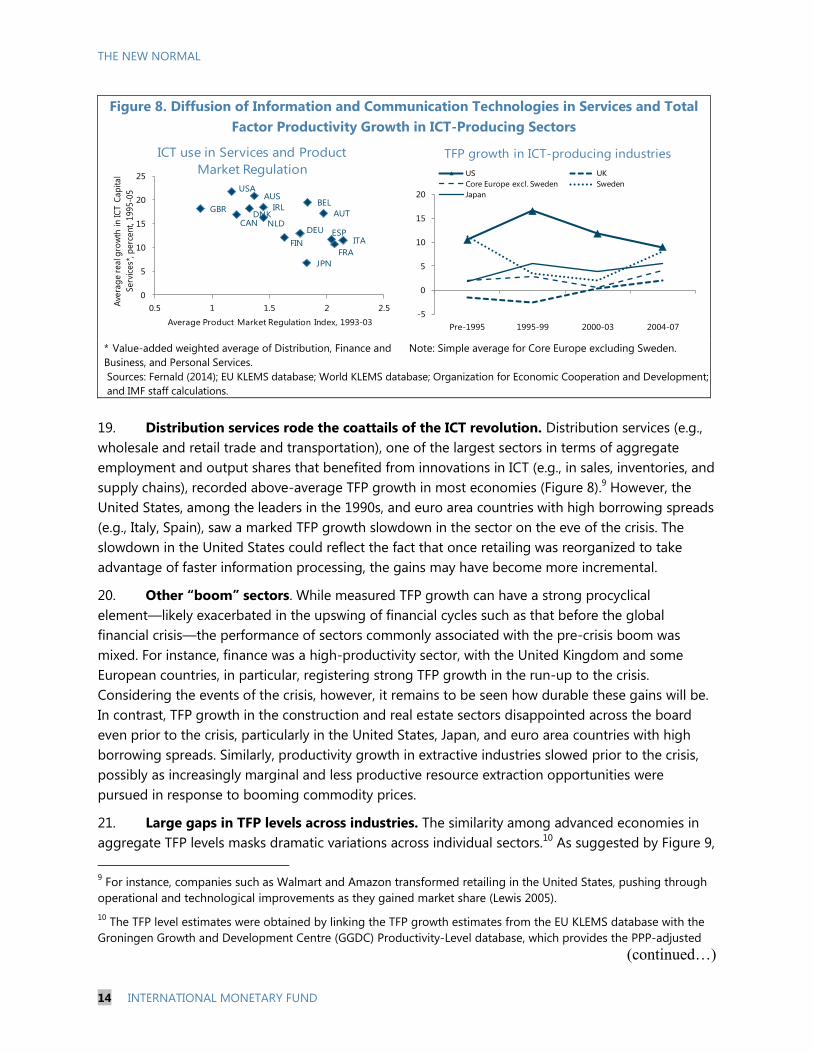
18. ICT productivity growth on the wane? ICT has had a broad-based effect on aggregate
TFP through its role as a general-purpose technology that fosters complementary innovations,
including business reorganization in other services. As shown in Figure 7, average TFP growth in ICT
goods and services (ICTGS) led all sectors during the 2000–07 period, particularly in the United
States and the Nordic countries, while Japan, core Europe, and euro area countries with high
borrowing spreads lagged. The role in spurring productivity growth in other sectors was even more
significant, particularly in the United States. Indeed, slower ICT adoption and diffusion within the
services sector in Europe (Finland and Sweden were exceptions) is widely cited as a key driver of the
productivity gap between the United States and Europe, reflecting, in part, differences in flexibility of
product markets (left-side panel of Figure 8). Yet, the positive effect of ICT on aggregate
1980 2007
0 5 10 15 20 25
Mining
Utilities
ICTGS
Finance
Personal
Construction
Agriculture
NonMarket
Distribution
Manufacturing
Percentage of total hours worked
0 5 10 15 20 25 30 35
Mining
Utilities
ICTGS
Finance
Personal
Construction
Agriculture
NonMarket
Distribution
Manufacturing
Percentage of real value added (2005 LCU)
THE NEW NORMAL
INTERNATIONAL MONETARY FUND 13
productivity growth may have already peaked. Figure 8 (right-side panel) shows a slowdown of TFP
growth in IT-producing sectors in the United States in advance of the crisis (Fernald 2014). These
trends have led some commentators to note that the productivity frontier is likely to return to
slower growth rates last seen in the early 1990s (Gordon 2012).
Figure 7. Total Factor Productivity Growth Rates by Countries and Selected Sectors
Sources: EU KLEMS database; World KLEMS database; and IMF staff calculations.
Note: ICTGS = information and communication goods and services.
1990-99 average 2000-07 average
-5 0 5 10 15
US
Finland
Sweden
Japan
Denmark
Germany
Ireland
France
Netherlands
UK
Austria
Canada
Australia
Italy
Spain
Belgium
ICTGS
-3 -2 -1 0 1 2 3
Germany
Finland
Netherlands
Sweden
Canada
US
Austria
Denmark
Japan
UK
France
Belgium
Australia
Ireland
Italy
Spain
Distribution
-2 -1 0 1 2 3 4
Austria
Finland
Netherlands
Sweden
Germany
UK
France
Canada
Belgium
Japan
Denmark
Spain
Australia
Italy
US
Ireland
Manufacturing (non-ICT)
-4 -3 -2 -1 0 1 2 3
Japan
Finland
Austria
Sweden
France
Germany
Ireland
Canada
Netherlands
Australia
UK
Belgium
US
Italy
Denmark
Spain
Personal Services
-4 -3 -2 -1 0 1 2
Japan
Germany
France
Italy
UK
Canada
US
Denmark
Austria
Spain
Belgium
Sweden
Netherlands
Australia
Finland
Ireland
Nonmarket Services
-4 -2 0 2 4
Japan
Ireland
UK
Canada
Finland
Sweden
US
Australia
Belgium
Netherlands
Austria
France
Italy
Germany
Denmark
Spain
Business
THE NEW NORMAL
14 INTERNATIONAL MONETARY FUND
Figure 8. Diffusion of Information and Communication Technologies in Services and Total
Factor Productivity Growth in ICT-Producing Sectors
* Value-added weighted average of Distribution, Finance and
Business, and Personal Services.
Note: Simple average for Core Europe excluding Sweden.
Sources: Fernald (2014); EU KLEMS database; World KLEMS database; Organization for Economic Cooperation and Development;
and IMF staff calculations.
19. Distribution services rode the coattails of the ICT revolution. Distribution services (e.g.,
wholesale and retail trade and transportation), one of the largest sectors in terms of aggregate
employment and output shares that benefited from innovations in ICT (e.g., in sales, inventories, and
supply chains), recorded above-average TFP growth in most economies (Figure 8).9 However, the
United States, among the leaders in the 1990s, and euro area countries with high borrowing spreads
(e.g., Italy, Spain), saw a marked TFP growth slowdown in the sector on the eve of the crisis. The
slowdown in the United States could reflect the fact that once retailing was reorganized to take
advantage of faster information processing, the gains may have become more incremental.
20. Other “boom” sectors. While measured TFP growth can have a strong procyclical
element—likely exacerbated in the upswing of financial cycles such as that before the global
financial crisis—the performance of sectors commonly associated with the pre-crisis boom was
mixed. For instance, finance was a high-productivity sector, with the United Kingdom and some
European countries, in particular, registering strong TFP growth in the run-up to the crisis.
Considering the events of the crisis, however, it remains to be seen how durable these gains will be.
In contrast, TFP growth in the construction and real estate sectors disappointed across the board
even prior to the crisis, particularly in the United States, Japan, and euro area countries with high
borrowing spreads. Similarly, productivity growth in extractive industries slowed prior to the crisis,
possibly as increasingly marginal and less productive resource extraction opportunities were
pursued in response to booming commodity prices.
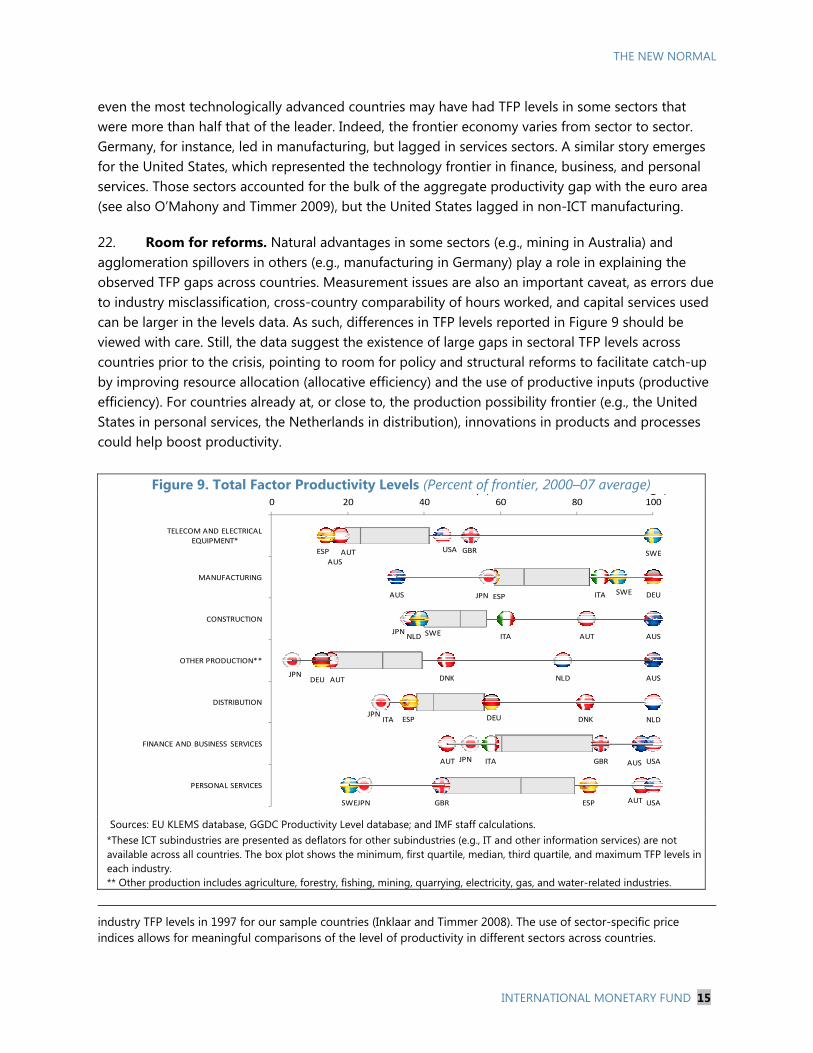
21. Large gaps in TFP levels across industries. The similarity among advanced economies in
aggregate TFP levels masks dramatic variations across individual sectors.10
As suggested by Figure 9,
9 For instance, companies such as Walmart and Amazon transformed retailing in the United States, pushing through
operational and technological improvements as they gained market share (Lewis 2005).
10 The TFP level estimates were obtained by linking the TFP growth estimates from the EU KLEMS database with the
Groningen Growth and Development Centre (GGDC) Productivity-Level database, which provides the PPP-adjusted
(continued…)
AUS
AUT
BEL
CANDNK
FINFRA
DEU
IRL
ITA
JPN
NLDESP
GBR
USA
0
5
10
15
20
25
0.5 1 1.5 2 2.5
Ave
rag
e r
eal g
row
th i
n IC
T C
ap
ital
Serv
ices*
, perc
ent, 1
995-0
5
Average Product Market Regulation Index, 1993-03
ICT use in Services and Product
Market Regulation
-5
0
5
10
15
20
Pre-1995 1995-99 2000-03 2004-07
TFP growth in ICT-producing industries
US UK
Core Europe excl. Sweden Sweden
Japan
THE NEW NORMAL
INTERNATIONAL MONETARY FUND 15
even the most technologically advanced countries may have had TFP levels in some sectors that were more than half that of the leader. Indeed, the frontier economy varies from sector to sector. Germany, for instance, led in manufacturing, but lagged in services sectors. A similar story emerges for the United States, which represented the technology frontier in finance, business, and personal services. Those sectors accounted for the bulk of the aggregate productivity gap with the euro area (see also O’Mahony and Timmer 2009), but the United States lagged in non-ICT manufacturing.
22. Room for reforms. Natural advantages in some sectors (e.g., mining in Australia) and agglomeration spillovers in others (e.g., manufacturing in Germany) play a role in explaining the observed TFP gaps across countries. Measurement issues are also an important caveat, as errors due to industry misclassification, cross-country comparability of hours worked, and capital services used can be larger in the levels data. As such, differences in TFP levels reported in Figure 9 should be viewed with care. Still, the data suggest the existence of large gaps in sectoral TFP levels across countries prior to the crisis, pointing to room for policy and structural reforms to facilitate catch-up by improving resource allocation (allocative efficiency) and the use of productive inputs (productive efficiency). For countries already at, or close to, the production possibility frontier (e.g., the United States in personal services, the Netherlands in distribution), innovations in products and processes could help boost productivity.
industry TFP levels in 1997 for our sample countries (Inklaar and Timmer 2008). The use of sector-specific price indices allows for meaningful comparisons of the level of productivity in different sectors across countries.
Figure 9. Total Factor Productivity Levels (Percent of frontier, 2000–07 average)
Sources: EU KLEMS database, GGDC Productivity Level database; and IMF staff calculations. *These ICT subindustries are presented as deflators for other subindustries (e.g., IT and other information services) are not available across all countries. The box plot shows the minimum, first quartile, median, third quartile, and maximum TFP levels in each industry. ** Other production includes agriculture, forestry, fishing, mining, quarrying, electricity, gas, and water-related industries.
AUS
AUS
AUS
AUS
AUS
AUT
AUT
AUT
AUT
AUT
DEU
DEU
DEU
DNK
DNK
ESP
ESP
ESP
ESP
GBR
GBR
GBR
ITA
ITA
ITA
ITA
JPN
JPN
JPN
JPN
JPN
JPN
NLD
NLD
NLD
SWE
SWE
SWE
SWE
USA
USA
USA
0 20 40 60 80 100
TELECOM AND ELECTRICAL EQUIPMENT*
MANUFACTURING
CONSTRUCTION
OTHER PRODUCTION**
DISTRIBUTION
FINANCE AND BUSINESS SERVICES
PERSONAL SERVICES
y ( g )
THE NEW NORMAL
16 INTERNATIONAL MONETARY FUND
III. RESOURCE ALLOCATION AND PRODUCTIVITY
Significant policy-induced distortions prevented efficient allocation of factors of production across
diverse industries and economic sectors even prior to the global financial crisis. Reducing these
distortions and achieving more efficient resource allocation could have a substantial impact on
boosting productivity.
23. Resource allocation. Aggregate TFP in an economy depends not only on the efficiency of
individual firms or industries but also on how inputs are allocated across them. Indeed, economic
theory suggests that more productive firms should have a greater incentive to innovate, and be
more able to attract labor and capital inputs, relative to less efficient firms. Over time, less
productive firms are forced to become more efficient or exit.11
This process brings about capital and
labor reallocation, which shows up in measured TFP and output. Misallocation of resources, however,
can arise if impediments exist to the movement of factors between heterogeneous firms and
sectors. This can give rise to persistent rates-of-return differentials across firms and sectors,
undermining aggregate TFP growth.
24. Impediments to efficient allocation. Impediments to the efficient allocation of capital and
labor in advanced economies take various forms. Exemptions of certain producers from regulations
or taxes, heavily-subsidized agricultural sectors, and “size-dependent policies” (e.g., size of retail
establishments in Japan, and employment protection policies in Italy and France that only take effect
beyond a certain size threshold) are distortions that induce a misallocation of factors. Labor and
product market rigidities, market structure, and imperfect competition also influence factor
reallocation, innovation, and firm restructuring.12
Examples of capital misallocation include financial
frictions that increase the cost of capital, and distort investment decisions, including in technology-
enhancing capital.13
These distortions lead firms to make inefficient capital and labor choices,
thereby lowering aggregate TFP (Restuccia and Rogerson 2008; Hsieh and Klenow 2009).
25. Within-sector productivity. Substantial TFP gains can accrue from reducing resource
misallocation and improving efficiency even within narrowly-defined industries of the economy.
Indeed, industry and firm-level evidence confirms the presence of substantial misallocation of factor
11
For example, Baily, Hulten, and Campbell (1992) find that 50 percent of the growth in manufacturing productivity
in the United States in the 1970s and 1980s can be attributed to the reallocation of factors across plants and firm
entry and exit (see Foster, Haltiwanger, and Syverson 2008). Similarly, Barnett and others (2014) find that labor
reallocation across firms explained 48 percent of labor productivity growth for most sectors in the U.K. economy in
the five years prior to 2007.
12 Hopenhayn and Rogerson (1993) showed that labor market firing taxes distort the allocation of labor across
establishments and that empirically reasonable values for this tax could generate TFP losses on the order of about 5
percent. In a related study, Lagos (2006) shows how policies such as unemployment insurance and employment
protection affect TFP via selection effects. See also Garicano, Lelarge, and Van Reenen (2013).
13 Gilchrist, Sim, and Zakrajsek (2013) relate financial frictions, measured as an increased dispersion in borrowing
costs, to capital misallocation across U.S. manufacturing firms even prior to the crisis.
THE NEW NORMAL
INTERNATIONAL MONETARY FUND 17
inputs as well as cross-country differences in establishment-level productivity and points to their
potentially important role in generating large losses in aggregate productivity (Restuccia and
Rogerson 2013; Hopenhayn 2014). For instance, Dias, Marques, and Richmond (2014) find that a
better allocation of resources across firms within services industries in Portugal could boost
measured TFP by about 40 percent. Similarly, Bartelsman, Haltiwanger, and Scarpetta (2013) find
large effects on aggregate TFP from the presence of idiosyncratic distortions, predicting that output
could be improved by as much as 15 percent in some European countries by improving the
allocation of resources across manufacturing establishments.
26. Measuring misallocation across sectors. While within-industry misallocation accounts for
the bulk of cross-country productivity differences, reducing misallocation across broad economic
sectors can also spur aggregate productivity and output. Following Aoki (2012), and using data on
sector-level value-added outputs, factor inputs, and input payments from the EU KLEMS database
for 12 advanced economies over 2000–07, we assess the size of the potential labor and capital
frictions (or equivalently “wedges”) that must be in place for the data to be an equilibrium outcome
of the distorted economy (see the Technical Appendix for the theoretical model). We then undertake
a counterfactual exercise to assess aggregate productivity and growth gains from eliminating these
distortions (Box 1). Given stylized model assumptions, the estimates are indicative of what can be
achieved from reducing distortions, rather than precise productivity payoffs.
Box 1. Estimating TFP Gains from Improved Across-Sector Resource Allocation
This exercise calculates the TFP gain that could accrue if each country were to adopt a better allocation of its
productive inputs across sectors. In an environment without any frictions, the optimal allocation of factor
inputs across productive sectors requires the equalization of marginal revenue. Deviations from this outcome
represent a misallocation of resources and translate into lower aggregate productivity and output.
The quantitative exercise includes the following steps:
Building a static general equilibrium model with multiple sectors (see Technical Appendix), where each
sector is subject to frictions. Our framework abstracts from specific frictions by assuming that the
distortions ultimately affect the effective cost of capital and labor.
For each country, measuring the sectoral TFP for each year from the data. We also measure labor and
capital frictions in each sector by estimating the cross-sector differences in marginal returns to inputs from
the data. With these frictions, the equilibrium sectoral input allocation and output in our stylized model
should exactly replicate the allocation and output measured in the data.
Fixing other elements of the model (technology, aggregate labor and capital stock, consumer preferences,
etc.), calculating the counterfactual aggregate TFP in an economy with identical frictions in all sectors. This
allows us to derive the potential TFP gain if the country were to adopt the (Pareto) efficient allocation.
Also considering changes only to capital (or labor) frictions. This allows us to identify the contributions of
reallocating labor (capital) to the aggregate TFP gain.
One noteworthy issue arises from the measurement of labor inputs. The easiest way to measure labor input is
to consider the total hours worked by employees without distinguishing workers’ skill levels (our baseline
measure of labor inputs). However, this measure could be problematic, as high-skilled workers tend to provide
more effective labor services than low-skilled workers. Therefore, we also constructed a labor index as a
weighted sum of hours worked by different skill groups. We report the results of our counterfactual exercise
for both the baseline (without labor skill heterogeneity) and the scenario with labor skill heterogeneity.
THE NEW NORMAL
18 INTERNATIONAL MONETARY FUND
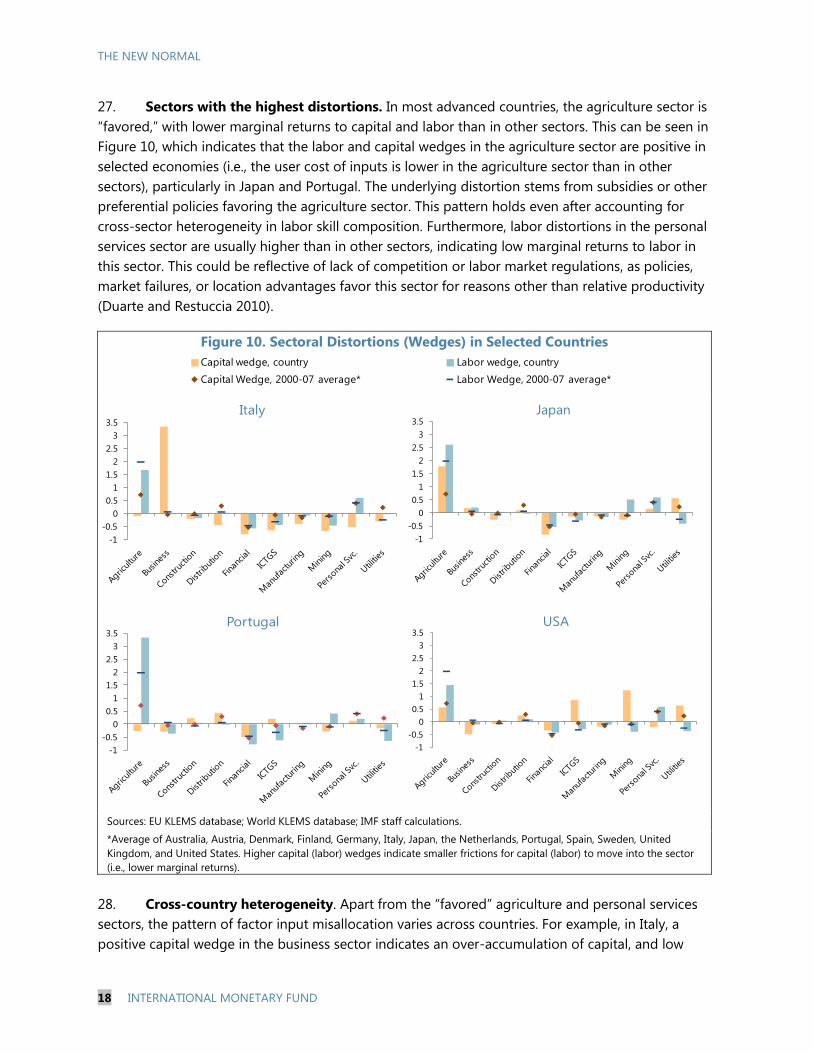
27. Sectors with the highest distortions. In most advanced countries, the agriculture sector is
“favored,” with lower marginal returns to capital and labor than in other sectors. This can be seen in
Figure 10, which indicates that the labor and capital wedges in the agriculture sector are positive in
selected economies (i.e., the user cost of inputs is lower in the agriculture sector than in other
sectors), particularly in Japan and Portugal. The underlying distortion stems from subsidies or other
preferential policies favoring the agriculture sector. This pattern holds even after accounting for
cross-sector heterogeneity in labor skill composition. Furthermore, labor distortions in the personal
services sector are usually higher than in other sectors, indicating low marginal returns to labor in
this sector. This could be reflective of lack of competition or labor market regulations, as policies,
market failures, or location advantages favor this sector for reasons other than relative productivity
(Duarte and Restuccia 2010).
Figure 10. Sectoral Distortions (Wedges) in Selected Countries
Sources: EU KLEMS database; World KLEMS database; IMF staff calculations.
*Average of Australia, Austria, Denmark, Finland, Germany, Italy, Japan, the Netherlands, Portugal, Spain, Sweden, United
Kingdom, and United States. Higher capital (labor) wedges indicate smaller frictions for capital (labor) to move into the sector
(i.e., lower marginal returns).
28. Cross-country heterogeneity. Apart from the “favored” agriculture and personal services
sectors, the pattern of factor input misallocation varies across countries. For example, in Italy, a
positive capital wedge in the business sector indicates an over-accumulation of capital, and low
-1
-0.5
0
0.5
1
1.5
2
2.5
3
3.5 Italy
Capital wedge, country Labor wedge, country
Capital Wedge, 2000-07 average* Labor Wedge, 2000-07 average*
-1
-0.5
0
0.5
1
1.5
2
2.5
3
3.5
Italy
-1
-0.5
0
0.5
1
1.5
2
2.5
3
3.5Japan
-1
-0.5
0
0.5
1
1.5
2
2.5
3
3.5Portugal
-1
-0.5
0
0.5
1
1.5
2
2.5
3
3.5USA
THE NEW NORMAL
INTERNATIONAL MONETARY FUND 19
capital returns to the sector. In Portugal, low labor wedges in the financial and ICTGS sectors
indicate significant barriers to entry and/or other frictions, which limit the size of employment in
these sectors. In the United States, misallocation stems from capital distortions, particularly in
mining.
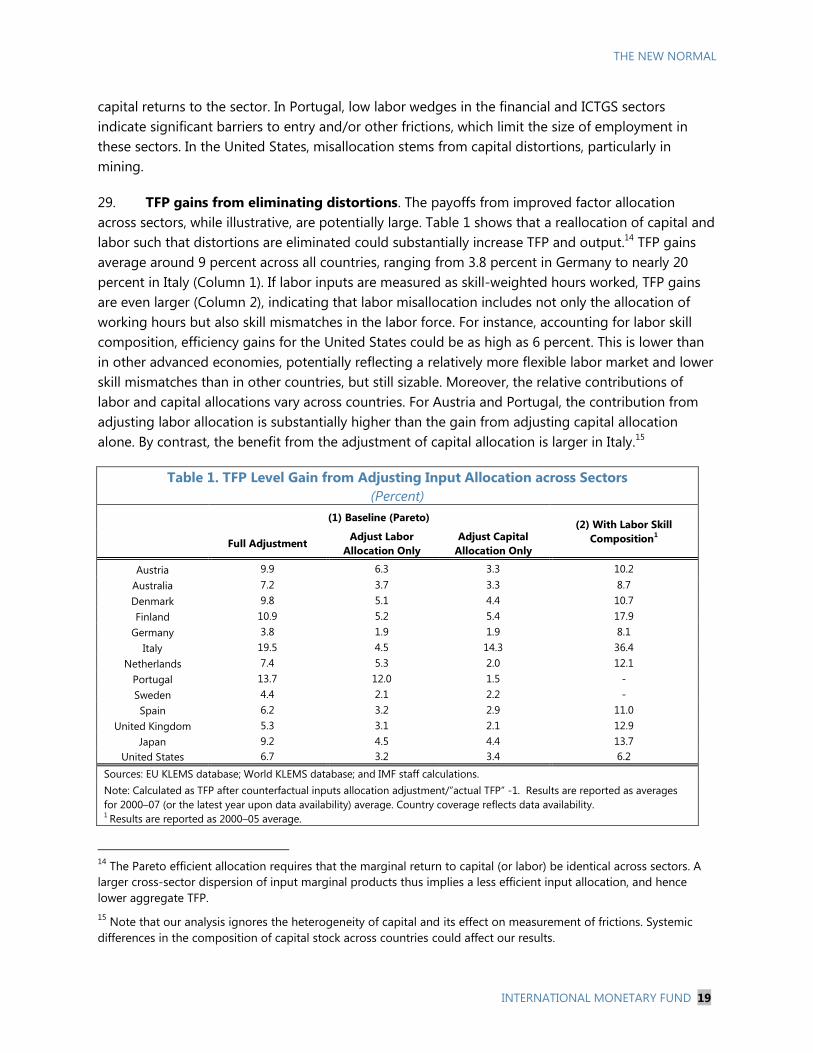
29. TFP gains from eliminating distortions. The payoffs from improved factor allocation
across sectors, while illustrative, are potentially large. Table 1 shows that a reallocation of capital and
labor such that distortions are eliminated could substantially increase TFP and output.14
TFP gains
average around 9 percent across all countries, ranging from 3.8 percent in Germany to nearly 20
percent in Italy (Column 1). If labor inputs are measured as skill-weighted hours worked, TFP gains
are even larger (Column 2), indicating that labor misallocation includes not only the allocation of
working hours but also skill mismatches in the labor force. For instance, accounting for labor skill
composition, efficiency gains for the United States could be as high as 6 percent. This is lower than
in other advanced economies, potentially reflecting a relatively more flexible labor market and lower
skill mismatches than in other countries, but still sizable. Moreover, the relative contributions of
labor and capital allocations vary across countries. For Austria and Portugal, the contribution from
adjusting labor allocation is substantially higher than the gain from adjusting capital allocation
alone. By contrast, the benefit from the adjustment of capital allocation is larger in Italy.15
Table 1. TFP Level Gain from Adjusting Input Allocation across Sectors
(Percent)
(1) Baseline (Pareto) (2) With Labor Skill
Composition1 Full Adjustment
Adjust Labor
Allocation Only
Adjust Capital
Allocation Only
Austria 9.9 6.3 3.3 10.2
Australia 7.2 3.7 3.3 8.7
Denmark 9.8 5.1 4.4 10.7
Finland 10.9 5.2 5.4 17.9
Germany 3.8 1.9 1.9 8.1
Italy 19.5 4.5 14.3 36.4
Netherlands 7.4 5.3 2.0 12.1
Portugal 13.7 12.0 1.5 -
Sweden 4.4 2.1 2.2 -
Spain 6.2 3.2 2.9 11.0
United Kingdom 5.3 3.1 2.1 12.9
Japan 9.2 4.5 4.4 13.7
United States 6.7 3.2 3.4 6.2
Sources: EU KLEMS database; World KLEMS database; and IMF staff calculations.
Note: Calculated as TFP after counterfactual inputs allocation adjustment/”actual TFP” -1. Results are reported as averages
for 2000–07 (or the latest year upon data availability) average. Country coverage reflects data availability. 1 Results are reported as 2000–05 average.
14
The Pareto efficient allocation requires that the marginal return to capital (or labor) be identical across sectors. A
larger cross-sector dispersion of input marginal products thus implies a less efficient input allocation, and hence
lower aggregate TFP.
15 Note that our analysis ignores the heterogeneity of capital and its effect on measurement of frictions. Systemic
differences in the composition of capital stock across countries could affect our results.
THE NEW NORMAL
20 INTERNATIONAL MONETARY FUND
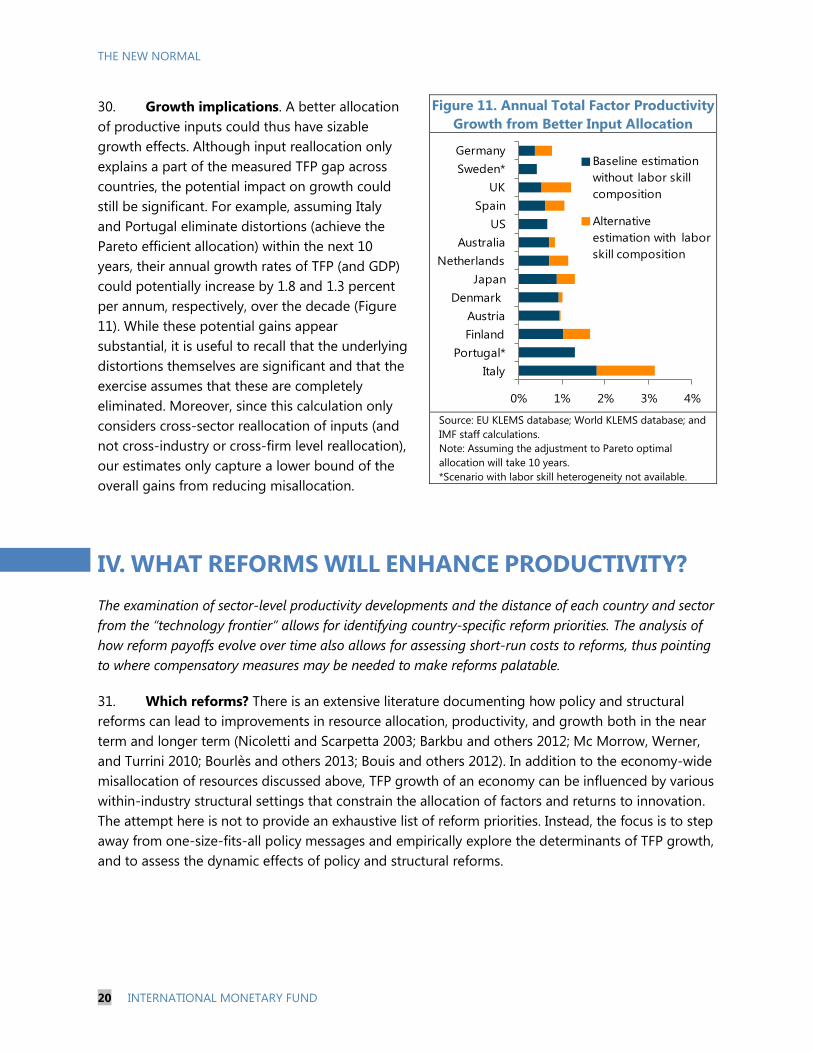
30. Growth implications. A better allocation
of productive inputs could thus have sizable
growth effects. Although input reallocation only
explains a part of the measured TFP gap across
countries, the potential impact on growth could
still be significant. For example, assuming Italy
and Portugal eliminate distortions (achieve the
Pareto efficient allocation) within the next 10
years, their annual growth rates of TFP (and GDP)
could potentially increase by 1.8 and 1.3 percent
per annum, respectively, over the decade (Figure
11). While these potential gains appear
substantial, it is useful to recall that the underlying
distortions themselves are significant and that the
exercise assumes that these are completely
eliminated. Moreover, since this calculation only
considers cross-sector reallocation of inputs (and
not cross-industry or cross-firm level reallocation),
our estimates only capture a lower bound of the
overall gains from reducing misallocation.
IV. WHAT REFORMS WILL ENHANCE PRODUCTIVITY?
The examination of sector-level productivity developments and the distance of each country and sector
from the “technology frontier” allows for identifying country-specific reform priorities. The analysis of
how reform payoffs evolve over time also allows for assessing short-run costs to reforms, thus pointing
to where compensatory measures may be needed to make reforms palatable.
31. Which reforms? There is an extensive literature documenting how policy and structural
reforms can lead to improvements in resource allocation, productivity, and growth both in the near
term and longer term (Nicoletti and Scarpetta 2003; Barkbu and others 2012; Mc Morrow, Werner,
and Turrini 2010; Bourlès and others 2013; Bouis and others 2012). In addition to the economy-wide
misallocation of resources discussed above, TFP growth of an economy can be influenced by various
within-industry structural settings that constrain the allocation of factors and returns to innovation.
The attempt here is not to provide an exhaustive list of reform priorities. Instead, the focus is to step
away from one-size-fits-all policy messages and empirically explore the determinants of TFP growth,
and to assess the dynamic effects of policy and structural reforms.
Figure 11. Annual Total Factor Productivity
Growth from Better Input Allocation
Source: EU KLEMS database; World KLEMS database; and
IMF staff calculations.
Note: Assuming the adjustment to Pareto optimal
allocation will take 10 years.
*Scenario with labor skill heterogeneity not available.
0% 1% 2% 3% 4%
Italy
Portugal*
Finland
Austria
Denmark
Japan
Netherlands
Australia
US
Spain
UK
Sweden*
GermanyBaseline estimation
without labor skill
composition
Alternative
estimation with labor
skill composition
THE NEW NORMAL
INTERNATIONAL MONETARY FUND 21
A. Drivers of Total Factor Productivity Growth
32. Conceptual framework. The conceptual framework of “distance to the technology frontier”
(Aghion and Howitt 2006, 2009; Acemoglu, Aghion, and Zilibotti 2006) is employed to empirically
assess the determinants of TFP growth across different industries and countries.16
Economic theory
distinguishes between two types of innovation activity: adoption of existing vintage technologies
(“imitation”) and introduction of new state-of-the-art technology (“innovation”). The key intuition is
that countries that are farther away from the global technological frontier tend to grow mainly
through technology adoption and imitation, whereas countries closer to the frontier rely more on
innovation. Therefore, the set of policies aimed at sustaining productivity growth across industries
and countries could vary depending on their locations vis-à-vis their technological frontiers.
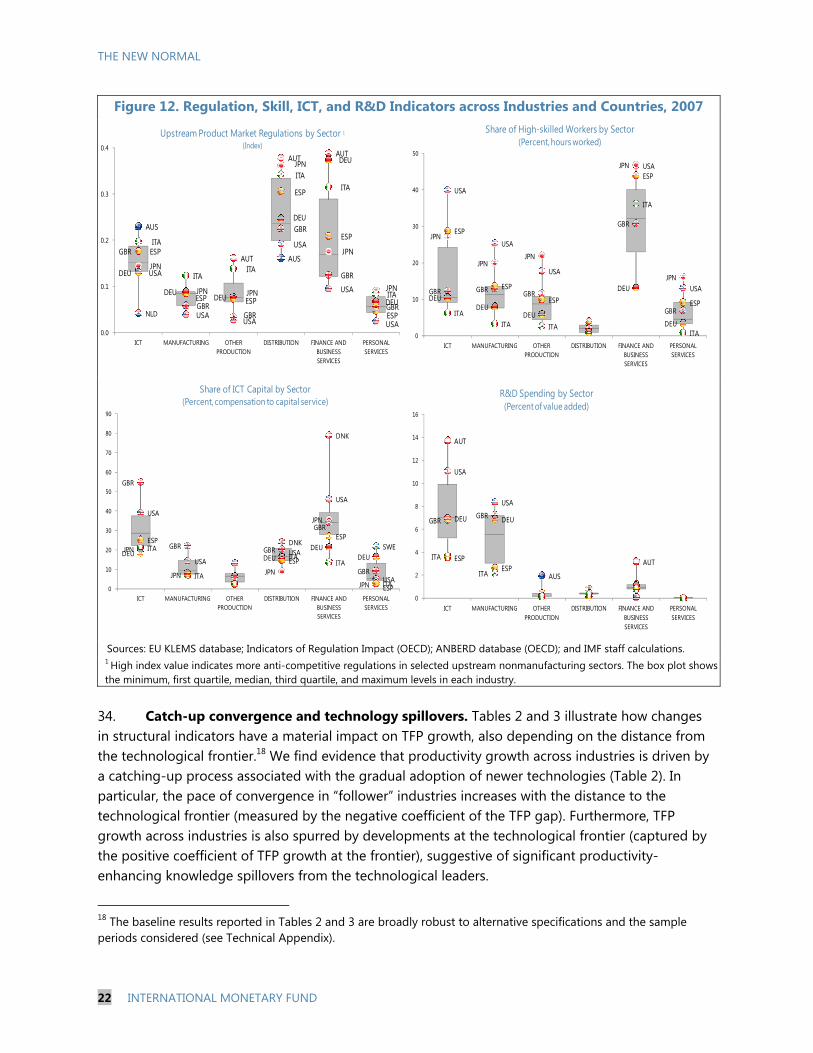
33. Structural drivers of TFP growth. The focus here is on assessing how regulatory
characteristics affect efficiency and convergence and other factors that drive expansion of the
technological frontier and foster technology adoption, such as education, innovation, and ICT use.
The degree of market flexibility, entry barriers, and competition in an economy is captured by the
stringency of product market and employment protection regulations.17
As can be seen in Figure 12,
rigidities in product markets vary across industries and countries, with services among the most
heavily regulated industries in most countries, especially in Italy and Japan. The wide dispersion in
services regulation across peers suggests a potential upside to reforms. An economy’s capacity for
innovation and absorption/adoption of new technologies is captured by the intensity of use of high-
skilled labor, ICT capital inputs, and research and development (R&D) spending. The United States
appears to lead its peers in most sectors in innovation and the intensive-use of high-skilled labor
(Figure 12). Moreover, as can be seen in Figure 12, unlike the manufacturing and ICT sectors,
innovation in services does not stem from R&D spending. Instead, investment in tangibles
(particularly automation and ICT) and nontangibles (e.g., business processes, organizational
structure) are important sources of productivity growth in many services (Uppenberg and Strauss
2010).
16
We conduct an industry-level panel study for 23 market industries in 11 advanced economies using annual data
over 1970–2007 (see Technical Appendix for details). Our empirical specification controls for country-industry specific
characteristics and common factors affecting TFP growth, as well as the TFP gap with respect to the “global frontier
—defined as the highest level of TFP in a specific industry in a given year.
17 For the product market regulation measure, we use the industry-specific OECD Indicators of Regulation Impact,
which capture the extent of anti-competitive regulations in upstream industries. For labor market regulations, the
OECD’s Employment Protection Legislation indicator is used as the proxy. Unlike other explanatory variables used in
the empirical analysis, the employment protection indicator is only available at the economy-wide level. See
Technical Appendix for more details.
THE NEW NORMAL
22 INTERNATIONAL MONETARY FUND
Figure 12. Regulation, Skill, ICT, and R&D Indicators across Industries and Countries, 2007
Sources: EU KLEMS database; Indicators of Regulation Impact (OECD); ANBERD database (OECD); and IMF staff calculations. 1 High index value indicates more anti-competitive regulations in selected upstream nonmanufacturing sectors. The box plot shows the minimum, first quartile, median, third quartile, and maximum levels in each industry.
34. Catch-up convergence and technology spillovers. Tables 2 and 3 illustrate how changes in structural indicators have a material impact on TFP growth, also depending on the distance from the technological frontier.18 We find evidence that productivity growth across industries is driven by a catching-up process associated with the gradual adoption of newer technologies (Table 2). In particular, the pace of convergence in “follower” industries increases with the distance to the technological frontier (measured by the negative coefficient of the TFP gap). Furthermore, TFP growth across industries is also spurred by developments at the technological frontier (captured by the positive coefficient of TFP growth at the frontier), suggestive of significant productivity-enhancing knowledge spillovers from the technological leaders.
18 The baseline results reported in Tables 2 and 3 are broadly robust to alternative specifications and the sample periods considered (see Technical Appendix).
USA
USAUSA
USA
USA
USA
JPN
JPN JPN
JPN
JPN
JPN
ITA
ITAITA
ITAITA
ITA
GBR
GBRGBR
GBR
GBR
GBR
ESP
ESP ESP
ESP
ESP
ESP
DEU
DEUDEU
DEU
DEU
DEU
AUS
AUSAUT
AUT AUT
NLD
0.0
0.1
0.2
0.3
0.4
ICT MANUFACTURING OTHER PRODUCTION
DISTRIBUTION FINANCE AND BUSINESS SERVICES
PERSONAL SERVICES
Upstream Product Market Regulations by Sector 1
(Index)
USA
USA
USA
USA
USA
JPN
JPNJPN
JPN
JPN
ITAITA ITA
ITA
ITA
GBR GBR GBR
GBR
GBR
ESP
ESP
ESP
ESP
ESPDEU
DEUDEU
DEU
DEU0
10
20
30
40
50
ICT MANUFACTURING OTHER PRODUCTION
DISTRIBUTION FINANCE AND BUSINESS SERVICES
PERSONAL SERVICES
Share of High-skilled Workers by Sector(Percent, hours worked)
USA
USAUSA
USA
USA
JPN
JPN JPN
JPN
JPN
ITA
ITA
ITAITA
ITA
GBR
GBR GBR
GBR
GBR
ESP
ESP
ESP
ESP
DEU DEUDEU
DEU
DNK
DNK
SWE
0
10
20
30
40
50
60
70
80
90
ICT MANUFACTURING OTHER PRODUCTION
DISTRIBUTION FINANCE AND BUSINESS SERVICES
PERSONAL SERVICES
Share of ICT Capital by Sector(Percent, compensation to capital service)
USA
USA
GBRGBR
ESPESP
DEU DEU
ITA
ITA
AUT
AUT
AUS
0
2
4
6
8
10
12
14
16
ICT MANUFACTURING OTHER PRODUCTION
DISTRIBUTION FINANCE AND BUSINESS SERVICES
PERSONAL SERVICES
R&D Spending by Sector(Percent of value added)
THE NEW NORMAL
INTERNATIONAL MONETARY FUND 23
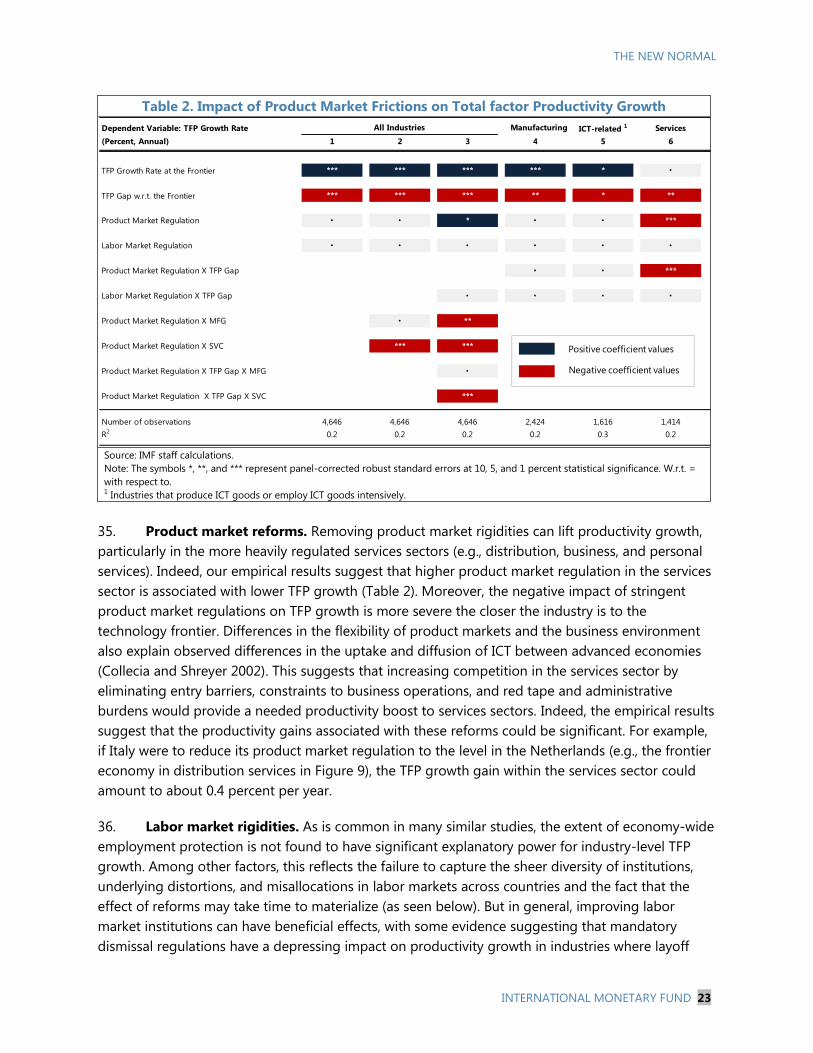
Table 2. Impact of Product Market Frictions on Total factor Productivity Growth
Source: IMF staff calculations.
Note: The symbols *, **, and *** represent panel-corrected robust standard errors at 10, 5, and 1 percent statistical significance. W.r.t. =
with respect to. 1 Industries that produce ICT goods or employ ICT goods intensively.
35. Product market reforms. Removing product market rigidities can lift productivity growth,
particularly in the more heavily regulated services sectors (e.g., distribution, business, and personal
services). Indeed, our empirical results suggest that higher product market regulation in the services
sector is associated with lower TFP growth (Table 2). Moreover, the negative impact of stringent
product market regulations on TFP growth is more severe the closer the industry is to the
technology frontier. Differences in the flexibility of product markets and the business environment
also explain observed differences in the uptake and diffusion of ICT between advanced economies
(Collecia and Shreyer 2002). This suggests that increasing competition in the services sector by
eliminating entry barriers, constraints to business operations, and red tape and administrative
burdens would provide a needed productivity boost to services sectors. Indeed, the empirical results
suggest that the productivity gains associated with these reforms could be significant. For example,
if Italy were to reduce its product market regulation to the level in the Netherlands (e.g., the frontier
economy in distribution services in Figure 9), the TFP growth gain within the services sector could
amount to about 0.4 percent per year.
36. Labor market rigidities. As is common in many similar studies, the extent of economy-wide
employment protection is not found to have significant explanatory power for industry-level TFP
growth. Among other factors, this reflects the failure to capture the sheer diversity of institutions,
underlying distortions, and misallocations in labor markets across countries and the fact that the
effect of reforms may take time to materialize (as seen below). But in general, improving labor
market institutions can have beneficial effects, with some evidence suggesting that mandatory
dismissal regulations have a depressing impact on productivity growth in industries where layoff
Dependent Variable: TFP Growth Rate ICT-related 1 Services
(Percent, Annual) 1 2 3 4 5 6
TFP Growth Rate at the Frontier *** *** *** *** * ‧
TFP Gap w.r.t. the Frontier *** *** *** ** * **
Product Market Regulation ‧ ‧ * ‧ ‧ ***
Labor Market Regulation ‧ ‧ ‧ ‧ ‧ ‧
Product Market Regulation X TFP Gap ‧ ‧ ***
Labor Market Regulation X TFP Gap ‧ ‧ ‧ ‧
Product Market Regulation X MFG ‧ **
Product Market Regulation X SVC *** ***
Product Market Regulation X TFP Gap X MFG ‧
Product Market Regulation X TFP Gap X SVC ***
Number of observations 4,646 4,646 4,646 2,424 1,616 1,414
R2 0.2 0.2 0.2 0.2 0.3 0.2
All Industries Manufacturing
Positive coefficient values
Negative coefficient values
THE NEW NORMAL
24 INTERNATIONAL MONETARY FUND
restrictions are more likely to be binding (Bassanini, Nunziata, and Venn 2009). Other studies found
that longer and more generous unemployment benefits, high labor tax wedges, and collective
bargaining systems that are more favorable to wages than employment affect employment
negatively (Nickell, Nunziata, and Ochel 2005; Bassanini and Duval 2009). However, studies do not
always agree on the role of specific institutions, and cross-country evidence on their productivity
impact is less clear-cut (OECD 2007). In general, firm-level evidence points to stronger productivity
effects, with less stringent labor market institutions and a more efficient use of human capital (e.g.,
reducing labor skills mismatches) facilitating the movement of labor to more productive firms, and
fostering creative destruction (firm entry and exit) (Henrekson 2014).
37. Productivity impact of knowledge capital and innovation. More intensive use of high-
skilled labor and ICT capital inputs and higher spending on R&D activities is associated with higher
productivity growth (Table 3). The channels through which these factors affect TFP growth, however,
differ. A highly skilled labor force can foster the development of skill-intensive industries and the
diffusion of new technologies. For example, the results in Table 3 suggest that increasing the share
of high-skilled workers in the United Kingdom to the level of Japan could boost productivity growth
by an additional 0.7 percent per year. More intensive and widespread use of ICT can support more
efficient organizational structures and business processes within firms, leading to efficiency gains.
Greater R&D spending creates new efficiency-enhancing technologies. These results clearly support
an important public policy role for improving educational attainment, fostering ICT diffusion, and
encouraging innovation in advanced economies.
38. Varying sectoral effects. Investments in human capital and R&D can play a significant role
in spurring TFP growth in ICT-related industries (and services in the case of skilled labor), with the
strongest productivity effects for countries closer to the frontier.19
Trade and technology spillovers
imply that reforms in leading economies not only have large productivity effects within these
countries, but also generate important positive spillovers. Within the services sector, however, the
impact on TFP growth of more intensive use of ICT is highest for countries with lagging productivity
in the sector. This suggests an important role for fostering greater ICT investment and diffusion in
services, including by eliminating barriers to trade and foreign direct investment, particularly in
countries that have important productivity gaps with respect to peers.20
19
This finding is consistent with previous studies that find that differences in TFP growth rates across industries are
linked to persistent cross-country differences in R&D intensity. The empirical literature has identified three set of
factors as potential determinants of industry variation in research intensity and productivity growth: technological
factors affecting the efficiency of research; the extent to which R&D benefits the innovator; and demand, which
influences the returns to research (Ngai and Samaniego 2011).
20 OECD (2001) finds that firms in the United States and Canada enjoyed considerably lower costs of ICT investment
goods in the 1990s than firms in European countries and Japan. Barriers to trade, in particular nontariff barriers
related to standards, import licensing, and government procurement, may partly explain cost differentials. The
difference in the timing of the technological boom in ICT and the regulatory reform process in Europe is also
considered a key factor hindering effective accumulation of ICT capital, particularly in services industries where
deregulation has been much slower to take place (Arnold, Nicoletti, and Scarpetta 2008).
THE NEW NORMAL
INTERNATIONAL MONETARY FUND 25
Table 3. Impact of ICT, Human Capital, and R&D
Source: IMF staff calculations.
Note: The symbols *, **, and *** represent panel-corrected robust standard errors at 10, 5, and 1 percent statistical significance. W.r.t. =
with respect to. 1 Industries that produce ICT goods or employ ICT goods intensively.
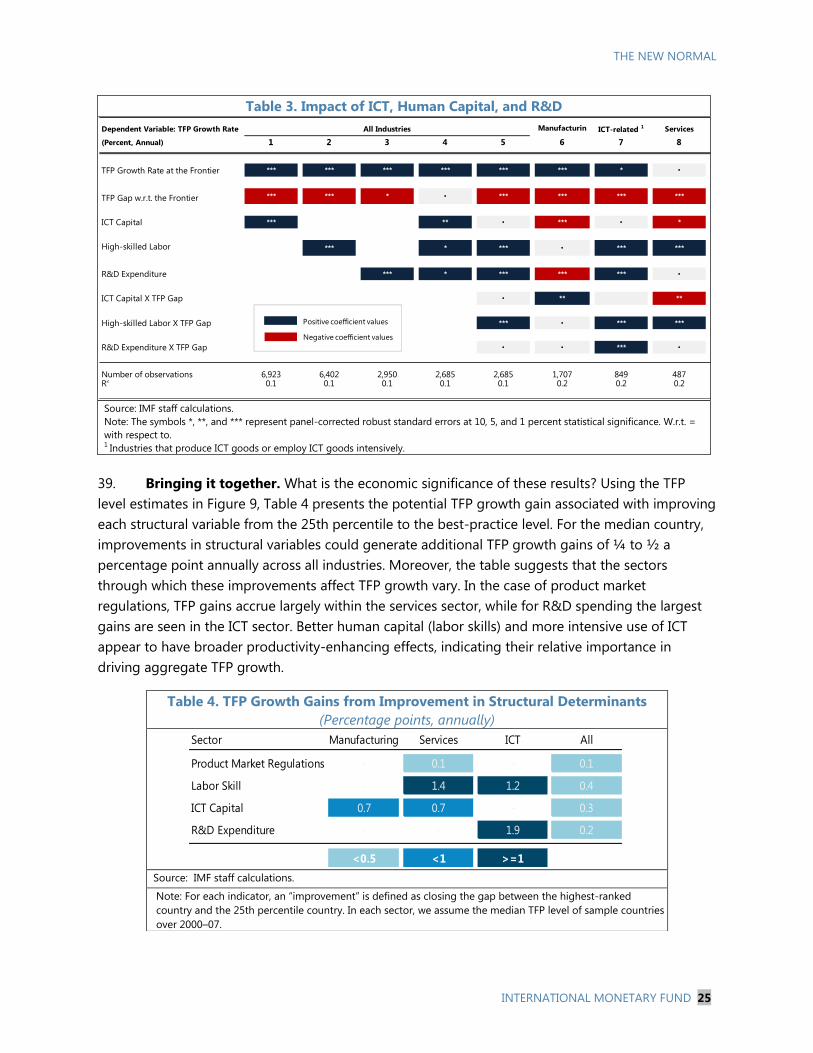
39. Bringing it together. What is the economic significance of these results? Using the TFP
level estimates in Figure 9, Table 4 presents the potential TFP growth gain associated with improving
each structural variable from the 25th percentile to the best-practice level. For the median country,
improvements in structural variables could generate additional TFP growth gains of ¼ to ½ a
percentage point annually across all industries. Moreover, the table suggests that the sectors
through which these improvements affect TFP growth vary. In the case of product market
regulations, TFP gains accrue largely within the services sector, while for R&D spending the largest
gains are seen in the ICT sector. Better human capital (labor skills) and more intensive use of ICT
appear to have broader productivity-enhancing effects, indicating their relative importance in
driving aggregate TFP growth.
Dependent Variable: TFP Growth Rate Manufacturin
g
ICT-related 1 Services
(Percent, Annual) 1 2 3 4 5 6 7 8
TFP Growth Rate at the Frontier *** *** *** *** *** *** * ‧
TFP Gap w.r.t. the Frontier *** *** * ‧ *** *** *** ***
ICT Capital *** ** ‧ *** ‧ *
High-skilled Labor *** * *** ‧ *** ***
R&D Expenditure *** * *** *** *** ‧
ICT Capital X TFP Gap ‧ ** **
High-skilled Labor X TFP Gap *** ‧ *** ***
R&D Expenditure X TFP Gap ‧ ‧ *** ‧
Number of observations 6,923 6,402 2,950 2,685 2,685 1,707 849 487R
20.1 0.1 0.1 0.1 0.1 0.2 0.2 0.2
All Industries
Positive coefficient values
Negative coefficient values
Table 4. TFP Growth Gains from Improvement in Structural Determinants
(Percentage points, annually)
Source: IMF staff calculations.
Note: For each indicator, an “improvement” is defined as closing the gap between the highest-ranked
country and the 25th percentile country. In each sector, we assume the median TFP level of sample countries
over 2000–07.
Sector Manufacturing Services ICT All
Product Market Regulations - 0.1 - 0.1
Labor Skill - 1.4 1.2 0.4
ICT Capital 0.7 0.7 - 0.3
R&D Expenditure - - 1.9 0.2
<0.5 <1 >=1
THE NEW NORMAL
26 INTERNATIONAL MONETARY FUND
B. Dynamic Effects of Reforms on Productivity
40. Reform payoffs evolve over time. The preceding section considered how institutional
rigidities and investments in knowledge capital and innovation are associated with productivity
performance. As reforms could result in adjustment costs that potentially vary across sectors, it is
useful to assess their dynamic (short- and medium-term) impact. Moreover, the overall productivity
gains are likely to depend on the magnitude of reforms undertaken. As a result, this section focuses
on large changes in structural indicators and examines their impact on productivity, employment,
and output over various time horizons (see Technical Appendix for details).21
We also investigate
how the productivity impact depends on the distance from the technological frontier, initial settings,
and prevailing economic conditions.
41. Identifying reform “shocks.” For the purposes of better identifying cause and effect, it is
useful to look at “shocks” to various structural indicators. Large reforms episodes are identified as a
significant improvement (in absolute terms) of a structural indicator above a certain threshold (Bouis
and others 2012).22
Reforms are identified using the same set of variables described in the previous
section with two additions. First, we include a measure of infrastructure, as improvements can have a
positive impact on productivity over a longer horizon that goes beyond the effect of increases in the
industry-specific capital stock. This is a result of economies of scale, the existence of network
externalities, and competition-enhancing mechanisms. Second, we include a measure of labor tax
wedges as an additional measure of labor market rigidities, as these can create disincentives to work
in some segments of the labor market and affect the direction and pace of technological change.23
42. Shock episodes. Figure 13 presents the number of identified reforms per country. Large
infrastructure shocks that took place mainly in the 1970s have since waned, reflecting in part the
declining stock of public capital as a share of output in advanced economies (IMF 2014). Product
market reforms saw a spurt in the 1990s and continued at a similar pace in the 2000s (Duval 2008).
However, labor market reforms, as measured by a reduction in job protection or a reduction in the
labor tax wedge, have been less frequent. The frequency of positive ICT “shocks” increased since the
1970s but slowed on the eve of the crisis, as did human capital and R&D shocks.
21
In particular, a dynamic version of the empirical specification outlined in the previous section is used to assess the
effects of reforms on TFP levels over time.
22 Specifically, a shock is identified if the change in R&D, ICT capital, and high-skilled labor is above two standard
deviations of the average annual change in the indicator. Because product and labor market regulations and
infrastructure do not vary as much over time, a major reform is assumed to have been undertaken when the change
in the policy indicators in a given year is below (above for infrastructure) one standard deviation.
23 The infrastructure measure is the principal component of roads, phones lines, and electricity generation capacity.
For more details see IMF (2014b). The labor tax wedge is taken from the OECD Taxing Wages database, measured as
a percentage of taxes and transfers paid in the share of total labor costs.
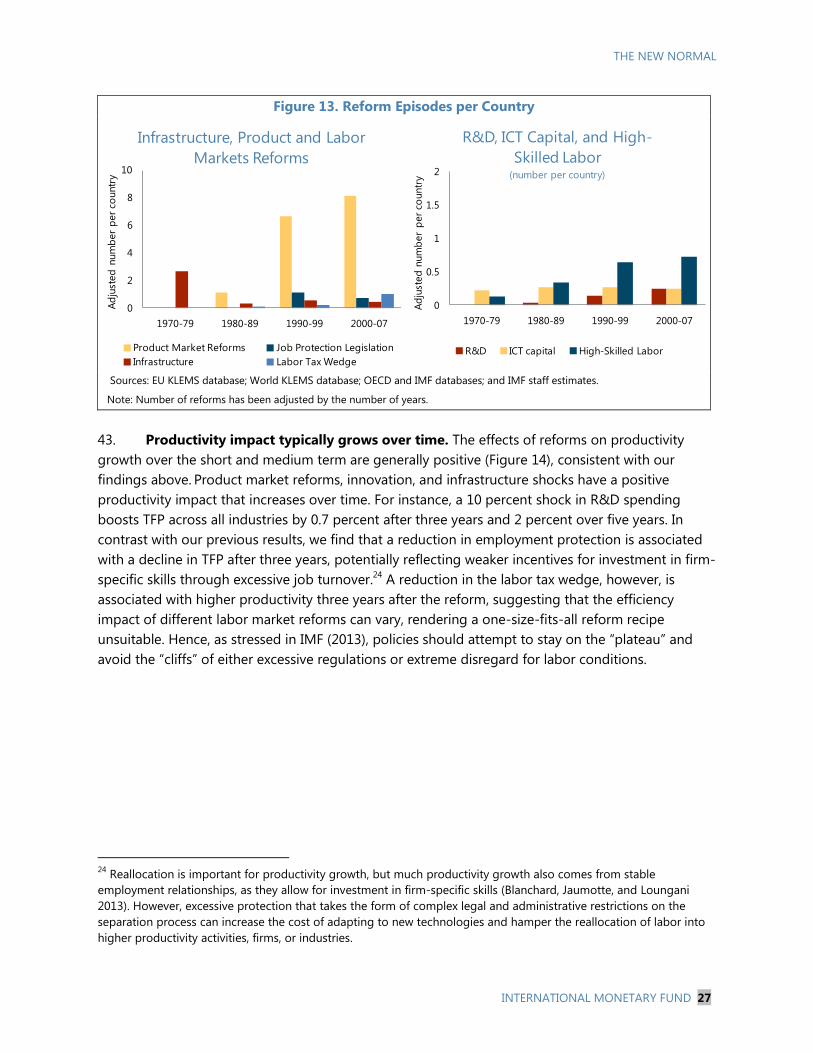
THE NEW NORMAL
INTERNATIONAL MONETARY FUND 27
Figure 13. Reform Episodes per Country
Sources: EU KLEMS database; World KLEMS database; OECD and IMF databases; and IMF staff estimates.
Note: Number of reforms has been adjusted by the number of years.
43. Productivity impact typically grows over time. The effects of reforms on productivity
growth over the short and medium term are generally positive (Figure 14), consistent with our
findings above. Product market reforms, innovation, and infrastructure shocks have a positive
productivity impact that increases over time. For instance, a 10 percent shock in R&D spending
boosts TFP across all industries by 0.7 percent after three years and 2 percent over five years. In
contrast with our previous results, we find that a reduction in employment protection is associated
with a decline in TFP after three years, potentially reflecting weaker incentives for investment in firm-
specific skills through excessive job turnover.24
A reduction in the labor tax wedge, however, is
associated with higher productivity three years after the reform, suggesting that the efficiency
impact of different labor market reforms can vary, rendering a one-size-fits-all reform recipe
unsuitable. Hence, as stressed in IMF (2013), policies should attempt to stay on the “plateau” and
avoid the “cliffs” of either excessive regulations or extreme disregard for labor conditions.
24
Reallocation is important for productivity growth, but much productivity growth also comes from stable
employment relationships, as they allow for investment in firm-specific skills (Blanchard, Jaumotte, and Loungani
2013). However, excessive protection that takes the form of complex legal and administrative restrictions on the
separation process can increase the cost of adapting to new technologies and hamper the reallocation of labor into
higher productivity activities, firms, or industries.
0
2
4
6
8
10
1970-79 1980-89 1990-99 2000-07
Ad
just
ed
num
ber
per
countr
y
Infrastructure, Product and Labor
Markets Reforms
Product Market Reforms Job Protection Legislation
Infrastructure Labor Tax Wedge
0
0.5
1
1.5
2
1970-79 1980-89 1990-99 2000-07
Ad
just
ed
num
ber
per
countr
y
R&D, ICT Capital, and High-
Skilled Labor(number per country)
R&D ICT capital High-Skilled Labor
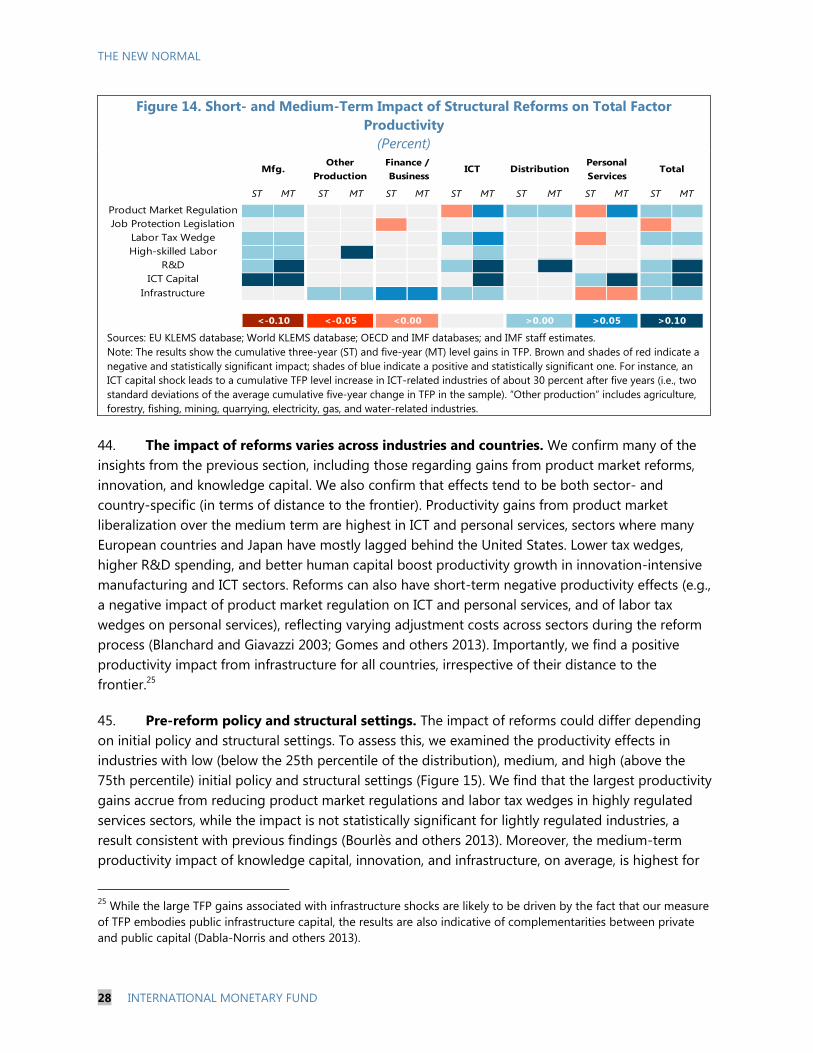
THE NEW NORMAL
28 INTERNATIONAL MONETARY FUND
Figure 14. Short- and Medium-Term Impact of Structural Reforms on Total Factor
Productivity
(Percent)
Sources: EU KLEMS database; World KLEMS database; OECD and IMF databases; and IMF staff estimates.
Note: The results show the cumulative three-year (ST) and five-year (MT) level gains in TFP. Brown and shades of red indicate a
negative and statistically significant impact; shades of blue indicate a positive and statistically significant one. For instance, an
ICT capital shock leads to a cumulative TFP level increase in ICT-related industries of about 30 percent after five years (i.e., two
standard deviations of the average cumulative five-year change in TFP in the sample). “Other production” includes agriculture,
forestry, fishing, mining, quarrying, electricity, gas, and water-related industries.
44. The impact of reforms varies across industries and countries. We confirm many of the
insights from the previous section, including those regarding gains from product market reforms,
innovation, and knowledge capital. We also confirm that effects tend to be both sector- and
country-specific (in terms of distance to the frontier). Productivity gains from product market
liberalization over the medium term are highest in ICT and personal services, sectors where many
European countries and Japan have mostly lagged behind the United States. Lower tax wedges,
higher R&D spending, and better human capital boost productivity growth in innovation-intensive
manufacturing and ICT sectors. Reforms can also have short-term negative productivity effects (e.g.,
a negative impact of product market regulation on ICT and personal services, and of labor tax
wedges on personal services), reflecting varying adjustment costs across sectors during the reform
process (Blanchard and Giavazzi 2003; Gomes and others 2013). Importantly, we find a positive
productivity impact from infrastructure for all countries, irrespective of their distance to the
frontier.25
45. Pre-reform policy and structural settings. The impact of reforms could differ depending
on initial policy and structural settings. To assess this, we examined the productivity effects in
industries with low (below the 25th percentile of the distribution), medium, and high (above the
75th percentile) initial policy and structural settings (Figure 15). We find that the largest productivity
gains accrue from reducing product market regulations and labor tax wedges in highly regulated
services sectors, while the impact is not statistically significant for lightly regulated industries, a
result consistent with previous findings (Bourlès and others 2013). Moreover, the medium-term
productivity impact of knowledge capital, innovation, and infrastructure, on average, is highest for
25
While the large TFP gains associated with infrastructure shocks are likely to be driven by the fact that our measure
of TFP embodies public infrastructure capital, the results are also indicative of complementarities between private
and public capital (Dabla-Norris and others 2013).
ST MT ST MT ST MT ST MT ST MT ST MT ST MT
>0.10
High-skilled Labor
R&D
ICT Capital
Infrastructure
<-0.10 <-0.05 <0.00 >0.00 >0.05
Personal
ServicesTotal
Product Market Regulation
Job Protection Legislation
Labor Tax Wedge
Mfg.Other
Production
Finance /
BusinessICT Distribution
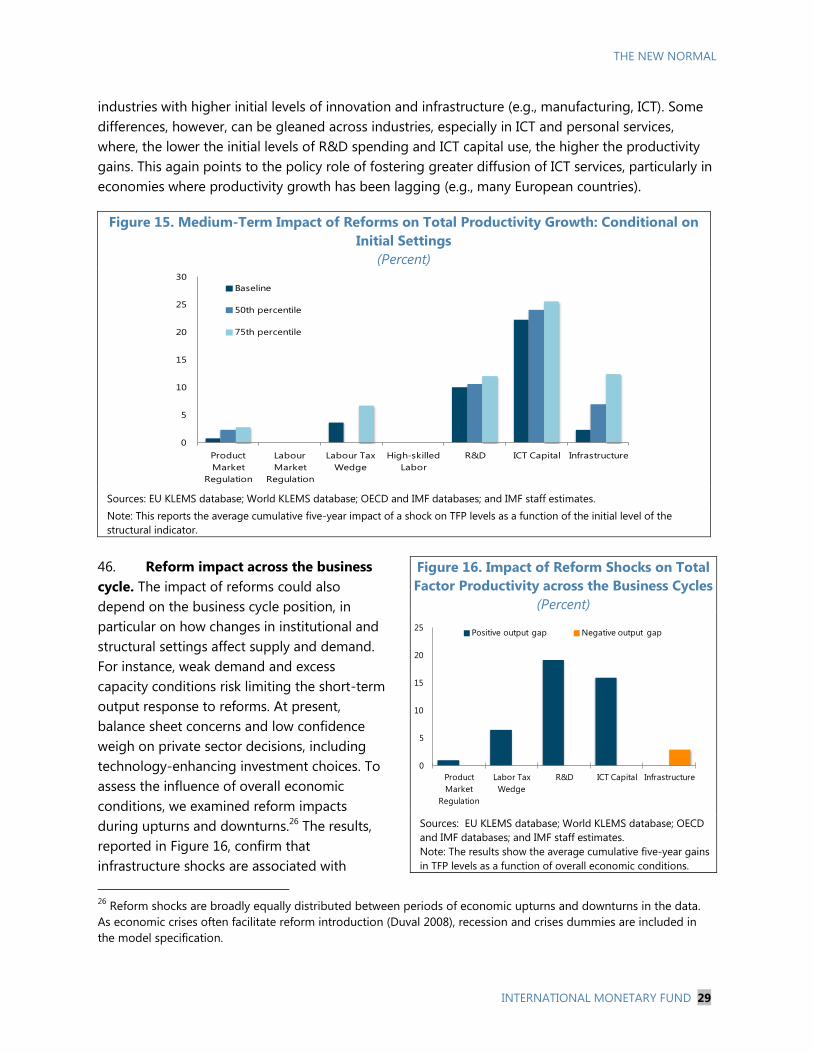
THE NEW NORMAL
INTERNATIONAL MONETARY FUND 29
industries with higher initial levels of innovation and infrastructure (e.g., manufacturing, ICT). Some
differences, however, can be gleaned across industries, especially in ICT and personal services,
where, the lower the initial levels of R&D spending and ICT capital use, the higher the productivity
gains. This again points to the policy role of fostering greater diffusion of ICT services, particularly in
economies where productivity growth has been lagging (e.g., many European countries).
Figure 15. Medium-Term Impact of Reforms on Total Productivity Growth: Conditional on
Initial Settings
(Percent)
Sources: EU KLEMS database; World KLEMS database; OECD and IMF databases; and IMF staff estimates.
Note: This reports the average cumulative five-year impact of a shock on TFP levels as a function of the initial level of the
structural indicator.
46. Reform impact across the business
cycle. The impact of reforms could also
depend on the business cycle position, in
particular on how changes in institutional and
structural settings affect supply and demand.
For instance, weak demand and excess
capacity conditions risk limiting the short-term
output response to reforms. At present,
balance sheet concerns and low confidence
weigh on private sector decisions, including
technology-enhancing investment choices. To
assess the influence of overall economic
conditions, we examined reform impacts
during upturns and downturns.26
The results,
reported in Figure 16, confirm that
infrastructure shocks are associated with
26
Reform shocks are broadly equally distributed between periods of economic upturns and downturns in the data.
As economic crises often facilitate reform introduction (Duval 2008), recession and crises dummies are included in
the model specification.
0
5
10
15
20
25
30
Product
Market
Regulation
Labour
Market
Regulation
Labour Tax
Wedge
High-skilled
Labor
R&D ICT Capital Infrastructure
Baseline
50th percentile
75th percentile
Figure 16. Impact of Reform Shocks on Total
Factor Productivity across the Business Cycles
(Percent)
Sources: EU KLEMS database; World KLEMS database; OECD
and IMF databases; and IMF staff estimates.
Note: The results show the average cumulative five-year gains
in TFP levels as a function of overall economic conditions.
0
5
10
15
20
25
Product
Market
Regulation
Labor Tax
Wedge
R&D ICT Capital Infrastructure
Positive output gap Negative output gap
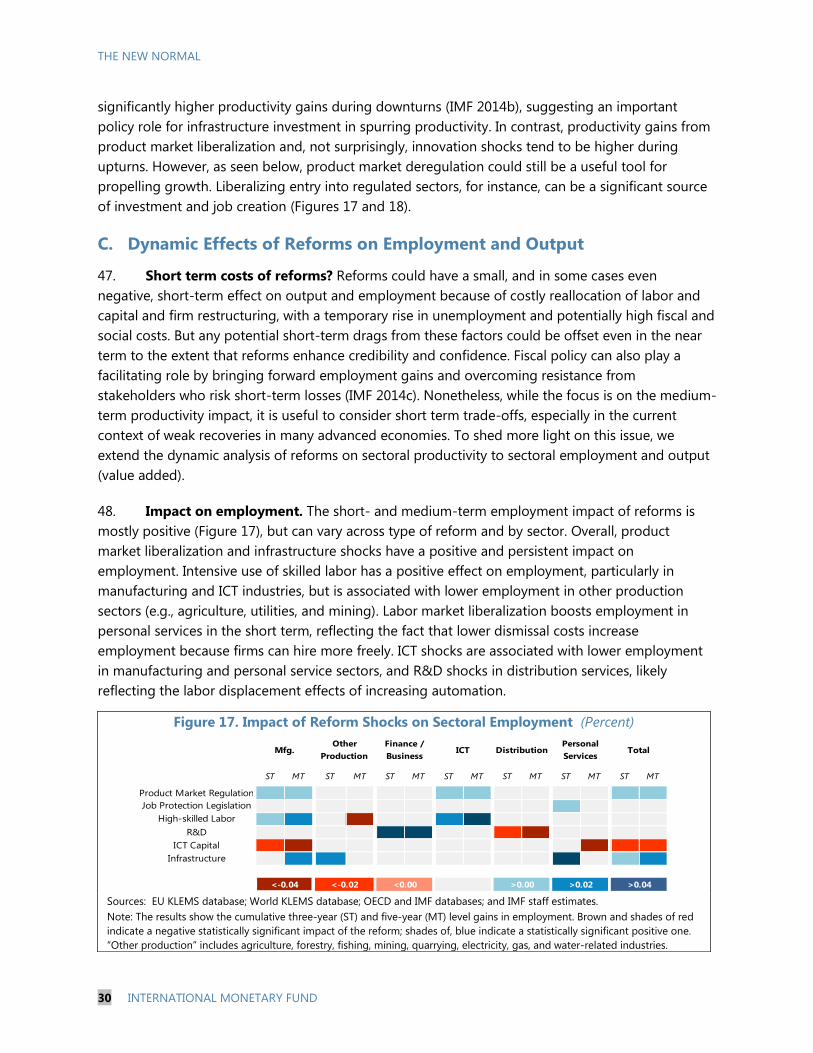
THE NEW NORMAL
30 INTERNATIONAL MONETARY FUND
significantly higher productivity gains during downturns (IMF 2014b), suggesting an important
policy role for infrastructure investment in spurring productivity. In contrast, productivity gains from
product market liberalization and, not surprisingly, innovation shocks tend to be higher during
upturns. However, as seen below, product market deregulation could still be a useful tool for
propelling growth. Liberalizing entry into regulated sectors, for instance, can be a significant source
of investment and job creation (Figures 17 and 18).
C. Dynamic Effects of Reforms on Employment and Output
47. Short term costs of reforms? Reforms could have a small, and in some cases even
negative, short-term effect on output and employment because of costly reallocation of labor and
capital and firm restructuring, with a temporary rise in unemployment and potentially high fiscal and
social costs. But any potential short-term drags from these factors could be offset even in the near
term to the extent that reforms enhance credibility and confidence. Fiscal policy can also play a
facilitating role by bringing forward employment gains and overcoming resistance from
stakeholders who risk short-term losses (IMF 2014c). Nonetheless, while the focus is on the medium-
term productivity impact, it is useful to consider short term trade-offs, especially in the current
context of weak recoveries in many advanced economies. To shed more light on this issue, we
extend the dynamic analysis of reforms on sectoral productivity to sectoral employment and output
(value added).
48. Impact on employment. The short- and medium-term employment impact of reforms is
mostly positive (Figure 17), but can vary across type of reform and by sector. Overall, product
market liberalization and infrastructure shocks have a positive and persistent impact on
employment. Intensive use of skilled labor has a positive effect on employment, particularly in
manufacturing and ICT industries, but is associated with lower employment in other production
sectors (e.g., agriculture, utilities, and mining). Labor market liberalization boosts employment in
personal services in the short term, reflecting the fact that lower dismissal costs increase
employment because firms can hire more freely. ICT shocks are associated with lower employment
in manufacturing and personal service sectors, and R&D shocks in distribution services, likely
reflecting the labor displacement effects of increasing automation.
Figure 17. Impact of Reform Shocks on Sectoral Employment (Percent)
Sources: EU KLEMS database; World KLEMS database; OECD and IMF databases; and IMF staff estimates. Note: The results show the cumulative three-year (ST) and five-year (MT) level gains in employment. Brown and shades of red
indicate a negative statistically significant impact of the reform; shades of, blue indicate a statistically significant positive one.
“Other production” includes agriculture, forestry, fishing, mining, quarrying, electricity, gas, and water-related industries.
ST MT ST MT ST MT ST MT ST MT ST MT ST MT
Mfg.Other
Production
Finance /
BusinessICT Distribution
Infrastructure
Personal
ServicesTotal
Product Market Regulation
Job Protection Legislation
<-0.04 <-0.02 <0.00 >0.00 >0.02 >0.04
High-skilled Labor
R&D
ICT Capital
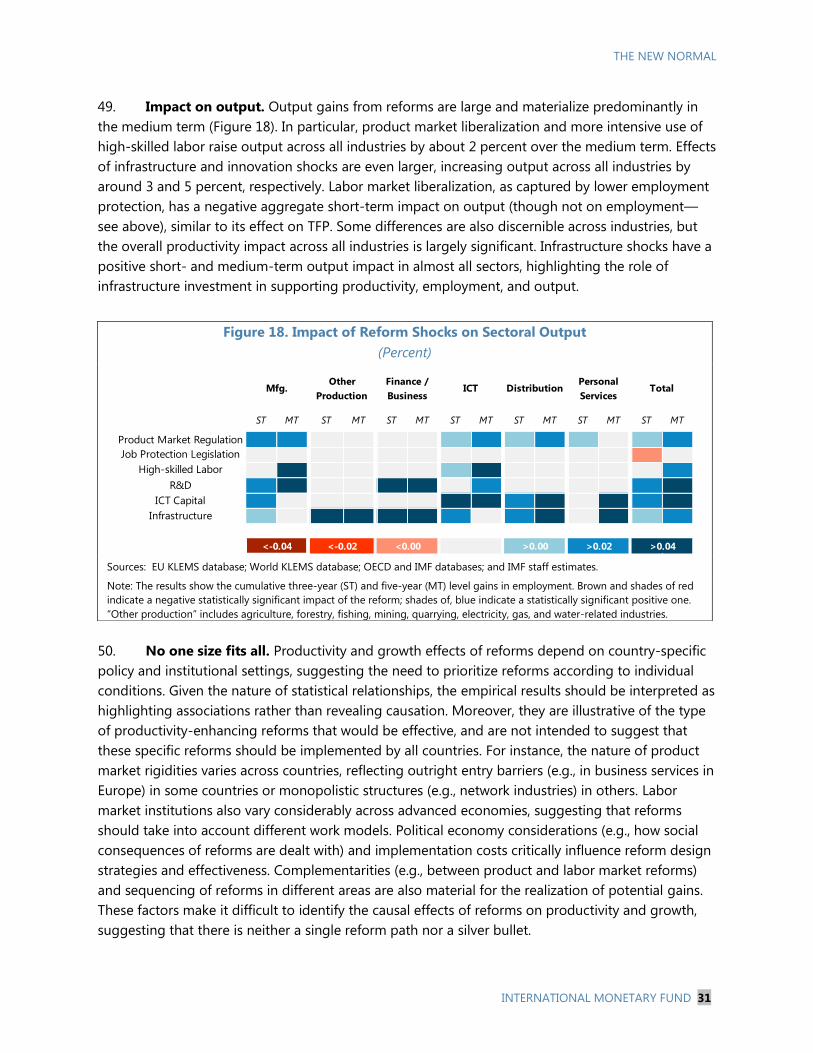
THE NEW NORMAL
INTERNATIONAL MONETARY FUND 31
49. Impact on output. Output gains from reforms are large and materialize predominantly in
the medium term (Figure 18). In particular, product market liberalization and more intensive use of
high-skilled labor raise output across all industries by about 2 percent over the medium term. Effects
of infrastructure and innovation shocks are even larger, increasing output across all industries by
around 3 and 5 percent, respectively. Labor market liberalization, as captured by lower employment
protection, has a negative aggregate short-term impact on output (though not on employment—
see above), similar to its effect on TFP. Some differences are also discernible across industries, but
the overall productivity impact across all industries is largely significant. Infrastructure shocks have a
positive short- and medium-term output impact in almost all sectors, highlighting the role of
infrastructure investment in supporting productivity, employment, and output.
50. No one size fits all. Productivity and growth effects of reforms depend on country-specific
policy and institutional settings, suggesting the need to prioritize reforms according to individual
conditions. Given the nature of statistical relationships, the empirical results should be interpreted as
highlighting associations rather than revealing causation. Moreover, they are illustrative of the type
of productivity-enhancing reforms that would be effective, and are not intended to suggest that
these specific reforms should be implemented by all countries. For instance, the nature of product
market rigidities varies across countries, reflecting outright entry barriers (e.g., in business services in
Europe) in some countries or monopolistic structures (e.g., network industries) in others. Labor
market institutions also vary considerably across advanced economies, suggesting that reforms
should take into account different work models. Political economy considerations (e.g., how social
consequences of reforms are dealt with) and implementation costs critically influence reform design
strategies and effectiveness. Complementarities (e.g., between product and labor market reforms)
and sequencing of reforms in different areas are also material for the realization of potential gains.
These factors make it difficult to identify the causal effects of reforms on productivity and growth,
suggesting that there is neither a single reform path nor a silver bullet.
Figure 18. Impact of Reform Shocks on Sectoral Output
(Percent)
Sources: EU KLEMS database; World KLEMS database; OECD and IMF databases; and IMF staff estimates.
Note: The results show the cumulative three-year (ST) and five-year (MT) level gains in employment. Brown and shades of red
indicate a negative statistically significant impact of the reform; shades of, blue indicate a statistically significant positive one.
“Other production” includes agriculture, forestry, fishing, mining, quarrying, electricity, gas, and water-related industries.
ST MT ST MT ST MT ST MT ST MT ST MT ST MT
Mfg.Other
Production
Finance /
BusinessICT Distribution
Infrastructure
Personal
ServicesTotal
Product Market Regulation
Job Protection Legislation
<-0.04 <-0.02 <0.00 >0.00 >0.02 >0.04
High-skilled Labor
R&D
ICT Capital
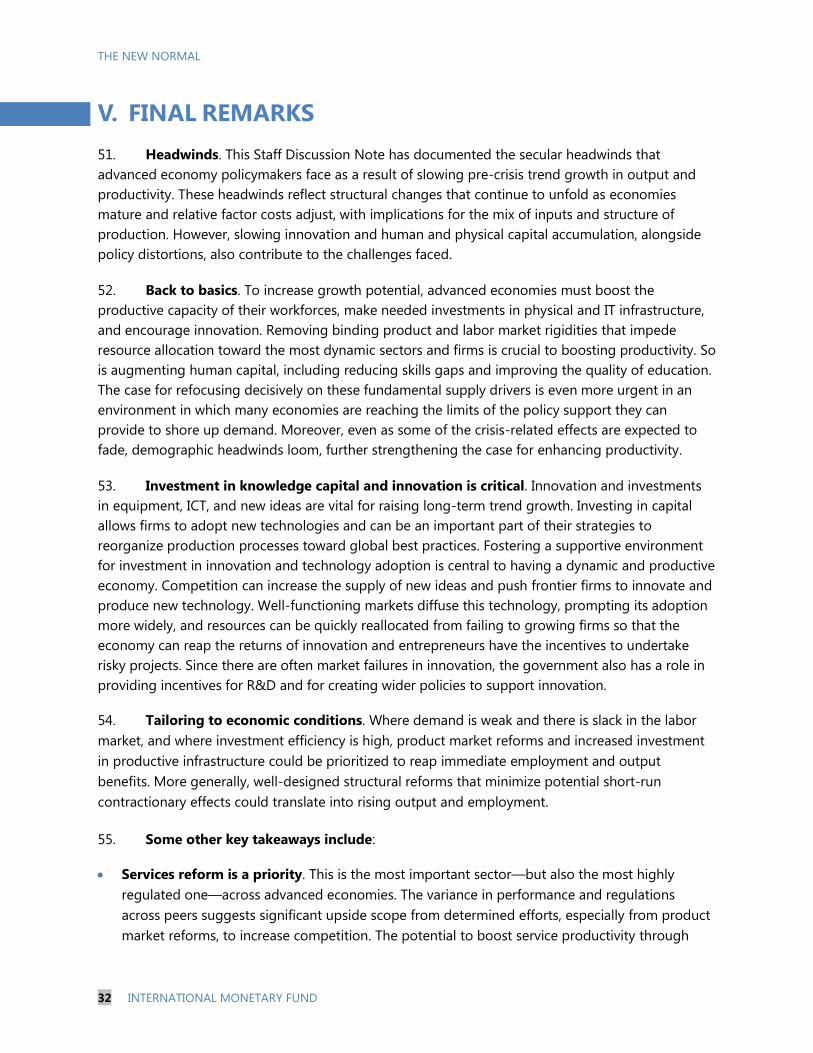
THE NEW NORMAL
32 INTERNATIONAL MONETARY FUND
V. FINAL REMARKS
51. Headwinds. This Staff Discussion Note has documented the secular headwinds that
advanced economy policymakers face as a result of slowing pre-crisis trend growth in output and
productivity. These headwinds reflect structural changes that continue to unfold as economies
mature and relative factor costs adjust, with implications for the mix of inputs and structure of
production. However, slowing innovation and human and physical capital accumulation, alongside
policy distortions, also contribute to the challenges faced.
52. Back to basics. To increase growth potential, advanced economies must boost the
productive capacity of their workforces, make needed investments in physical and IT infrastructure,
and encourage innovation. Removing binding product and labor market rigidities that impede
resource allocation toward the most dynamic sectors and firms is crucial to boosting productivity. So
is augmenting human capital, including reducing skills gaps and improving the quality of education.
The case for refocusing decisively on these fundamental supply drivers is even more urgent in an
environment in which many economies are reaching the limits of the policy support they can
provide to shore up demand. Moreover, even as some of the crisis-related effects are expected to
fade, demographic headwinds loom, further strengthening the case for enhancing productivity.
53. Investment in knowledge capital and innovation is critical. Innovation and investments
in equipment, ICT, and new ideas are vital for raising long-term trend growth. Investing in capital
allows firms to adopt new technologies and can be an important part of their strategies to
reorganize production processes toward global best practices. Fostering a supportive environment
for investment in innovation and technology adoption is central to having a dynamic and productive
economy. Competition can increase the supply of new ideas and push frontier firms to innovate and
produce new technology. Well-functioning markets diffuse this technology, prompting its adoption
more widely, and resources can be quickly reallocated from failing to growing firms so that the
economy can reap the returns of innovation and entrepreneurs have the incentives to undertake
risky projects. Since there are often market failures in innovation, the government also has a role in
providing incentives for R&D and for creating wider policies to support innovation.
54. Tailoring to economic conditions. Where demand is weak and there is slack in the labor
market, and where investment efficiency is high, product market reforms and increased investment
in productive infrastructure could be prioritized to reap immediate employment and output
benefits. More generally, well-designed structural reforms that minimize potential short-run
contractionary effects could translate into rising output and employment.
55. Some other key takeaways include:
Services reform is a priority. This is the most important sector––but also the most highly
regulated one––across advanced economies. The variance in performance and regulations
across peers suggests significant upside scope from determined efforts, especially from product
market reforms, to increase competition. The potential to boost service productivity through
THE NEW NORMAL
INTERNATIONAL MONETARY FUND 33
investment in information technology in lagging regions is also sizable. Labor market policies
should attempt to avoid either excessive regulations or extreme disregard for labor conditions.
Spillovers can be large. Efforts to enhance performance by technology leaders (e.g., Germany
in manufacturing, the United States in ICT services) are global goods that spill over to support
productivity gains in other countries. There is a lot of low hanging fruit in this area. Increasing
returns to scale are evident in knowledge capital and create many opportunities for countries to
boost their own and global prospects. This will support countries that are further from the
frontier, but these are just the countries that need to work doubly hard to remove impediments
to productivity growth.
Infrastructure investment has clear benefits. Investments in transport, energy, and
telecommunications are essential to improving productivity, boosting employment, and
increasing output. Because they tend to be large-scale and long-term, these investments require
high levels of coordination to maximize the wider benefits to society as a whole. In many cases,
governments will need to play a vital role in planning, delivering, and financing these projects.
At present, debt-financed projects could have large productivity and output effects, particularly
if clearly identified infrastructure needs are met through efficient investment (IMF 2014b).
Improving resource allocation across sectors. Reducing policy distortions that affect resource
allocation across broad economic sectors could yield significant productivity payoffs. In this
regard, rationalizing large agricultural subsidies and increasing competition in personal services
could be important, as they create a misallocation of productive resources to relatively low-value
activities.
Calibrating reforms. The productivity and growth effects of reforms depend on a variety of
country-specific policy and institutional settings. While some policies are applicable across all
advanced economies, granularity is necessary, as there is no one-size-fits-all strategy. The
divergence in productivity performance and the underlying drivers across sectors suggest that
reform priorities need to be appropriately calibrated.
THE NEW NORMAL
34 INTERNATIONAL MONETARY FUND
Annex 1. Stochastic Frontier Analysis
We use stochastic frontier analysis (SFA) to illustrate the patterns of total factor productivity (TFP)
growth across countries at the sector level. The basic idea of SFA in our context is that there is a
world frontier technology for each given industry or sector, which represents the most productive
technology within that industry or sector. The TFP of industry (or sector) in country depends on
the world frontier TFP level and how efficient the country can make use of the frontier technology.
We choose a model specification close to Pitt and Lee (1981), that is,
(1)
(2)
is the TFP level of industry or sector in country at time . represents the world
frontier productivity level, which is determined by a constant and a trend component . is
an i.i.d white noise. The term represents the inefficiency level, which is the distance of country to
the world frontier technology. See Belotti and others (2012) for alternative model specifications.
Most specifications differ either in the main equation (1) or the distribution of the inefficiency term.
The TFP level estimates used for the calculation were obtained by linking the TFP growth estimates
from the EU KLEMS database with the Groningen Growth and Development Centre) Productivity-
Level database, which provides the PPP-adjusted industry TFP levels in 1997 for our sample
countries (Inklaar and Timmer 2008). We constructed productivity levels series for 23 sectors
spanning the period from 1970–2007.
We use the maximum likelihood method to estimate the model specified by (1) and (2) on 10-year
rolling window sectoral TFP data. For each sector i, we report the trend of frontier TFP growth ( )
and the average TFP level in percentage of world frontier (cross-sectional mean of
THE NEW NORMAL
INTERNATIONAL MONETARY FUND 35
References
Acemoglu, D., P. Aghion, and F. Zilibotti. 2006. “Distance to Frontier, Selection, and Economic
Growth.” Journal of the European Economic Association 4 (1): 37–74.
Aghion, P., and P. Howitt. 2006. “Joseph Schumpeter Lecture—Appropriate Growth Policy: A
Unifying Framework.” Journal of the European Economic Association 4 (2–3): 269–314.
———. 2009. The Economics of Growth. Cambridge, Massachusetts: MIT Press.
Aoki, Shuhei. 2012. “A Simple Accounting Framework for the Effect of Resource Misallocation on
Aggregate Productivity.” Journal of the Japanese and International Economies 26 (4): 473–94.
Arnold, J., G. Nicoletti, and S. Scarpetta. 2008. “Regulation, Allocative Efficiency and Productivity in
OECD Countries: Industry and Firm-level Evidence.” OECD Economics Department Working
Paper No. 616, Organization for Economic Cooperation and Development, Paris.
Baily, M. N., C. Hulten, and D. Campbell. 1992. “Productivity Dynamics in Manufacturing Plants.”
Brookings Papers on Economic Activity. Washington, Brookings Institution.
Barkbu, B., J. Rahman, R. Valdés, and others. 2012. “Fostering Growth in Europe Now.” IMF Staff
Discussion Note SDN/12/07, International Monetary Fund, Washington.
Barnett, A., A. Chiu, J. Franklin, and M. Sebastia-Barriel. 2014. “The Productivity Puzzle: A Firm-Level
Investigation into Employment Behavior and Resource Allocation over the Crisis.” Bank of
England Working Paper 495.
Bartelsman, E., J. Haltiwanger, and S. Scarpetta. 2013. “Cross-Country Differences in Productivity: The
Role of Allocation and Selection.” American Economic Review 103 (1): 305–34.
Bassanini, A., L. Nunziata, and D. Venn. 2009. “Job Protection Legislation and Productivity Growth in
OECD Countries.” Economic Policy 24: 349–402.
Baumol, W.J., S A.B. Blackman, and E.N. Wolff. 1985. “Unbalanced Growth Revisited: Asymptotic
Stagnancy and New Evidence.” American Economic Review 75: 806–17.
Belotti, F., S. Daidone, G. Ilardi, and V. Atella. 2012. “Stochastic Frontier Analysis Using
Stata.” The Stata Journal 13 (4): 719–58.Blanchard, O, 2004. “The Economic Future of
Europe.” Journal of Economic Perspectives 18 (4): 3–26.
Blanchard, O., and F. Giavazzi. 2003. “Macroeconomic Effects of Regulation and Deregulation in
Goods and Labor Markets.” The Quarterly Journal of Economics 118 (3): 879–907.
Blanchard, O., F. Jaumotte, and P. Loungani. 2013. “Labor Market Policies and IMF Advice in
Advanced Economies during the Great Recession.” Staff Discussion Note 13/02, International
Monetary Fund, Washington.
THE NEW NORMAL
36 INTERNATIONAL MONETARY FUND
Boius, R., O. Causa, L. Demmou, R. Duval, and A. Zdzienicka. 2012. “The Short-Term Effects of
Structural Reforms: An Empirical Analysis.” OECD Economics Department Working Paper
949, Organization for Economic Cooperation and Development, Paris.
Bourlès, R., G. Cette, J. Lopez. J. Mairesse, and G. Nicoletti. 2013. “Do Product Market Regulations in
Upstream Sectors Curb Productivity Growth? Panel Data Evidence for OECD Countries.” The
Review of Economics and Statistics 95 (5): 1750–768.
Collecia, A., and P. Shreyer. 2002. “ICT Investment and Economic Growth in the 1990s: Is the United
States a Unique Case? A Comparative Study of Nine OECD Countries.” Review of Economic
Dynamics 5: 408–42.
Dabla-Norris, E., and others. 2013. “Anchoring Growth: The Importance of Productivity-Enhancing
Reforms in Emerging Market and Developing Economies.” Staff Discussion Note 13/08,
International Monetary Fund, Washington.
Dias, D., C. Robalo Marques, and C. Richmond. 2014. “Misallocation and Productivity in the Lead Up
to the Eurozone Crisis.” Banco de Portugal Working Paper.
Duarte, M., and D. Restuccia. 2010. “The Role of the Structural Transformation in Aggregate
Productivity.” Quarterly Journal of Economics 125 (1): 129–73.
Duval, R. 2008. “Is There a Role for Macroeconomic Policy in Fostering Structural Reforms? Panel
Evidence from OECD Countries over the Past Two Decades.” European Journal of Political
Economy 24 (2): 491–502.
Fernald, J. 2014. “Productivity and Potential Output Before, During, and After the Great
Recession.” NBER Macroeconomics Annual 2014, Vol. 29. Chicago: University of Chicago
Press.
———, and C. I. Jones. 2014. “The Future of US Economic Growth.” American Economic Review 104
(5): 44–49.
Foster, L., J. Haltiwanger, and C. Syverson. 2008. “Reallocation, Firm Turnover, and Efficiency:
Selection on Productivity or Profitability.” American Economic Review 98 (1): 394–425.
Garicano, L., C. Lelarge, and J. Van Reenen. 2013. “Firm Size Distortions and the Productivity
Distribution: Evidence from France.” NBER Working Paper 18841, National Bureau of
Economic Research, Cambridge, Massachusetts.
Gilchrist, S., J. W. Sim, and E. Zakrajsek. 2013. “Misallocation and Financial Market Frictions: Some
Direct Evidence from the Dispersion in Borrowing Costs.” Review of Economic Dynamics 16
(1): 159–76.
Gomes, S., P. Jacquinot, M. Mohr, and M. Pisani. 2013. “Structural Reforms and Macroeconomic
Performance in the Euro Area Countries: A Model-Based Assessment.” International Finance
16: 23–44.
THE NEW NORMAL
INTERNATIONAL MONETARY FUND 37
Gordon, R. J. 2012. “Is US Economic Growth Over? Faltering Innovation Confronts the Six
Headwinds.” NBER Working Paper 18315, National Bureau of Economic Research,
Cambridge, Massachusetts.
Henrekson, M. 2014. “How Labor Market Institutions Affects Job Creation and Productivity Growth.”
IZA World of Labor 38.
Herrendorf, B., R. Rogerson, and A. Valentinyi. 2013. “Growth and Structural Transformation.” NBER
Working Paper 18996, National Bureau of Economic Research, Cambridge, Massachusetts.
Hopenhayn, H. 2014. “On the Measure of Distortions.” NBER Working Paper 20404, National Bureau
of Economic Research, Cambridge, Massachusetts.
———, and R. Rogerson. 1993. “Job Turnover and Policy Evaluation: A General Equilibrium Analysis.”
Journal of Political Economy 101(5): 915–38.
Hsieh, C.-T., and P. Klenow. 2009. “Misallocation and Manufacturing TFP in India and China.”
Quarterly Journal of Economics 124 (4): 1403–448.
Inklaar, R., and M. Timmer. 2008. “GGDC Productivity Level Database: International Comparisons of
Output, Inputs and Productivity at the Industry Level.” Paper No. GD-104, Groningen Growth
and Development Centre, University of Groningen.
International Monetary Fund (IMF). 2013. “Jobs and Growth: Analytical and Operational
Considerations for the Fund.” International Monetary Fund, Washington, 14 March.
http://www.imf.org/external/np/pp/eng/2013/031413.pdf
———. 2014a. The Managing Director’s Global Policy Agenda to the International and Finance
Committee. International Monetary Fund, Washington.
http://www.imf.org/external/np/pp/eng/2014/041214.pdf
———. 2014b. World Economic Outlook. Washington, October.
———. 2014c. Fiscal Monitor Washington, October.
———. Forthcoming. “World Economic Outlook. Washington, April 2015.
Jorgenson, D., and M.P. Timmer. 2011. “Structural Change in Advanced Nations: A New Set of
Stylised Facts.” The Scandinavian Journal of Economics 113 (1): 1–29.
Jorgenson, D., M. Ho, and K. J. Stiroh. 2008. “A Retrospective Look at the U.S. Productivity Growth
Resurgence.” Journal of Economic Perspectives 22 (1): 3–24.
Lagos, R. 2006. “A Model of TFP.” Review of Economic Studies 73: 983–1007.
Lewis, W. 2005. The Power of Productivity: Wealth, Poverty, and the Threat to Global Stability.
Chicago: University of Chicago Press.
THE NEW NORMAL
38 INTERNATIONAL MONETARY FUND
Mc Morrow, K., R. Werner, and A. Turrini. 2010. “Determinants of TFP Growth: A Close Look at
Industries Driving the EU-US TFP Gap.” Structural Change and Economic Dynamics 21 (3):
165–80.
Ngai, L.R., and R.M. Samaniego. 2011. “Accounting for Research and Productivity Growth across
Industries.” Review of Economic Dynamics 14 (3): 475–95.
Nickell S., L. Nunziata, and W. Ochel. 2005. “Unemployment in the OECD since the 1960s: What Do
We Know?” Economic Journal 115: 1–27.
Nicoletti, G., and S. Scarpetta. 2003. “Regulation, Productivity and Growth: OECD Evidence.”
Economic Policy 18 (36): 9–72.
O'Mahony, M., and M.P. Timmer. 2009. “Output, Input and Productivity Measures at the Industry
Level: The EU Klems Database.” The Economic Journal 119 (538): F374–F403.
Organization for Economic Cooperation and Development (OECD). 2001. The New Economy: Beyond
the Hype. Paris: Organization for Economic Cooperation and Development.
———. 2007. OECD Employment Outlook. Paris: Organization for Economic Cooperation and
Development.
———. 2014. Economic Policy Reforms 2014: Going for Growth. Paris: Organization for Economic
Cooperation and Development.Restuccia, D., and R. Rogerson. 2008. “Policy Distortions and
Aggregate Productivity with Heterogeneous Establishments.” Review of Economic Dynamics
11 (4): 707–20.
———. 2013. “Misallocation and Productivity.” Review of Economic Dynamics 16 (1): 1–10.
Syverson, C. 2011. “What Determines Productivity?” Journal of Economic Literature 49 (2): 326–65.
Uppenberg, K., and H. Strauss. 2010. “Innovation and Productivity Growth in the EU Services Sector.”
European Investment Bank.
van Ark, B., M. O'Mahony, and M. P. Timmer. 2008. “The Productivity Gap Between Europe and The
United States: Trends and Causes.” The Journal of Economic Perspectives 22 (1): 25–44.
Zheng, S., and H. Bloch. 2014. “Australia’s Mining Productivity Decline: Implications for MFP
Measurement.” Journal of Productivity Analysis 41 (2): 201–12.