Embed Size (px)
Citation preview
The next round of relocation
Glenn Banks
This chapter differs from the previous ones in that it is focused on a particular area, rather than an issue such as economic change. It establishes a social and economic baseline for the Kewai people on the north bank of the Kaiya River (see Map 1.1) within a Lease for Mining Purposes (LMP) which the Porgera Joint Venture (PJV) was seeking to acquire in 1993. These people were due to be affected by the spoil from the PJV's planned Anjolek Creek waste dump, and the company was therefore embarking on a compensation and relocation programme in accordance with an agreement negotiated with representatives of the affected community. The original intention of this study was to facilitate the monitoring of those social and economic changes which would occur in the community as a result of the company's proposed relocation programme.
Until the end of 1993, the Kewai people had been largely unaffected in the physical and material sense by the development of the Porgera mine. Although they had been able to both see and hear many of the changes occurring on the other side of the Kaiya River, they had not yet experienced the loss of land and huge amounts of cash compensation that had befallen the communities of the Special Mining Lease (SML). This is not to say that the Kewai were totally unaffected by the massive changes that had taken place in the
The next round of relocation I 191
previous five years. The people were very mobile, and a significant number spent most of their time out of the area, working for the PJV or living with wantoks within the SML. Many had lost access to the alluvial gold of the Kaiya River as a result of increased sedimentation, some had already received compensation payouts, and a few had picked up business contracts with the PJY. In addition, their expectations and aspirations, based on what they had already seen within the SML, were high. The baseline study which follows must be seen in this context-as a description of a community which was already changing, but which had yet to experience the magnitude of changes that had affected the SML communities.
One other point to note here is that although the brief was to establish a socioeconomic baseline for the people of the 'Kaiya River LMP', our study took in a wider area than that covered by the LMP. This occurred for a number of reasons. First, the mobility of the people meant that most had gardens and houses both inside and outside the LMP, and that many people who had an interest in the LMP did not reside within its boundaries. Conversely, there were some inside the LMP boundary who were not likely to lose gardens or require relocation as a result of the further development of mining operations. At the same time, some people resident outside the LMP boundary were liable to be affected by other people relocating to their neighbourhood, especially because the proposed relocation road would run outside the LMP boundary for most of its length. Finally, it was not always obvious on the ground where the LMP boundary actually ran. The area covered by our study therefore stretches from the Kaiya River almost to the ridge of Mount Tangawundi.1
A series of detailed interviews form the basis for this report. These were carried out over a three-week period in November and December 1993. Information was collected on the make-up of the household, the type of housing, household assets, involvement in the cash economy, food eaten in the previous 24 hours, and the number, size and location of gardens. Each interview lasted between one and four hours, depending largely on the size of the household and the number and location of gardens. In total, 45 households were interviewed (comprising 381 individuals), and 91 gardens surveyed. Each of the gardens was measured, crops were counted, and notes were made on the location, the setting, the slope and other relevant details. All parts of the LMP and surrounding areas were visited, although a problem was encountered at Nikianga, where some Seventh Day Adventist
192 I Dilemmas of Development
households were unwilling to be interviewed because of rumours about our role which were spread by the lay preacher.
The Department of Enga and PJV records of compensation payments made for the Kaiya LMP area during 1993 were collected and analysed. Fritz Robinson's detailed relocation study for the Kaiya LMP (Robinson 1993) proved very useful, as did the Kewai genealogies compiled by both Robinson and Kurubu Ipara (1993). The work carried out by Goldsmith (1993) and Mules (1993) provided most of the information on the geology and geomorphology of the area. Further discussions, formal and informal, were held with Fritz Robinson, Geoff Hiatt, Rob Goldsmith, Tona Yongape, Marala (PJV), Kurubu Ipara (Department of Enga) and Pawe Lembopa (Councillor), and fleshed out the information obtained from the surveys.
The Kaiya environment
The following description of the existing environment of the Kaiya LMP area varies markedly in terms of detail. The emphasis is on economic and, to a lesser extent, social measures from the household survey carried out in November and December 1993. Evidence on changes in the extent of garden coverage between 1971 and 1991 is taken from aerial photographs. Material on the physical environment (geology, geomorphology, soils and vegetation), demography, social services and political situation is drawn from existing reports and conversations with a range of individuals, and is open to correction and refinement by those who have (or had) a better understanding of the situation than myself. Where appropriate, I have made comparisons between the Kewai community and other parts of the Porgera Valley, as discussed in previous chapters of this volume, in order to provide a clearer picture of the social and economic situation of the Kewai people relative to other communities.
PhYSical environment
The physical environment of the north bank of the Kaiya River is similar to that of Apalaka on the south bank (see Chapter 5). The Kaiya River is 14.5 kilometres in length, running from an altitude of 3,200m below Mount Pangalin in the west down to the junction with the Pongema River in the east at an altitude of 1720m (Goldsmith 1993:9-10). The lower Kaiya, from the junction with Anjolek Creek to the Pongema, comprises a relatively steep V-shaped valley, with slopes between 10° and 50°, while the upper part of the valley is wider and flatter.
The next round of relocation I 193
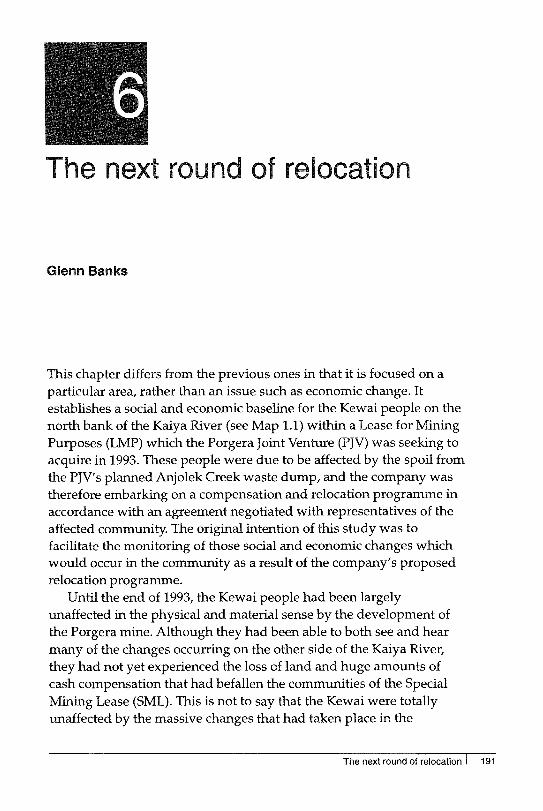
Goldsmith (1993:9) describes the geology of the valley as folded and faulted Chin Formation mudstone, with major structural elements trending northwest to southeast, although variations in the direction of the bedding are significant and have an impact on slope stability. The mudstone is generally of low strength, with high rates of erosion leading to the development of deep-seated slide blocks. The geomorphology of the area is dominated by a series of large dormant landslides, which make up the bulk of the flatter (and more populated) parts of the valley. Lepalama, for example, is situated on such a landslide (see Map 6.1). The headscarps of several of these landslides are visible high on the ridge. The soils on the dormant landslides are peaty to clayey, and are generally deep and poorly drained. On the steeper mudstone, the soils are residual clay and/ or perched colluvial veneer, with generally good drainage (Mules 1993). The area is split by a number of small streams and creeks which drain into the Kaiya River. These generally have low sediment loads, although they are capable of moving relatively large amounts of sediment after heavy rain.
It has been pointed out (Chapter 5) that climatic data collected from meteorological stations in different parts of the Porgera Valley reveal the marked influence of local topography and orographic effects on rainfall magnitude and intensity (PJV 1993:6). The area under consideration here is mostly at a lower altitude (1,800-2,000m) than the Alipis mine site (2,250m), from which the most detailed records are available, and can therefore be expected to have higher average hours of sunshine, warmer daytime temperatures, and lower rainfall. These features were readily apparent during our work in the area.
In 1993, the northern side of the Kaiya Valley was mostly covered by primary forest, interspersed with garden areas. The density of gardens decreased with altitude, with large tracts of garden and short fallow separated by patches of forest close to the Kaiya River, but no gardens along the ridgeline which reaches up to 2,500m. This was in marked contrast to the southern side of the valley, where the relocation areas of Apalaka and Yarik had little forest remaining below 2,500m (see Chapter 5). A series of air photographs (from 1971, 1986, 1991 and 1993) show that gardens had certainly been encroaching on the forested land on the northern side of the valley for the previous 20 years, but the remaining forest cover was still in the order of 65 per cent of the total area.
194 I Dilemmas of Development
-I
::r '" ::l '" ~ a c: ::
l 0
. g,
en o n ~ er ::
l
~
<D
(]I
Map
6.1
lo
ca
tio
n o
f h
ou
ses
in t
he
Kai
ya l
MP
, 199
1 (a
fter
Gol
dsm
ith 1
993)
IPAE
LALA
MA
• ."-
.:--. -
.. --I
• ••
-.
..........
.. • •
• • • i
./"
. _ ........
.... ;
•• •
•
AnjO
leK
",,'-'.
N
IKIL
AMA
'.
• •
•• _
.-
LMP
bou
ndar
y
• H
ouse
Sour
ce:
Ban
ks, G
,. 19
94b.
Kai
ya R
iver
LM
P S
ocio
-Eco
nom
ic B
asel
ine
Stud
y,
Por
gera
Sod
al M
onit
orin
g P
rogr
amm
e R
epor
t 4,
Uni
sear
ch P
NG
Pty
Ltd
for
P
orge
ra J
oint
Ven
ture
, Por
t Mor
esby
.
'-.
KUM
ANE
MAN
E
-. ......
.......
&, ~
• •
• •
This 'lower montane' forest is similar to that found throughout the rest of Enga Province, the predominant species being beech (Nothofagus), with some oak (Castanopsis acuminatissima) and a mixture of other species (Pain et al. 1982:35-7). In economic terms, one of the most significant tree species is Karuka (Pandanus jiulianetti), which appears to be more widespread on the northern side than the southern side of the Kaiya.
The people
The Kewai clan have primary rights to the area covered by the LMP. The boundaries of the Kewai territory extend up to Mount Tangawundi, which forms the prominent ridgeline to the north of the Kaiya River, down to the Kaiya River itself on the southern side, along the Kaiya to the east to a point almost halfway between the Kogai junction and the bridge, and for an unknown distance upstream to the west, probably as far as Mount Pangalin and the ridge at the head of the valley. Significantly, this is the ridge which separates Porgera from Paiela.
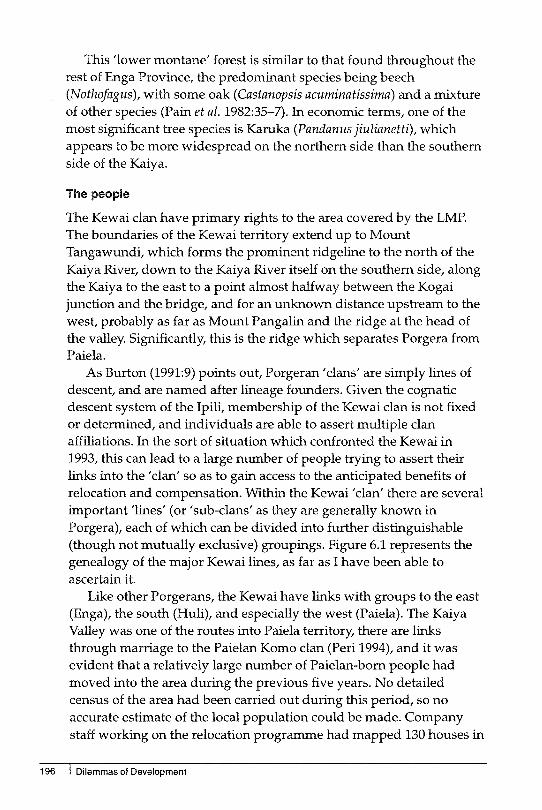
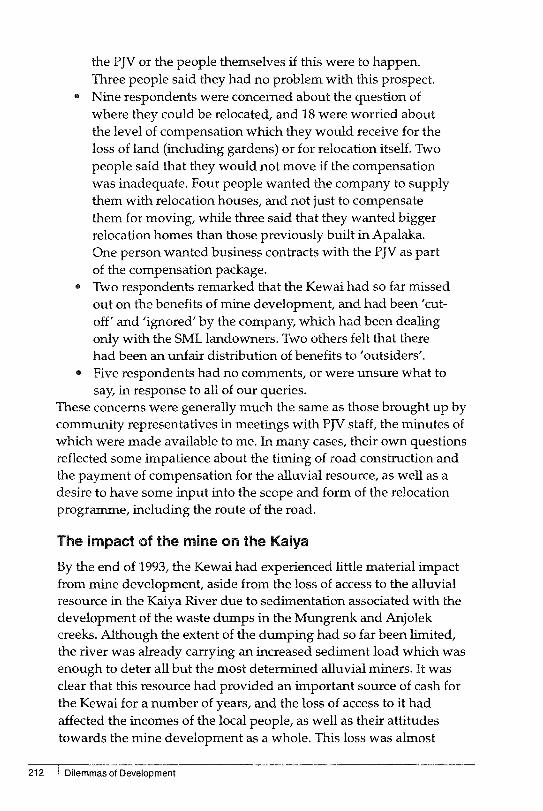
As Burton (1991:9) points out, Porgeran 'clans' are simply lines of descent, and are named after lineage founders. Given the cognatic descent system of the Ipili, membership of the Kewai clan is not fixed or determined, and individuals are able to assert multiple clan affiliations. In the sort of situation which confronted the Kewai in 1993, this can lead to a large number of people trying to assert their links into the 'clan' so as to gain access to the anticipated benefits of relocation and compensation. Within the Kewai 'clan' there are several important 'lines' (or 'sub-clans' as they are generally known in Porgera), each of which can be divided into further distinguishable (though not mutually exclusive) groupings. Figure 6.1 represents the genealogy of the major Kewai lines, as far as I have been able to ascertain it.
Like other Porgerans, the Kewai have links with groups to the east (Enga), the south (Huli), and especially the west (Paiela). The Kaiya Valley was one of the routes into Paiela territory, there are links through marriage to the Paielan Komo clan (Peri 1994), and it was evident that a relatively large number of Paielan-born people had moved into the area during the previous five years. No detailed census of the area had been carried out during this period, so no accurate estimate of the local population could be made. Company staff working on the relocation programme had mapped 130 houses in
196 I Dilemmas of Development
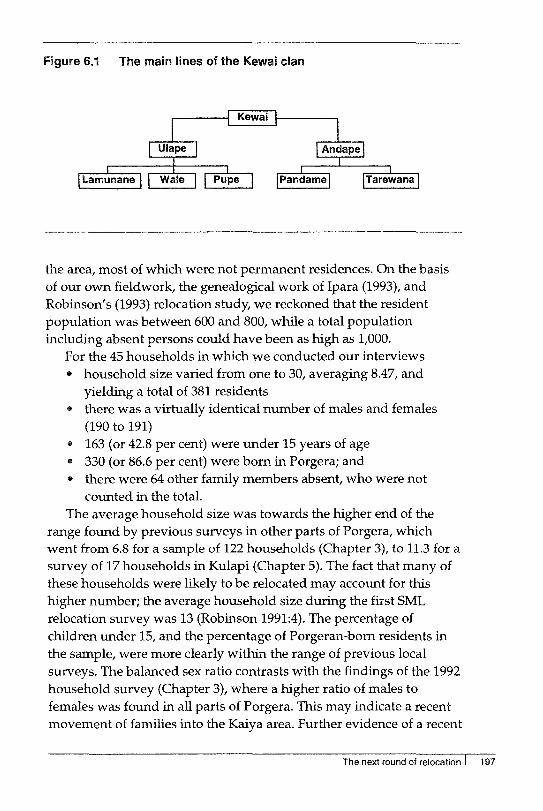
Figure 6.1 The main lines of the Kewai clan
the area, most of which were not permanent residences. On the basis of our own fieldwork, the genealogical work of Ipara (1993), and Robinson's (1993) relocation study, we reckoned that the resident population was between 600 and 800, while a total population including absent persons could have been as high as 1,000.
For the 45 households in which we conducted our interviews .. household size varied from one to 30, averaging 8.47, and
yielding a total of 381 residents .. there was a virtually identical number of males and females
(190 to 191) .. 163 (or 42.8 per cent) were under 15 years of age .. 330 (or 86.6 per cent) were born in Porgera; and .. there were 64 other family members absent, who were not
counted in the total. The average household size was towards the higher end of the
range found by previous surveys in other parts of Porgera, which went from 6.8 for a sample of 122 households (Chapter 3), to 11.3 for a survey of 17 households in Kulapi (Chapter 5). The fact that many of these households were likely to be relocated may account for this higher number; the average household size during the first SML relocation survey was 13 (Robinson 1991:4). The percentage of children under 15, and the percentage of Porgeran-born residents in the sample, were more clearly within the range of previous local surveys. The balanced sex ratio contrasts with the findings of the 1992 household survey (Chapter 3), where a higher ratio of males to females was found in all parts of Porgera. This may indicate a recent movement of families into the Kaiya area. Further evidence of a recent
The next round of relocation I 197
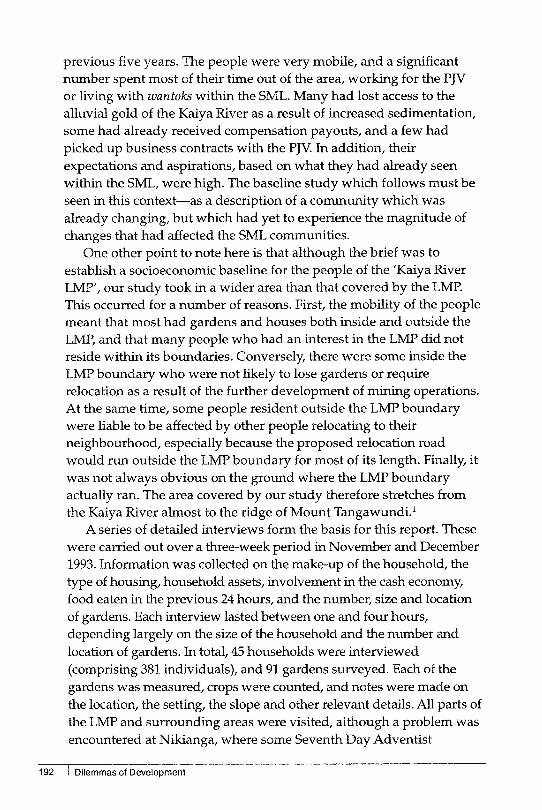
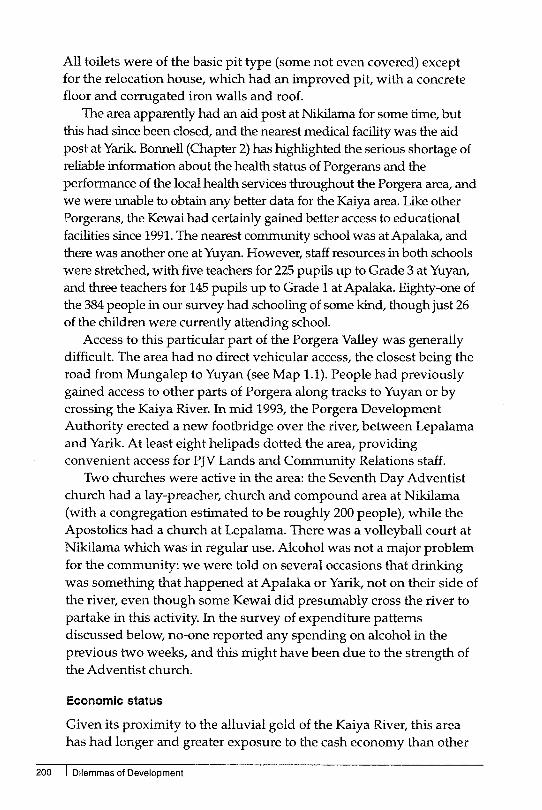
movement of people into the area is contained in the age profile of our survey, which shows a large proportion of 25-29 year-olds (see Figure 6.2). This is unusual in an area from which out-migration could have been expected, as this age group would be one of the most mobile and thus most likely to leave. Here again, it suggests the movement of young people into the area in anticipation of benefits from the relocation and compensation packages.
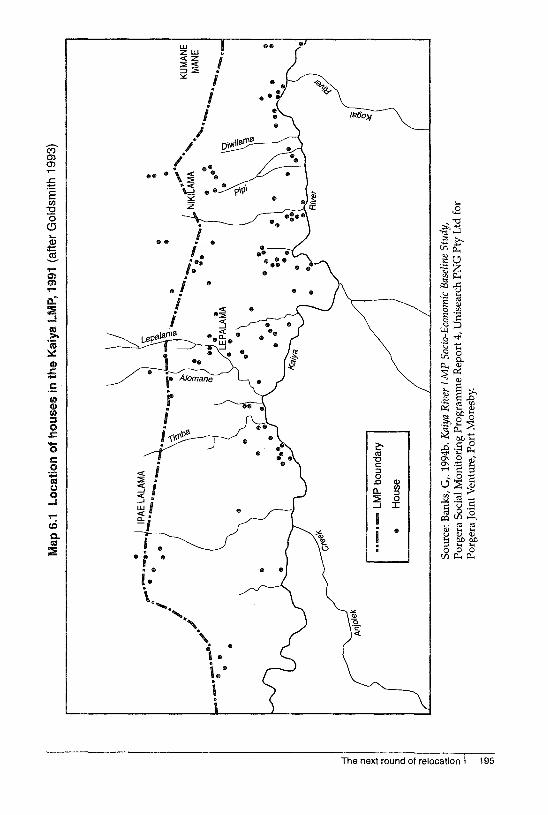
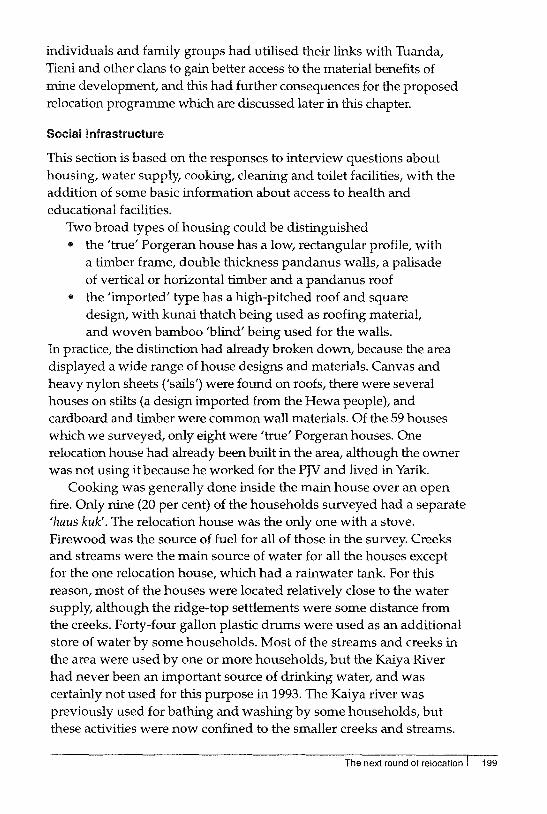
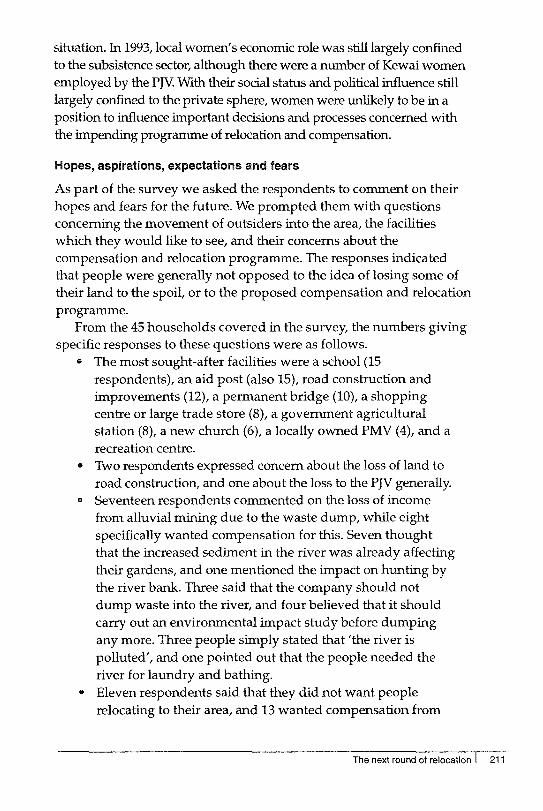
The population was scattered throughout the area, with three main settlements (Kumane Mane, Nikilama and Lepalama), and a tendency for groups of four or five houses to be clustered together at garden sites. Twenty six (58 per cent) of the households interviewed had more than one residence. The general pattern was for a family to live in one house for the greater part of the year, but to spend short spells at their other home or homes. In some cases, the secondary homes were garden houses. Map 6.1 shows the location of the houses (not all of which were primary places of residence) revealed in a December 1991 air photograph, and highlights the scattered nature of the population.
The population was also very mobile, with people 'commuting' to Yuyan, Apalaka and Yarik on a daily basis. Some residents had departed the area on a more permanent basis, because the Nikilama and Lepalama areas were isolated, even by comparison to Yuyan, and they evidently wanted to get closer to the road and all the benefits that this would bring, or was thought likely to bring. More recently,
Figure 6.2 Age profile from the Kewai household survey, 1993
5CHlO
Co 40-44 ::J e Cl 30-34 <D Cl « 20-24
10-14
0-4
0 10 20 30 40 50 60
Number
Source: Kaiya household survey, 1993.
198 I Dilemmas of Development
individuals and family groups had utilised their links with Tuanda, Tieni and other clans to gain better access to the material benefits of mine development, and this had further consequences for the proposed relocation programme which are discussed later in this chapter.
Social infrastructure
This section is based on the responses to interview questions about housing, water supply, cooking, cleaning and toilet facilities, with the addition of some basic information about access to health and educational facilities.
Two broad types of housing could be distinguished .. the 'true' Porgeran house has a low, rectangular profile, with
a timber frame, double thickness pandanus walls, a palisade of vertical or horizontal timber and a pandanus roof
.. the 'imported' type has a high-pitched roof and square design, with kunai thatch being used as roofing material, and woven bamboo 'blind' being used for the walls.
In practice, the distinction had already broken down, because the area displayed a wide range of house designs and materials. Canvas and heavy nylon sheets ('sails') were found on roofs, there were several houses on stilts (a design imported from the Hewa people), and cardboard and timber were common wall materials. Of the 59 houses which we surveyed, only eight were 'true' Porgeran houses. One relocation house had already been built in the area, although the owner was not using it because he worked for the PJV and lived in Yarik.
Cooking was generally done inside the main house over an open fire. Only nine (20 per cent) of the households surveyed had a separate 'haus kuk'. The relocation house was the only one with a stove. Firewood was the source of fuel for all of those in the survey. Creeks and streams were the main source of water for all the houses except for the one relocation house, which had a rainwater tank. For this reason, most of the houses were located relatively close to the water supply, although the ridge-top settlements were some distance from the creeks. Forty-four gallon plastic drums were used as an additional store of water by some households. Most of the streams and creeks in the area were used by one or more households, but the Kaiya River had never been an important source of drinking water, and was certainly not used for this purpose in 1993. The Kaiya river was previously used for bathing and washing by some households, but these activities were now confined to the smaller creeks and streams.
The next round of relocation I 199
All toilets were of the basic pit type (some not even covered) except for the relocation house, which had an improved pit, with a concrete floor and corrugated iron walls and roof.
The area apparently had an aid post at Nikilama for some time, but this had since been closed, and the nearest medical facility was the aid post at Yarik. Bonnell (Chapter 2) has highlighted the serious shortage of reliable information about the health status of Porgerans and the performance of the local health services throughout the Porgera area, and we were unable to obtain any better data for the Kaiya area. Like other Porgerans, the Kewai had certainly gained better access to educational facilities since 1991. The nearest community school was at Apalaka, and there was another one at Yuyan. However, staff resources in both schools were stretched, with five teachers for 225 pupils up to Grade 3 at Yuyan, and three teachers for 145 pupils up to Grade 1 at Apalaka. Eighty-one of the 384 people in our survey had schooling of some kind, though just 26 of the children were currently attending school.
Access to this particular part of the Porgera Valley was generally difficult. The area had no direct vehicular access, the closest being the road from Mungalep to Yuyan (see Map 1.1). People had previously gained access to other parts of Porgera along tracks to Yuyan or by crossing the Kaiya River. In mid 1993, the Porgera Development Authority erected a new footbridge over the river, between Lepalama and Yarik. At least eight helipads dotted the area, providing convenient access for PJV Lands and Community Relations staff.
Two churches were active in the area: the Seventh Day Adventist church had a lay-preacher, church and compound area at Nikilama (with a congregation estimated to be roughly 200 people), while the Apostolics had a church at Lepalama. There was a volleyball court at Nikilama which was in regular use. Alcohol was not a major problem for the community: we were told on several occasions that drinking was something that happened at Apalaka or Yarik, not on their side of the river, even though some Kewai did presumably cross the river to partake in this activity. In the survey of expenditure patterns discussed below, no-one reported any spending on alcohol in the previous two weeks, and this might have been due to the strength of the Adventist church.
Economic status
Given its proximity to the alluvial gold of the Kaiya River, this area has had longer and greater exposure to the cash economy than other
200 I Dilemmas of Development
parts of Porgera.2 Until recently, the Kewai were heavily involved in alluvial mining, and even in 1993, this was still the largest source of income for the local residents. Although this was already a diminishing resource, the Kewai, along with others along the Kaiya and the Porgera, were due to be compensated for their loss of access to it. Nevertheless, the Kewai community is one in which average incomes had probably dropped since the start of construction in 1989, and this may have had some bearing on the level of expectations within the community.
I shall now discuss the economic status of the Kewai people in 1993 with reference to the results of our survey, looking specifically at amounts and sources of income and expenditure, material wealth and assets, and food eaten in the previous 24 hours. The survey revealed that the Kewai had a variety of sources of income, the most significant of which was alluvial mining. Table 6.1 compares the Kewai figures with those obtained in 1992 for other areas of the Porgera Valley (see Table 3.8). Table 6.1 highlights several other features of the Kewai situation. The figures for royalties and occupation fees were lower than elsewhere, while the proportion of households which had received PJV compensation was higher, although the value of this compensation to date had been relatively low. Almost 50 per cent of the households were involved in the sale of crops or produce. The proportion involved in a business (11 per cent) was lower than in all other parts of the Porgera Valley we surveyed in 1992, but the number and proportion (30 per cent) of households involved in alluvial
Table 6.1 Annual value and distribution of cash income for the Kewai community (1993) compared with other parts of Porgera (1992)
1992 Porgera survey (N=122) 1993 Kewai survey (N=4S) Income sources Income No. of Kina Income No. of Kina
(kina) recipients per (kina) recipients per recipient recipient
Royalties 41,308 43 961 1,045 8 131 Occupation fees 8,454 33 256 140 140 PJV compensation 241,250 32 7,539 14,254 16 891 Cash cropping 6,054 41 148 4,610 22 210 Alluvial mining 18,150 14 1,296 27,577 14 1,970 No. in business n.a. 30 n.a. n.a. 5 n.a.
Source: Porgera household survey and Kaiya household survey.
The next round of relocation I 201
mining, and the value of that activity to the community, were significantly greater than they were elsewhere in the valley.3
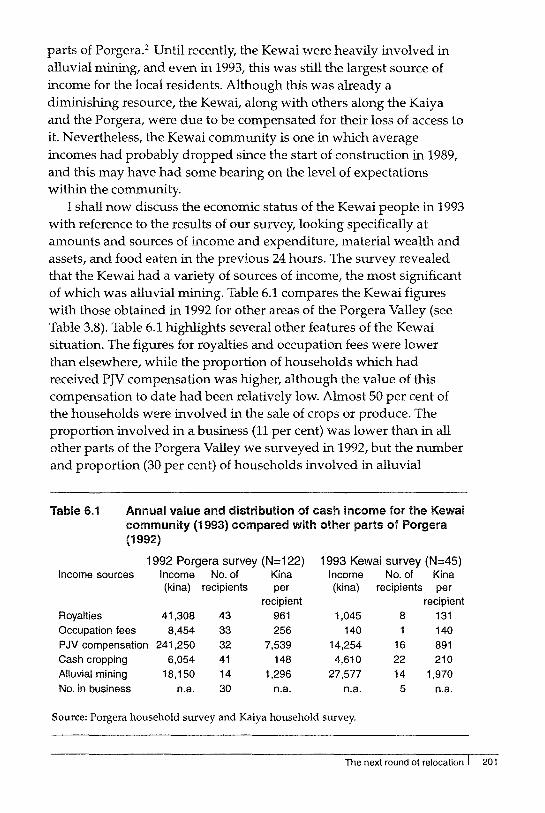
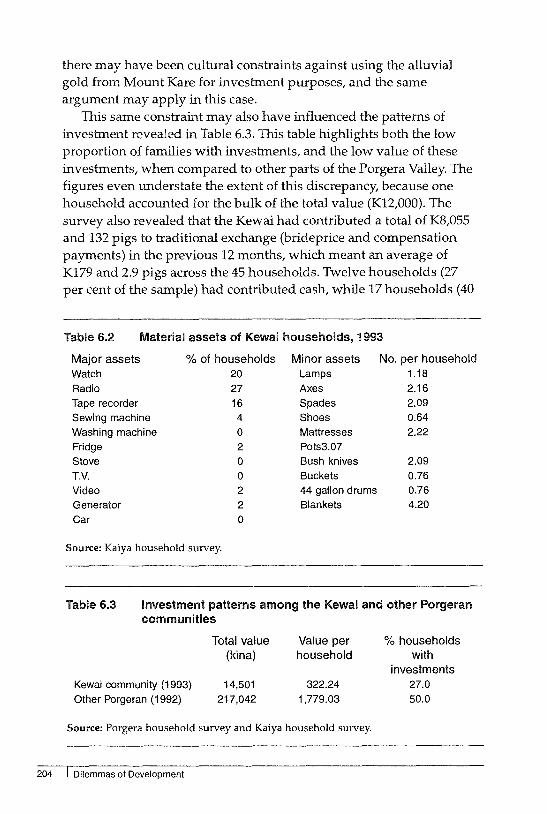
The data obtained from survey questions relating to income received in the past two weeks are shown in Figures 6.3 and 6.4. Sixteen people in the 45 households we surveyed were in paid employment. A total of K5,004 was received by these households at an average of Kll1.20 per household for the fortnight. The information was significantly skewed by one household, which had received a K2,OOO compensation payment from PJV during the period in question. This was left in the data because it appears to be typical of the way that the local economy functions, with a sequence of 'windfalls' of various sizes and sources occurring to different households throughout the year. The data show that
.. excluding the large compensation payment, alluvial mining and money from wantoks provided the greatest source of income to the community; PJV wages accounted for 11 per cent of the income received, though this figure is certainly an underestimate, as several household heads did not know how much money their adult children had brought home in wages from PJV
.. the Kewai income figures were generally below those previously found in other parts of Porgera (with the exception of Tipinini) in our income and expenditure survey.4 There were variations in the significance of the 'other' category for the Kewai (67 per cent against 5 per cent in the rest of Porgera), the lesser importance of wages from any source (15 per cent against 48 per cent), and the complete absence of any profits from businesses, which accounted for 28 per cent of income in the 1992 Porgerawide survey (see Chapter 3)
.. ten households (22 per cent) reported no income for the two week period.
Table 6.2 is based on the answers given to survey questions about the ownership of a range of material assets.5 Compared to other parts of Porgera, the Kewai generally had fewer material goods than those inside or close to the SML, and similar amounts of assets to those in Tipinini. This is somewhat surprising, given the long history of alluvial mining, and may relate to a focus on consumption rather than investment in goods or businesses. Clark (1993) has postulated that
202 I Dilemmas of Development
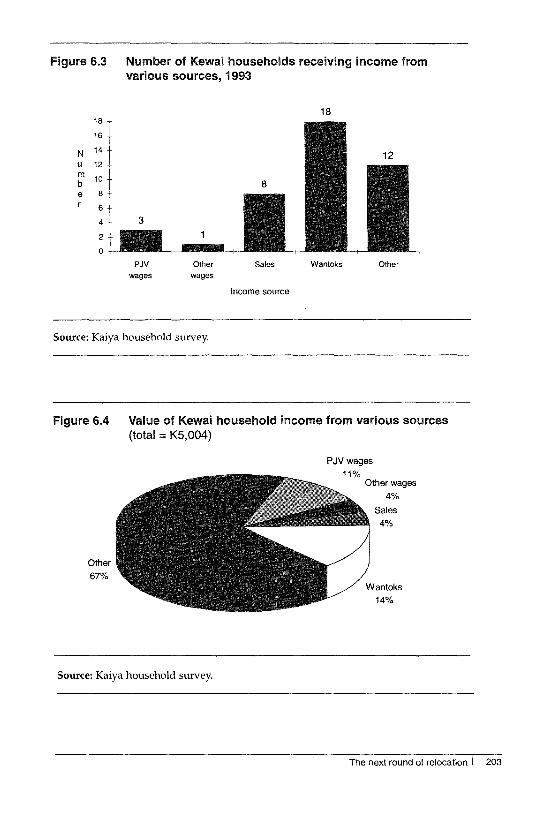
Figure 6.3
18
16
N 14
U 12
~ 10
e 8
6
Number of Kewai households receiving income from various sources, 1993
18
4 3
2
o PJV Other
wages wages
Source: Kaiya household survey.
Sales Wantoks Other
Income source
Figure 6.4 Value of Kewai household income from various sources (total = K5,004)
Other
67%
Source: Kaiya household survey.
PJVwages
11% Other wages
4%
Sales
4%
14%
The next round of relocation I 203
there may have been cultural constraints against using the alluvial gold from Mount Kare for investment purposes, and the same argument may apply in this case.
This same constraint may also have influenced the patterns of investment revealed in Table 6.3. This table highlights both the low proportion of families with investments, and the low value of these investments, when compared to other parts of the Porgera Valley. The figures even understate the extent of this discrepancy, because one household accounted for the bulk of the total value (K12,000). The survey also revealed that the Kewai had contributed a total of KS,055 and 132 pigs to traditional exchange (brideprice and compensation payments) in the previous 12 months, which meant an average of K179 and 2.9 pigs across the 45 households. Twelve households (27 per cent of the sample) had contributed cash, while 17 households (40
Table 6.2 Material assets of Kewai households, 1993
Major assets % of households Minor assets No. per household Watch 20 Lamps 1.18
Radio 27 Axes 2.16
Tape recorder 16 Spades 2.09
Sewing machine 4 Shoes 0.64 Washing machine 0 Mattresses 2.22
Fridge 2 Pots3.07 Stove 0 Bush knives 2.09
T.V. 0 Buckets 0.76
Video 2 44 gallon drums 0.76
Generator 2 Blankets 4.20
Car 0
Source: Kaiya household survey.
Table 6.3 Investment patterns among the Kewai and other Porgeran communities
Kewai community (1993) Other Porgeran (1992)
Total value (kina)
14,501 217,042
Value per household
322.24
1,779.03
Source: Porgera household survey and Kaiya household survey.
204 I Dilemmas of Development
% households with
investments 27.0 50.0
per cent of the sample) had contributed pigs. In other parts of Porgera, we had found that 63 per cent of households surveyed contributed cash, and 61 per cent contributed pigs, to ceremonial exchanges, which meant an average of K2203.18 and 5.4 pigs per household (see Chapter 3). In summary, our measures of material wealth did not reflect the long history of alluvial mining in the Kaiya area, possibly because of cultural factors, or else because the mobility of local residents was associated with the movement of money out of the area.
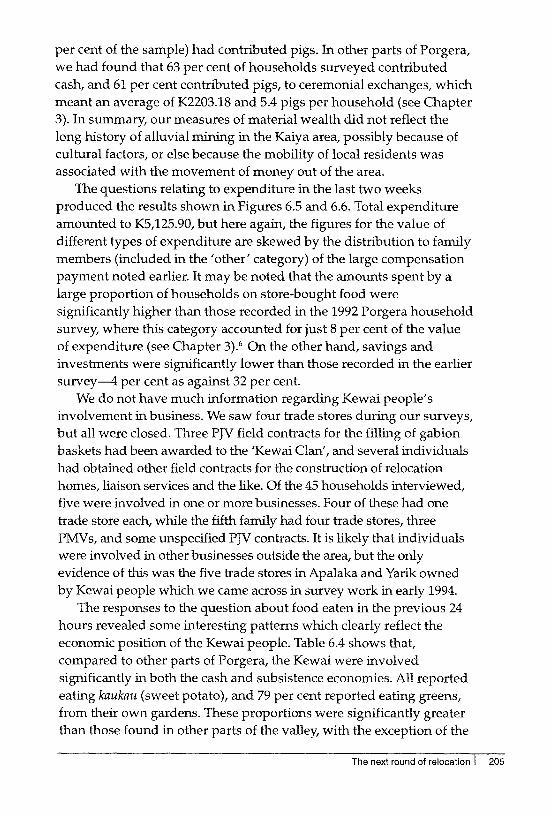
The questions relating to expenditure in the last two weeks produced the results shown in Figures 6.5 and 6.6. Total expenditure amounted to K5,125.90, but here again, the figures for the value of different types of expenditure are skewed by the distribution to family members (included in the 'other' category) of the large compensation payment noted earlier. It may be noted that the amounts spent by a large proportion of households on store-bought food were significantly higher than those recorded in the 1992 Porgera household survey, where this category accounted for just 8 per cent of the value of expenditure (see Chapter 3).6 On the other hand, savings and investments were significantly lower than those recorded in the earlier survey-4 per cent as against 32 per cent.
We do not have much information regarding Kewai people's involvement in business. We saw four trade stores during our surveys, but all were closed. Three PJV field contracts for the filling of gabion baskets had been awarded to the 'Kewai Clan', and several individuals had obtained other field contracts for the construction of relocation homes, liaison services and the like. Of the 45 households interviewed, five were involved in one or more businesses. Four of these had one trade store each, while the fifth family had four trade stores, three PMV s, and some unspecified PJV contracts. It is likely that individuals were involved in other businesses outside the area, but the only evidence of this was the five trade stores in Apalaka and Yarik owned by Kewai people which we came across in survey work in early 1994.
The responses to the question about food eaten in the previous 24 hours revealed some interesting patterns which clearly reflect the economic position of the Kewai people. Table 6.4 shows that, compared to other parts of Porgera, the Kewai were involved significantly in both the cash and subsistence economies. All reported eating kaukau (sweet potato), and 79 per cent reported eating greens, from their own gardens. These proportions were significantly greater than those found in other parts of the valley, with the exception of the
The next round of relocation I 205
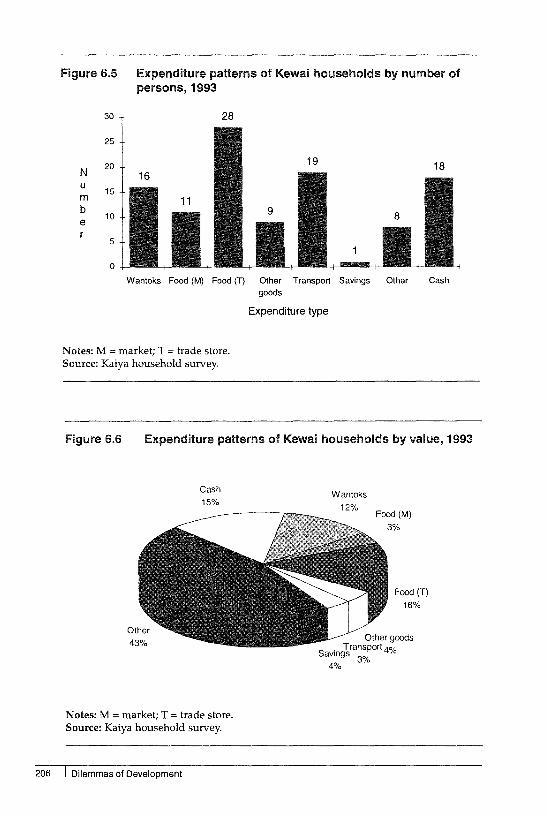
Figure 6.5
30
25
N 20
U 15
m b e 10
5
0
Expenditure patterns of Kewai households by number of persons, 1993
28
Wantoks Food (M) Food (T) Other Transport Savings Other Cash goods
Expenditure type
Notes: M = market; T = trade store. Source: Kaiya household survey.
Figure 6.6 Expenditure patterns of Kewai households by value, 1993
Cash
15%
Notes: M = market; T = trade store. Source: Kaiya household survey.
206 I Dilemmas of Development
Wantoks
4%
Food{T)
16%
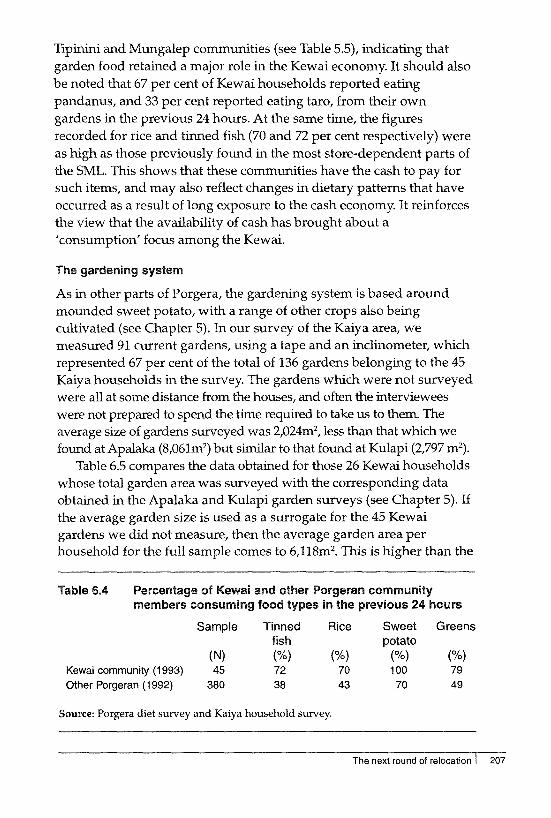
Tipinini and Mungalep communities (see Table 5.5), indicating that garden food retained a major role in the Kewai economy. It should also be noted that 67 per cent of Kewai households reported eating pandanus, and 33 per cent reported eating taro, from their own gardens in the previous 24 hours. At the same time, the figures recorded for rice and tinned fish (70 and 72 per cent respectively) were as high as those previously found in the most store-dependent parts of the SML. This shows that these communities have the cash to pay for such items, and may also reflect changes in dietary patterns that have occurred as a result of long exposure to the cash economy. It reinforces the view that the availability of cash has brought about a 'consumption' focus among the Kewai.
The gardening system
As in other parts of Porgera, the gardening system is based around mounded sweet potato, with a range of other crops also being cultivated (see Chapter 5). In our survey of the Kaiya area, we measured 91 current gardens, using a tape and an inclinometer, which represented 67 per cent of the total of 136 gardens belonging to the 45 Kaiya households in the survey. The gardens which were not surveyed were all at some distance from the houses, and often the interviewees were not prepared to spend the time required to take us to them. The average size of gardens surveyed was 2,024m2
, less than that which we found at Apalaka (8,061m2) but similar to that found at Kulapi (2,797 m2).
Table 6.5 compares the data obtained for those 26 Kewai households whose total garden area was surveyed with the corresponding data obtained in the Apalaka and Kulapi garden surveys (see Chapter 5). If the average garden size is used as a surrogate for the 45 Kewai gardens we did not measure, then the average garden area per household for the full sample comes to 6,118m2
• This is higher than the
Table 6.4 Percentage of Kewai and other Porgeran community members consuming food types in the previous 24 hours
Kewai community (1993) Other Porgeran (1992)
Sample Tinned Rice Sweet Greens
(N) 45
380
fish potato (%) (%) (%) 72 70 100 38 43 70
(%) 79 49
Source: Porgera diet survey and Kaiya household survey.
The next round of relocation I 207
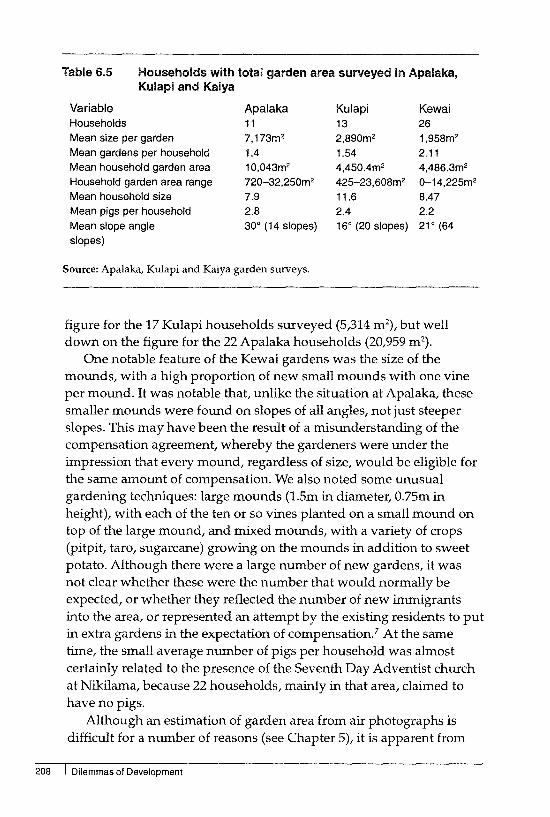
Table 6.5 Households with total garden area surveyed in Apalaka, Kulapi and Kaiya
Variable Apalaka Kulapi Kewai Households 11 13 26 Mean size per garden 7,173m2 2,890m2 1 ,958m2
Mean gardens per household 1.4 1.54 2.11 Mean household garden area 10,043m2 4,450.4m2 4,486.3m2 Household garden area range 720-32 ,250m2 425-23,608m2 O-14,225m2
Mean household size 7.9 11.6 8.47 Mean pigs per household 2.8 2.4 2.2 Mean slope angle 30° (14 slopes) 16° (20 slopes) 21 ° (64 slopes)
Source: Apalaka, Kulapi and Kaiya garden surveys.
figure for the 17 Kulapi households surveyed (5,314 m 2), but well
down on the figure for the 22 Apalaka households (20,959 m2).
One notable feature of the Kewai gardens was the size of the mounds, with a high proportion of new small mounds with one vine per mound. It was notable that, unlike the situation at Apalaka, these smaller mounds were found on slopes of all angles, not just steeper slopes. This may have been the result of a misunderstanding of the compensation agreement, whereby the gardeners were under the impression that every mound, regardless of size, would be eligible for the same amount of compensation. We also noted some unusual gardening techniques: large mounds (1.5m in diameter, 0.75m in height), with each of the ten or so vines planted on a small mound on top of the large mound, and mixed mounds, with a variety of crops (pitpit, taro, sugarcane) growing on the mounds in addition to sweet potato. Although there were a large number of new gardens, it was not clear whether these were the number that would normally be expected, or whether they reflected the number of new immigrants into the area, or represented an attempt by the existing residents to put in extra gardens in the expectation of compensation.7 At the same time, the small average number of pigs per household was almost certainly related to the presence of the Seventh Day Adventist church at Nikilama, because 22 households, mainly in that area, claimed to have no pigs.
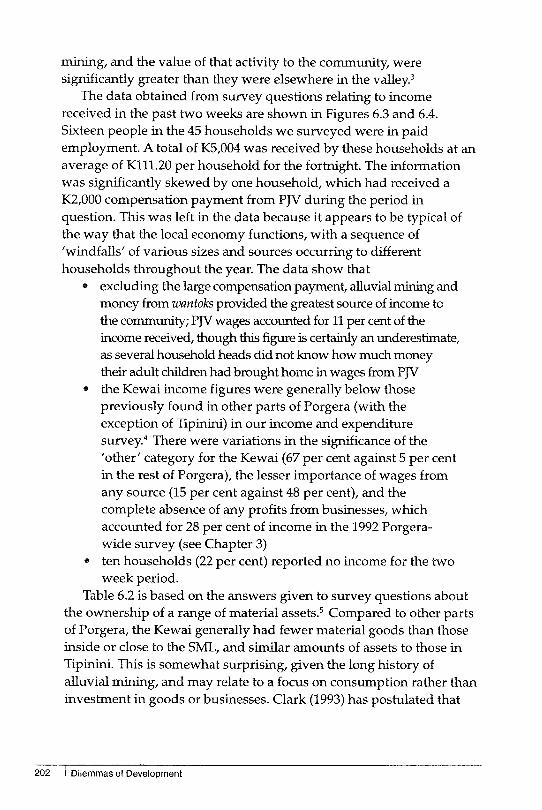
Although an estimation of garden area from air photographs is difficult for a number of reasons (see Chapter 5), it is apparent from
208 I Dilemmas of Development
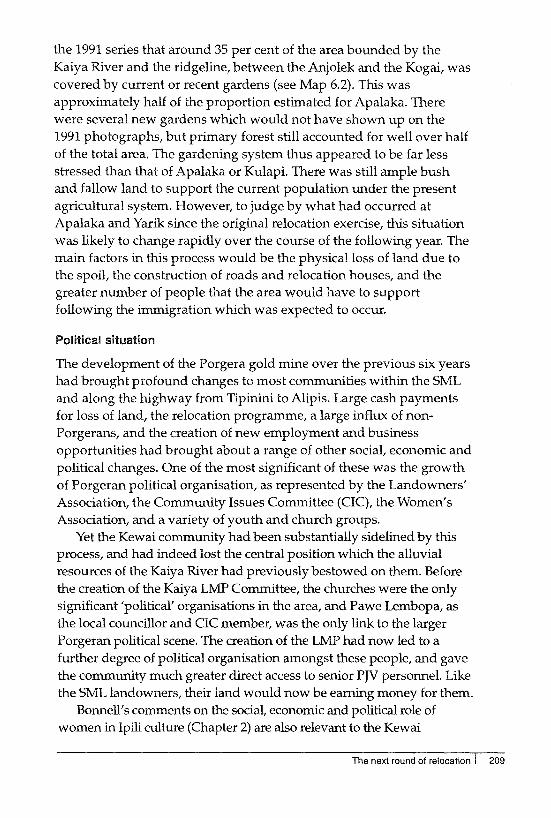
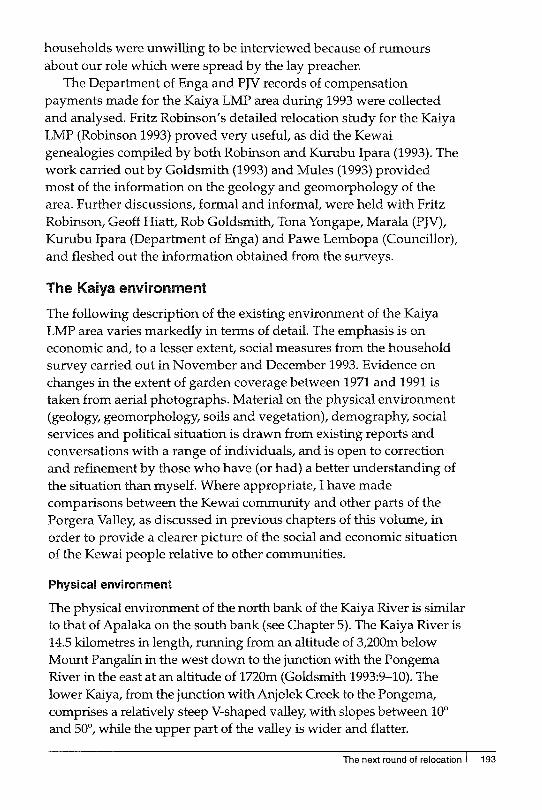
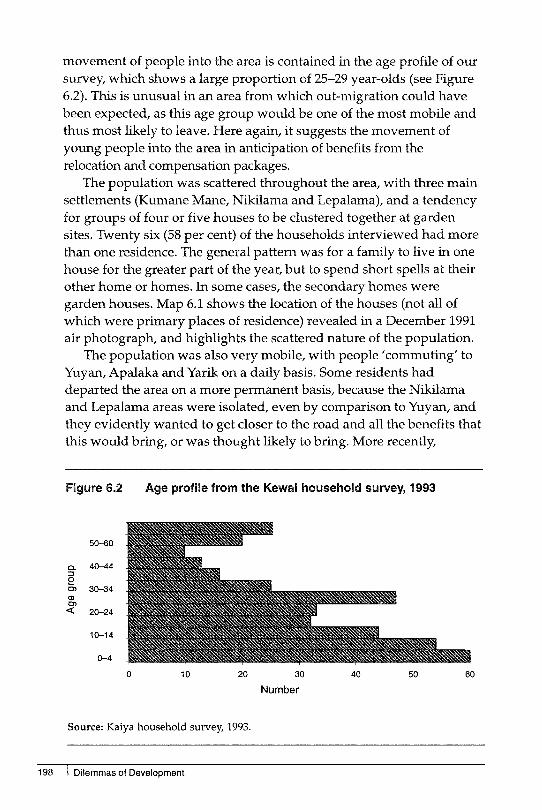
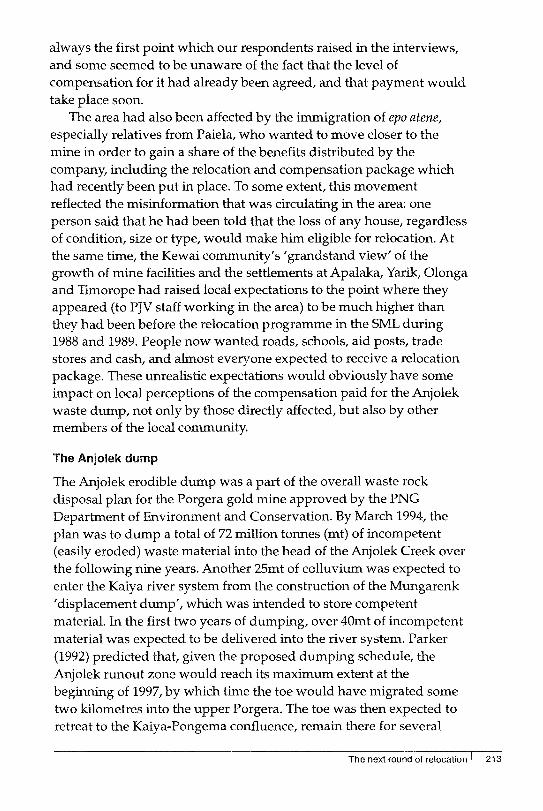
the 1991 series that around 35 per cent of the area bounded by the Kaiya River and the ridgeline, between the Anjolek and the Kogai, was covered by current or recent gardens (see Map 6.2). This was approximately half of the proportion estimated for Apalaka. There were several new gardens which would not have shown up on the 1991 photographs, but primary forest still accounted for well over half of the total area. The gardening system thus appeared to be far less stressed than that of Apalaka or Kulapi. There was still ample bush and fallow land to support the current population under the present agricultural system. However, to judge by what had occurred at Apalaka and Yarik since the original relocation exercise, this situation was likely to change rapidly over the course of the following year. The main factors in this process would be the physical loss of land due to the spoil, the construction of roads and relocation houses, and the greater number of people that the area would have to support following the immigration which was expected to occur.
Political situation
The development of the Porgera gold mine over the previous six years had brought profound changes to most communities within the SML and along the highway from Tipinini to Alipis. Large cash payments for loss of land, the relocation programme, a large influx of nonPorgerans, and the creation of new employment and business opportunities had brought about a range of other social, economic and political changes. One of the most significant of these was the growth of Porgeran political organisation, as represented by the Landowners' Association, the Community Issues Committee (CIC), the Women's Association, and a variety of youth and church groups.
Yet the Kewai community had been substantially sidelined by this process, and had indeed lost the central position which the alluvial resources of the Kaiya River had previously bestowed on them. Before the creation of the Kaiya LMP Committee, the churches were the only significant 'political' organisations in the area, and Pawe Lembopa, as the local councillor and CIC member, was the only link to the larger Porgeran political scene. The creation of the LMP had now led to a further degree of political organisation amongst these people, and gave the community much greater direct access to senior PJV personnel. Like the SML landowners, their land would now be earning money for them.
Bonnell's comments on the social, economic and political role of women in Ipili culture (Chapter 2) are also relevant to the Kewai
The next round of relocation I 209
~
o 9.
iD
3 3 Ol rn ~
o ~ Cl
-0
3 Cl) :a
1
Map
6.2
D
istr
ibu
tion
of
Kai
ya g
ard
en
s an
d fo
rest
(19
91),
wit
h
an
ticip
ate
d i
mp
act
of t
he
An
jole
k d
um
p
KA
IYA
LM
P
D
Inn
er
enve
lope
Ga
rde
n a
nd f
allo
w
Pri
ma
ry b
ush
met
res
(app
rox)
500
I ~ ~
Sour
ce:
Ban
ks, G
,. 19
94b.
Kai
ya R
iver
LM
P S
ocio
-Eco
nom
ic B
asel
ine
Stud
y,
Por
gera
Soc
ial
Mon
itor
ing
Pro
gram
me
Rep
ort
4, U
nise
arch
PN
G P
ty L
td f
or
Por
gera
Joi
nt V
entu
re, P
ort M
ores
by.
situation. In 1993, local women's economic role was still largely confined to the subsistence sector, although there were a number of Kewai women employed by the PN With their social status and political influence still largely confined to the private sphere, women were unlikely to be in a position to influence important decisions and processes concerned with the impending programme of relocation and compensation.
Hopes, aspirations, expectations and fears
As part of the survey we asked the respondents to comment on their hopes and fears for the future. We prompted them with questions concerning the movement of outsiders into the area, the facilities which they would like to see, and their concerns about the compensation and relocation programme. The responses indicated that people were generally not opposed to the idea of losing some of their land to the spoil, or to the proposed compensation and relocation programme.
From the 45 households covered in the survey, the numbers giving specific responses to these questions were as follows.
.. The most sought-after facilities were a school (15 respondents), an aid post (also 15), road construction and improvements (12), a permanent bridge (10), a shopping centre or large trade store (8), a government agricultural station (8), a new church (6), a locally owned PMV (4), and a recreation centre.
.. Two respondents expressed concern about the loss of land to road construction, and one about the loss to the PJV generally.
.. Seventeen respondents commented on the loss of income from alluvial mining due to the waste dump, while eight specifically wanted compensation for this. Seven thought that the increased sediment in the river was already affecting their gardens, and one mentioned the impact on hunting by the river bank. Three said that the company should not dump waste into the river, and four believed that it should carry out an environmental impact study before dumping any more. Three people simply stated that 'the river is polluted', and one pointed out that the people needed the river for laundry and bathing.
.. Eleven respondents said that they did not want people relocating to their area, and 13 wanted compensation from
The next round of relocation I 211
the PJV or the people themselves if this were to happen. Three people said they had no problem with this prospect.
.. Nine respondents were concerned about the question of where they could be relocated, and 18 were worried about the level of compensation which they would receive for the loss of land (including gardens) or for relocation itself. Two people said that they would not move if the compensation was inadequate. Four people wanted the company to supply them with relocation houses, and not just to compensate them for moving, while three said that they wanted bigger relocation homes than those previously built in Apalaka. One person wanted business contracts with the PJV as part of the compensation package.
.. Two respondents remarked that the Kewai had so far missed out on the benefits of mine development, and had been 'cutoff' and 'ignored' by the company, which had been dealing only with the SML landowners. Two others felt that there had been an unfair distribution of benefits to 'outsiders'.
It Five respondents had no comments, or were unsure what to say, in response to all of our queries.
These concerns were generally much the same as those brought up by community representatives in meetings with PJV staff, the minutes of which were made available to me. In many cases, their own questions reflected some impatience about the timing of road construction and the payment of compensation for the alluvial resource, as well as a desire to have some input into the scope and form of the relocation programme, including the route of the road.
The impact of the mine on the Kaiya
By the end of 1993, the Kewai had experienced little material impact from mine development, aside from the loss of access to the alluvial resource in the Kaiya River due to sedimentation associated with the development of the waste dumps in the Mungrenk and Anjolek creeks. Although the extent of the dumping had so far been limited, the river was already carrying an increased sediment load which was enough to deter all but the most determined alluvial miners. It was clear that this resource had provided an important source of cash for the Kewai for a number of years, and the loss of access to it had affected the incomes of the local people, as well as their attitudes towards the mine development as a whole. This loss was almost
212 I Dilemmas of Development
always the first point which our respondents raised in the interviews, and some seemed to be unaware of the fact that the level of compensation for it had already been agreed, and that payment would take place soon.
The area had also been affected by the immigration of epa atene, especially relatives from Paiela, who wanted to move closer to the mine in order to gain a share of the benefits distributed by the company, including the relocation and compensation package which had recently been put in place. To some extent, this movement reflected the misinformation that was circulating in the area: one person said that he had been told that the loss of any house, regardless of condition, size or type, would make him eligible for relocation. At the same time, the Kewai community's' grandstand view' of the growth of mine facilities and the settlements at Apalaka, Yarik, Olonga and Timorope had raised local expectations to the point where they appeared (to PJV staff working in the area) to be much higher than they had been before the relocation programme in the SML during 1988 and 1989. People now wanted roads, schools, aid posts, trade stores and cash, and almost everyone expected to receive a relocation package. These unrealistic expectations would obviously have some impact on local perceptions of the compensation paid for the Anjolek waste dump, not only by those directly affected, but also by other members of the local community.
The Anjolek dump
The Anjolek erodible dump was a part of the overall waste rock disposal plan for the Porgera gold mine approved by the PNG Department of Environment and Conservation. By March 1994, the plan was to dump a total of 72 million tonnes (mt) of incompetent (easily eroded) waste material into the head of the Anjolek Creek over the following nine years. Another 25mt of colluvium was expected to enter the Kaiya river system from the construction of the Mungarenk 'displacement dump', which was intended to store competent material. In the first two years of dumping, over 40mt of incompetent material was expected to be delivered into the river system. Parker (1992) predicted that, given the proposed dumping schedule, the Anjolek run out zone would reach its maximum extent at the beginning of 1997, by which time the toe would have migrated some two kilometres into the upper Porgera. The toe was then expected to retreat to the Kaiya-Pongema confluence, remain there for several
The next round of relocation I 213
years, and then retreat rapidly up the Kaiya with the reduction in the rate of dumping. By the end of dumping (in 2002), after delivering 97mt of material to the system, the runout zone was predicted to have just 13.3mt of sediment stored in it (down from a maximum of 3Imt), while all the other material should have been carried further downstream by fluvial action, as had already occurred with spoil from the Anawe dump.
Parker (1992) estimated that the mudflow would aggrade the bed of the Kaiya River, between the Anjolek and Pongema confluences, by up to 35m below Apalaka to about 15m at the junction with Taro Creek. This aggradation was expected to occur quite rapidly, with the toe of the slide reaching the confluence with Taro Creek by the beginning of 1995. The mudflow might also reactivate a number of large, currently dormant landslides. It was this combination of predicted physical effects which had resulted in the negotiation of the proposed compensation and relocation package for the Kaiya LMP.
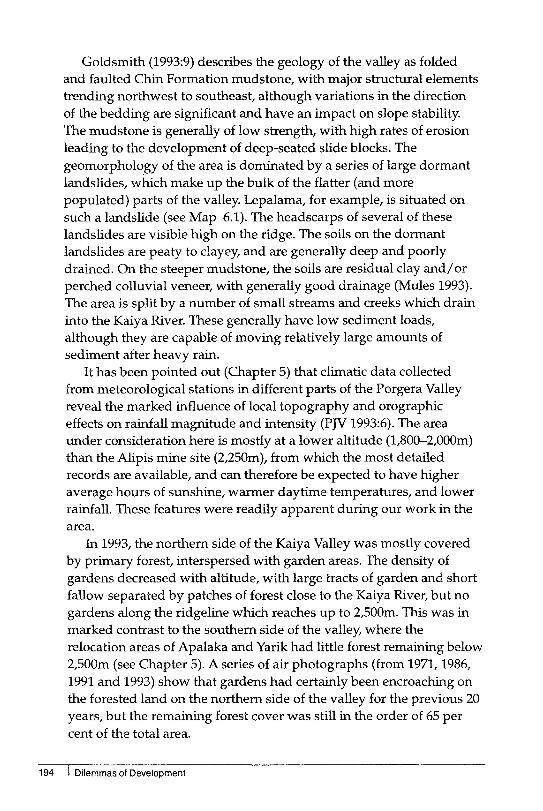
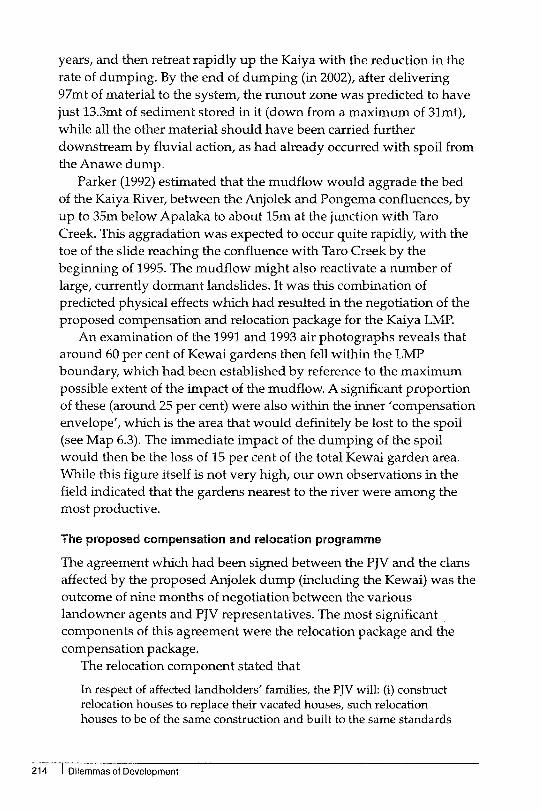
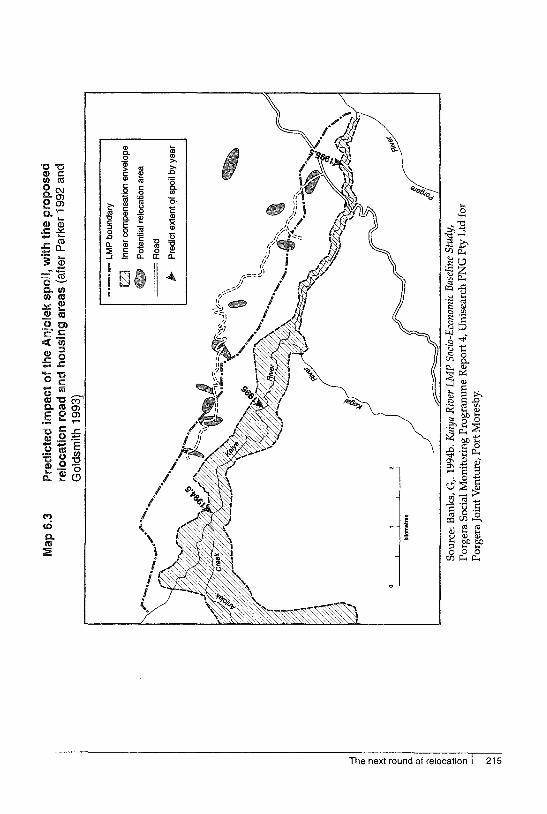
An examination of the 1991 and 1993 air photographs reveals that around 60 per cent of Kewai gardens then fell within the LMP boundary, which had been established by reference to the maximum possible extent of the impact of the mudflow. A significant proportion of these (around 25 per cent) were also within the inner 'compensation envelope', which is the area that would definitely be lost to the spoil (see Map 6.3). The immediate impact of the dumping of the spoil would then be the loss of 15 per cent of the total Kewai garden area. While this figure itself is not very high, our own observations in the field indicated that the gardens nearest to the river were among the most productive.
The proposed compensation and relocation programme
The agreement which had been signed between the PJV and the clans affected by the proposed Anjolek dump (including the Kewai) was the outcome of nine months of negotiation between the various landowner agents and PJV representatives. The most significant components of this agreement were the relocation package and the compensation package.
The relocation component stated that
In respect of affected landholders' families, the PJV will: (i) construct relocation houses to replace their vacated houses, such relocation houses to be of the same construction and built to the same standards
214 I Dilemmas of Development
-I
:T
ID
:::J ~ o C
:::J 0- ca. co 0" " ~ 0'
:::J ~
01
Map
6.3
Idlo
met
res
Pre
dict
ed i
mp
act
of t
he A
njo
lek
spo
il, w
ith
th
e p
rop
ose
d
relo
catio
n r
oad
and
hOlJ
sing
are
as (
afte
r P
arke
r 19
92 a
nd
Gol
dsm
ith 1
993)
_._
.-LM
P b
ound
ary
~j
Inne
r com
pens
atio
n en
velo
pe
Pot
entia
l rel
ocat
ion
area
=
Roa
d
~
Pre
dict
ext
ent 9
1 sp
oil b
y ye
ar
Sou
rce:
Ban
ks, G
,. 19
94b.
Kai
ya R
iver
LM
P S
ocio
-Eco
nom
ic B
asel
ine
Stud
y,
Por
gera
Soc
ial M
onit
orin
g P
rogr
amm
e R
epor
t 4, U
nise
arch
PN
G P
ty L
td f
or
Por
gera
Joi
nt V
entu
re, P
ort M
ores
by.
as offered in respect of families relocated for the purposes of the PJV's activities under its Special Mining Lease No. 1 - Porgera, such houses to be wired to Elcom standards and complete with an external power box ready for connection; (ii) provide road access to the main cluster of relocation houses;
The key phrase in the above is 'affected landholders' families', defined in the agreement as
True Landholders (YUU ANDUANE) who had prior to 3rd August 1992 and still have a primary residence within the LMP area. These individuals will appear in the genealogies which are being prepared and will be agreed between the PJV and the relevant Landholders;
Long term relatives, particularly WANA, married into the clan and who have a primary residence prior to 3rd August 1992 in the above area; and
Long-term invited outsiders (EPG ATENE) of ten (10) years permanent residence in the above area.
Given the general mobility of the population, and especially the recent movements towards the roads and the SML communities, there were a significant number of Kewai people who would simply not be eligible for relocation under the terms of the agreement, because their main place of residence was now outside the LMP area. Likewise, the epa atene who had moved in over the last five years would not be eligible.
The relocation package also included the following undertakings by the PJV
.. agreement to meet the reasonable costs of relocating each family of eligible landholders, with a payment of Kl,OOO to the head of each family for hardship and disturbance, and provision of rations to commence on the date on which the family no longer had access to traditional gardens, and to continue until the food gardens in the new locations were ready to harvest, or else for a maximum period of nine months
.. sympathetic examination of the situation of any relocated landowners who were affected in a special or unusual manner
.. construction of an aid post by the main cluster of relocation houses, with an extra relocation house for the orderly, subject to agreement by the government to staff this facility and supply appropriate drugs and medicines
216 I Dilemmas of Development
.. construction of two more relocation houses for the church pastors, although these would remain the property of the congregations rather than the pastors
.. clearing of a sports area for a basketball court and volleyball court, and supply of initial sporting equipment for these
.. construction and maintenance of two footbridges across the Kaiya River.
According to the agreement, relocation would occur' as necessitated by the PJV's activities'. Relocation of 40 households in the Anjolek area, on the southern side of the Kaiya River, was already underway by early 1994. On the northern side, an assessment of the value of the forest and 'improvements' in the inner envelope had already been completed, and those households which were eligible for relocation had been identified. At that stage it appeared that 40 Kewai families were due for relocation around the middle of 1994, although the actual effects of the spoil might cause this number to increase. Recent arguments between the company and the community, and also within the community itself, had concentrated on the question of who should get a relocation house. Many of the community representatives appeared to be arguing less in terms of eligibility under the agreement than in terms of 'political correctness', which in this case meant a preference for people with some standing in the community.
The compensation package stipulated rates for various economic and non-economic trees, which were based on those paid under the SML compensation agreement. These rates were generally somewhat higher than those recommended by the Valuer-General, which had last been revised in November 1993 (DLPP 1993). For example, a mature pandanus (karuka) was valued at K8 in the Valuer-General's schedule,
Table 6.6 Rates of annual fees payable for the Kaiya lMP
Type of payment Kina per hectare Bush and nuisance compensation 12.30 Cleared land 9.22 Damaged land Lost land Non-Renewable Resources Fund Occupation fee
Source: Kaiya LMP compensation agreement.
18.45 21.52
6.15 5.00
The next round of relocation I 217
but K12 in the Kaiya LMP compensation agreement. Compensation payments of this type had already started within the LMP area, primarily in respect of the damage done by clearing helipads and by surveying and cutting the LMP boundary. By the end of 1993, a total of 32 claims had been paid, with a total value of K28,848.50. The distribution lists contained 216 names, but there was some duplication, as some individuals received a share of as many as nine of the claims. There were 146 different individuals named on the lists, and their receipts ranged from K3,172.60 down to K17.40, with an average of K197.59 per person.
Since the inner envelope contained around eighty hectares of Kewai land, and the minimum PJV compensation payment for a hectare of bush was K9,OOO, then the Kewai could expect a minimum of K720,OOO cash compensation for the loss of these eighty hectares. Given that some of the inner envelope consisted of gardens, and the compensation rates for these were more than K14,OOO per hectare, the total was certain to exceed K1 million. The compensation to be paid for the damage caused by building the relocation road to Lepalama would make a substantial addition to this total.
The compensation package also established the rates of the annual fees to be paid over the whole LMP area, under the various categories shown in Table 6.6. The fees for cleared, damaged and lost land were mutually inclusive, so that K27.67 would be paid for a hectare of damaged land and K49.19 for a hectare of lost land. The NonRenewable Resources Fund was to consist of a series of trust funds established 'for the benefit of the landowners and other people of the Porgera area'. If we assume that the Kewai had primary rights to 387 hectares of land inside the LMP, then their total annual receipts under this element of the package would be worth at least K9,OOO, and might turn out to be worth twice that amount.
Separate compensation agreements had been negotiated for the loss of access to the alluvial resource and for the sedimentation of the river system. The agreement for the alluvials involved a single lump sum of K311,755 'to be invested or distributed as directed by the landowner representatives' of the clans who lived along the Kaiya, between the Anjolek and Pongema junctions. The agreement for the sedimentation was based on a rate of 1 toea per tonne of material dumped in the failing dumps, and in this case also, the distribution was to be determined by the landowner representatives. At the end of 1993, both of these 'heads of agreement' were awaiting government
218 I Dilemmas of Development
approval of the genealogical studies being carried out by the company to determine which groups would be eligible for these monies.
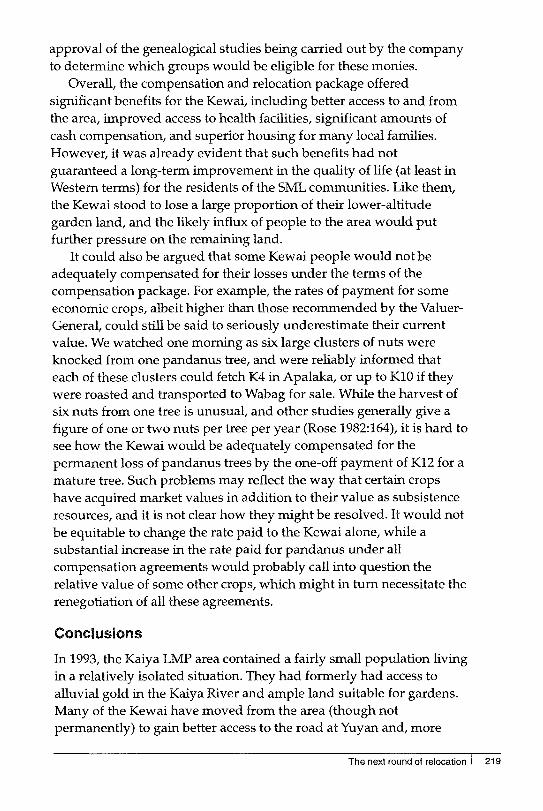
Overall, the compensation and relocation package offered significant benefits for the Kewai, including better access to and from the area, improved access to health facilities, significant amounts of cash compensation, and superior housing for many local families. However, it was already evident that such benefits had not guaranteed a long-term improvement in the quality of life (at least in Western terms) for the residents of the SML communities. Like them, the Kewai stood to lose a large proportion of their lower-altitude garden land, and the likely influx of people to the area would put further pressure on the remaining land.
It could also be argued that some Kewai people would not be adequately compensated for their losses under the terms of the compensation package. For example, the rates of payment for some economic crops, albeit higher than those recommended by the ValuerGeneral, could still be said to seriously underestimate their current value. We watched one morning as six large clusters of nuts were knocked from one pandanus tree, and were reliably informed that each of these clusters could fetch K4 in Apalaka, or up to KI0 if they were roasted and transported to Wabag for sale. While the harvest of six nuts from one tree is unusual, and other studies generally give a figure of one or two nuts per tree per year (Rose 1982:164), it is hard to see how the Kewai would be adequately compensated for the permanent loss of pandanus trees by the one-off payment of K12 for a mature tree. Such problems may reflect the way that certain crops have acquired market values in addition to their value as subsistence resources, and it is not clear how they might be resolved. It would not be equitable to change the rate paid to the Kewai alone, while a substantial increase in the rate paid for pandanus under all compensation agreements would probably call into question the relative value of some other crops, which might in turn necessitate the renegotiation of all these agreements.
Conclusions
In 1993, the Kaiya LMP area contained a fairly small population living in a relatively isolated situation. They had formerly had access to alluvial gold in the Kaiya River and ample land suitable for gardens. Many of the Kewai have moved from the area (though not permanently) to gain better access to the road at Yuyan and, more
The next round of relocation I 219
recently, the benefits of mine development at Apalaka and Yarik. They had lost income in recent years as a result of the increasing sedimentation of the Kaiya. Our survey evidence suggests the existence of well-established cash consumption patterns, especially relating to the purchase of food, and yet the subsistence sector remained an integral part of the local economy.
The creation of the Anjolek failing waste dump was about to bring huge changes to the Kewai community. There were great expectations that the compensation and relocation package would bring substantial benefits to all, and some people were bound to be disillusioned at the eventual distribution of the benefits, while a minimum of 80 hectares of land would be lost, including 15 per cent of the current gardening area.
The evidence from other parts of the Porgera Valley, as discussed in previous chapters of this volume, shows that the benefits do not necessarily mean a positive long-term change for the communities which receive them. In particular, cash compensation had mostly been consumed or poorly invested, and there were relatively few individuals who were in a secure financial position or who had secured long-term benefits from such income. These problems were not a function of the compensation packages themselves, which were seen to be adequate by those who received them, and which appeared quite generous to an outsider like myself. But once payments had been made or benefits distributed, there was little follow-up action by company or (more significantly) government officers to assist and advise the recipients on such matters as the best way to invest their money or maintain their houses.
In the Kewai case, the limited flow of information from the mining company to the local community was reflected in the abundance of false rumours. Several people told us, for example, that they were expecting a relocation because they had been told that everyone would get a house, and there was widespread ignorance of the terms of the compensation agreement for the alluvial gold resource. These rumours were feeding the expectations of the local people, while senior company personnel placed too much reliance on local representatives to pass on the information derived from formal meetings between them. These lines of communication did not seem to be working too well, either in the Kaiya area or in the rest of the Porgera Valley.
220 I Dilemmas of Development
Notes
1 The area of the new LMP which lay south of the Kaiya River (below Mungalep) was specifically excluded from our terms of reference.
2 Descendants of Joe Searson, the first of the long-term miners who arrived in 1948, still live at Kumane Mane.
3 Although we did not collect systematic data on this point, it appeared that much of the current alluvial mining was being carried out on irregular trips to Mount Kare, where the Kewai had some land rights, but we also saw some alluvial miners working (successfully) in the Kaiya area.
4 It is important to note that the income and expenditure survey carried out in late 1992 was directed at individuals, whereas the current survey was included as part of a household survey, so direct comparison is not possible.
5 These questions were of two types. In the case of larger or more expensive goods, a simple 'yes' or 'no' answer was recorded, while in the case of more common items, we asked how many of them each household had. In hindsight, it would probably have been better to ask the second type of question for all the goods.
6 No spending on alcohol was reported in the Kaiya survey, although this was now included as a separate category of expenditure.
7 There were two one-person households with no gardens at all.
The next round of relocation I 221