Embed Size (px)
Citation preview
The Nickels and Dimes of Education for All
Carina Omoeva and Ania ChaludaEducation Policy and Data Center, FHI [email protected]
Part II: Will we (ever) reach universal primary completion, and how much will it cost?
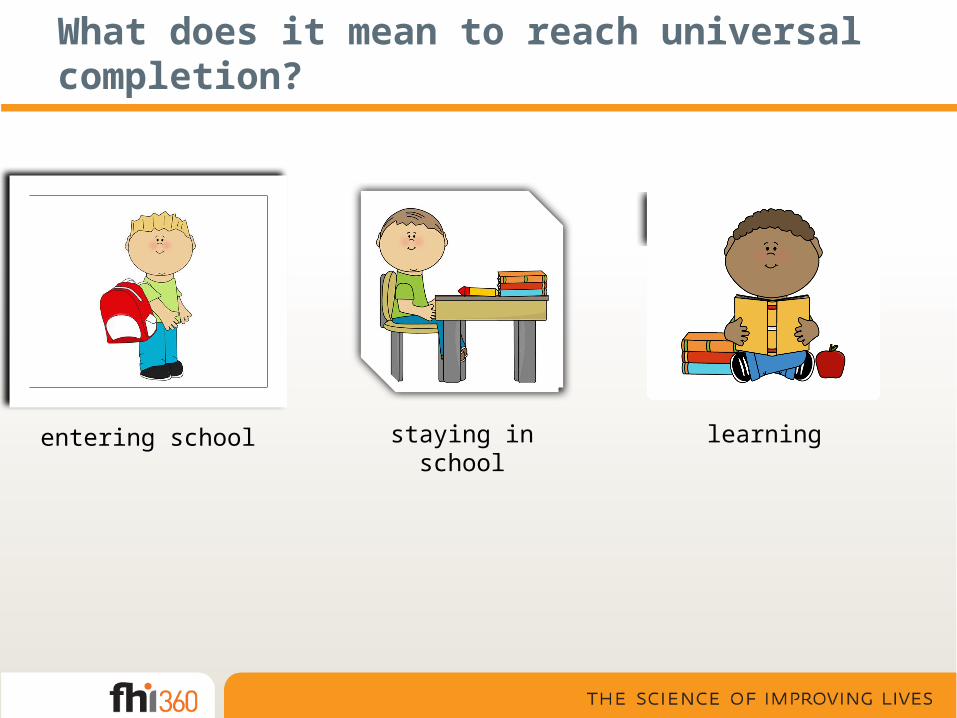
What does it mean to reach universal completion?
entering school staying in school learning
Research questions
Is universal completion within reach?
What are the cost implications of reaching this goal?
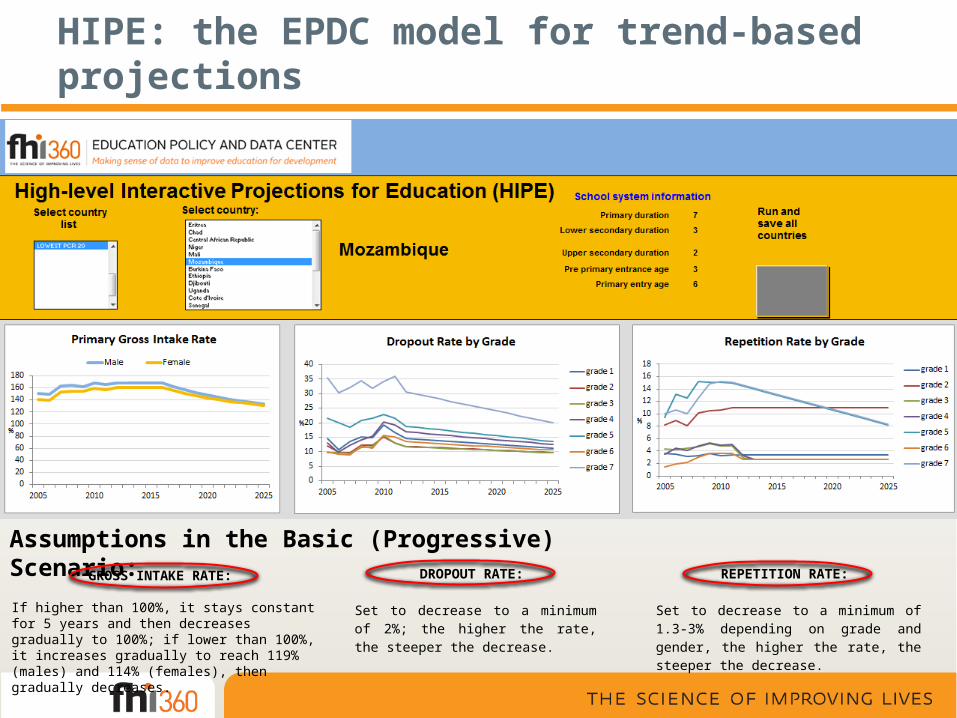
HIPE: the EPDC model for trend-based projections
GROSS INTAKE RATE:
If higher than 100%, it stays constant for 5 years and then decreases gradually to 100%; if lower than 100%, it increases gradually to reach 119% (males) and 114% (females), then gradually decreases.
DROPOUT RATE:
Set to decrease to a minimum of 2%; the higher the rate, the steeper the decrease.
REPETITION RATE:
Set to decrease to a minimum of 1.3-3% depending on grade and gender, the higher the rate, the steeper the decrease.
Assumptions in the Basic (Progressive) Scenario:
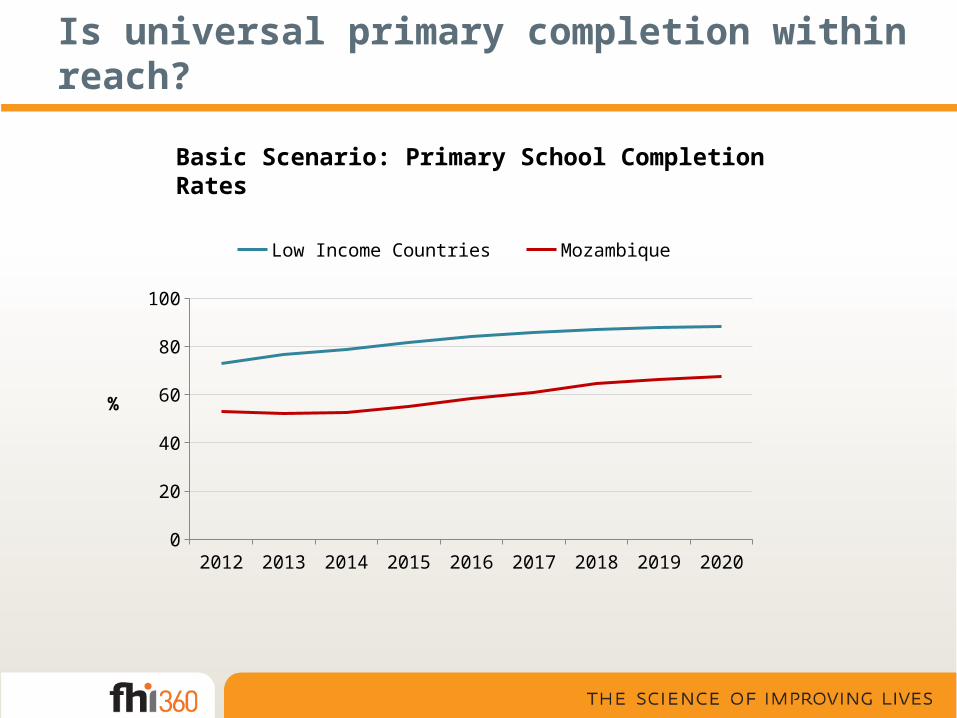
Is universal primary completion within reach?
Basic Scenario: Primary School Completion Rates
2012 2013 2014 2015 2016 2017 2018 2019 20200
20
40
60
80
100
Low Income Countries Mozambique
%
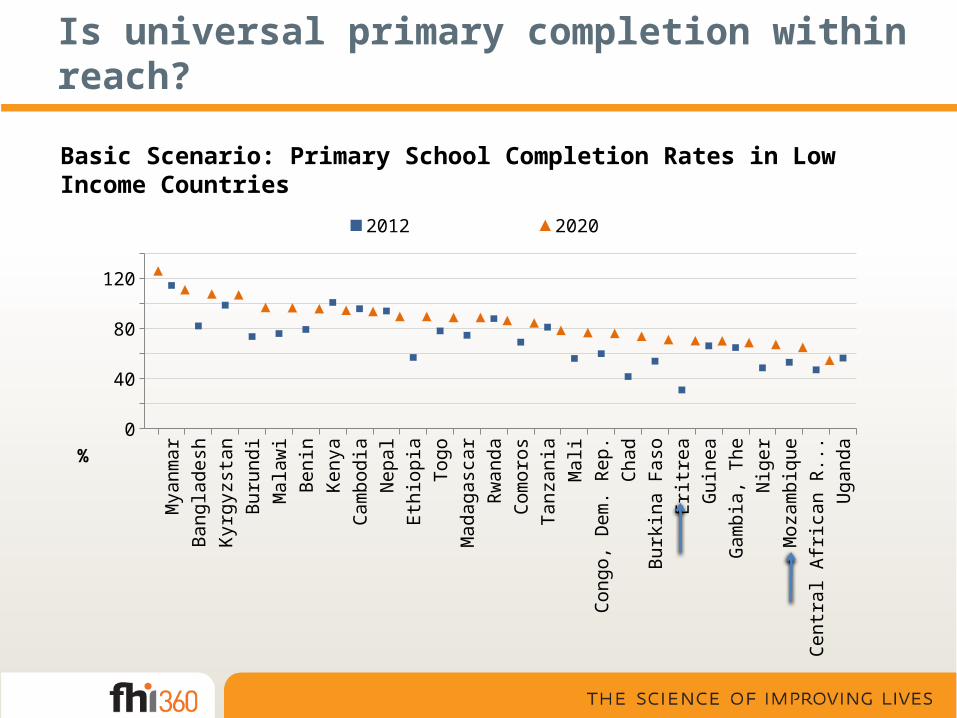
Is universal primary completion within reach?
Basic Scenario: Primary School Completion Rates in Low Income CountriesM
yanm
arBa
ngla
desh
Kyrg
yzst
anBu
rund
iM
alaw
iBe
nin
Keny
aCa
mbo
dia
Nep
alEt
hiop
iaTo
goM
adag
asca
rRw
anda
Com
oros
Tanz
ania
Mal
iCo
ngo,
Dem
. Rep
.Ch
adBu
rkin
a Fa
soEr
itrea
Gui
nea
Gam
bia,
The
Nig
erM
ozam
biqu
eCe
ntra
l Afr
ican
Rep
ublic
Uga
nda
020406080
100120140
2012 2020
%
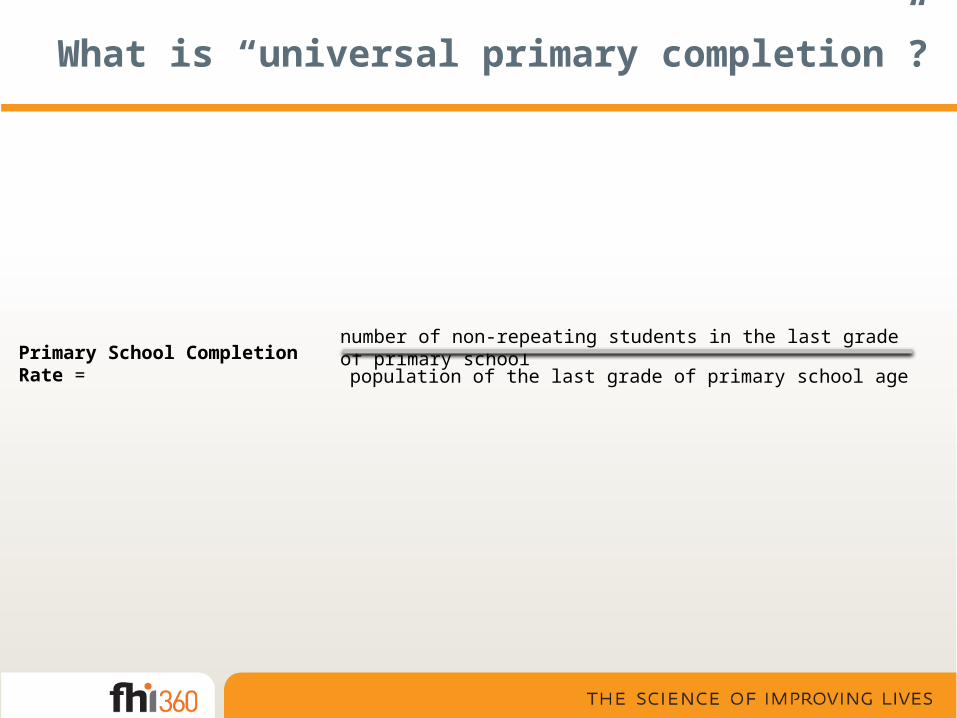
What is “universal primary completion”?
Primary School Completion Rate = number of non-repeating students in the last grade of primary school
population of the last grade of primary school age
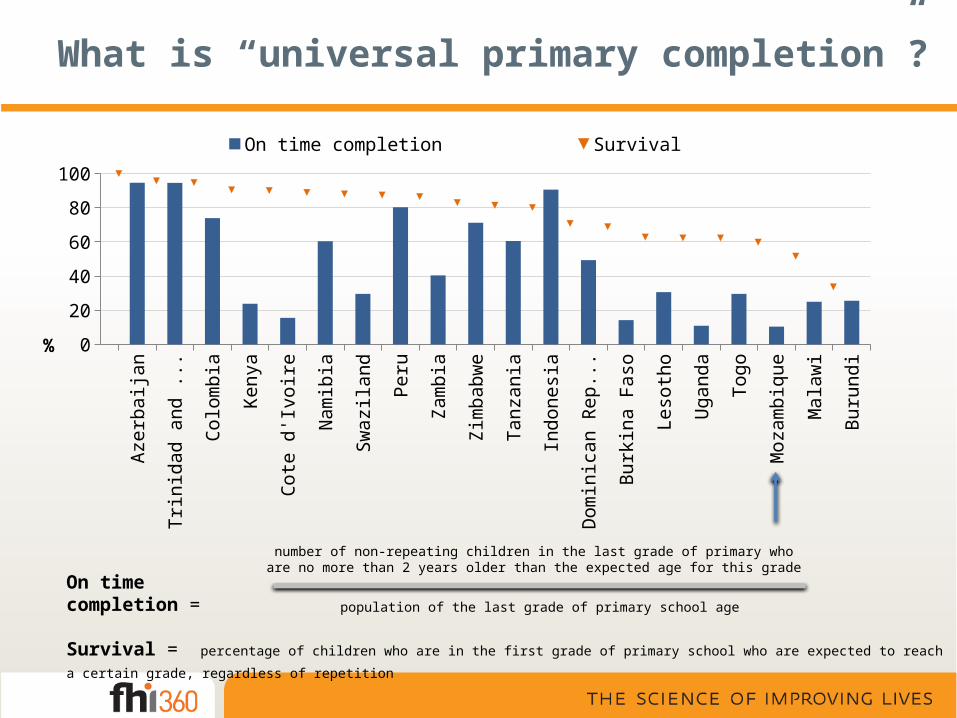
What is “universal primary completion”?
Azer
baija
n
Trin
idad
and
Tob
ago
Colo
mbi
a
Keny
a
Cote
d'Iv
oire
Nam
ibia
Swaz
iland
Peru
Zam
bia
Zim
babw
e
Tanz
ania
Indo
nesia
Dom
inic
an R
epub
lic
Burk
ina
Faso
Leso
tho
Uga
nda
Togo
Moz
ambi
que
Mal
awi
Buru
ndi0
20
40
60
80
100
On time completion Survival
%
On time completion =
number of non-repeating children in the last grade of primary who are no more than 2 years older than the expected age for this grade
population of the last grade of primary school age
Survival = percentage of children who are in the first grade of primary school who are expected to reach a certain grade, regardless of repetition
Do students learn more when they repeat?
Research shows that….
Repetition does not increase learning. Repeating students don’t usually progress more than they would have had they been promoted (Verspoor et al, 2005)
Repetition increases the risk of dropping out (Majgaard & Mingat, 2005; Wechtler et al, 2005)
Automatic promotion? Not necessarily, but reducing some very high repetition rates observed in certain developing countries should be considered.
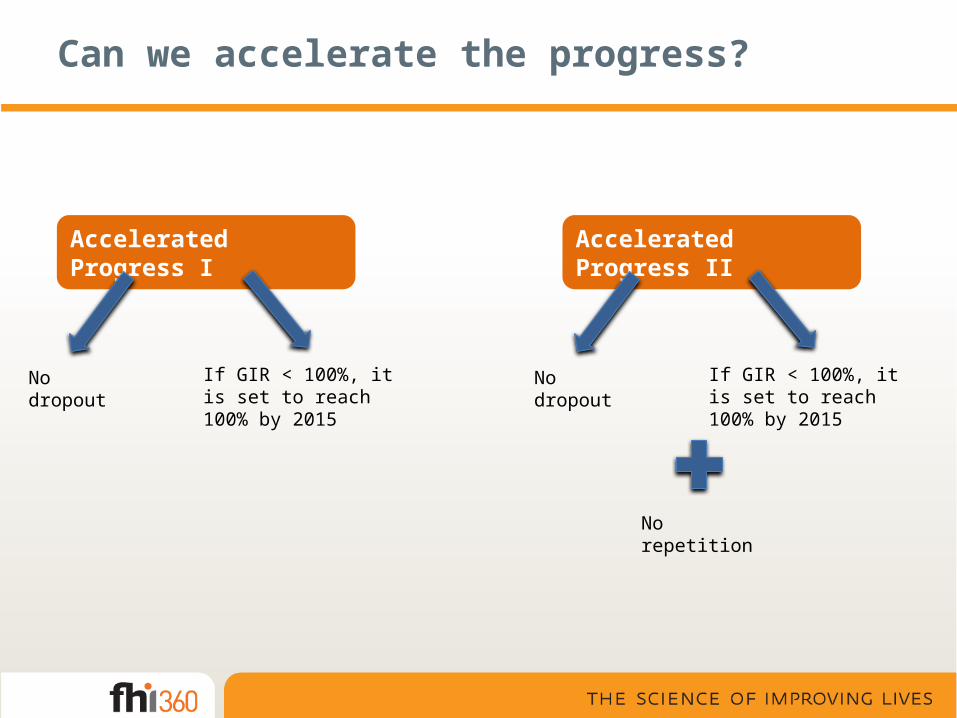
Can we accelerate the progress?
Accelerated Progress I
No dropout If GIR < 100%, it is set to reach 100% by 2015
Accelerated Progress II
No dropout If GIR < 100%, it is set to reach 100% by 2015
No repetition

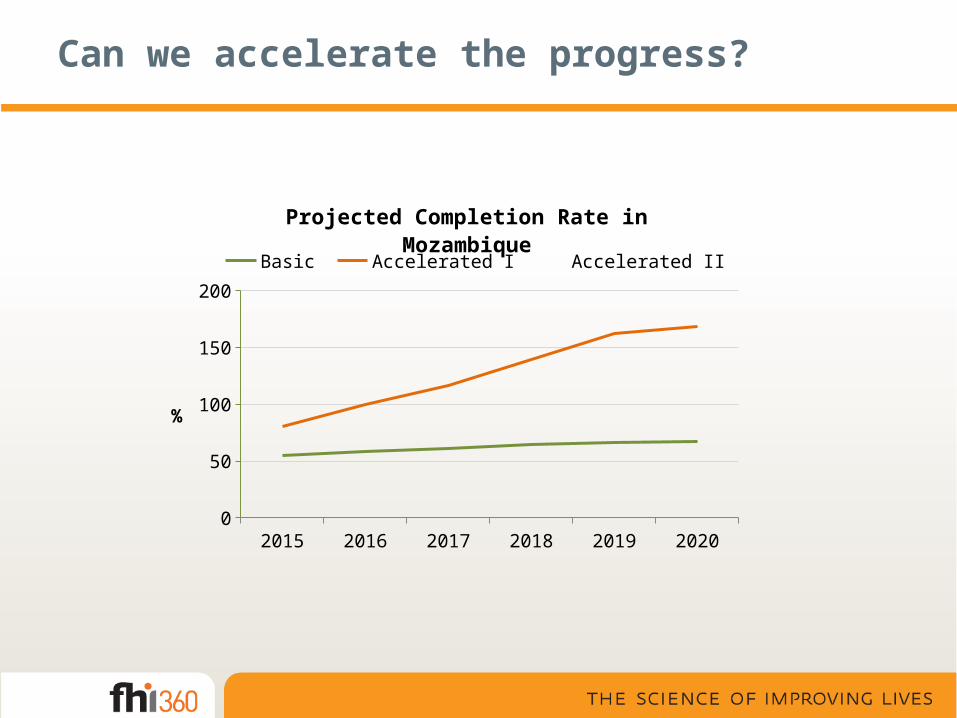
Can we accelerate the progress?
2015 2016 2017 2018 2019 20200
20406080
100120140160180200
Projected Completion Rate in Mozambique
Basic Accelerated I Accelerated II
%
Can we accelerate the progress?
2015 2016 2017 2018 2019 20200
20406080
100120140160180200
Projected Completion Rate in Mozambique
Basic Accelerated I Accelerated II
%
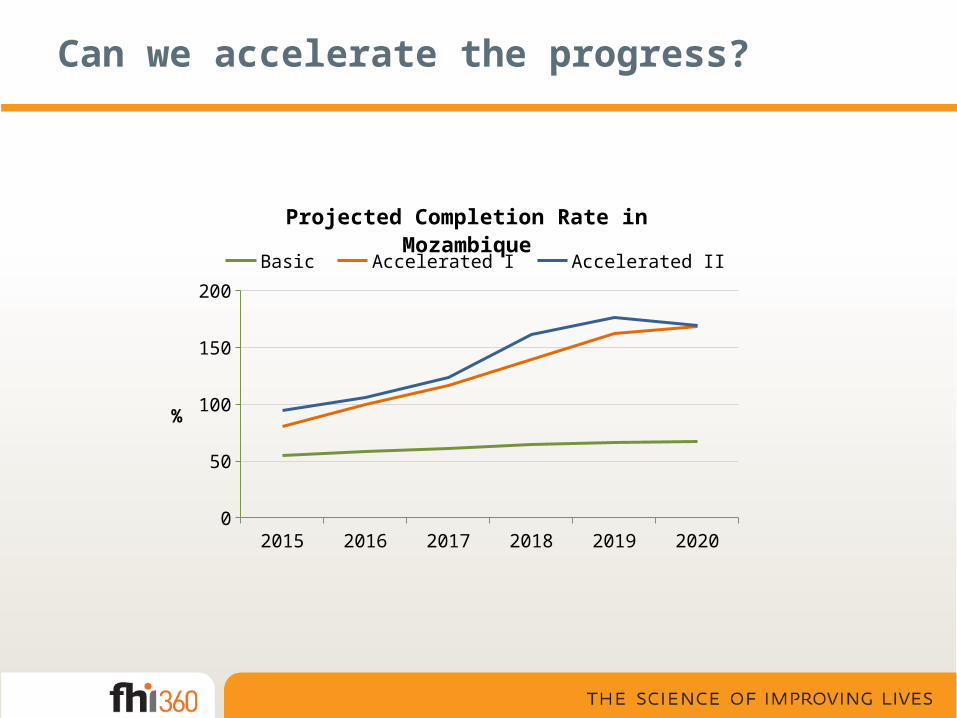
Can we accelerate the progress?
2015 2016 2017 2018 2019 20200
20406080
100120140160180200
Projected Completion Rate in Mozambique
Basic Accelerated I Accelerated II
%
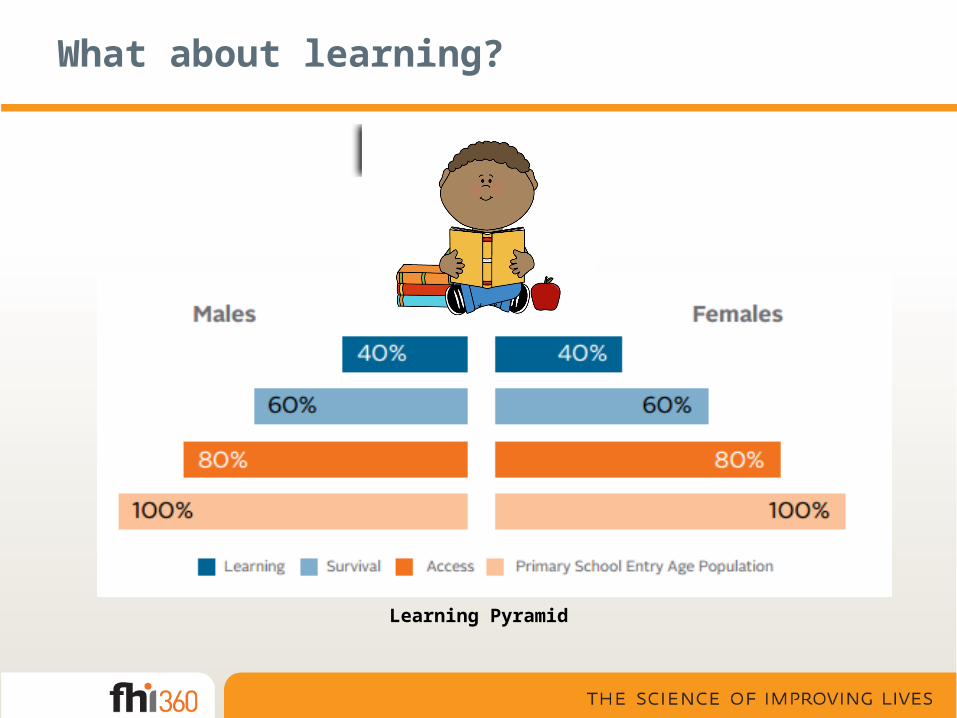
What about learning?
Learning Pyramid
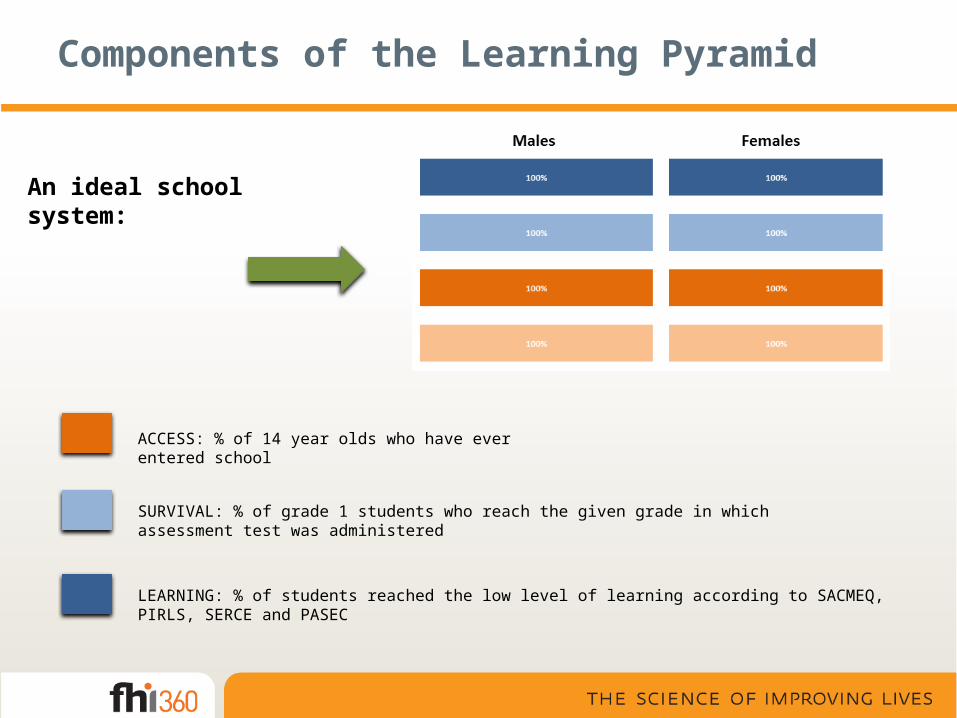
Components of the Learning Pyramid
An ideal school system:
ACCESS: % of 14 year olds who have ever entered school
SURVIVAL: % of grade 1 students who reach the given grade in which assessment test was administered
LEARNING: % of students reached the low level of learning according to SACMEQ, PIRLS, SERCE and PASEC
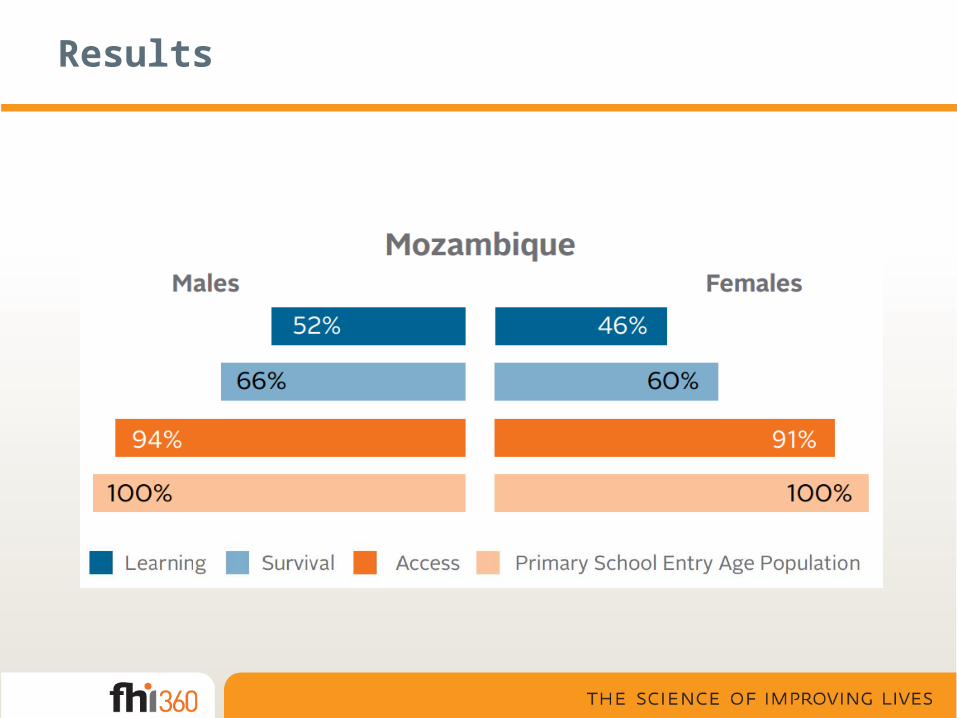
Results
What are the cost implications?
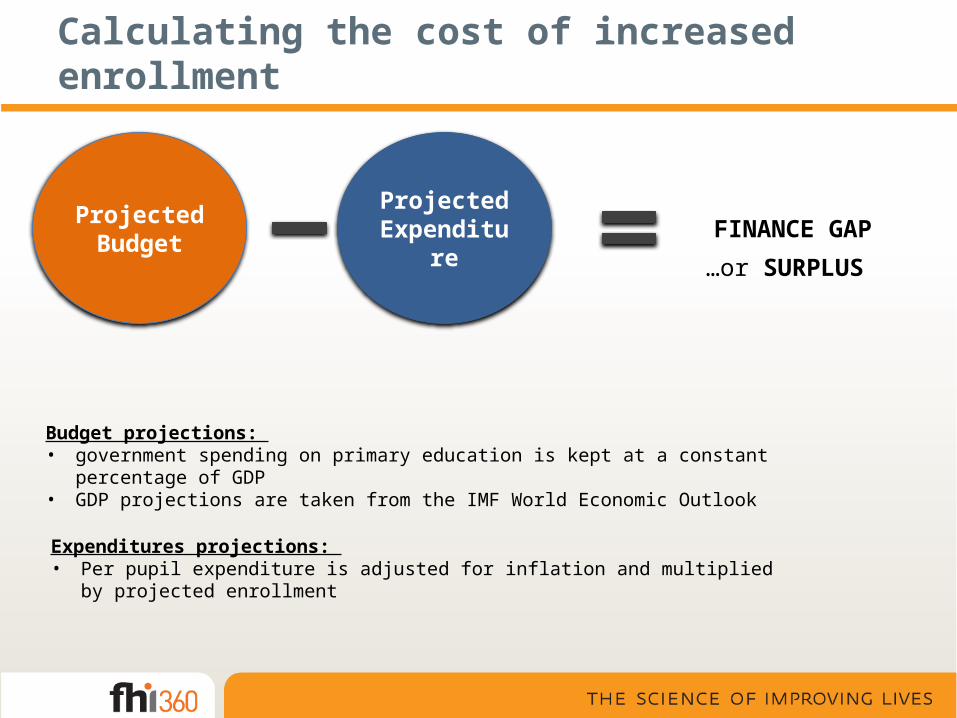
Calculating the cost of increased enrollment
Projected Expenditure
Projected Budget FINANCE GAP
…or SURPLUS
Budget projections: • government spending on primary education is kept at a constant percentage of GDP• GDP projections are taken from the IMF World Economic Outlook
Expenditures projections: • Per pupil expenditure is adjusted for inflation and multiplied by projected enrollment
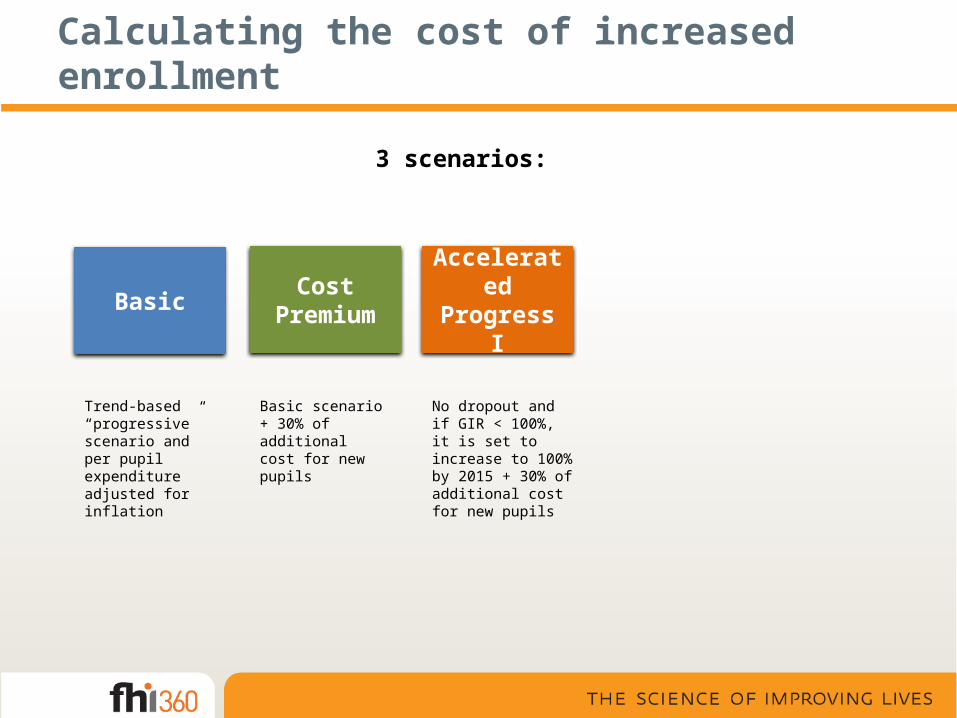
Calculating the cost of increased enrollment
3 scenarios:
BasicCost
PremiumAccelerated Progress I
Trend-based “progressive” scenario and per pupil expenditure adjusted for inflation
Basic scenario + 30% of additional cost for new pupils
No dropout and if GIR < 100%, it is set to increase to 100% by 2015 + 30% of additional cost for new pupils
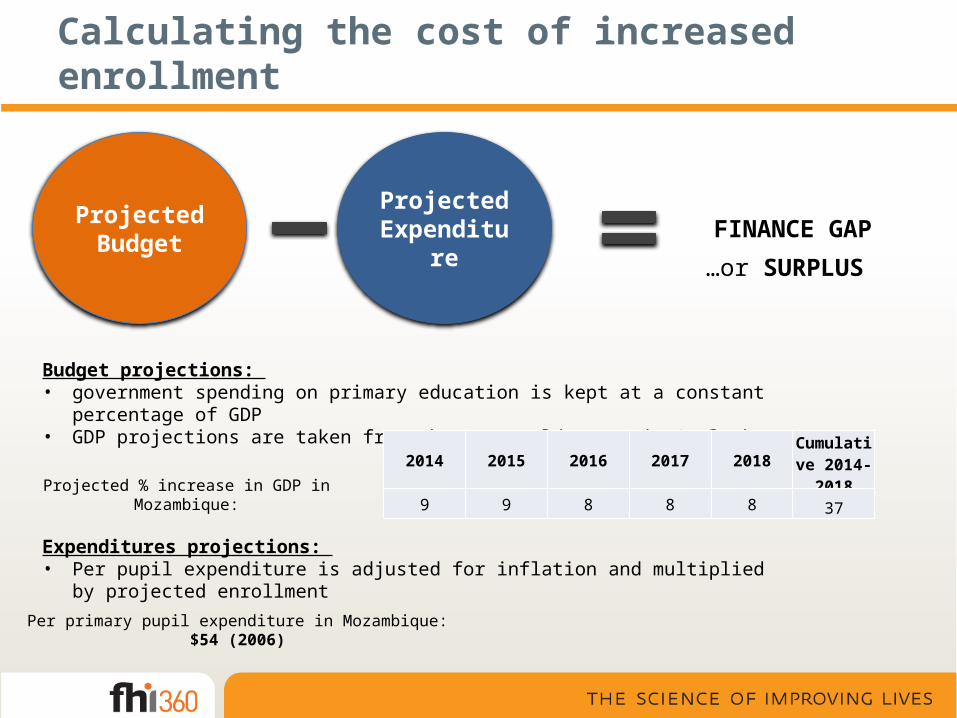
Calculating the cost of increased enrollment
Projected Expenditure
Projected Budget FINANCE GAP
…or SURPLUS
Budget projections: • government spending on primary education is kept at a constant percentage of GDP• GDP projections are taken from the IMF World Economic Outlook
Expenditures projections: • Per pupil expenditure is adjusted for inflation and multiplied by projected enrollment
2014 2015 2016 2017 2018 Cumulative 2014-2018
9 9 8 8 8 37Projected % increase in GDP in Mozambique:
Per primary pupil expenditure in Mozambique: $54 (2006)
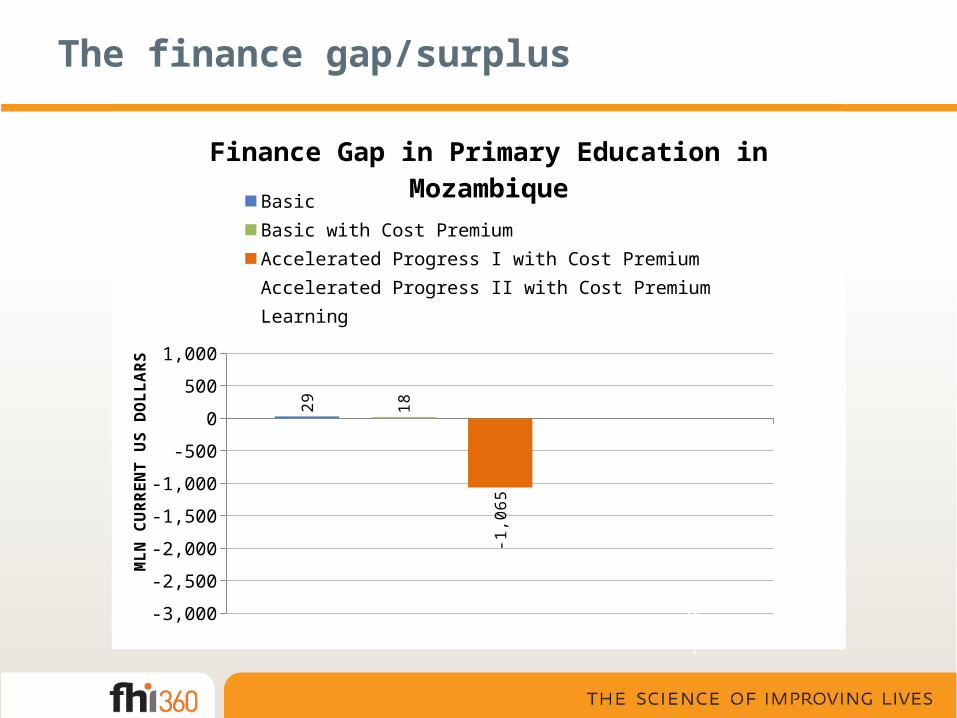
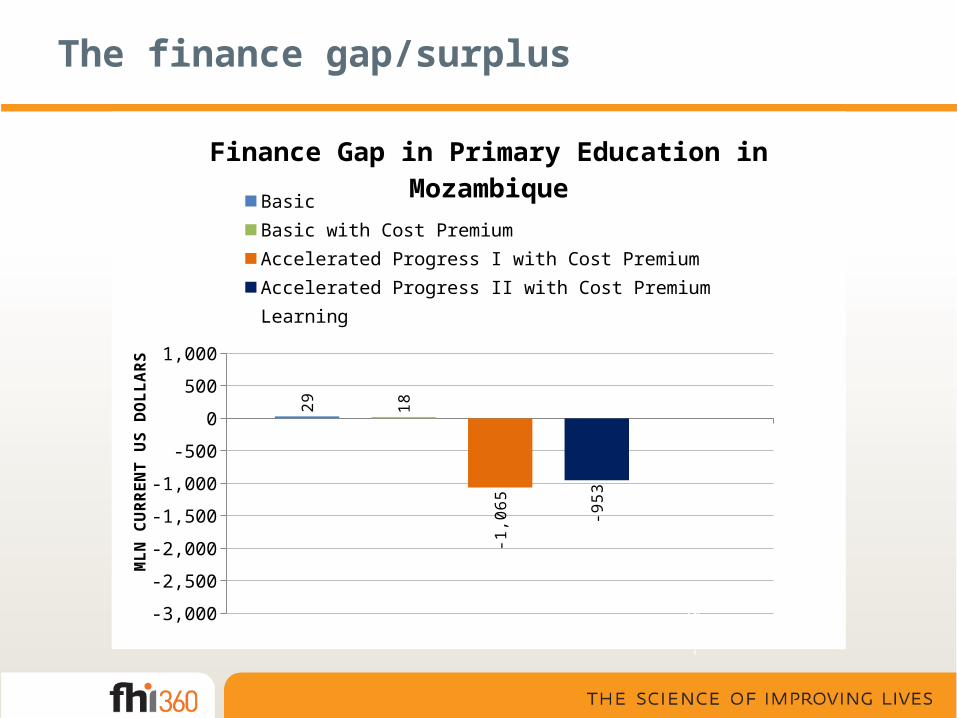
The finance gap/surplus
1
-3,000
-2,500
-2,000
-1,500
-1,000
-500
0
500
1,000
29 18
-1,0
65 -953
-2,7
09
Finance Gap in Primary Education in Mozambique
BasicBasic with Cost PremiumAccelerated Progress I with Cost PremiumAccelerated Progress II with Cost PremiumLearning
MLN
CU
RREN
T U
S D
OLL
ARS

Calculating the cost of increased enrollment
4 scenarios:
BasicCost
PremiumAccelerated Progress I
Accelerated Progress II
Accelerated Progress I + no repetition
Trend-based “progressive” scenario and per pupil expenditure adjusted for inflation
Basic scenario + 30% of additional cost for new pupils
No dropout and if GIR < 100%, it is set to increase to 100% by 2015 + 30% of additional cost for new pupils

The finance gap/surplus
1
-3,000
-2,500
-2,000
-1,500
-1,000
-500
0
500
1,000
29 18
-1,0
65 -953
-2,7
09
Finance Gap in Primary Education in Mozambique
BasicBasic with Cost PremiumAccelerated Progress I with Cost PremiumAccelerated Progress II with Cost PremiumLearning
MLN
CU
RREN
T U
S D
OLL
ARS
The finance gap/surplus
1
-3,000
-2,500
-2,000
-1,500
-1,000
-500
0
500
1,000
29 18
-1,0
65 -953
-2,7
09
Finance Gap in Primary Education in Mozambique
BasicBasic with Cost PremiumAccelerated Progress I with Cost PremiumAccelerated Progress II with Cost PremiumLearning
MLN
CU
RREN
T U
S D
OLL
ARS

The cost of repetition
Scenario 1Scenario
2
Rate in each grade of primary school 10% 20%
Number of children entering grade 1 1,000,000 1,000,000
Survival to grade 5 100% 100%
Number of students reaching grade 5 within 10 years 999,936 996,934
Per pupil expenditure per year ($) $100 $100
Cost of educating these students ($Millions) $544 $597
Cost of Educating These Students without REPETITION ($ Million) $500 $498
DIFFERENCE ($ Millions) $44 $98
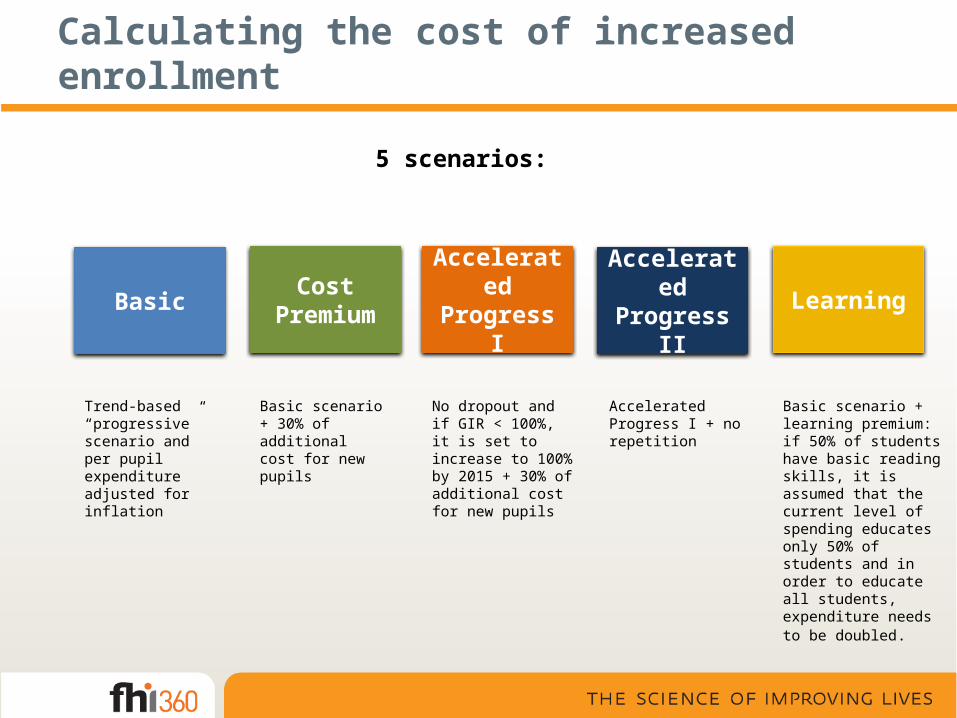
Calculating the cost of increased enrollment
5 scenarios:
BasicCost
PremiumAccelerated Progress I
Accelerated Progress II
Accelerated Progress I + no repetition
Learning
Basic scenario + learning premium: if 50% of students have basic reading skills, it is assumed that the current level of spending educates only 50% of students and in order to educate all students, expenditure needs to be doubled.
Trend-based “progressive” scenario and per pupil expenditure adjusted for inflation
Basic scenario + 30% of additional cost for new pupils
No dropout and if GIR < 100%, it is set to increase to 100% by 2015 + 30% of additional cost for new pupils

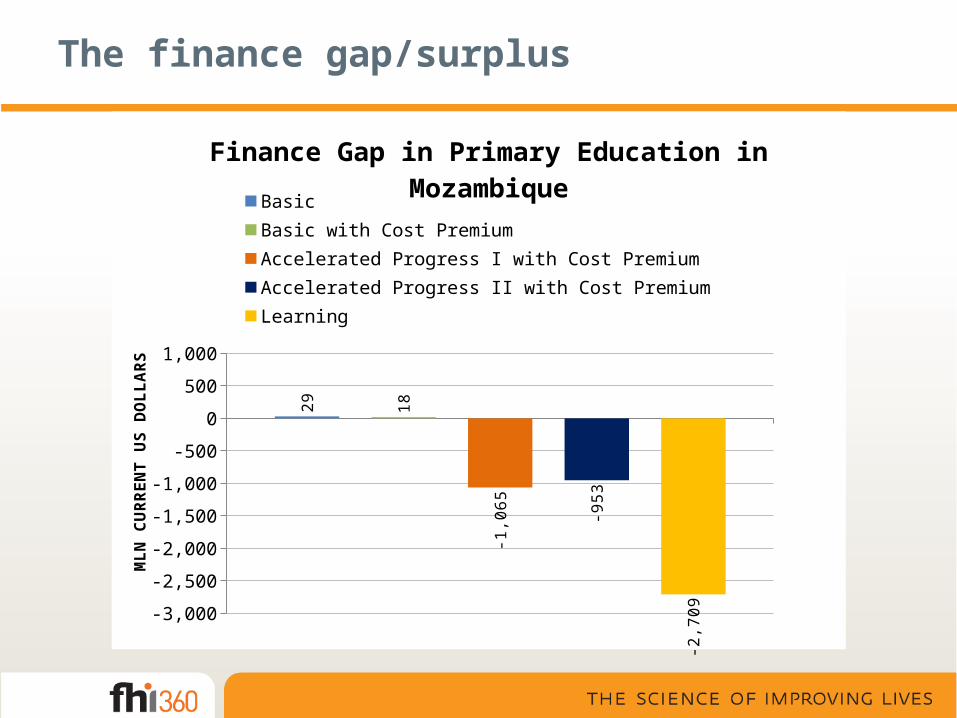
The finance gap/surplus
1
-3,000
-2,500
-2,000
-1,500
-1,000
-500
0
500
1,000
29 18
-1,0
65 -953
-2,7
09
Finance Gap in Primary Education in Mozambique
BasicBasic with Cost PremiumAccelerated Progress I with Cost PremiumAccelerated Progress II with Cost PremiumLearning
MLN
CU
RREN
T U
S D
OLL
ARS
The finance gap/surplus
1
-3,000
-2,500
-2,000
-1,500
-1,000
-500
0
500
1,000
29 18
-1,0
65 -953
-2,7
09
Finance Gap in Primary Education in Mozambique
BasicBasic with Cost PremiumAccelerated Progress I with Cost PremiumAccelerated Progress II with Cost PremiumLearning
MLN
CU
RREN
T U
S D
OLL
ARS
Does more $ really increase learning?
Not necessarily.
Studies show that “more of the same” does not lead to increased levels of student achievement (J-PAL, http://www.povertyactionlab.org). Countries that spend more do not always produce better learning outcomes.
Resources are necessary but they do not guarantee improved learning.
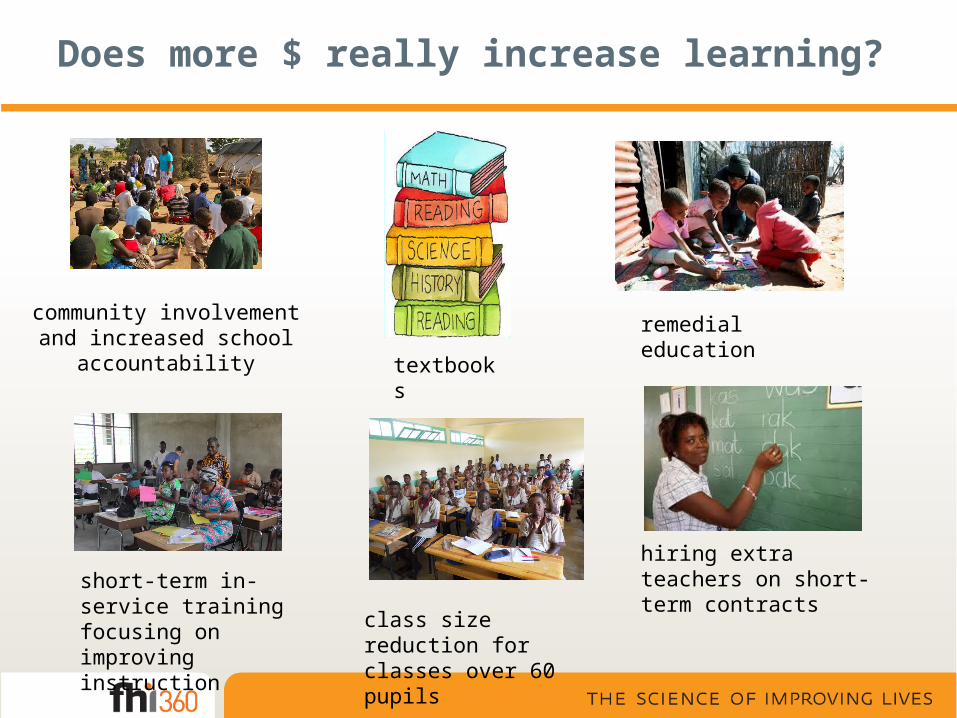
Does more $ really increase learning?
textbooks
community involvement and increased school accountability
short-term in-service training focusing on improving instruction
class size reduction for classes over 60 pupils
remedial education
hiring extra teachers on short-term contracts

Does more $ really increase learning?
Randomized evaluations don’t always confirm findings that come out of retrospective studies (Kremer, 2003).
The main challenge: controlling for a number of hard to measure variables, such as student innate ability and motivation, teacher quality, or parents’ preference for child attending school (Glewwe & Kremer, 2005)
Conclusions
Many countries are still far from reaching universal primary completion and approaching this goal even by 2020 would require unrealistic reductions in dropout and repetition
Getting children to school may be financially plausible in many developing countries but ensuring sufficient resources to enable learning will be a big challenge
Simply adding more resources does not increase learning – it is most important how these resources are transformed into effective policy interventions
Measuring student learning and continuously evaluating various approaches is essential to developing cost efficient ways to increase the quality of education


![A. L. Dawn French Director NEMO/Saint Lucia BSc [ Hons ], MA [EPDC], PgD [RCDM]](https://img.pdfslide.net/doc/110x75/5681531b550346895dc13f68/a-l-dawn-french-director-nemosaint-lucia-bsc-hons-ma-epdc-pgd-rcdm.jpg)


