Embed Size (px)
Citation preview
U.S
. Arm
y Co
rps o
f Eng
ineers - Civil W
orks Fund
a
U.S. Army Corps of Engineers - Civil Works
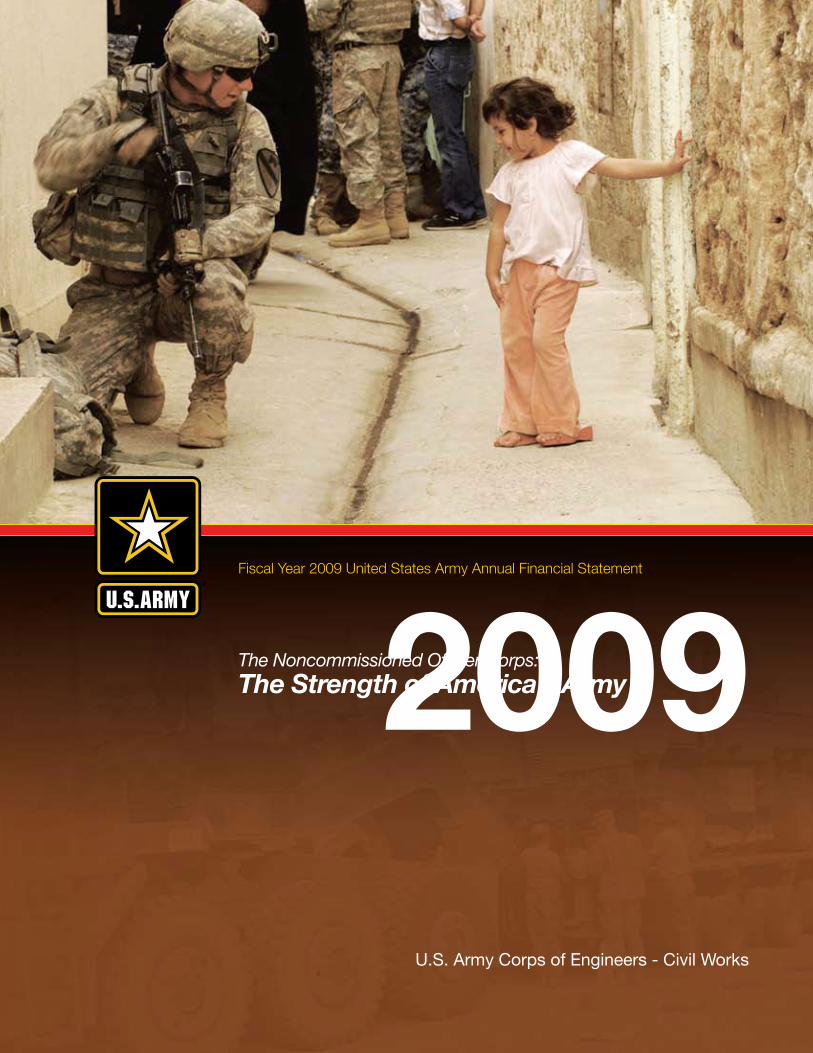
2009Fiscal Year 2009 United States Army Annual Financial Statement
The Noncommissioned Officer Corps:The Strength of America’s Army

ON THE COVER: A Soldier demonstrates to an Iraqi child how to properly take a knee during Operation Warhorse Scimitar in west Mosul. The child was running up and down this alleyway giving high fives to Soldiers.
*Unless otherwise noted, all photos on the cover and inside pages are courtesy of the U.S. Army. (www.army.mil)
The Florida Everglades
Since 1775, the Army has set apart its NCOs from other enlisted Soldiers by distinctive insignia of grade.
With more than 200 years of service, the U.S. Army’s Noncommissioned Officer (NCO) Corps has distinguished itself as the worlds most accomplished group of military professionals. Historical and daily accounts of life as an NCO are
exemplified by acts of courage, and a dedication and a willingness to do whatever it takes to complete the mission. NCOs have been celebrated for decorated service
in military events ranging from Valley Forge to Gettysburg, to charges on Omaha Beach and battles along the Ho Chi Minh Trail, to current conflicts in Afghanistan
and Iraq.
In recognition of their commitment to service and willingness to make great sacrifices on behalf of our nation, the Secretary of the Army established
2009 as the Year of the NCO.
FY 2009 Contents
Message from the Assistant Secretary of the Army (Civil Works) iii
Message from the USACE Chief Financial Officer v
Management’s Discussion & Analysis 1
Civil Works Fund – Principal Financial Statements, Notes, Supplementary Information and Auditor’s Report 33

ii Fiscal Year 2009 United States Army Annual Civil Works Financial Statement
Our NCO Corps is unrivaled by any Army
in the world, envied by our allies and
feared by our enemies. Throughout the
Army’s history, the NCO has been a pivotal
figure, but never more so than today with
our full spectrum of operations...
the “backbone of our Army.”
Kenneth O. Preston, Sergeant Major of the Army

Messag
es
iii
November 24, 2009
Since their support of our military forces at Bunker Hill and during the Revolutionary War, the role and responsibilities of the Army Corps of Engineers over time have evolved to reflect America’s changing priorities. Through its Civil Works, military, contingency, and reimbursable support for others missions, the Corps’ engineering and construction expertise today serves the nation both at home and in over one hundred countries throughout the world.
As society’s requirements and values have changed, the Army Civil Works mission has reflected those changing national priorities for public water resources management. The Civil Works program supports the President’s commitment to the goals of revitalizing infrastructure, restoring the environment, and reducing dependence on foreign, non-renewable energy sources. Corps projects and programs enhance the environment; address the risks inherent in aging water resources infrastructure through dam and levee safety programs; advance flood risk reduction and management in cooperation with other federal, state, and local agencies; invest in inland and coastal navigation to ensure that the nation remains competitive in international commerce; invest in hydropower, a clean, renewable, domestic energy source; and respond to a myriad
of comprehensive water-related problems and opportunities facing the nation, including climate change.
The Army’s high priority goals for the Civil Works program are these: to provide sustainable development, restoration, and protection of the Nation’s water resources by restoring degraded habitat and achieving no net loss of wetlands; to reduce the nation’s risk of flooding that places individuals at risk of injury or loss of life and damages property and the environment; to improve Inland Marine Transportation System (IMTS) reliability; and to generate 140 billion kilowatt-hours of hydroelectric power in the next two years.
The Corps’ $3.4 billion in Civil Works supplemental fund execution in FY 2009 represents significant progress not only in the upgrade of the New Orleans perimeter protection, but also in the restoration to a safe and functional level of a large number of other storm-damaged projects in the mid-west, Gulf coast and Mississippi-Ohio valleys. In addition to executing these supplemental appropriations and $5.1 billion for its regular program, this year the Corps Civil Works program received $4.6 billion under the American Recovery and Reinvestment Act, and executed $2.2 billion in FY 2009, creating or maintaining an estimated 58,000 jobs.
This unprecedented level of program execution was made possible by the use of innovative acquisition methods, by advance planning with key contractor groups, and most of all by the dedication and commitment of the Corps team.
Jo-Ellen Darcy Assistant Secretary of the Army (Civil Works)

iv Fiscal Year 2009 United States Army Annual Civil Works Financial Statement
“We have magnificent Soldiers, leaders and
civilians. They are ordinary people who are
doing extraordinary things for our country.”
General George Casey, Chief of Staff of the Army

Messag
es
v
November 24, 2009
Last year I began by noting that we received our first unqualified clean audit opinion in fiscal year FY 2008 and that this news had permeated the U.S. Army Corps of Engineers (USACE) financial management community with a joyous sense of purpose and optimism. During FY 2009, the USACE financial community worked even harder to build on that success, made steady progress, and demonstrated commitment to improve management controls. I am proud that everyone at USACE assisted in laying the groundwork for sustained excellence.
FY 2009 was historic with over $14B obligated. USACE was a major player in American Recovery and Reinvestment Act with an additional $2.8B in direct appropriations and another $166M in reimbursable work. This annual financial report provides our performance in delivering the Civil Works mission for FY 2009 and our financial position.
I am proud to report that USACE received another unqualified opinion on its FY 2009 financial statements. Our commitment to provide transparency and accountability in budget and financial management remains priority number one.
Wesley C. MillerUSACE Chief Financial Officer

vi Fiscal Year 2009 United States Army Annual Financial Statement
Army NCOs trace their roots to the beginnings of American military history. They
helped Washington preserve the Continental Army at Valley Forge, stood with Winfield
Scott at Chippewa, and directed Zachary Taylor’s guns at Palo Alto. They carried the
Nation’s colors at Gettysburg and Vicksburg, fought yellow fever in Cuba with Walter
Reed, and led Pershing’s and Eisenhower’s legions into Germany. Whether helping
local populations build a village in Southeast Asia or teaching young Iraqi soldiers
to conduct operations, American NCOs are leading from the front and are some of
our nation’s best ambassadors. Over time, through various changes in tactics and
technology, Army NCOs have emerged as the Army’s small–unit leaders, trainers,
and guardians of standards.
TM
U.S
. Arm
y Co
rps o
f Eng
ineers - Civil W
orks Fund
vii
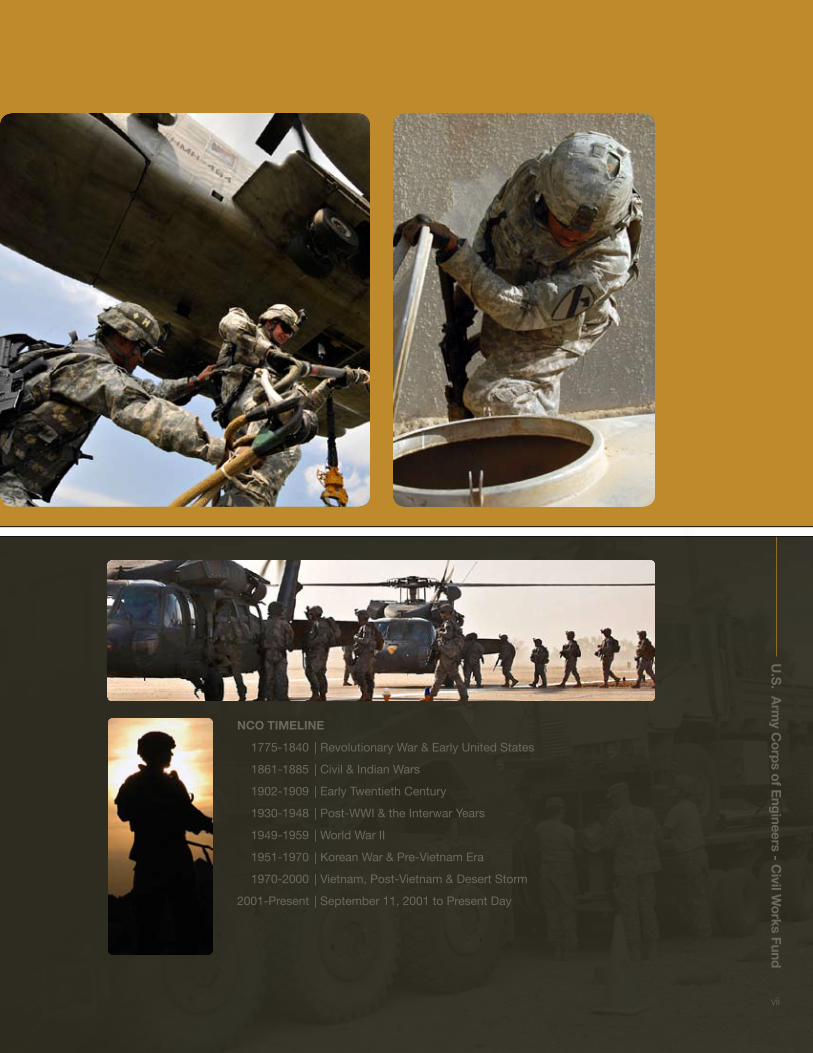
NCO TIMELINE
1775-1840 | Revolutionary War & Early United States
1861-1885 | Civil & Indian Wars
1902-1909 | Early Twentieth Century
1930-1948 | Post-WWI & the Interwar Years
1949-1959 | World War II
1951-1970 | Korean War & Pre-Vietnam Era
1970-2000 | Vietnam, Post-Vietnam & Desert Storm
2001-Present | September 11, 2001 to Present Day
viii Fiscal Year 2009 United States Army Annual Civil Works Financial Statement
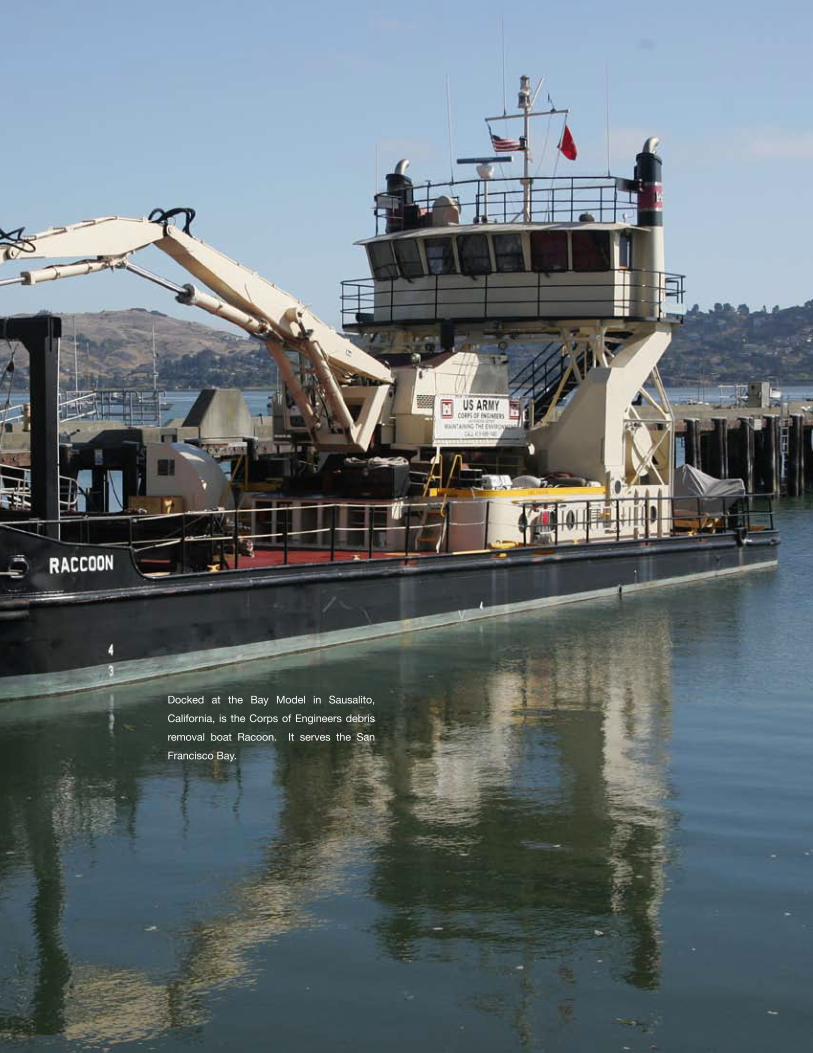
Docked at the Bay Model in Sausalito,
California, is the Corps of Engineers debris
removal boat Racoon. It serves the San
Francisco Bay.
U.S
. Arm
y Co
rps o
f Eng
ineers - Civil W
orks Fund
1
Overview
Mission
The civil works mission of the United States Army Corps of Engineers (USACE) is 1) to contribute to the national welfare and serve the nation with quality, responsive development and management of the nation’s water resources; 2) protect, restore and manage the environment; 3) respond to disasters and aid in recovery; and 4) provide engineering and technical services. This multi-faceted mission is accomplished in an environmentally sustainable, economically- and technically-sound manner through partnerships with other government agencies and nongovernment organizations.
Developing and Managing Water Resources
The original role of the USACE in civil works, as it related to developing and managing water resources, was to support navigation by maintaining and improving federal navigation channels. Over the years, and through subsequent legislation, the Corps’ role has expanded to include flood risk management, improvement of aquatic habitat, generation of hydroelectric power, creation of recreation opportunities, provision of water storage for municipal and industrial water supplies, regulation of discharges into navigable waters, and emergency planning and management.
Protecting, Restoring and Managing the Environment
The Rivers and Harbors Act of 1890 required the Corps to prevent the obstruction of navigable waterways. As environmental concerns grew in the late 20th century, the National Environmental Policy Act of 1969 and the Clean Water Act of 1972 greatly broadened the scope of the Corps’ responsibility for regulating discharges into U.S. waters, including the country’s wetlands. The civil works program’s environmental responsibilities have continued to increase through legislation and now include aquatic ecosystem restoration, remedial activities at former defense sites, and overall stewardship responsibilities.
Responding and Assisting in Disaster Relief
Throughout the Corps’ history, the United States has relied on the civil works program for help both in times of natural and man-made disasters. The Corps responds to natural disasters under the Flood Control and Coastal Emergency Act (Public Law 84-99, as amended), and to man-made disasters under the Robert T. Stafford Disaster Relief and
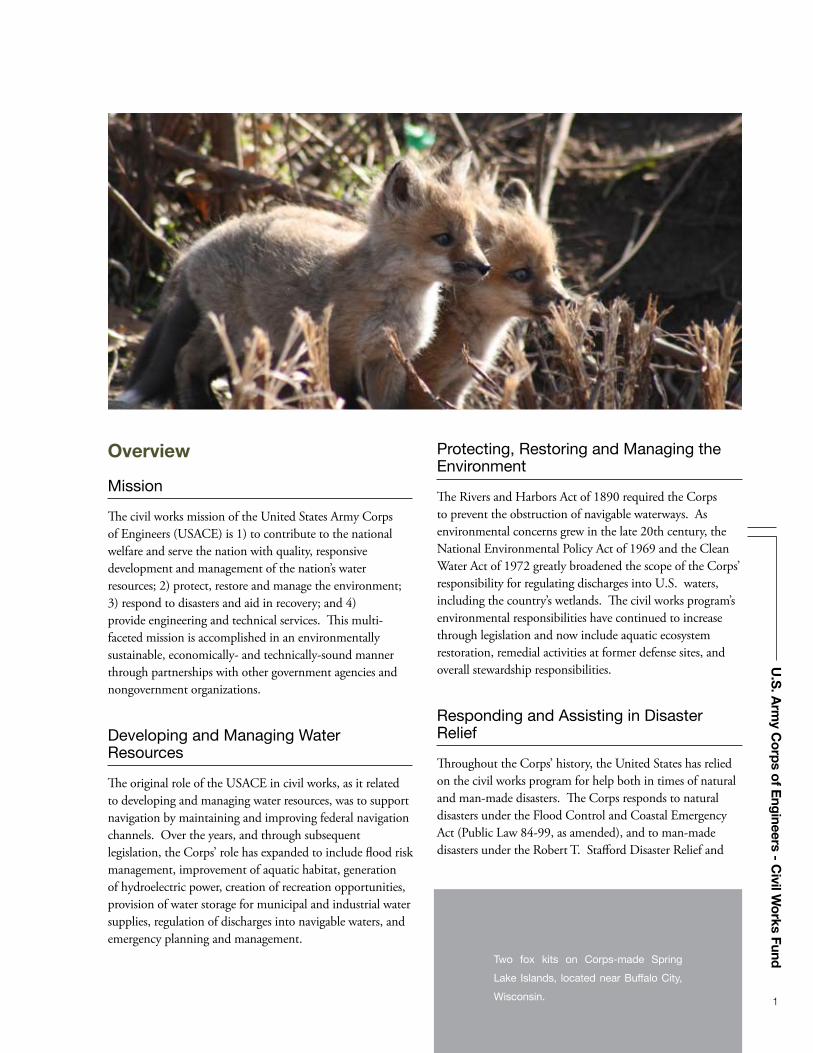
Two fox kits on Corps-made Spring
Lake Islands, located near Buffalo City,
Wisconsin.

2 Fiscal Year 2009 United States Army Annual Civil Works Financial Statement
Emergency Assistance Act (PL 93-288, as amended). The civil works program’s primary role in emergency relief and recovery operations is to provide public works and engineering support.
Providing Engineering Support and Technical Services
In Titles 10 and 33 of the U.S. Code, Congress expresses its intent for the Corps to provide services on a reimbursable basis to other federal entities; state, local and tribal governments; private firms; and international organizations. Additional authority to provide services to all federal agencies is found in Titles 15, 22 and 31, which includes providing services to foreign governments.
Civil Works ProgramsThe Corps operates multiple programs to accomplish its mission. Each program specifically addresses a single mission component, but may also contribute to one or more other program missions. Figure 1 lists the programs
that receive direct appropriations, and the funds used for executive direction and management of those programs.
Through the American Recovery and Reinvestment Act of 2009 (ARRA), the Corps received $4.6 billion for its civil works programs. All of the Corps’ business lines, except emergency management, have, or are designated to receive, ARRA funding for various programs, projects, and activities. Specific information on ARRA funding may be found at the Corps’ Recovery Web site at http://usace.army.mil/recovery.
Navigation
The navigation program is responsible for ensuring safe, reliable, efficient, and environmentally sustainable waterborne transportation systems for the movement of commercial goods as well as for national security needs. The program meets this responsibility through a combination of capital improvements and the operation and maintenance of existing infrastructure projects. The navigation program is vital to the nation’s economic prosperity: 95 percent of America’s overseas international trade moves through its ports. Our nation’s marine transportation system
Figure 1. FY 2009 Civil Works’ Initial Appropriation by Business Line(Amounts in millions)
NavigationFlood Risk ManagementHydropowerRegulatoryEnvironment-Ecosystem RestorationEnvironment-StewardshipEnvironment-FUSRAPEmergency ManagementRecreationWater SupplyExecutive Direction and Management
$1,892
$1,579
$140
$320
$277$6
$517
$97
$184
$16
$183
Note: An additional $191 million (3.8 percent of the total appropriation) was received for environmental infrastructure projects, which are neither budgeted nor associated with any business line. This brings the total initial appropriation to $5,402 million.
U.S
. Arm
y Co
rps o
f Eng
ineers - Civil W
orks Fund
3
(MTS) encompasses a network of Corps-maintained navigable channels, waterways, and infrastructure as well as publicly- and privately-owned vessels, marine terminals, intermodal connections, shipyards, and repair facilities. The MTS consists of approximately 12,000 miles of inland and intracoastal waterways; approximately 13,000 miles of coastal, Great Lakes and inland harbors; and channel projects maintained by the Corps.
This program, estimated at $1.9 billion, accounted for 35 percent of civil works initial appropriations in FY 2009.
Flood Risk Management
The flood risk management program reduces the risk to human safety and property damage in the event of floods and coastal storms. The civil works program has constructed 8,500 miles of levees and dikes, 383 reservoirs, and more than 90 storm damage reduction projects along 240 miles of the nation’s 2,700 miles of shoreline. Upon completion, with the exception of reservoirs, most infrastructure built under this program is transferred to the sponsoring cities, towns, and special use districts that own and operate the projects.
Over the years, the Corps’ mission of addressing the causes and impacts of flooding has evolved from flood control and prevention to more comprehensive flood risk management. These changes reflect a greater appreciation
for the complexity and dynamics of flood problems—the interaction of natural forces and human development—as well as for the federal, state, local, and individual partnerships needed to thoroughly manage the risks caused by coastal storms and heavy rains.
Risk management is the process of identifying, evaluating, selecting, implementing, and monitoring actions to mitigate levels of risk. Its goal is to ensure scientifically sound, cost-effective, integrated actions that reduce risks while taking into account social, cultural, environmental, ethical, political, and legal considerations. The Corps’ approach to flood risk management relies on productive collaborations with partners and stakeholders, i.e., the Federal Emergency Management Agency, the Department of Housing and Urban Development, the National Oceanic and Atmospheric Administration, affected state agencies, sponsors and citizens. Effectively and efficiently, these collaborations heighten the nation’s awareness of flood risks and consequences.
The flood risk management program has compiled an impressive record of performance, yielding a six-to-one return on investment; that is, the program saves six dollars
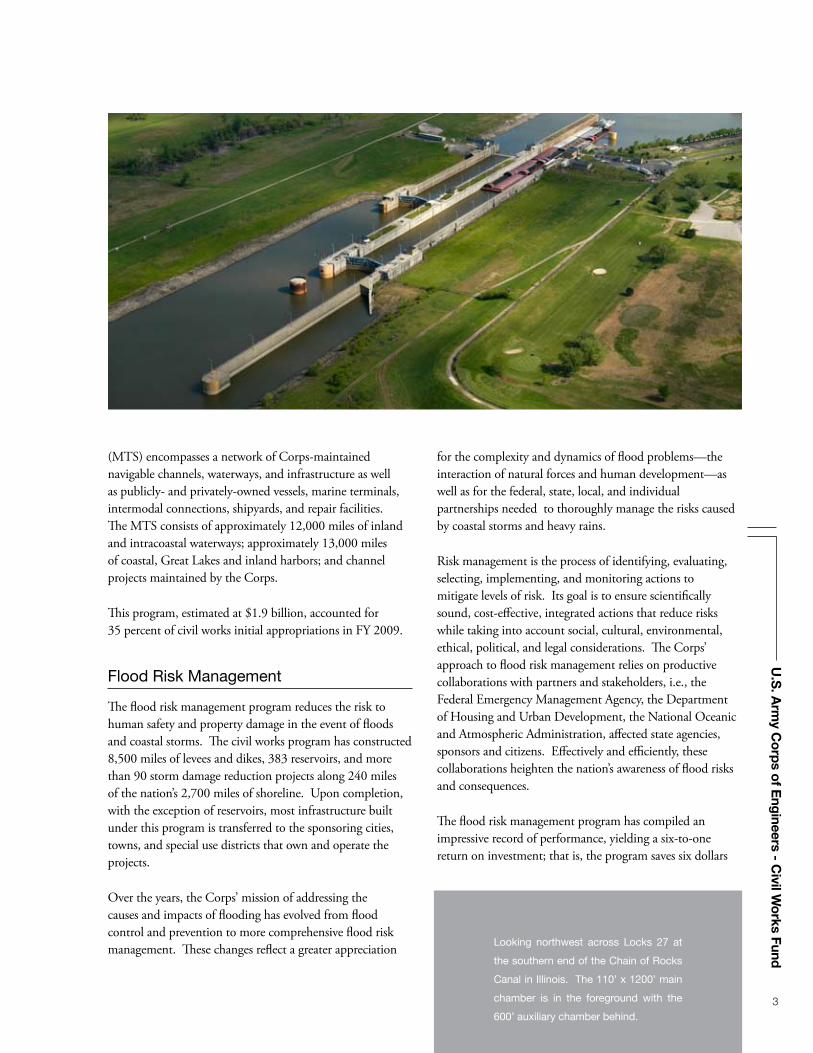
Looking northwest across Locks 27 at
the southern end of the Chain of Rocks
Canal in Illinois. The 110’ x 1200’ main
chamber is in the foreground with the
600’ auxiliary chamber behind.

4 Fiscal Year 2009 United States Army Annual Civil Works Financial Statement
for each dollar spent. The program also has helped reduce the risk to human safety by providing timely flood warnings that afford sufficient time for evacuation.
In FY 2009, this $1,579 million program accounted for slightly more than 29 percent of civil works appropriations.
Environment
The Corps has three distinct programs that are focused on the environment: aquatic ecosystem restoration; stewardship of Corps’ lands; and the Formerly Utilized Sites Remedial Action Program (FUSRAP).
Aquatic Ecosystem Restoration. The Army’s mission in aquatic ecosystem restoration is to help restore aquatic habitat to a more natural condition in ecosystems whose structures, functions and dynamic processes have become degraded. The emphasis is on restoration of nationally- or regionally-significant habitat where the solution primarily involves modifying the hydrology and geomorphology. In FY 2009, the aquatic ecosystem restoration program received $517 million, which translates to almost 10 percent of the total initial appropriation.
Environmental Stewardship. The environmental stewardship program focuses on managing, conserving, and preserving natural resources on 11.5 million acres of land and water at 456 multipurpose Corps’projects. In addition, program
personnel monitor water quality at Corps’ dams and operate fish hatcheries in cooperation with state wildlife agencies. The environmental program encompasses compliance measures to ensure Corps’ projects 1) meet federal, state and local environmental requirements; 2) sustain environmental quality; and 3) conserve natural and cultural resources. In FY 2009, the environmental stewardship program received $97 million, an amount comprising 1.8 percent of the total initial appropriation.
FUSRAP. Under the FUSRAP, the Corps cleans up former Manhattan Project and Atomic Energy Commission sites, making use of expertise gained in cleansing former military sites and civilian hazardous waste sites under the Environmental Protection Agency Superfund program. In FY 2009, the FUSRAP program received $140 million, or approximately 2.6 percent of the total initial appropriation.
Regulation of Wetlands and Waterways
In accordance with the Rivers and Harbors Act of 1890 (Sec. 10) and the Clean Water Act of 1972 (Sec. 404), as amended, the Corps regulatory program regulates the discharge of dredged and fill material into U.S. waters,
Saylorville Lake emergency spillway
being lowered

U.S
. Arm
y Co
rps o
f Eng
ineers - Civil W
orks Fund
5
including wetlands. The Corps implements many of its oversight responsibilities by means of a permit process. Throughout the permit evaluation process, the Corps complies with the National Environmental Policy Act and other applicable environmental and historic preservation laws. In addition to federal statutes, the Corps also considers the views of other federal, tribal, state and local governments and agencies, and interest groups, as well as the general public when rendering its final permit decisions.
In FY 2009, this $183 million program accounted for a little more than 3 percent of civil works appropriations.
Emergency Management
Throughout Corps’ history, the United States has relied on the civil works program for help in times of national disaster. Emergency management continues to be an important part of the civil works program, which directly supports the Department of Homeland Security in carrying out the National Response Framework. It does this by providing emergency support in public works and engineering, and by conducting emergency response and recovery activities under authority of Public Law 84-99. In a typical year, the Corps responds to more than 30 presidential disaster declarations, and its highly-trained workforce is prepared to deal with both man-made and natural disasters.
Hurricanes Katrina, Rita, Wilma, and Ophelia caused significant damage to the flood and hurricane protection projects along the Gulf Coast and South Atlantic states. Hurricane Katrina, alone, resulted in federal costs of approximately $125 billion in Louisiana, Mississippi, and Alabama. USACE costs to repair and upgrade the New Orleans Hurricane and Storm Damage Risk Reduction System (HSDRRS) will be approximately $14 billion. Major damage to the storm protection system in the New Orleans area included overtopping of 47 sections of levees and the failure of three floodwalls along Lake Pontchartrain and vicinity. In addition, several New Orleans-to-Venice projects required extensive repairs prior to the beginning of the 2006 hurricane season.
Coupled with its repair efforts, the Corps studied ways to improve hurricane protection in the vicinity of Lake Pontchartrain. Shortly after Hurricane Katrina, it commissioned a Hurricane Protection Decision Chronology (HPDC) to collect, record and analyze project memoranda and reports and related documentation. This material was used to better understand how complex social and political decision-making processes contributed to the HSDRRS, and to determine how processes might be improved.
A U.S. Army Corps of Engineers
employee inspects an emergency levee
in Valley City, North Dakota, during the
2009 spring flooding of the Red River of
the North.
6 Fiscal Year 2009 United States Army Annual Civil Works Financial Statement
Subsequently, a report provided an explanation—as opposed to an evaluation—of the way in which Corps’ policies and organization, legislation, financial and other factors influenced decisions that led to the HSDRRS protective structures in place when Hurricane Katrina struck.
The HPDC focus on project decision-making complemented the engineering forensics investigations conducted by the Interagency Performance Evaluation Task Force and other institutions. The HPDC’s purpose is to make predictions about the future by looking at historical data, and it demonstrated that no single individual, agency, organization, or decision was solely responsible for the development of the HSDRRS over the course of its 50-year history. The Corps is committed to open, transparent communication with the American public regarding the lessons learned in the aftermath of Hurricane Katrina.
The Corps not only contributes to domestic emergency management efforts, but also plays a major role on the international stage through its participation in the civil military emergency preparedness program. In support of the Department of Defense, the Corps shares emergency management knowledge and expertise with U.S. allies and partners in the former Soviet Republics and Eastern Europe. This valuable program brings together key leaders and builds relationships among nations in direct support of the national defense strategy.
In FY 2009, this program received approximately $1.4 billion in supplemental appropriations for flood
control and coastal emergencies for support of preparedness activities, repairs to eligible flood-damaged projects, emergency operations and flood fighting. This program did not receive funding in the regular civil works appropriation.
Hydropower
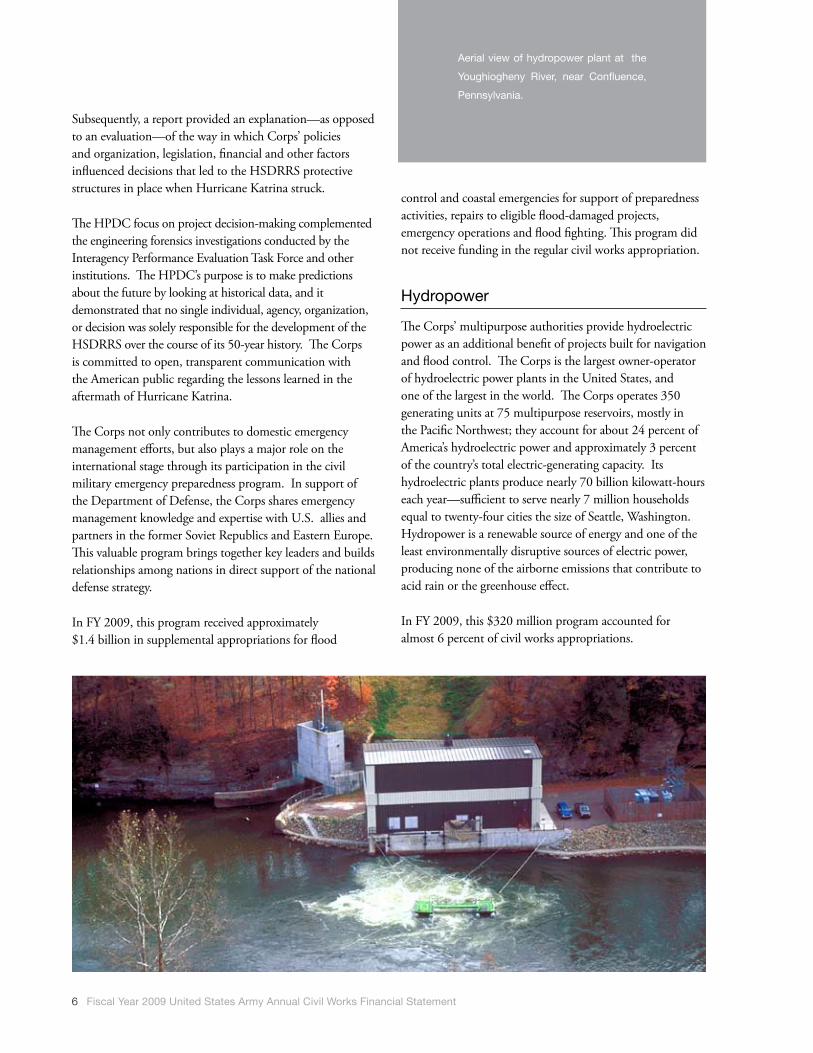
The Corps’ multipurpose authorities provide hydroelectric power as an additional benefit of projects built for navigation and flood control. The Corps is the largest owner-operator of hydroelectric power plants in the United States, and one of the largest in the world. The Corps operates 350 generating units at 75 multipurpose reservoirs, mostly in the Pacific Northwest; they account for about 24 percent of America’s hydroelectric power and approximately 3 percent of the country’s total electric-generating capacity. Its hydroelectric plants produce nearly 70 billion kilowatt-hours each year—sufficient to serve nearly 7 million households equal to twenty-four cities the size of Seattle, Washington. Hydropower is a renewable source of energy and one of the least environmentally disruptive sources of electric power, producing none of the airborne emissions that contribute to acid rain or the greenhouse effect.
In FY 2009, this $320 million program accounted for almost 6 percent of civil works appropriations.
Aerial view of hydropower plant at the
Youghiogheny River, near Confluence,
Pennsylvania.

U.S
. Arm
y Co
rps o
f Eng
ineers - Civil W
orks Fund
7
Recreation
The Corps is an important provider of outdoor recreation, which is an ancillary benefit of its flood prevention and navigation projects. The Corps’ recreation program provides quality outdoor public recreation experiences in accordance with its three-part mission: 1) serve the needs of present and future generations; 2) contribute to the quality of American life; and 3) manage and conserve natural resources consistent with ecosystem management principles.
The Corps administers 4,488 recreation sites at 423 projects on 12 million acres of land. During fiscal year 2008, 10 percent of the U.S. population visited a Corps’ project at least once. These visitors spent $18 billion pursuing their favorite outdoor recreation activities, which, in turn, supported some 350,000 full- and part-time jobs.
In FY 2009, this $277 million program accounted for just over 5 percent of the civil works budget.
Water Storage for Water Supply
Conscientious management of the nation’s water supply is critical to limiting water shortages and lessening the impact of droughts. The Corps has an important role in ensuring that homes, businesses and farms, nationwide, have enough water to meet their needs. It retains authority for water supply in connection with construction, operation and
modification of federal navigation; flood damage reduction; and multipurpose projects.
In FY 2009, this $6 million program accounted for less than 1 percent of civil works appropriations.
Organizational Structure
The Workforce
The Corps employs approximately 35,000 people, including 650 military officers and 24,800 civilians who perform civil works duties. It is funded through the energy and water development appropriation and executes programs through eight regional divisions and 38 of the Corps’ 41 districts; the three remaining districts are dedicated to military-related missions. There is a ninth provisional division in the Gulf Region that supports operations in Iraq and Afghanistan, which has three embedded provisional districts. In addition, there is a provisional district in Afghanistan that reports directly to Corps’ headquarters.
More than 60 recreation boats dropped
anchor on a sand bar at the north end of
U.S. Army Corps of Engineers Carlyle
Lake, Illinois. Carlyle Lake, at 26,000
acres, is the largest man-made lake in
Illinois.
8 Fiscal Year 2009 United States Army Annual Civil Works Financial Statement
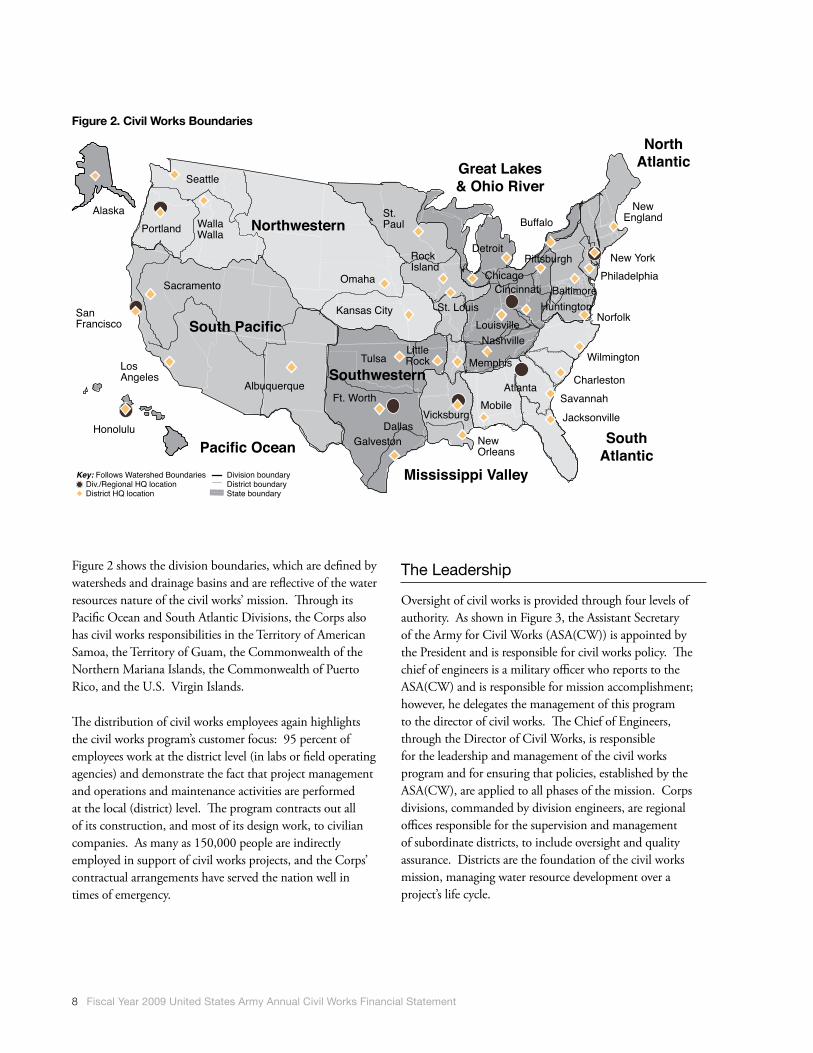
Figure 2 shows the division boundaries, which are defined by watersheds and drainage basins and are reflective of the water resources nature of the civil works’ mission. Through its Pacific Ocean and South Atlantic Divisions, the Corps also has civil works responsibilities in the Territory of American Samoa, the Territory of Guam, the Commonwealth of the Northern Mariana Islands, the Commonwealth of Puerto Rico, and the U.S. Virgin Islands.
The distribution of civil works employees again highlights the civil works program’s customer focus: 95 percent of employees work at the district level (in labs or field operating agencies) and demonstrate the fact that project management and operations and maintenance activities are performed at the local (district) level. The program contracts out all of its construction, and most of its design work, to civilian companies. As many as 150,000 people are indirectly employed in support of civil works projects, and the Corps’ contractual arrangements have served the nation well in times of emergency.
The Leadership
Oversight of civil works is provided through four levels of authority. As shown in Figure 3, the Assistant Secretary of the Army for Civil Works (ASA(CW)) is appointed by the President and is responsible for civil works policy. The chief of engineers is a military officer who reports to the ASA(CW) and is responsible for mission accomplishment; however, he delegates the management of this program to the director of civil works. The Chief of Engineers, through the Director of Civil Works, is responsible for the leadership and management of the civil works program and for ensuring that policies, established by the ASA(CW), are applied to all phases of the mission. Corps divisions, commanded by division engineers, are regional offices responsible for the supervision and management of subordinate districts, to include oversight and quality assurance. Districts are the foundation of the civil works mission, managing water resource development over a project’s life cycle.
Figure 2. Civil Works Boundaries
Galveston NewOrleans
Jacksonville
SavannahCharleston
Wilmington
Norfolk
PhiladelphiaNew York
Buffalo
Tulsa
Ft. WorthMobile
Detroit
Baltimore
PittsburghChicago
Memphis
NashvilleLouisville
Atlanta
Dallas
Alaska
SanFrancisco
LosAngeles
Honolulu
Pacific Ocean
Portland
Seattle
WallaWalla
Omaha
Albuquerque
South Pacific
Northwestern
Southwestern
Mississippi Valley
SouthAtlantic
NorthAtlanticGreat Lakes
& Ohio River
Sacramento
Kansas City
LittleRock
NewEngland
RockIsland
St.Paul
HuntingtonCincinnati
Vicksburg
St. Louis
Key: Follows Watershed Boundaries Div./Regional HQ location District HQ location
Division boundaryDistrict boundaryState boundary

U.S
. Arm
y Co
rps o
f Eng
ineers - Civil W
orks Fund
9
Figure 3. Civil Works Levels of Authority
ASA (CW)
Chief of EngineersApplies policy guidance
38 Districts
8 DivisionsSupervise and manage districts
Perform district-level quality assurance
Director of CWActs on behalf of the Chief of Engineers
in policy guidance
Provides policy guidance
PlanDesign
OperateMaintainConstruction Management
Civil Works Fund Performance ResultsCivil works directly impacts America’s prosperity, competitiveness, quality of life and environmental stability. In March 2004, the Corps’ leadership published a strategic plan that provides a framework for enhancing the sustainability of America’s resources. The plan’s strategic
goals support the Corps’ strategic direction over the five-year period, FY 2004—FY 2009. Key performance measures, developed in conjunction with the Office of Management and Budget, are presented below.
Goal 1: Provide Sustainable Development and Integrated Management of the Nation’s Water Resources.
Navigation
Objective: To invest in navigation infrastructure that is fully capable of supporting maritime requirements in environmentally sustainable ways where economically justified.
Funding History: The first row of Table 1 indicates funding for the investigations, major rehabilitation and construction program.
Performance Indicators: To measure progress in meeting the Goal 1 objectives, the Corps uses performance indicators related to investigations and construction activities for inland and intracoastal waterways and coastal ports and harbors, as well as to the efficiency of the overall, combined navigation system. Indicators are described below and their measures are shown in Tables 1.
Construction measures for the navigation system
In FY 2008, the Corps instituted new performance measures and began gathering data, which will be reported pending availability of a complete year’s worth of data.
Table 1. Navigation Program Construction and Investigation Performance Indicators
FY 2009
FY 2006 FY 2007 FY 2008 Target Actual
Expenditures in millions of dollars $916 $609 $490 $628 $597
Inland Waterways
Percentage of funds to high-return investments (BCR > 3)
Note 1
59%
Note 3
42%
Coastal Ports and Harbors
Percent of reports recommending projects reflecting watershed principles
100%Note 2 0%
Average annual benefits attributable to PEDs completed in current FY ($ millions) $28.1 $7.9
Note 1: New performance measure for FY 2008, which was the first year data were collected.Note 2: Represents the completion of one report.Note 3: Performance targets will not be established until FY 2010, after 2 years of data are collected.

10 Fiscal Year 2009 United States Army Annual Civil Works Financial Statement
n High-return investments. The percent of funding to rehabilitate, construct, or expand projects that is allocated to high-return investments. High-return investment projects are defined as those with a benefit-to-cost ratio of 3.0 or greater.
n Percent of reports recommending projects reflecting watershed principles. The percent of Chief of Engineer’s reports recommending projects for authorization that meet criteria for industry-accepted watershed principles. This measure expresses a long-term goal and assesses progress achieved in watershed-based planning.
n Average annual benefits attributable to preconstruction engineering and design (PED) work completed in current fiscal year. The total average annual benefits (present value) attributable to PEDs. This measure assesses the effectiveness of PED in enabling transportation savings.
n Average annual benefits realized by construction projects completed in current fiscal year. The total average annual benefits (present value) realized by construction projects completed. This measure assesses the effectiveness of the construction program in realizing transportation savings.
n Percent change in funds required to complete all programmed work. The percent change in constant-dollar balance to complete programmed work on all ongoing, budgeted construction projects. This measure assesses progress in reducing the backlog of ongoing, budgetable construction projects.
Performance Results—Construction and Investigations
Funding for investigations was used at various locations throughout the nation to continue the study and design of navigation improvements to increase the economic benefits of navigation systems and to reduce transportation costs.
Two PEDs were completed: 1) Gulf Intracoastal Waterway—High Island to Brazos River, TX project— and 2) Akutan Harbor, AK. They realized average annual benefits of $3.2 million and $4.7 million, respectively. There were no Chief of Engineer reports completed for navigation projects in FY 2009.
Construction funding for inland waterways was used to continue: 1) major repairs, construction, or replacement of locks and dams; 2) dam safety assurance; 3) seepage control and static instability corrections; and 4) construction or replacement of locks and dams. While 42 percent of funds programmed for high-return investments seems low at first glance; it is important to understand that more than one-half of the remaining 58 percent of construction funds was used for mandatory dam safety assurance, seepage control, and static instability correction projects—all of which have BCRs less than 3.0. As the Corps continues to assess the condition of the nation’s dams, it must address the human safety issues that are being found. These dam-safety projects are given funding priority, necessitating the deferral or delay of other critical projects
Construction funding for coastal navigation projects was used for channel deepening and improvement projects. Additional construction funding was used to construct dredged material and beneficial use placement sites as well as to mitigate shoreline damages caused by navigation projects.
The American Recovery and Reinvestment Act of 2009 provided the Corps an additional $4 million in investigation funds and $740 million in construction funds, which will be spent on navigation projects through FY 2011. Specifically, expenditures will be allocated for: 1) the advancement and completion of studies, 2) engineering and design, 3) construction, and 4) the major rehabilitation of navigation projects.
Flood Risk Management
Objective: To invest in environmentally-sustainable flood and coastal storm damage reduction solutions through the safe operation of flood reduction infrastructure when benefits exceed costs.
Funding History: The first row of Table 2 displays investigation and construction program funding for flood risk management.
Performance Indicators: To measure its progress in meeting the Goal 1 objective, the Corps uses performance indicators related to the construction program for flood risk management. The construction indicators are described below and their measures are shown in Table 2.

U.S
. Arm
y Co
rps o
f Eng
ineers - Civil W
orks Fund
11
Construction measures for the flood risk management program
n Additional people protected. The increase in total affected population, with reduced risk at project design, attributed to project completion in the current fiscal year.
n Flood damage prevented. The estimated annual dollars of property damage avoided through Corps’ flood control projects completed during the fiscal year.
n Ten-year moving average. The 10-year moving average of actual flood-damage reduction benefits attributable to all completed Corps’ flood control projects.
n Dam safety projects. The percent of dams in the screening portfolio risk assessment (SPRA) that fall in Dam Safety Action Class (DSAC) I, II or III.
n Relative loss of life. The total relative annualized loss of life per dam.
n DSAC I, II, and III projects. The number of DSAC I, II, and III projects underway or completed during the applicable year.
n SPRA assessments completed. The number of SPRA screening-level assessments completed in the applicable year.
Performance Results—Construction
A portion of FY 2009 budgeted funds were targeted to complete four projects; however, due to a variety of reasons, only Antelope Creek, NE, was completed in FY 2009. The new schedules call for completion of the three remaining projects by the end of FY 2011. Although not originally scheduled for completion in FY 2009, the dam safety portion of the Mud Mountain Dam, WA, was also finished.
The work on the SPRA continued during FY 2009, and the total number of flood damage reduction dams with completed SPRAs increased to 343. The percentage of dams in DSAC I, II, and III increased from 45.0 percent in FY 2008 to 46.2 percent at the end of FY 2009 due to the identification of additional dams. Dams with completed SPRAs fell short of the target due to extensive spring flooding in the Red River and Missouri Basins; however, estimated relative loss of life per dam decreased. An additional 70 dams will be counted as FY 2010 completions and, in that fiscal year, all SPRAs will be concluded and interim risk reduction plans implemented at the DSAC I, II, and III dams.
Table 2. Construction & Investigation—Flood Risk Management
FY 2009
FY 2006Note 1
FY 2007Note 1
FY 2008 Target Actual
Expenditures in millions of dollars $1,512 $1,774 $1,107 $1,130 $1,343
Con
stru
ctio
n
Additional people protected (in thousands) 121 142 0 741 645
Flood damage prevented (in millions of dollars) $56.1 $55.6 $0.0 $19.7 $10.4
Ten-year moving average (in millions of dollars) $20.1 $20.1 $22.3 Note 2
Dam safety projects
Note 3
55.7% 45.0% 45.0% 46.2%
Relative loss of life 0.81 0.95 0.95 0.95
DSAC I, II, and III projects 10 56 80 56
SPRA assessments completed 61 71 185 220 66
Note 1: Prior-year funds were for the total of all expenditures in the coastal and flood damage reduction program and should not be compared to the FY 2008 construction expenditures.Note 2: Data are collected from actual floods occurring throughout the year, and data become available in March following the year of interest. The Corps makes no predictions or targets year-to-year; data are used for trend analysis only.Note 3: Data not available prior to FY 2007.
12 Fiscal Year 2009 United States Army Annual Civil Works Financial Statement
In FY 2009, the USACE Levee Safety Program initiated periodic inspections of levees to 1) verify proper operation and maintenance; 2) evaluate operational adequacy and structural stability; and, 3) identify components and features to monitor over time. Also, a new Web-based Levee Screening Tool is being used to 1) rank levees by risk factor; 2) communicate issues to drive actions; 3) recommend interim risk reduction measures to improve public safety; and 4) prioritize next steps to focus highest risk areas. USACE initiated a one time, accelerated program of periodic inspections of federal levees under the ARRA. Concurrently, during FY 2008 and FY 2009, the USACE chaired and provided staff support to the National Levee Safety Committee. The recommendations of this committee are consistent with USACE levee safety activities and future plans.
Hydropower
Objective: To invest in hydropower solutions when benefits exceed costs.
Performance Indicators: The availability of hydroelectric generating units during peak power-demand periods. Indicators of successful performance in meeting this objective are measured by generating capacity and forced outage rates.
Performance Result: The Corps uses the same indicators as in Goal 3; please see Table 9.
Goal 2: Repair Past Environmental Degradation and Prevent Future Environmental Losses
Aquatic Ecosystem Restoration
Objective: Restore the structure, function and process of significantly degraded ecosystems to allow them to revert to a more natural condition. Invest in restoration projects or features that positively contribute to the nation’s environmental resources in a cost-effective manner.
Funding History: The first row of Table 3 displays the funding for aquatic ecosystem restoration.
Performance Indicators: The Corps has established four indicators to assess progress in meeting this objective. It began collecting performance data for three of these indicators during fiscal years 2005 and 2006. Data are shown in Table 3.
n Acres of habitat restored, created, improved, or protected—annual. The number of acres of habitat restored in degraded ecosystems.
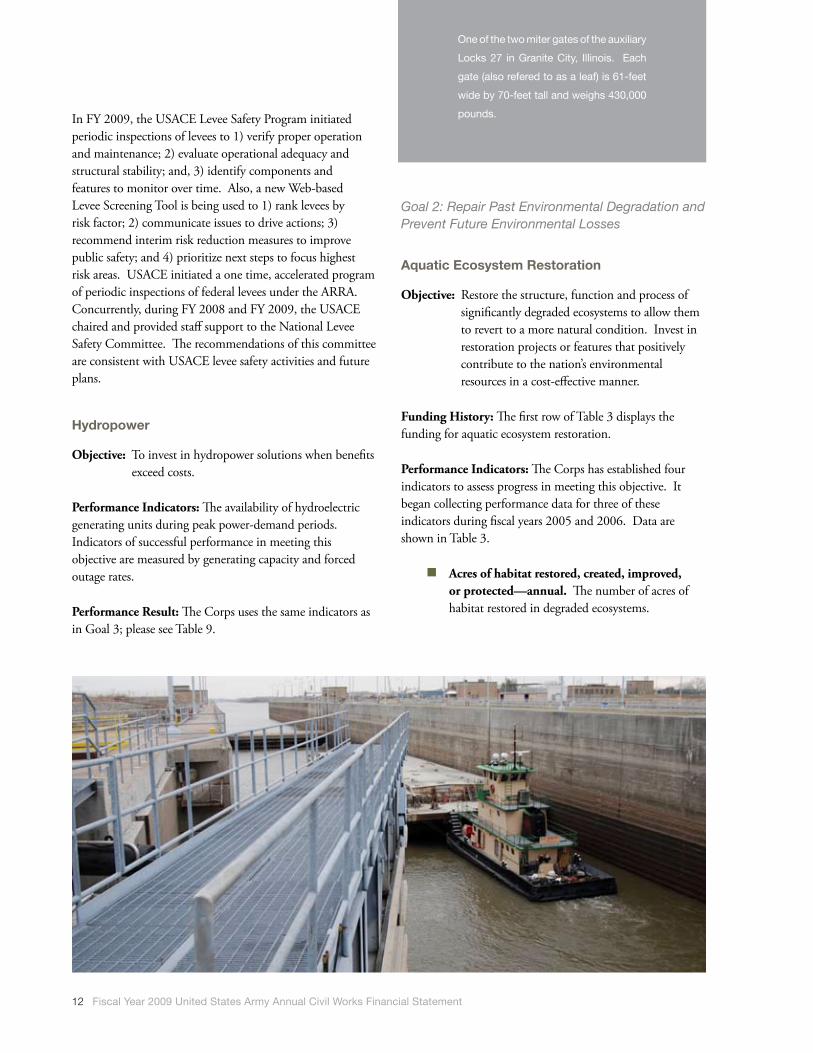
One of the two miter gates of the auxiliary
Locks 27 in Granite City, Illinois. Each
gate (also refered to as a leaf) is 61-feet
wide by 70-feet tall and weighs 430,000
pounds.

U.S
. Arm
y Co
rps o
f Eng
ineers - Civil W
orks Fund
13
n Nationally-significant acres of habitat restored, created, improved or protected—annual. The number of acres of habitat restored each year that have high-quality outputs as compared to national needs.
n Cost per acre to restore, create, improve or protect nationally-significant habitat. The per-acre cost of projects that produce nationally-significant acres in any given year. Over the long term, through efficiencies in project execution or other actions, the goal is to restore the most acres per dollar expended.
n Number of projects or separate elements physically completed. The actual number of projects or separate elements physically completed in the current fiscal year. Performance of the other measures is directly dependent upon this performance factor.
Performance Results Significant progress was made on Everglades South Florida/Central and South Florida projects, most notably the restoration of the Kissimmee River, the Seminole Big Cypress Restoration, Manatee Pass-Through Gates and the South Dade County C-111 modification as well as the response to the biological opinion on the Columbia River system and Missouri River. Construction progressed on the restoration of Poplar Island, MD, Hamilton Airfield Wetlands, CA, Upper Mississippi River Restoration, and modifications to the Chicago Sanitary
and Ship Canal, which prohibits Asian carp from entering the Great Lakes from the Mississippi River. Physical construction was completed at 14 projects resulting in 10,480 restored acres, approximately 13 percent of which are nationally significant. Advancements were also made on a significant number of studies exploring ecosystem restoration options in a variety of diverse ecosystems across the country, to include the Louisiana Coastal Area Ecosystem Restoration.
Regulatory
Objective: To administer the regulatory program in a manner that protects the aquatic environment (ensures zero net-loss of wetlands) while making timely, fair permit decisions.
Funding History: The first row of Table 4 displays the program’s funding.
Performance Indicators: Table 4 lists eight measures that serve as performance indicators in determining progress in meeting this objective.
n Individual permit compliance. The percent of all individual permits on which the Corps completed an initial compliance inspection; measures permits issued during the previous fiscal year when authorized work began.
Table 3. Aquatic Ecosystem Restoration Indicators
FY 2009
FY 2006 FY 2007 FY 2008 Note 1
Target Actual
Expenditures in millions of dollars $516 $340 $429 $517 $492
Acres of habitat restored, created, improved or protected (annual) 6,600 4,838 2,435 10,200 10,480
Nationally significant acres of habitat restored, created, improved or protected (annual) 5,500 2,987 1,986 1,700 1,380
Cost per acre to restore, create, improve or protect nationally significant habitat $9,800 $6,800 $6,700 $8,000 $6,600
Number of projects/separable elements physically completing Note 2 16 14
Note 1: Beginning in FY 2008, this business program credits acres in the year physical construction is completed instead of the last year that the project was budgeted in the construction account. This is due to the increased use of fully-funded contracts and funding of the out-year monitoring requirements.Note 2: New measure; FY 2009 will be first year of reporting.

14 Fiscal Year 2009 United States Army Annual Civil Works Financial Statement
n General permit compliance. The percent of all general permits on which the Corps completed an initial compliance inspection; measures permits issued during the previous fiscal year when authorized work began.
n Mitigation site compliance. The percent of field compliance inspections completed on active mitigation sites each fiscal year. Active mitigation sites are those authorized and monitored through the permit process, but which have not met final approval under the permit special conditions.
n Mitigation inspections or audits. The percent of compliance inspections or audits completed on active mitigation banks and in-lieu-of-fee programs.
n Resolution of non-compliance issues. The percent of non-compliance issues identified during the fiscal year in which the Corps reached resolution. This addresses non-compliance with permit conditions.
n Resolution of enforcement actions. The percent of pending enforcement actions, i.e., unauthorized activities, identified during the fiscal year in which the Corps reached resolution.
n General permit decisions. The percent of general permit application decisions made within 60 days.
n Individual permits. The percent of general individual permit application decisions made within 120 days. This standard does not include individual permits with formal Endangered Species Act consultations.
Performance Results
Fiscal year 2009 funds were used to hire and support regulatory personnel analyzing projects and making permit decisions, completing necessary compliance efforts on issued permits, and investigating and resolving instances of alleged unauthorized activities within the nation’s waters.
Promulgation of guidance associated with the Supreme Court decision on the Carabell and Rapanos1 cases significantly increased the staff workload for many
jurisdictional determinations. The regulatory program continues to experience high levels of scrutiny from the public, elected officials, and interest groups as development pressures mount and national public awareness of the importance of aquatic resources increases. Court decisions at the local, state, regional, and national levels continue to drive program adjustments. In addition, heightened sensitivity to the functions and value of wetlands has brought about greater direct input from the public, environmental and development interest groups, and from federal and state resource agencies. This fact has led to greater scrutiny, and subsequent controversy, in the review of permit proposals.
The Corps has implemented several initiatives to speed the permit decision process and improve environmental review and documentation. In several districts, the regulatory program arranged Lean Six Sigma analyses of the individual permit process in an effort to streamline it and reduce waste. The program continues to improve a nationwide spatial database that tracks all Corps’ permits, thereby enabling better decision-making and more efficient permit processing. Through a nationwide network of subject matter experts, the Corps is implementing a program to increase use of programmatic general permits, which will expand overall technical expertise and reduce the number of routine Corps actions. All these initiatives directly support the Corps’ efforts to expedite permit review while improving environmental analysis and documentation.
Environmental Remediation (Formerly Utilized Sites Remedial Action Program-FUSRAP)
Objective: To achieve the cleanup objectives of the FUSRAP, the Corps uses three outcome measures to indicate progress: 1) minimize risk to human health and the environment; 2) maximize the cubic yardage of contaminated material disposed in a safe and legal disposal facility; and 3) return the maximum number of affected individual properties to beneficial use.
Funding History: The first row of Table 5 displays funding for environmental remediation.
Performance Indicators: The measures listed in Table 5 serve as indicators to help Corps’ personnel determine
1 Rapanos v. United States and Carabell v. Army Corps of Engineers 126 S. Ct. 2208 (2006).

U.S
. Arm
y Co
rps o
f Eng
ineers - Civil W
orks Fund
15
progress in meeting this objective. In addition to the indicators explained below, the Corps has begun to measure both the cumulative percentage of FUSRAP funding expended on actual cleanup activities as well as the total cost of disposing of contaminated material.
n Number of records of decision (ROD) signed. As studies are completed and best alternatives for cleanup activities are decided, the number of RODs increases. A final ROD establishes the final cleanup standard, which controls the actual estimate of the remaining environmental liability for each site.
n Number of remedial investigations (RI) completed. The RI establishes the baseline risk assessment whereby the level of risk to human health and the environment is identified.
n Number of action memorandums signed. Where warranted by risk or other limiting factors, action memorandums allow the Corps to move toward reducing risk more rapidly than through production of a ROD. No action memorandums are presently identified.
n Cubic yardage of contaminated material disposed. Target soil amounts are dependent on previous-year funding and scheduled activities.
n Individual properties returned to beneficial use. Number of properties released for general use following remediation.
n Number of remedies in place or response complete. As select portions of sites or complete sites meet their remedial action goals, risks to human health and the environment are reduced to within acceptable levels. Properties may be used within a community without fear of increased cancer risk or further degradation of the environment.
n Percentage of funding expended on cleanup. The cumulative percentage of FUSRAP funding expended on cleanup activities rather than on studies. The baseline for this measure was established in FY 2004; results are reported every three years.
n Remediation of contaminated material. The cost to dispose of contaminated material as measured in cubic yards. Data for this measure will not be available until late FY 2009.
Performance Results
Fiscal year 2009 funds were used to continue remedial activities at the Linde, Maywood, Shpack, St. Louis Vicinity Property, St. Louis Downtown, Iowa Army Ammunition
Table 4. Regulatory Indicators
FY 2009
FY 2006 FY 2007 FY 2008 Target Actual
Expenditures in millions of dollars $158 $159 $176 $183 $190
Percent of compliance inspections on individual permits 41% 11% 22% 10% 25%
Percent of compliance inspections on general permits 7% 7% 7% 5% 11%
Percent of active mitigation sites inspected 10% 7% 18% 5% 37%
Percent of compliance inspections on active mitigation banks 26% 63% 39% 20% 44%
Percent resolution on non-compliance with permit conditions or mitigation requirements 37% 56% 28% 20% 38%
Percent resolution on pending enforcement actions 60% 82% 34% 20% 37%
Percent of general permit application decisions made within 60 days 82% 78% 82% 75% 88%
Percent of standard permits and letter of permission permit decisions made within 120 days 61% 53% 51% 50% 64%
16 Fiscal Year 2009 United States Army Annual Civil Works Financial Statement
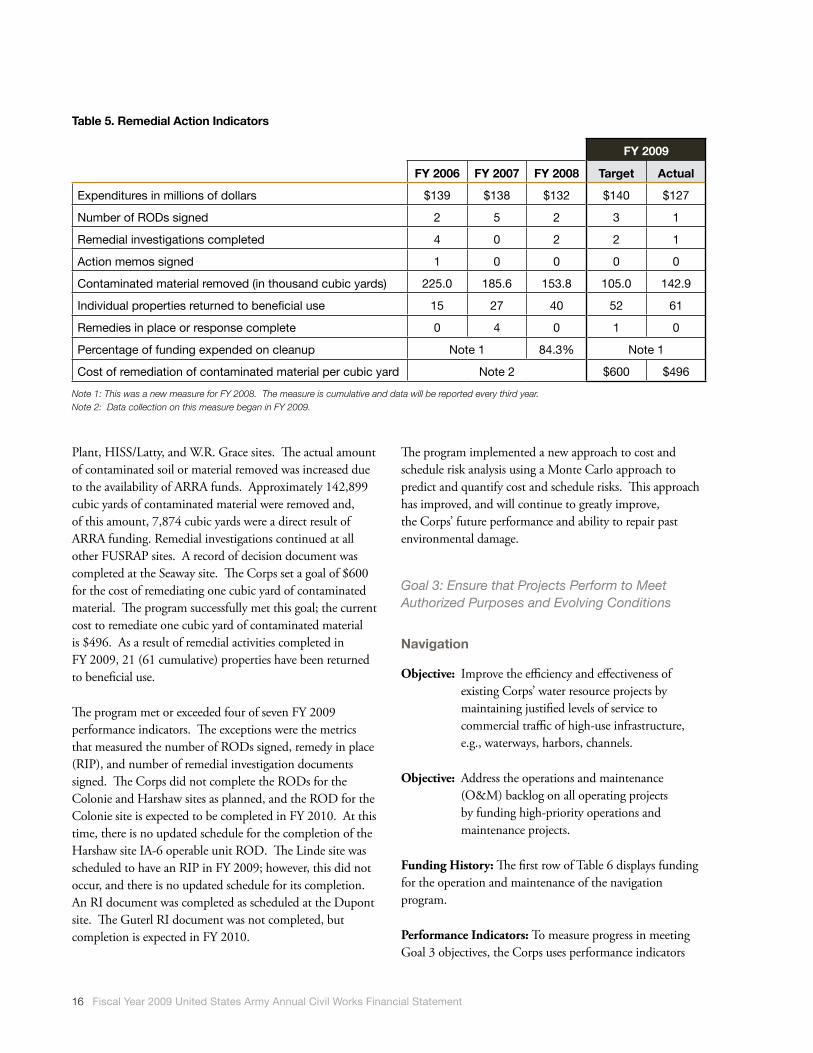
Plant, HISS/Latty, and W.R. Grace sites. The actual amount of contaminated soil or material removed was increased due to the availability of ARRA funds. Approximately 142,899 cubic yards of contaminated material were removed and, of this amount, 7,874 cubic yards were a direct result of ARRA funding. Remedial investigations continued at all other FUSRAP sites. A record of decision document was completed at the Seaway site. The Corps set a goal of $600 for the cost of remediating one cubic yard of contaminated material. The program successfully met this goal; the current cost to remediate one cubic yard of contaminated material is $496. As a result of remedial activities completed in FY 2009, 21 (61 cumulative) properties have been returned to beneficial use.
The program met or exceeded four of seven FY 2009 performance indicators. The exceptions were the metrics that measured the number of RODs signed, remedy in place (RIP), and number of remedial investigation documents signed. The Corps did not complete the RODs for the Colonie and Harshaw sites as planned, and the ROD for the Colonie site is expected to be completed in FY 2010. At this time, there is no updated schedule for the completion of the Harshaw site IA-6 operable unit ROD. The Linde site was scheduled to have an RIP in FY 2009; however, this did not occur, and there is no updated schedule for its completion. An RI document was completed as scheduled at the Dupont site. The Guterl RI document was not completed, but completion is expected in FY 2010.
The program implemented a new approach to cost and schedule risk analysis using a Monte Carlo approach to predict and quantify cost and schedule risks. This approach has improved, and will continue to greatly improve, the Corps’ future performance and ability to repair past environmental damage.
Goal 3: Ensure that Projects Perform to Meet Authorized Purposes and Evolving Conditions
Navigation
Objective: Improve the efficiency and effectiveness of existing Corps’ water resource projects by maintaining justified levels of service to commercial traffic of high-use infrastructure, e.g., waterways, harbors, channels.
Objective: Address the operations and maintenance (O&M) backlog on all operating projects by funding high-priority operations and maintenance projects.
Funding History: The first row of Table 6 displays funding for the operation and maintenance of the navigation program.
Performance Indicators: To measure progress in meeting Goal 3 objectives, the Corps uses performance indicators
Table 5. Remedial Action Indicators
FY 2009
FY 2006 FY 2007 FY 2008 Target Actual
Expenditures in millions of dollars $139 $138 $132 $140 $127
Number of RODs signed 2 5 2 3 1
Remedial investigations completed 4 0 2 2 1
Action memos signed 1 0 0 0 0
Contaminated material removed (in thousand cubic yards) 225.0 185.6 153.8 105.0 142.9
Individual properties returned to beneficial use 15 27 40 52 61
Remedies in place or response complete 0 4 0 1 0
Percentage of funding expended on cleanup Note 1 84.3% Note 1
Cost of remediation of contaminated material per cubic yard Note 2 $600 $496
Note 1: This was a new measure for FY 2008. The measure is cumulative and data will be reported every third year.Note 2: Data collection on this measure began in FY 2009.
U.S
. Arm
y Co
rps o
f Eng
ineers - Civil W
orks Fund
17
that 1) relate to operation and maintenance activities for inland and intracoastal waterways and coastal ports and harbors, and 2) relate to the efficiency of the overall, combined navigation system. Indicators are described below and their measures are shown in Table 6.
Operation and maintenance measures for inland and intracoastal waterways
n Ton-miles. The sum total of movement of cargo on the waterways; this measure is a roll-up of tons of cargo transported by a vessel multiplied by the miles that vessel traveled on the inland waterways. Although there is no specific Corps-generated target, this indicator is used for trend analysis.
n Segment availability. Number of hours, over 24, that mechanical-driven failure or shoaling results in the closure of all or part of a high- or moderate-commercial-use segment. The measure includes only failures on the main chamber of a lock (rather than an auxiliary chamber), and on shoaling due to inadequate dredging (rather than low water levels from droughts or channels closed due to floods). It also tracks closures of more than one week.
n Total funds expended per segment ton-mile (five-year rolling average). Total O&M funds expended per segment ton-mile averaged over a five-year period, including major rehabilitations.
n Efficiency measure. Operation and maintenance costs per ton of cargo shipped. Assesses the efficiency of the commercial navigation system at a particular coastal port or harbor.
The Corps developed new performance measures and began data-gathering in FY 2008. Data will not be reported until FY 2010.
n Channel availability, high-use projects. The percent of time that inland and intracoastal waterway segments with high commercial activity are available when customers want to use them. The focus is to minimize vessel draft restrictions due to shoaling of the channels, and to minimize local closures due to mechanical failures.
n Percent of high-use segments with a good service level. Percent of high commercial-use segments with sufficient preventive maintenance to achieve a good level of service. High-use segments are the upper- and lower- Mississippi, the Illinois, Ohio and Tennessee Rivers and the Gulf Intracoastal Waterway.
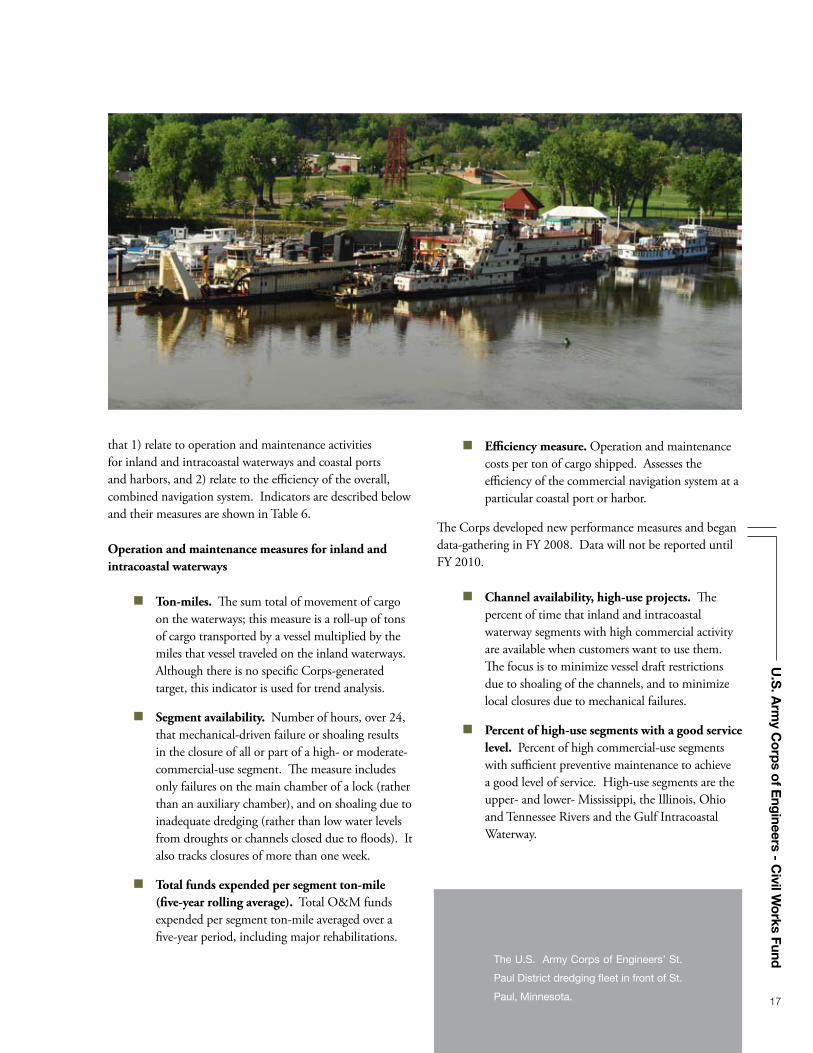
The U.S. Army Corps of Engineers’ St.
Paul District dredging fleet in front of St.
Paul, Minnesota.
18 Fiscal Year 2009 United States Army Annual Civil Works Financial Statement
Operations and maintenance measures for coastal ports and harbors, including major repairs
n Tons of cargo. Total sum of cargo in tons moved in and out of coastal ports and harbor systems. This measure indicates system use; data collected are for the purpose of trend analysis. No specific target is generated by the Corps.
n Channel availability, high-use projects. The percent of time that high commercial-traffic navigation channels are available to commercial users. There are a total of 59 high-use projects, defined as those that pass 10 million or more tons of cargo per year.
In FY 2008, the Corps instituted new performance measures and began gathering data. Data will be reported as beginning in FY 2010.
n Channel availability, moderate-use projects. The percent of time that moderate commercial-traffic navigation channels are available to commercial users. There are a total of 100 moderate-use projects that are defined as those passing 1-10 million tons of cargo per year.
n Channel availability, low-use projects. The percent of time that low commercial-use channels, harbors and ports are available to all current users. There are about 1,000 low-use projects that are defined as those passing less than one million tons of cargo per year.
Performance Results
The program continues to be successful in providing significant navigation benefits to the nation; however, the program faces significant challenges in its efforts to maintain the reliability of the inland and intracoastal waterways and coastal navigation system. The system’s aging infrastructure requires more repairs than the Corps can accomplish given the historical level of program appropriations. These same funding shortfalls, coupled with increased costs in dredging operations and construction, are affecting the Corps’ ability to properly maintain its infrastructure and channels. There has been a 27-percent increase in dredging costs in recent years, which corresponds to the near doubling of fuel purchasing costs and similarly significant increases in steel and labor costs. Although other factors may limit or control channel availability, the ability to maintain an acceptable
waterway width and depth through dredging operations has, by far, the greatest impact.
Performance Results—Operation and Maintenance
The O&M appropriations and the Mississippi River and Tributaries appropriations were used to fund 1) continued operation and maintenance of 241 locks at 195 locations, and 2) maintenance dredging of critical and high commercial-use reaches of the 11,000 miles of inland and intracoastal waterways. Not all waterways were maintained at authorized dimensions. Many locks and dams forewent all but the most critically-needed maintenance, and some locks, dams, and waterways were only maintained in caretaker status. The overall condition of the inland and intracoastal waterways is expected to decline, and projects will continue to experience lock closures due to mechanical breakdowns and failures.
Funding also enabled maintenance dredging of high-use, commercially important coastal ports, harbors and channels; critical harbors of refuge; and subsistence harbors. Many moderate- and low-commercial-use harbors and channels were not dredged and continue to shoal, further limiting vessel drafts. For the 59 highest-use coastal ports and harbors, channel conditions are expected to continue to decline due to large increases in the costs of doing business, particularly as they relate to fuel, steel and labor. Dredging costs have increased an estimated 27 percent over the past three years. For these projects, authorized channel depths (for the channel’s center half ) were available approximately 35 percent of the time during fiscal years 2005-2007. The condition of moderate-and low-use inland and intracoastal waterways, as well as coastal ports and harbors, is expected to continue to decline.
The ARRA provided an additional $1 billion in O&M funding that will be expended by the end of FY 2010. Numerous contract awards were made during the second half of FY 2009 to perform additional maintenance of inland and intracoastal waterways and to perform additional dredging and maintenance of coastal ports and harbors. These funds should help improve the overall condition of the inland and intracoastal waterways, help reduce lock closures due to mechanical breakdowns and failures, and help improve the conditions of high and moderate use coastal ports and harbors.
U.S
. Arm
y Co
rps o
f Eng
ineers - Civil W
orks Fund
19
Flood Risk Management
Objective: To reduce the risk to public safety and risk of damages due to flooding and coastal storms through the safe operation of flood damage reduction projects, as authorized.
Funding History: The first row of Table 7 presents operation and maintenance funding for flood risk management.
Performance Indicators: To measure progress in meeting Goal 3 objectives, the Corps uses performance indicators that relate to operation and maintenance activities for flood risk management. The indicators are described below and their measures are shown in Table 7.
Operations and maintenance measures for the flood risk management program
n Operating projects in zones 21-25 (High Risk). The percent of operating projects ( dams, levees, channels, flood gates) in zones 21-25 of the relative risk ranking matrix.
n Operating projects in zones 1-6 (Low Risk). The percent of operating projects (dams, levees, channels, flood gates) in zones 1-6 of the relative risk ranking matrix.
n Marginal cost of operations. The marginal cost of operations and maintenance for all operating projects (dams, levees, channels, flood gates) relative to damages prevented; shown as a percentage, i.e., the cost of O&M divided by the cost of damages prevented.
Performance Results
FY 2009 funds were used to operate and maintain federal projects and to inspect federal projects turned over to local sponsors. These resources supported coordination of federal reservoir operating schedules with private reservoirs within the basin. Projects operated in their targeted relative risk zones as represented by the indicator performance measures found in Table 7.
Funding was also used to support dam safety program functions. This included: 1) monitoring and evaluating performance (instrumentation) of all dams; 2) accomplishing routine dam safety-related maintenance and repairs; 3) performing all required inspections (periodic, post-earthquake, high-pool, etc.); 4) preparing emergency action plans; 5) performing site-specific dam safety training of project personnel; and 6) implementing force protection security features.
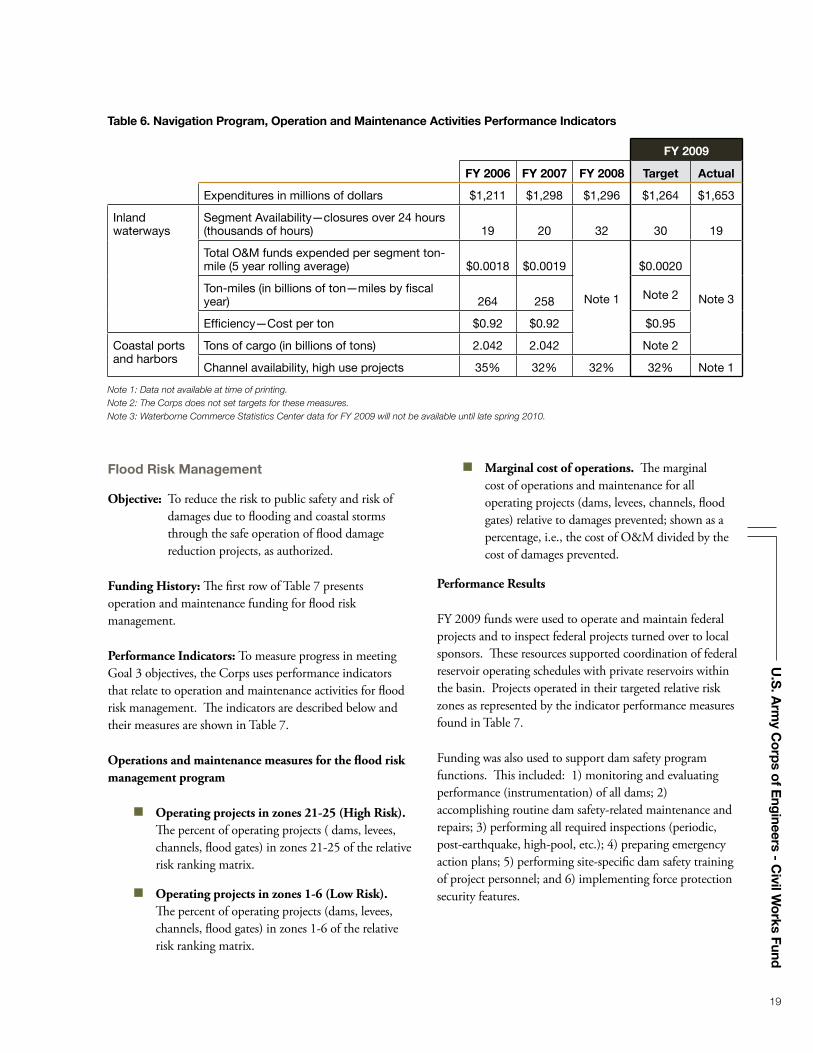
Table 6. Navigation Program, Operation and Maintenance Activities Performance Indicators
FY 2009
FY 2006 FY 2007 FY 2008 Target Actual
Expenditures in millions of dollars $1,211 $1,298 $1,296 $1,264 $1,653
Inland waterways
Segment Availability—closures over 24 hours (thousands of hours) 19 20 32 30 19
Total O&M funds expended per segment ton-mile (5 year rolling average) $0.0018 $0.0019
Note 1
$0.0020
Note 3Ton-miles (in billions of ton—miles by fiscal year) 264 258 Note 2
Efficiency—Cost per ton $0.92 $0.92 $0.95
Coastal ports and harbors
Tons of cargo (in billions of tons) 2.042 2.042 Note 2
Channel availability, high use projects 35% 32% 32% 32% Note 1
Note 1: Data not available at time of printing.Note 2: The Corps does not set targets for these measures.Note 3: Waterborne Commerce Statistics Center data for FY 2009 will not be available until late spring 2010.

20 Fiscal Year 2009 United States Army Annual Civil Works Financial Statement
Environmental Stewardship
Objective: To improve the efficiency and effectiveness of existing Corps water resources projects.
Objective: To ensure healthy and sustainable lands and waters and associated natural resources on Corps lands in public trust to support multiple purposes.
Objective: To protect, preserve, and restore significant ecological resources in accordance with master plans.
Objective: To ensure the operation of all civil works facilities and management of associated lands—including out-granted lands—complies with the environmental requirements of relevant federal, state and local laws and regulations.
Objective: To meet the mitigation requirements of authorizing legislation or applicable Corps authorization decision documents.
Funding History: The first row of Table 8 shows the funding for environmental stewardship.
Performance Indicators: To measure success in attaining the objectives above, the Corps developed seven performance indicators. Data on these indicators may be found in Table 8.
n Mitigation compliance. A percentage of the acres of designated Corps-administered mitigation lands that meet mitigation requirements, divided by
the total number of acres of designated Corps-administered mitigation lands. The measure can also be the number of pounds of fish (or the number of individual fish) produced in a mitigation hatchery, divided by the number of fish required to be produced at a mitigation hatchery in order to meet the mitigation requirement.
n Endangered species protection. The percent of Corps operating projects with Endangered Species Act responsibilities that meet those responsibilities.
n Cultural resources management. The percent of Corps operating projects that meet federally-mandated cultural resource management responsibilities in relation to the number of projects with such responsibilities.
n Healthy and sustainable lands and waters. The number of Corps fee-owned acres classified in a sustainable condition divided by the total number of Corps fee-owned acres. Sustainable is defined as being healthy and viable, not significantly impacted by any unmanageable factors, and not requiring intensive management to maintain health. The acreage also meets operational goals and objectives established in applicable management documents.
n Level-one natural resources inventory completion index. This measures the Corps’ efforts in completing basic, level-one natural resource inventories required by USACE Environmental Regulation 1130-2-540, Environmental Stewardship Operations and Maintenance Policies. These inventories are
Table 7. Operations and Maintenance—Flood Risk Management
FY 2009
FY 2006Note 1
FY 2007Note 1
FY 2008 Target Actual
Expenditures in millions of dollars $1,512 $1,774 $678 $449 $858
Operations & Maintenance
Operating projects in zones 21-25 (High Risk)
Note 2
96 68 50
Operating projects in zones 1-6 (Low Risk) 49 28 74
Marginal cost of operations 1.3% 1.2% 3.7%
Note 1: Prior-year funds were for the total of all expenditures in the flood risk management program and should not be compared to the FY 2008 and following year’s O&M expenditures.Note 2: New measure for FY 2008, the first year data were collected.
U.S
. Arm
y Co
rps o
f Eng
ineers - Civil W
orks Fund
21
necessary to effect sound resource management decisions and strategy development. The percentage of acres for which level-one inventories are necessary and completed is used to evaluate the relative performance in this measure.
n Master plan completion. A master plan is completed, per regulation, to foster an efficient and cost-effective project for natural resources, cultural resources and recreational management programs. This measure demonstrates the Corps’ commitment to fully integrate environmental stewardship in the management of operating projects. The measure is expressed as a percentage derived by dividing the number of required master plans in compliance with regulation by the total number of required master plans.
n Efficiency. This concept is represented by program costs recovered in cents-on-the- dollar. The objective is to manage projects in an efficient manner. This measure is an assessment of federal costs avoided in relation to the program cost. Revenue recovered each year, equivalent to the federal costs avoided, will vary due to the nature and extent of the sustainability practices implemented. The program emphasis, however, is on resource sustainability as opposed to revenue generation.
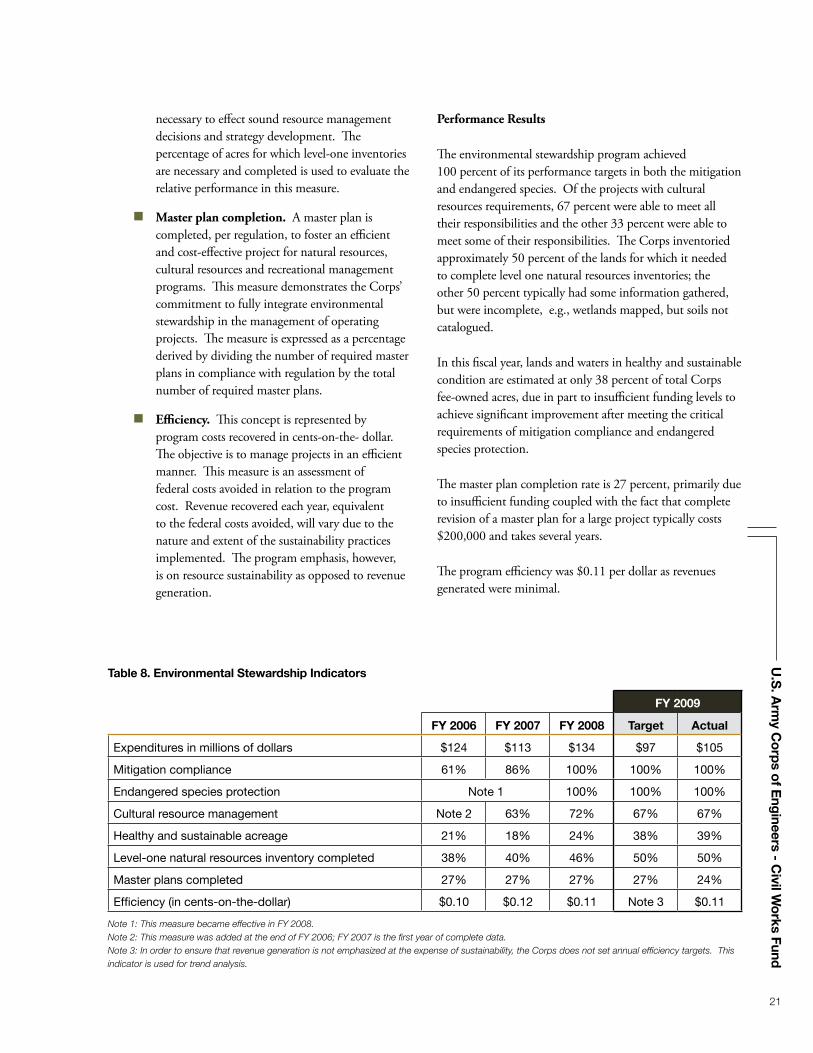
Performance Results
The environmental stewardship program achieved 100 percent of its performance targets in both the mitigation and endangered species. Of the projects with cultural resources requirements, 67 percent were able to meet all their responsibilities and the other 33 percent were able to meet some of their responsibilities. The Corps inventoried approximately 50 percent of the lands for which it needed to complete level one natural resources inventories; the other 50 percent typically had some information gathered, but were incomplete, e.g., wetlands mapped, but soils not catalogued.
In this fiscal year, lands and waters in healthy and sustainable condition are estimated at only 38 percent of total Corps fee-owned acres, due in part to insufficient funding levels to achieve significant improvement after meeting the critical requirements of mitigation compliance and endangered species protection.
The master plan completion rate is 27 percent, primarily due to insufficient funding coupled with the fact that complete revision of a master plan for a large project typically costs $200,000 and takes several years.
The program efficiency was $0.11 per dollar as revenues generated were minimal.
Table 8. Environmental Stewardship Indicators
FY 2009
FY 2006 FY 2007 FY 2008 Target Actual
Expenditures in millions of dollars $124 $113 $134 $97 $105
Mitigation compliance 61% 86% 100% 100% 100%
Endangered species protection Note 1 100% 100% 100%
Cultural resource management Note 2 63% 72% 67% 67%
Healthy and sustainable acreage 21% 18% 24% 38% 39%
Level-one natural resources inventory completed 38% 40% 46% 50% 50%
Master plans completed 27% 27% 27% 27% 24%
Efficiency (in cents-on-the-dollar) $0.10 $0.12 $0.11 Note 3 $0.11
Note 1: This measure became effective in FY 2008.Note 2: This measure was added at the end of FY 2006; FY 2007 is the first year of complete data.Note 3: In order to ensure that revenue generation is not emphasized at the expense of sustainability, the Corps does not set annual efficiency targets. This indicator is used for trend analysis.

22 Fiscal Year 2009 United States Army Annual Civil Works Financial Statement
Hydropower
Objective: To improve the efficiency and effectiveness of existing Corps water resource projects. The Corps seeks to maintain a high level of reliability and peak availability of hydroelectric power-generating capability at multipurpose reservoir projects.
Funding History: The first row of Table 9 shows capital improvements and operation and maintenance expenditures for the hydropower program over the past three-year period.
Performance Indicator: Performance indicator results and targets for the year are displayed in Table 9.
n Percent of time units are available to produce power. The amount of time during a given year that hydroelectric generating units are available to the Power Marketing Administration’s (PMA) interconnected system.
n Percent of time available during periods of peak demand. The amount of time during daily peak-demand periods that hydroelectric generating units are available to the PMA’s interconnected system.
n Percent of forced outages. The percent of time generating units are in an unscheduled or unplanned outage status. The lower the forced
outage rate, the more reliable and less expensive the electrical power provided to the customer.
n Electrical reliability standards met. The percent of Federal Energy Regulatory Commission (FERC) and the National Electric Reliability Council-approved electric reliability standards that are met or exceeded by the program. The FERC has no jurisdiction over the Corps’ hydropower program; however, the Corps takes reliability seriously and has voluntarily chosen to comply with all applicable FERC standards, subject to the availability of resources.
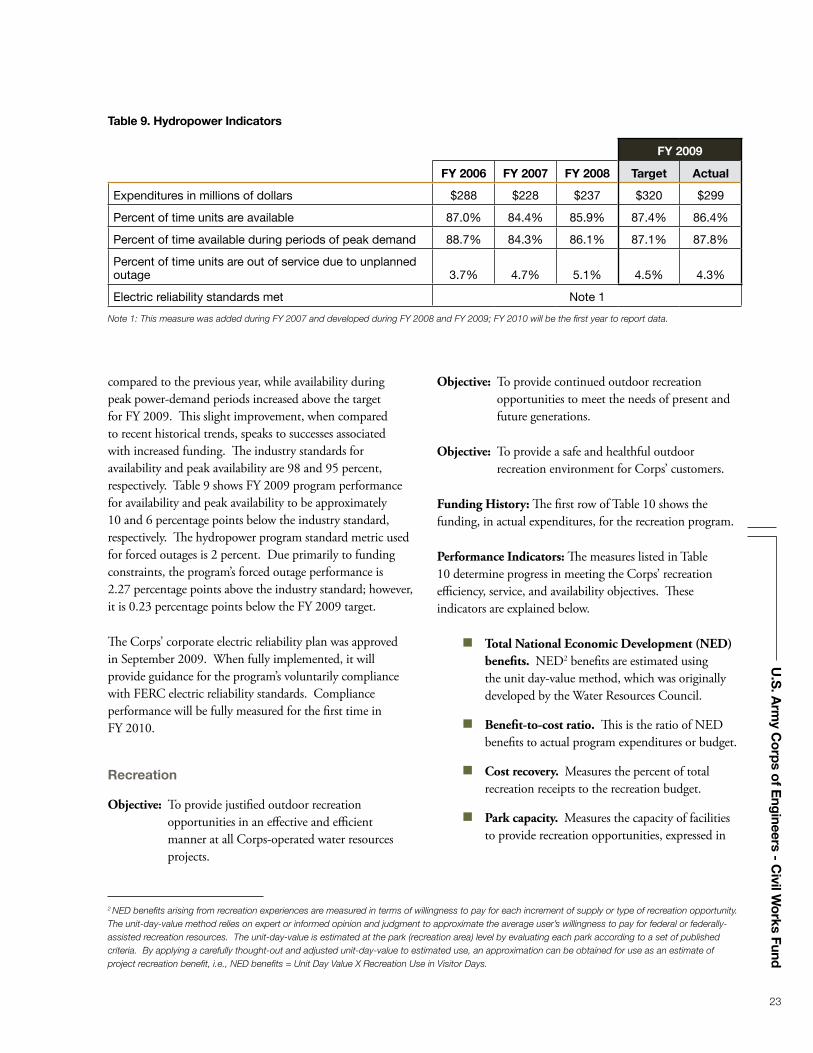
Performance Results
Table 9 shows an increase in FY 2009 funding for the hydropower program. Approximately 40 percent of appropriations did not go toward performance improvements, e.g., replacements, major maintenance, or reduction in backlogged maintenance. Instead, these funds were used to mitigate impacts on endangered fish species in the Pacific Northwest.
The length of time hydropower generating units were actually available to produce power increased slightly when
Sails line the beach at Black Butte Lake
near Chico, California.
U.S
. Arm
y Co
rps o
f Eng
ineers - Civil W
orks Fund
23
compared to the previous year, while availability during peak power-demand periods increased above the target for FY 2009. This slight improvement, when compared to recent historical trends, speaks to successes associated with increased funding. The industry standards for availability and peak availability are 98 and 95 percent, respectively. Table 9 shows FY 2009 program performance for availability and peak availability to be approximately 10 and 6 percentage points below the industry standard, respectively. The hydropower program standard metric used for forced outages is 2 percent. Due primarily to funding constraints, the program’s forced outage performance is 2.27 percentage points above the industry standard; however, it is 0.23 percentage points below the FY 2009 target.
The Corps’ corporate electric reliability plan was approved in September 2009. When fully implemented, it will provide guidance for the program’s voluntarily compliance with FERC electric reliability standards. Compliance performance will be fully measured for the first time in FY 2010.
Recreation
Objective: To provide justified outdoor recreation opportunities in an effective and efficient manner at all Corps-operated water resources projects.
Objective: To provide continued outdoor recreation opportunities to meet the needs of present and future generations.
Objective: To provide a safe and healthful outdoor recreation environment for Corps’ customers.
Funding History: The first row of Table 10 shows the funding, in actual expenditures, for the recreation program.
Performance Indicators: The measures listed in Table 10 determine progress in meeting the Corps’ recreation efficiency, service, and availability objectives. These indicators are explained below.
n Total National Economic Development (NED) benefits. NED2 benefits are estimated using the unit day-value method, which was originally developed by the Water Resources Council.
n Benefit-to-cost ratio. This is the ratio of NED benefits to actual program expenditures or budget.
n Cost recovery. Measures the percent of total recreation receipts to the recreation budget.
n Park capacity. Measures the capacity of facilities to provide recreation opportunities, expressed in
Table 9. Hydropower Indicators
FY 2009
FY 2006 FY 2007 FY 2008 Target Actual
Expenditures in millions of dollars $288 $228 $237 $320 $299
Percent of time units are available 87.0% 84.4% 85.9% 87.4% 86.4%
Percent of time available during periods of peak demand 88.7% 84.3% 86.1% 87.1% 87.8%
Percent of time units are out of service due to unplanned outage 3.7% 4.7% 5.1% 4.5% 4.3%
Electric reliability standards met Note 1
Note 1: This measure was added during FY 2007 and developed during FY 2008 and FY 2009; FY 2010 will be the first year to report data.
2 NED benefits arising from recreation experiences are measured in terms of willingness to pay for each increment of supply or type of recreation opportunity. The unit-day-value method relies on expert or informed opinion and judgment to approximate the average user’s willingness to pay for federal or federally-assisted recreation resources. The unit-day-value is estimated at the park (recreation area) level by evaluating each park according to a set of published criteria. By applying a carefully thought-out and adjusted unit-day-value to estimated use, an approximation can be obtained for use as an estimate of project recreation benefit, i.e., NED benefits = Unit Day Value X Recreation Use in Visitor Days.

24 Fiscal Year 2009 United States Army Annual Civil Works Financial Statement
millions of days/nights that recreation units were available for use.
n Number of visitors. Total number of visitors to Corps-managed parks, expressed in millions of people.
n Visitor health and safety services. This measure is expressed as a percentage of visitors to Corps-managed recreation areas who reported acceptable service.3 (Formerly titled, Customer Satisfaction, this measure has been revised to focus on the visitor’s experience related to service as opposed to the condition of the facility. A separate measure, referencing visitor centers, is no longer used; visitor centers are a component of the recreation area.)
n Facility service. The percentage of visitors served at a Corps-managed recreation area with a facility condition score of 4 or better,4 who indicate their experience was fair to good. (Formerly titled, Facility Conditions, this measure was renamed and slightly modified to emphasize service to the public. The quality of a visitor’s experience and satisfaction with Corps’ facilities are directly related to the facility condition.)
Performance Results
Program funding decreased in inflation-adjusted terms from FY 2008 to FY 2009. As a result, some performance measures increased slightly or, at best, remained the same. Only 47 percent of people who visited Corps’ parks were served at acceptable health and safety service levels. Also, just 45 percent of visitors at Corps’ parks rated the facilities in acceptable condition.
In an attempt to mitigate the combined results of reduced funding and increasing demand, the Corps resorted to reductions in contract services and daily operating hours, as well as shortened recreation seasons.
Water Storage for Water Supply
Objective: To provide municipal and industrial (M&I) water supply storage in a cost-efficient and environmentally responsible manner in partnership with non-federal water management plans, consistent with law and policy.
Funding History: The first row of Table 11 displays funding for water storage under the water supply program.
Table 10. Recreation Indicators
FY 2009
FY 2006 FY 2007 FY 2008 Target Actual
Expenditures in millions of dollars $291 $299 $309 $277 $297
Total NED benefits (in millions of dollars) $1,271 $1,353 $1,452 $1,171 $1,424
Benefit-to-cost ratio 4.46 4.49 4.70 4.32 4.61
Cost recovery 16% 16% 16% 16% 16%
Park capacity (in millions of days) 74 74 74 74 74
Number of visitors (in millions of visits) 131 132 137 127 132
Visitor health and safety services 50% 50% 48% 47% 47%
Facility service 48% 48% 47% 44% 45%
3 A typical park in peak season for the region provides cleaning five days a week, two to three ranger patrols and visitor contacts daily, contract law enforcement, periodic public safety programs, and ability to correct urgent repairs within one to three days.
4 A facility condition score of 4 means the facility requires no more than routine maintenance (e.g., painting, caulking, asphalt patching, filling cracks) to reduce visitor health and safety risks and environmental degradation.
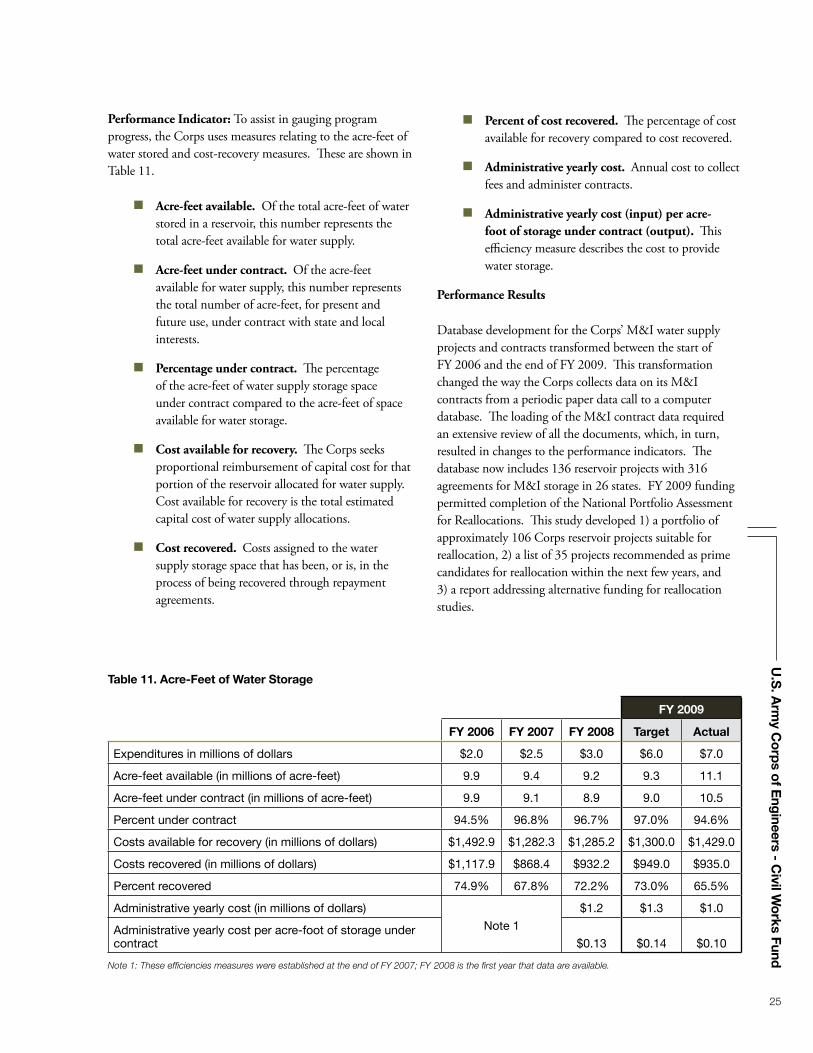
U.S
. Arm
y Co
rps o
f Eng
ineers - Civil W
orks Fund
25
Performance Indicator: To assist in gauging program progress, the Corps uses measures relating to the acre-feet of water stored and cost-recovery measures. These are shown in Table 11.
n Acre-feet available. Of the total acre-feet of water stored in a reservoir, this number represents the total acre-feet available for water supply.
n Acre-feet under contract. Of the acre-feet available for water supply, this number represents the total number of acre-feet, for present and future use, under contract with state and local interests.
n Percentage under contract. The percentage of the acre-feet of water supply storage space under contract compared to the acre-feet of space available for water storage.
n Cost available for recovery. The Corps seeks proportional reimbursement of capital cost for that portion of the reservoir allocated for water supply. Cost available for recovery is the total estimated capital cost of water supply allocations.
n Cost recovered. Costs assigned to the water supply storage space that has been, or is, in the process of being recovered through repayment agreements.
n Percent of cost recovered. The percentage of cost available for recovery compared to cost recovered.
n Administrative yearly cost. Annual cost to collect fees and administer contracts.
n Administrative yearly cost (input) per acre-foot of storage under contract (output). This efficiency measure describes the cost to provide water storage.
Performance Results
Database development for the Corps’ M&I water supply projects and contracts transformed between the start of FY 2006 and the end of FY 2009. This transformation changed the way the Corps collects data on its M&I contracts from a periodic paper data call to a computer database. The loading of the M&I contract data required an extensive review of all the documents, which, in turn, resulted in changes to the performance indicators. The database now includes 136 reservoir projects with 316 agreements for M&I storage in 26 states. FY 2009 funding permitted completion of the National Portfolio Assessment for Reallocations. This study developed 1) a portfolio of approximately 106 Corps reservoir projects suitable for reallocation, 2) a list of 35 projects recommended as prime candidates for reallocation within the next few years, and 3) a report addressing alternative funding for reallocation studies.
Table 11. Acre-Feet of Water Storage
FY 2009
FY 2006 FY 2007 FY 2008 Target Actual
Expenditures in millions of dollars $2.0 $2.5 $3.0 $6.0 $7.0
Acre-feet available (in millions of acre-feet) 9.9 9.4 9.2 9.3 11.1
Acre-feet under contract (in millions of acre-feet) 9.9 9.1 8.9 9.0 10.5
Percent under contract 94.5% 96.8% 96.7% 97.0% 94.6%
Costs available for recovery (in millions of dollars) $1,492.9 $1,282.3 $1,285.2 $1,300.0 $1,429.0
Costs recovered (in millions of dollars) $1,117.9 $868.4 $932.2 $949.0 $935.0
Percent recovered 74.9% 67.8% 72.2% 73.0% 65.5%
Administrative yearly cost (in millions of dollars)
Note 1
$1.2 $1.3 $1.0
Administrative yearly cost per acre-foot of storage under contract $0.13 $0.14 $0.10
Note 1: These efficiencies measures were established at the end of FY 2007; FY 2008 is the first year that data are available.

26 Fiscal Year 2009 United States Army Annual Civil Works Financial Statement
The current funding level provides the minimum amount necessary to continue the water supply program on a caretaker basis. It does not commit the funds required to generate the benefits that could be produced with adequate funding. For example, funds are not available to conduct required sedimentation surveys, yield analysis studies to assess the effect of recent droughts, or conduct studies of water supply reallocation possibilities. These studies would help solve the water supply needs in many communities across the nation.
Goal 4: Reduce Vulnerabilities and Losses to the Nation and the Army from Natural and Man-Made Disasters, Including Terrorism
The goal’s purpose is to manage the risks associated with all types of hazards, and to increase the civil works emergency management program’s responsiveness to disasters in support of federal, state and local emergency management efforts. Disaster preparedness and response capabilities are not limited to water-related events, but also draw on the Corps’ engineering skills and management capabilities in responding to a broad range of natural disasters and national emergencies. The Corps is mindful that emergency readiness contributes to national security.
Objective: To attain and maintain a high, consistent state of preparedness.
Objective: To provide a rapid, effective, and efficient all-hazards response.
Objective: To ensure effective and efficient long-term recovery operations.
Funding History: The first row of Table 12 indicates funding for emergency preparedness and response and recovery operations.
Performance Indicators: The four primary measures, listed in Table 12, assist in determining progress toward meeting the Corps’ emergency management objectives. Indicators are explained below.
n Planning response team readiness. The Corps established designated planning and response teams (PRT) that are organized to provide rapid emergency response within a specific mission area. This measure is calculated as a percentage of time during the fiscal year that PRTs are fully staffed, trained and ready to deploy.
n Project inspection performance. The Corps performs inspections of flood control works operated and maintained by public sponsors to ensure and assess their operations and maintenance condition. This measure is determined by the percentage of scheduled inspections completed during the fiscal year.
n Damaged project restoration. The Corps repairs flood control projects damaged by floods or storms under authority of Public Law 84-99. This measure is the percentage of projects damaged during a fiscal year and repaired prior to the next flood season.
n Project condition ratings. Under the Corps’ rehabilitation and inspection program, inspected projects are given condition ratings characterizing
Table 12. Emergency Preparedness Indicators
FY 2009
FY 2006Note 1
FY 2007Note 1
FY 2008Note 1
TargetNote 2
ActualNote 1
Expenditures in millions of dollars $5,408 $1,561 $847 $40 $1,405
Planning response team readiness 92% 72% 85% 91% 83%
Project inspection performance 93% 97% 58% 93% 67%
Damaged project restoration 65% 29% 90% 35% 14%
Project condition ratings 95% 90% 79% 91% 79%
Note 1: Funding was provided in supplemental appropriations to repair projects damaged by coastal storm and flooding.Note 2: The funding target for FY 2009 was to fund preparedness activities.
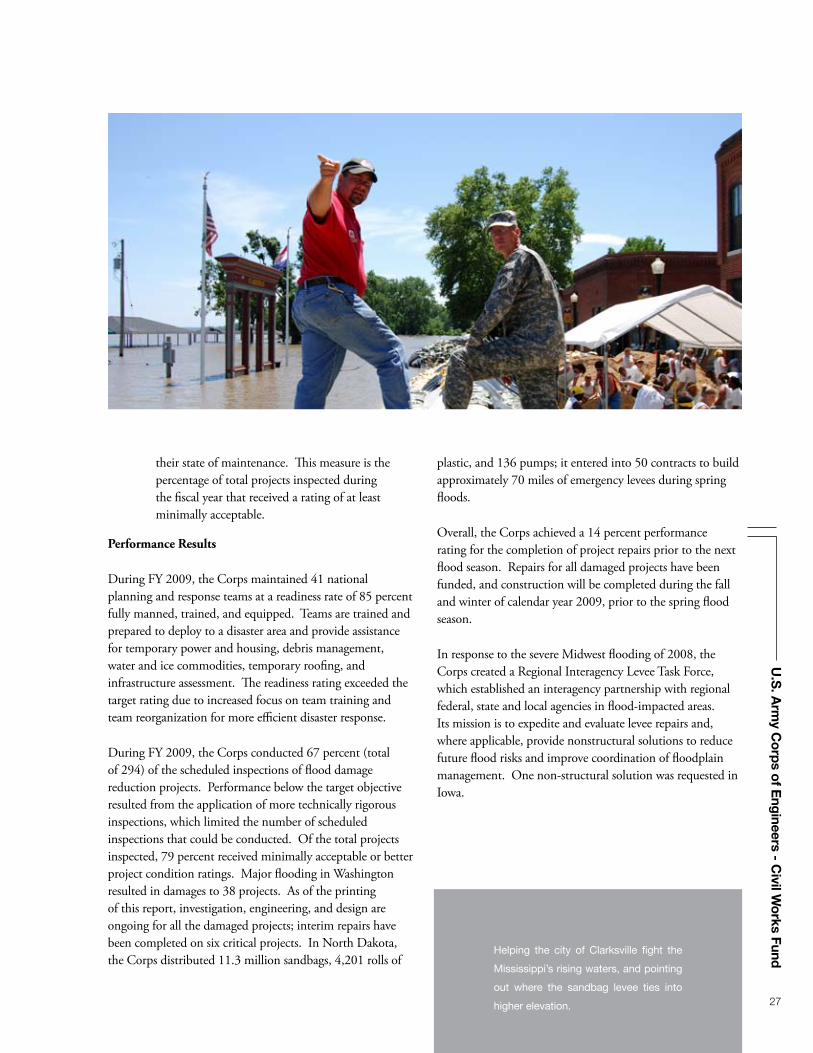
U.S
. Arm
y Co
rps o
f Eng
ineers - Civil W
orks Fund
27
their state of maintenance. This measure is the percentage of total projects inspected during the fiscal year that received a rating of at least minimally acceptable.
Performance Results
During FY 2009, the Corps maintained 41 national planning and response teams at a readiness rate of 85 percent fully manned, trained, and equipped. Teams are trained and prepared to deploy to a disaster area and provide assistance for temporary power and housing, debris management, water and ice commodities, temporary roofing, and infrastructure assessment. The readiness rating exceeded the target rating due to increased focus on team training and team reorganization for more efficient disaster response.
During FY 2009, the Corps conducted 67 percent (total of 294) of the scheduled inspections of flood damage reduction projects. Performance below the target objective resulted from the application of more technically rigorous inspections, which limited the number of scheduled inspections that could be conducted. Of the total projects inspected, 79 percent received minimally acceptable or better project condition ratings. Major flooding in Washington resulted in damages to 38 projects. As of the printing of this report, investigation, engineering, and design are ongoing for all the damaged projects; interim repairs have been completed on six critical projects. In North Dakota, the Corps distributed 11.3 million sandbags, 4,201 rolls of
plastic, and 136 pumps; it entered into 50 contracts to build approximately 70 miles of emergency levees during spring floods.
Overall, the Corps achieved a 14 percent performance rating for the completion of project repairs prior to the next flood season. Repairs for all damaged projects have been funded, and construction will be completed during the fall and winter of calendar year 2009, prior to the spring flood season.
In response to the severe Midwest flooding of 2008, the Corps created a Regional Interagency Levee Task Force, which established an interagency partnership with regional federal, state and local agencies in flood-impacted areas. Its mission is to expedite and evaluate levee repairs and, where applicable, provide nonstructural solutions to reduce future flood risks and improve coordination of floodplain management. One non-structural solution was requested in Iowa.
Helping the city of Clarksville fight the
Mississippi’s rising waters, and pointing
out where the sandbag levee ties into
higher elevation.
28 Fiscal Year 2009 United States Army Annual Civil Works Financial Statement
Possible Future Effects of Existing Conditions
Flood Risk Management
The program’s goal is to reduce the nation’s risk to life and damages due to flooding and coastal storms. The nation faces increasing flood hazards, putting existing developments5 at risk. This is compounded by the fact that new development continues to occur in flood-prone areas, often behind aging flood-control structures, which include levees designed to provide agricultural rather than urban protection. National flood damages, which averaged $3.9 million annually in the 1980s, nearly doubled in the decade 1995 through 2004. Total disaster assistance for emergency response operations, and subsequent long-term recovery efforts, increased from an average of $444 million during the 1980s to $3.75 billion over the period 1995—2004.
Significant investments are required to identify, evaluate, and maintain existing flood infrastructure, e.g., levees, dams, beaches. This includes accounting for changes in the frequency, magnitude, and location of storms, as well as changes in land use. The Corps is responsible for maintaining some of this infrastructure, while other entities are responsible for the remaining infrastructure. Regardless of ownership, all infrastructure elements must function as a holistic system to be effective. In addition to infrastructure maintenance, new flood-risk management measures must be studied, evaluated, and implemented in a timely fashion.
The Marine Transportation System (MTS)
The MTS system is comprised of 1,000 harbor channels, 25,000 miles of inland, intracoastal and coastal waterways, and 241 lock chambers. The national MTS goal is to provide a safe, secure, and globally-integrated network that, in harmony with the environment, ensures reliable movement of people and commerce along waterways, sea lanes, and intermodal connections. Today, approximately 20 percent of the gross domestic product of the United States is generated by foreign trade, and approximately 95 percent of that trade is moved by water. The value of foreign tonnage is over $900 billion and it generates 16 million jobs. Current forecasts predict that maritime trade will double, or possibly triple, in the next 20 years.
Inland Waterways: Eleven inland waterway locks are over 100 years old, and 122 are over 50 years old. In recent years, maintenance deferrals and delays in repairs and replacement of aging locks have driven up the number of unscheduled lock closures. For example, closures due to mechanical breakdowns increased from less than 10,000 hours per year in FY 2000 to more than 30,000 hours per year in FY 2008. These closures have a negative effect on the economy by imposing costs on shippers, carriers, and electric utilities. For example, an unscheduled 52-day closure at Greenup Locks and Dams in Ohio, cost shippers and carriers over $53 million. Additionally, rehabilitations and improvements to inland waterways are jeopardized by the low balance in the Inland Waterways Trust Fund because half of the cost of improvements are derived from this fund.
Coastal Channels and Harbors: Existing high-volume channels and harbors were available only 35 percent of the time in FY 2006, and 32 percent of the time in FY 2007. Inadequate channels negatively affect the economy by imposing costs on vessel operators that, in turn, are reflected in the cost of imports and the price of U.S. exports. On average, failure to maintain one foot of channel depth increases container shipping costs by about 6 percent. Additional economic costs will accrue by postponing investment in deeper and wider channels that address projected future demand.
Environment: Aquatic Ecosystem Restoration
The Aquatic Ecosystem Restoration sub-program’s goal is to restore to a more natural condition, aquatic habitat whose structure, function and dynamic processes have become degraded. To achieve its objectives, the Corps designs and constructs cost-effective projects that modify hydrologic and geomorphic characteristics.
The call for aquatic ecosystem restoration is great; however, the challenge is to strike a sustainable balance between the often conflicting demands for use and control of water resources. Climate change may make this balancing act even more difficult in the future. In FY 2009, the Corps continued its research and development effort to field environmental benefit assessments that more objectively evaluate aquatic ecosystem restoration projects. This will facilitate more consistent results as well as the ability to effectively build and evaluate a national program. In the
5 Development in this context refers to cities, towns, houses, businesses, infrastructure, and other man-made objects that have been constructed in low-lying areas or floodplains.

Carlyle Lake Dam, near Carlyle, Illinois.
Looking southeast, this dam forms the
U.S. Army Corps of Engineers Lake Carlyle,
Illinois’ largest man-made lake, at 26,000
acres. The floating barrier in the foreground
provides added security for the facility and
safety for boaters.
U.S
. Arm
y Co
rps o
f Eng
ineers - Civil W
orks Fund
29

30 Fiscal Year 2009 United States Army Annual Civil Works Financial Statement
absence of a standard metric, the Corps continues to work with other agencies and invest in research and development to objectively evaluate disparate ecosystem restoration projects and prioritize restoration needs. The Corps continues to try to fund a balanced program that addresses the variety of resources needed across the country.
Analysis of Financial Statements
Civil Works Fund Balance Sheet
The USACE balance sheet includes total assets that exceed $60 billion, which is an approximate 24 percent increase over FY 2008. Two asset categories—Fund Balance with Treasury and General Property, Plant and Equipment (GPP&E)—make up just over 86 percent of total assets, with values of $24.9 billion and $27.0 billion, respectively.
Fund Balance with Treasury increased $9.7 billion (64 percent). The USACE received $5.8 billion of Disaster Relief and Recovery Supplemental Appropriations during 1st Quarter, FY 2009, primarily for increased disaster relief and recovery efforts along the Gulf of Mexico. The USACE also received $4.6 billion under the American Recovery and Reinvestment Act during 2nd Quarter, FY 2009, and $797.2 million for navigation channel dredging and recovery efforts related to hurricanes, floods, and other natural disasters during 3rd Quarter, FY 2009.
Total liabilities are approximately $7.3 billion. They are comprised primarily of other liabilities, accounts payable and environmental liabilities, which represent approximately 64 percent of the total amount.
Table 13. Select Civil Works Fund Assets and Liabilities($ in billions)
Asset Type2009
Consolidated2008
Consolidated ChangePercentage of
FY 2009 AssetsGeneral Property, Plant and Equipment $26.98 $26.61 $0.37 45%Fund Balance with Treasury 24.94 15.24 9.70 41%Accounts Receivable 3.01 1.82 1.19 5%Remaining Assets 5.36 4.92 0.44 9%Total Assets $60.29 $48.59 $11.70 100%
Liability Type2009
Consolidated2008
Consolidated Change
Percentage of FY 2009 Liabilities
Other Liabilities $2.55 $2.16 $0.39 35%Accounts Payable 1.05 1.24 (0.19) 15%Environmental Liabilities 1.03 0.98 0.05 14%Remaining Liability 2.64 1.17 1.47 36%Total Liabilities $7.27 $5.55 $1.72 100%Columns and rows may not sum due to rounding.
General Property, Plant and EquipmentFund Balance with TreasuryAccounts ReceivableRemaining Assets
Civil Works Fund Assets Civil Works Fund Liabilities
15%
36%
14%
45%41%
9%5%
35%Other LiabilitiesAccounts PayableEnvironmental LiabilitiesRemaining Liability
Figure 4. Select Civil Works Fund Assets and Liabilities

U.S
. Arm
y Co
rps o
f Eng
ineers - Civil W
orks Fund
31
Stewardship Information
The properties of stewardship assets resemble those of GPP&E assets that are traditionally capitalized in the financial statements. Due to the nature of these assets, however, valuation would be difficult, and matching costs with specific periods would not be meaningful. Stewardship PP&E includes land and heritage assets. Heritage assets are items of historical, natural, cultural, educational, or artistic significance, and items with significant architectural
characteristics. Heritage assets are expected to be preserved indefinitely.
The Corps accounts for heritage assets in three categories: buildings and structures, archeological sites, and other heritage asset. As of September 30, 2009, the Corps reported the following heritage assets: (1) 353 buildings and structures, (2) 587 archeological sites, and (3) 217 other heritage assets comprised of artifact on display in cases.

32 Fiscal Year 2009 United States Army Annual Civil Works Financial Statement

33Civil Works Fund | Principal Financial Statements, Notes, Supplementary Information and Auditor’s Report
Limitations
Limitations of the Financial Statements
The financial statements have been prepared to report the financial position and results of operations for the entity, pursuant to the requirements of Title 31, United States Code, section 3515(b).
While the statements have been prepared from the books and records of the entity, in accordance with the formats prescribed by the Office of Management and Budget, the statements are in addition to the financial reports used to monitor and control budgetary resources which are prepared from the same books and records.
The statements should be read with the realization that they are for a component of the United States Government, a sovereign entity.
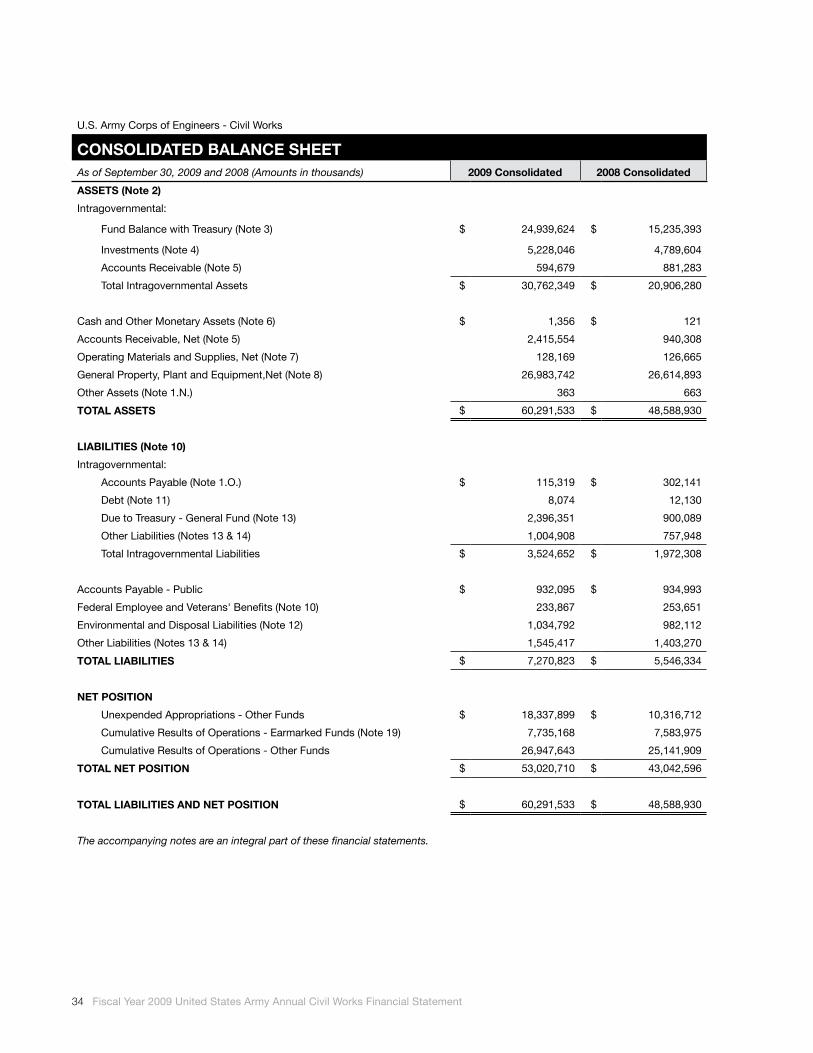
34 Fiscal Year 2009 United States Army Annual Civil Works Financial Statement
U.S. Army Corps of Engineers - Civil Works
CONSOLIDATED BALANCE SHEETAs of September 30, 2009 and 2008 (Amounts in thousands) 2009 Consolidated 2008 Consolidated
ASSETS (Note 2)
Intragovernmental:
Fund Balance with Treasury (Note 3) $ 24,939,624 $ 15,235,393
Investments (Note 4) 5,228,046 4,789,604
Accounts Receivable (Note 5) 594,679 881,283
Total Intragovernmental Assets $ 30,762,349 $ 20,906,280
Cash and Other Monetary Assets (Note 6) $ 1,356 $ 121
Accounts Receivable, Net (Note 5) 2,415,554 940,308
Operating Materials and Supplies, Net (Note 7) 128,169 126,665
General Property, Plant and Equipment,Net (Note 8) 26,983,742 26,614,893
Other Assets (Note 1.N.) 363 663
TOTAL ASSETS $ 60,291,533 $ 48,588,930
LIABILITIES (Note 10)
Intragovernmental:
Accounts Payable (Note 1.O.) $ 115,319 $ 302,141
Debt (Note 11) 8,074 12,130
Due to Treasury - General Fund (Note 13) 2,396,351 900,089
Other Liabilities (Notes 13 & 14) 1,004,908 757,948
Total Intragovernmental Liabilities $ 3,524,652 $ 1,972,308
Accounts Payable - Public $ 932,095 $ 934,993
Federal Employee and Veterans' Benefits (Note 10) 233,867 253,651
Environmental and Disposal Liabilities (Note 12) 1,034,792 982,112
Other Liabilities (Notes 13 & 14) 1,545,417 1,403,270
TOTAL LIABILITIES $ 7,270,823 $ 5,546,334
NET POSITION
Unexpended Appropriations - Other Funds $ 18,337,899 $ 10,316,712
Cumulative Results of Operations - Earmarked Funds (Note 19) 7,735,168 7,583,975
Cumulative Results of Operations - Other Funds 26,947,643 25,141,909
TOTAL NET POSITION $ 53,020,710 $ 43,042,596
TOTAL LIABILITIES AND NET POSITION $ 60,291,533 $ 48,588,930
The accompanying notes are an integral part of these financial statements.
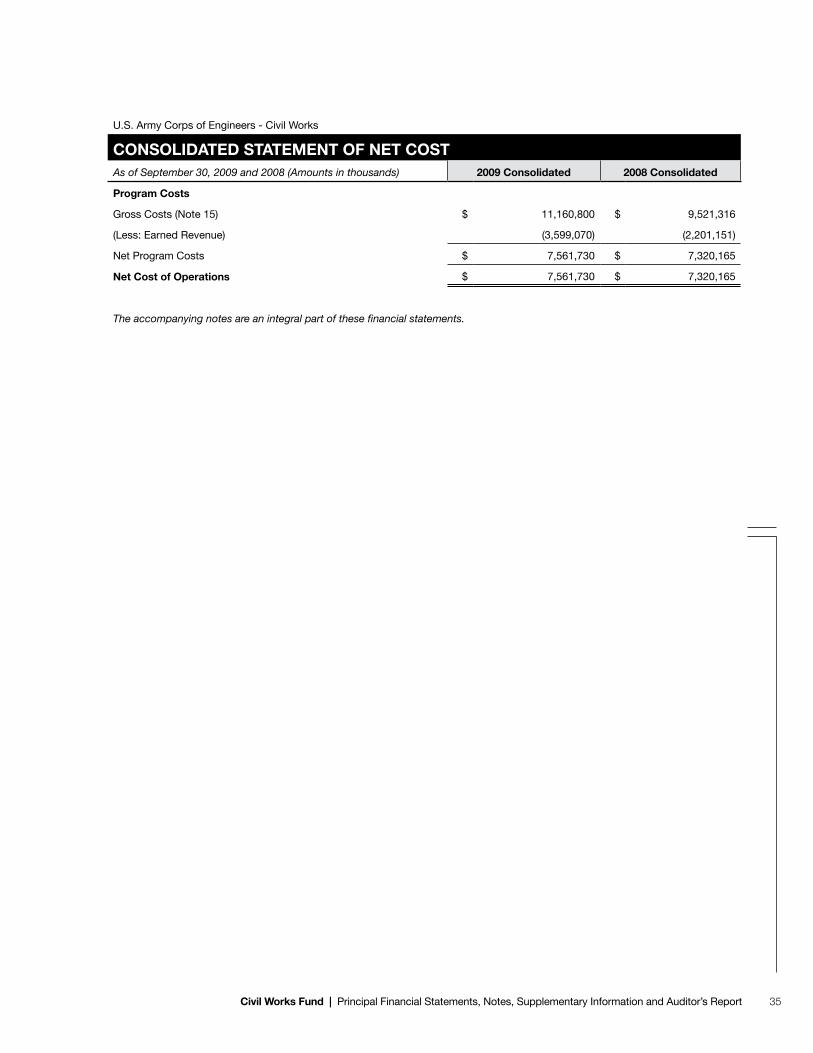
35Civil Works Fund | Principal Financial Statements, Notes, Supplementary Information and Auditor’s Report
U.S. Army Corps of Engineers - Civil Works
CONSOLIDATED STATEMENT OF NET COSTAs of September 30, 2009 and 2008 (Amounts in thousands) 2009 Consolidated 2008 Consolidated
Program Costs
Gross Costs (Note 15) $ 11,160,800 $ 9,521,316
(Less: Earned Revenue) (3,599,070) (2,201,151)
Net Program Costs $ 7,561,730 $ 7,320,165
Net Cost of Operations $ 7,561,730 $ 7,320,165
The accompanying notes are an integral part of these financial statements.
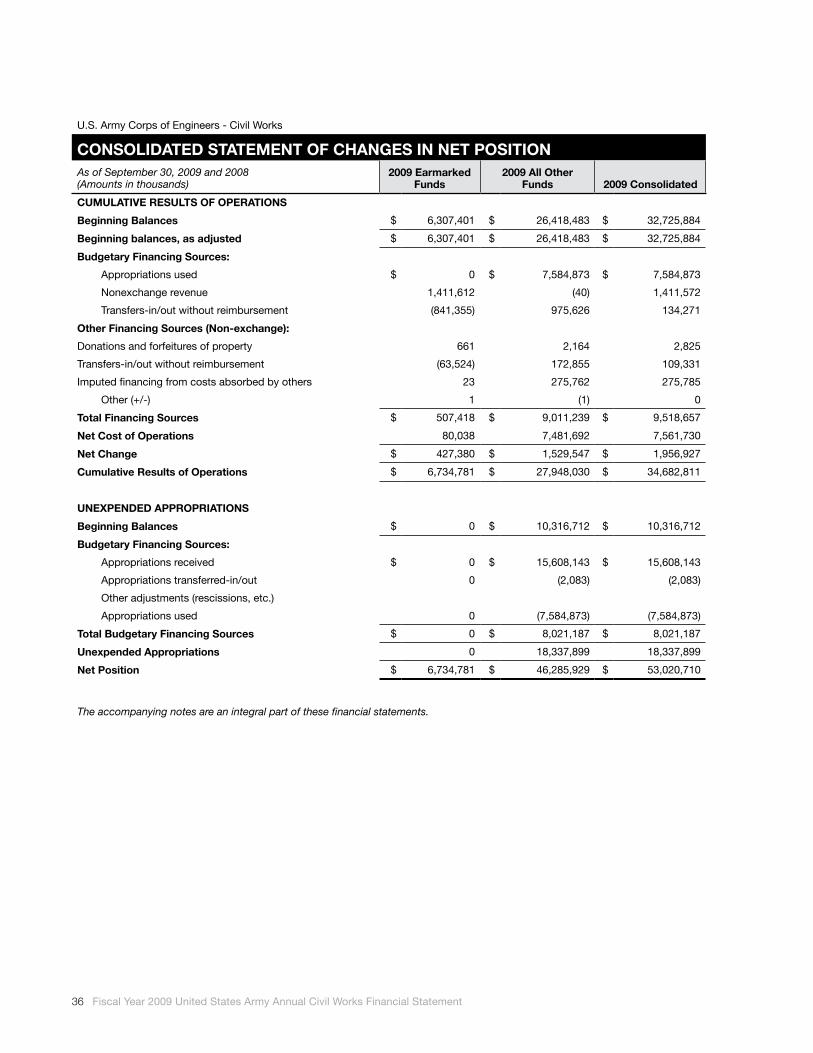
36 Fiscal Year 2009 United States Army Annual Civil Works Financial Statement
U.S. Army Corps of Engineers - Civil Works
CONSOLIDATED STATEMENT OF CHANGES IN NET POSITIONAs of September 30, 2009 and 2008 (Amounts in thousands)
2009 Earmarked Funds
2009 All Other Funds 2009 Consolidated
CUMULATIVE RESULTS OF OPERATIONS
Beginning Balances $ 6,307,401 $ 26,418,483 $ 32,725,884
Beginning balances, as adjusted $ 6,307,401 $ 26,418,483 $ 32,725,884
Budgetary Financing Sources:
Appropriations used $ 0 $ 7,584,873 $ 7,584,873
Nonexchange revenue 1,411,612 (40) 1,411,572
Transfers-in/out without reimbursement (841,355) 975,626 134,271
Other Financing Sources (Non-exchange):
Donations and forfeitures of property 661 2,164 2,825
Transfers-in/out without reimbursement (63,524) 172,855 109,331
Imputed financing from costs absorbed by others 23 275,762 275,785
Other (+/-) 1 (1) 0
Total Financing Sources $ 507,418 $ 9,011,239 $ 9,518,657
Net Cost of Operations 80,038 7,481,692 7,561,730
Net Change $ 427,380 $ 1,529,547 $ 1,956,927
Cumulative Results of Operations $ 6,734,781 $ 27,948,030 $ 34,682,811
UNEXPENDED APPROPRIATIONS
Beginning Balances $ 0 $ 10,316,712 $ 10,316,712
Budgetary Financing Sources:
Appropriations received $ 0 $ 15,608,143 $ 15,608,143
Appropriations transferred-in/out 0 (2,083) (2,083)
Other adjustments (rescissions, etc.)
Appropriations used 0 (7,584,873) (7,584,873)
Total Budgetary Financing Sources $ 0 $ 8,021,187 $ 8,021,187
Unexpended Appropriations 0 18,337,899 18,337,899
Net Position $ 6,734,781 $ 46,285,929 $ 53,020,710
The accompanying notes are an integral part of these financial statements.
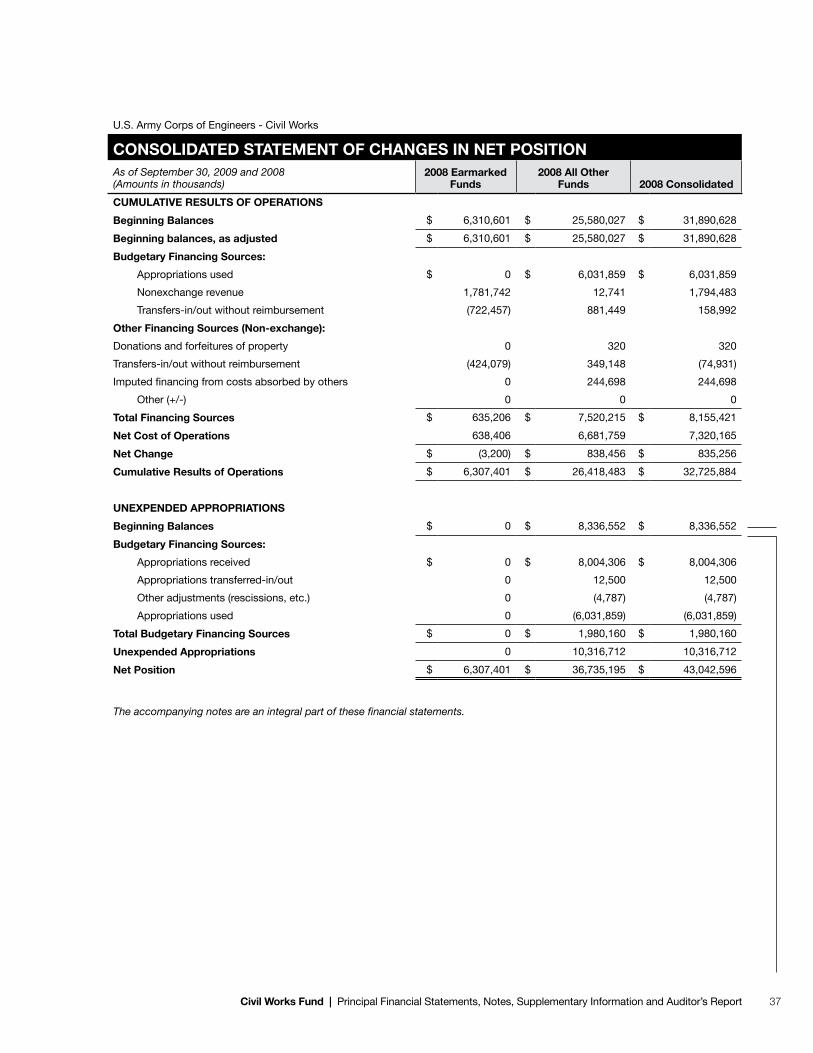
37Civil Works Fund | Principal Financial Statements, Notes, Supplementary Information and Auditor’s Report
U.S. Army Corps of Engineers - Civil Works
CONSOLIDATED STATEMENT OF CHANGES IN NET POSITIONAs of September 30, 2009 and 2008 (Amounts in thousands)
2008 Earmarked Funds
2008 All Other Funds 2008 Consolidated
CUMULATIVE RESULTS OF OPERATIONS
Beginning Balances $ 6,310,601 $ 25,580,027 $ 31,890,628
Beginning balances, as adjusted $ 6,310,601 $ 25,580,027 $ 31,890,628
Budgetary Financing Sources:
Appropriations used $ 0 $ 6,031,859 $ 6,031,859
Nonexchange revenue 1,781,742 12,741 1,794,483
Transfers-in/out without reimbursement (722,457) 881,449 158,992
Other Financing Sources (Non-exchange):
Donations and forfeitures of property 0 320 320
Transfers-in/out without reimbursement (424,079) 349,148 (74,931)
Imputed financing from costs absorbed by others 0 244,698 244,698
Other (+/-) 0 0 0
Total Financing Sources $ 635,206 $ 7,520,215 $ 8,155,421
Net Cost of Operations 638,406 6,681,759 7,320,165
Net Change $ (3,200) $ 838,456 $ 835,256
Cumulative Results of Operations $ 6,307,401 $ 26,418,483 $ 32,725,884
UNEXPENDED APPROPRIATIONS
Beginning Balances $ 0 $ 8,336,552 $ 8,336,552
Budgetary Financing Sources:
Appropriations received $ 0 $ 8,004,306 $ 8,004,306
Appropriations transferred-in/out 0 12,500 12,500
Other adjustments (rescissions, etc.) 0 (4,787) (4,787)
Appropriations used 0 (6,031,859) (6,031,859)
Total Budgetary Financing Sources $ 0 $ 1,980,160 $ 1,980,160
Unexpended Appropriations 0 10,316,712 10,316,712
Net Position $ 6,307,401 $ 36,735,195 $ 43,042,596
The accompanying notes are an integral part of these financial statements.
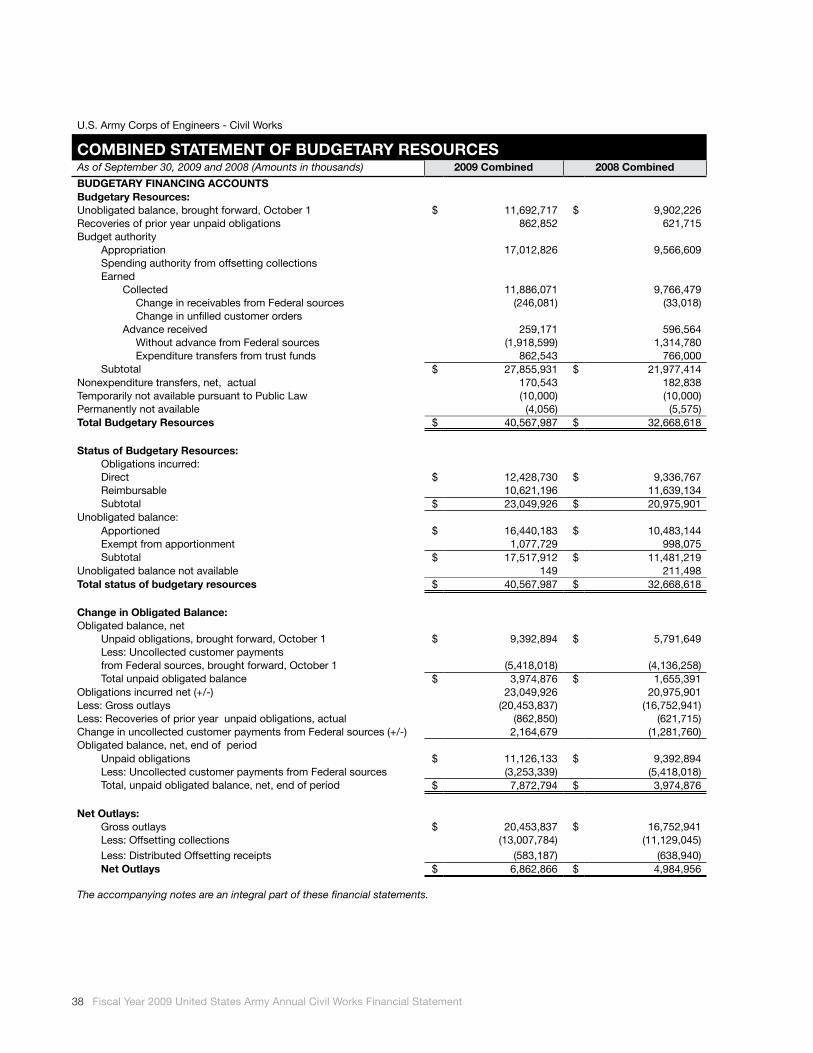
38 Fiscal Year 2009 United States Army Annual Civil Works Financial Statement
U.S. Army Corps of Engineers - Civil Works
COMBINED STATEMENT OF BUDGETARY RESOURCESAs of September 30, 2009 and 2008 (Amounts in thousands) 2009 Combined 2008 Combined
BUDGETARY FINANCING ACCOUNTSBudgetary Resources:Unobligated balance, brought forward, October 1 $ 11,692,717 $ 9,902,226 Recoveries of prior year unpaid obligations 862,852 621,715 Budget authority
Appropriation 17,012,826 9,566,609 Spending authority from offsetting collectionsEarned
Collected 11,886,071 9,766,479 Change in receivables from Federal sources (246,081) (33,018)Change in unfilled customer orders
Advance received 259,171 596,564 Without advance from Federal sources (1,918,599) 1,314,780 Expenditure transfers from trust funds 862,543 766,000
Subtotal $ 27,855,931 $ 21,977,414 Nonexpenditure transfers, net, actual 170,543 182,838 Temporarily not available pursuant to Public Law (10,000) (10,000)Permanently not available (4,056) (5,575)Total Budgetary Resources $ 40,567,987 $ 32,668,618 Status of Budgetary Resources:
Obligations incurred:Direct $ 12,428,730 $ 9,336,767 Reimbursable 10,621,196 11,639,134 Subtotal $ 23,049,926 $ 20,975,901
Unobligated balance:Apportioned $ 16,440,183 $ 10,483,144 Exempt from apportionment 1,077,729 998,075 Subtotal $ 17,517,912 $ 11,481,219
Unobligated balance not available 149 211,498 Total status of budgetary resources $ 40,567,987 $ 32,668,618
Change in Obligated Balance:Obligated balance, net
Unpaid obligations, brought forward, October 1 $ 9,392,894 $ 5,791,649 Less: Uncollected customer paymentsfrom Federal sources, brought forward, October 1 (5,418,018) (4,136,258)Total unpaid obligated balance $ 3,974,876 $ 1,655,391
Obligations incurred net (+/-) 23,049,926 20,975,901 Less: Gross outlays (20,453,837) (16,752,941)Less: Recoveries of prior year unpaid obligations, actual (862,850) (621,715)Change in uncollected customer payments from Federal sources (+/-) 2,164,679 (1,281,760)Obligated balance, net, end of period
Unpaid obligations $ 11,126,133 $ 9,392,894 Less: Uncollected customer payments from Federal sources (3,253,339) (5,418,018)Total, unpaid obligated balance, net, end of period $ 7,872,794 $ 3,974,876
Net Outlays:Gross outlays $ 20,453,837 $ 16,752,941 Less: Offsetting collections (13,007,784) (11,129,045)Less: Distributed Offsetting receipts (583,187) (638,940)Net Outlays $ 6,862,866 $ 4,984,956
The accompanying notes are an integral part of these financial statements.

39Civil Works Fund | Principal Financial Statements, Notes, Supplementary Information and Auditor’s Report
Note 1. Significant Accounting Policies
1.A. Mission of the Reporting Entity
The primary mission of U.S. Army Corps of Engineers Civil Works Program (USACE) includes maintaining navigation channels, reducing flooding, assisting during natural disasters and other emergencies, and making waterways passable. The Civil Works Program also supports the Department of Homeland Security in carrying out the National Response Plan. The USACE’s primary role in support of this plan is to provide emergency support in areas of public works and engineering. The USACE responds to more than 30 presidential disaster declarations in a typical year, and its highly trained workforce is prepared to deal with both man-made and natural disasters.
1.B. Basis of Presentation and Accounting
These financial statements have been prepared to report the financial position and results of operations of the USACE, as required by the Chief Financial Officers Act of 1990, expanded by the Government Management Reform Act of 1994. The financial statements have been prepared from the books and records of the USACE in accordance with the U.S generally accepted accounting principles (GAAP) for federal entities and the formats prescribed by the Office of Management and Budget (OMB) Circular No. A-136, Financial Reporting Requirements. The accompanying financial statements account for all civil works resources for which the USACE is responsible.
The accounting structure of federal agencies is designed to reflect both accrual and budgetary accounting transactions. Under the accrual method of accounting, revenues are recognized when earned and expenses are recognized when incurred without regard to the receipt or payment of cash. The budgetary accounting principles, on the other hand, are designed to recognize the obligation of funds according to legal requirements, which in many cases is prior to the occurrence of an accrual-based transaction. The recognition of budgetary accounting transactions is essential for compliance with legal constraints and controls over the use of federal funds.
The USACE has presented comparative financial statements for the Consolidated Balance Sheets, Consolidated Statements of Net Cost and Changes in Net Position, and Combined Statements of Budgetary Resources, in accordance with OMB financial statement reporting guidelines
The USACE’s financial management system meets all of the requirements for full accrual accounting. The USACE’s transactions are recorded on an accrual accounting basis as required by GAAP.
1.C. Fund Types
General funds are used for financial transactions funded by congressional appropriations, including personnel, operation and maintenance, research and development, procurement, and construction accounts.
Revolving funds received funding to establish an initial corpus through an appropriation or a transfer of resources from existing appropriations or funds. The corpus finances operations and transactions that flow through the fund. The revolving fund resources the goods and services sold to customers on a reimbursable basis and maintains the corpus. Reimbursable receipts fund future operations and generally are available in their entirety for use without further congressional action.
Special funds are used to record government receipts reserved for a specific purpose.
Trust funds contain receipts and expenditures of funds held in trust by the government for use in carrying out specific purposes or programs in accordance with the terms of the donor, trust agreement, or statute.
Contributed funds are received from the public for construction of assets under local cost sharing agreements.
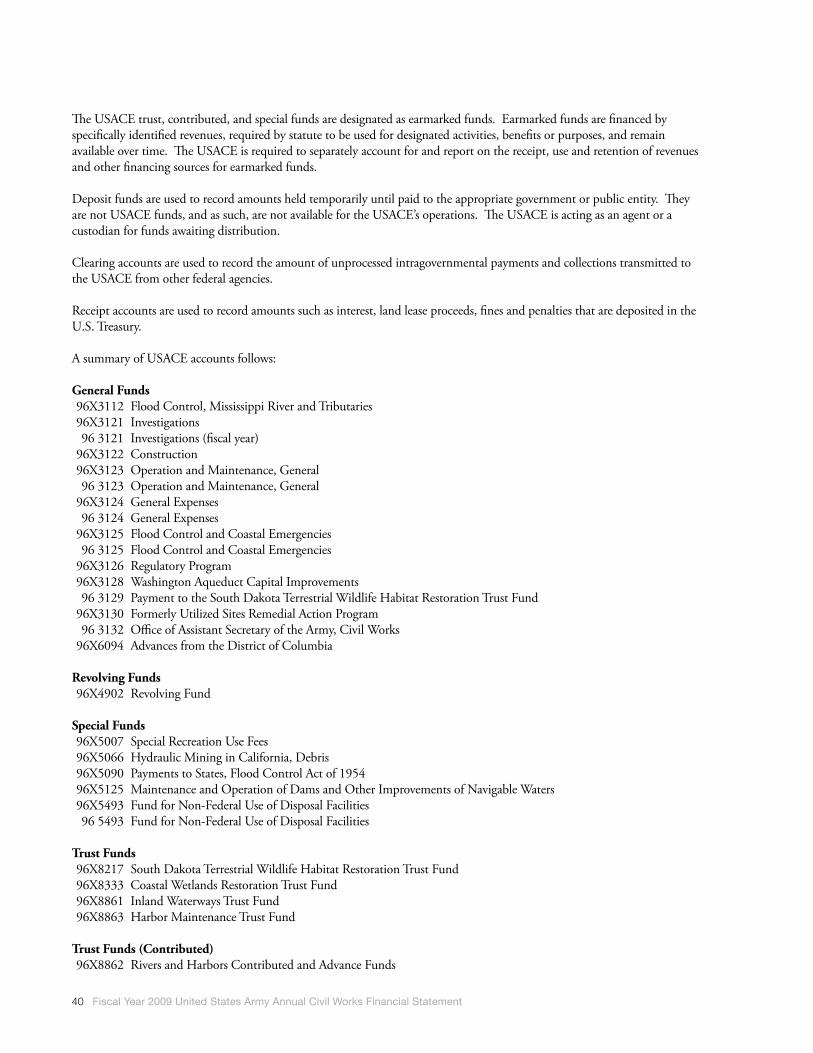
40 Fiscal Year 2009 United States Army Annual Civil Works Financial Statement
The USACE trust, contributed, and special funds are designated as earmarked funds. Earmarked funds are financed by specifically identified revenues, required by statute to be used for designated activities, benefits or purposes, and remain available over time. The USACE is required to separately account for and report on the receipt, use and retention of revenues and other financing sources for earmarked funds.
Deposit funds are used to record amounts held temporarily until paid to the appropriate government or public entity. They are not USACE funds, and as such, are not available for the USACE’s operations. The USACE is acting as an agent or a custodian for funds awaiting distribution.
Clearing accounts are used to record the amount of unprocessed intragovernmental payments and collections transmitted to the USACE from other federal agencies.
Receipt accounts are used to record amounts such as interest, land lease proceeds, fines and penalties that are deposited in the U.S. Treasury.
A summary of USACE accounts follows:
General Funds 96X3112 Flood Control, Mississippi River and Tributaries 96X3121 Investigations 96 3121 Investigations (fiscal year) 96X3122 Construction 96X3123 Operation and Maintenance, General 96 3123 Operation and Maintenance, General 96X3124 General Expenses 96 3124 General Expenses 96X3125 Flood Control and Coastal Emergencies 96 3125 Flood Control and Coastal Emergencies 96X3126 Regulatory Program 96X3128 Washington Aqueduct Capital Improvements 96 3129 Payment to the South Dakota Terrestrial Wildlife Habitat Restoration Trust Fund 96X3130 Formerly Utilized Sites Remedial Action Program 96 3132 Office of Assistant Secretary of the Army, Civil Works 96X6094 Advances from the District of Columbia
Revolving Funds 96X4902 Revolving Fund
Special Funds 96X5007 Special Recreation Use Fees 96X5066 Hydraulic Mining in California, Debris 96X5090 Payments to States, Flood Control Act of 1954 96X5125 Maintenance and Operation of Dams and Other Improvements of Navigable Waters 96X5493 Fund for Non-Federal Use of Disposal Facilities 96 5493 Fund for Non-Federal Use of Disposal Facilities
Trust Funds 96X8217 South Dakota Terrestrial Wildlife Habitat Restoration Trust Fund 96X8333 Coastal Wetlands Restoration Trust Fund 96X8861 Inland Waterways Trust Fund 96X8863 Harbor Maintenance Trust Fund
Trust Funds (Contributed) 96X8862 Rivers and Harbors Contributed and Advance Funds

41Civil Works Fund | Principal Financial Statements, Notes, Supplementary Information and Auditor’s Report
Deposit Funds 96X6500 Advances Without Orders from Non-Federal Sources 96X6501 Small Escrow Amounts
Clearing Accounts 96F3875 Budget Clearing Account (suspense) 96F3880 Unavailable Check Cancellations and Overpayments (suspense) 96F3885 Undistributed Intragovernmental Payments
Receipt Accounts 96R0891 Miscellaneous Fees for Regulatory and Judicial Services, Not Otherwise Classified 96R1060 Forfeitures of Unclaimed Money and Property 96R1099 Fines, Penalties, and Forfeitures, Not Otherwise Classified 96R1299 Gifts to the United States, Not Otherwise Classified 96R1435 General Fund Proprietary Interest, Not Otherwise Classified 96R3220 General Fund Proprietary Receipts, Not Otherwise Classified, All Other 96R5005 Land and Water Conservation Fund 96R5007 Special Recreation Use Fees 96R5066 Hydraulic Mining in California 96R5090 Receipts from Leases of Lands Acquired for Flood Control, Navigation, and Allied Purposes 96R5125 Licenses under Federal Power Act, Improvements of Navigable Waters, Maintenance and Operation of Dams, etc.,
(50%) 96R5493 User Fees, Fund for Non-Federal Use of Disposal Facilities 96R8862 Contributions and Advances, Rivers and Harbors
1.D. Financing Sources
The United States Army Corps of Engineers (USACE) Civil Works Program receives federal funding through the annual Energy and Water Development Appropriations Act. Funding also comes from nonfederal project sponsors who share in project costs according to formulas established by project authorization acts. A third source of funding comes through the Support for Others Program, which is conducted under reimbursable agreements with federal agencies.
The USACE Civil Works Program receives its appropriations and funds as general, revolving, trust, special, and deposit funds. The USACE uses these appropriations and funds to execute its mission and subsequently report on resource usage.
The USACE received borrowing authority from the U.S. Treasury to finance capital improvements to the Washington Aqueduct.
The USACE receives congressional appropriations as financing sources that expire annually, on a multi-year basis, or do not expire. When authorized by legislation, these appropriations are supplemented by revenues generated by sales of goods and services. The USACE recognizes revenue as a result of costs incurred for goods or services provided to other federal agencies and the public. Full cost pricing is the USACE’s standard policy for goods or services provided as required by the Office of Management and Budget (OMB) Circular No. A-25, User Charges.
The USACE records two types of revenue: exchange and non-exchange. Exchange revenue is the inflow of resources that the USACE has earned by providing something of value to the public or another federal entity at a price. The main sources of exchange revenue are customer orders (reimbursable agreements), cost sharing revenue, and long-term water storage agreements.
Customer orders are contracts where the USACE provides goods or services under a reimbursable agreement; the related revenue and accounts receivable are recorded simultaneously along with the costs and payables. For non-federal entities, an advance payment is required and the USACE records advances from others. The USACE reduces advances and recognizes revenue as goods or services are provided.
42 Fiscal Year 2009 United States Army Annual Civil Works Financial Statement
Cost-sharing revenue arises from agreements under which the USACE constructs assets, the cost of which will be borne in part by another entity (sponsor). Throughout the life of a cost-share project, the USACE revenue is earned based on the sponsor’s proportionate share of project costs incurred. Sponsors are generally required to provide funds in advance and the USACE records deferred credits. The USACE withdraws the sponsor’s cash account, which is an escrow account. The USACE reduces the deferred credits and recognizes revenue at the time of the withdrawal for costs incurred.
Non-exchange revenue represents resources received by USACE when a good or service is not provided in exchange for that revenue. Non-exchange revenue generally consists of trust fund receipts, penalties, and donations.
1.E. Recognition of Expenses
The USACE recognizes expenses in the period incurred or consumed. The USACE’s expenditures for capital assets are recognized as operating expenses as the assets are depreciated or amortized.
1.F. Accounting for Intragovernmental Activities
The USACE eliminates transactions within the USACE Civil Works Program in these consolidated financial statements. Accounting standards require that an entity eliminate intraentity activity and balances from consolidated financial statements in order to prevent overstatement for business with itself.
Generally, financing for the construction of USACE’s facilities is obtained through appropriations. To the extent this financing ultimately may have been obtained through the issuance of public debt, interest costs have not been capitalized since the U.S. Treasury does not allocate such costs to the USACE.
In accordance with Statement of Federal Financial Accounting Standard (SFFAS) No. 4, Managerial Cost Accounting Concepts and Standards, the USACE recognizes imputed financing and cost for unreimbursed goods and services provided by others. These costs include unreimbursed rent, interest during construction, Judgment Fund payments on behalf of the USACE and employee benefits.
1.G. Entity and NonEntity Assets
The assets are categorized as entity or nonentity. Entity assets consist of resources that the USACE has the authority to use, or where management is legally obligated to use funds to meet entity obligations. Nonentity assets consist of resources for which the USACE maintains stewardship accountability and responsibility to report but are not available for USACE operations.
1.H. Funds with the U.S. Treasury
The USACE’s monetary financial resources are maintained in U.S. Treasury accounts. The disbursing offices of the USACE Finance Center (UFC), the Defense Finance and Accounting Service (DFAS), and the Department of State’s financial service centers process the majority of USACE cash collections, disbursements, and adjustments worldwide. Each disbursing station prepares monthly reports that provide information to the U.S. Treasury on check issued, electronic fund transfers, interagency transfers, and deposits.
In addition, UFC and DFAS sites submit reports to the U.S. Treasury by appropriation on interagency transfers, collections received, and disbursements issued. The U.S. Treasury records this information to the applicable Fund Balance with Treasury (FBWT) account. Differences between the USACE’s recorded balance in FBWT accounts and U.S. Treasury’s FBWT accounts sometimes result and are subsequently reconciled on a monthly basis.
43Civil Works Fund | Principal Financial Statements, Notes, Supplementary Information and Auditor’s Report
1.I. Investments
The USACE reports investments in U.S. Treasury securities at cost, net of amortized premiums or discounts. Premiums or discounts are amortized over the term of the investment using the effective interest rate method or another method obtaining similar results. The USACE’s intent is to hold investments to maturity, unless they are needed to finance claims or otherwise sustain operations. Consequently, a provision is not made for unrealized gains or losses on these securities.
The Bureau of Public Debt, on behalf of the USACE, invests in nonmarketable securities. Nonmarketable, market-based intragovernmental securities mimic marketable securities, but are not publicly traded.
The USACE’s net investments are held by the South Dakota Terrestrial Habitat Restoration, Inland Waterways, and Harbor Maintenance trust funds.
1.J. Accounts Receivable
Accounts receivable includes three categories: accounts, claims, and refunds receivable from other federal entities or from the public. The USACE bases the allowance for uncollectible accounts receivable due from the public on established percentages per aged category of the cumulative balance of delinquent public receivables. The USACE regards its intragovernmental accounts receivable balance as fully collectable.
Accounts receivable also includes amounts stemming from long-term water storage agreements based on the cost of construction to be recouped by the USACE from the municipality. The USACE performs an analysis of the collectability of the receivables periodically and recognizes an allowance for estimated uncollectible amounts from the municipality.
1.K. Operating Materials and Supplies
The USACE’s operating materials and supplies are stated at historical cost under moving average cost method and are adjusted for the results of physical inventories. Operating materials and supplies are expensed when consumed. There are no restrictions on the use of operating materials and supplies.
1.L. General Property, Plant and Equipment
With the exception of buildings and structures related to hydropower projects which are capitalized regardless of cost, USACE General Property, Plant, and Equipment (PP&E) is capitalized at historical acquisition cost, plus capitalized improvements, when an asset has a useful life of two or more years and the acquisition cost exceeds $25,000.
When it is in the best interest of the government, the USACE provides government property to contractors to complete contract work. The USACE either owns or leases such property, or it is purchased directly by the contractor for the government based on contract terms. When the value of contractor-procured General PP&E exceeds the Department of Defense (DoD) capitalization threshold, it is reported on the USACE’s Balance Sheet.
The USACE uses estimates to support the historical costs of its real property assets, including the administrative costs of land, acquired prior to FY 1999, and personal property assets acquired prior to FY 2003. The alternate methods are necessary because certain supporting documentation to substantiate recorded costs for those assets is no longer available. Management’s alternate methods, which are consistent with the principles, relevant to USACE circumstances, as contained in SFFAS No. 6, Accounting for Property, Plant and Equipment and SFFAS No. 23, Eliminating the Category National Defense Property, Plant And Equipment, consist of using a combination of appropriation or engineering documents, or other available real estate, financial and operations data, combined with written management attestation statements, to estimate and support the original acquisition or construction costs recorded for each asset.
Construction in progress (CIP) is used to accumulate the cost of construction and accumulated costs are transferred from CIP to the relevant asset category when an asset is completed.

44 Fiscal Year 2009 United States Army Annual Civil Works Financial Statement
1.M. Leases
Lease payments for the rental of equipment and operating facilities are classified as operating leases. An operating lease does not substantially transfer all the benefits and risk of ownership. Payments for operating leases are charged to expense over the lease term as it becomes payable.
1.N. Other Assets
Other assets include travel advances that are not reported elsewhere on the USACE’s Balance Sheet.
1.O. Accounts Payable
Accounts payable are the amounts owed, but not yet paid, by the USACE for goods and services received from other entities, progress in contract performance made by other entities, and rents due to other entities. The USACE has no known delinquent accounts payable.
1.P. Debt
The USACE debt consists of the amount owed to the U.S. Treasury for capital improvements to the Washington Aqueduct.
1.Q. Due to Treasury – General Fund
The USACE reported an offsetting custodial liability for amounts Due to Treasury – General Fund for interest and accounts receivable which, when collected, will be deposited in the U.S. Treasury.
1.R. Federal Employee and Veterans’ Benefits
The Federal Employees and Veterans’ Benefits liability consist of the actuarial liability for Federal Employees Compensation Act benefits. The Department of the Army (DA) actuarial liability for workers’ compensation benefits is developed by the Department of Labor and provided to the DA at the end of each fiscal year. The liability for future workers’ compensation benefits includes the expected liability for death, disability, medical and miscellaneous costs for approved compensation cases, plus a component for incurred but not reported claims. The liability is determined using a method that utilizes historical benefit payment patterns related to a specific incurred period to predict the ultimate payments related to that period. Consistent with past practice, these projected annual benefit payments have been discounted to present value using the OMB’s economic assumptions for 10-year U.S. Treasury notes and bonds.
1.S. Other Liabilities
The USACE reports a liability for funded payroll and benefits, to include civilian earned leave, except sick leave, that has been accrued and not used as of the Balance Sheet date. Sick leave is expensed as taken. The liability reported at the end of the accounting period reflects current pay rates.
The SFFAS No. 5, Accounting for Liabilities of the Federal Government, as amended by SFFAS No. 12, Recognition of Contingent Liabilities Arising from Litigation, defines a contingency as an existing condition, situation, or set of circumstances that involves an uncertainty as to possible gain or loss. The uncertainty will be resolved when one or more future events occur or fail to occur. The USACE recognizes contingent liabilities when past events or exchange transactions occur, a future loss is probable, and the loss amount can be reasonably estimated. The USACE discloses contingent liabilities when conditions for liability recognition do not exist but there is at least a reasonable possibility of incurring a loss or additional losses.

45Civil Works Fund | Principal Financial Statements, Notes, Supplementary Information and Auditor’s Report
Examples of loss contingencies include the collectibility of receivables, pending or threatened litigation, and possible claims and assessments. The USACE’s risk of loss and resultant contingent liabilities arise from pending or threatened litigation or claims and assessments due to events such as aircraft, ship and vehicle accidents; property or environmental damages; and contract disputes.
Other liabilities arise as a result of anticipated disposal costs for USACE assets. This type of liability has two components: nonenvironmental and environmental. Consistent with SFFAS No. 6, Accounting for Property, Plant, and Equipment, recognition of an anticipated environmental disposal liability begins when the asset is placed into service. Nonenvironmental disposal liabilities are recognized for assets when management decides to dispose of an asset based upon DoD’s policy, which is consistent with SFFAS No. 5.
1.T. Environmental and Disposal Liabilities
Environmental and disposal liabilities include future costs to address government-related environmental contamination at USACE sites and other sites at which USACE is directed by congress to perform remediation work. The USACE recognizes a liability for each site as the need for cleanup work becomes probable and costs, based on site-specific engineering estimates, become measurable. Costs to address environmental contamination not caused by the government are recorded as incurred. Cleanup remedies are selected from feasible alternatives using the decision-making process prescribed by the Comprehensive Environmental Response, Compensation, and Liability Act.
1.U. Liabilities Not Covered by Budgetary Resources
Liabilities not covered by budgetary resources are those liabilities for which congressional action is needed before budgetary resources can be provided.
1.V. Net Position
Net Position consists of unexpended appropriations and cumulative results of operations.
Unexpended Appropriations include the amounts of authority that are unobligated and have not been rescinded or withdrawn. Unexpended Appropriations also include amounts obligated for which legal liabilities for payments have not been incurred. Cumulative Results of Operations represent the net difference, since inception of an activity, between expenses and losses, and financing sources (including appropriations, revenue, and gains).
1.W. Allocation Transfers
The USACE is a party to allocation transfers with other federal agencies as a receiving (child) entity. Allocation transfers are legal delegations by one agency of its authority to obligate budget authority and outlay funds to another agency. A separate fund account (allocation account) is created in the U.S. Treasury as a subset of the parent fund account for tracking and reporting purposes. All allocation transfers of balances are credited to this account, and subsequent obligations and outlays incurred by the child entity are charged to this allocation account as they execute the delegated activity on behalf of the parent entity. Generally, all financial activity related to these allocation transfers (e.g., budget authority, obligations, outlays) is reported in the financial statements of the parent entity, from which the underlying legislative authority, appropriations and budget apportionments are derived. Exceptions to this general rule affecting the USACE include certain U.S. Treasury-Managed Trust Funds for which the USACE is the child in the allocation transfer, but per OMB guidance, will report all activity relative to these allocation transfers in the reporting entity’s financial statements. The U.S. Treasury-Managed Trust Funds, which are included in USACE financial statements, are South Dakota Terrestrial Wildlife Habitat Restoration, Inland Waterways, and Harbor Maintenance trust funds.

46 Fiscal Year 2009 United States Army Annual Civil Works Financial Statement
In addition to these funds, the USACE received allocation transfers, as the child, from Departments of Agriculture, Interior, Transportation, Energy and the Appalachian Regional Commission.
Note 2. Nonentity AssetsAs of September 30 2009 2008
(Amounts in thousands)
Nonentity Assets
Intragovernmental Assets
Fund Balance with Treasury $ 10,630 $ 10,331
Accounts Receivable 1 3
Total Intragovernmental Assets $ 10,631 $ 10,334
Cash and Other Monetary Assets $ 1,356 $ 121
Accounts Receivable 2,396,350 908,914
Total Nonfederal Assets $ 2,397,706 $ 909,035
Total Nonentity Assets $ 2,408,337 $ 919,369
Total Entity Assets 57,883,196 47,669,561
Total Assets $ 60,291,533 $ 48,588,930
Other Information
Intragovernmental Nonentity Fund Balance with Treasury consists of amounts collected into deposit and suspense accounts and is not available for use in operations. Deposit and suspense accounts are used to record amounts held temporarily until ownership is determined. The USACE is acting as an agent or custodian for funds awaiting distribution.
Intragovernmental Nonentity Accounts Receivable consists of a receivable from the U.S. Coast Guard within the Department of Homeland Security for the usage of dredge disposal areas. Nonentity Accounts Receivable are recorded in unavailable receipt accounts and funds will be returned to the U.S. Treasury when collected. The USACE does not have specific statutory authority to keep the receipts.
Cash and Other Monetary Assets reflect the disbursing officer’s accountability which is comprised of change funds for recreation cashiers, disbursing officer’s cash, and foreign currency. The disbursing officer acts as an agent for the U. S. Treasury.
Nonentity Accounts Receivable represents all current and noncurrent receivables due from nonfederal sources. This includes noncurrent receivables due from state and local municipalities for long-term water storage contracts; current receivables due from state and local municipalities for water storage; long-term receivables for flood control, coastal restoration and hurricane protection for the Louisiana coastal area; accrued interest receivable; penalties, fines, and administrative fees receivable; long-term receivables for hydraulic mining; leasing of land acquired for flood control purposes and the allowance for doubtful accounts. Nonentity Accounts Receivables are recorded in unavailable receipt accounts, including an offsetting custodial liability due to the U. S. Treasury and funds will be returned to the U.S. Treasury when collected. The USACE does not have specific statutory authority to keep the receipts.
Note 1.J and Note 5, Accounts Receivable, and Note 13, Due to Treasury – General Fund and Other Liabilities, provide additional information related to long-term water storage agreements.
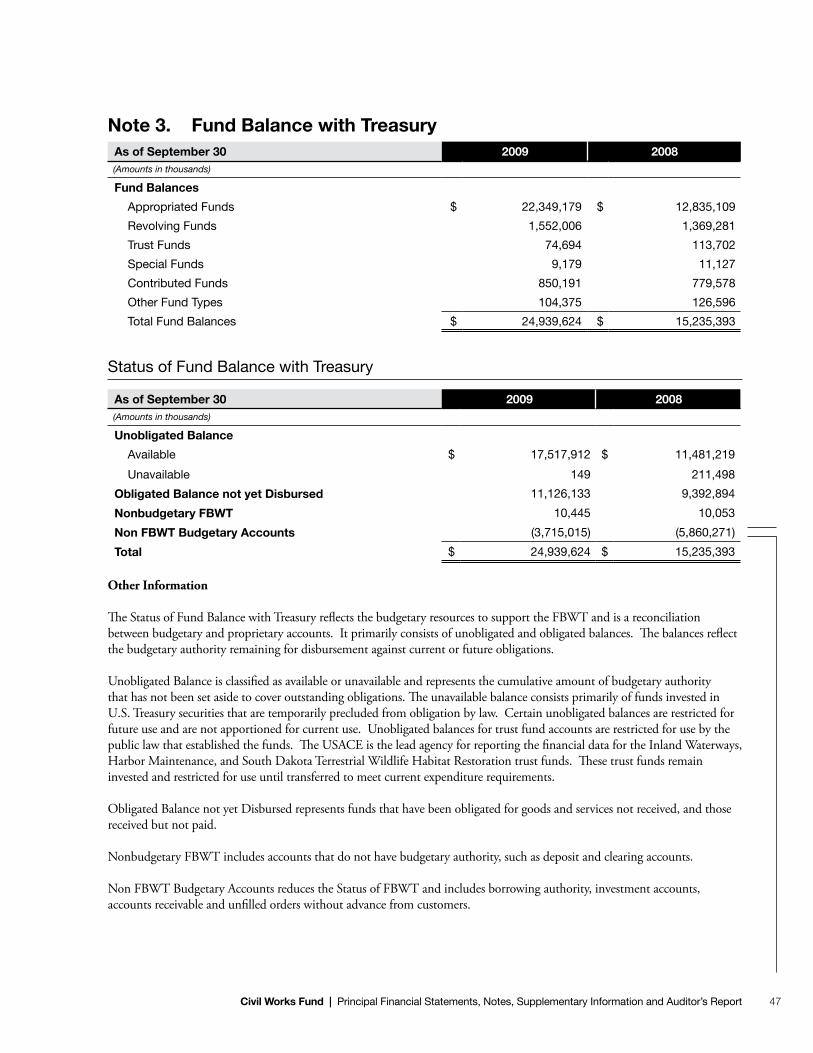
47Civil Works Fund | Principal Financial Statements, Notes, Supplementary Information and Auditor’s Report
Note 3. Fund Balance with TreasuryAs of September 30 2009 2008(Amounts in thousands)
Fund Balances
Appropriated Funds $ 22,349,179 $ 12,835,109
Revolving Funds 1,552,006 1,369,281
Trust Funds 74,694 113,702
Special Funds 9,179 11,127
Contributed Funds 850,191 779,578
Other Fund Types 104,375 126,596
Total Fund Balances $ 24,939,624 $ 15,235,393
Status of Fund Balance with Treasury
As of September 30 2009 2008(Amounts in thousands)
Unobligated Balance
Available $ 17,517,912 $ 11,481,219
Unavailable 149 211,498
Obligated Balance not yet Disbursed 11,126,133 9,392,894
Nonbudgetary FBWT 10,445 10,053
Non FBWT Budgetary Accounts (3,715,015) (5,860,271)
Total $ 24,939,624 $ 15,235,393
Other Information
The Status of Fund Balance with Treasury reflects the budgetary resources to support the FBWT and is a reconciliation between budgetary and proprietary accounts. It primarily consists of unobligated and obligated balances. The balances reflect the budgetary authority remaining for disbursement against current or future obligations.
Unobligated Balance is classified as available or unavailable and represents the cumulative amount of budgetary authority that has not been set aside to cover outstanding obligations. The unavailable balance consists primarily of funds invested in U.S. Treasury securities that are temporarily precluded from obligation by law. Certain unobligated balances are restricted for future use and are not apportioned for current use. Unobligated balances for trust fund accounts are restricted for use by the public law that established the funds. The USACE is the lead agency for reporting the financial data for the Inland Waterways, Harbor Maintenance, and South Dakota Terrestrial Wildlife Habitat Restoration trust funds. These trust funds remain invested and restricted for use until transferred to meet current expenditure requirements.
Obligated Balance not yet Disbursed represents funds that have been obligated for goods and services not received, and those received but not paid.
Nonbudgetary FBWT includes accounts that do not have budgetary authority, such as deposit and clearing accounts.
Non FBWT Budgetary Accounts reduces the Status of FBWT and includes borrowing authority, investment accounts, accounts receivable and unfilled orders without advance from customers.
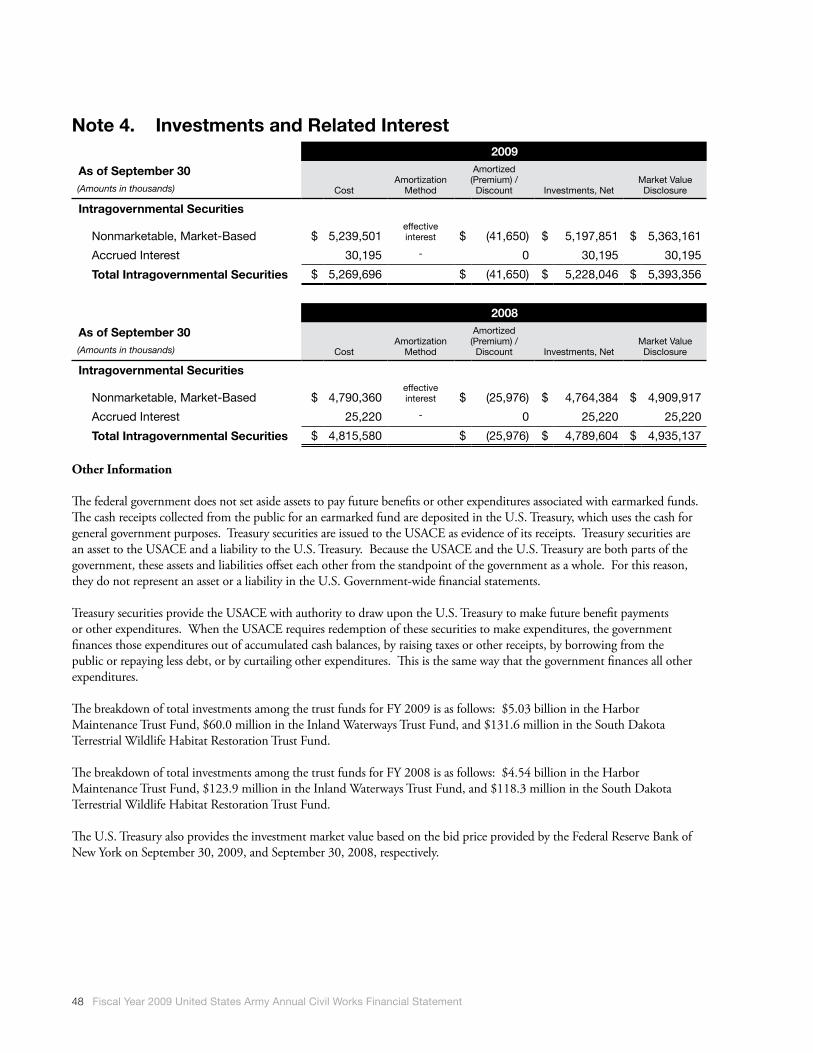
48 Fiscal Year 2009 United States Army Annual Civil Works Financial Statement
Note 4. Investments and Related Interest2009
As of September 30(Amounts in thousands) Cost
Amortization Method
Amortized (Premium) /
Discount Investments, NetMarket Value
Disclosure
Intragovernmental Securities
Nonmarketable, Market-Based $ 5,239,501effective interest $ (41,650) $ 5,197,851 $ 5,363,161
Accrued Interest 30,195 - 0 30,195 30,195
Total Intragovernmental Securities $ 5,269,696 $ (41,650) $ 5,228,046 $ 5,393,356
2008
As of September 30(Amounts in thousands) Cost
Amortization Method
Amortized (Premium) /
Discount Investments, NetMarket Value
Disclosure
Intragovernmental Securities
Nonmarketable, Market-Based $ 4,790,360effective interest $ (25,976) $ 4,764,384 $ 4,909,917
Accrued Interest 25,220 - 0 25,220 25,220
Total Intragovernmental Securities $ 4,815,580 $ (25,976) $ 4,789,604 $ 4,935,137
Other Information
The federal government does not set aside assets to pay future benefits or other expenditures associated with earmarked funds. The cash receipts collected from the public for an earmarked fund are deposited in the U.S. Treasury, which uses the cash for general government purposes. Treasury securities are issued to the USACE as evidence of its receipts. Treasury securities are an asset to the USACE and a liability to the U.S. Treasury. Because the USACE and the U.S. Treasury are both parts of the government, these assets and liabilities offset each other from the standpoint of the government as a whole. For this reason, they do not represent an asset or a liability in the U.S. Government-wide financial statements.
Treasury securities provide the USACE with authority to draw upon the U.S. Treasury to make future benefit payments or other expenditures. When the USACE requires redemption of these securities to make expenditures, the government finances those expenditures out of accumulated cash balances, by raising taxes or other receipts, by borrowing from the public or repaying less debt, or by curtailing other expenditures. This is the same way that the government finances all other expenditures. The breakdown of total investments among the trust funds for FY 2009 is as follows: $5.03 billion in the Harbor Maintenance Trust Fund, $60.0 million in the Inland Waterways Trust Fund, and $131.6 million in the South Dakota Terrestrial Wildlife Habitat Restoration Trust Fund.
The breakdown of total investments among the trust funds for FY 2008 is as follows: $4.54 billion in the Harbor Maintenance Trust Fund, $123.9 million in the Inland Waterways Trust Fund, and $118.3 million in the South Dakota Terrestrial Wildlife Habitat Restoration Trust Fund.
The U.S. Treasury also provides the investment market value based on the bid price provided by the Federal Reserve Bank of New York on September 30, 2009, and September 30, 2008, respectively.

49Civil Works Fund | Principal Financial Statements, Notes, Supplementary Information and Auditor’s Report
Note 5. Accounts Receivable, Net2009
As of September 30(Amounts in thousands) Gross Amount Due
Allowance For Estimated Uncollectibles Accounts Receivable, Net
Intragovernmental Receivables $ 594,679 N/A $ 594,679
Nonfederal Receivables (From the Public) 2,419,528 $ (3,974) 2,415,554
Total Accounts Receivable $ 3,014,207 $ (3,974) $ 3,010,233
2008
As of September 30(Amounts in thousands) Gross Amount Due
Allowance For Estimated Uncollectibles Accounts Receivable, Net
Intragovernmental Receivables $ 881,283 N/A $ 881,283
Nonfederal Receivables (From the Public) 941,148 $ (840) 940,308
Total Accounts Receivable $ 1,822,431 $ (840) $ 1,821,591
Other Information
As of September 30, 2009, and September 30, 2008, accounts receivable from the public, net of allowances, stemming from long-term water storage and Louisiana coastal restoration, flood control and hurricane protection agreements include $2.2 billion and $728.1 million respectively. These agreements have maturity dates ranging from 2 to 50 years, and interest rates based on the U.S. Treasury effect rate at the time of the agreement.
Note 6. Cash and Other Monetary AssetsAs of September 30 2009 2008(Amounts in thousands)
Cash $ 47 $ 23
Foreign Currency 1,309 98
Total Cash and Foreign Currency $ 1,356 $ 121
Other Information
Cash is the total of cash resources under the control of the USACE, which includes coin, paper currency, negotiable instruments, and amounts held for deposit in banks and other financial institutions. Foreign currency consists of the total U.S. dollar equivalent of both purchased and nonpurchased foreign currencies held in foreign currency fund accounts.
The USACE conducts operations overseas on behalf of the U.S. Government which involves the use of foreign currency. Foreign currency fluctuations require adjustments to the original obligation amount at the time of payment. The USACE does not separately identify currency fluctuations.
The USACE translates foreign currency to U.S. dollars utilizing the U.S. Treasury prevailing rate of exchange. This rate is the most favorable rate that would legally be available to the federal government acquisition of foreign currency for its official disbursements and accommodation of exchange transactions. There are no significant effects from changes in the foreign currency exchange rate.

50 Fiscal Year 2009 United States Army Annual Civil Works Financial Statement
Note 7. Operating Materials and SuppliesAs of September 30 2009 2008(Amounts in thousands)
Operating Materials & Supplies:
Items Held for Use $ 128,169 $ 126,665
Total $ 128,169 $ 126,665
Other Information
Operating materials and supplies (OM&S) is comprised of personal property to be consumed in normal operations. The OM&S category includes materials used for constructing riverbank stabilization devices, spare and repair parts, miscellaneous office supplies, and prepaid postage. Moving average cost flow assumptions are applied in arriving at the historical cost of the ending OM&S and cost of goods consumed.
As of September 30, 2009 and 2008, there were differences between the carrying amount and the net realizable value of OM&S of $14,900 due to excess, obsolete, or unserviceable items. There are no restrictions on the use of OM&S.
The USACE maintains OM&S stocks because many unique materials and supplies are not readily available in the market and will eventually be needed.
As of September 30, 2009 and 2008, the USACE does not have inventories, stockpile materials, seized or forfeited properties, or goods held under price support and stabilization programs, as defined in SFFAS No. 3, Accounting for Inventory and Related Property.
Note 8. General Property, Plant & Equipment, Net2009
As of September 30 (Amounts in thousands)
Depreciation/ Amortization
MethodServiceLife (yrs) Acquisition Value
(Accumulated Depreciation/ Amortization) Net Book Value
Major Asset Classes
Land N/A N/A $ 8,958,792 N/A $ 8,958,792
Buildings, Structures, and Facilities S/L 20 - 100 28,534,507 $ (14,443,620) 14,090,887
Leasehold Improvements S/L lease term 41,587 (35,751) 5,836
Software S/L 2 - 10 94,574 (84,408) 10,166
General Equipment S/L 5 - 50 1,524,213 (771,677) 752,536
Construction-in-Progress N/A N/A 3,165,519 N/A 3,165,519
Other 8 (2) 6
Total General PP&E $ 42,319,200 $ (15,335,458) $ 26,983,742
Legend for Depreciation Methods:S/L = Straight Line N/A = Not Applicable
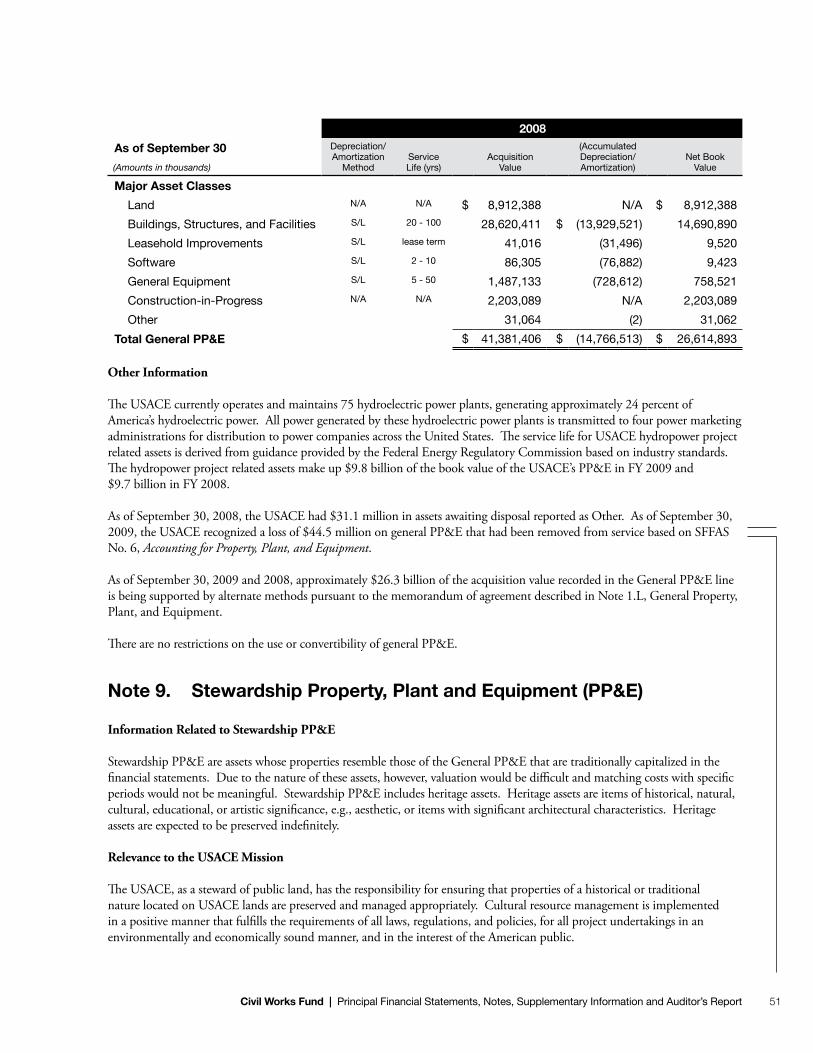
51Civil Works Fund | Principal Financial Statements, Notes, Supplementary Information and Auditor’s Report
2008
As of September 30
(Amounts in thousands)
Depreciation/ Amortization
MethodServiceLife (yrs)
Acquisition Value
(Accumulated Depreciation/ Amortization)
Net Book Value
Major Asset Classes
Land N/A N/A $ 8,912,388 N/A $ 8,912,388
Buildings, Structures, and Facilities S/L 20 - 100 28,620,411 $ (13,929,521) 14,690,890
Leasehold Improvements S/L lease term 41,016 (31,496) 9,520
Software S/L 2 - 10 86,305 (76,882) 9,423
General Equipment S/L 5 - 50 1,487,133 (728,612) 758,521
Construction-in-Progress N/A N/A 2,203,089 N/A 2,203,089
Other 31,064 (2) 31,062
Total General PP&E $ 41,381,406 $ (14,766,513) $ 26,614,893
Other Information
The USACE currently operates and maintains 75 hydroelectric power plants, generating approximately 24 percent of America’s hydroelectric power. All power generated by these hydroelectric power plants is transmitted to four power marketing administrations for distribution to power companies across the United States. The service life for USACE hydropower project related assets is derived from guidance provided by the Federal Energy Regulatory Commission based on industry standards. The hydropower project related assets make up $9.8 billion of the book value of the USACE’s PP&E in FY 2009 and $9.7 billion in FY 2008.
As of September 30, 2008, the USACE had $31.1 million in assets awaiting disposal reported as Other. As of September 30, 2009, the USACE recognized a loss of $44.5 million on general PP&E that had been removed from service based on SFFAS No. 6, Accounting for Property, Plant, and Equipment.
As of September 30, 2009 and 2008, approximately $26.3 billion of the acquisition value recorded in the General PP&E line is being supported by alternate methods pursuant to the memorandum of agreement described in Note 1.L, General Property, Plant, and Equipment.
There are no restrictions on the use or convertibility of general PP&E.
Note 9. Stewardship Property, Plant and Equipment (PP&E)
Information Related to Stewardship PP&E
Stewardship PP&E are assets whose properties resemble those of the General PP&E that are traditionally capitalized in the financial statements. Due to the nature of these assets, however, valuation would be difficult and matching costs with specific periods would not be meaningful. Stewardship PP&E includes heritage assets. Heritage assets are items of historical, natural, cultural, educational, or artistic significance, e.g., aesthetic, or items with significant architectural characteristics. Heritage assets are expected to be preserved indefinitely.
Relevance to the USACE Mission
The USACE, as a steward of public land, has the responsibility for ensuring that properties of a historical or traditional nature located on USACE lands are preserved and managed appropriately. Cultural resource management is implemented in a positive manner that fulfills the requirements of all laws, regulations, and policies, for all project undertakings in an environmentally and economically sound manner, and in the interest of the American public.
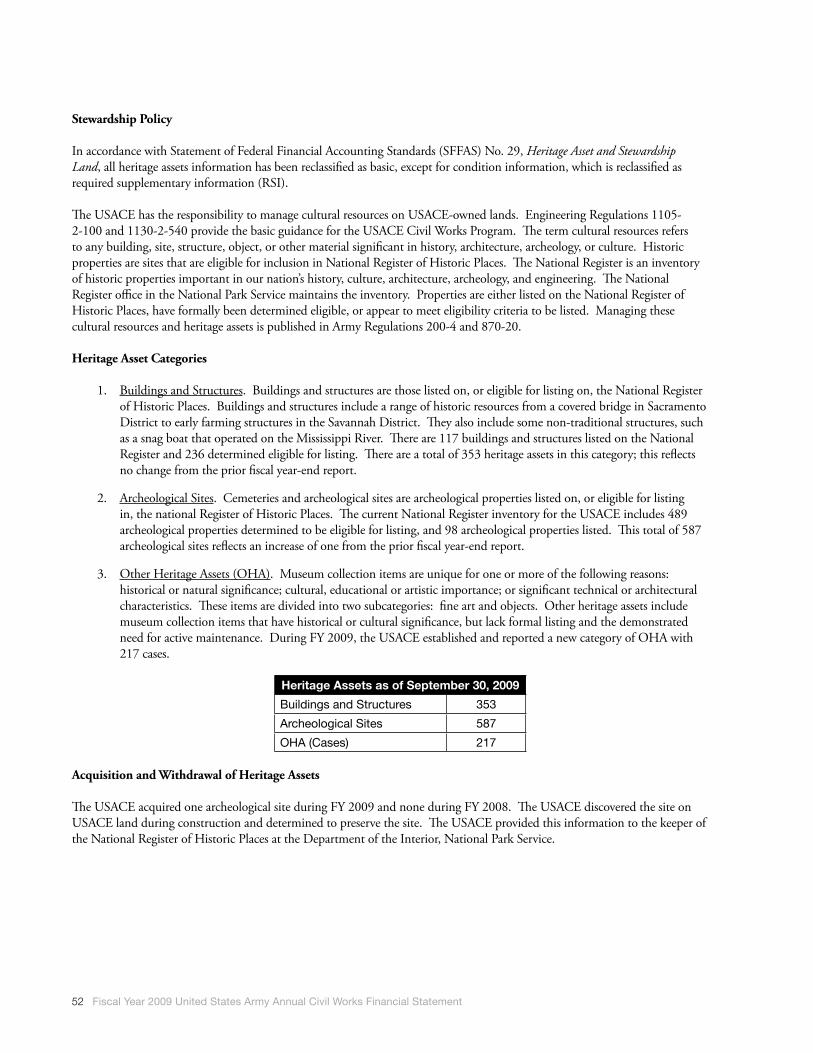
52 Fiscal Year 2009 United States Army Annual Civil Works Financial Statement
Stewardship Policy
In accordance with Statement of Federal Financial Accounting Standards (SFFAS) No. 29, Heritage Asset and Stewardship Land, all heritage assets information has been reclassified as basic, except for condition information, which is reclassified as required supplementary information (RSI).
The USACE has the responsibility to manage cultural resources on USACE-owned lands. Engineering Regulations 1105-2-100 and 1130-2-540 provide the basic guidance for the USACE Civil Works Program. The term cultural resources refers to any building, site, structure, object, or other material significant in history, architecture, archeology, or culture. Historic properties are sites that are eligible for inclusion in National Register of Historic Places. The National Register is an inventory of historic properties important in our nation’s history, culture, architecture, archeology, and engineering. The National Register office in the National Park Service maintains the inventory. Properties are either listed on the National Register of Historic Places, have formally been determined eligible, or appear to meet eligibility criteria to be listed. Managing these cultural resources and heritage assets is published in Army Regulations 200-4 and 870-20.
Heritage Asset Categories
1. Buildings and Structures. Buildings and structures are those listed on, or eligible for listing on, the National Register of Historic Places. Buildings and structures include a range of historic resources from a covered bridge in Sacramento District to early farming structures in the Savannah District. They also include some non-traditional structures, such as a snag boat that operated on the Mississippi River. There are 117 buildings and structures listed on the National Register and 236 determined eligible for listing. There are a total of 353 heritage assets in this category; this reflects no change from the prior fiscal year-end report.
2. Archeological Sites. Cemeteries and archeological sites are archeological properties listed on, or eligible for listing in, the national Register of Historic Places. The current National Register inventory for the USACE includes 489 archeological properties determined to be eligible for listing, and 98 archeological properties listed. This total of 587 archeological sites reflects an increase of one from the prior fiscal year-end report.
3. Other Heritage Assets (OHA). Museum collection items are unique for one or more of the following reasons: historical or natural significance; cultural, educational or artistic importance; or significant technical or architectural characteristics. These items are divided into two subcategories: fine art and objects. Other heritage assets include museum collection items that have historical or cultural significance, but lack formal listing and the demonstrated need for active maintenance. During FY 2009, the USACE established and reported a new category of OHA with 217 cases.
Heritage Assets as of September 30, 2009
Buildings and Structures 353
Archeological Sites 587
OHA (Cases) 217
Acquisition and Withdrawal of Heritage Assets
The USACE acquired one archeological site during FY 2009 and none during FY 2008. The USACE discovered the site on USACE land during construction and determined to preserve the site. The USACE provided this information to the keeper of the National Register of Historic Places at the Department of the Interior, National Park Service.

53Civil Works Fund | Principal Financial Statements, Notes, Supplementary Information and Auditor’s Report
Note 10. Liabilities Not Covered by Budgetary ResourcesAs of September 30 2009 2008(Amounts in thousands)
Intragovernmental Liabilities
Debt $ 8,074 $ 12,130
Due to Treasury - General Fund 2,396,351 900,089
Other 222,199 215,888
Total Intragovernmental Liabilities $ 2,626,624 $ 1,128,107
Federal Employee and Veterans’ Benefits 233,867 253,356
Environmental Liabilities 1,034,792 982,112
Contingent Liabilities 45,920 54,047
Total Liabilities Not Covered by Budgetary Resources $ 3,941,203 $ 2,417,622
Total Liabilities Covered by Budgetary Resources 3,329,620 3,128,712
Total Liabilities $ 7,270,823 $ 5,546,334
Other Information
Intragovernmental Liabilities – Debt is comprised of the amount owed by the USACE to the U.S. Treasury for capital improvements to the Washington Aqueduct. Arlington County and the City of Falls Church, Virginia, provide funding to the USACE to repay the debt. Refer to Note 11, Debt, for additional details and disclosures.
Intragovernmental Liabilities – Due to Treasury - General Fund includes offsetting custodial liability to accounts receivable. The custodial liability is for amounts that will be deposited in the general fund of the U.S. Treasury when collected and are primarily related to long term water storage and Louisiana coastal restoration, flood control and hurricane protection agreements. Budgetary resources are not required for these types of liabilities.
Intragovernmental Liabilities – Other includes Judgment Fund liabilities-Contract Dispute Act (CDA), and workmen’s compensation liabilities under the Federal Employees Compensation Act (FECA). The USACE is seeking supplemental funding for the CDA liability. The FECA liability will not be funded until FY 2010.
Federal Employee and Veterans’ Benefits include actuarial liability for FECA. Refer to Note 13, Due to Treasury - General Fund and Other Liabilities, for additional details and disclosures. The FECA actuarial liability is a future funded expense and will be funded in future appropriations.
Environmental Liabilities represent estimated cleanup costs for environmental liabilities, which will be funded in future appropriations. Refer to Note 12, Environmental and Disposal Liabilities, and Note 13, Due to Treasury - General Fund and Other Liabilities, for additional details and disclosures.
Contingent liabilities represent probable losses related to lawsuits filed against the USACE. Contingent liabilities may be funded in future appropriations. Refer to Note 14, Contingencies for additional details and disclosures.
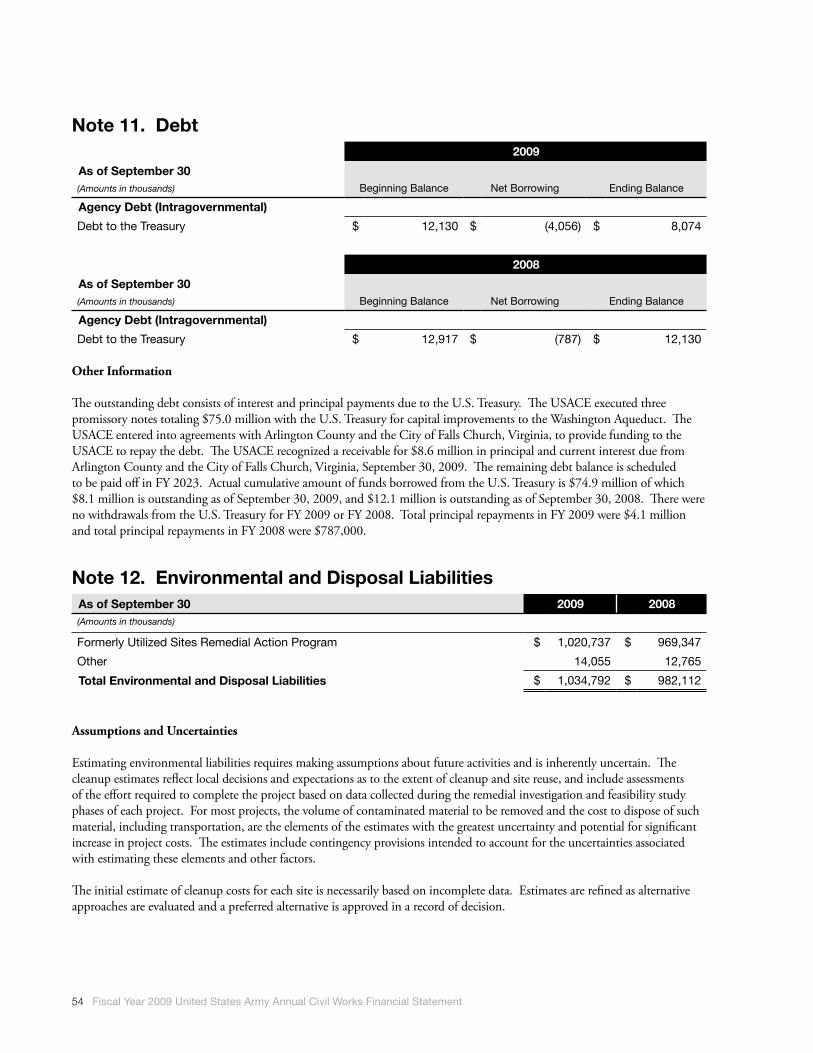
54 Fiscal Year 2009 United States Army Annual Civil Works Financial Statement
Note 11. Debt2009
As of September 30 (Amounts in thousands) Beginning Balance Net Borrowing Ending Balance
Agency Debt (Intragovernmental)
Debt to the Treasury $ 12,130 $ (4,056) $ 8,074
2008
As of September 30 (Amounts in thousands) Beginning Balance Net Borrowing Ending Balance
Agency Debt (Intragovernmental)
Debt to the Treasury $ 12,917 $ (787) $ 12,130
Other Information
The outstanding debt consists of interest and principal payments due to the U.S. Treasury. The USACE executed three promissory notes totaling $75.0 million with the U.S. Treasury for capital improvements to the Washington Aqueduct. The USACE entered into agreements with Arlington County and the City of Falls Church, Virginia, to provide funding to the USACE to repay the debt. The USACE recognized a receivable for $8.6 million in principal and current interest due from Arlington County and the City of Falls Church, Virginia, September 30, 2009. The remaining debt balance is scheduled to be paid off in FY 2023. Actual cumulative amount of funds borrowed from the U.S. Treasury is $74.9 million of which $8.1 million is outstanding as of September 30, 2009, and $12.1 million is outstanding as of September 30, 2008. There were no withdrawals from the U.S. Treasury for FY 2009 or FY 2008. Total principal repayments in FY 2009 were $4.1 million and total principal repayments in FY 2008 were $787,000.
Note 12. Environmental and Disposal LiabilitiesAs of September 30 2009 2008(Amounts in thousands)
Formerly Utilized Sites Remedial Action Program $ 1,020,737 $ 969,347
Other 14,055 12,765
Total Environmental and Disposal Liabilities $ 1,034,792 $ 982,112
Assumptions and Uncertainties
Estimating environmental liabilities requires making assumptions about future activities and is inherently uncertain. The cleanup estimates reflect local decisions and expectations as to the extent of cleanup and site reuse, and include assessments of the effort required to complete the project based on data collected during the remedial investigation and feasibility study phases of each project. For most projects, the volume of contaminated material to be removed and the cost to dispose of such material, including transportation, are the elements of the estimates with the greatest uncertainty and potential for significant increase in project costs. The estimates include contingency provisions intended to account for the uncertainties associated with estimating these elements and other factors.
The initial estimate of cleanup costs for each site is necessarily based on incomplete data. Estimates are refined as alternative approaches are evaluated and a preferred alternative is approved in a record of decision.

55Civil Works Fund | Principal Financial Statements, Notes, Supplementary Information and Auditor’s Report
The environmental liability estimates are dependent on annual funding levels and achievement of work as scheduled. congressional appropriations at lower than anticipated levels, unplanned delays in project completion, or future changes in costs may cause actual costs to be higher than the recorded liability.
The USACE considers various key factors in determining whether future outflows of resources can be reasonably estimated, including:
n Completion of remedial investigation or feasibility study or other study,
n Experience with similar site or conditions, and
n Availability of remediation technology.
The environmental liabilities of $1.0 billion do not include sites where the USACE has identified likely contamination resulting from past Tungsten Queen Mine related activities, but for which a reasonable estimate cannot be made.
Formerly Utilized Sites Remedial Action Program
The USACE is responsible for the Formerly Utilized Sites Remedial Action Program (FUSRAP), established to respond to radiological contamination from early U.S. Atomic Energy and Weapons Programs. For each FUSRAP site, the USACE has received congressional authorization to ascertain the extent of environmental contamination; select a remedy with input from state and federal authorities local stakeholders; perform the cleanup work; and dispose of wastes. After cleanup work is completed at each site, the USACE transfers responsibility for long-term surveillance and monitoring to the U.S. Department of Energy.
Changes in the FUSRAP liability during the fiscal years ended September 30, 2009 and 2008, resulted from inflation adjustments to reflect changes in costs for the current year, cleanup activities performed, adjustments to estimates of soil volumes, and new estimates for sites added to the program.
Other Environmental Liabilities
Other environmental liabilities relate to environmental contamination at current or former USACE project sites.

56 Fiscal Year 2009 United States Army Annual Civil Works Financial Statement
Note 13. Due to Treasury – General Fund and Other Liabilities2009
As of September 30 (Amounts in thousands) Current Liability Noncurrent Liability Total
Intragovernmental
Due to Treasury-General Fund $ 136,215 $ 2,260,136 $ 2,396,351
Advances from Others $ 759,735 $ 0 $ 759,735
Deposit Funds and Suspense Account Liabilities (137) 0 (137)
Disbursing Officer Cash 1,356 0 1,356
Judgment Fund Liabilities 171,911 0 171,911
FECA Reimbursement to the Department of Labor 21,144 29,145 50,289
Employer Contribution and Payroll Taxes Payable 21,754 0.00 21,754
Total Intragovernmental $ 1,111,978 $ 2,289,281 $ 3,401,259
Accrued Funded Payroll and Benefits $ 501,931 $ 0 $ 501,931
Advances from Others 158,429 0 158,429
Deferred Credits 769,633 0 769,633
Deposit Funds and Suspense Accounts 10,630 0 10,630
Contract Holdbacks 58,874 0 58,874
Contingent Liabilities 45,920 0 45,920
Total Other Liabilities $ 2,657,395 $ 2,289,281 $ 4,946,676
2008
As of September 30 (Amounts in thousands) Current Liability Noncurrent Liability Total
Intragovernmental
Due to Treasury –General Fund $ 124,255 $ 775,834 $ 900,089
Advances from Others $ 524,833 $ 0 $ 524,833
Deposit Funds and Suspense Account Liabilities (273) 0 (273)
Disbursing Officer Cash 121 0 121
Judgment Fund Liabilities 167,624 0 167,624
FECA Reimbursement to the Department of Labor 20,337 27,806 48,143
Employer Contribution and Payroll Taxes Payable 17,500 0 17,500
Total Intragovernmental $ 854,397 $ 803,640 $ 1,658,037
Accrued Funded Payroll and Benefits $ 399,797 $ 0 $ 399,797
Advances from Others 134,797 0 134,797
Deferred Credits 755,426 0 755,426
Deposit Funds and Suspense Accounts 10,332 0 10,332
Contract Holdbacks 48,871 0 48,871
Contingent Liabilities 54,047 0 54,047
Total Other Liabilities $ 2,257,667 $ 803,640 $ 3,061,307

57Civil Works Fund | Principal Financial Statements, Notes, Supplementary Information and Auditor’s Report
Other Information
Intragovernmental - Due to Treasury – General Fund is comprised of the custodial liability to offset interest and accounts receivable which, when collected, will be deposited in the U.S. Treasury. The USACE records a custodial liability for payables from water storage and hydraulic mining contracts and for flood control, coastal restoration and hurricane protection measures with the Coastal Protection and Restoration Authority of Louisiana.
Judgment Fund Liabilities - the USACE has recognized an unfunded liability arising from Judgment Fund Contract Disputes Act (CDA) settlements in accordance with a provision of the CDA requiring agencies to reimburse the Judgment Fund for payments to claimants in cases involving federal contract disputes. The USACE cannot fund the CDA claims since it is funded for projects and does not receive funding for this type of claim. The USACE sought supplemental appropriations for payment of CDA claims in FY 2000, FY 2006, and FY 2007, but these requests were not approved. The FY 2009 budget does not provide funding for payment of the CDA claims.
Note 14. Contingencies
Legal Contingencies
The USACE is a party in various administrative proceedings and legal actions, with claims including environmental damage claims, equal opportunity matters, and contractual bid protests. The USACE has accrued contingent liabilities for legal actions where the USACE’s Office of the Chief Counsel considers an adverse decision probable and the amount of loss is measurable. In the event of an adverse judgment against the government, some of the liabilities may be paid from the U.S. Treasury’s Judgment Fund. The USACE discloses amounts recognized as contingent liabilities in Note 13, Due to Treasury – General Fund and Other Liabilities.
The U.S. Army Claims Service supervises processing, investigates, adjudicates, and negotiates the settlement of non-contractual administrative claims on behalf of and against the Department of the Army (including USACE); however, because of their uniqueness, the hurricane Katrina-related administrative claims are processed by the U.S. Department of Justice (DOJ). By law, administrative claims filed against the government are either adjudicated, denied, or are effectively denied if no action is taken within six months from the claim filing date. Barring such resolution within six months from the date of filing, claimants may file legal cases with the federal court. Filing of an administrative claim for resolution is a required precursor to a claimant’s filing against the government in federal court.
Claims settled below the statutory threshold of $2,500 are paid using civil works appropriations; settlements above this threshold are referred to the Judgment Fund for payment. With the exception of CDA settlements disclosed in Note 13, amounts that are paid by the Judgment Fund are recorded as expenses and imputed financing sources.
Probable Likelihood of an Adverse Outcome
The USACE is subject to potential liabilities where adverse outcomes are probable, and claims are approximately $45.9 million and $54.0 million as of September 30, 2009 and 2008, respectively, and the contingent liabilities were included in Note 13.
Reasonably Possible Likelihood of an Adverse Outcome
The USACE is subject to potential liabilities where adverse outcomes are reasonably possible and claims are approximately $5.6 billion and $30.0 million as of September 30, 2009 and 2008, respectively.

58 Fiscal Year 2009 United States Army Annual Civil Works Financial Statement
Hurricane Katrina-Related Claims and Litigation
Various parties filed administrative claims and lawsuits against the USACE as a result of Hurricane Katrina in 2005. Most of the Katrina-related litigation is consolidated before a single federal judge sitting in the Federal District Court in New Orleans. The Court, for case management purposes, has classified the individual cases into seven categories and ordered the filing of superseding, master complaints in most categories: Levee, Mississippi River Gulf Outlet (MRGO), Insurance, Responder, Dredging Limitation, St. Rita Nursing Home, and Barge. The MRGO category, the Barge category and Robinson, involving similar geographic areas, are most relevant to USACE at this point.
The government filed a motion to dismiss the MRGO case with regard to the application of the discretionary function exception to the activities performed at the East Bank Industrial Area on September 15, 2009, with oral arguments held on October 28, 2009. The Court has stayed the trial of the MRGO case pending resolution of the government’s motion. Additionally, the United States has recently discovered that none of the three plaintiffs in the MRGO category who reside in an area affected by a particular flood wall breach filed administrative claims – a prerequisite for filing suit in federal court – before filing their suits. Accordingly, the government has moved to dismiss the count from MRGO case that pertains to this particular flood wall breach, with arguments on this motion to be held on December 16, 2009.
On June 22, 2009, the Court severed the Barge case and stayed the third party claims of Lafarge against the United States. As a result, the United States will not participate in the trial in this matter, set for February, 2010.
The trial of the Robinson case concluded on May 14, 2009, and both the plaintiffs and the government filed a post-trial memorandum. On November 18, 2009, the court rendered an adverse decision finding the USACE liable for the damage to certain properties during Hurricane Katrina. The DOJ and the USACE Office of Chief Counsel have reviewed the opinion and intend to appeal the decision to the U.S. Court of Appeals for the Fifth Circuit. Accordingly, the USACE is presently unable to determine the amount of loss that may result from this case.
In addition to the matters described above, the St. Bernard Parish Government filed a class action on behalf of the residents of St. Bernard Parish and the Lower Ninth Ward of Orleans Parish, alleging that the presence of MRGO and its affect on the surge from Hurricane Katrina amounted to taking without just compensation. The amount claimed is $5 billion.
The DOJ, which is responsible for litigating Katrina-related matters in federal court on behalf of the government, has concluded that there is a reasonable possibility that the Katrina-related administrative claims and court cases currently asserted could result in a loss to the federal government. The government is unable to estimate the amount of any loss that may result, however, and the USACE has not recorded a provision for Katrina-related matters in the consolidated financial statements.
Other Litigation
In addition to the matters described above, the USACE is subject to other potential liabilities for which the exact amount or range of loss is unknown.
Commitment and Other Contingencies
The USACE does not have undelivered orders for open contracts citing cancelled appropriations, which may remain unfilled or unreconciled, and for which the reporting entity may incur a contractual commitment for payout.
The USACE does not have contractual arrangements, such as fixed price contracts with escalations, price redetermination, or incentive clauses, which may require future financial obligations.

59Civil Works Fund | Principal Financial Statements, Notes, Supplementary Information and Auditor’s Report
Note 15. General Disclosures Related to the Statement of Net Cost As of September 30 2009 2008(Amounts in thousands)
Intragovernmental Costs $ 1,284,049 $ 1,434,065
Public Costs 9,876,751 8,087,251
Total Costs $ 11,160,800 $ 9,521,316
Intragovernmental Earned Revenue $ (3,047,876) $ (2,180,957)
Public Earned Revenue (551,194) (20,194)
Total Earned Revenue $ (3,599,070) $ (2,201,151)
Net Cost of Operations $ 7,561,730 $ 7,320,165
Other Information
Intragovernmental costs and revenue are related to transactions made between two reporting entities within the federal government. Public costs and revenues are exchange transactions made between the reporting entity and a nonfederal entity.
The consolidated Statement of Net Cost is unique because its principles are driven on understanding the net cost of programs and/or organizations that the federal government supports through appropriations or other means. This statement provides gross and net cost information that can be related to the amount of output or outcome for a given program or organization administered by a responsible reporting entity.
The USACE incurred no costs associated with acquiring, constructing, improving, reconstructing or renovating heritage assets or acquiring stewardship land.
Note 16. Disclosures Related to the Statement of Changes in Net Position
Other Information
Appropriations received on the Statement of Budgetary Resources (SBR) should not, and do not, agree with appropriations received on the Statement of Changes in Net Position (SCNP) due to differences between proprietary and budgetary accounting concepts and reporting requirements. The difference is due to additional resources of $1.4 billion during FY 2009 and $1.6 billion during FY 2008 in appropriated trust, contributed, and special fund receipts included in Appropriation on the SBR. These funds do not update the proprietary appropriations received amount reported on the SCNP. Refer to Note 17, Statement of Budgetary Resources, for additional disclosures and details.
Cumulative Results of Operations – Earmarked Funds ending balance on the SCNP does not agree with the Cumulative Results of Operations – Earmarked Funds reported on the Balance Sheet because the cumulative results on the Balance Sheet are presented net of eliminations, whereas Cumulative Results of Operations balance for earmarked and other funds on the SCNP are presented before eliminations.

60 Fiscal Year 2009 United States Army Annual Civil Works Financial Statement
Note 17. Disclosures Related to the Statement of Budgetary ResourcesAs of September 30 2009 2008(Amounts in thousands)
Net Amount of Budgetary Resources Obligated for Undelivered Orders at the End of the Period $ 9,481,104 $ 7,735,527
Other Information
Category A apportionments distribute budgetary resources by fiscal quarter. Category B apportionments distribute budgetary resources by activity, project, object or a combination of these categories. Exempt budgetary resources are not subject to apportionment because they are not appropriated funds. Funding sources for exempt category comes from sources outside the federal government.
For FY 2009, the amount of direct and reimbursable obligations incurred against amounts apportioned under Category A SBR includes: $12.4 billion for direct obligations; $10.5 billion for reimbursable obligations; and $58.9 million for reimbursable obligations exempt from apportionment. The USACE did not report any direct obligations exempt from apportionment. The USACE has no apportionments under Category B. Undelivered orders presented in the SBR include undelivered orders-unpaid for both direct and reimbursable funds
For FY 2008, the amount of direct and reimbursable obligations incurred against amounts apportioned under Category A in the SBR includes: $9.3 billion for direct obligations, $11.5 billion for reimbursable obligations, and $141.0 million for reimbursable obligations exempt from apportionment. The USACE did not report any direct obligations exempt from apportionment. The USACE has no apportionments under Category B. Undelivered orders presented in the SBR include undelivered orders-unpaid for both direct and reimbursable funds.
Intraentity transactions have not been eliminated because the SBR is presented as a combined statement.
Permanent Indefinite Appropriations. The USACE receives receipts from hydraulic mining in California; leases of land acquired for flood control, navigation, and allied purposes; and licenses under the Federal Power Act for improvements of navigable water including maintenance and operation of dams. These funds are available for expenditure.
There are no legal arrangements that affect the use of unobligated balances of budget authority.
There are differences between amounts reported on the SBR and the SF133, Report on Budget Execution (SF133) for FY 2009 and FY 2008. Treasury account symbol 96X6094 (Advances from the District of Columbia) is not included in the SF133. This money is not from appropriated funds and is not included in the Office of Management and Budget’s data for budget formulation. The USACE does include this appropriation in the SBR.
The President’s budget with actual figures for FY 2009 has not yet been published. The FY 2011 President’s budget will include actual figures for FY 2009 reporting. The FY 2011 President’s budget can be found at: http://www.whitehouse.gov/omb, early in FY 2010. The following chart is a reconciliation of the FY 2010 President’s budget actual figures for FY 2008 to FY 2008 Statement of Budgetary Resources as required by OMB Circular No. A-136.

61Civil Works Fund | Principal Financial Statements, Notes, Supplementary Information and Auditor’s Report
Department of DefenseU.S. Army Corps of Engineers - Civil Works
Reconciliation of FY 2008 Year-End SBR to FY 2010 President’s Budget(Amounts in millions)
Budgetary Resources
Obligations Incurred
Offsetting Receipts Net Outlays
Line 23.90 Line 23.95 Line 02.99 Line 90.00 Explanation for reconciling differences
SBR $32,669 $20,976 $639 $4,985
Reconciling Difference (154) (141) 91 The SBR includes Treasury symbol 96X6094 for advances from the District of Columbia for work on the Washington Aqueduct. It is not included in the President’s budget since these are not appropriated funds.
Reconciling Difference 639 The SBR reduces net outlays by the amount of distributed offsetting receipts. The President's budget Line Item 90.00 does not.
Reconciling Difference (61) General funds clearing accounts are included as distributed offsetting receipts in accordance with DFAS year-end guidance. It is not included in the President’s budget amount.
Reconciling Difference 1,692 The President's budget line 02.99 includes total receipts and collections for the trust funds. The SBR includes only the USACE's distributed offsetting receipts to South Dakota Terrestrial Wildlife per Treasury Financial Manual, Federal Account Symbols and Titles (FAST Book). Other trust fund receipts are included in the budgetary resources, line 23.90.
Reconciling Difference 8 Per the FAST Book, receipt account 96R 5125 is not a distributed offsetting receipt account and is not included in the SBR as a distributed offsetting receipt. It is included in the President’s budget amount.
Reconciling Difference (296) (296) 2008 audit adjustments
Total $32,219 $20,539 $2,278 $5,715
President’s Budget 32,215 20,540 2,279 5,715
Difference ($4) $1 $1 $0 Due to rounding.

62 Fiscal Year 2009 United States Army Annual Civil Works Financial Statement
Note 18. Reconciliation of Net Cost of Operations (Proprietary) to Budget
As of September 30 2009 2008 (Amounts in thousands)
Resources Used to Finance Activities:
Budgetary Resources Obligated:
Obligations incurred $ 23,049,926 $ 20,975,901
Less: Spending authority from offsetting collections and recoveries (11,705,957) (13,032,520)
Obligations net of offsetting collections and recoveries $ 11,343,969 $ 7,943,381
Less: Offsetting receipts (583,187) (638,940)
Net obligations $ 10,760,782 $ 7,304,441
Other Resources:
Donations and forfeitures of property 2,825 320
Transfers in/out without reimbursement 109,331 (74,931)
Imputed financing from costs absorbed by others 275,785 244,698
Net other resources used to finance activities $ 387,941 $ 170,087
Total resources used to finance activities $ 11,148,723 $ 7,474,528
Resources Used to Finance Items Not Part of the Net Cost of Operations:
Change in budgetary resources obligated for goods, services and benefits ordered but not yet provided:
Undelivered Orders $ (1,745,577) $ (3,325,059)
Unfilled Customer Orders (1,659,428) 1,911,344
Resources that fund expenses recognized in prior periods (23,819) (57,251)
Budgetary offsetting collections and receipts that do not affect Net Cost of Operations 131,123 122,110
Resources that finance the acquisition of assets (15,501) (9,638)
Other resources or adjustments to net obligated resources that do not affect Net Cost of Operations:
Less: Trust or Special Fund Receipts Related to exchange in the Entity’s Budget (10,000) (10,000)
Other (112,155) 74,612
Total Resources Used to Finance Items Not Part of the Net Cost of Operations $ (3,435,357) $ (1,293,882)
Total Resources Used to Finance the Net Cost of Operations $ 7,713,366 $ 6,180,646
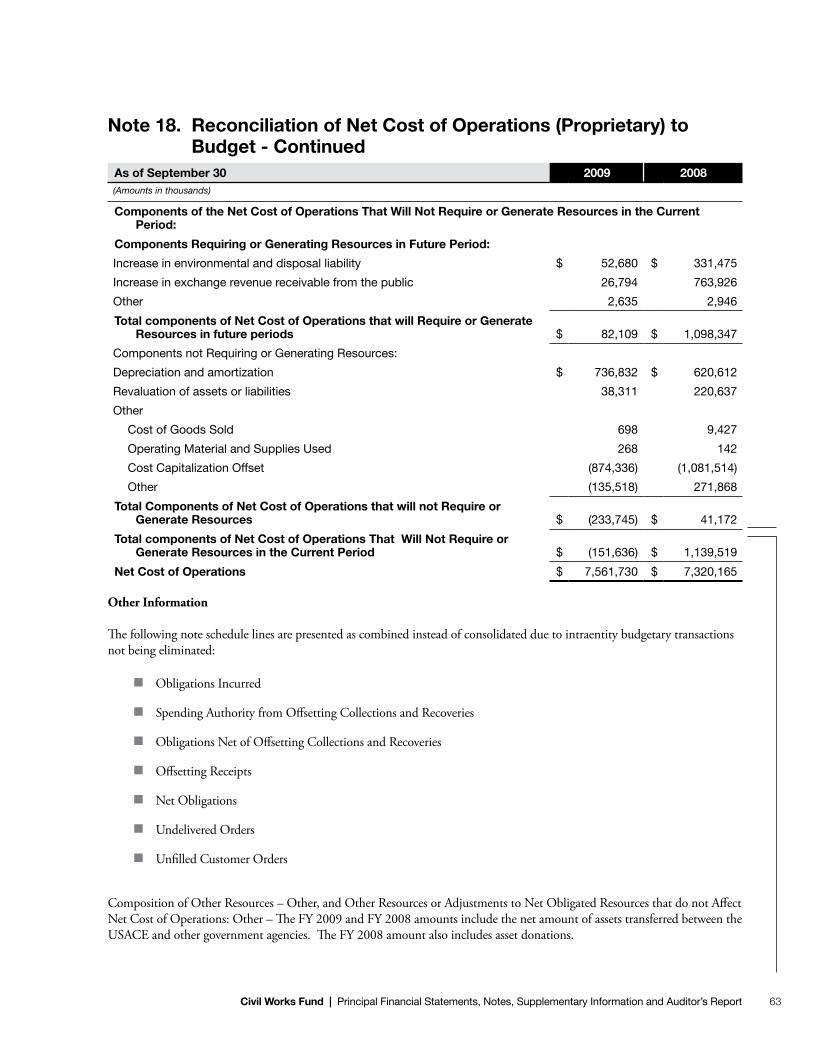
63Civil Works Fund | Principal Financial Statements, Notes, Supplementary Information and Auditor’s Report
Note 18. Reconciliation of Net Cost of Operations (Proprietary) to Budget - Continued
As of September 30 2009 2008 (Amounts in thousands)
Components of the Net Cost of Operations That Will Not Require or Generate Resources in the Current Period:
Components Requiring or Generating Resources in Future Period:
Increase in environmental and disposal liability $ 52,680 $ 331,475
Increase in exchange revenue receivable from the public 26,794 763,926
Other 2,635 2,946
Total components of Net Cost of Operations that will Require or Generate Resources in future periods $ 82,109 $ 1,098,347
Components not Requiring or Generating Resources:
Depreciation and amortization $ 736,832 $ 620,612
Revaluation of assets or liabilities 38,311 220,637
Other
Cost of Goods Sold 698 9,427
Operating Material and Supplies Used 268 142
Cost Capitalization Offset (874,336) (1,081,514)
Other (135,518) 271,868
Total Components of Net Cost of Operations that will not Require or Generate Resources $ (233,745) $ 41,172
Total components of Net Cost of Operations That Will Not Require or Generate Resources in the Current Period $ (151,636) $ 1,139,519
Net Cost of Operations $ 7,561,730 $ 7,320,165
Other Information
The following note schedule lines are presented as combined instead of consolidated due to intraentity budgetary transactions not being eliminated:
n Obligations Incurred
n Spending Authority from Offsetting Collections and Recoveries
n Obligations Net of Offsetting Collections and Recoveries
n Offsetting Receipts
n Net Obligations
n Undelivered Orders
n Unfilled Customer Orders
Composition of Other Resources – Other, and Other Resources or Adjustments to Net Obligated Resources that do not Affect Net Cost of Operations: Other – The FY 2009 and FY 2008 amounts include the net amount of assets transferred between the USACE and other government agencies. The FY 2008 amount also includes asset donations.
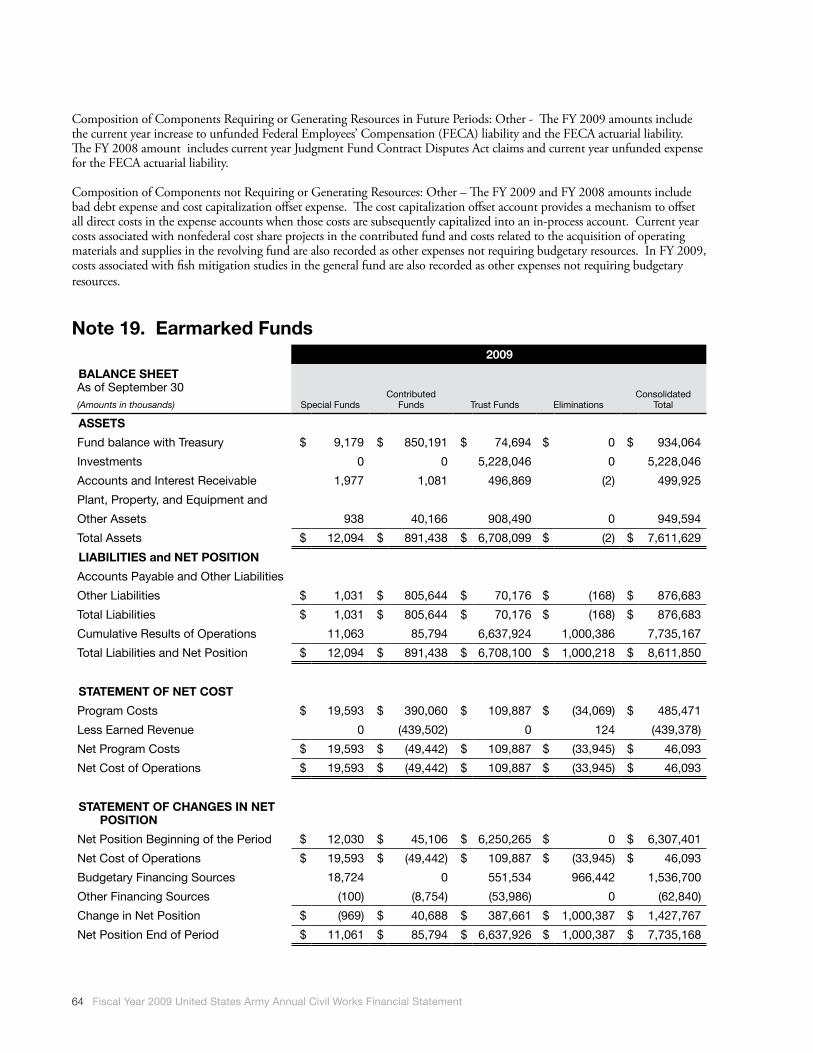
64 Fiscal Year 2009 United States Army Annual Civil Works Financial Statement
Composition of Components Requiring or Generating Resources in Future Periods: Other - The FY 2009 amounts include the current year increase to unfunded Federal Employees’ Compensation (FECA) liability and the FECA actuarial liability. The FY 2008 amount includes current year Judgment Fund Contract Disputes Act claims and current year unfunded expense for the FECA actuarial liability. Composition of Components not Requiring or Generating Resources: Other – The FY 2009 and FY 2008 amounts include bad debt expense and cost capitalization offset expense. The cost capitalization offset account provides a mechanism to offset all direct costs in the expense accounts when those costs are subsequently capitalized into an in-process account. Current year costs associated with nonfederal cost share projects in the contributed fund and costs related to the acquisition of operating materials and supplies in the revolving fund are also recorded as other expenses not requiring budgetary resources. In FY 2009, costs associated with fish mitigation studies in the general fund are also recorded as other expenses not requiring budgetary resources.
Note 19. Earmarked Funds2009
BALANCE SHEET As of September 30 (Amounts in thousands) Special Funds
Contributed Funds Trust Funds Eliminations
Consolidated Total
ASSETS
Fund balance with Treasury $ 9,179 $ 850,191 $ 74,694 $ 0 $ 934,064
Investments 0 0 5,228,046 0 5,228,046
Accounts and Interest Receivable 1,977 1,081 496,869 (2) 499,925
Plant, Property, and Equipment and
Other Assets 938 40,166 908,490 0 949,594
Total Assets $ 12,094 $ 891,438 $ 6,708,099 $ (2) $ 7,611,629
LIABILITIES and NET POSITION
Accounts Payable and Other Liabilities
Other Liabilities $ 1,031 $ 805,644 $ 70,176 $ (168) $ 876,683
Total Liabilities $ 1,031 $ 805,644 $ 70,176 $ (168) $ 876,683
Cumulative Results of Operations 11,063 85,794 6,637,924 1,000,386 7,735,167
Total Liabilities and Net Position $ 12,094 $ 891,438 $ 6,708,100 $ 1,000,218 $ 8,611,850
STATEMENT OF NET COST
Program Costs $ 19,593 $ 390,060 $ 109,887 $ (34,069) $ 485,471
Less Earned Revenue 0 (439,502) 0 124 (439,378)
Net Program Costs $ 19,593 $ (49,442) $ 109,887 $ (33,945) $ 46,093
Net Cost of Operations $ 19,593 $ (49,442) $ 109,887 $ (33,945) $ 46,093
STATEMENT OF CHANGES IN NET POSITION
Net Position Beginning of the Period $ 12,030 $ 45,106 $ 6,250,265 $ 0 $ 6,307,401
Net Cost of Operations $ 19,593 $ (49,442) $ 109,887 $ (33,945) $ 46,093
Budgetary Financing Sources 18,724 0 551,534 966,442 1,536,700
Other Financing Sources (100) (8,754) (53,986) 0 (62,840)
Change in Net Position $ (969) $ 40,688 $ 387,661 $ 1,000,387 $ 1,427,767
Net Position End of Period $ 11,061 $ 85,794 $ 6,637,926 $ 1,000,387 $ 7,735,168
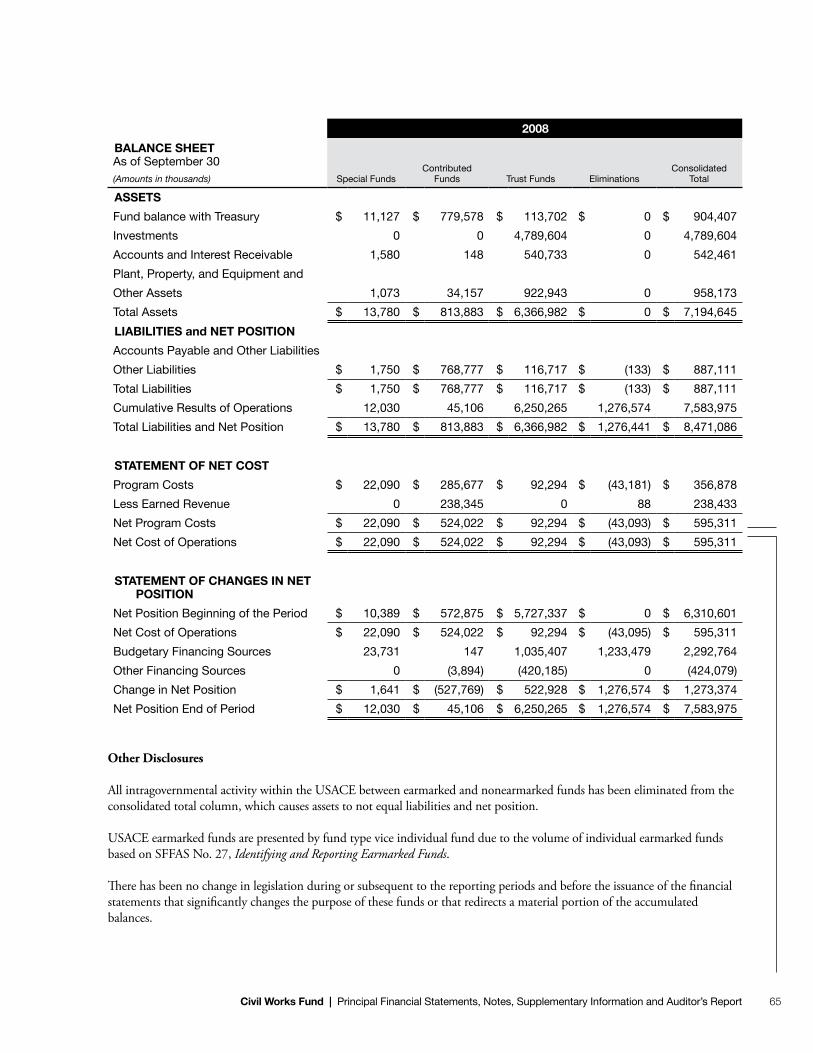
65Civil Works Fund | Principal Financial Statements, Notes, Supplementary Information and Auditor’s Report
2008
BALANCE SHEET As of September 30 (Amounts in thousands) Special Funds
Contributed Funds Trust Funds Eliminations
Consolidated Total
ASSETS
Fund balance with Treasury $ 11,127 $ 779,578 $ 113,702 $ 0 $ 904,407
Investments 0 0 4,789,604 0 4,789,604
Accounts and Interest Receivable 1,580 148 540,733 0 542,461
Plant, Property, and Equipment and
Other Assets 1,073 34,157 922,943 0 958,173
Total Assets $ 13,780 $ 813,883 $ 6,366,982 $ 0 $ 7,194,645
LIABILITIES and NET POSITION
Accounts Payable and Other Liabilities
Other Liabilities $ 1,750 $ 768,777 $ 116,717 $ (133) $ 887,111
Total Liabilities $ 1,750 $ 768,777 $ 116,717 $ (133) $ 887,111
Cumulative Results of Operations 12,030 45,106 6,250,265 1,276,574 7,583,975
Total Liabilities and Net Position $ 13,780 $ 813,883 $ 6,366,982 $ 1,276,441 $ 8,471,086
STATEMENT OF NET COST
Program Costs $ 22,090 $ 285,677 $ 92,294 $ (43,181) $ 356,878
Less Earned Revenue 0 238,345 0 88 238,433
Net Program Costs $ 22,090 $ 524,022 $ 92,294 $ (43,093) $ 595,311
Net Cost of Operations $ 22,090 $ 524,022 $ 92,294 $ (43,093) $ 595,311
STATEMENT OF CHANGES IN NET POSITION
Net Position Beginning of the Period $ 10,389 $ 572,875 $ 5,727,337 $ 0 $ 6,310,601
Net Cost of Operations $ 22,090 $ 524,022 $ 92,294 $ (43,095) $ 595,311
Budgetary Financing Sources 23,731 147 1,035,407 1,233,479 2,292,764
Other Financing Sources 0 (3,894) (420,185) 0 (424,079)
Change in Net Position $ 1,641 $ (527,769) $ 522,928 $ 1,276,574 $ 1,273,374
Net Position End of Period $ 12,030 $ 45,106 $ 6,250,265 $ 1,276,574 $ 7,583,975
Other Disclosures
All intragovernmental activity within the USACE between earmarked and nonearmarked funds has been eliminated from the consolidated total column, which causes assets to not equal liabilities and net position.
USACE earmarked funds are presented by fund type vice individual fund due to the volume of individual earmarked funds based on SFFAS No. 27, Identifying and Reporting Earmarked Funds.
There has been no change in legislation during or subsequent to the reporting periods and before the issuance of the financial statements that significantly changes the purpose of these funds or that redirects a material portion of the accumulated balances.
66 Fiscal Year 2009 United States Army Annual Civil Works Financial Statement
The USACE has the following Earmarked Funds as of September 30, 2009 and 2008:
Special Funds
Special Recreation Use Fees. Title 16 United States Code (USC) 4601-6a granted, the USACE authority to charge and collect fair and equitable special recreation use fees at recreation facilities and campgrounds located at lakes or reservoirs under the jurisdiction of the USACE. Types of allowable fees include daily use fees, admission fees, recreational fees, annual pass fees, and other permit type fees. The revenue is received from the public and is an inflow of resources to the government. The purpose of the fund is to maintain and operate the recreation and camping facilities.
Hydraulic Mining in California Debris. Title 33 USC 683, states that those operating hydraulic mines through which debris flows in part or in whole to a body restrained by a dam or other work erected by the California Debris Commission shall pay a tax as determined by the Federal Energy Regulatory Commission (FERC). The tax is paid annually on a date fixed by FERC. Taxes imposed under this code are collected and then expended under the supervision of the USACE and the direction of the Department of the Army. The revenue is received from the public and is an inflow of resources to the government. The purpose of the fund is for repayment of funds advanced by the federal government or other agencies for construction, restraining works, settling reservoirs, and maintenance.
Payments to States. The Flood Control Act of 1954, Title 33 USC 701c-3 established, that 75 percent of all funds received and deposited from the leasing of lands acquired by the U.S. for flood control, navigation and allied purposes, including the development of hydroelectric power, shall be returned to the state in which the property is located. The USACE collects lease receipts into a receipt account. The revenue is received from the public and is an inflow of resources to the government. Funds are appropriated in the amount of 75 percent of the receipts in the following fiscal year and disbursed to the states. The funds may be expended by the states for the benefit of public schools and public roads of the county, or counties, in which such property is situated, or for defraying any of the expense of county government.
Maintenance and Operation of Dams and Other Improvements of Navigable Waters. Title 16 USC 803f, 810, states that whenever a reservoir or other improvement is constructed by the U.S., the Federal Power Commission, now known as FERC, shall assess charges against any licensee directly benefited, and any amount so assessed shall be paid into the U.S. Treasury. The title further states that all charges arising from other licenses, except those charges established by FERC for purpose of administrative reimbursement, shall be paid to the U.S. Treasury from which specific allocations will be made. From the specific allocations, 50 percent of charges from all other licenses is reserved and appropriated as a special fund in the U.S. Treasury. This special fund is to be expended under the direction of the Secretary of the Army (Secretary) for the maintenance and operation of dams and other navigation structures that are owned by the U.S. or for construction, maintenance, or operation of headwater or other improvements of U.S. navigable waters. The revenue is received from the public and is an inflow of resources to the government.
Nonfederal Use of Disposal Facilities. The fund for nonfederal use of disposal facilities (for dredged material) was established by Title 33 USC 2326a. This title provides that the Secretary may permit the use of any dredged material disposal facility under the jurisdiction of, or managed by, the Secretary by a nonfederal interest if the Secretary determines that such use will not reduce the availability of the facility for project purposes. The Secretary may impose fees to recover capital, operation and maintenance costs associated with such use. Any monies received through collection of fees under this law shall be available to the Secretary, and shall be used by the Secretary, for the operation and maintenance of the disposal facility from which the fees were collected. The revenue is received from the public and is an inflow of resources to the government.
Special funds utilize both receipt and expenditure accounts in accounting for and reporting the fund.
Contributed Funds
Rivers and Harbors Contributed and Advance Funds, authorized by Title 33 USC 701h, 702f, and 703, establishes funding to construct, improve, and maintain levees, water outlets, flood control, debris removal, rectification and enlargement of
67Civil Works Fund | Principal Financial Statements, Notes, Supplementary Information and Auditor’s Report
river channels, etc., in the course of flood control and river/harbor maintenance. Whenever any state or political subdivision thereof shall offer to advance funds for a flood control project duly adopted and authorized by law, the Secretary may, in his discretion, receive such funds and expend the same in the immediate prosecution of such work. Advances are from the public and are inflows of resources to the government. This fund utilizes both receipt and expenditure accounts in accounting for and reporting the fund.
Trust Funds
The South Dakota Terrestrial Wildlife Habitat Restoration Trust Fund. The fund was established by Public Law 105-277, Sec. 603. Yearly transfers are made from the general fund of the U.S. Treasury to the trust fund for investment purposes. Investment activity is managed by the U.S. Treasury, Bureau of Public Debt (BPD). When the fund reaches the aggregate amount of $108.0 million, withdrawals may be made by the USACE for payment to the state of South Dakota. The state shall use the payments to fund the annually scheduled work for wildlife habitat restoration. This fund utilizes both receipt and expenditure accounts in accounting for and reporting the fund.
The Coastal Wetlands Restoration Trust Fund. The fund is authorized by Title 16 USC 3951-3956. This title grants parallel authority to the USACE, along with the Environmental Protection Agency, and the Fish and Wildlife Service to work with the state of Louisiana to develop, review, evaluate, and approve a plan that is proposed to achieve a goal of no net loss of wetlands in coastal Louisiana. The USACE is also responsible for allocating funds among the named task force members. Federal contributions are established at 75 percent of project costs, or 85 percent if the state has an approved Coastal Wetlands Conservation Plan. This fund is an expenditure account and receives funding transfers from the Sport Fish Restoration and Boating Trust Fund.
The Inland Waterways Trust Fund (IWTF). The fund is authorized by Title 26 USC 9506. The title made IWTF available for USACE expenditures for navigation, construction, and rehabilitation projects on inland waterways. Collections into the trust fund are from excise taxes on fuel used in commercial transportation on inland waterways. The revenue is received from the public and is an inflow of resources to the government. The collections are invested and investment activity is managed by the BPD. This fund utilizes receipt and expenditure accounts in accounting for and reporting the fund.
The Harbor Maintenance Trust Fund (HMTF). The fund was established by Title XIV of the Water Resources Development Act (the Act) of 1986, Public Law 99-662. The HMTF is authorized to recover 100 percent of USACE eligible operation and maintenance (O&M) expenditures for the maintenance of commercial navigation in harbors and channels as well as 100 percent of the O&M cost of St. Lawrence Seaway by the St. Lawrence Seaway Development Corporation. As provided in the Act, amounts in HMTF shall be available for making expenditures to carry out the functions specified in the Act and for the payment of all expenses of administration incurred by the U.S. Treasury, the USACE, and the Department of Commerce. Collections are made into the trust fund from fees assessed on port use associated with imports, imported merchandise admitted into a foreign trade zone, passengers, and movements of cargo between domestic ports. The collections are invested and investment activity is managed by BPD. The revenue is received from the public and is an inflow of resources to the government. This fund utilizes receipt and expenditure accounts in accounting for and reporting the fund.
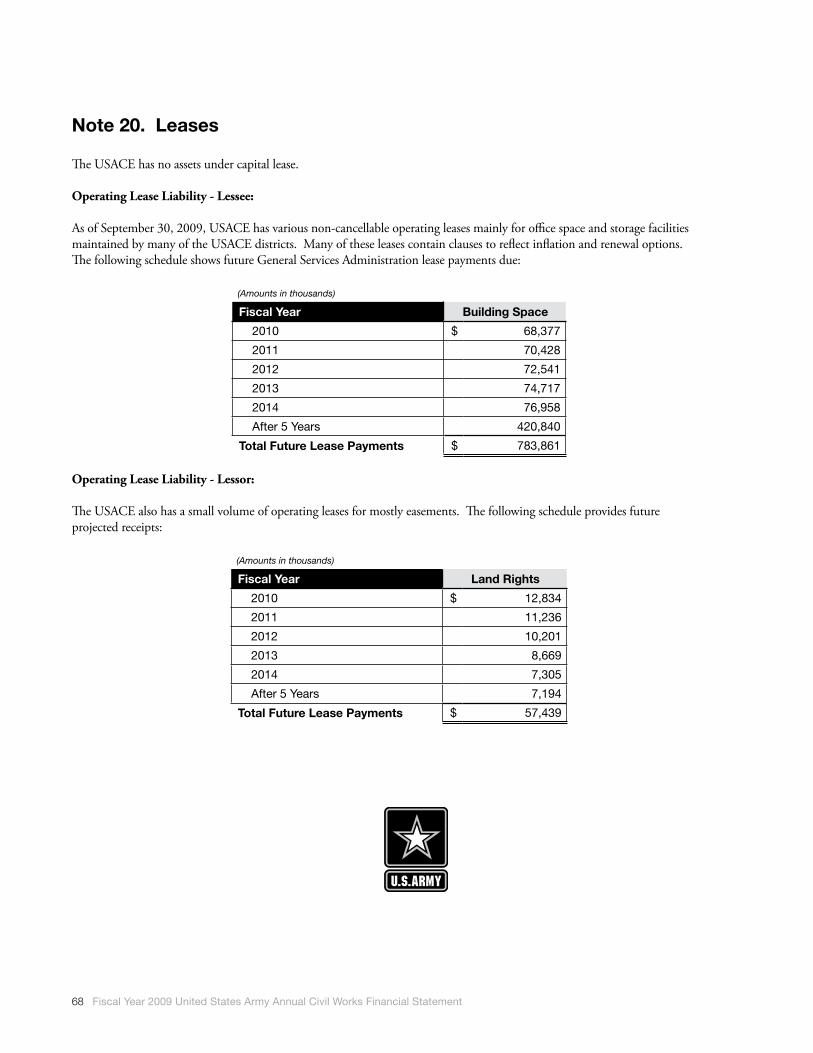
68 Fiscal Year 2009 United States Army Annual Civil Works Financial Statement
Note 20. Leases
The USACE has no assets under capital lease.
Operating Lease Liability - Lessee:
As of September 30, 2009, USACE has various non-cancellable operating leases mainly for office space and storage facilities maintained by many of the USACE districts. Many of these leases contain clauses to reflect inflation and renewal options. The following schedule shows future General Services Administration lease payments due:
(Amounts in thousands)
Fiscal Year Building Space
2010 $ 68,377
2011 70,428
2012 72,541
2013 74,717
2014 76,958
After 5 Years 420,840
Total Future Lease Payments $ 783,861
Operating Lease Liability - Lessor:
The USACE also has a small volume of operating leases for mostly easements. The following schedule provides future projected receipts:
(Amounts in thousands)
Fiscal Year Land Rights
2010 $ 12,834
2011 11,236
2012 10,201
2013 8,669
2014 7,305
After 5 Years 7,194
Total Future Lease Payments $ 57,439
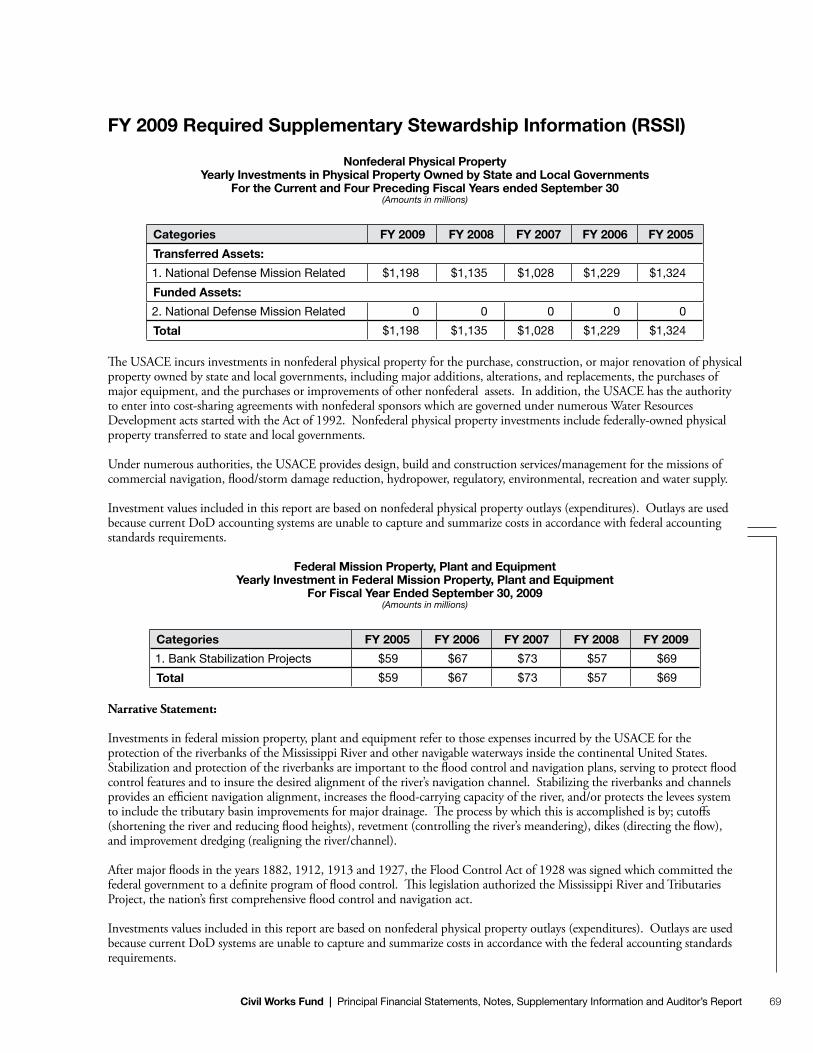
69Civil Works Fund | Principal Financial Statements, Notes, Supplementary Information and Auditor’s Report
FY 2009 Required Supplementary Stewardship Information (RSSI)
Nonfederal Physical Property Yearly Investments in Physical Property Owned by State and Local Governments
For the Current and Four Preceding Fiscal Years ended September 30(Amounts in millions)
Categories FY 2009 FY 2008 FY 2007 FY 2006 FY 2005
Transferred Assets:
1. National Defense Mission Related $1,198 $1,135 $1,028 $1,229 $1,324
Funded Assets:
2. National Defense Mission Related 0 0 0 0 0
Total $1,198 $1,135 $1,028 $1,229 $1,324
The USACE incurs investments in nonfederal physical property for the purchase, construction, or major renovation of physical property owned by state and local governments, including major additions, alterations, and replacements, the purchases of major equipment, and the purchases or improvements of other nonfederal assets. In addition, the USACE has the authority to enter into cost-sharing agreements with nonfederal sponsors which are governed under numerous Water Resources Development acts started with the Act of 1992. Nonfederal physical property investments include federally-owned physical property transferred to state and local governments.
Under numerous authorities, the USACE provides design, build and construction services/management for the missions of commercial navigation, flood/storm damage reduction, hydropower, regulatory, environmental, recreation and water supply.
Investment values included in this report are based on nonfederal physical property outlays (expenditures). Outlays are used because current DoD accounting systems are unable to capture and summarize costs in accordance with federal accounting standards requirements.
Federal Mission Property, Plant and EquipmentYearly Investment in Federal Mission Property, Plant and Equipment
For Fiscal Year Ended September 30, 2009(Amounts in millions)
Categories FY 2005 FY 2006 FY 2007 FY 2008 FY 2009
1. Bank Stabilization Projects $59 $67 $73 $57 $69
Total $59 $67 $73 $57 $69
Narrative Statement:
Investments in federal mission property, plant and equipment refer to those expenses incurred by the USACE for the protection of the riverbanks of the Mississippi River and other navigable waterways inside the continental United States. Stabilization and protection of the riverbanks are important to the flood control and navigation plans, serving to protect flood control features and to insure the desired alignment of the river’s navigation channel. Stabilizing the riverbanks and channels provides an efficient navigation alignment, increases the flood-carrying capacity of the river, and/or protects the levees system to include the tributary basin improvements for major drainage. The process by which this is accomplished is by; cutoffs (shortening the river and reducing flood heights), revetment (controlling the river’s meandering), dikes (directing the flow), and improvement dredging (realigning the river/channel).
After major floods in the years 1882, 1912, 1913 and 1927, the Flood Control Act of 1928 was signed which committed the federal government to a definite program of flood control. This legislation authorized the Mississippi River and Tributaries Project, the nation’s first comprehensive flood control and navigation act.
Investments values included in this report are based on nonfederal physical property outlays (expenditures). Outlays are used because current DoD systems are unable to capture and summarize costs in accordance with the federal accounting standards requirements.

70 Fiscal Year 2009 United States Army Annual Civil Works Financial Statement
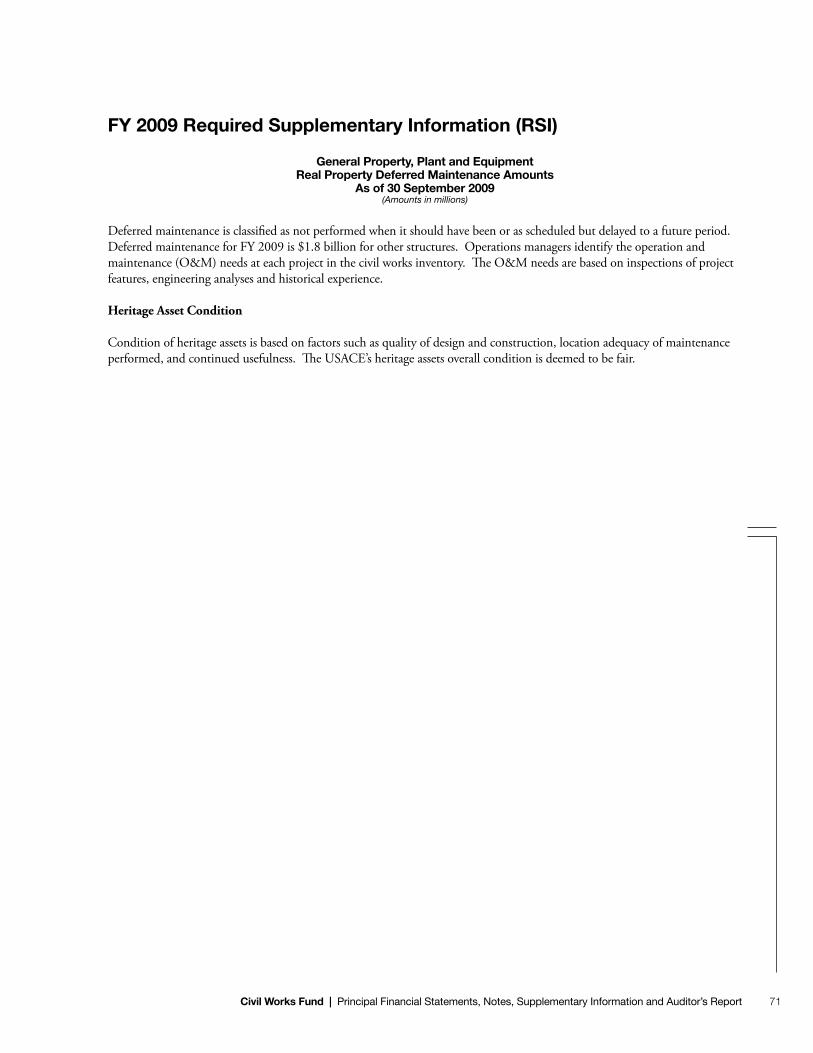
71Civil Works Fund | Principal Financial Statements, Notes, Supplementary Information and Auditor’s Report
FY 2009 Required Supplementary Information (RSI)
General Property, Plant and EquipmentReal Property Deferred Maintenance Amounts
As of 30 September 2009(Amounts in millions)
Deferred maintenance is classified as not performed when it should have been or as scheduled but delayed to a future period. Deferred maintenance for FY 2009 is $1.8 billion for other structures. Operations managers identify the operation and maintenance (O&M) needs at each project in the civil works inventory. The O&M needs are based on inspections of project features, engineering analyses and historical experience.
Heritage Asset Condition
Condition of heritage assets is based on factors such as quality of design and construction, location adequacy of maintenance performed, and continued usefulness. The USACE’s heritage assets overall condition is deemed to be fair.
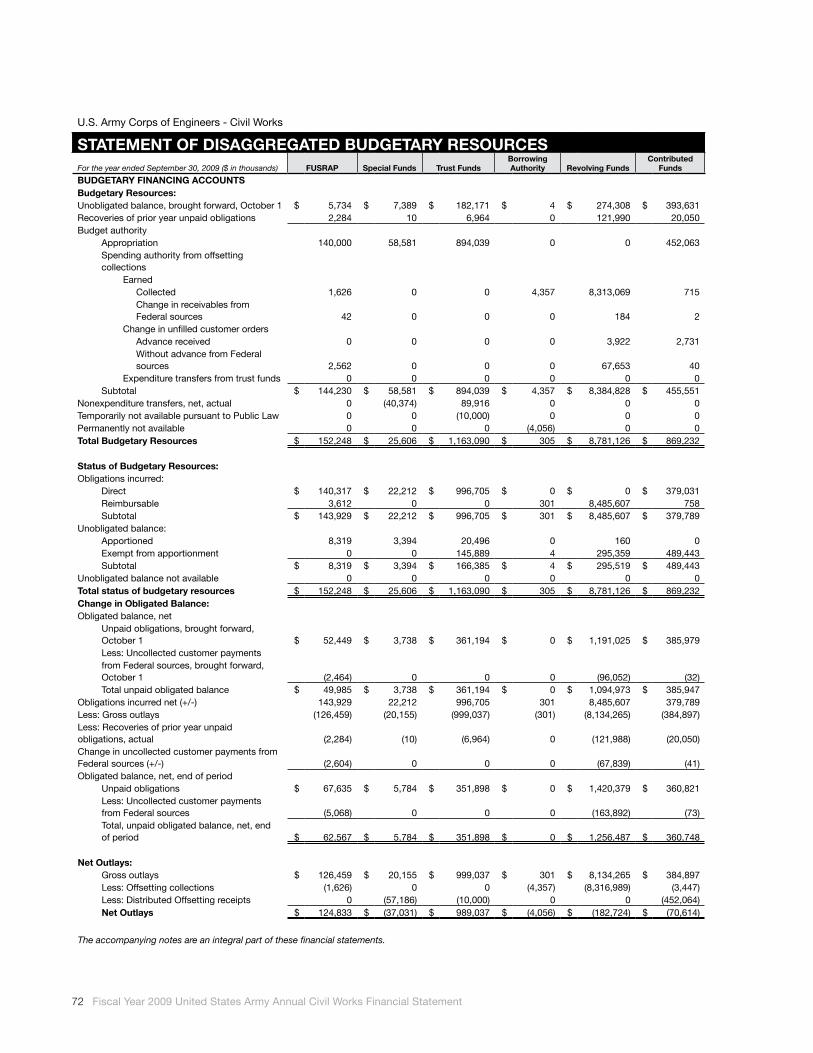
72 Fiscal Year 2009 United States Army Annual Civil Works Financial Statement
U.S. Army Corps of Engineers - Civil Works
STATEMENT OF DISAGGREGATED BUDGETARY RESOURCESFor the year ended September 30, 2009 ($ in thousands) FUSRAP Special Funds Trust Funds
Borrowing Authority Revolving Funds
Contributed Funds
BUDGETARY FINANCING ACCOUNTSBudgetary Resources:Unobligated balance, brought forward, October 1 $ 5,734 $ 7,389 $ 182,171 $ 4 $ 274,308 $ 393,631 Recoveries of prior year unpaid obligations 2,284 10 6,964 0 121,990 20,050 Budget authority
Appropriation 140,000 58,581 894,039 0 0 452,063 Spending authority from offsetting collections
EarnedCollected 1,626 0 0 4,357 8,313,069 715 Change in receivables from Federal sources 42 0 0 0 184 2
Change in unfilled customer ordersAdvance received 0 0 0 0 3,922 2,731 Without advance from Federal sources 2,562 0 0 0 67,653 40
Expenditure transfers from trust funds 0 0 0 0 0 0 Subtotal $ 144,230 $ 58,581 $ 894,039 $ 4,357 $ 8,384,828 $ 455,551
Nonexpenditure transfers, net, actual 0 (40,374) 89,916 0 0 0 Temporarily not available pursuant to Public Law 0 0 (10,000) 0 0 0 Permanently not available 0 0 0 (4,056) 0 0 Total Budgetary Resources $ 152,248 $ 25,606 $ 1,163,090 $ 305 $ 8,781,126 $ 869,232 Status of Budgetary Resources:Obligations incurred:
Direct $ 140,317 $ 22,212 $ 996,705 $ 0 $ 0 $ 379,031 Reimbursable 3,612 0 0 301 8,485,607 758 Subtotal $ 143,929 $ 22,212 $ 996,705 $ 301 $ 8,485,607 $ 379,789
Unobligated balance:Apportioned 8,319 3,394 20,496 0 160 0 Exempt from apportionment 0 0 145,889 4 295,359 489,443 Subtotal $ 8,319 $ 3,394 $ 166,385 $ 4 $ 295,519 $ 489,443
Unobligated balance not available 0 0 0 0 0 0 Total status of budgetary resources $ 152,248 $ 25,606 $ 1,163,090 $ 305 $ 8,781,126 $ 869,232 Change in Obligated Balance:Obligated balance, net
Unpaid obligations, brought forward, October 1 $ 52,449 $ 3,738 $ 361,194 $ 0 $ 1,191,025 $ 385,979 Less: Uncollected customer paymentsfrom Federal sources, brought forward, October 1 (2,464) 0 0 0 (96,052) (32)Total unpaid obligated balance $ 49,985 $ 3,738 $ 361,194 $ 0 $ 1,094,973 $ 385,947
Obligations incurred net (+/-) 143,929 22,212 996,705 301 8,485,607 379,789 Less: Gross outlays (126,459) (20,155) (999,037) (301) (8,134,265) (384,897)Less: Recoveries of prior year unpaid obligations, actual (2,284) (10) (6,964) 0 (121,988) (20,050)Change in uncollected customer payments from Federal sources (+/-) (2,604) 0 0 0 (67,839) (41)Obligated balance, net, end of period
Unpaid obligations $ 67,635 $ 5,784 $ 351,898 $ 0 $ 1,420,379 $ 360,821 Less: Uncollected customer payments from Federal sources (5,068) 0 0 0 (163,892) (73)Total, unpaid obligated balance, net, end of period $ 62,567 $ 5,784 $ 351,898 $ 0 $ 1,256,487 $ 360,748
Net Outlays:Gross outlays $ 126,459 $ 20,155 $ 999,037 $ 301 $ 8,134,265 $ 384,897 Less: Offsetting collections (1,626) 0 0 (4,357) (8,316,989) (3,447)Less: Distributed Offsetting receipts 0 (57,186) (10,000) 0 0 (452,064)Net Outlays $ 124,833 $ (37,031) $ 989,037 $ (4,056) $ (182,724) $ (70,614)
The accompanying notes are an integral part of these financial statements.
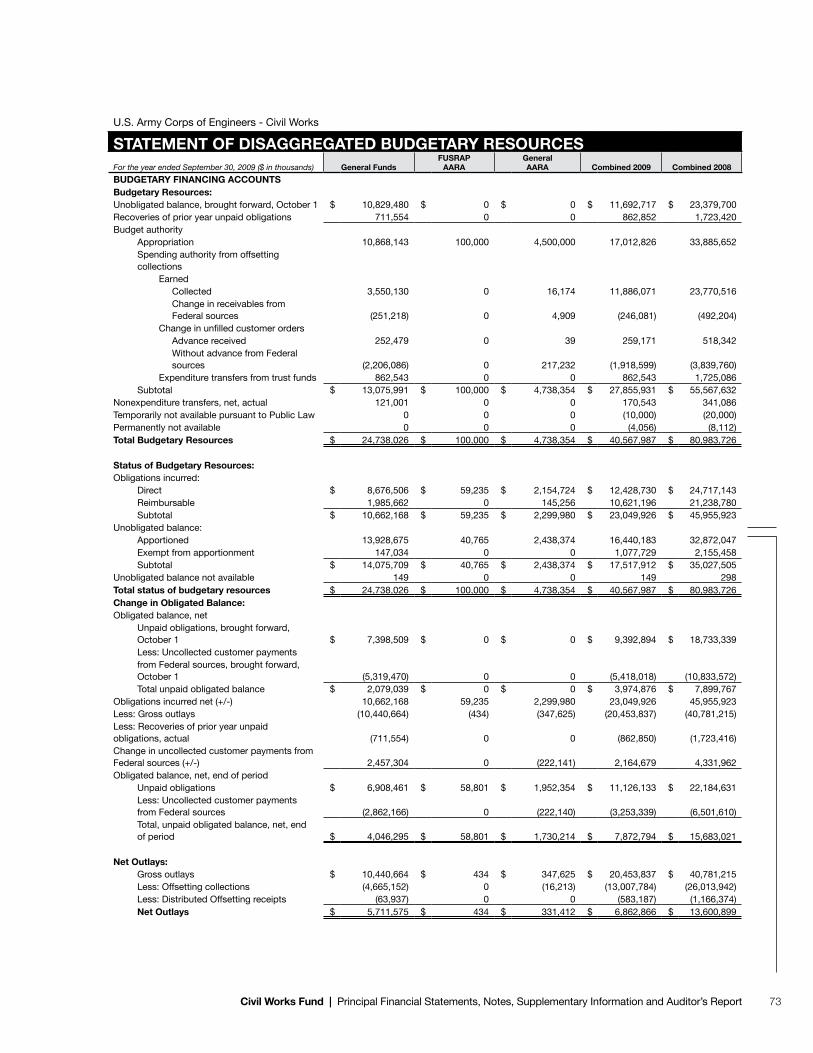
73Civil Works Fund | Principal Financial Statements, Notes, Supplementary Information and Auditor’s Report
U.S. Army Corps of Engineers - Civil Works
STATEMENT OF DISAGGREGATED BUDGETARY RESOURCESFor the year ended September 30, 2009 ($ in thousands) General Funds
FUSRAP AARA
General AARA Combined 2009 Combined 2008
BUDGETARY FINANCING ACCOUNTSBudgetary Resources:Unobligated balance, brought forward, October 1 $ 10,829,480 $ 0 $ 0 $ 11,692,717 $ 23,379,700 Recoveries of prior year unpaid obligations 711,554 0 0 862,852 1,723,420 Budget authority
Appropriation 10,868,143 100,000 4,500,000 17,012,826 33,885,652 Spending authority from offsetting collections
EarnedCollected 3,550,130 0 16,174 11,886,071 23,770,516 Change in receivables from Federal sources (251,218) 0 4,909 (246,081) (492,204)
Change in unfilled customer ordersAdvance received 252,479 0 39 259,171 518,342 Without advance from Federal sources (2,206,086) 0 217,232 (1,918,599) (3,839,760)
Expenditure transfers from trust funds 862,543 0 0 862,543 1,725,086 Subtotal $ 13,075,991 $ 100,000 $ 4,738,354 $ 27,855,931 $ 55,567,632
Nonexpenditure transfers, net, actual 121,001 0 0 170,543 341,086 Temporarily not available pursuant to Public Law 0 0 0 (10,000) (20,000)Permanently not available 0 0 0 (4,056) (8,112)Total Budgetary Resources $ 24,738,026 $ 100,000 $ 4,738,354 $ 40,567,987 $ 80,983,726 Status of Budgetary Resources:Obligations incurred:
Direct $ 8,676,506 $ 59,235 $ 2,154,724 $ 12,428,730 $ 24,717,143 Reimbursable 1,985,662 0 145,256 10,621,196 21,238,780 Subtotal $ 10,662,168 $ 59,235 $ 2,299,980 $ 23,049,926 $ 45,955,923
Unobligated balance:Apportioned 13,928,675 40,765 2,438,374 16,440,183 32,872,047 Exempt from apportionment 147,034 0 0 1,077,729 2,155,458 Subtotal $ 14,075,709 $ 40,765 $ 2,438,374 $ 17,517,912 $ 35,027,505
Unobligated balance not available 149 0 0 149 298 Total status of budgetary resources $ 24,738,026 $ 100,000 $ 4,738,354 $ 40,567,987 $ 80,983,726 Change in Obligated Balance:Obligated balance, net
Unpaid obligations, brought forward, October 1 $ 7,398,509 $ 0 $ 0 $ 9,392,894 $ 18,733,339 Less: Uncollected customer paymentsfrom Federal sources, brought forward, October 1 (5,319,470) 0 0 (5,418,018) (10,833,572)Total unpaid obligated balance $ 2,079,039 $ 0 $ 0 $ 3,974,876 $ 7,899,767
Obligations incurred net (+/-) 10,662,168 59,235 2,299,980 23,049,926 45,955,923 Less: Gross outlays (10,440,664) (434) (347,625) (20,453,837) (40,781,215)Less: Recoveries of prior year unpaid obligations, actual (711,554) 0 0 (862,850) (1,723,416)Change in uncollected customer payments from Federal sources (+/-) 2,457,304 0 (222,141) 2,164,679 4,331,962 Obligated balance, net, end of period
Unpaid obligations $ 6,908,461 $ 58,801 $ 1,952,354 $ 11,126,133 $ 22,184,631 Less: Uncollected customer payments from Federal sources (2,862,166) 0 (222,140) (3,253,339) (6,501,610)Total, unpaid obligated balance, net, end of period $ 4,046,295 $ 58,801 $ 1,730,214 $ 7,872,794 $ 15,683,021
Net Outlays:Gross outlays $ 10,440,664 $ 434 $ 347,625 $ 20,453,837 $ 40,781,215 Less: Offsetting collections (4,665,152) 0 (16,213) (13,007,784) (26,013,942)Less: Distributed Offsetting receipts (63,937) 0 0 (583,187) (1,166,374)Net Outlays $ 5,711,575 $ 434 $ 331,412 $ 6,862,866 $ 13,600,899

74 Fiscal Year 2009 United States Army Annual Civil Works Financial Statement
75Civil Works Fund | Principal Financial Statements, Notes, Supplementary Information and Auditor’s Report
INSPECTOR GENERALDEPARTMENT OF DEFENSE
200 ARMY NAVY DRIVEARLINGTON, VIRGINIA 22202-4704
November 24, 2009
MEMORANDUM FOR THE CHIEF OF ENGINEERS, U.S. ARMY CORPS OF ENGINEERS
SUBJECT: Independent Auditor’s Report on the U.S. Army Corps of Engineers, Civil Works, FY 2009 and FY 2008 Basic Financial Statements (Report No. D 2010-018)
The Chief Financial Officers Act of 1990, as amended, requires the Department of Defense Inspector General to audit the accompanying U.S. Army Corps of Engineers, Civil Works, (USACE) Consolidated Balance Sheets as of September 30, 2009 and 2008, and Consolidated Statement of Net Cost, Consolidated Statement of Changes in Net Position, and Combined Statement of Budgetary Resources and related notes for the fiscal years then ended. The financial statements are the responsibility of USACE management. USACE is also responsible for implementing effective internal control and for complying with laws and regulations. Our responsibility is to express an opinion on these financial statements and to report on the internal controls and compliance with laws and regulations based on our audit.
We conducted our audit in accordance with auditing standards generally accepted in the United States of America; the U.S. Government Accountability Office “Government Auditing Standards;” and the requirements of Office of Management and Budget (OMB) Bulletin No. 07-04, Audit Requirements for Federal Financial Statements, as amended. Those standards require that we plan and perform the audit to obtain reasonable assurance about whether the financial statements are free of material misstatement. An audit includes examining, on a test basis, evidence supporting the amounts and disclosures in the financial statements. An audit also includes assessing the accounting principles used and significant estimates made by management, as well as evaluating the overall financial statement presentation and assessing the internal control over financial reporting and compliance with laws and regulations. We believe that our audit provides a reasonable basis for our opinion.
In our opinion, the financial statements referred to above present fairly, in all material respects, the financial position of USACE as of September 30, 2009 and 2008, and the Net Cost of Operations, Changes in Net Position and Budgetary Resources for the years then ended in conformity with accounting principles generally accepted in the United States of America (U.S. GAAP) and the requirements of the OMB Circular A-136, Financial Reporting Requirements. In addition to our opinion on the financial statements, we are including the required Report on Internal Controls and Compliance with Laws and Regulations (Report). This report is an integral part of our opinion on the financial statements.
Matters of Emphasis Based on the pervasive internal control weaknesses related to USACE’s financial reporting process and the extensive effort needed to audit these basic financial statements, we have concerns about whether USACE will be able to sustain the level of effort necessary to continue the annual audit process. USACE has not fully implemented an appropriate organizational and internal control structure that is necessary for effective financial management and oversight. Although USACE financial management oversight exists, weaknesses in the entity-level control structure continue to affect USACE’s financial reporting process. Because of USACE’s unreliable entity-wide controls, USACE management adjusted material financial reporting errors during annual audits rather than having adequate internal controls in place to prevent and detect these errors in the normal course of business. More importantly, without first correcting these material internal control weaknesses, USACE may not produce accurate, complete, and timely financial information for the financial statements, which could ultimately result in
76 Fiscal Year 2009 United States Army Annual Civil Works Financial Statement
significant misstatements. Once internal control weaknesses are corrected, the audit will become more efficient and USACE management will have more reliable financial information readily available for decision-making.
In addition, the USACE Management Discussion and Analysis (MD&A) does not include a robust discussion on the financial statements in accordance with Statement of Federal Financial Accounting Standards (SFFAS) No. 15, as it only discusses the Balance Sheet and no other statements. The MD&A also does not include a section for systems, controls, and legal compliance as required by SFFAS No. 15. However, the MD&A, Required Supplementary Information (RSI), and Required Supplementary Stewardship Information (RSSI) were not required in the basic financial statements but were required as supplementary information by the Federal Accounting Standards Advisory Board and OMB Circular No. A 136. The scope of our work included procedures in OMB Bulletin No. 07-04. We were not required to audit this information or express an opinion on it under OMB Bulletin No. 07-04. Accordingly, we do not express an opinion on this information.
Summary of Internal ControlIn planning our work, we considered USACE’s internal control over financial reporting and compliance with laws and regulations. We did this to determine our procedures for auditing the financial statements and to comply with OMB guidance, but our purpose was not to express an opinion on internal control. Accordingly, we do not express an opinion on internal control over financial reporting and compliance with laws and regulations.
A material weakness is a significant deficiency, or a combination of significant deficiencies, resulting in more than a remote likelihood that a material misstatement of the financial statements will not be prevented or detected.1 We identified the following material weaknesses:
n General Property, Plant, and Equipment
n Environmental Liabilities
n Entity-Wide Internal Controls
n Financial Reporting
n Long-Term Water Storage Agreements
A significant deficiency is a control deficiency,2 or a combination of control deficiencies, adversely affecting the entity’s ability to initiate, authorize, record, process, or report financial data reliably in accordance with U.S. GAAP. Significant deficiencies result in more than a remote likelihood that a misstatement of an entity’s financial statements that is more than inconsequential will not be prevented or detected. We identified the following significant deficiencies:
n Cost Share Revenue
n Financial Management Systems
1 The term “remote” is defined as when the chance of a future event or events occurring is slight. Therefore, the likelihood of an event is “more than remote” when it is at least reasonably possible.
2 A control deficiency exists when the design or operation of a control does not allow management or employees, in the normal course of performing their assigned functions, to prevent or detect misstatements on a timely basis.
77Civil Works Fund | Principal Financial Statements, Notes, Supplementary Information and Auditor’s Report
Internal control work that we conducted as part of our prior audits would not necessarily disclose all significant deficiencies. The Attachment offers additional details on significant deficiencies, five of which we considered to be material internal control weaknesses.
Summary of Compliance With Laws and RegulationsAs part of obtaining reasonable assurance about whether the USACE FY 2009 and FY 2008 Financial Statements were free of material misstatement, we performed tests for compliance with certain provisions of laws and regulations, including those specified in OMB Bulletin No. 07-04. We did not determine, however, whether USACE complied with all applicable laws and regulations related to financial reporting. Providing an opinion on compliance with laws and regulations was not an objective of our audit, and accordingly, we do not express such an opinion. However, we noted instances of noncompliance with the following laws and regulations:
n Federal Managers’ Financial Integrity Act of 1982,
n Federal Financial Management Improvement Act of 1996,
n Energy and Water Development Appropriations Act,
n Debt Collection Improvement Act of 1996,
n South Dakota Terrestrial Wildlife Habitat Restoration Trust Fund, and
n Antideficiency Act.

78 Fiscal Year 2009 United States Army Annual Civil Works Financial Statement
Management’s ResponsibilitiesManagement is responsible for:
n preparing the financial statements in conformity with U.S. GAAP;
n establishing, maintaining, and assessing internal control to provide reasonable assurance that the broad control objective of the Federal Managers’ Financial Integrity Act are met; and
n complying with applicable laws and regulations.
We provided a draft of this report to the Chief of Engineers, U.S. Army Corps of Engineers, who provided technical comments that we incorporated into the report as appropriate.
Patricia A. Marsh, CPAAssistant Inspector GeneralDefense Business Operations
Attachment:As stated
79Civil Works Fund | Principal Financial Statements, Notes, Supplementary Information and Auditor’s Report
Report on Internal Control and Compliance with Laws and Regulations
Internal ControlManagement is responsible for developing and maintaining effective internal control and for providing reasonable assurance that accounting data are accumulated, recorded, and reported properly; assuring that the requirements of applicable laws and regulations are met; and safeguarding assets against misappropriation and abuse. Because of USACE management’s assertion that the FY 2009 and FY 2008 Basic Financial Statements were free of material error, we performed auditing procedures to determine whether the financial statements were presented fairly in all material respects. In planning our audit, we considered USACE internal control over financial reporting and compliance with laws and regulations to determine our procedures for auditing the financial statements and to comply with Office of Management and Budget (OMB) guidance. But the purpose of our audit was not to express an opinion on internal control or compliance with laws and regulations. Accordingly, we do not express an opinion. However, we identified internal control weaknesses over financial reporting that we considered to be significant deficiencies, five of which we considered to be material weaknesses.
We conducted our audit in accordance with auditing standards generally accepted in the United States of America; the Government Accountability Office “Government Auditing Standards;” and the requirements of OMB Bulletin No. 07-04. Those standards require that we plan and perform the audit to obtain reasonable assurance about whether the financial statements are free of material misstatement. An audit includes examining, on a test basis, evidence supporting the amounts and disclosures in the financial statements. An audit also includes assessing the accounting principles used and significant estimates made by management, as well as evaluating the overall financial statement presentation and assessing the internal control over financial reporting and compliance with laws and regulations. We believe our audit provides a reasonable basis for our opinion.
Our testing of USACE internal controls included those procedures in OMB Bulletin No. 07-04 that were designed to determine whether an agency’s internal control provides reasonable, but not absolute, assurance that:
n Transactions are properly recorded, processed, and summarized to permit the preparation of the financial statements in accordance with U.S. GAAP, and to safeguard assets against loss from unauthorized acquisition, use, or disposition.
n Transactions that could have a direct and material effect on the consolidated and combined financial statements are executed in accordance with laws governing the use of budget authority and with laws, regulations, and Government-wide policies identified in Appendix E of OMB Bulletin No. 07-04.
We did not test all internal controls relevant to the operating objectives broadly defined by the Federal Managers’ Financial Integrity Act (FMFIA) of 1982. Rather, we focused our internal control testing on controls over financial reporting and compliance with laws and regulations.
We reported our audit findings on the unreliability of the USACE control environment before the FY 2009 audit. Our overall FY 2009 audit method emphasized substantive tests of details on account balances because the USACE internal controls were determined to be unreliable. As a result of our audit, USACE management posted material adjusting entries to the USACE FY 2009 Financials Statements to conform with U.S. GAAP and to address the internal control deficiencies.

80 Fiscal Year 2009 United States Army Annual Civil Works Financial Statement
Material WeaknessesDuring the audit, we identified General Property, Plant, and Equipment (General PP&E), Environmental Liabilities, Entity-wide Internal Controls, Financial Reporting, and Long-Term Water Storage Agreements as material weaknesses. USACE management reported only General PP&E as a material weakness in its FY 2009 Annual Statement of Assurance on Management Controls.
General Property, Plant, and Equipment
The USACE General PP&E line item is the single largest category of assets on USACE FY 2009 Basic Financial Statements. Its main components are Construction-in-Progress (CIP), Buildings and Other Structures (B&S), Land, and Equipment. Effective control and accountability over General PP&E assets are, therefore, a key USACE management imperative. During our FY 2009 audit, we noted several findings on internal controls related to the accuracy, existence, rights, and completeness of General PP&E, some of which were noted in prior-year audits.
Lack of Controls Over Construction AssetsUSACE did not fully implement the CIP quarterly review process. The quarterly CIP reviews are intended to verify that costs in the CIP account are part of active, ongoing projects, and that these costs are not identified with any asset previously placed in service, or do not represent a completed asset that should have been placed in service. The review should also identify expenses that USACE incorrectly classified as CIP. USACE established a 30-day time frame for placing assets or projects in service for their intended use. However, our review of 19 CIP projects identified three completed projects included in CIP. The three projects were completed before FY 2009 and should have been removed from CIP and placed in service. In addition, projects not intended for use by USACE were improperly included in CIP.
Lack of Supporting DocumentationUSACE was unable to provide supporting documentation for all the transactions in our CIP, B&S, and Equipment samples. A lack of documentation to support the asset costs and transactions authorization increases the risk that incorrect costs were capitalized or that unauthorized users approved incorrect costs. Our audit identified that documentation to support the useful lives, costs, and transaction amounts for General PP&E was not readily available and, in some instances, not provided. As a result, there were a significant number of testing exceptions noted for General PP&E, which identified weaknesses in internal controls.
Lack of Supervisory Review Over General Property, Plant, and Equipment Transaction Data EntryUSACE did not adequately validate the accuracy or completeness of information entered into the Corps of Engineers Financial Management System (CEFMS), which is USACE’s primary accounting system. This occurred because USACE did not consistently conduct an independent review of asset information entered into CEFMS across all districts. Adequate supervisory review is necessary to ensure the correct treatment of accounting transactions. Our audit identified the following types of errors that may have been prevented had USACE management completed consistent review procedures:
n Asset classifications were incorrect.
n Operation and maintenance costs were erroneously capitalized.
n Transaction amounts did not agree with the supporting documentation for several assets.
n Depreciation amounts of assets placed into service were incorrect due to wrong useful life.
n The useful life from additions and betterment costs was not adjusted.
n The fully depreciated value of transfer-in assets from other Federal agencies was not recognized.
n Assets no longer in use by USACE were inadequately capitalized.

81Civil Works Fund | Principal Financial Statements, Notes, Supplementary Information and Auditor’s Report
Erroneous asset classification, capitalization amounts, and useful life could yield inaccurate depreciation rates. Inaccurate depreciation rates inadequately portray the General PP&E balance and expenses for the accounting period.
Lack of General Property, Plant, and Equipment ReconciliationsGeneral PP&E reconciliation was not adequately performed. During FY 2009, USACE implemented a corrective action plan (CAP) that involved General PP&E reconciliations. This CAP required that each USACE district review, document, approve, and date each of the asset reconciliation reports and that each report have a reviewer signature, a date of completion, a documented resolution to each variance, and an approval signature and date by someone one level higher than the reviewer within 15 days after the end of the quarter. However, USACE management did not implement policies and procedures related to timely recording and review of PP&E reconciliations. Our audit noted instances where reconciliation reports were not signed in a timely manner, reports did not resolve all prior variances, and districts did not perform complete reconciliation reports. Lack of management review of General PP&E reconciliations and timely resolution of variances can result in misstatements in General PP&E account balances.
Environmental Liabilities
The Atomic Energy Commission created the Formerly Utilized Remedial Action Program (FUSRAP) to identify, investigate, and take appropriate cleanup action at sites with a low concentration of radioactive contamination resulting from the early atomic weapons programs. Since October 1977, USACE has continued the cleanup efforts at these sites and any additional sites that have been identified. These projected cleanup costs related to environmental liabilities are funded through the Civil Works appropriation. In addition, there are also non-FUSRAP environmental liabilities, which involve the cleanup of USACE facilities and property in accordance with Federal, State, and local environmental laws and regulations. We identified the following material weaknesses in the USACE internal controls related to environmental liabilities.
Accounting for Cleanup Costs Related to Government-Acknowledged Contamination. USACE incorrectly recognized Government-acknowledged liabilities. Government-acknowledged liabilities result from the Government’s decision to respond to events unrelated to the Government’s operations. Statement of Federal Financial Accounting Standards (SFFAS) No. 5 makes a distinction between the accounting treatment for liabilities arising from Government-related events and those arising from Government-acknowledged events. A Government-related liability results from Federal operations regardless of whether it is intentional or unintentional. Government-related liabilities should be fully recognized when the liability is measurable and probable. In contrast, only the actual work performed, but unpaid as of year-end, should be recognized as a liability for Government-acknowledged liabilities.
Accounting for Employee, Operations, and Maintenance Costs Associated With Environmental Liabilities USACE did not record a liability for the costs to operate and maintain a legacy waste facility because USACE regarded such costs as current period costs. In addition, USACE did not record costs associated with Headquarters employees responsible for program management because it was not aware that such costs should be included in the liability and because it determined the amount to be immaterial.
Recognition of Environmental Liabilities USACE did not recognize a remediation liability for three FUSRAP projects for which future remediation costs were probable and measurable as of September 30, 2008. Of the three projects, USACE did not record two as of June 30, 2009, because USACE policy for recognition of environmental liabilities for FUSRAP projects is subject to the completion of project feasibility studies, rather than the probable and measurable recognition criteria described in SFFAS No. 5. USACE correctly recorded the third project as of June 30, 2009.
USACE also misinterpreted Federal Accounting Standards Advisory Board Technical Release No. 2, Determining Probable and Reasonably Estimable for Environmental Liabilities in the Federal Government, and inappropriately limited the recognition criteria to those sites with completed project feasibility studies.

82 Fiscal Year 2009 United States Army Annual Civil Works Financial Statement
Entity-Wide Internal Controls
There are five integrated components of internal control: Control Environment, Risk Assessment, Monitoring, Information and Communication, and Control Activities. Taken together, they provide management with reasonable assurance that USACE achieves its objectives related to effectiveness and efficiency of operations, compliance with applicable laws and regulations, and reliability of financial reporting. During the FY 2009 audit, we continued to find deficiencies in four of the five components of USACE internal controls. USACE has not fully implemented an appropriate organizational and internal control structure that is necessary for effective financial management and oversight. Although USACE financial management oversight exists, weaknesses in the entity-level control structure continue to affect USACE financial management as noted below.
Control EnvironmentUSACE has not fully implemented a financial management structure where U.S. GAAP is effectively applied. USACE management has not completed a review to assess the appropriateness of existing non-U.S. GAAP financial policies and procedures. In addition, USACE management was unable to provide a complete listing of noncompliant accounting treatments with financial statement effects. Our audit also identified gaps in management’s implementation of accounting standards and a lack of policies and procedures in several processes.
The USACE financial management structure lacks appropriate and clear internal reporting relationships. USACE management has ineffective financial guidance and oversight over the USACE districts and divisions that provide financial information. In addition, the review of adjustments made in the financial reporting process is ineffective.
Risk AssessmentUSACE has not fully implemented an ongoing, entity-wide risk assessment process and has not developed or fully implemented adequate controls in relation to information systems and communication relevant to financial reporting.
MonitoringUSACE has not implemented entity-level monitoring controls. Specifically USACE lacks:
n a process to monitor and control timely completion of the action plan milestones and update the status of completion;
n oversight over the review of adjustments made in the financial reporting process;
n an effective process for a timely review of offline financial statements;
n oversight over the processes prescribed by and reporting related to FMFIA and Federal Financial Management Improvement Act (FFMIA);
n proper training for employees to prevent Antideficiency Act (ADA) violations from occurring;
n an effective process to identify environmental liabilities for which USACE may be responsible;
n an effective process for financial reporting related to, and the disclosure of, Long-Term Water Storage Agreements;
n an effective process for maintaining supporting documentation for, and the management review of, General PP&E; and
n an effective process for maintaining supporting documentation for Work-in-Kind (WIK) and Land, Easements, Rights-of-Way, Relocations, and Dredged Materials (LERRD) related to cost share agreements and the management review of cost share agreements.
83Civil Works Fund | Principal Financial Statements, Notes, Supplementary Information and Auditor’s Report
Information and CommunicationUSACE has not developed or fully implemented adequate controls in relation to information systems and communication relevant to financial reporting as evidenced by the weaknesses noted in the entity’s information technology area.
Because of USACE’s weak entity-wide controls, USACE management adjusted material financial reporting errors during annual audits rather than having adequate internal controls in place to prevent and detect these errors in the normal course of business. More importantly, USACE may not produce accurate, complete, and timely financial information for the financial statements, which could ultimately result in significant misstatements.
Financial Reporting
USACE has a complex financial reporting process that includes summarizing accounting transactions from 59 CEFMS databases, using the Corps of Engineers Enterprise Management Information System. The accounting transaction data are further summarized in the Corps of Engineers Enterprise Management Information System and compiled into the Defense Departmental Reporting System (DDRS), which generates the USACE financial statements. DDRS prepares financial statements in accordance with DoD policies and procedures for internal DoD-wide reporting. However, because of the complexities of the process and system constraints, the financial statements produced do not comply with OMB and Financial Accounting Standards Advisory Board requirements.
In addition to preparing the DDRS financial statements for internal DoD-wide reporting purposes, USACE management prepares separate stand-alone year end comparative financial statements that conform to OMB and Department of the Treasury Financial Management Service guidance for audit and external reporting purposes. This requires a significant amount of manual data input by USACE Finance Center staff within a compressed reporting time frame. The manually intensive process creates a greater risk of error. Inconsistent execution of review procedures and similar control activities over financial statement preparation increases the risk that an error will exist within the financial statements and remain undetected.
Review and Approval of Manual Journal VouchersUSACE lacks internal control procedures over CEFMS manual journal entries. Manual CEFMS journal entries are initiated at the district-level and are made to correct imbalances or errors. These journal entries are entered into CEFMS without appropriate support, review, or approval. The lack of appropriate support, review, and approval of manual journal entries could lead to a material misstatement in the financial statements.
Reconciliations in the Defense Department Reporting System USACE recorded unsupported journal voucher entries to eliminate variances in account balances. Specifically, USACE recorded unsupported adjustments to eliminate the variance between the Revolving Fund account balance in CEFMS and the Funds Balance with Treasury. In addition, USACE eliminated variances between trading partner activity amounts in DDRS and the amounts represented in the DDRS trial balance for Federal expenses by recording unsupported journal voucher entries and reclassifying amounts between Federal and non-Federal expenses. Thus, if these transactions were entered into DDRS and the activity was the result of erroneous transactions and records outside USACE, there is an increased risk that the USACE Basic Financial Statements could be materially misstated.
Presentation and Disclosure USACE omitted disclosures related to Inventory, Heritage Assets, and Required Supplementary Information. USACE did not disclose Operation, Maintenance, and Supplies (OM&S) in accordance with U.S. GAAP. During the audit, we noted two stock items that should be classified as OM&S held for future use. These items were included in the OM&S line item on the face of the financial statements but not separately disclosed in the footnotes as required by SFFAS No.3, Accounting for Inventory and Related Property. In addition, USACE did not:

84 Fiscal Year 2009 United States Army Annual Civil Works Financial Statement
n separately disclose its allowance for obsolete or unserviceable OM&S in the footnote or show it as a separate line item on the face of the financial statements,
n disclose a difference between the carrying amount of OM&S before identification as obsolete or unserviceable,
n disclose balances for each of the categories of OM&S, and
n disclose the decision criteria for identifying each category to which OM&S are assigned.
Also, USACE did not adequately disclose Heritage Assets in accordance with SFFAS No. 29, Heritage Assets and Stewardship Land. Specifically, USACE did not adequately disclose stewardship PP&E policies, how stewardship PP&E relates to USACE mission, or a description of the major methods of acquisition and withdrawal of stewardship PP&E.
Trust Fund ClassificationThe South Dakota Terrestrial Wildlife Habitat Restoration Fund (Restoration Fund) is inappropriately classified as an earmarked fund as defined by U.S. GAAP. Specifically, USACE inappropriately recorded the interest earned on the investments held in the Restoration Fund as an entity asset. However, USACE does not have the right (legal ownership) to use the interest earned on the investments held in the Restoration Fund for USACE operations. Therefore, the interest earned on the investments held should be recorded as a nonentity asset.
Prior-Year RecoveriesOur FY 2009 audit identified recovery transactions totaling $125 million that should have been recorded in FY 2008. In addition, USACE did not record recoveries of $8.5 million in FY 2009. USACE made auditor proposed adjustments to correct these balances.
Long-Term Water Storage Agreements
USACE has long-term agreements or promissory notes with other Federal entities for water storage facilities provided by USACE. These agreements range from approximately 20 to 30 years. During our audit, we noted that USACE disclosures for Long-Term Water Storage receivables were not in accordance with U.S. GAAP. USACE financial statements do not provide information about the range of maturity dates, the extent of the agreements, the range of interest rates, or how interest rates are determined.
In addition, USACE did not properly recognize long-term receivables in accordance with U.S. GAAP for two projects. Specifically, USACE recorded accounts receivable (public) and advances from others (public) of $478 million. However, USACE did not provide evidence of receipt of cash in advance and did not substantiate the amount recorded. Based on our review of the agreements, there were provisions that should have been accounted for similar to cost share agreements and provisions that should have been separately accounted for as promissory notes (notes receivable) from the third parties. For the principal amount of the agreements associated with the provisions in the promissory notes where repayment spans over 30 years and interest is to be assessed, $1.5 billion should have been recorded as Accounts Receivable and as due to the Treasury General Fund. Because USACE did not separately account for the provisions as promissory notes from the third parties, there was an understatement of Accounts Receivable-Public and due to Treasury General Fund of $1 billion and $1.5 billion, respectively, as well as an overstatement in advances from others by $478 million. USACE made the auditor-proposed adjustments to correct these balances at year-end.
Lastly, USACE did not record new agreements or changes to amortization schedules in a timely manner. Specifically, we identified two agreements that were executed on January 16, 2009, but were not recorded in CEFMS until September 30, 2009.
85Civil Works Fund | Principal Financial Statements, Notes, Supplementary Information and Auditor’s Report
Significant DeficienciesDuring the FY 2009 audit, we identified USACE Cost Share Revenue and Financial Management Systems as significant deficiencies. USACE management did not and was not required to report significant deficiencies in its FY 2009 Annual Statements of Assurance on Management Controls.
Cost Share Revenue
USACE did not follow the matching concept when recognizing revenue for the cost share agreements in accordance with U.S. GAAP. Cost share agreements are agreements with a third party where the third party is expected to cover a portion of the total costs in cash, WIK, or LERRD. WIK and LERRD are elements that comprise the estimated total cost of the project and are given consideration when initially determining cash needed in advance from the third party. USACE employs a WIK first premise in recognizing cost share revenue. For example, if the estimated total cost of the project is $1 million and the third party is expected to cover 50 percent of the estimated total cost of the project, the estimated share for the third party is expected to be $500,000. If the third party and USACE agree that the estimated contribution of WIK and LERRD is worth $300,000, the third party is expected to pay $200,000 in advance. Thus, 20 percent of the estimated total cost is expected in cash. The 20 percent represents the share to be paid by the third party to cover actual costs incurred by USACE, and thus, the revenue recognized for the period should equal 20 percent of actual costs incurred by USACE for the same period.
Although WIK and LERRD are elements of the total costs (that is, costs incurred that are directly paid by the third party and costs incurred that are directly paid by USACE), WIK and LERRD are not part of the actual costs incurred on USACE financial statements. Thus, the USACE method of applying WIK first results in the lack of full revenue recognition to match actual costs incurred by USACE in the period.
In addition, our review of the financial statement presentation and disclosure of deferred credits and revenue associated with cost share agreements determined that USACE did not properly calculate deferred credits as of September 30, 2009, and did not consider the current-year effect of the prior-year adjustment to revenue for cost share activity. Specifically, we noted that USACE determined deferred credits based on the ending balance of the Fund Balance with Treasury general ledger account, at post-close summary level. This summary level account balance consists of the beginning deferred credits balance plus current-year collections minus current-year disbursements. By using this account balance without evaluation of its components, USACE did not use current year revenue as a factor in determining the year-end deferred credits balance. Instead, cash disbursements to pay bills were inappropriately part of the deferred credits calculation.
Financial Management Systems
USACE financial management systems are not in compliance with DoD and National Institute of Science and Technology requirements. Weaknesses existed in the policies and procedures governing security management, access controls, configuration management, and segregation of duties. The lack of effective policies and procedures over security management and access controls could result in inconsistencies in identifying and determining the individuals who should have access to CEFMS. The lack of effective controls over configuration management increases the risk that unauthorized, untested, and harmful CEFMS changes can occur that could impact the confidentiality, integrity, and availability of CEFMS data.
The lack of documented policies and procedures for handling segregation of duties could lead to an inconsistent application of how segregation of duties are administered and increase the risk of excessive access that could impact the confidentiality, integrity, and availability of CEFMS data.
86 Fiscal Year 2009 United States Army Annual Civil Works Financial Statement
Compliance With Laws and RegulationsManagement is responsible for complying with existing laws and regulations related to financial reporting. The purpose of our work was to determine compliance with selected provisions of the applicable laws and regulations and to obtain reasonable assurance about whether the USACE FY 2009 Basic Financial Statements were free from material misstatement. We performed tests for compliance with provisions of laws and regulations that could have a direct and material effect on the determination of financial statement amounts, as well as with other relevant laws and regulations specified in OMB Bulletin No. 07-04. However, we did not determine whether USACE complied with all applicable laws and regulations related to financial reporting. Providing an opinion on compliance with laws and regulations was not an objective of our audit, and accordingly, we do not express such an opinion.
Our audit disclosed instances of noncompliance or other matters that Government Auditing Standards and OMB Bulletin No. 07-04 required agencies to report.
Federal Managers’ Financial Integrity Act of 1982
USACE is not compliant with FMFIA. The USACE FMFIA process is not properly designed, not operating effectively, and not sufficient to identify, evaluate, correct, and report all material weaknesses. USACE has not fully implemented its internal control program to ensure that the entity takes appropriate action throughout the year to meet the objectives of FMFIA.
USACE asserts that internal controls meet the requirements of OMB Circular No. A-123, Appendix A, for Internal Controls over Financial Reporting except for a material weakness related to General PP&E based on its FY 2008 audit report. Although USACE performs its own assessment to determine that financial systems are effective and operating in compliance with FMFIA, its primary source of information for its assurance statement is our audit report. Thus, the USACE FY 2009 Assurance Statement on Managers’ Internal Controls is not prepared in accordance with the requirements of OMB Circular No. A-123 (the circular issued under the authority of FMFIA), Appendix A, Section V, Management’s Assurance Statement on Internal Control over Financial Reporting.
Further, USACE does not report within its annual statement of assurance on whether the entity’s accounting system (financial management system) conforms to the principles, standards, and requirements prescribed by the Government Accountability Office as required by FMFIA, Section 4. Lastly, several of USACE’s cycle memoranda were incomplete or inaccurate and thus did not meet the documentation requirements established by OMB Circular A 123, Appendix A, Section IV.
Federal Financial Management Improvement Act of 1996
USACE lacks sufficient controls to ensure compliance with all requirements of FFMIA. Specifically, USACE does not have robust policies and procedures to ensure review and appropriate implementation of applicable accounting guidance. In addition, USACE has not resolved CEFMS programming limitations so that transactions can be recorded in accordance with the United States Standard General Ledger requirements. Because USACE has not ensured appropriate implementation of applicable accounting guidance and has not resolved the programming limitations that exist in CEFMS, management will need to continue to manually record significant DDRS journal vouchers so that activity is properly recognized and in compliance with the United States Standard General Ledger.
Energy and Water Development Appropriations Act
We were unable to test USACE reprogramming actions in accordance with the Energy and Water Development Appropriations Act. Reprogramming is the movement of funds to or from a program, project, or activity. We were unable to test USACE reprogramming actions because USACE did not provide supporting documentation or assurance over the completeness of the reprogramming population selected for test work. In addition, USACE lacked proper internal controls

87Civil Works Fund | Principal Financial Statements, Notes, Supplementary Information and Auditor’s Report
over initiating and recording reprogramming actions in the financial system. USACE relied on its financial system for the calculation of the baselines without maintaining readily available support for the calculations.
Debt Collection Improvement Act of 1996
In executing our procedures relating to USACE compliance with certain provisions of the Debt Collection Improvement Act, we noted that, of the 32 debtor files tested as of September 30, 2009, USACE:
n did not refer debts older than 180 days to Treasury in a timely manner for 10 debtor files;
n inaccurately calculated penalties, interest, and administrative fees for 6 debtor files;
n did not properly and timely use the salary offset program for 12 debtor files; and
n did not provide statement of accounts or demand letters supporting the total amount due for 3 debtor files.
South Dakota Terrestrial Wildlife Habitat Restoration Trust Fund
USACE did not comply with Public Law 110-114, Title V, Section 5129, which requires that the Restoration Fund include two asset accounts, one for principal of the investment and one for interest earned on the investment. Management did not perform a thorough review of the guiding public law establishing the Restoration Fund to properly present the related financial information in the USACE financial statements. As a result, the disclosure of nonentity assets and liabilities is understated by the amount of interest associated with the Restoration Fund ($20.5 million as of June 30, 2009).
Antideficiency Act
USACE management self-reported four infractions related to ADA to the Assistant Secretary of the Army (Financial Management and Comptroller). Two of the four instances involved the Revolving Fund Plant Replacement and Improvement Program. Specifically, a possible violation of the ADA occurred when approximately $1 million of Revolving Fund General and Administrative funds were used to fund a space compression project when the Revolving Fund Plant Replacement and Improvement Program was the proper source of funding. In addition, a possible violation of the ADA occurred when approximately $2.5 million was used from Operation and Maintenance and General Expense to fund the development of an Enhanced Learning Network, and the proper funding source was again the Revolving Fund Plant Replacement and Improvement Program. The third possible violation occurred when approximately $500,000 of obligations and expenses were incurred related to the study and design of a USACE project prior to having the statutory authority to do so. After having the statutory authority, USACE continued the study without a cost share partner to take on a percentage of the expenses. Lastly, the Chicago District reported that a possible violation of the ADA occurred when approximately $39.3 million of Federal obligations and expenditures were incurred in excess of the amount authorized.
Audit Disclosures We will provide the recommendations for corrective actions associated with the USACE material internal control weaknesses, other significant deficiencies, and noncompliance with laws and regulations addressed in this report to USACE management in a separate letter.

United States Army : 1500 Army Pentagon : Washington, DC, 20310-1500 : www.army.mil
The Soldier’s CreedI am an American Soldier.
I am a Warrior and a member of a team. I serve the people of the United States and live the Army Values.
I will always place the mission first.I will never accept defeat.
I will never quit.I will never leave a fallen comrade.
I am disciplined, physically and mentally tough,trained and proficient in my warrior tasks
and drills. I always maintain my arms,my equipment and myself.
I am an expert and I am a professional.
I stand ready to deploy, engage, anddestroy the enemies of the United States
of America in close combat.
I am a guardian of freedom and theAmerican way of life.
I am an American Soldier.