Embed Size (px)
Citation preview

THE NUTRITIVE VALUE OF WHEAT WET DISTILLERS BYPRODUCTS AND WET BREWERS GRAINS AS SUPPLEMENTS
FOR FEEDLOT AND GRAZING CATTLE.
A ThesisSubmitted to the Faculty of Graduate Studies and Research
in Partial Fulfillment of the Requirements for the Degree of Master of Science
in theDepartment of Animal and Poultry Science
University of Saskatchewan Saskatoon
UNIVERSITY OF NAIROBI LIBRARY
T. O. Box 30197 NAIROBI
BY
MESHACK OBWANGA OJOWI
Spring 1995
© Copyright Meshack O. Ojowi, 1995. All rights reserved.

1 c
College of Graduate Studies and Research University of SaskatchewanRoom 50 Murray Building, Telephone: (306) 966-5751, Facsimile: (306) 966-5756
GSR 301
Certification of Master's Thesis Work
le the undersigned, certify that Meshack Obwanga Ojowi______________________erton College, Kenya (Agric. Diploma); Calpoly, Pomona (B.Sc.)
(full name) (degrees)
andidate for the degree of M»Sc
i the Department/College of Animal and Poultry ScienceThe Nutritive Value of Wheat Wet Distillers
as presented his /her thesis with the following title:
products and Wet Brewers Grains as Supplements for Feedlot and Grazing Cattle
(as it appears on the title page and front cover of thesis)
lat the thesis is acceptable in form and content, and that a satisfactory knowledge of the field covered by the thesis was
emonstrated by the candidate through an oral examination held on June 12, 1995_______________________
June 12, 1995

In presenting this thesis in partial fulfillment of the requirements for a Postgraduate degree from the University of Saskatchewan, I agree that the Libraries of this University may make it freely available for inspection. I further agree that permission for copying of this thesis in any manner, in whole or in part, for scholarly purposes may be granted by the professor or professors who supervised my thesis work or, in their absence, by the Head of Department or the Dean of the College in which my thesis work was done. It is understood that any copying or publication or use of this thesis or parts thereof for financial gain shall not be allowed without my written permission. It is also understood that due recognition shall be given to me and the University of Saskatchewan in any scholarly use which may be made of any material in my thesis.
Request for permission to copy or to make other use of material in this thesis in whole or in part should be addressed to:
Head of Department of Animal and Poultry Science University of Saskatchewan
Saskatoon, Saskatchewan S7N 0W0

ABSTRACT
Wet distillers by-products from wheat based ethanol production and wet brewers
grains (WBG) were evaluated as supplements in feedlot and grazing cattle diets. A
feedlot experiment used canola meal, WBG and wet distillers grains (WDG) as protein
supplements during the growing period. Three diets (control, WBG and WDG) were
used in a completely randomized design experiment. Average daily gain (ADG), dry
matter intake (DMI), feed conversion ratio (FCR), ultrasonic back fat thickness
(USFAT) and ultrasonic ribeye area (USREA) were measured throughout the trial.
Carcass fat thickness and composition were measured after slaughter. During the
growing period ADG and DMI were similar across all the treatments, however, steers
fed WBG diet tended (P<0.10) to have better feed conversions than control fed steers.
During the finishing phase the control fed steers grew faster (P<0.05) than the WBG fed
steers. Wet distillers grains fed cattle were intermediate. Fat and muscle deposition and
carcass characteristics were similar across treatments. However, carcass composition
indicated that WDG steers had more (P<0.01) intermuscular fat than control and WBG
and WBG had more subcutaneous fat (P<0.02) compared to the WDG group. These
results indicate that WDG and WBG may be used to replace standard feed ingredients in
the grower ration.
An in situ nylon bag experiment was used to determine the dry matter (DM) and
crude protein (CP) degradation from WBG and WDG collected during (WBGT; WDGT)
and after (WBGP; WDGP) the trial. A completely randomized design experiment was
used with one fistulated cow and four feed samples. Three separate days were used to

11
carry out seven rumen incubations of 2, 4, 6, 8, 12, 24 and 48 h. Dry matter and CP
degradation was higher in WDG compared to WBG. Similarly, effective degradability
parameters indicated that WDG is more degradable than WBG. The high degradability
observed for WDG may be related to the higher soluble fraction and rate of degradation.
The results show that WBG has a higher rumen undegradable protein than WDG.
The value of thin stillage as an energy and protein supplement was determined for
growing cattle grazing crested wheatgrass. Forty steers were used in a trial in which
ADG, fluid intake, USFAT, DMI from stillage consumption and plasma metabolite
concentration were measured. Crested wheatgrass (CWG) pastures and thin stillage
samples collected during the trial were subjected to proximate analysis. Results of the
trial indicate that ADG, fluid intake, and DMI from stillage consumption were all higher
(P<0.05) for stillage fed cattle relative to the water group. Fat deposition and plasma
urea N, magnesium and phosphorus concentrations were also higher for stillage fed
cattle. The proximate analysis of thin stillage indicated high protein and energy content.
Similar analysis for CWG indicated a declining nutritional quality as the pastures
matured and the dry season progressed. The higher performance for the stillage fed cattle
in an indication of the higher nutritional status of the stillage fed cattle. In conclusion,
the results from these trials indicate that by-products from wheat based ethanol
production are valuable sources of nutrients for cattle managed under a variety of
production situations.
Ill
Acknowledgments
I would like to thank my supervisor D. A. Christensen for his, tuition, patience
and encouragement during the entire course of my M.Sc. program, members of my
advisory committee J.J. McKinnon, G.I. Christison, C.M. Williams, R.D.H. Cohen and
G.L. Campbell. Appreciation is extended to the staff at the Animal and Poultry Science
laboratory particularly N. Webb for his technical assistance during analysis of
experimental ration samples, V. Racz and the staff at University of Saskatchewan Feed
Testing Laboratory, N. Suttle of Agriculture Canada Research for extensive use of their
freeze drier. I would also like to thank the University of Saskatchewan farm manager, G.
Francis, and his staff for the organization of timely supply of the ethanol distillation by
products to the feedlot and pasture trials conducted simultaneously at University of
Saskatchewan feedlot and Termuende Research Station at Lanigan, Saskatchewan.
Special thanks to researchers R. Bergen Department of Animal and Poultry Science and
N. Kohle of Saskatchewan Agriculture and Food Technology for their ultrasound work
on the feedlot as well as the pasture steers and carcass analytical work on the feedlot
cattle. Special appreciation is extended to J.J McKinnon for coordination of the research
projects and negotiating for research animals from Pound Maker Ag-Ventures Limited.
The assistance of Pam Little and administrative staff of the Department of Animal and
Poultry Science is highly appreciated. Many thanks to Kenya Agricultural Research
Institute (KARI) for granting me the opportunity to pursue further studies in Canada.
Assistance from these agencies is acknowledged and highly appreciated
Canadian International Development Agency (CIDA) for tuition, subsistence and

IV
research funds and the Kenya High Commission (Ottawa) for the management of CIDA
funds, Mohawk Oil company through the PoundMaker Ag-ventures, University of
Saskatchewan Farm Project and the Natural Science and Engineering Research Council
for provision of research assistance.
Finally and most importantly I would like to express my heart felt gratitude to
my family particularly my mum, Lonah, wife Jullianne, children Ben, Maureen, Martin
and Purity whose support, constant prayer and patience made it possible for me to
successfully complete this program. May God bless all of you.

Table of contents
ABSTRACT........................................................................................................................ i
Acknowledgments............................................................................................................. iii
Table of contents................................................................................................................ v
List of Tables...................................................................................................................viii
List of Figures.................................................................................................................... x
List of abbreviations.......................................................................................................... xi
1.0 Introduction...................................................................................................................1
2.0 Review of literature...................................................................................................... 7
2.1 Energy and protein requirement systems for cattle...................................................7
2.1.1 Protein supplements in cattle rations.................................................................10
2.1.2 Effect of N and carbohydrate source on microbial protein synthesis...............13
2.1.3 Importance of dietary rumen undegradable protein and effect of processing on
protein utilization........................................................................................................15
2.1.4 Relationship of acid detergent insoluble nitrogen to protein solubility........ 17
•*»
2.2 Sources of protein for ruminants..............................................................................18
2.3.1 Soybean meal........................................................................................................19
2.3.2 Canola products for cattle............................................................................ 21
2.3.3 Ethanol distillation by-products for cattle........................................................... 22
2.3.3.1 The nutritive value of distillers grains.........................................................23
2.3.3.2 Distillers grains as an energy source 24

VI
2.3.3.3 The nutritive value of distillers grains as a source RUP............................... 30
2.3.3.4 Thin stillage as a potential supplement for ruminants.................................. 32
2.3.4 Brewers grains as supplements for cattle.......................................................... 35
2.5 Summary of literature review..................................................................................... 37
3.0. Evaluation of wet brewers and distillers grains as protein supplements for feedlotcattle..................................................................................................................................39
3.1 Introduction............................................................................................................. 39
3.2 Materials and methods............................................................................................ 41
3.2.1 Experimental animals and housing................................................................... 41
3.2.2 Experimental diets and feeding protocol.......................................................... 41
3.2.3 Data collection and analytical procedure.......................................................... 43
3.2.4 Statistical analysis............................................................................................ 45
3.3 Results and Discussion............................................................................................... 45
3.4 Conclusion................................................................................................................. 60
4.0. In Situ rumen disappearance of dry matter and crude protein from wet brewers anddistillers grains..................................................................................................................61
4.1 Introduction............................................................................................................. 61
4.2 Materials and methods............................................................................................ 63
4.2.1 Experimental animals and housing...................................................................... 63
4.2.2 Experimental treatments and in situ rumen incubation procedure....................... 63
4.2.3 Statistical analysis................................................................................................ 65
4.3 Results and Discussion 65

4.4 Conclusion............................................................................................................... 79
5.0. Thin stillage from wheat based fermentation as a water source for cattle grazingcrested wheatgrass pastures.............................................................................................. 80
5.1 Introduction............................................................................................................. 80
5.2 Materials and methods............................................................................................ 82
5.2.1 Experimental animals and housing...................................................................... 82
5.2.2 Experimental diets and feeding protocol............................................................. 82
5.2.3 Data collection and analytical procedure............................................................. 82
5.2.4 Statistical Analysis............................................................................................... 83
5.3 Results and Discussion............................................................................................... 83
5.4 Conclusion................................................................................................................. 99
6.0 General Discussion and Conclusions...................................................................... 100
7.0. Literature cited.........................................................................................................107
vii

Vlll
2.1 True nitrogen digestibility, biological value and net utilization of mixed rumen
List of Tables
microorganisms................................................................................................................14
2.2 Soluble and degradable protein fractions in various feedstuffs................................. 20
2.3 The energy values of distillers grains for beef cattle................................................. 27
2.4 Performance of calves fed corn distillers by-products supplements..........................28
2.5 Effect of corn distillers by-products on performance of finishing cattle................... 29
2.6 Effect of corn by-products on ruminal pH and volatile fatty acid concentrations.....31
2.7 Rumen undegradable protein values of distillers by-products determined withfistulated steers..................................................................................................................33
2.8 Disappearance and the effective degradability for dry matter and nitrogen in wheat-based distillers dried grains...............................................................................................34
3.1 Outline of the experimental protocol for the feedlot feeding trial, 1992................... 42
3.2 Ingredient composition and analysis of concentrate used in the growing and finishingperiods of the trial.............................................................................................................46
3.3 Composition and analysis of diets fed to the steers during the growing period of thetrial................................................................................................................................... 47
3.4 Composition and analysis of diets fed to the steers during the finishing period of thetrial.................................................................................................................................... 49
3.5. Summary of the performance of cattle fed wet brewers and wheat wet distillersgrains or the control diet during the growing period of the trial......................................50
3.6. Summary of the performance of cattle fed wet brewers and wheat wet distillersgrains or the control diet during the finishing period of the trial......................................52
3.7 Performance of cattle fed wet brewers or wheat wet distillers grains or canola meal control over the course of the entire feeding period....................... .................................54

IX
3.8 Linear regression parameters for rate of fat and ribeye development for steers fed thecontrol, wet brewers and wheat wet distillers grains diets...............................................57
3.9 Carcass characteristics and composition of cattle fed the control, wet brewers orwheat wet distillers grains diets........................................................................................ 59
4.1 Ingredient make up of the barley based concentrate and chemical analysis of the feedused in the fistulated cow ration....................................................................................... 66
4.2 Chemical analysis of pre (malting barley and wheat grain) and post (wet brewers andwet distillers grains) fermentation products used in the incubation study.......................67
4.3 Dry matter and crude protein disappearance and effective degradability from wetbrewers and distillers grains............................................................................................. 72
5.1 Analysis of thin stillage samples collected throughout the during grazing trial........85
5.2 Performance of cattle grazing, crested wheatgrass pastures, with access to water orthin stillage........................................................................................................................88
5.3 Plasma concentration of blood metabolites of cattle with access to water or thinstillage on crested wheatgrass grass..................................................................................91

List of Figures
1.1 Ethanol distillation process and the byproduct feeds................................................... 4
1.2 Beer brewing process and the byproduct feeds............................................................ 5
3.1 Fat development in cattle fed control, wet brewers or distillers grains...................... 55
3.2 Muscle development in cattle fed control, wet brewers or distillers grains............... 56
4.1 Dry matter disappearance from wet distillers grains collected during the trial..........69
4.2 Dry matter disappearance from wet distillers grains collected after the trial............ 70
4.3 Crude protein disappearance from wet distillers grains collected during the feedingtrial.................................................................................................................................... 73
4.4 Crude protein disappearance from wet distillers grains collected after the feedingtrial.................................................................................................................................... 74
5.1 Average crude protein, acid and neutral detergent fiber content of crested wheatgrasspastures over an 83 day grazing period.............................................................................86
5.2 Average daily gain for cattle with access to water or thin stillage............................. 89
5.3 Cumulative fluid intake for cattle with access to water or thin stillage..................... 92
5.4 Dry matter and digestible energy intake from stillage consumption for cattle grazingcrested wheatgrass........................................................................................................ -..93

XI
ADFADGADINADFIPAOACARCBMBPBVCCaCDDGCDDGSCDGSCGFCGMClcmCMCNCPSC 02CPCPDCuCWDGCWGCWGMdDCGFDEDEIDMDMDDDGSDMIECPDEDEDMDEEFCRFeg
List of abbreviations
acid detergent fiberaverage daily gainacid detergent insoluble nitrogenacid detergent fiber insoluble proteinAssociation of Official Analytical ChemistsAgricultural research councilBarley maltborate phosphatebiological valueCelsiuscalciumcorn dry distillers grainscorn dry distillers grains with solublescorn distillers grains with solublescorn gluten feedcom gluten mealchlorinecentimetercanola mealCornell Net Carbohydrate and Protein System carbon dioxide crude proteincrude protein disappearance coppercom wet distillers grains crested wheatgrass corn wet gluten meal daydry com gluten feed digestible energy digestible energy intake dry matterdry matter disappearancedry distillers grains with solublesdry matter intakeeffective crude protein degradabilityeffective degradabilityeffective dry matter disappearanceether extractfeed conversion ratioirongram

XU
h hourH20 waterHOM hominy feedK potassiumkg kilogram(s)L liter(s)LB pound(s)MB malting barleyMeal megacalorieME metabolizable energyMF medium frameMg magnesiumMJ megajoulemm millimeterMn manganeseMRM mixed rumen microorganismsN nitrogenNa sodiumNAS National Academy of SciencesNDF neutral detergent fiberNDICP neutral detergent insoluble nitrogenNE net energyn h 3 ammonian h 3-n ammonia nitrogenNPN non-protein nitrogenNCR National Research CouncilNSC non structural carbohydrateP phosphorusPE protein efficiencyRUP rumen undegradable proteinSAS Statistical Analysis System Institute, Inc.SBM soybean mealSC structural carbohydrateSE standard error of meansTCA trichloroacetic acidTDN total digestible nutrientsTND true nitrogen digestibilityTS thin stillageUSFAT ultrasonic fatUS REA ultrasonic rib eye areaVFA volatile fatty acidsWBG wet brewers grainsWDB wet distillers by-productsDDG dry distillers grains •WDG wet distillers grains

XIU
WGWWDGZn
wheat grainwheat wet distillers grains zinc

1.0 Introduction
Ruminants have two unique capabilities as food producing animals. First their rumen
microbial population produces cellulases and other enzymes that degrade complex
carbohydrates. They can therefore use roughages or high fiber feeds such as distillers
grains as a major part of their ration. Secondly, because the rumen microbes produce
proteases and urease and can also combine ammonia and carbon skeletons to form amino
acids, non-protein nitrogen is converted to microbial protein. This microbial protein
partially meets the ruminant protein requirements. However, not all of the ammonia is
converted to microbial protein and part can be excreted via urine as urea. This is,
however, an inefficient process. If there is a lack of energy available for synthesis of
microbial protein, fermentation will reduce the amount of nitrogen utilized by the
ruminant. Dietary protein that escapes microbial fermentation in the rumen is an
advantageous nutrient to the animal as it may be more efficiently used.
Many of the less degradable protein sources arise from the processing of grains and
other feedstuffs. Ethanol distillation of wheat cereal grain results in by-products such as
wheat wet distillers grains and thin stillage which are excellent sources oLrumen
undegradable protein and energy for growing ruminants. Saskatchewan accounts for the
largest portion (14 million tonnes) of Canadian wheat production. Approximately 37,000
tonnes of this wheat are used to produce 14 million liters of fuel ethanol at the
PoundMaker plant at Lanigan, Saskatchewan. This produces 11,728 tonnes of wet

2
distillers grains of which 28.9% is dry matter and 50,400 tonnes of thin stillage with 7-
8% dry matter.
Most of the research data available on the nutritive value of distillers by-products
involves corn distillers by-products and has been obtained in the USA where com is
readily available for ethanol production. In western Canada, wheat is more readily
available than com, hence ethanol production is wheat-based rather than corn-based.
During the ethanol distillation process, large quantities of by-products (wet distillers
grains and thin stillage) are generated. These by-products have to be disposed of without
becoming a burden to the ethanol enterprise. This may be achieved by feeding the by
products to livestock with minimum operating expenses. Other ways of disposal include,
use as organic fertilizers and dumping. However, both these two options are less
appealing and unpopular to potential users.
The nutritive value of corn dry distillers grains (CDDG) and thin stillage or corn dry
distillers grains with solubles (CDDGS) has been evaluated and recommended as
suitable for inclusion in ruminants rations. The recommendation for use of the two by
products as cattle supplements is based on their high energy and protein content. During
the distillation process, cereal grains are ground, slurried with water and cooked to
gelatinize the starch. The resultant mash is cooled to fermentation temperature,
inoculated with yeast and allowed to ferment for a period of three to five days.
Distillation of the fermented mash results in ethanol alcohol and a liquid (whole stillage)
which is processed further to make distillers by-products. Whole stillage is passed over
screens to remove coarse unfermented portions of grains. Mechanical pressing yields wet

3
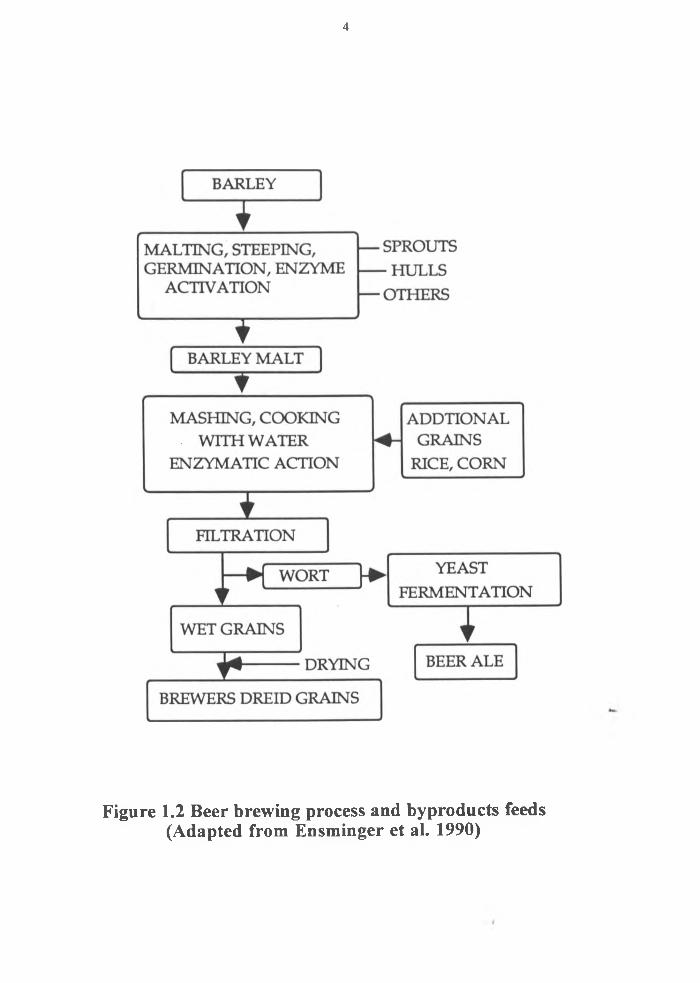
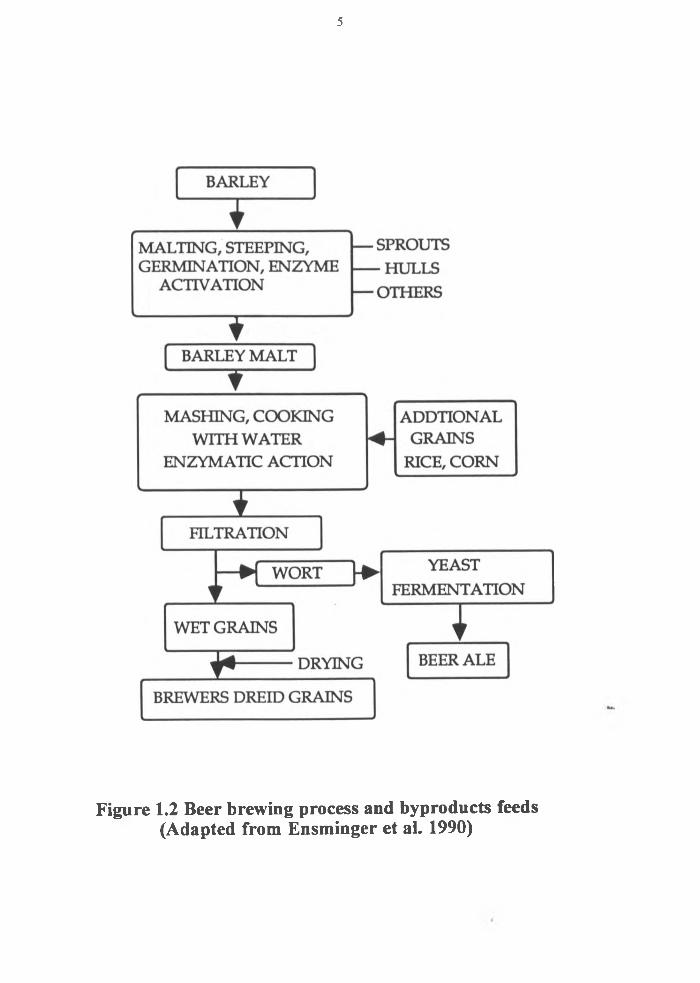
distillers grains ( Figure 1.1). A similar process (except for the distillation part) to that
described in Figure 1.1, is used to produce wet brewers grains from barley malt. Figure
1.2 provides a brief description of this process.
Wheat wet distillers grains (WWDG) contains approximately 20% dry matter, 36%
total dietary fiber and 26% crude protein. Thin stillage from ethanol fermentation of
durum wheat contains small particles of grain, yeast cells and other soluble nutrients
with very high nutritive potential. This stillage is composed of about 3% to 5% dry
matter (DM), which contains 42% to 43% crude protein (CP), 31% total dietary fiber,
5.6% fat and 5.3% ash (Lee et al. 1991). Studies by Davis et al. (1983) revealed that wet
brewers grains (WBG) contains 31% DM, 27% CP and 25% acid detergent fiber (ADF).
Early interest in thin stillage as a supplementary feed for cattle was based on the idea
that it contained stimulatory factors for fiber digestion. The stimulatory factor referred to
in this research may have included vitamins, proteins, amino acids, carbohydrates and
some lipids which are known to stimulate microbial activity (Hatch 1993a). This
assumption may be related to the high energy and protein content of thin stillage.
Addition of corn distillers dried grains with solubles (CDDGS) to cattle diets was
observed to enhance fiber digestion. Thin stillage has been found to contain superior
energy and protein content compared to the cereal grains from which it is produced.
These high nutrient values may provide additional energy to the bacteria for use in fiber
digestion above that supplied by a grain supplement. Recent research in this area has
focused on the rumen undegradable protein value of thin stillage rather than its effect on
fiber digestion.
4
Figure 1.2 Beer brewing process and byproducts feeds(Adapted from Ensminger et al. 1990)
5
Figure 1.2 Beer brewing process and byproducts feeds(Adapted from Ensminger et al. 1990)

6
Corn dry distillers grains with solubles has a rumen escape value of about 60%
compared to between 30 and 40% for soybean meal (SBM) (Aines et al. 1986). This
implies that ruminants supplemented with CDDGS will receive substantial rumen
undegradable protein (RUP), for lower gastrointestinal tract digestion compared to those
receiving soybean meal as a protein supplement.
The objective of the literature search was to review work on rumen microbial energy
and protein utilization of standard feed sources used in North America as supplements in
ruminant diets. The review covers research work on rumen microbial fermentation of
feed sources and the importance of RUP in the diets of high producing ruminants. An
attempt has been made to review work carried out on brewers grains and corn, as well as
wheat distillers by-products.

7
2.0 Review of literature
2.1 Energy and protein requirement systems for cattle
With an increasing world population there is an ever growing need to maximize food
production on limited land resources and maintain a high quality of life. This is only
possible if efficient production techniques are employed to meet the animals’ nutritional
requirements and produce high quality products required by the consumer. Efficient
animal performance requires adequate dietary energy and protein supply. Several
methods are available for estimation of the energy requirements of different classes of
cattle. These include total digestible nutrients (TDN), digestible energy (DE),
metabolizable energy (ME) and net energy (NE). Of these methods, NE is the most
accurate for the estimation of the energy requirements of ruminants (National Academy
of Science, National Research Council (NAS-NCR 1984)). The NE system is used to
estimate energy for maintenance and gain and accounts for the energy losses in the
process of energy utilization by the animal. Reviews (Huber and Kung, 1981; Chalupa
1974; Chalupa 1984; Clark 1974; Clark et al. 1992 and Oldham 1993) have reviewed in
depth the various aspects of protein metabolism in ruminants. The purpose of this review
is to briefly cover aspects of protein feeding to ruminants and specific areas which
should be focused on when formulating cattle rations. The review will emphasize
feeding ethanol by-products to feedlot and grazing cattle with particular focus on
distillers grains and thin stillage.
Several feeding systems have been used to predict the requirements of animals based
on biological information and feedstuffs available to the producer, scientist or ration

8
formulator. Of these systems, the most widely used is the NAS-NCR and the
Agricultural Research Council (ARC) for North America and the UK, respectively. In
the NAS-NCR system, NE requirement for a growing calf is estimated as NE for
maintenance and NE for growth (NAS-NCR 1984). The net energy for growth is
estimated as the amount of energy deposited as non-fat organic matter (mostly protein)
plus that deposited as fat (NAS-NCR 1984). The calorific value of fat is estimated as 9.4
kcal g"1, and that for nonfat organic matter has an average value of 5.6 kcal g’1 (NAS-
NCR 1984). The Cornell net carbohydrate and protein system (CNCPS) makes an
attempt to quantitatively estimate fermentation end products (the metabolizable energy
from volatile fatty acids, microbial protein and ammonia) and materials escaping rumen
degradation (carbohydrates, proteins and undegraded peptides). Rumen bacteria are
categorized into two groups according to the carbohydrate type they ferment (Russell et
al. 1992). The structural carbohydrate fermentors act only on the cell wall carbohydrates.
The non-structural carbohydrate fermentors act on starch, pectin, sugar and the other
non-cell wall carbohydrates.
The energy component of feedstuffs is divided into four fractions which are
considered of carbohydrate origin. Total carbohydrate is defined as 100- (CP + Fat +
Ash) with four fractions A, Bb B2 and C. The A fraction is composed of soluble sugars
that are very rapidly fermented (100% to 350% per hour) by the NSC bacteria. The B,
fraction is composed of starch and pectin and has an intermediate fermentation rate (5%
to 40% per hour). This fraction is also fermented by the NSC bacteria. This fraction is
estimated as 100 - CP - Fat - Ash - (NDF-NDICP). Where NDICP is the amount of CP

9
insoluble in neutral detergent solution. The B2 fraction includes the available cell wall
(part of the NDF) and is slowly fermented by the SC bacteria (5% to 10% per hour).
Lastly, the C fraction composed of the unavailable cell wall and consists mostly of
indigestible fiber (Sniffen et al. 1992).
When feeding cattle on low protein diets (5% of diet DM intake), 70% of the CP
intake will be composed of recycled nitrogen, mostly ammonia and urea. When the
dietary protein intake is high (20%), the contribution of recycled nitrogen decreases to
11% of the dietary CP intake (NAS-NCR 1985 and 1989). The CNCPS uses the NAS-
NCR (1984) equation for recycled nitrogen
Y= 121.7- 12.01X + 0.3235X2
where Y = the urea nitrogen recycled (percentage of nitrogen intake) and X = intake of
CP as a percentage of diet DM (Russell et al. 1992).
The rumen environment plays an important role in microbial fermentation. A faster
rate of protein degradation than carbohydrate fermentation results in large quantities of
nitrogen lost as ammonia. If the rate of carbohydrate fermentation exceeds protein
degradation then microbial protein growth decreases. Gut fill limits dry matter intake
with slowly degradable feedstuffs. Lastly, slow or high rumen outflow rate ( depending
on the feed particle size, saliva production rate and water intake) affects degradability
such that slow rumen turnover leads to more feed degradability and high rumen turnover
leads to less degradation (Russell et al. 1992).
The CNCPS divides the protein into five fractions; (A, Bb B2, B3, and C). The A
fraction is composed of NPN, soluble in trichloroacetic acid (TCA) and buffer solution.

10
The B group, or the true protein fraction, is further subdivided. The B, fraction is soluble
and rapidly degraded in the rumen. The A and B) fractions are fermented at rates of
120% to 250% per hour. The B2, fraction is the buffer insoluble protein minus cell wall
crude protein (B3) and is fermented at rate of 5% to 15% per hour. The B3 fraction is the
cell wall nitrogen which is insoluble in neutral detergent solution and has a very slow
rate of fermentation (less than 1% per hour). Lastly the C fraction is the unavailable
protein which cannot be fermented by rumen bacteria. It is the protein nitrogen
associated with the lignin, tannins and maillard products. Identification of the specific
energy and protein fractions and degradation rates, has made it possible to improve the
accuracy of the prediction of cattle requirements for these nutrients. When formulating
rations for feedlot cattle, it is important that careful attention be paid to meeting the
nutritional requirements so as to realize the expected levels of performance anticipated
by the producer.
2.1.1 Protein supplements in cattle rations
The feeding of protein supplements to ruminants is to satisfy the protein needs of
both the animal and the microbial population in the rumen (NAS-NCR 1984). There is
need for crude protein (nitrogen, amino acids and peptides) for bacterial fermentation
and post ruminal amino acids for animal tissues and production purposes (NAS-NCR
1984). At high protein intakes, efficiency of protein utilization is reduced because more
protein is available than the host can process for beneficial purposes (Broster 1972). Low
protein intakes result in high efficiencies of utilization because of salivary nitrogen
recycling to the rumen as urea and reduced urea losses through the kidneys as urine

11
(Botts et al. 1979). In the rumen, increased nutrient retention time, depressed intakes and
lowered capacity to digest organic matter results from very low protein intakes, most
likely due to curtailing of microbial fermentation (Egan 1980).
Feedlot cattle are expected to grow fast, hence their energy and protein supplements
reflect their requirements in terms of maintenance and production. When choosing the
protein supplement for these animals, two factors that need to be considered are the
quantity and quality of crude protein and its solubility or rumen degradability. Highly
soluble proteins tend to have poor rumen undegradable protein values (RUP) while those
with low solubility have higher RUP values. The quality of the protein is, however,
measured not only by the degree of degradability in the rumen but also by the
availability of the protein for absorption in the small intestines.
The nitrogen absorbed from the digestive tract has two metabolic fates. It is either
stored as tissue nitrogen or excreted as urinary nitrogen (Satter and Roffler 1974). It is
important to be able to predict the point at which ammonia produced in the rumen is
efficiently utilized for conversion to protein. Non-protein nitrogen (NPN) in excess of
12.5% crude protein, in diets of lactating dairy cattle is not converted into microbial•*»
protein and is excreted in the urine (Satter and Roffler 1974). Ammonia is the primary N
source for rumen bacteria utilizing structural carbohydrate while both peptides and
ammonia are needed by those utilizing non-structural carbohydrates (Chalupa 1972;
Russell et al. 1992).
Since the majority of the rumen bacteria can use ammonia as their nitrogen source, it
is an important determinant of microbial protein production (Byrant and Robinson

12
1962). For efficient synthesis of amino acids, and therefore microbial protein, ammonia
should be available in optimal concentrations. The rumen ammonia concentration of 5 to
8 mg N/100 ml rumen fluid has been suggested as the point at which there is equilibrium
between production and utilization of rumen ammonia (Satter and Slyter 1974).
Degradation of protein occurs via bacterial (usually cell surface) proteases and
peptidases. The highly degradable, soluble protein is rapidly absorbed into the bacterial
cell while the slowly degradable, insoluble portion is passed on down the digestive tract
(Nugent et al. 1981).
Rumen microbes produce a wide variety of enzymes including ureases which are
important microbial enzymes that degrade urea recycled to the rumen. Ammonia is
combined with feed carbohydrates during microbial growth to form amino acids. When
protein intake is low (5% CP in the ration DM) the recycled nitrogen, entering the rumen
may be as much as 70% of the nitrogen entering the rumen. Feeding of protein sources
susceptible to ruminal degradation increases microbial protein synthesis and microbial
nitrogen flow to the small intestines compared to protein feeds more resistant to rumen
degradation (McCarthy et al. 1989; Rook and Armstrong, 1989 and Cecava et al. 1990).•*>
The extent of degradation of feed and conversion to microbial matter depends on its
rumen degradability, energy available in the diet and retention time in the rumen (Storm
and 0rskov 1983). For a wide range of diets, 60% to 85% of the protein passing through
to the small intestine is of microbial origin (Smith 1979; ARC 1980). Protein recycling
is a dynamic process which contributes as a supplementary source to the dietary protein
source. The sources of endogenous proteins in the ruminant include salivary proteins,

13
sloughed mucosal cells, mucopolysaccharides and urea of blood plasma transferred to
the rumen (Leng and Nolan, 1984). These sources may account for a substantial quantity
of the nitrogen supply to the rumen bacteria.
2.1.2 Effect of N and carbohydrate source on microbial protein synthesis
For accurate formulation of a ration that will satisfy the protein requirement of the
animal, attention must also be paid to the requirements of the microorganisms and their
role in fermentation of the feed. Coleman (1980) suggested accounting for protozoal
predation of bacteria by lowering the theoretical maximum bacterial growth yield from
50% to 40% of the bacterial protein synthesized. In vitro studies indicate that efficiency
of microbial growth declines significantly when the rumen pH drops below 6.0 (Strobel
and Russell, 1986).
The microbial population in the rumen can broadly be divided into two categories
according to the carbohydrate they ferment. By understanding the fermentative needs of
rumen microbes, it is possible to make the most efficient use of available feed by
ensuring that they are provided in the appropriate quantities. There are microbes that
ferment non-structural carbohydrates (NSC) and those that ferment structural
carbohydrates (SC). The division reflects nitrogen utilization and growth efficiency, as
well as the partition of energy source and utilization (Russell et al. 1992).
Storm et al. 1983a reviewed research carried out by several scientists to determine
the nutritive value of rumen microorganisms in the ruminant (Table 2.1).

Table 2.1 True nitrogen digestibility, biological value and net utilization of mixed rumen microorganisms.
Source Method used TND (%)z BV (%)y NNU (%)x
Harris & Mitchell (1941) Sheep given purified diets with urea as main 89 62 55Jonson et al. (1944) nitrogen source. 55 66 36McNaught et al. (1950) } Rats given purified diets with isolated MRM 73 88 64McNaught et al. (1954) } Rats given purified diets with isolated MRM 74 81 60Bergen et al. (1968) } as the main source of protein 75 85 64Storm et al. (1983)a Intragastric infusion of MRM in eight sheep 81 67 54
(Adapted from Storm et al. 1983).ZTND = true nitrogen digestibility.} BV = biological value.x NNU = net nitrogen utilization MRM = mixed rumen microorganisms.
t

15
In contrast to plant proteins, the amino acid composition of microbial protein is
constant under a variety of nutritional regimens (Bergen et al. 1967; Bergen et al. 1968
and Syvaoja and Kreula 1979).
Feeding of protein sources susceptible to ruminal degradation increases microbial
protein synthesis and/or microbial nitrogen flow to the small intestine compared to
proteins resistant to ruminal degradation (McCarthy et al. 1989; Rook and Armstrong
1989 and Cecava et al. 1990). However, protein sources with greater resistance to
ruminal degradation have higher non-ammonia non-microbial nitrogen flow to the
duodenum when compared to those with highly degradable protein sources (Stokes et al.
1991). This is important for ruminant animals since in some production situations, they
may need rumen undegradable protein to supply limiting amino acids lacking in the
microbial sources. Endogenous protein results from sloughing of intestinal tissues. The
digestion of endogenous protein and its impact on ruminant nutrition is difficult to
ascertain and is usually discounted during ration formulation (Huber and Kung 1981).
Considering that endogenous protein is part of the urea recycled via saliva, it should be
noted that this protein source partially meets the microbial nitrogen requirement thereby
helping meet the animal’s amino acid requirements (Leng and Nolan 1984).
2.1.3 Importance of dietary rumen undegradable protein (RUP) and effect of processing on protein utilization.
Most soluble proteins and non-protein nitrogen are very rapidly degraded in the
rumen. Insoluble plant proteins are generally resistant to breakdown and contain slowly
degradable protein (prolamines and glutelins) (Van Soest 1982). Dietary protein that

16
escapes rumen degradation and reaches the duodenum is important to the ruminant
animal, however, it is a smaller fraction compared to the microbial fraction. The
importance of this fraction is due to its complementary effect to the microbial protein in
meeting the limiting amino acid needs of the animal (Clark et al. 1992).
Ruminants, as well as non-ruminants, need preformed essential amino acids at
the tissue level. Ruminants obtain their amino acid supply from microbial protein
synthesized by rumen microbes and dietary RUP. The emphasis on RUP content of
dietary protein is both on the proportion escaping rumen microbial digestion and the
amino acid profile reaching the tissue level (Mantysaari et al. 1989). If the amino acid
profile of the absorbed protein does not meet the needs of the animal, both the
productivity and protein efficiency will decrease with adverse economic results
(Mantysaari et al. 1989). Cattle grazing winter pastures and supplemented with escape
protein have an improved forage intake, abomasal protein flow to the hindgut and more
protein digestibility, thereby reducing protein deficiency without affecting fiber
digestibility (Donaldson et al. 1991). Diets containing slowly degradable protein
generally supply more amino acids to the intestines than diets containing more
degradable protein from sources such as soybean meal (SBM) (Santos et al. 1§84).
Normal procedures in the manufacture of feed ingredients can influence the magnitude
of protein degradation in the rumen. Certain grain processing procedures can either
increase or decrease ruminal degradation of proteins. Disruption of the protein matrix
may result in increased degradation while heat generated or applied during processing
can decrease ruminal degradation (Hale 1973). Methods for estimation of energy and

17
protein degradability in the rumen can be broadly categorized as in vitro and in vivo
techniques. The nylon bag technique is the best way to mimic rumen utilization with a
given feeding regime except for the lack of mastication, rumination and passage which
would make it the total ruminal experience. With this procedure non-digestible bags
containing a feedstuff are placed in the rumen of a fistulated animal for various time
intervals and the amount of nitrogen removed over time is measured (Nocek 1988). An
extensive review by Michalet-Doreau and Ould-Bah (1992) has been published. These
authors emphasized the use of the nylon bag technique, the most common non
commercial (not routinely used in industry) method, for estimating the rumen
degradability of proteins. Despite its non-commercial application the nylon bag
technique is a necessary method for generating databases for use in developing in vitro
prediction equations (Roe and Sniffen 1990). Factors such as initial lag time required for
solubilization, microbial attachment, variations in microbial populations and supply of
enzymes affect rates at which proteins are broken down. The rate at which a pure feed
protein is digested in the rumen when enzyme supply is not limiting, depends on the
quantity of the protein and its properties which determine the degradation rate constant
(Van Soest 1982).
2.1.4 Relationship of acid detergent insoluble nitrogen to protein solubility
Heat damage has detrimental effects to protein quality and has been associated with
an increase in acid detergent insoluble nitrogen (ADIN). Acid detergent insoluble
nitrogen has been associated with the insolubility of protein by several researchers (Van
Soest 1965; Goering 1972; Yu and Thomas 1976). These workers suggested that

18
increasing ADIN level in forage proteins directly decreases nitrogen digestibility. ADIN
has also been used as a measure of heat damage in non-forage plant proteins sources
(Van Soest and Sniffen 1984). In a recent research article, Nakamura et al. (1994) has
proposed that ADIN is partially digestible and therefore not a true measure of protein
indigestibility in non-roughage proteins. It may therefore be concluded from the results
of this research that ADIN can not reliably be used as an indicator of protein digestibility
for heat damaged proteins. Further research may be necessary before the controversy
surrounding ADIN is resolved.
The process of maximizing the utilization of rumen escape protein is reflected in
improved animal responses where protected protein or amino acids are introduced into
the lower gastro-intestinal tract. The improvement results from a combination of two
effects. The greater quantity of essential amino acids and the higher true digestibility of
feed quality proteins as compared with the crude protein in rumen organisms (Van Soest
1982).
2.2 Sources of protein for ruminants
Ruminal bacteria use various sources of nitrogen (primarily ammonia, amino acids and
peptides), energy (derived from fermentation) and minerals for growth. Any of these
factors can limit bacterial digestion of organic matter in the rumen consequently
reducing feed intake. The amount of protein that escapes degradation may vary
considerably, with most management and feeding conditions in the dairy and feedlot
industry, an escape rate of 40% for dietary protein probably represents an acceptable
average. The remaining 60% is almost entirely degraded to ammonia and peptides

19
(Satter and Roffler, 1974). Van Soest (1982) has classified protein sources according to
their solubility, binding to ADF fraction, and the insoluble but available portion (Table
2.2). This classification is important when choosing the protein supplement for a given
class of ruminant, since it provides the approximate portion that will finally get to the
abomasum for absorption and utilization by the animal. The ultimate decision
concerning the choice of the protein supplement, must consider the benefits to the
animal, cost and the acceptability of the product.
2.3.1 Soybean meal
Soybean meal has been used extensively as a protein supplement in cattle rations for
the past several decades with satisfactory results. It is evident from nutritional reports
that SBM is a moderately rumen degradable protein. Some of the original amino acids
reach the duodenum for absorption (Santos et al. 1984). Treatment of dietary proteins
with various agents to decrease ruminal degradation has received considerable attention.
The main reason for this is to increase the outflow and balance of amino acids to the
duodenum by protection of the protein from microbial fermentation in the rumen
(Windshitl and Stern 1988). The effect of heat during oil extraction and toasting to•*»
destroy trypsin inhibitory activity reduces the high degradability of soybean protein
allowing more bypass to reach the small intestines. Diet supplements containing low
rumen degradable protein such as corn gluten meal, wet brewers grains and corn dry
distillers grains will generally supply more amino acids to the intestines than SBM for
every 100 g of crude protein ingested (Santos et al. 1984).

20
Table 2.2 Soluble and degradable protein fractions in various fecdstuffs.
Types of feed%Crude protein
(DM basis) Soluble
% of Crude ]
z ADFIPy
proteinPotentiallydegradable"
Solubility
H ighCorn germ meal 29.4 63 2.8 35Corn bran 29.4 63 2.8 35Corn gluten feed 22.2 55 2.6 50Wheat middlings 18.4 37 2.3 61
M ediumOats 12.9 31 4.8 64Soybean meal 52.3 24 1.8 75DDGS* 29.1 19 15.3 65
LowCotton seed meal 44.3 12 3.1 85Corn 9.6 15 5.0 80Dry brewers grains 28.9 6 13.2 81Dry distillers grains 26.7 6 18.8 76Corn gluten meal 66.2 4 10 85
(Adapted from Van Soest 1982)z Fraction a , the rapidly soluble protein fraction (0rskov and McDonald, 1979). y The protein fraction bound to acid detergent fiber.w Fraction b, the potentially degradable protein fraction (0rskov and McDonald, 1979). x Dry distillers grains with solubles.

21
Soybean meal protein without further treatment has a rumen escape value of 50% for
high producing dairy cattle at a rumen outflow rate of 8% h"1 (0rskov 1992). The
treatment of SBM with xylose or calcium lignosulfonate is effective in reducing ruminal
protein degradation without severely restricting small intestinal availability of the SBM
protein (Windschitl and Stern 1988). Using the procedure for controlled non-enzymatic
browning by heating SBM in the presence of reducing sugars, Cleale et al. (1987a),
showed xylose to be the most effective sugar in reducing the degradation of SBM by
rumen microbes. The addition of xylose at 3 moles mole'1 of lysine in soybean meal
increased the rumen undegradability of soybean meal protein from 13.1% to 33.7%
(Cleale et al. 1987b). The implication of this at the high rate of rumen outflow of 8% per
hour is that the xylose treated SBM has a potential undegradability or escape value of
67%.
2.3.2 Canola products for cattle
Canola meal is widely used as a protein supplement (37% CP in DM) in ruminant
rations. However, its crude protein fraction is readily digested by rumen microorganisms
and thus canola is relatively a poor source of rumen undegradable protein (Deacon et al.•*»
1988, Khorasani et al. 1989). Canola is more rapidly degraded in the rumen than many
other supplements hence treatment of canola meal to increase its rumen undegradable
fraction may be desirable (Kennedy and de Boer 1986). Untreated whole canola seed has
an effective CP degradability of 83.5%. Application of dry heat for a short period (Jet-
sploding at 315°C) has successfully decreased this rate to 43.2% (Deacon et al 1988).
Kennedy et al. (1993) reported jet-sploding canola seed at 150°C for short periods of

22
time and inclusion in the dairy cattle diet at 4.5% of the dietary dry matter is the most
beneficial combination to the animal. This product due to its high fat content can only be
used at 5% of the dietary dry matter without adversely affecting dry matter intake
(Khorasani et al. 1991). A combination of formaldehyde treatment and encapsulation
with oil from canola seed reduces the effective degradability of canola meal to 36% from
58% (Deacon et al. 1988). The detrimental effect of the treated canola products is due to
its high oil content. The antibacterial action of polyunsaturated fatty acids has been
shown to inhibit cellulolytic bacteria (Palmquist 1988). Acetic acid treated canola meal
increases RUP of canola meal without necessarily increasing milk yield or total protein
supply to the duodenum due to lower microbial protein production (Kennedy and
Khorasani 1993). McKinnon et al. (1991) have reported higher levels of RUP when
moderate heat (125-145°C) was applied for short periods of time (10-30 minutes). The
study concluded that moderate heating of canola meal for short periods increased the
ruminally undegradable protein fraction, however, the intestinal utilization of the
undegraded protein required further investigation.
2.3.3 Ethanol distillation by-products for cattle
During the process of producing alcohol from grains, two by-products, distillers
grains and thin stillage are generated. In this process high energy feedstuffs are
converted to high protein by-products. The protein concentrations in the dry matter of
corn distillers grains and thin stillage are almost equal and almost three times that in
com grain (Larson et al. 1982a). Characteristics of the nutrient composition in the two
products are quite different due to the variations in processing and stage of harvest

23
(Aines et al. 1986). During the fermentation of cereal grains by yeast to produce the
alcohol, the remaining material is referred to as whole stillage (usually 90% water). It is
screened or centrifuged to produce thin stillage and distillers grains. Thin stillage (often
called distillers solubles) contains yeast cells, soluble nutrients and small corn (wheat)
particles. The distillers grains contain unfermented com residues, including protein, and
a large fraction of digestible fiber and fat (Aines et al. 1986).
2.3.3.1 The nutritive value of distillers grains
Distillers grains combined with NPN sources have been found to be an excellent
protein supplement for growing ruminants (Waller et al. 1980) due to their low rumen
degradable protein. The drying of corn distillers grains for use as a protein supplement in
ruminant rations has been promoted by transportation costs, poor shelf life and storage
characteristics and the bulkiness of the wet distillers grains. However, drying wet corn
distillers solubles or wet grains is expensive and may account for over 40% of the energy
cost incurred by the alcohol plant (Ham et al. 1994). The nutritional value of dry corn
distillers grains has been debated and the increasing fuel costs may make the wet com
distillers grains a more attractive and economical feed (Ham et al. 1994). No difference
has been observed between the rumen degradability of CWDG and CDDG (Abrams et
al. 1983). Corn wet distillers grains has a greater value as a protein supplement when fed
to growing lambs on high forage diets and gaining 53 to 114 g d '1 or for steers gaining
420 to 600 g d’1 relative to soybean meal (Abrams et al. 1983). Corn distillers wet grains
due to its high moisture content tends to spoil soon after the distillation process.
Attempts have been made to preserve and extend their shelf life. One of the attempts to

24
preserve CWDG has been through ensiling. However, Abrams et al. (1983) reported
increases in the soluble nitrogen content, lowering its value as a source of RUP.
The performance of cattle fed high roughage rations supplemented with CDDG has
been reported to be superior to those fed dry com gluten feed (DCGF). This was
explained by greater duodenal particulate nitrogen flow, lower NH3-N flow and greater
non-ammonia, non-bacterial nitrogen and total nitrogen flow to the duodenum (Firkins et
al. 1986). This study showed that nitrogen of CDDG escaped ruminal fermentation to a
greater extend than did nitrogen in DCGF (Firkins et al. 1986). This shows that there is a
decreased flow of nitrogen to the duodenum in steers fed DCGF relative to those fed
CDDG. Growing calves fed a combination of milo, dry distillers grains and urea have
been reported to be 50% more efficient in protein utilization than calves fed soybean
meal (Waller et. al. 1980). Corn distillers grains has been found to be more resistant to
microbial degradation than SBM and casein (Little et al. 1968). The limitation to the
amount of DDG from most of the cereal grains used for ethanol production that may be
incorporated into ruminant diets is the low lysine content of the byproduct (Santos et al.
1984; Boila and Ingalls 1994).
2.3.3.2 Distillers grains as an energy source
Despite the high energy value of CDDG, the economic value of feeding the
byproduct as a protein supplement is twice that as feeding it as an energy source (Aines
et al. 1986). The energy value of CDDG is equal or slightly superior to corn because it
contains highly digestible fiber and three times as much fat (Aines, et al. 1986).

25
Farlin (1981) reported increased feed intake, and feed efficiency when he included
CWDG at 43% of the ration, as an energy source, replacing corn. Risk et al. (1982) using
CWDG to replace all the corn in the diet reported reduced daily gains and DM intake,
however, feed efficiency increased with higher levels of CWDG. Improved daily gains
of cattle were reported by Firkins et al. (1985) when CWDG was included at 50% of the
ration and attributed the improvement to higher digestible energy value for CWDG than
suggested in NAS-NCR (1976) or that the absence of starch in CWDG may have
resulted in higher rumen pH relative to the control ration and consequently fiber
digestion may have improved. These studies suggest that feeding CWDG as a substitute
for grain in finishing cattle rations at replacement level up to 50% of the ration does not
result to decreased animal performance and suggest better performance. Wet corn
distillers grains fed to finishing cattle replacing 21% corn in the ration, resulted in
similar daily weight gains, feed intakes and feed conversion ratios as the control group
fed dry rolled corn (85% corn, 10% hay and 5% supplement). Increasing the level of
WCDG to 41% increases daily weight gains while feed intake is unaffected but feed
conversion ratio is increased by 10% (Aines et al. 1986). Further increases in the level of
WCDG up to 75% of the ration do not elicit any beneficial performance results (Table
2.3).
Cattle fed wet distillers by-products gained faster (P<0.05) and more efficiently
(P<0.10) than cattle fed dry rolled corn (Ham et al. 1994). Compared to corn, wet
distillers by-products contain 45.8% more energy while dry by-products contain 24%
more energy. Therefore wet distillers by-products are superior energy sources compared

26
to CDDGS and are both superior to dry rolled corn for finishing cattle. The steers fed
thin stillage had lower (P<0.10) ruminal pH (5.5) compared to the other diets (6.1). The
total volatile fatty acid concentration was similar across the diets but the propionate
concentration tended to be higher (P<0.10) for thin stillage steers resulting in a reduced
acetate to propionate ratio. The infusion of thin stillage into the rumen through the
rumen canula of the fistulated steers may have increased particulate passage rates which
combined with lower ruminal pH may have resulted in suboptimal conditions for the
survival of acetate producing bacteria. This condition may be responsible for reduced
acetate to propionate ratio. The increased propionate would improve energy utilization
and would help explain the improvement in feed efficiency from wet distillers by
products (WDB) observed in the finishing trial (Ham et al. 1994) (Table 2.4; 2.5).
Ham et al. (1994) based on the nutritive value of corn distillers byproduct suggested
that:
1. There were no differences in performance for calves fed wet or dry distillers grains.
2. No matter what level of ADIN (low medium or high) in CDDG the performance of
steers was not affected when CDDG was fed as an energy source.
3. Calves fed both CWDG and CDDG as an energy source gained faster and more
efficiently than calves fed dry rolled corn.
4. Despite similar gains, calves on fed CWDG were more efficient than those fed
CDDG, since they consumed less feed. It may therefore be safe to conclude from these
results of this study that:

27
Tabic 2.3 The energy values of distillers grains for beef cattle.
Reference Level in ration (% of DM) Energy value (% of corn)
Rouse and Trenkle (1980) 15 116Farlin (1981) 25 100Farlin (1981) 50 124Farlin (1981) 75 115Hankc and Lindor (1982) 14.6 94Risk et al. (1982) 10.5 83Risk et al. (1982) 24.9 122Risk et al. (1982) 43.6 110Firkins et al. (1985) 25 103Firkins et al. (1985) 50 122
(Adapted from Aines et al. 1986)

Table 2.4 Performance of calves fed corn distillers by-products supplements.
Supplemental protein7ADG
(kg d 'V PEX (% )RUP w (%) ADIN CPU
Urea 0.45WDG + TS 0.66 2.6 54.9 -
C D D G Slow ADIN 0.67 2.0 38.0 9.7medium ADIN 0.67 1.8 47.4 17.5high ADIN 0.70 2.5 49.4 28.8
(Adapted from Ham et al. 1994).z CDDGS = corn distillers dry grains with solubles, WDG = wet distillers grains and TS = thin stillage, dry matter intake averaged 2.3% (DM) of body weight. y Average daily gain averaged across levels of supplemental protein.
protein efficiency calculated as gain above urea controls divided by protein intake above urea controls (slope of regression lines).w Rumen undegradable protein estimates after 12 hours of nylon bag incubation, values given as percentage of crude protein.u acid detergent insoluble nitrogen used as a measure of the effect of heat damage its effect on digestibility.

Table 2.5 Effect of corn distillers by-products on performance of finishing cattle.
Item Control WDBADINLow
DDGSZADIN
MediumADINHigh
Daily gain (kg d ') 1.5b 1.7C 1.7C 1.7C 1.7C
DMI (kg d ') 10.9dc 10.7d 11.5ef 11.3ef 11.7f
Feed/gain 7.5d 6.4e 6.9f 6.7 f 6.9f
(Adapted from Ham et al 1994).WDB = wet distillers by-products (40% of ration dry matter).ADIN = acid detergent insoluble nitrogen.DMI = dry matter intake.z distillers grains with solubles (40% of the ration DM).h, c, d, e, t means wjthin a row with unlike superscripts differ (p < 0.05).

30
- Acid detergent insoluble nitrogen is a poor indicator of protein availability or
utilization in distillers by-products.
- Drying does not affect protein efficiency but reduces net energy for gain.
- The increased propionate ratio in the thin stillage fed cattle would help explain the
observed improvement in feed efficiency from the wet distillers by-products (WDB)
during the finishing trial. This improvement in performance may be linked to an
increased rate of passage which coupled with lower ruminal pH result in suboptimal
conditions for the survival of acetate producing bacteria. This may the possible
explanation of the reduction of the acetate to propionate ratio (Table 2.6).
2.3.3.3 The nutritive value of distillers grains as a source RUP
Faster rumen disappearance of dry matter (DM) and nitrogen (N) has been observed
for wet and dry corn gluten feed compared to wet and dry corn distillers grains.
Consequently, both wet and dry corn distillers grains register higher rumen undegradable
protein values than wet and dry corn gluten feeds (Firkins et al. 1985).
Improvement in performance of steers fed wet corn distillers grains, as a replacement for
up to 50% of dry or wet corn gluten feed of the ration, suggests that wet corn distijlers
grains is not only an important protein but also energy source for growing and finishing
steers (Firkins et al. 1984). Wet and dry corn distillers grains, dry distillers grains with
solubles and wet corn stillage supplements in high forage diets increases dry matter
intake, apparent total tract digestibility, and crude protein digestibility (Muntifering et al.
1985). Dry matter, nitrogen and amino acids are less degraded for dry distillers grains

31
Table 2.6 Effect of corn by-products on ruminal pH and VFA concentrations.
2Treatments
Item DRC WDG TS HOM DCGF WCGF
Ruminal pH 6.1b 5.9b 5.7C 6.1b 6.1b 6.1b
Total VFA (mM/L) 112.7 111.6 115.0 112.2 111.2 108.5
Acetate (mM/L) 59.0 59.5 49.3 59.6 56.6 56.9
Propionate (mM/L) 32.4b 26.5b 45.4C 31.1b 29.7b 29.8b
Acetate: Propionate L9b 2.4b 1.2° 2.1b 2.1b 1.9b
(Adapted from Ham et al. 1994).
7 DRC = dry rolled corn, WDG = wet distillers grains.TS = thin stillage, HOM = hominy feed, DCGF = dry corn gluten feed and WCGF = wet corn gluten feed.’c Means within a row with unlike superscripts differ (p < 0.05 ).
32
than canola when effective degradability is measured. Rumen undegradable protein
values of 44-53% for dry distillers grains have been reported (Hatch, 1993b). Ingalls (in
Hatch, 1993b) reported, that when evaluating wheat dry distillers grains and canola
meal, the major difference occurred in the rumen where degradability of nitrogen and
amino acids was 50% higher for canola meal than for wheat dry distillers grains. In the
same study, the order of limiting amino acids for dry distillers grains was identified as
lysine, isoleucine, tyrosine, valine and threonine, whereas for canola meal the five most
limiting amino acids were isoleucine, tyrosine, lysine, valine and leucine. Several
workers have compared the protein value of distillers dried grains with or without
solubles with soybean meal (Table 2.7). All these workers reported higher value of
distillers grains relative to SBM (Table 2.7). Higher acid detergent fiber in wheat based
dry distillers grains is responsible for a smaller soluble fraction and a larger potentially
degradable fraction. The slower rate of degradation of this fraction results in a smaller
effective degradability of DM and CP at each of the rumen outflow rates of 2%, 5% and
8% (Boila and Ingalls 1994) (Table 2.8).
2.3.3.4 Thin stillage as a potential supplement for ruminants•*»
Thin stillage, a byproduct of ethanol production from grains, is obtained from the
separation of whole stillage by screening pressing or centrifugation. The ethanol
distillation process solubilizes over one half of the mineral content of the original grains,
with most of this being found in thin stillage (Larson et al. 1982a). Thin stillage contains
about 4.5% dry matter of which 40% is crude protein (Lee et al. 1991).
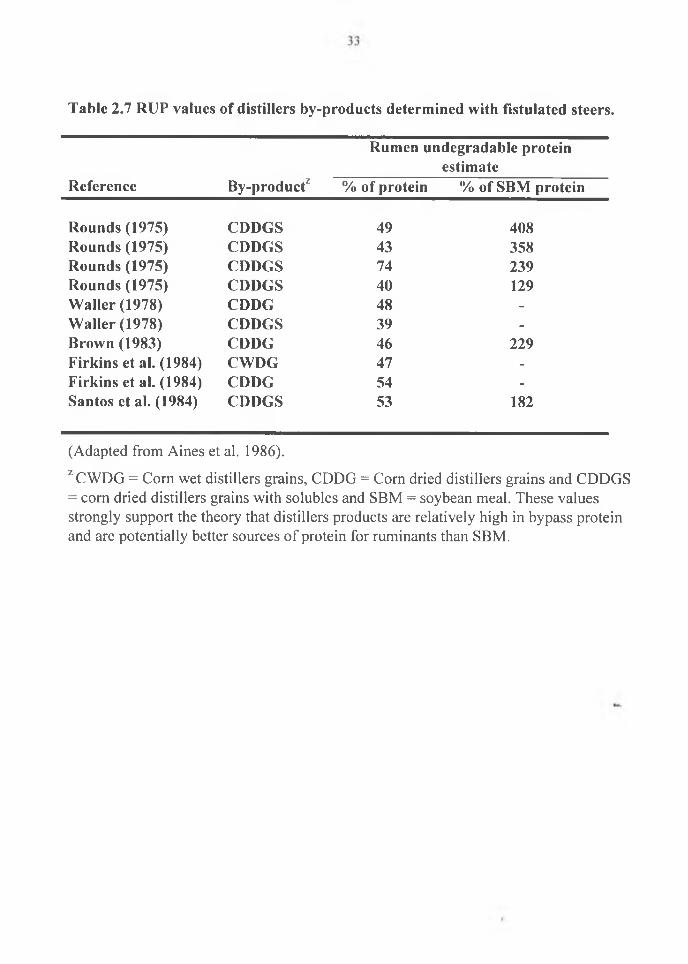
Table 2.7 RUP values of distillers by-products determined with fistulatcd steers.
Reference By-productz
Rumen undegradable protein estimate
% of protein % of SBM protein
Rounds (1975) CDDGS 49 408Rounds (1975) CDDGS 43 358Rounds (1975) CDDGS 74 239Rounds (1975) CDDGS 40 129Waller (1978) CDDG 48 -
Waller (1978) CDDGS 39 -
Brown (1983) CDDG 46 229Firkins et al. (1984) CWDG 47 -
Firkins et al. (1984) CDDG 54 -
Santos et al. (1984) CDDGS 53 182
(Adapted from Aines et al. 1986).
ZCWDG = Corn wet distillers grains, CDDG = Corn dried distillers grains and CDDGS = corn dried distillers grains with solubles and SBM = soybean meal. These values strongly support the theory that distillers products are relatively high in bypass protein and are potentially better sources of protein for ruminants than SBM.

34
Table 2.8 Disappearance and the effective degradability for dry matter and nitrogen in wheat-based distillers dried grains.
Disappearance parameters7 Effective degradability*
Item «(% ) b (%) c %(10'3 h 1) ( / ( h 1) 2 (%) 5 (%) 8 (%)
D D G X
Dry matter 28.5 53.2 36.7 0.10 63.5 51.3 45.3Nitrogen 22.6 75.1 25.5 0.28 66.2 48.8 41.0
A m in o acids
Lysine 21.8 60.6 38.6 0.00 62.3 48.6 41.7Threonine 22.1 76.6 23.2 0.12 64.9 47.3 39.6Phenylalanine 18.7 80.0 25.9 0.10 65.6 47.2 38.9Tyrosine 24.8 73.1 27.3 0.07 68.3 51.3 43.6Leucine 14.1 84.6 22.7 0.67 61.0 41.5 33.0Valine 17.2 81.5 21.8 1.03 61.5 42.5 34.4Isoleucine 16.5 82.2 20.8 0.79 60.2 41.4 33.5Arginine 17.3 78.6 27.6 0.21 64.6 46.4 38.1Histidine 16.5 81.8 26.5 0.07 64.7 45.9 37.5Aspartate 16.8 79.1 23.1 0.27 61.0 42.8 34.9Glutamate 22.0 76.7 29.2 0.18 69.0 51.2 42.9Serine 21.2 77.6 25.1 0.10 66.0 48.1 40.0Glycine 23.4 65.0 36.9 0.00 66.3 51.5 44.1Alanine 20.8 77.1 21.9 0.25 62.8 45.1 37.5Proline 30.8 68.0 29.7 0.10 72.3 56.4 49.0Methionine -10.1 107.1 21.4 0.93 48.3 24.1 13.8Cystine -1.1 99.6 20.8 0.57 52.8 30.4 20.9
(Adapted from Boila and Ingalls 1994).z The disappearance parameters: a = soluble fraction; b = potentially degradable fraction; c = rate of degradation; d = lag time.y Effective degradability (ED) estimated at rumen particulate outflow rates of 8%, 5% and 2% per hour. x DDG = distillers dried grains.

35
Early research interest in thin stillage was based on the idea that when it was consumed
by cattle it stimulated fiber digestion (Little et al. 1964; Little et al. 1970; and Chen et al.
1977). Beeson (1975) reviewed studies which indicated that the addition of dry distillers
grains (DDG) or thin stillage at relatively low levels (0.5% of ration DM) to high urea
liquid supplements increased nitrogen retention in ruminants.
Recent attention to thin stillage has focused on its use as a protein source for
ruminants with particular interest in its RUP value (Aines et al. 1986). Growing calves
and lactating dairy cows have high protein requirements and often benefit from RUP for
high performance (Aines et al. 1986). Thin stillage offered to calves on pasture can
potentially serve as an important source of nutrients. Various reports indicate that cattle
fed high forage diets and supplemented with protein increase feed intake (Delcurtoo et
al. 1990). Considering the high protein content of thin stillage and little research data on
the product, there is a need to further study the effects of feeding this material to
growing cattle.
2.3.4 Brewers grains as supplements for cattle
Wet brewers grains (WBG) are a byproduct from the beer brewing industry in which
barley malt is fermented to produce beer. Wet brewers grains are by-products to the
breweries and can be important sources of nutrients for livestock. The importance of
WBG as a supplement for cattle, particularly growing cattle, may be attributed to its
protein content and low rumen solubility. These factors make WBG a better choice
under some circumstances over other soluble or highly rumen degradable products such
as soybean and canola meals. Brewers grains is suitable as a protdin supplement for high
U N IV E R S IT Y O F N A IR O B I L IB R A R Y

36
producing ruminants such as dairy cows. Analysis of dried brewers grains indicates that
its dietary undegraded crude protein (42%) is equivalent to corn gluten meal (41%) but
with a superior amino acid balance than either soybean meal (SBM) (36%) or CGM
(Cozzi and Polan 1994). The favorable production response for cattle fed dried brewers
grains compared to those fed SBM or a combination of SBM and either DBG or CGM
can be explained by a more favorably balanced amino acid profile in the ruminally
undegraded protein than in the other diets (Cozzi and Polan 1994). Brewers grains (BG)
and corn gluten meal (CGM) are about 6 times higher in rumen undegradable protein
(RUP) than SBM. The high RUP of CGM is attributed to its gelatinous nature and lack
of surface exposure in the nylon bags (Stern and Satter 1982) while the RUP of BG may
be related to the alteration of the protein matrix due to heat during the brewing process.
Higher performances of cattle fed DBG as a partial replacement of SBM may be
attributed to the contribution of the RUP and energy that meets the amino acid needs that
are limiting or co-limiting to higher animal performance (Cozzi and Polan 1994). WBG
may be more digestible than the equivalent dry brewers grains (Porter and Conrad 1975).
Murdock et al. (1981) has suggested that WBG can be utilized as a protein supplement
and supply crude protein equivalent to SBM in lactating dairy cattle for milk production.
Grenawalt et al. (1981) reported satisfactory milk production from cows fed rations
containing 20% dry matter as WBG, however, milk production was depressed when
WBG was increased to between 30% and 40%. The reason for the observed depression
in dry matter intake may have been the high moisture content which because of rumen
fdl may be a limiting factor in dry matter intake. Dry brewer grains (DBG) have been

37
reported to supply similar duodenal microbial nitrogen flow when fed at 13% of the
ration dry matter as soybean meal fed at 16% of the ration dry matter (Armentano et al.
1986). The resistance of DBG protein to ruminal degradation is optimized when used in
combination with NPN or more degradable protein sources (Polan 1988).
2.5 Summary of literature review.
Distillers grains with and without solubles as ration ingredients have been used in
ruminant diets for a long time. Most of the information available on distillers by
products has been investigated using corn distillers products. However, there is less
information on the value and feeding potential for wheat distillers by-products.
Information available on wheat distillers by-products is limited to the dry product with
little or no information on the wet products (wet distillers grains and thin stillage).
In western Canada the major cereal cash crops include wheat, barley and oats. The
ethanol industry in western Canada should therefore focus on utilizing the locally
available wheat or barley by-products. The by-products from the ethanol industry
including wet or dried distillers grains and thin stillage or dried thin stillage from wheat
should be used to supplement high producing cattle where such supplementation is
economical. Based on the literature one can conclude:
1. Corn dried distillers grains (CDDG) can be used to supplement growing cattle as a
source of protein replacing 40% of the protein supplement.
2. Corn dry distillers grains has also been successfully utilized as an energy source
replacing up to 40% of grain corn in the ration. Similarly wheat dry distillers grains has
also been used as an energy supplement for growing ruminants. .

38
3. There is little difference in the nutritive value of corn wet distillers grains (CWDG)
and CDDG when fed to ruminants as protein supplements. However, the feeding of
CWDG is more economical since it eliminates the drying process. The limitation to
using CWDG is the short shelf life due to mold growth within 5 to 6 days.
4. Brewers grains is another good quality, high rumen bypass protein but is limited by
location of the producer relative to the brewery and producers do not have equal access
to the available sources of the grains.
5. There is need to evaluate wheat wet distillers by-products from production of ethanol.
However, in light of the lack of research on wet distillers by-products from wheat based
fermentation for ethanol production, the objectives of this thesis were:
1. To evaluate the performance and carcass quality of cattle fed diets containing wet
distillers grains from wheat based ethanol production and to contrast this performance to
that obtained from diets based on wet brewers grains or standard feed ingredients
common to western Canada, during the growing and finishing periods.
2. To examine the rate and extent of dry matter and protein digestion in the rumen from
wet distillers grains, from wheat based fermentation, and to compare it to wet brewers•*»
grains, a commonly used protein supplement.
3. To investigate the chemical composition of thin stillage from wheat based ethanol
production and its nutritive value for growing cattle grazing crested wheatgrass pastures.

39
3.0. Evaluation of wet brewers and distillers grains as a feed source for fcedlot cattle.
3.1 Introduction
Optimum performance from any livestock enterprise depends to a large extent on
how well the nutrient requirements are met. The two most crucial requirements are for
protein and energy. Growing and finishing feedlot cattle require balanced diets in order
to reach their full production potential. When producers are formulating diets for cattle,
they should exercise care that the supply of nutrients meets the needs for the desired
level of production. The most widely used system of nutrient estimation in North
America, is the National Academy of Science-National Research Council (NAS-NCR
1984). This system allocates costs to every activity that the animal is engaged in and
attempts to account for metabolic nutrient losses. The estimated energy and protein
requirements for growing and finishing feedlot cattle are based on factors such as stage
of growth, body frame size, level of production, age of the cattle, types and sources of
the nutrients and period in which the end product is expected to be ready (NAS-NCR
1984). The protein requirement for growing and finishing cattle includes not only tissue
growth but also rumen microbial growth. Since the rumen microbes contribute to the
amino acid supply of cattle, it is important to take their requirements into account when
formulating diets (NAS-NCR 1984).
Protein supplements for feedlot cattle in North America include soybean and canola
meals. Canola meal is more widely used in western Canada than soybean meal because it
is more readily available (Deacon et al. 1988; Khorasani et al. 1989). Other protein
sources that are now available on the market include distillers grains with or without

40
solubles from cereal grain ethanol production. The supply of these supplements has
increased due to the recent focus on the use of energy sources that do not contain lead
and produce less ozone layer depleting gases than those produced by the fossil fuels
(Distillers Feed Research Council 1982).
Ethanol production in western Canada is from wheat rather than corn as in the
United States. Wheat dried distillers grains (DDG) has been evaluated as a source of
rumen undegradable (RUP) protein due to its low protein degradability (Boila and
Ingalls 1994). This makes it an attractive alternate to other more widely used protein
supplements such as canola or soybean meal (SBM). The cost of drying wet distillers
grains with or without solubles is, however, prohibitive and ultimately uses for the wet
by-products could decrease the cost of protein supplementation. Wet distillers grains
(WDG) from corn-based fermentation has been shown to be an excellent protein source
for feedlot cattle (Aines et al. 1986; Ham et al. 1994; Firkins et al. 1984). Similarly,
work with wet brewers grains (WBG) has shown it to be an excellent protein source that
may be used in growing and finishing feedlot cattle diets (Porter and Conrad 1975;
Grenawalt et al. 1981; Murdock et al. 1981). However, there is little or no work on the
feeding value of wet distillers grains from wheat-based, ethanol production, for feedlot
cattle. The objective of this trial was to evaluate the performance and carcass quality of
cattle fed diets containing wet distillers grains (WDG) from wheat based ethanol
production and to contrast performance to that obtained from diets based on wet brewers
grains (WBG) or standard feed ingredients common to western Canada, during the
growing and finishing periods.

41
3.2 Materials and methods
3.2.1 Experimental animals and housing
One hundred and twenty medium frame (MF) steers were purchased from
commercial sources during May of 1992. The steers were fed and housed in outdoor
pens at the University of Saskatchewan Beef Research Station at Saskatoon,
Saskatchewan. The steers were managed according to the guidelines of the Canadian
Council of Animal Care (Olfert et al. 1992). The cattle were adapted to feedlot
conditions for a period of 14 days prior to the start of the trial. The experimental protocol
is given in Table 3.1. The cattle with an average weight of 311 ± 24 kg (mean ± SD)
were randomly allotted to 15 pens of 8 steers each. Allotment of steers in each pen was
stratified to give a uniform weight across the fifteen pens. Each pen was assigned to one
of the three dietary treatments.
3.2.2 Experimental diets and feeding protocol
Three dietary treatments were formulated. The control diet was formulated using
standard feed ingredients common to western Canada. These included barley grain,
alfalfa-brome hay, wheat straw and canola meal as a protein supplement during: the
growing period. The remaining two treatments used wet brewers or distillers grains as
protein and energy supplements in the growing and finishing phases. The diets were
formulated to provide 2.9 and 3.4 Meal kg'1 of digestible energy (DE) in the growing
and finishing phases, respectively. An outline of the experimental protocol of the feedlot
trail is presented in Table 3.1.
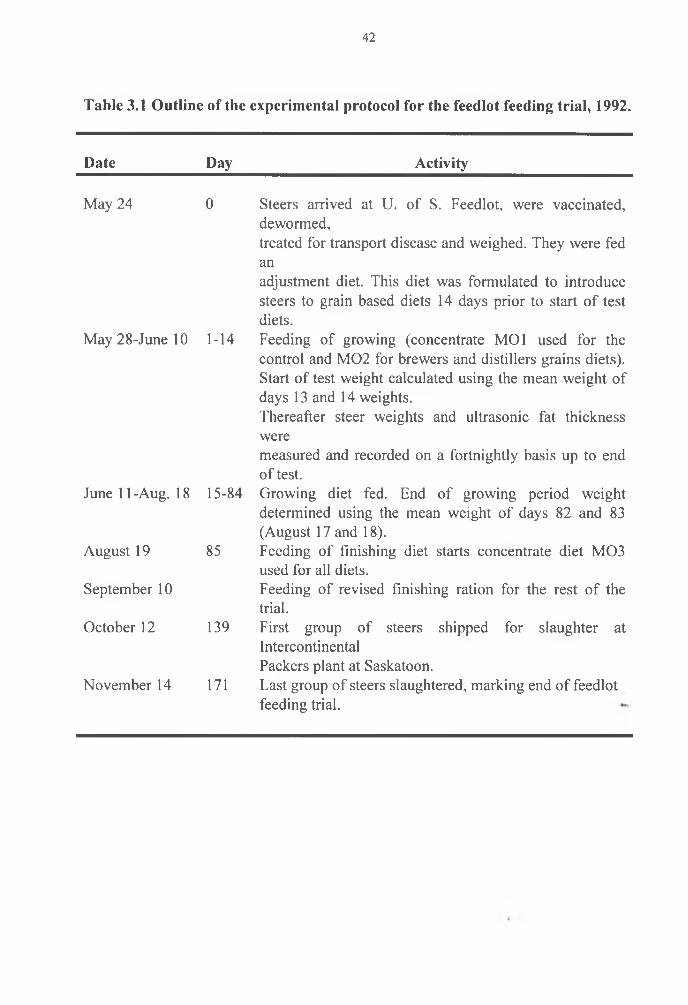
42
Table 3.1 Outline of the experimental protocol for the feedlot feeding trial, 1992.
Date Day Activity
May 24 0
May28-Junel0 1-14
June 11-Aug. 18 15-84
August 19 85
September 10
October 12 139
November 14 171
Steers arrived at U. of S. Feedlot, were vaccinated, dewormed,treated for transport disease and weighed. They were fed anadjustment diet. This diet was formulated to introduce steers to grain based diets 14 days prior to start of test diets.Feeding of growing (concentrate MOl used for the control and M02 for brewers and distillers grains diets). Start of test weight calculated using the mean weight of days 13 and 14 weights.Thereafter steer weights and ultrasonic fat thickness weremeasured and recorded on a fortnightly basis up to end of test.Growing diet fed. End of growing period weight determined using the mean weight of days 82 and 83 (August 17 and 18).Feeding of finishing diet starts concentrate diet M03 used for all diets.Feeding of revised finishing ration for the rest of the trial.First group of steers shipped for slaughter atIntercontinentalPackers plant at Saskatoon.Last group of steers slaughtered, marking end of feedlot feeding trial.

43
A minimum of 12% crude protein was formulated for both the growing and finishing
periods. Feed ingredients used in diet formulation, included barley grain, alfalfa-brome
hay, wheat straw, limestone and a mineral, vitamin premix. Diet formulation was based
on the NAS-NCR (1984) requirements for a 300 kg MF steer gaining 1.1 kg d '1 in the
growing period, and maximum growth in the finishing phase. The steers were fed ad
libitum twice daily at 0800 and 1600h. Each complete mixed ration was delivered to the
steers by a feeder wagon, equipped with a mixing auger, and a weigh scale. Orts were
collected and weighed every fourteen days. Data obtained was used to estimate dry
matter intake (DMI) and feed conversion (kg feed kg"1 of gain) of cattle fed each
treatment.
3.2.3 Data collection and analytical procedure
Body weights of steers at the start and end of the growing and finishing periods
were determined from the mean of two consecutive weights. During the remainder of the
trial period, daily weight gain was determined from fortnightly measurements. Steers
were measured between the 12lh and the 13th ribs for subcutaneous fat thickness
(USFAT) and the area of the longissimus dorsi muscle (USREA) at the start of the Trial,
and on days 51, 73, 92, 107, 120, and at the end of the trial using the procedure of
Perkins et al. (1992). This data was used to estimate carcass characteristics and
composition of the live animal.
Complete mixed rations from feedbunks were collected every fourteen days and
dried in a forced air oven (60°C for 72 hours) for dry matter determination. The samples
44
were ground through a 1 mm screen and analyzed for dry matter (DM) (method 7.003,
Association of Official Analytical Chemists (AOAC) 1984), crude protein (CP)
(Kjedahl-N method 7.015 AOAC 1984) acid (ADF) (method 7.076 AOAC 1984) and
neutral (NDF) detergent fiber (Goering and Van Soest 1976). Calcium (Ca) and
phosphorus (P) was determined using an atomic absorption spectrophotometer (Zazoski
and Burau 1977).
The WBG was supplied by the Great Western Brewing Company Limited in
Saskatoon, Saskatchewan. The WDG was from the PoundMaker Ag-Venture Ltd.
ethanol plant at Lanigan, Saskatchewan. Due to the high moisture content and the
possibility of spoilage, it was necessary to make a weekly trip to ensure an adequate
supply of these ingredients.
Carcass data was obtained on all animals through Agriculture Canada’s Blue Tag
program. The left side of each carcass was cut on the morning after slaughter between
the 12th and 13th ribs. Measurements taken on the exposed surface of the longissimus
dorsi included thickness of the subcutaneous fat cover, longissimus dorsi area, cutability
and marbling score. Randomly selected carcasses from the three dietary treatments (19,
25 and 18 steers, respectively, for canola control, WBG and WDG) were useJ for
measurement and evaluation of carcass composition. Carcass composition was
determined from 7-bone rib samples according to the method of McKinnon et al. (1993).
Each rib was physically dissected into muscle, fat and bone components.
45
3.2.4 Statistical analysis
The experiment was a completely randomized design. Pen was used as the
experimental unit. The data for the growing and finishing phases of the trial was
analyzed using the General Linear Model of the Statistical Analysis System (SAS Inc.
1990). Rates of fat deposition and muscle growth were determined from ultrasonic
measurements of animals backfat thickness and ribeye area during the trial. Simple
regressions were used to analyze the effect of diet on carcass composition. Single degree
of freedom contrasts were used to compare treatment effects on feedlot performance and
carcass composition (Steel and Torrie 1980). Differences among contrasts were
considered significant if a “P” value of less than 0.05 was noted. Contrasts of interest
were: A = Control versus WBG; B = Control versus WDG; C = WBG versus WDG.
3.3 Results and Discussion
Ingredients and analysis of the concentrate mixes for the growing and finishing
phases are given in Table 3.2. The concentrate for the control in the growing period
contained 15.4% canola meal. The composition of the diets fed in the growing period is
given in Table 3.3. The DM content of the WBG and WDG used in the trial was *22%
and 28%, respectively (Table 4.2). During the growing period the WBG and WDG diets
contained 44% and 32% WBG and WDG (% as fed) (16 and 13% DM), respectively. All
three diets fed during the growing period met the minimum crude protein levels set by
the NAS-NCR (1984) for growing medium frame steers.

46
Table 3.2 Ingredient composition and analysis of concentrate used in the growing (MOl and M02) and finishing (M03) periods of the trial.
Period
Growing Finishing
Parameter MOl M02 M03
Ingredient (%> as fed)
Barley 81.1 97.0 97.0Canola meal 15.4 - -Limestone 1.0 1.0 1.0Mineral/vitamin/ mix1 1.9 2.0 2.0
Ingredient (% DM)
Barley 81.3 96.7 96.8Canola meal 15.3 - -Limestone 1.0 1.1 1.2Mineral/Vitamin/ mix1 1.7 2.0 2.0
Concentrate analysis (% DM)
Dry matter 89.2 73.7 73.7Total digestible nutrients 78.5 80.7 80.1Crude protein 16.8 11.8 14.2Acid detergent fiber 10.6 8.0 7.2Neutral detergent fiber 22.5 18.0 20.6Calcium 0.7 1.2 1.0Phosphorus 0.5 0.5 0.3
z The mineral/vitamin premix contained 440,040 IU vitamin A, and 88,009 vitamin D kg'1 premix. Trace minerals in the mineral premix were: 19% calcium, 19% phosphorus, 5025 ppm zinc, 413 ppm iodine, 188 ppm iron, 8025 ppm manganese, 3000 ppm and 100 ppm cobalt.

Table 3.3 Composition and analysis of diets fed to the steers during the growing period of the trial
Diet (%)*
Parameter Control WBG WDG
Concentrates (% as fed)
MOl 59.0 _ _MQ2 - 30.0 37.0
Wet grains (%> as fed)
Wet brewers grains - 44.0 _
Wet distillers grains - - 32.0
Forages (% as fed)
Wheat straw 30.0 19.0 23.0Alfalfa/brome hay 11.0 7.0 8.0
Concentrates (%DM)
MOl 59.1 _ _M02 - 39.6 42.2
Wet grains (%DM)
Wet brewers grains - 18.4 .
Wet distillers grains - 14.6
Forages (%DM)
Wheat straw 29.9 30.7 32.1Alfalfa/brome hay
Diet analysis (% DM)
11.1 11.3 11.2
Dry matter 89.2 72.7 72.7Total digestible nutrients 65.1 65.0 65.3Crude protein 12.9 13.8 13.1Acid detergent fiber 26.3 25.3 25.7Neutral detergent fiber 44.7 47.5 46.8Calcium 0.6 0.7 0.7Phosphorus 0.4 0.6 0.4
WBG = wet brewers grains and WDG = wet distillers grains.

48
Estimated energy levels during the growing diets were 65, 64.9 and 66.7% TDN for
control, WBG and WDG, respectively (Table 3.3). The analyzed (dry matter basis) crude
protein level for WBG (13.8%) was, however, slightly higher than that of the control
(12.9%) and WDG (13.1%) diets (Table 3.3). Acid detergent fiber, NDF, Ca and P levels
during the growing period were similar across diets. During the finishing phase of the
trial, the forage to concentrate ratio was changed to provide higher energy levels (Table
3.4). This was achieved by reduction of the fiber content from hay while maintaining
straw at 8% or less in control, WBG and WDG diets, respectively (Table 3.4). Wet
brewers grains and WDG composed 19% and 13% (as fed) and 5.2% and 4.5% (DM
basis), respectively, of the WBG and WDG finishing diets. Estimated energy in the
finishing diets were 78.4, 78.3 and 78.7% TDN (Table 3.4). Chemical analysis indicates
that the fiber fraction of the diets was reduced by approximately half, from 25% ADF
during the growing period to 10% and 46% to 26% NDF during the finishing period.
Protein levels were maintained at a minimum of 12% for the finishing phase (Table 3.4).
No differences were observed in weight gain and dry matter intake (DMI) over
the course of the growing period (Table 3.5). Steers fed WBG tended (P<0.10) to have
better feed conversions than steers fed the canola meal based control. The control steers
consumed 7.5 kg of feed kg'1 weight gain, the WBG fed cattle consumed 6.8 kg of feed
for every kg of weight gain. Cumulative bi-weekly gains during the period indicated,
however, that the cattle fed WDG exhibited superior weight gains relative to the control
fed animals through day 56 (P<0.06) and day 70 (P<0.03). The WBG fed cattle were
intermediate in gain (Table 3.5).

49
Table 3.4 Composition and analysis of diets fed to the steers during the finishing period of the trial.
Diet (%)z
Parameter Control WBG WDG
Concentrate (% as fed)
M03 93.0 76.0 79.0
Wet grains (% as fed)
Wet brewers grains - 19.0 -
Wet distillers grains - - 13.0
Forages (% as fed)
Wheat straw 7.0 5.0 8.0Alfalfa/brome hay - - -
Concentrate (% DM)
M03 93.0 86.2 84.1
Wet grains (% DM)
Wet brewers grains - 6.8 -
Wet distillers grains - 5.5
Forages (% DM)
Wheat straw 6.9 6.9 10.4Alfalfa/brome hay “ - “
Diet analysis (% DM)
Dry matter 89.6 80.1 84.0Total digestible nutrients 77.6 77.7 76.7Crude protein 12.1 13.2 12.8Acid detergent fiber 10.9 10.5 13.1Neutral detergent fiber 28.8 25.5 25.9Calcium 0.5 0.5 0.6Phosphorus 0.4 0.5 0.4
WBG = wet brewers grains and WDG = wet distillers grains.

Table 3.5. Summary of the performance of cattle fed wet brewers (WBG) and wheat wet distillers (WDG) grains or thecontrol diet during the growing period of the trial.
Treatment Contrasts of interest (P>F)Z
Control WBG WDG SEy A B C
Param eter
Initial wt. (kg) 313.70 309.20 310.10 2.13Final wt. (kg) 420.80 424.60 424.70 3.60Days on feed 84.00 84.00 84.00 -
DM Intake (kg) 9.47 9.12 9.71 0.28Feed conversion 7.50 6.80 7.20 0.30 0.10
A D G X (kg d 1)
P eriod (days)1-14 2.16 2.04 2.01 0.151-28 1.56 1.66 1.60 0.071-42 1.40 1.57 1.52 0.091-56 1.41 1.53 1.57 0.05 0.061-70 1.39 1.46 1.57 0.05 0.031-84 (cumulative gain) 1.26 1.36 1.35 0.05
z Contrasts of interest: A = Control versus WBG, B = Control versus WDG, C = WBG versus WDG y SE = standard error of the, mean. x ADG = average daily gain.
51
The faster rate of gain observed during the biweekly periods may be the result of
the higher rumen undegradable protein (RUP) in the WDG diet. Studies carried out
using wet corn distillers grain, have attributed superior weight gains to protein which
bypassed the rumen and became available for digestion in the duodenum (Firkins et al.
1985; Firkins et al. 1984; Risk et al. 1982 and Ham et al. 1994). Abrams et al. (1983)
reported improved weight gain for cattle supplemented with corn wet distillers grains
compared to cattle fed soybean meal. DeHaan et al. (1982) have suggested that corn wet
distillers grains supported greater weight gains, improved feed conversion and superior
protein efficiency than soybean fed cattle. Results of the present study, which show
improvement in early weight gains, with WDG from wheat may be attributed to the high
RUP content of the diet. Boila and Ingalls (1994), for example, have reported higher
RUP levels for both CP and amino acids from dried wheat distillers grains relative to
canola meal. A greater amount of protein would have escaped degradation in the rumen
and thus become available for postruminal digestion and absorption in the WDG diets.
The failure to see a consistent response to WDG over the entire growing period may be
due to the fact that bypass protein needs decrease as the animal matures and develops.
Several studies have shown, for example, that only young rapidly growing cattle respond
to supplemental bypass protein (NAS-NCR 1985; McKinnon 1992).
The control fed steers gained faster (P<0.05) than the WBG fed steers during the
finishing period (Table 3.6). Cattle fed WDG were intermediate. Other parameters
examined including DMI and feed conversion did not show any differences during this
period (Table 3.6).

Table 3.6. Summary of the performance of cattle fed wet brewers (WBG) and wheat wet distillers (WDG) grains or thecontrol diet during the finishing period of the trial.
Treatment Contrasts of interest (P>F)Z
Control WBG WDG SEy A B C
Param eter
Initial wt. 420.80 424.60 424.70 3.60Final wt. 513.50 506.80 505.70 3.90Days on feed 66.60 66.00 61.50 2.40DM Intake (kg d’1) 10.47 10.06 10.91 0.41Feed conversion 7.53 8.07 8.32 0.45
A D G (kg d 1)
Period (days) 85-99 1.68 1.22 1.51 0.2185-113 1.11 1.02 1.30 0.10 0.0885-127 1.39 1.23 1.39 0.05 0.03 0.0485-141 1.39 1.21 1.49 0.06 0.07 0.0185-slaughter (cumulative gain) 1.40 1.25 1.32 0.05 0.05
z Contrasts of interest: A = Control versus WBG; B = Control versus WDG; C = WBG versus WDG.
y SE = standard error of the? mean.
x ADG = average daily gain.
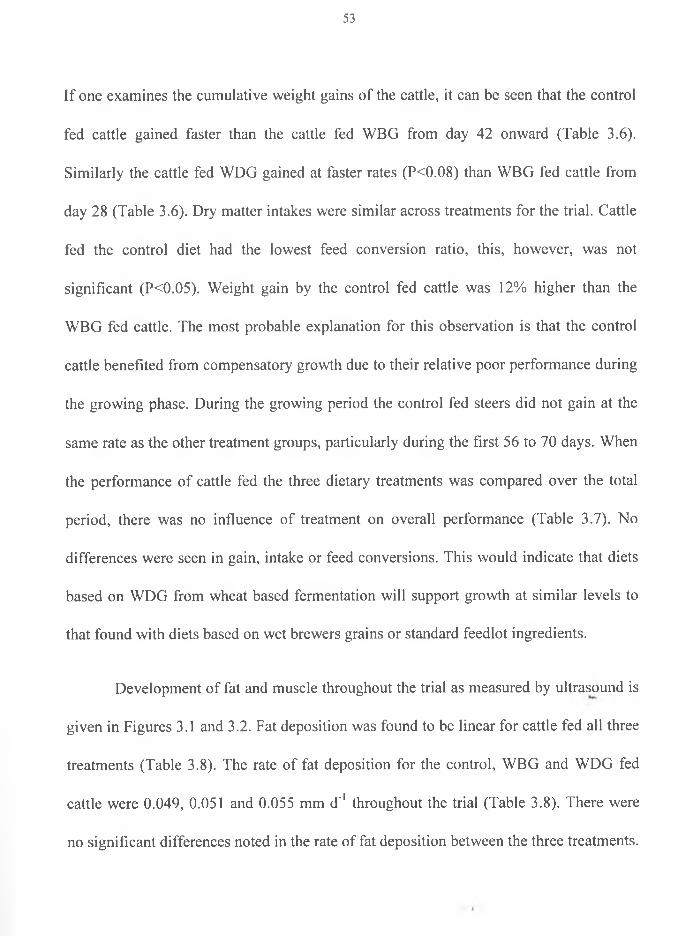
53
If one examines the cumulative weight gains of the cattle, it can be seen that the control
fed cattle gained faster than the cattle fed WBG from day 42 onward (Table 3.6).
Similarly the cattle fed WDG gained at faster rates (P<0.08) than WBG fed cattle from
day 28 (Table 3.6). Dry matter intakes were similar across treatments for the trial. Cattle
fed the control diet had the lowest feed conversion ratio, this, however, was not
significant (P<0.05). Weight gain by the control fed cattle was 12% higher than the
WBG fed cattle. The most probable explanation for this observation is that the control
cattle benefited from compensatory growth due to their relative poor performance during
the growing phase. During the growing period the control fed steers did not gain at the
same rate as the other treatment groups, particularly during the first 56 to 70 days. When
the performance of cattle fed the three dietary treatments was compared over the total
period, there was no influence of treatment on overall performance (Table 3.7). No
differences were seen in gain, intake or feed conversions. This would indicate that diets
based on WDG from wheat based fermentation will support growth at similar levels to
that found with diets based on wet brewers grains or standard feedlot ingredients.
Development of fat and muscle throughout the trial as measured by ultrasound is
given in Figures 3.1 and 3.2. Fat deposition was found to be linear for cattle fed all three
treatments (Table 3.8). The rate of fat deposition for the control, WBG and WDG fed
cattle were 0.049, 0.051 and 0.055 mm d '1 throughout the trial (Table 3.8). There were
no significant differences noted in the rate of fat deposition between the three treatments.

Table 3.7 Performance of cattle fed wet brewers (WBG) or wheat wet distillers (WDG) grains or canola meal controlover the course of the entire feeding period.
Treatment Contrasts of interest (P>F)Z
Control WBG WDG SEy
Param eters
Start of test wt. (kg) 313.70 309.20 310.10 2.13End of test wt. (kg) 513.50 506.80 505.70 3.90Days on feed 151.60 151.00 146.50 2.40Daily gain (kg) 1.32 1.31 1.34 0.03DM Intake (kg d'1) 9.96 9.59 10.30 0.32Feed conversion 7.60 7.30 7.70 0.30
z Contrasts of interest: A = Control versus WBG, B = Control versus WDG, C = WBG versus WDG. y SE = standard error of the mean.

55
Days on fssd
F ig u re 3 .1 F a t d e v e lo p m e n t In c a t t le fe d th e c o n tro l (C ) , w e t b re w e rs (W B G ) o r d is t i l le r s (W D G ) g r a in s d ie ts .

56
Days on feed
F ig u re 3 .2 M u s c le d e v e lo p m e n t In c a t t le fe d th e c o n tro l (C ) w e t b re w e rs (W B G ) o r w e t d is t i l le rs (W D G ) g r a in s d ie ts .

57
Table 3.8 Linear regression parameters for rate of fat (mm d"1) and ribeye (cm'd"1) development for steers fed the control, wet brewers (WBG) and wheat wet distillers grains (WDG) diets.
Tissue development
Slope* SEy r2 R SD
F at developm ent (mm)
Control 0.049 0.002 0.65 1.56Wet brewers grains 0.051 0.002 0.67 1.55Wet distillers grains 0.055 0.002 0.74 1.41
R ib eye developm ent (cm ')
Control 0.150 0.009 0.43 6.64Wet brewers grains 0.167 0.009 0.55 6.03Wet distillers grains 0.158 0.009 0.56 5.52
z No quadratic effects detected. y SE = standard error of the slope. r2 = Coefficient of determination. RSD = Residual standard deviation.
58
9 1The rate of USREA muscle development was 0.15, 0.17 and 0.16 cm d' in the control,
WBG and WDG diets, respectively (Table 3.8). No significant differences were
observed between the three treatments. These values while similar to those obtained by
other workers (Hamlin et al. 1991; Bergen, personal communication) indicate that cattle
fed the WDG diet exhibited similar growth characteristics for carcass fat and muscle
over the course of the feeding period as cattle fed the WBG diet or the control based on
standard feed ingredients.
Similarly carcass traits collected at slaughter (Table 3.9) did not show any
significant differences among treatments. Contrasts for carcass composition indicated
higher (P<0.05) percent intermuscular fat for cattle fed WDG relative to both WBG and
control fed cattle. WBG fed cattle had higher (P<0.02) subcutaneous fat than the WDG
fed cattle (Table 3.9). These results and that of the live animal ultrasound indicate that
carcass growth and development and quality at slaughter will be similar for cattle fed
WDG as a protein supplement relative to conventional fed cattle. Hanke and Lindor
(1982) observed similar results for cattle fed corn wet distillers grains. These workers
found no differences in carcass characteristics over those fed high moisture corn and
urea. All carcass characteristics examined in this study including carcass weight,
marbling score, kidney, heart and pelvic fat, ribeye area, fat depth quality grade and
yield and yield grade, were similar.

Table 3.9 Carcass characteristics and composition of cattle fed the control, wet brewers (WBG) or wheat wet distillers (WDG) grains diets.
Treatment Contrasts of interest (P > F)z
Control WBG WDG SEy
C arcass characteristics
Weight (kg) 273.60 269.40 269.90 3.00Dressing (%) 55.10 55.00 55.10 0.30Rib Eye Area (cm2) 74.60 72.90 74.20 1.50Cutability (%) 59.90 59.20 59.50 0.30Average fat (mm) 7.50 7.90 8.00 0.30Marbling score 1.10 1.20 1.20 0.06
Carcass com position
Bone (%) 21.50 21.40 21.40 0.30Lean (%) 53.60 54.10 54.40 0.70Fat (%) 24.90 24.40 24.20 0.70Intermuscular fat (%) 51.00 50.80 52.80 0.30Subcutaneous fat (%) 36.20 37.50 34.70 0.60Body cavity fat (%) 12.80 11.70 12.40 0.50
A B C
0.01 0.01 0.02
z Contrasts of interest: A = Control versus WBG, B = Control Versus WDG and C = WBG Versus WDG. y SE = standard error of the mean.

60
3.4 Conclusion
In this trial, there were few differences noted between the performance of cattle
fed conventional feeds, WBG or WDG in the growing and finishing phases. Some
improvement in growth was noted during the growing phase with cattle fed WBG
relative to the control. This effect was not, however, seen over the entire period. Cattle
fed WDG from wheat based fermentation exhibited performance at least equal to that
from cattle fed control or WBG diets during the growing period. Similarly cattle fed
WDG gained equally as well during the finishing period. No adverse effects were seen
on carcass composition or live animal muscle or fat development. Based on this work it
can be concluded that WDG from wheat based fermentation from ethanol production is a
satisfactory ingredient for growing and finishing cattle. This implies that this product
can be effectively utilized as a protein and energy supplement for ruminants.

61
4.0. In S itu rumen disappearance of dry matter and crude protein from wet brewers and distillers grains.
4.1 Introduction.
In order to establish the amounts and ratios of nutrients necessary for optimal
microbial and animal growth, one must first predict the degree to which the nutrients are
available in the rumen. There are several techniques that have been used to estimate the
contribution of feed protein or carbohydrate to rumen fermentation. Techniques for
estimation of ruminal protein and carbohydrate digestion have been extensively
reviewed (Hoover et al. 1991; Czerkawski and Breckennridge 1977; Broderick 1978;
Krishnamoorthy et al. 1982; Nocek 1988; Erdman et al. 1987; Campling 1990 and
McAllister 1990). The energetic value of a diet or a feed depends on organic matter
digestion in the rumen and in particular, on starch digestion (Cerneau and Michalet-
Doreau 1991). Starch digestion by ruminants is governed by the site (ruminal or
intestinal) of digestion, nature of the feed and degree of processing (Cerneau and
Michalet-Doreau 1991). In view of the importance of rate and extent of degradation of
dietary protein, a lot of attention has been focused on this area of protein digestion
(0rskov 1982). Soluble proteins become attached very rapidly to bacterial cell walls and
are thus rapidly degraded (Nugent et al. 1983). Feed sources that contain less soluble
protein become attached to rumen bacteria, but are slowly or poorly degraded. Chemical
properties of proteins such as number of disulfide bridges and tertiary structure may be
partly responsible for lower degradability. Other enzymatic activities such as
endopeptidases and exopeptidases may also be partially involved in the slow
degradability of some protein supplements (Orskov 1982). Estimates of the degradability

62
of protein in the rumen are essential for the application of systems for the evaluation of
protein requirements of the ruminant (National Academy of Sciences-National Research
Council (NAS-NCR 1989)). The most extensively evaluated and utilized procedure is
the in situ nylon bag technique (Nocek 1988).
Distillers grains and brewers grains are by-products of industries that produce
alcohol through yeast fermentation of cereal grain. A conversion of starch to alcohol
results in the production of a byproduct with higher cell wall and protein content than the
original grain substrate. Both wet brewers and dry brewers grains have been extensively
evaluated as protein supplements in cattle diets (Porter and Conrad 1975; Murdock et al.
1981; Grenawalt et al. 1981; Davis et al. 1983; Polan et al. 1985; Armentano et al. 1986;
Polan 1988 and Cozzi and Polan 1994). Wet and dry corn distillers grains have also been
evaluated as protein supplements in cattle diets (Rounds 1975; Waller et al. 1980;
Firkins et al. 1984; Santos et al. 1984; Muntifering et al. 1985; Aines et al. 1986; Beyla
et al. 1989; Delcurtoo et al. 1990 and Ham et al. 1994). Corn-based distillers grains has
higher protein content than the grain from which it is produced (Beyla et al. 1989).
Furthermore, the corn-based distillers grains has a rumen undegradable protein (RUP)
value of 55%, making it a more valuable protein source for dairy cattle than the corn
itself. The high RUP content is a result of the distillation process where the cooking
temperature exceeds 120°C. Recent research has focused on the value of wheat distillers
grains as a protein source for cattle. Most of this evaluation work on wheat distillers
grains has been done on dried distillers grains (Heinemann 1986; Hatch 1993a and Boila
and Ingalls 1994). As with corn, dry distillers grains from wheat j^ased fermentation has

63
been shown to be high in RUP. For example, Boila and Ingalls (1994) noted that wheat
dried distillers grains had high rumen undegradable protein and amino acids compared to
canola meal. No work has been carried out to evaluate the nature of the protein from wet
distillers grains from wheat based fermentation. This is important because drying results
in further heating and may alter the protein degradation characteristics. The objectives of
this study were to look at the rate and extent of dry matter and protein digestion in the
rumen from wet distillers grains, from wheat based fermentation (WDG), and to
compare it to wet brewers grains (WBG), a commonly used bypass protein supplement.
4.2 Materials and methods
4.2.1 Experimental animal and housing
A 650 kg fistulated Holstein cow was housed in a 10 x 10 m pen in the
University of Saskatchewan, Animal and Poultry Department metabolism barn. The cow
was kept in an individual pen for effective management during the experimental
protocol. The cow was fed twice daily at 0800 and 1400h. The diet consisted of 2.5 kg
concentrate, 0.5 kg alfalfa hay and 5.5 kg barley silage (as fed basis per feeding). Water
and salt were provided ad libitum. The cow was managed according to the guidelines of
the Canadian Council of Animal Care (Olfert et al. 1992).
4.2.2 Experimental treatments and in situ rumen incubation procedure
This study examined in situ nutrient disappearance from two products of cereal
grain processing. Wet brewers grains (WBG) and wet distillers grains (WDG). Wet
brewers grains was supplied by the Great Western Brewing Company at Saskatoon,
64
Saskatchewan. Wet distillers grains was supplied by PoundMaker Ag-Ventures Ltd., at
Lanigan, Saskatchewan. Two samples of each grain were evaluated. Samples of WBG
and WDG, were collected over the winter of 1991/92, from the feeding trial described in
Chapter 3, and dried in a forced air oven at 40°C for 72 h, composited and ground
through a 1 mm screen. These samples were designated as wet brewers grain trial
(WBGT) and wet distillers grain trial (WDGT). A second sample of each grain type was
collected from each source after the feeding trial in 1992. These post trial samples were
designated wet brewers grains post trial (WBGP) and wet distillers grains post trial
(WDGP). Wheat grain and barley malt were collected from the same sources for
laboratory analysis. Duplicate samples (6 g) of each treatment were incubated in nylon
bags (12 x 19 cm with 50 pm porosity) in the rumen for 2, 4, 6, 8, 12, 24 and 48 h. Bags
were put in the rumen in the morning before the cow was fed. The bags were put in the
rumen starting with the 48 h first and 2 h incubation last. All bags were removed at the
same time. Three separate incubations were carried out and were used as replicates in the
study. Following removal from the rumen, the bags were washed according to the
procedure described by McKinnon et al. (1991) and dried in a forced air oven at 60°C for
3 d. Samples were then analyzed for DM and CP according to AOAC methods described
in Chapter 3. Nutrient disappearance was calculated from DM and CP residues in the
nylon bags following each incubation period. Rumen kinetic parameters were calculated
according to the equation of 0rskov and McDonald (1979) using an interactive nonlinear
regression procedure of the Statistical Analysis System Institute Inc. (SAS Inc. 1990):
P = a + b(l-ect)
65
where P represents the amount degraded at time t\ a the rapidly soluble fraction, b the
potentially degradable fraction and c the fractional rate constant at which b is degraded
with the constraint that a +b < 100. Effective degradability (ED) in the rumen for DM or
CP was estimated using the equation of 0rskov and McDonald (1979):
ED - a + (b *c)/(c+k)
where k represents the rumen dilution rate (5% h’1) and a, b and c refer to the nonlinear
parameters described above.
4.2.3 Statistical analysis
The experiment was a completely randomized design (Steel and Torrie 1980)
with four treatments. These included wet brewers (WBGT and WBGP) and wet distillers
(WDGT and WDGP) grains collected during and after the trial, respectively. Data
analysis was performed using the General Linear Model of the SAS Inc. (1990). Mean
separation was accomplished using single degree of freedom contrasts (Steel and Torrie
1980) for in situ DM and CP disappearance and effective DM and CP degradability.
Contrasts of interest were: A. WBGT versus WDGT; B. WBGP versus WDGP; C.
average of WBG versus average of WDG feeds.M.
4.3 Results and Discussion
Analysis of the feeds fed to the cow used in the in situ incubations is presented
in Table 4.1. These feed ingredients are standard feeds for dairy cattle in western
Canada. The nutrient composition of the wet brewers and distillers grains used in the in
situ incubations are given in Table 4.2. Crude protein concentration was slightly higher/
for brewers than distillers grains (Table 4.2). Average values were 28.5 and 25.5%,

66
Table 4.1 Ingredient make up of the barley based concentrate and chemical analysis of the feed used in the fistulated cow ration.
Ingredien t DM CP ADF NDF Ca P
C oncentrate (%> as fed )
Barley 74.50Soybean meal 8.05Canola meal 7.93Canola oil 0.96Dicalcium-phosphatc 0.96Sodium chloride 0.74Phosphorus (25%) 0.93Mineral-Vitamin premix' 5.93
A n alysis (D M basis)
Concentrate 89.8 15.8 5.8 20.9 0.8 1.0Hay 86.6 17.7 28.4 36.4 1.8 0.2Silage 35.9 16.6 31.7 58.2 0.3 0.3
Mineral-Vitamin premix contained: Vitamin A = 333334 IU kg’ ; Vitamin D3 =
60000 IU/kg; Vitamin E (SD) = 1000 IU/kg; Iron(carbonate) = 1050 ppm; Zinc
(oxide) = 2100 ppm; Manganese (oxide) = 1500 ppm; Copper (sulfate) = 533.33
ppm; Iodine = 45 ppm; Cobalt (carbonate) = 15 ppm; Selenium (sodium selenite)
= 12 ppm; Mg = 3.33%; K = 1.8%; S = 1.0%; Na = 6.3%; Chloride = 10.35%;
Ca = 16.10% and P = 8.5%.

67
Table 4.2 Chemical analysis of pre (barley malt and wheat grain) and post (wet brewers and wet distillers grains) fermentation products used in the incubation study.
Ingredient* DM CP EE ADF NDF Ash Ca P
Pre ferm en ta tion products
Barley malt 92.7 13.1 2.3 5.2 20.2 2.4 0.0 0.3
Wheat grain 90.5 15.9 1.8 3.5 19.6 1.9 0.0 0.3
P ost ferm en ta tion products
WBGTy 21.2 28.9 6.7 23.2 65.4 4.2 0.3 0.1
WBGP 22.4 27.9 6.5 22.9 65.5 4.5 0.3 0.2
WDGTy 29.2 25.6 6.2 23.9 66.7 2.8 0.2 0.6
WDGP 28.3 25.5 6.3 24.1 65.9 2.7 0.2 0.6
' analysis reported on dry matter basisJ WBGT and WBGP = wet brewers grains used in the trial and post trial, WDGT and WDGP = wet distillers grains used in the trial and post trial.

68
respectively. Acid detergent fiber and NDF were similar for both WBG and WDG
collected during and after the feeding trial. Wet brewers grains exhibited slightly higher
fat levels (6.6 versus 6.3%) than WDG. Phosphorus levels were three times as high for
WDG relative to WBG (0.6 versus 0.15%). Table 4.2 also shows values for barley malt
and wheat grain. Fermentation has concentrated the nutrients in the post fermentation
products. This result has been observed by numerous workers (Heinemann 1986; Boila
and Ingalls 1994; Grenawalt et al. 1983; Davis et al. 1983; Cozzi and Polan 1994).
The wet brewers grains and WDG used in the in situ incubations were air dried in
a forced air oven at 40°C for 72 h. This procedure was carried out to dry the products. A
low drying temperature was chosen to avoid heat damage to the protein fraction of the
grains. Heat damage to protein results in lower rumen protein degradability (McKinnon
et al. 1991; Kennelly and De Boer 1986). Boila and Ingalls (1994) observed reduced
ruminal degradation of dry matter and protein as a result of drying wheat distillers
grains.
Dry matter disappearance from wet brewers (WBG) and distillers (WDG) grains
is presented in Figures 4.1 and 4.2. Results were similar for samples collected during
(Figure 4.1) and after (Figure 4.2) the trial for both feed sources. Dry matter
disappearance was greater from WDG (P<0.05) at 8, 24 and 48 h for trial samples
(Figure 4.1) and at 2, 4, 24 and 48 h for post trial samples (Figure 4.2).

69
Incubation time (h)
Figure 4.1 Dry matter disappearance from wet brewers (WBGT) and distillers(WDGT) grains collected during the trial (* significant difference P<0.05).

70
Incubation time (h)
Figure 4.2 Dry matter disappearance from wet brewers (WBGP) anddistillers (WDGP) feeds collected after the feeding trial (* significantdifference P<0.05).

71
These results are reflected in the in situ kinetic parameters for dry matter which
are presented in Table 4.3. These parameters were used to calculate the effective dry
matter degradability (0rskov and McDonald 1979). Wet brewers grains exhibited a
lower (P<0.05) soluble DM fraction (a) and a lower (P<0.05) (b) or potentially
degradable fraction. No significant differences were noted in c values or rates of DM
digestion although when the values were averaged, WBG tended (P<0.08) to be
degraded faster (7.57 versus 5.38 % h’1). As a result of the differences in a and b
fractions, WDG exhibited a greater (P<0.01) effective DM degradability (sample
averages 47.2 versus 52.8%).
With respect to CP, WDG exhibited greater CP loss at all incubation times
except the 2 and 4 h incubation for the samples collected during the trial (Figure 4.3).
Similarly, for the post trial samples greater CP losses were seen at 8, 24 and 48 h
incubations (Figure 4.4). These results would indicate that the protein from WBG is
more resistant to rumen degradation than that from WDG. Examination of the in situ
kinetic parameters shows that WBG and WDG have similar a or soluble CP fractions
(range 24.7-27.9%) (Table 4.3). Averaged across samples, WBG had a higher (P<0.05)
potentially degradable fraction (b) (62.9 versus 57.8%) than WDG (Table 4.3). The two
WBG samples exhibited similar rates (c value) of CP disappearance (average 7.14% h'1).
The WDGP exhibited a similar c value or rate of CP disappearance as WBG samples
(7.17% h 1). However, the WDG trial sample exhibited a significantly higher (P<0.01)
rate of CP disappearance (14.2% h"1).

Table 4.3 Dry matter (DMD) and crude protein (CPD) disappearance and effective degradability (EDMD and ECPD) from wet brewers (WBG) and distillers grains (WDG).
Treatment1 Contrasts of interest P>FX
WBGT WBGP Average WDGT WDGP Average SEy A B c
DMD*
a 13.70 13.93 13.82 18.47 18.70 18.58 0.74 0.01 0.01 0.01b 57.23 54.97 56.10 65.90 67.00 66.45 1.41 0.01 0.01 0.01c 7.22 7.92 7.57 5.49 5.28 5.38 1.12 NS NS 0.08
EDMDk = 5% 47.07 47.37 47.22 52.77 53.00 52.88 0.86 0.01 0.01 0.01
CPDW
a 27.90 25.57 26.74 24.83 24.73 24.78 1.41 NS NS NSb 57.07 58.57 57.82 61.67 64.80 62.94 1.99 NS 0.05 0.02c 7.97 6.85 7.14 14.12 7.17 10.65 0.83 0.01 NS 0.01
ECPDk=5% 62.97 59.33 61.15 70.40 62.77 66.59 0.78 0.01 0.01 0.01
z Treatment are brewers grain used in trial (WBGT) and those collected post trial (WBGP), distillers grains used in trial (WDGT) and those collected post trial (WDGP).y SE is standard error of the mean.x Contrasts of interest: A = WBGT versus WDGT, B = WBGP versus WDGP and C = average of WBG versus average of WDG feeds. w Disappearance parameters a = rapidly degradable fraction (%), b = potentially degradable fraction (%), c = degradation rate constant for b fraction (“/oh' 1) and k = the rumen particulate outflow rate used for estimation of EDMD and ECPD.
f

73
In c u b a t io n t im e (h )
Figure 4.3 Crude protein disappearance from wet brewers (WBGT)and distillers (WDGT) grains collected during the trial (* significantdifference P<0.05)
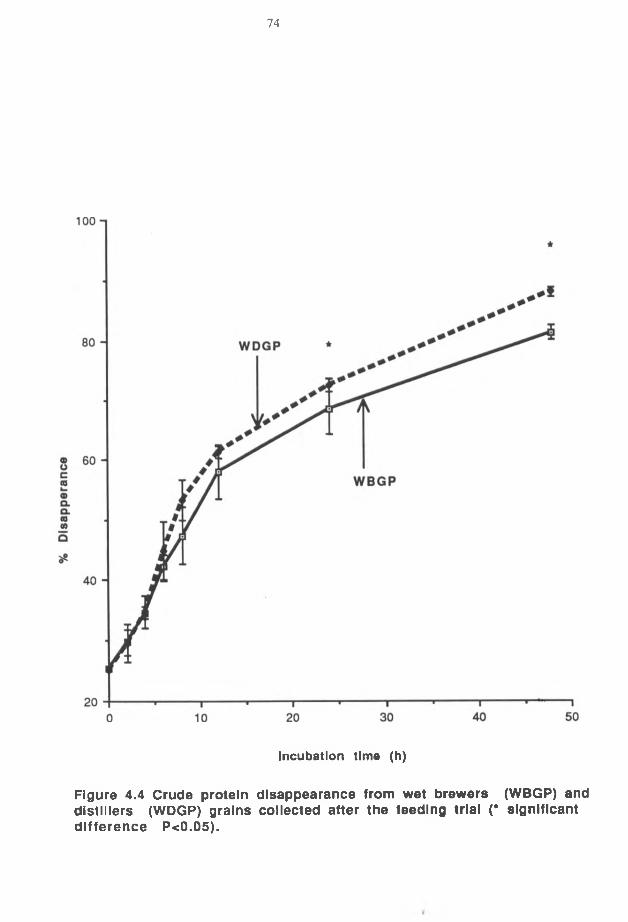
74
Incubation time (h)
Figure 4.4 Crude protein disappearance from wet brewers (WBGP) anddistillers (WDGP) grains collected after the feeding trial (* significantdifference P<0.05).

75
Examination of the data shows no apparent reason for this discrepancy other than the
fact that in this data set, protein disappeared faster at all incubation times. The extent of
protein disappearance was similar at 24 hours of incubation. When samples were
averaged, the WBG exhibited a slower rate (P<0.01) of CP disappearance (7.1 versus
10.7% h '1) (Table 4.3). Consequently, effective CP degradability was greater (P<0.01)
for WDG (66.6%) than for WBG (61.2%).
The soluble fraction (a) of WDG reported in this trial for DM disappearance
(18.6%) is smaller than that (28.5%) reported by Boila and Ingalls (1994). This
difference is unexpected because the samples of Boila and Ingalls (1994) underwent
further drying, a process which should reduce the (a) value. No reason for this
disappearance is apparent. The potentially degradable fraction (b) observed in this study
(66.5%) was higher than (53.2%) that reported by Boila and Ingalls (1994). Examining
the c value, WDG used in this study exhibited a higher rate of degradability (5.4% h '1),
compared to that (3.6% h’1) observed by Boila and Ingalls (1994). This would be
expected because of the heat applied to DDG during the drying process. Despite these
differences in rumen kinetic parameters and processing of the distillers grains used in the
two studies, the EDMD, reported by Boila and Ingalls (51.3%) is close to that (52.9%)
observed in this study. Other studies using distillers grains from various cereals grains
have been carried out. Shelford and Tait (1986) reported non-significant differences in
EDMD from rye (67%) and corn (68%) distillers grain. Weiss et al. (1989) compared
barley distillers grains and SBM. No significant differences in dry matter degradability
between the two protein sources were noted. Offer and Offer (1992b) observed EDMD

76
from malt barley distillers grains of 43%, estimated at a rumen outflow of 6% h '1, in
sheep. The effective dry matter degradability value for WBG feeds reported in this study
(47.2%) is close to those reported by Santos et al. (1984) (52%) and Davis et al. (1983)
(55%).
The sum of the soluble fraction (a) and the potentially degradable DM fraction
(b) averaged 85% for the average of the two WDG samples, respectively. Boila and
Ingalls (1994) noted a value of 81% in dried distillers grains for fractions a and b. The
difference between the two trials may be attributed to the extra drying applied to the
dried distillers grains used by Boila and Ingalls (1994). The drying process has the effect
of alteration of the protein properties of the feedstuff, thereby increasing its rumen
undegradability.
Effective crude protein degradability for distillers grain averaged 66.6% at 5% h"1
rumen outflow rate. This value is higher than 48.8% reported by Boila and Ingalls
(1994). The difference in ECPD observed in these two trials may be attributed to the
same explanation used for the differences observed in EDMD. The extra heat applied
during drying increases the RUP content of the byproduct. Shaver (1992) reviewed
research papers and quoted average RUP content from dried and wet corn distillers
grains at 55 and 50%, respectively. The effective crude protein degradability from WBG
averaged 61.2%. Work carried out using other cereal grains has been documented. Weiss
et al. (1989) noted an ECPD from dried barley distillers grains of 57.6%. Shelford and
Tait (1986) reported ECPD from dried rye distillers grains with solubles (73.4%) and
dried corn distillers grains with solubles (73.9%).

77
Effective nutrient disappearance from WBG and WDG was characterized by
larger soluble CP than DM fractions (Table 4.3). As observed with EDMD, the effective
crude protein disappearance from WDG feeds was higher (P<0.01) than from WBG
feeds. The larger soluble and potentially degradable fractions may have contributed to
the larger ECPD (Table 4.3). The rate of degradation (c) of the degradable crude protein
fraction (b) did not differ except for the WDGT sample which showed a high value
(14%) compared to an average of (7%) for the other feeds (Table 4.3). This higher value
in this sample contributed to the high ECPD (70%) for the WDGT and WDG (average)
(66.6%) compared to the WBG (average 61.2%) samples.
The sum of the soluble and degradable CP fractions (a) and (b) was 88%
compared to 98% reported by Boila and Ingalls (1994). However, the effective crude
protein disappearance from this study estimated at a rumen outflow rate of 5% was
66.6% compared to the 48% reported by Boila and Ingalls (1994). The differences in the
present study compared to Boila and Ingalls (1994) may be attributed to the extra heat
applied to distillers grains during drying. The review by Shaver (1992) indicates that the
RUP in wet corn distillers grains is 50%. In dried distillers grains the RUP value was
55% (Shaver 1992). The RUP value for wet distillers grains from wheat in the present
study was 33%. The high rate of degradation (c) in the WDGT sample played a role in
making the ECPD higher than expected. The implication of this result is that the
microbes degraded WDG at a much faster rate than was the case for the Boila and
Ingalls (1994) trial. Cozzi and Polan (1994) reported 42% ECPD for dry brewers grains.
This value is much lower than that reported in this study (61%). The large difference in

78
the ECPD for these two products may be explained by the effect of drying the brewers
grains by Cozzi and Polan (1994) compared to the product used in this study.
Work has also been carried out to determine the rumen digestibility from other
protein sources. Mustafa et al. (unpublished data) have estimated EDMD and ECPD
from borage meal (BM), soybean meal (SBM), canola meal (CM) and corn gluten meal
(CGM). These workers found EDMD values for BM, SBM, CM and CGM of 48.8, 78.7,
64.5 and 32.5%, respectively. In the same trial, ECPD was estimated as 61.7, 71.2, 68.0
and 11.2% for BM, SBM, CM and CGM, respectively. Kirkpatrick and Kennelly (1987)
examined the EDMD and ECPD from barley, CM, SBM and meat and bone meal
(MBM). The results of their study indicated that MBM had the lowest EDMD and
ECPD while the other protein sources used in the trial ranged from 63 to 74% for
EDMD and 60 to 73% for ECPD. These values give an indication of the role that may be
played by wheat wet distillers grains as a source of RUP for ruminants. If one compares
the EDMD for WBG and WDG in the present study to these values, one could conclude
that these supplements have relatively high bypass values for DM compared to canola
meal or SBM. Effective CP disappearance values are, however, only slightly lower than
reported values for canola meal or SBM. Compared to high bypass sources such as corn
gluten meal, these products would at best be considered as intermediate sources of
bypass DM and protein.
79
4.4 Conclusion
The results of this study indicate that WBG had lower disappearance of both DM and CP
than WDG. This implies that if both products are fed to cattle, those fed WBG could
benefit more from RUP than those fed WDG. The lower DM and CP degradation
observed in the dry wheat distillers grains used by Boila and Ingalls (1994) relative to
the values in the present study may be attributable to the extra heating applied to DDG
prior to rumen incubation. Compared to canola meal and soybean meal, the two by
products used in the present study would be expected to have high rumen undegradable
dry matter values but only slightly higher bypass protein values. Wheat wet distillers
grains or WBG may be used to replace the standard protein supplements currently used
in western Canada and supply slightly higher levels of RUP. The use of these two by
products may be limited due to the cost involved in transportation for producers who are
not close to processing plants.

80
5.0. Thin stillage from wheat based fermentation as a water source for cattle grazing crested wheatgrass pastures.
5.1 Introduction.
Distillers by-products are produced when whole stillage is screened, centrifuged
or pressed. Such a processing results in wet distillers grains and the pressed liquid or thin
stillage (Aines et al. 1986). Thin stillage from corn based fermentation has a total solids
content of 4 to 8%. It consists primarily of suspended and dissolved particles that
include spent grains, yeast cells and soluble nutrients that are not utilized during the
fermentation process. Com thin stillage has been shown to be an excellent source of
crude protein (28-30%) calcium (1.4%) and phosphorus (2.1%) (Aines et al. 1986) and
an excellent source of nutrients for growing and finishing cattle (Larson et al. 1982;
Aines et al. 1986; Ham et al. 1994). Early interest in corn thin stillage was based on the
idea that it stimulated fiber digestion (Little et al. 1964; Little et al. 1970 and Beeson
1975). More recent work on corn thin stillage has focused on the rumen undegradable
protein content of stillage (Larson et al. 1982a; Aines et al. 1986; Ham et al. 1994).
In western Canada, extensive corn production is not viable due to the climate.
However, wheat production which is common can be an alternate cereal substrate for
ethanol production. Thin stillage from wheat based ethanol production may differ in
nutritive value than that from corn based ethanol production. Lee et al. (1991), for
example, showed that thin stillage from western Canadian ethanol production plants,
contains 4.5% DM of which 45% is CP. There has been no research which has examined
the nutritional value of thin stillage from wheat based ethanol production as a nutrient
source for cattle.

81
Cattle fed low quality roughages or grazing winter grasses have been shown to
improve their performance when provided with protein supplements. Barton et al. (1992)
reported improvement in utilization of intermediate wheat grass in terms of total organic
matter intake, higher ruminal ammonia and total volatile fatty acids (VFA) for steers
supplemented with cottonseed cake compared to the control steers. Similarly, Hannah et
al. (1991) reported an improvement in forage utilization for steers supplied with protein
supplements. Hennessy (1983) and Pitts et al. (1992) reported improvement in the rate of
weight gain for grazing cattle supplemented with protein sources. Hennessy (1983) used
a protein pellet composed of cotton seed cake (80%), meat (10%) and fish meal (10%).
Pitts et al. (1992) used cotton seed meal as the source of protein.
Drying thin stillage to produce dry distillers solubles (DDS) is an expensive
method of utilizing this product as a supplementary source of nutrients for cattle. One
alternative to drying would be to feed this product in liquid form close to the ethanol
plant. Growth of cattle on pasture is often limited by energy and protein supply. Often
available nutrients are insufficient to meet requirements. An attractive means of
supplementing thin stillage would be to make this product available to grazing cattle as a
replacement for water. No work has been done, however, on the feeding value of wheat
based thin stillage to grazing cattle that are in an active stage of growth. The objective of
this trial was to investigate the chemical composition of thin stillage from wheat based
ethanol production and its nutritive value for growing cattle grazing crested wheatgrass
pastures.

82
5.2 Materials and methods
5.2.1 Experimental animals and housing
Forty medium frame steers (265 ± 4.0 kg) were purchased from commercial
sources during May 1992. The steers were processed and housed at Termuende Research
Station at Lanigan, Saskatchewan. The steers were managed according to the guidelines
of the Canadian Council of Animal Care. The cattle were randomly assigned to 1 of 8
crested wheatgrass paddocks (2 ha each). Five cattle were assigned to each paddock. The
paddocks were then assigned to one of two dietary treatments. These included water or
thin stillage as a drinking source. Two adjacent pastures were allotted to the same
treatment since they shared one drinking trough. This enabled ten animals to drink from
the one trough.
5.2.2 Experimental diets and feeding protocol
Each 2 ha pasture of crested wheatgrass was grazed by five steers with access to
water or thin stillage. Thin stillage and water levels were monitored and the 1136 liter
troughs were refilled daily, to ensure that there was an ad libitum supply of fresh water
or thin stillage for each group of steers.
5.2.3 Data collection and analytical procedure
Fluid consumption of steers on each treatment was measured using a calibrated
meter rule. The amount of water or thin stillage in the trough before and after filling was
recorded daily. Dry matter and digestible energy intake from thin stillage were estimated
from daily consumption of thin stillage.

83
Daily weight gains were calculated from body weights taken at the start and at 14
day intervals throughout the test and at the end of test. Start of test and end of test
weights were the mean of two consecutive daily weights. Pasture samples were clipped
in all experimental pastures every 14 days and analyzed for crude protein (CP), acid
detergent (ADF) and neutral detergent (NDF) fiber, calcium (Ca) and phosphorus (P)
contents using AO AC procedures as outlined in Chapter 3. Ultrasound backfat
measurements were carried out at the start and end of trial, using the procedure outlined
in Chapter 3. Six samples of thin stillage were collected using two liter containers during
the trial, freeze dried and analyzed for CP, ADF, NDF, Ca and P using AOAC methods
outlined in Chapter 3.
5.2.4 Statistical Analysis
Results of the experiment were analyzed using the General Linear Model of
Statistical Analytical System (SAS) Inc. (1990). Mean comparison was accomplished
using a Student’s T-Test (Steel and Torrie 1980). For average daily gain (ADG) and
ultrasound data, the pasture with 5 animals was considered the experimental unit (N=8).
For fluid consumption, the experimental unit was the two adjacent pastures with access
to one drinking trough (N=4).
5.3 Results and Discussion
The analysis of thin stillage (Table 5.1) shows high CP (average 48.5 ± 1.83%)
and fat levels (9.63 ± 1.63%). Average CP and fat values for number one Canadian hard
spring wheat are 14.8 and 1.73%, respectively (Saskatchewan Feed Test Lab.). The

84
relatively high levels in thin stillage are a reflection of nutrient concentration during
fermentation and for CP in particular, the addition of yeast cells used for fermentation.
The fat value reported in this study is similar to that reported by Aines et al. (1986)
(9.0%) for corn dry distillers solubles and Ham et al. (1994) (9.2%) for thin stillage from
corn. Phosphorus levels in the present study were three times those of the original grains
(Table 4.2).
Acid and neutral detergent fiber values were 3.5 and 34.5%, respectively.
Additional energy would have been available from the fiber in thin stillage. The acid
detergent fiber (3.5%) is lower while the NDF (34.5%) is higher than that reported by
Huhtanen and Miettinen (1992) (6.0% ADF and 10% NDF) for wet distillers solubles
(WDS). Crude protein and fat contents were also lower in the Huhtanen and Miettinen
(1992) study relative to the present study. Their product was, however, based on corn
and not wheat as in the present study. The fat level in the present study was reflected in a
high energy value for thin stillage. The energy (DE) value of thin stillage was estimated
at 3.96 Meal kg’1 DM. This energy value was determined from the average proximate
analysis of the samples collected throughout the study. The regression equation of Bath
et al. (1986) was used to determine this value.
The nutritive value of CWG pastures declined throughout the trial (Figure 5.1).

Table 5.1 Analysis of thin stillage samples collected throughout the during grazing trial.
Nutrient2
Samplenumber
DM%
CP%
Fat%
ADF%
NDF%
Ash%
Ca%
P%
Mg%
Cuppm
Znppm
Mnppm
Feppm
1 8.52 49.40 9.47 3.26 28.60 8.38 0.30 1.12 0.62 12.80 54.30 94.30 481.80
2 9.10 50.50 12.80 2.88 38.80 8.52 0.40 1.21 0.62 13.00 73.80 118.40 617.60
3 8.12 47.20 9.07 3.41 33.40 6.86 0.29 1.10 0.66 13.00 71.20 101.10 316.90
4 8.01 50.20 8.86 4.10 37.20 6.71 0.31 1.12 0.64 12.00 74.30 108.20 402.00
5 8.51 45.80 9.55 3.04 - 8.57 0.45 0.98 0.70 10.20 73.50 108.30 388.90
6 8.30 48.00 8.06 3.63 - 8.88 0.46 0.99 0.70 10.50 69.10 100.30 377.40
Mean 8.42 48.50 9.63 3.39 34.49 7.99 0.37 1.09 0.66 11.90 69.40 105.10 430.70
' SDy 0.35 1.83 1.63 0.44 4.55 0.95 0.08 0.09 0.04 1.28 7.65 8.40 105.80
z Expressed as % of dry matter or parts per million (ppm DM basis). > SD = standard deviation.
r
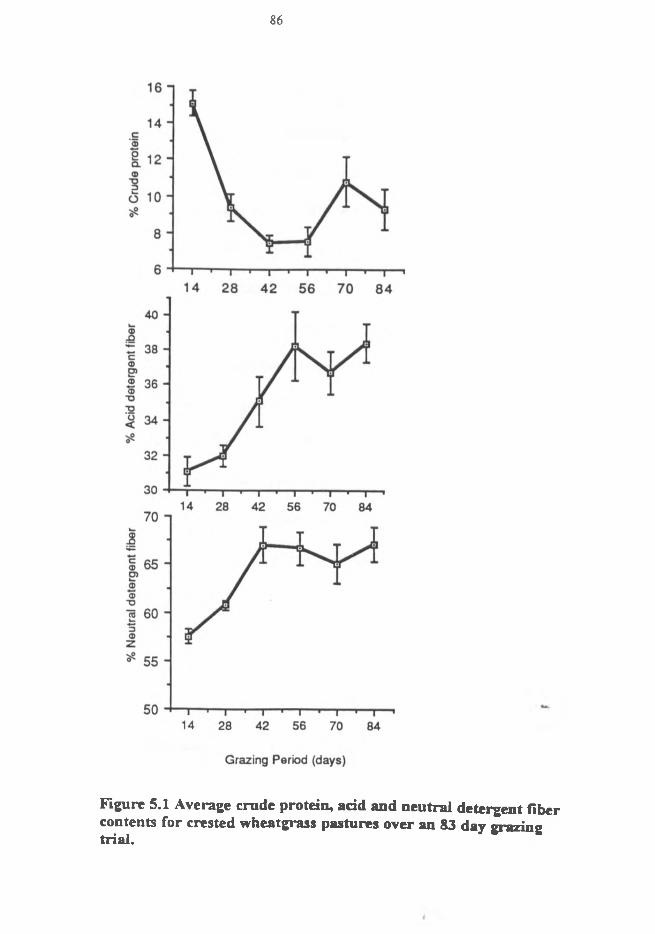
86
Figure 5.1 Average crude protein, add and neutral detergent fiber contents for crested wheatgrass pastures over an 83 day grazing trial.

87
The decline in the CP content combined with an increase in the levels of both ADF and
NDF (Figure 5.1) are indications of lower nutritional status of the CWG pasture towards
the end of the trial. Crude protein content decreased from 15% to 9% while ADF and
NDF both increased in content from 31% to 38% and 57% to 67%, respectively (Figure
5.1). In contrast Ca (0.43 to 0.48%) and P (0.21 to 0.12%) values stayed relatively
constant and did not show great variation throughout the trial. Similar seasonal declines
in plant nutrient composition have been reported for crested wheatgrass (Wright 1986;
McCaughey 1989). These workers attempted to minimize this decline in nutritive quality
of CWG as the pasture season progressed, by application of nitrogen fertilizer. Their
results showed that the application of N fertilizer to crested wheatgrass pastures
improved the status of the pasture and supported higher (P<0.05) growth rates in grazing
cattle. These results are encouraging because they show that effective management
practices can be used to improve the growth of cattle grazing CWG.
Table 5.2 shows that despite slightly lower start of test weights, cattle fed thin
stillage had higher (P<0.05) end of test weights. Consequently average daily gain over
the course of the trial was greater for cattle with access to thin stillage (1.39 versus 0.91
kg'1). Figure 5.2 illustrates that this improvement in performance was significant Trom
day 42 of the trial. At the start of test, fat depth as measured by ultrasound was zero for
both stillage and water fed cattle (Table 5.2). However, at the end of test, stillage
supplemented cattle had accumulated more fat (P < 0.05) (2.52 versus 0.60 mm) than the
water treatment group (Table 5.2).

88
Tabic 5.2 Performance of cattle grazing, crested wheatgrass pastures, with access to water or thin stillage.
P aram eter
Treatment
Water Stillage SEZ P < F
B ody w eight (kg)
Start 269.6 262.0 3.9 _
End 362.71* 402.0b 6.5 0.05Daily gain 0.9a 1.4h 0.1 0.05
U ltrasound f a t (mm)Start 0.0 0.0 - -End 0.6a 2.5b 0.3 0.05
F lu id in take (Liters d’1)
Actual 32.7a 44.8b 2.3 0.05Corrected for DM 32.7a 41.2b 2.3 0.05
N utrien t in take fro m stillage
DM (kg d ') 0.00a 3.58b 0.19 0.05DE (Meal d ')y 0.00a 14.181’ 0.19 0.05
a'b Means in rows with different superscripts differ P<0.05. z SE = standard error of the mean.y Estimated from the regression equation of Bath et al. 1986.

89
D a y s o f p a s tu re g ra z in g
F igure 5 .2 A verag e da ily gain (m ean ± S E M ) o f ca ttle w ith ac ces s to w a ter or th in s tillage (* = m eans d iffer P <0.05).

90
Fluid intake, both actual and DM corrected, was higher (P<0.05) for stillage fed cattle
(Table 5.2). Figure 5.3 shows that this response was evident from day 28 of the trial. The
estimated daily dry matter (DMI) and digestible energy (DEI) intake from the
consumption of thin stillage by steers was 3.58 kg of DM and 14.2 Meal of DE,
respectively (Table 5.2 and Figure 5.4).
Plasma concentration of blood metabolites is given in Table 5.3. Samples were
take on day 42, 56 and 70 of the trial. Blood urea nitrogen was higher (P<0.05) for
stillage supplemented cattle at each sampling period. Plasma creatinine levels of the
stillage fed cattle averaged 100 mmol L '1. This was lower (P<0.05) than that of the water
fed cattle (129 mmol L'1). These values while significantly different were within the
normal physiological range (Swanson 1982).
Blood urea nitrogen can be used as an indicator of dietary protein status. Cattle
fed diets that are deficient in crude protein have been shown to have low blood urea
nitrogen (BUN) levels (Lewis 1958). Blood urea levels are a reflection of the changes in
ammonia production in the rumen which is influenced by the level of dietary nitrogen. In
this study, the higher (P<0.05) BUN levels of the stillage fed cattle reflect the improved
nutritional status of these cattle, particularly with respect to protein intake. Huhtanen and
Miettinen (1992) also found that lactating dairy cows fed wet distillers solubles
exhibited a higher level of blood urea nitrogen.

Table 5.3 Plasma concentration of blood metabolites of cattle with access to water or thin stillage on crested wheatgrass.
Plasma metabolites (mmol/Liter)
Treatment Na K Cl Ca P Mg Urea Creatinine Glucose
Period 1 Day 42
Water 145.30 5.11 105.30 2.62a 2.92 0.81b 4.40b 137.10 4.80Stillage 145.50 5.06 106.80 2.48b 2.53 0.89a 7.81a 116.00 3.41SEZ 0.99 0.12 0.76 0.04 0.16 0.02 0.37 6.99 1.04
Period 2 Day 56
Water 143.90 4.81 105.90 2.51 2.80 0.94b 7.59b 123.00a 3.73Stillage 143.40 4.80 104.80 2.44 2.95 1.08a 8.85a 97.80b 3.80SEZ 0.83 0.11 0.80 0.04 0.06 0.03 0.35 6.37 0.24
Period 3 Day 70
Water 142.00 4.90 102.30 2.56a 2.30b 0.85b 5.41b 129.00a 3.35Stillage 141.60 4.80 102.30 2.42b 2.79a 1.05a 7.78a 88.50b 3.75SE1 0.88 0.09 0.71 0.04 0.08 0.04 0.30 6.69 0.26
a'b = means within a column and period differ (p < 0.05). z SE = standard error of the mean.
t

92
60
Days of pasturo grazing
F ig u re 5 .3 C u m u la t iv e f lu id In ta k e (L d*^ m e a n ± S D ) fo r c a t t le w ith a c c e s s to w a te r o r th in s t i l la g e (* s ig n if ic a n t d i f fe re n c e P < 0 .0 5 ) .

93
Days of pasture grazing
Figure 5.4 Dry matter (DMI kg d-*) and digestible energy (DEI Meal d'l) intake from consumption of stillage for cattle grazing crested wheat grass.

94
Plasma concentration of magnesium shows that cattle fed thin stillage had higher
(P<0.05) levels than the water group (Table 5.3). Values ranged from 0.89 to 1.05 mmol
L 1 for thin stillage fed cattle compared to 0.81 to 0.94 mmol L’1 for the water group.
The higher plasma magnesium with stillage feeding may benefit cattle that are
susceptible to grass tetany. Magnesium is a required nutrient and insufficient supply may
result in many metabolic problems. In particular, cattle in early lactation or growing
cattle grazing lush rapidly growing pastures can be susceptible to grass tetany. The most
constant and significant biochemical problem associated with this disease is
hypomagnesaemia (Blood et al. 1980). Thin stillage feeding which elevated plasma
magnesium levels in this study may benefit cattle that are susceptible to this disturbance.
Phosphorus levels for thin stillage fed cattle during the third sampling period were
higher (P<0.05) relative to the water group. In contrast, calcium levels were lower. Both
calcium and phosphorus are important nutrients for cattle since they both play important
metabolic roles in the body. Calcium is the mineral with the most physiological
functions in the animal’s body. It is used in bone formation, milk production,
transmission of nerve messages, regulation of cardiovascular activities, blood clotting,
enzymatic stabilization, nutrient transport and muscle excitement (NAS-NCR 1984). The
significance of the lower plasma calcium levels in this study due to thin stillage
supplementation is not clear. The actual difference while significant was small (2.56
versus 2.42 mmol L"1). Furthermore NAS-NCR (1984) state that plasma calcium levels
are not good indicators of calcium status.

95
Phosphorus like calcium has important metabolic and physiological roles for
normal function. It is involved in cell permeability, energy transfers in the body via high
energy adenosine triphosphate (ATP) bonds, activation of several B-vitamins to form
coenzymes and control of genetic material transfer between generations (NAS-NCR
1984). Many forages have been reported to contain low phosphorus contents (NAS-NCR
1984; Wright 1986). The presence of high iron levels in the ruminant diet may form
insoluble phosphate bonds that may result in phosphorus deficiency. Phosphorus
deficiency may result in decreased growth rates, inefficient feed utilization and a
depraved appetite (NAS-NCR 1984). Thin stillage supplementation may provide
supplemental phosphorus in the diet of grazing cattle.
The results of this study show that cattle grazing CWG with access to thin
stillage gained faster (P<0.05) and put on more body fat (P<0.05) than those on similar
pasture with access to water as a fluid source. The higher (P<0.05) plasma levels of urea
N, magnesium and phosphorus indicate that stillage supplemented cattle had an
improved nutritional status . The most likely explanation for this improved performance
and nutritional status is that thin stillage was a nutritional supplement for the cattle in
this trial. The declining nutritional quality of the CWG pasture (Figure 5.1) did not
supply sufficient nutrients to allow these cattle to gain to their genetic potential. In fact,
performance would indicate that the quantity and quality of grass available to these
animals was sufficient to support the animals maintenance needs and to allow for a daily
gain of only 0.91 kg d’1. There was insufficient energy available from the pasture to
allow for any fat deposition (Table 5.2). The NAS-NCR (1984) in fact recommend that

96
medium frame 300 kg cattle, consuming 7.2 kg of DM and gaining 1.0 kg d '1 consume
10.1 and 6 Meal of NEm and NEg, respectively. The NEm and NEg values for CWG in
the early vegetative stage are 1.79 and 1.16 Meal kg 1 DM, respectively. For full bloom
and post ripe CWG the respective values are 1.34 and 0.77 and 0.93 and 0.39 Meal kg'1
DM (NAS-NCR 1984). Animals consuming early vegetative CWG could get sufficient
energy to gain in excess of 1.0 kg d'1. Animals consuming CWG that has reached full
bloom would barely be able to meet maintenance needs and that for 1 kg per day gain.
Cattle grazing CWG that had nutritional characteristics similar to post ripe values would
not meet maintenance and production needs. Similar gains for cattle grazing CWG to/
that observed in this study have been noted by other workers who have grazed cattle on
CWG pasture. McCaughey (1989) reported an ADG of 0.96 kg d’1 which is close to that
observed in the present study. Wright (1986) reported lower ADG (0.58-0.78 kg d '1) for
cattle grazed CWG pasture than those observed in the present study. These workers
found that management of CWG pastures by N fertilization improved quality of the
pasture and cattle performance. McCaughey (1989) found a 43% increase in productivity
for animals grazing CWG N fertilized pastures than those grazing the control pastures.
Similarly Wright (1986) reported a positive relationship between N fertilizer application
and higher CP content of CWG than control pastures. This high CP content improved
the performance of animals.
The cattle with access to thin stillage in this trial consumed 3.58 kg d '1 of DM on
average from thin stillage in addition to the DM intake from pasture. This would supply
an additional 3.96 Meal kg d"1 DE. Furthermore, the high crude protein content
97
(48.5%) of this product (Table 5.1) would indicate that the animals would consume an
average of 1.92 kg d'1 of CP. The supplemental energy and protein from thin stillage
would be used for maintenance and productive functions and can explain the extra 0.4 kg
per d '1 daily gain observed over the course of the trial by stillage fed cattle. The fact that
stillage supplemented the nutrient intake from CWG is supported by the bi-weekly daily
gains shown in Figure 5.2. There were no significant differences in average daily gain
until day 42. As seen from Figure 5.3, this period was when differences in fluid intake
were readily apparent between the two groups of cattle and was also a period when the
CWG was at its lowest (Figure 5.1) nutritional quality (low protein, high fiber). The
most likely explanation for the improved performance is that thin stillage supplemented
the nutrient intake of the cattle, allowing for greater weight gains and in fact, for fat
deposition (Table 5.2).
An alternative explanation that may also explain part of the improvement in
performance may be related to alterations in rumen pH due to stillage consumption.
Reduced rumen pH has been documented to induce changes in the type of rumen
microbes that dominate the fermentation process (Kaufmann et al. 1980; Mackie et al.
1978). Low rumen pH will induce an increase in the number of amylolytic and acid
tolerant bacteria and decrease the number of the cellulolytic bacteria. This change in
microbial population alters the fermentation pattern of VFA’s such that propionate is the
dominant VFA (Kaufmann et al. 1980; Mackie et al. 1978). Higher propionate
production in the rumen would result in more efficient utilization of energy for gain.
Several workers have reported lower rumen pH values and higher propionate in ruminal
98
fluids after infusion of stillage into the rumen (Ham et al. 1994; Huhtanen and Miettinen
1992). Ham et al. (1994) associated the low rumen pH and altered VFA concentration to
thin stillage. In this study the average pH of stillage was 4.5. The cattle drank on
average, 44.8 L d'1. This level of intake may have reduced rumen pH and altered the
production of VFA in the rumen. Higher ruminal propionate production would increase
the supply of glucose precursors to the liver and thus for hepatic gluconeogenesis
(Brockman and Laarveld 1986). Glucose is the basic energy unit required by animals for
energy metabolism. The availability of glucose precursors for gluconeogenesis would
improve energy status and reduce the need for amino acids as sources of energy. The
improved energy status and the fact that more amino acids are available for tissue
development could help explain the higher growth rates for stillage supplemented cattle.
This hypothesis is supported to some extent by plasma glucose levels (Table 5.3).
Although not significantly different, stillage supplemented cattle had numerically higher
blood glucose levels at the end of the trial (3.75 versus 3.35 mmol L"1).
The results of this trial indicate that thin stillage from wheat based ethanol
production is an excellent source of energy and protein which may be successfully
utilized to improve the nutritional status of grazing cattle. Supplementation will lead to
improved energy and protein intake for cattle grazing crested wheatgrass pastures and
therefore to improved growth.

99
5.4 Conclusion
Thin stillage from wheat-based ethanol production is an excellent source of
protein and energy for growing cattle grazing on crested wheatgrass pastures.
Performance assessed through daily gains, fat deposition and plasma metabolites
improved when supplemented with thin stillage. It would appear that nutrients from thin
stillage supplemented the intake of nutrients from the crested wheatgrass. This
supplementation was particularly important during the latter half of the grazing season as
pasture quality declined. However, due to the high moisture content, thin stillage feeding
of cattle on pasture is only feasible for producers located near ethanol distillation plants.
Proximity to ethanol plants would make it possible to feed stillage and cut down on the
costs of transportation.

100
6.0 General Discussion and Conclusions.
Wet distillers grains and thin stillage are by-products of ethanol production from
cereal grains. Steps involved in the process include enzymatic hydrolysis, fermentation
and distillation. The main effect of fermentation is breakdown and conversion of starch
to sugars and eventual conversion to alcohol. This results in a concentration of the
remaining nutrients in the solids. This process converts the cereal grain from a high
energy feed to a high protein byproduct relatively high in fiber (Berger 1981). Distillers
grains are high in protein, fat (energy), minerals and vitamins (Hatch 1993a). The
distillation process also concentrates yeast hence increasing the quantity of vitamins,
particularly the B-complex (Hatch 1993a). The high energy content of distillers by
products results from its digestible fiber and high fat content. Distillers grains are
separated from whole stillage through screens or centrifugation.
Thin stillage is the term used to define the liquid recovered following removal of
the distillers grains. It contains 4 to 10% DM in the form of highly digestible small,
suspended and dissolved particles of grain, yeast cells and other soluble nutrients (Aines
et al. 1986; Hanke and Lindor 1982; Ham et al. 1994). When fed together they referred
to as distillers grains with solubles. Numerous trials have shown that distillers dried
grains with or without solubles can replace conventional protein sources such as soybean
meal in rations of dairy and beef cattle (Distillers Feed Research Council 1982). Early
use of distillers grains or thin stillage mainly involved the dry product derived from corn
grain. In diets containing a combination of rumen degradable and non-degradable protein
sources such as urea and distillers grains, it has been reported that the additive nature of

101
these two protein sources led to improved performance of cattle. Waller et al. (1980)
reported improved efficiency of protein utilization for cattle fed a combination of urea
and milo DDG. The improved protein utilization was reflected in higher weight gains for
steers fed the combination of milo DDG-urea compared to SBM-urea control cattle
(Waller et al. 1980). Recent studies indicate that feeding the wet products was cheaper
and as effective (Abrams et al. 1983; Ham et al. 1994). Corn wet distillers grains have
been reported to provide cattle with higher weight gains, better protein efficiencies and
improved feed conversions relative to the dried products (DeHaan et al. 1982).
Research to determine the feeding value of distillers by-products for ruminants
has been conducted for several decades, however, most of the research work has
involved the use of corn or sorghum distillers feeds. Limited research carried out on the
value of wheat distillers by-products suggests that they have similar feeding values to
corn or sorghum (Heinemann 1986; Boila and Ingalls 1994). Distillers grains used in
high roughage diets for growing calves, can help meet protein and energy requirements
for these animals ( Abrams et al. 1983; Muntifering et al. 1985).
Brewers grains have also been utilized as feed ingredients in ruminant diets.•*»
Brewers grains are by-products of fermentation of barley malt, corn grits or rice for the
production of beer. Brewers dried grains are palatable and high in protein. They have
been successfully incorporated into dairy and beef cattle rations (Bath et al. 1986).
Brewers grains deliver more protein and DM to the duodenum than isonitrogenous
amounts of SBM (Armentano et al. 1986). Armentano et al. (1986) also reported WBG
as intermediate (when fed at 16% of the ration for lactating dairy cattle) to brewers dried
102
grains and SBM. Brewers grains may be used to substitute part of the concentrate
mixture in the ration due to available energy of this byproduct (Bath et al. 1986). They
may be used as 25% of the total DM of a dairy and 15 to 20% of DM of a feedlot ration
(Bath et al. 1986). This may be attributed to the high protein and energy content of
brewers grains which contain about 80% of the energy value in barley grain and 20 to
25% crude protein (Bath et al. 1986).
In situ dry matter disappearance from wet brewers grains used in the present
study was lower (P<0.05) than from WDG (47% versus 53% respectively). Unpublished
data collected after this trial in this Department shows similar dry matter disappearance
values to that reported in this study (Mustafa et al. unpublished data). The values for
DMD reported in the present study are comparable to values reported elsewhere for
canola meal and SMB (Deacon et al. 1988; McKinnon et al. 1991; Ham et al. 1994).
These workers reported DMD highest for SBM and lowest for CGM with canola meal
intermediate to the two feeds. Armentano et al. (1986) reported similar DMD values for
WBG to those observed in the present study, however, examining RUP flow to the
duodenum (Armentano et al. 1986) indicated higher values for WBG compared to SBM.
The results of the present trial indicate that wheat based wet distillers grains
(WDG) have similar effective crude protein degradability (ECPD) as soybean meal and
canola meal. The ECPD in the present trial was 67%. This is in the same range as 68%
and 71% reported for canola meal and SBM, respectively (Santos et al. 1984; Abrams et
al. 1983; Ham et al. 1994; Mustafa et al. unpublished data). This implies that the feeding
103
of WDG to feedlot cattle would supply equivalent RUP to canola meal or SBM. Wet
brewers grains provided slightly higher RUP than the values observed for WDG. The
effective crude protein degradability value for WBG (61%) while not statistically
different was 9% lower than WDG (67%).
Examination of the data collected during the feedlot trial indicates that feed
conversions during the growing period were not different across treatments, however,
WBG fed cattle had good conversions (P<0.10) compared to the WDG and the control
fed cattle. Cumulative bi-weekly weight gains showed superior performance for the
WDG fed cattle relative to control cattle for days 1 to 56 through 1 to 70. A possible
explanation to the superior performance during this period may be due to the higher
EDMD of WDG compared to WBG reported in Chapter 4 (Table 4.3). Dry matter intake
during this period although not statistically significant (P<0.05) appeared lower for
WBG compared to WDG and control diets.
During the finishing period the control fed cattle gained faster (P<0.05) than the
WBG fed cattle. Wet distillers grains fed cattle were intermediate. It was found that
weight gains of the control fed cattle (P<0.03) from day 85 to 113 and WDG fed cattle
from day 85 to 127 onward (P<0.08) gained faster than the WBG fed cattle. This was
compounded by the low EDMD of WBG (47%) which may have contributed less
available energy for the animals (Table 4.3). Control fed cattle may have benefited from
compensatory growth having performed relatively poor compared to WBG and WDG
fed cattle during the growing period. The level of WBG grains used in this trial was

104
within the recommended range of 30 to 40% of the ration for lactating dairy cattle diets
(Davis et al. 1983). Corn wet distillers grains have been included in lactating dairy cattle
diets at 22% of the ration DM (Schingoethe et al. 1983). Ham et al. (1994) used corn wet
distillers grains at 40% of the ration DM in a steer metabolism trial. Results of the
present trial show that inclusion of WBG at 44% and WDG at 32% (as fed) during the
growing period were equally successful compared to other standard feedlot ingredients
and they may be used to replace other conventional supplements used in feedlot rations
during the growing period.
The results of the present study indicated that thin stillage from wheat based
ethanol production improved performance of growing cattle grazing crested wheat grass.
When compared to water fed cattle the stillage fed cattle in the present trial benefited
from increased nutrient intake through the consumption of thin stillage. The improved
performance was reflected in a faster (P<0.05) rate of gain and more fat deposition at the
end of test. Analysis of thin stillage used in the present trial indicates high protein (48%)
and fat (9.6%) levels (Table 5.1). These high values make the byproduct a useful source
of nutrients for growing cattle. The energy value in thin stillage estimated at 3.96 Meal
kg’1, provided stillage fed cattle with additional energy to sustain a higher level of
performance throughout the trial. The additional energy from thin stillage consumption
was estimated as 14.2 Meal d'1 for cattle that consumed an average of 44.5 L d’1.
Additional energy may have been derived from the highly digestible fiber available in
stillage. The improvement in performance was reflected in higher (P<0.05) ADG and fat
deposition throughout the course of the trial for stillage fed cattle. The extra 0.4 kg d'

105
gain for cattle fed thin stillage over those on water is an indication that this byproduct
provided cattle with additional nutrients. Fat deposition was also higher for stillage fed
cattle (2.5 versus 0.6 mm d'1) compared to the water group. Another explanation for the
higher performance for stillage fed cattle is the high rumen outflow rate associated with
liquid feeds. The high rumen outflow rate may have reduced rumen microbial
degradation of the nutrients in stillage and made them available for post ruminal
digestion. Stillage also provided cattle with essential minerals such as calcium,
phosphorus and magnesium. The analyzed value for magnesium (0.66%) in thin stillage
(Table 5.1) was within the recommended range (0.05 to 0.25%) for medium framed
steers gaining 1.0 kg d'1 (NAS-NCR 1984). Previous work has indicated that thin stillage
from corn based ethanol production can be successfully used to improve performance of
growing and finishing cattle (Berger 1981; Hanke et al. 1982 and Ham et al. 1994). In
the present study, declining nutritional status of CWG pastures was evident. These
included a reduced crude protein content (15% to 9%) and increases in both ADF (31 to
38%) and NDF (57 to 67%). The apparent decline in nutrient quality may have
contributed to the poorer performance of the water fed cattle.
Feeding of wet distillers by-products and WBG to growing cattle has shown that
both by-products are palatable and that carcasses from these cattle meet acceptable
carcass classification characteristics. In this study these treatments compared favorably
with the control diet. This is an indication that no detrimental effects result from feeding
WBG or WDG supplements in feedlot cattle diets. Wet distillers grains and WBG can be
used to replace part of the concentrate portion of the ration in growing and finishing

106
cattle. Due to the high moisture content, WBG and WDG should be fed in diets at levels
that do not result in a reduction in dry matter intake. No health problems were
encountered in animals fed WBG or WDG diets. Whenever it is feasible, thin stillage
can be utilized as a source of nutrients for growing cattle. The limitation to the
widespread use of these products may be their high water content.

107
7.0. Literature cited
Abrams, S.M., Klopfenstein, T.J. Stock, R.A., Britton, R.A. and Nelson, M.L. 1983Preservation of wet distillers grains and its value as a protein source for growing ruminants. J. Anim. Sci. 57(3):729-738.
ARC 1984. Report of the protein group of the agricultural research council working party on the nutritional requirements of ruminants. Commonwealth Agric. Bur. Slough England.
Aines, G., Klopfenstein, T. and Stock, R. 1986. Distillers grains. The Agricultural Research Division, Institute of Agricultural and National Resources University of Nebraska Lincoln.
Anderson, S.J., Klopfenstein, T. J. and Wilkerson, V.A. 1988. Escape protein supplementation of yearling steers grazing smooth brome pastures. J. Anim. Sci. 66:237. 242.
Armentano, J.H., Herrington, R.A., Polan, C.E., Moe, A.J., Herbein, J.H. and Umstadt, P. 1986. Ruminal degradation of dried brewers grains, wet brewers grains and soybean meal. J. Dairy. Sci. 69:2124-2133.
Armstrong, D.G. and Hutton, K. 1975. Digestion and metabolism in the rumen. In; The ruminant animal, Digestive physiology and nutrition D.C. Church ed. Prentice Hall Englewood Cliffs, New Jersey 1988.
Association of Official Analytical Chemists. 1984. Official methods of analysis A.O.A.C. Washington, D.C.
Barton R.K., Krysl, L.J., Judkins M.B., Holcombe, D.W., Gunter, S.A. and Beam, S.W. 1992. Time of daily supplementation for steers grazing dormant intermediate wheat grass pasture. J. Anim. Sci. 70:547-558.
Bath, D., Dunbur, J., King, J. Steven, B., Leonard, R.O. and Olbrich, S.~1986.composition of unusual feeds. Feedstuff July 23 58:32.
Beeson, W.M. 1975. Evaluation of condensed distillers solubles for liquid cattle supplements. Distillers. Conf. Proc. 30:14
Beyla, R.L., Steevens, B.J., Restrepo, R.J. and Clubb A.P. 1989. Variation in composition of byproduct feeds. J Anim Sci. 2339-2345.
Bergen, W.G., Purser, B.D. and Cline, J.H. 1967. Enzymatic determination of the protein quality of individual rumen bacteria. J. Nutr. 92:357-364.

108
Bergen, W.G., Purser, B.D. and Cline, J.H. 1968. Effect of ration on the nutritive quality of rumen bacterial protein. J. Anim. Sci. 27:1497-1501.
Berger, L.L. 1981. Nutritional value of distillers feeds for livestock. Dept, of Animal Science, University of Illinois, Urbana 61801. (Unpublished data).
Blood, D.C., Henderson J.A., Radostist, O.M., Arundel, J.H. and Gray C.C. 1980.Veterinary Medicine: A text book of diseases of cattle sheep pigs and horses. 35 Red Lion Square London WCIR 45G.
Boila, R.J. and Ingalls, J.R. 1994. The ruminal degradation of dry matter, nitrogen and amino acids in wheat-based distillers dried grains in sacco. Anim. Feed Sci. Tech. 48:57- 72.
Borroughs, W., Nelson, D.K. and Mertens, D.R. 1974. Evaluation of protein nutrition by metabolizable protein and urea fermentation potential. J. Dairy. Sci. 58(4): 611-619.
Borroughs, W., Nelson, D.K. and Mertens, D.R. 1975. Protein physiology and its application in the lactating cow: metabolizable protein feeding standard. J. Dairy. Sci. 41(3):933-944.
Botts, R.L., Hemken, R.W. and Bull, L.S. 1979. Protein reserves in the lactating dairy cow. J. Dairy. Sci. 62:433-440.
Brockman, R.P. and Laarveld, B. 1986. Hormonal regulation of metabolism in ruminants: a review. Livest. Prod. Sci. 14(4):313-334.
Broderick, G.A. 1978. In vitro procedures of estimating rates of ruminal protein degradation and proportions of protein escaping the rumen undegraded. J. Nutr. 108(2): 181-190.
Broster, W.H. 1972. Protein-energy interrelationships in growth and lactation of cattle and sheep. Proc. Nutr. Soc. 32:115.
Brown , W.F. 1983. Computer simulations of animal and plant growth and their interactions in a grazing situation. Ph. D. dissertation University of Nebraska, Lincoln Nebraska, USA.
Bryant, M.P. and Robinson, I.M. 1962. Some nutritional characteristics of predominant cultureable ruminal bacteria. J. Bacteriol. 84:605.
Campling, R.C. 1991. Processing cereal grains for cattle: a review. Livest. Prod. Sci. 28:223-234.

109
Cecava, M.J., Merchen, N.R., Berger, L.L. and Fahey, G.C. Jr. 1990. Intestinal supply of amino acids in sheep fed alkaline hydrogen peroxide-treated wheat straw- based diets supplemented with soybean meal or combinations of corn gluten meal and blood meal. J Anim Sci. 68:467-477.
Cecava, M.J., Merchen, N.R., Berger, L.L Mackie, R.I. and Fahey, G.C Jr. 1991.Effects of dietary energy level and protein source on nutrient digestion and ruminal nitrogen metabolism in steers. J. Anim. Sci. 69:2230-2243.
Cerneau, P. and Michalet-Doreau 1991. In situ starch degradation of different feeds in the rumen. Reprod. Nutr. Devel. 31:65-72.
Chalupa, W. 1972. Metabolic aspects of non-protein nitrogen utilization in ruminant animals. Fed. Proc. 31:1152 (as quoted by Chalupa 1974)
Chalupa, W. 1974. Rumen bypass and protection of protein and amino acids. J. Dairy. Sci. 58(8): 1198-1218.
Chalupa, W. 1984. Discussion of protein symposium. J. Dairy. Sci. 67:1134-1146.
Chandler, P. 1989. Achievement of optimum amino acid balance possible. Feedstuffs June 26 pp 13-14.
Chen, M.C., Beeson, W.M., Perry, T.W. and Mohler, M.T. 1977. Effects of varying levels of processed distillers solubles and distillers dried grains on nitrogen and energy metabolism of beef steers. J. Anim. Sci. 44:859-866.
Christensen, D.A. and McKinnon, J.J. 1993. Canola meal for beef and dairy cattle. In Canola meal: Feed Industry Guide pages 21-27 ed. D. Hickling for Canola Council of Canada.
Clark, J.H. 1974. Lactational responses to postruminal administration of proteins and amino acids. J. Dairy. Sci. 58(8): 1178-1197.
Clark, J.H., Klusmeyer, T.H. and Cameron, M.R. 1992. Symposium: Nitrogen metabolism and amino acid nutrition in dairy cattle. Microbial protein synthesis and flows of nitrogen fractions to the duodenum of dairy cows. J. Dairy. Sci. 75:2304-2323.
Cleale, R.M. IV, Klopfenstein, T.J., Britton, R.A., Satterlee, L.D. and Lowry, S.R. 1987a. Induced non-enzymatic browning of SBM. I. Effects of factors controlling non- enzymatic browning on in vitro ammonia release. J. Anim. Sci. 65:1312-1318.
Cleale, R.M. IV, Britton, R.A., Klopfenstein, T.J., Bauer, M.L., Harmon, D.L. and Satterlee, L.D. 1987b. Induced non-enzymatic browning of SBM. II. Ruminal escapeand net portal absorption of SBM treated with xylose. J. Anim. Sci. 65:1319-1326./
Coleman, G.S. 1980. Rumen ciliate protozoa. Adv. Parasitol. 18:121.

110
Coleman, G.S. 1975. Page 149. in Digestion and metabolism in the ruminant. The interrelationship between rumen ciliate protozoa and bacteria. I.W. McDonald and A.I.C. Warner, ed. Univ New England Pub Unit, Armidale, Australia.
Cozzi, G. and Polan, C.E. 1994. Corn gluten meal or brewers dried grains as partial replacement for soybean meal in the diet of Holstein cows. J. Dairy Sci. 77:825-834.
Czerkawski, J.W. and Breckenridge, G. 1977. Design and development of a long-term rumen simulation technique. Br. J. Nutr. 38(3):371 -384.
Davis, C.L., Grenawalt, D.A., and McCoy, G.C. 1983. Feeding value of pressed brewers grains for lactating dairy cows. J Dairy Sci 66:73-79.
Deacon, M.A., De Boer, G. and Kennedy, J.J. 1988. Influence of Jet-sploding and extrusion on ruminal and intestinal disappearance of canola and soybeans. J. Dairy Sci. 66: 492-504.
DeHaan, K., Klopfenstein, T.J., Stock, R., Abrams, S and Britton, R.A. 1982. Wetdistillers by-products for growing ruminants. Beef cattle report pp 33-35. Nebraska Agricultural Experimental Station University of Nebraska, Lincoln, NE.
Delcurtoo, T., Cochran, R.C., Harmon, D.L., Beharka. A.A., Jaques, K.A., Towne, G. and Vanzant, E.S. 1990. Supplementation of dormant, tall-prairie forage: Influence of varying supplemental protein and (or) energy levels on forage utilization characteristics of beef steers in confinement. J. Anim. Sci. 68:515-531.
Distillers Feed Research Council 1982. Distillers feeds research. Cincinnati, Ohio.
Donaldson, R.S., McCann, M.A., Amos, H.E. and Hoveland, C.S. 1991. Protein and fiber digestion by steers grazing winter annuals and supplemented with ruminal escape protein. J. Anim. Sci. 69:3067-3071.
Egan, A.R. 1980. Host animal-rumen relationships. Proc. Nutr. Soc. 39:79.
Egan, A.R. and Doyle, P.T. 1985. Effects of intraruminal infusion of urea on the response in voluntary food intake by sheep. Aust. J. Agric. Res. 36:483-495.
Ensminger, M.E., Oldfield, J.E. and Heinemann, W.W. 1990. Feeds and nutrition digest. Ensminger Pub. Co. Covis California, USA.
Erdman, R.A., Vandersall, J.H., Russek-Cohen, E. And Switalski, G. 1987.Simultaneous measures of rates of ruminal digestion and passage for prediction of ruminal nitrogen and dry matter digestion in lactating dairy cows. J. Anim. Sci. 64:565- 577.
/Farlin, S.D. 1981. Wet distillers grains for finishing cattle. Anim Nutr. Health 36:35.

I l l
Firkins, J.L., Berger, L.L., Fahey, G.C. Jr. and Merchen, N.R. 1984. Ruminal nitrogen degradability and escape of wet and dry distillers grains and wet and dry com gluten feeds. J. Dairy Sci. 67:1936-1944.
Firkins, J.L., Berger, L.L. and Fahey, G.C. Jr. 1985. Evaluation of wet and drydistillers grains and wet and dry com gluten feeds for ruminants. J. Anim. Sci. 60(3):847-860.
Firkins, J.L., Berger, L.L., Merchen, N.R. and Fahey, G.C. Jr. 1986 Effects of particle size, level of feed intake and supplemental protein degradability on microbial protein synthesis and site of nutrient digestion in steers. J. Anim. Sci. 62:1081-1094.
Fox, D.G. and Barry, M.C. 1994. Predicting cattle net energy and protein requirements and supply under widely varying conditions. In Livestock production for the 21s* century: Priorities and research needs, ed. P.A. Thacker. 1994.
Fox, D.G., Sniffen, C.J. O’Connor, J.D., Russell, J.B. and Van Soest, P.J. 1992. Anet carbohydrate and protein system for evaluating cattle diets: III. Cattle requirements and diet adequacy. J. Anim. Sci. 70:3578-3596.
Gibb, D.J., Klopfcnstein, T.J., Britton, R.A. and Lewis, A.J. 1992 Plasma amino acid response to graded levels of escape protein. J. Anim. Sci. 70:2885-2892.
Goering, H.K. and Van Soest, P.J. 1970. Forage fiber analysis. Agricultural handbook No.379. USDA.
Grenawalt, D.A., McCoy, G.C. and Davis, C.L. 1981. Performance of lactating dairy cows fed rations containing varying amounts of pressed brewers grains. J. Dairy Sci. 64 (suppl. 1): 116 (abstract).
Ha, J.K., Kennelly, J.J and Berzins, R. 1986. Effect of dietary nitrogen source on microbial protein synthesis, dietary protein degradation and nutrient digestion in steers. Anim. Feed. Sci. Tech. 14:117-126.
Hale, W.H., 1973. Influence of processing on the utilization of grains (starch ) by ruminants. J. Anim. Sci. 37(4): 1075-81.
Ham, G.A, Stock, R.A., Klopfcnstein, T.J, Larson, E.M., Shain, D.H. and Huffman, R.P., 1994. Wet corn distillers by-products compared with dried corn distillers grains with solubles as a source of protein and energy for ruminants. J. Anim. Sci. 72:3246- 3257.
Hannah, S.M., Cochran, R.C., Vanzant, E.S. and Harmon, D.L. 1991. Influence of protein supplementation on site and extend of digestion, forage intake and nutrient flow characteristics in steers consuming dormant bluestem-range forage. J. Anim. Sci. 69:2624-2633.

112
Hankc, H.E., Lindor, L.K. and Smith R.E. 1982. Influence of feeding thin stillage as a replacement for water on feedlot performance of yearling steers. Minnesota Beef Report. B-288:23-27.
Hanke, H.E. and Lindor, L.K. 1982. Pressed distillers grains in diets of finishing yearling steers. Minnesota Beef Report. B-289:28-35.
Hatch, R.H. 1993a. Use of distillers grain, like any feed, requires understanding. May 17 Feedstuffs-17.
Hatch, R.H. 1993b. Distillers feeds and grains are good sources of feed, protein Feedstuffs August, 16 vol. 14.
Heinemann, W.W. 1986. Dried distillers grains of hard spring wheat in finishing diet for steers. Research Bulletin XB. 0975, Agriculture Research Center, Washington State University.
Hennessy, D.W. 1983. Improved production from grazing cattle when given protein. S. Afr. J. Anim. Sci. 13(1):9-11.
Hennessy, D.W. and Nolan J.V. 1988. Nitrogen kinetics in cattle fed a mature subtropical grass hay with and without protein supplementation. Aust. J. Agric. Res. 39: 1135-50.
Hennessy, D.W. and Williamson, P.J. 1990. Feed intake and live weight of cattle on subtropical native pasture hays. II. The effect of urea and maize flour or protected- casein. Aust. J. Agric. Res. 41:1197-85
Hennessy, D.W., Lee, G.T. and Williamson P.J. 1983. Nitrogen loss from protein meals held in terylene bags in the rumen of cattle and the nutritive value of the residues Aust. J. Agric. Res. 34:453-671.
Hespell, R.B. and Bryant, M.P. 1979. Efficiency of rumen microbial growth: influence of some theoretical and experimental factors on YAXP . J. Anim. Sci. 49:1640-1659. -
Hoover, W.H. and Stokes, S.R. 1991. Balancing carbohydrates and proteins for optimum rumen microbial yield. J. Dairy Sci. 74:3630-3644.
Huber, J.T. and Kung, L. Jr. 1981. Protein and non protein nitrogen in dairy cattle. J. Dairy Sci. 64:1170-1195.
Huber, J.T. and Thomas, J.W. 1971. Urea treated corn silage in low protein rations for lactating cows. J. Dairy Sci. 54:224-230.
Huhtanen, P. and Miettinen, H. 1992. Milk production and concentration of blood metabolites as influenced by the level of wet distillers solubles ifi dairy cows receiving grass silage-based diet. Agric. Sci. Finl. 1:279-290.

113
Hungate 1966. The rumen and its microbes. Acad. Press New York, NY USA.
Jacobson, D.R., Barnett, J.W., Carr, S.B. and Hatton, H. 1967. Voluntary feed intake , milk production, rumen content, and plasma-free amino acid levels of lactating cows on low sulfur and sulfur supplemented diets. J. Dairy Sci. 50:1248-1254.
Johnson B.C., Hamiliton, T.S., Robinson W.B. and Gavey, J.C. 1944. On themechanism of non-protein nitrogen utilization by ruminants. J. Anim. Sci. 3:287-298
Kaufmann, W., Hagemcister, H. and Dirksen, G. 1980. Adaptation to changes in dietary composition, level and frequency of feeding. Pages 587-602 In Y. Ruchebusch and P Thivend ed. Digestive physiology and metabolism in ruminants. MTP Press Falcon House, Lancaster, England.
Kennedy, J.J. and De Boer, G. 1986. Ruminal and Intestinal disappearance of whole canola seed as influenced by Jet sploding temperature. Page 82 in 65 Annual Feeders’ Day Report Univ. Alberta Edmonton, AB, Canada.
Kennedy, J.J. and Khorasani, G.R. 1993. Enhancement of the nutritive value of canola protein by acid treatment. 10th Project report Research on canola meal pp 101- 129.
Kennedy, J.J., Khorasani, G.R., Robinson, P.H. and de Boer, G. 1993. Effect of Jet- sploding and extrusion on the nutritive value of canola meal and whole canola seed for dairy cattle. 10th Project report Research on canola meal pp 130-140.
Khorasani, G.R., Robinson, P.H. and Kennedy, J.J. 1989. Effect of chemical treatment on in vitro and in situ degradation of canola meal protein. J. Dairy Sci. 72:2074-2080
Khorasani, G.R., Robinson, P.H., De Boer, G. and Kennedy, J.J. 1991. Influence of canola fat on yield, fat percentage, fatty acid profile and nitrogen fraction in Holstein milk. J. Dairy Sci. 74: 1904-1911.
Larson, D.A., Diallo, M, Goodrich, R.D. and Meiske, J.C. 1982a. Chemical analysis of ethanol plant by-products. Minnesota Beef Research report B289.
Larson, D.A., Diallo, M, Goodrich, R.D. and Meiske, J.C. 1982b. Chemical preservation of wet distillers pressed grains. Minnesota Beef Research report B-290.
Lee, W.J., Sosulski, F.W. and Sokhansanj, S. 1991. Yield and composition of soluble and insoluble fractions from corn and wheat stillages. Cereal Chem. 68(5): 559-562.
Leibholz, J. and Kellaway, R.C. 1979. Amino acid requirements for microbial protein synthesis. Ann. Rech. Vet 10:274.

114
Leng, R.A. and Nolan, J.V. 1984. Symposium: Protein nutrition of the lactating dairy cow. Nitrogen metabolism in the rumen. J. Dairy Sci. 67:1072-1089.
Lewis D. 1958. Blood-Urea concentration in relation to protein utilization in the ruminant. J. Agric. Sci. 48:438-446.
Little, C.O., Mitchell, G.E., Jr. and Bradley, N.W. 1964. Rumen stimulatory factors in com distillers dried solubles. Dist. Feed Res. Conf. Proc. 19:43
Little, C.O., Mitchell, G.E. Jr. and Potter, G.D. 1968. Nitrogen in the abomasum of wethers fed different protein sources. J. Anim. Sci. 27:1722. (As quoted by Aines et al. 1986)
Little, C.O., Potter, G.D. and Amos, H.E. 1970. Distillers feeds - Stimulants of rumen digestion. Dist. Feed. Conf. Proc. 25:41.
Loosli, J.K. and Warner, G.R. 1958. Distillers grains, brewers grains and urea as protein supplements for dairy rations. J. Dairy. Sci. 41:1446.
Loosli, J.K., Elliot, J.M. and Warner, G.R. 1960. Comparative value of corn distillers dried grains with solubles, soybean oil meal and linseed oil meal as for milk production. J. Dairy. Sci. 43:816-820.
Loosli, J.K., Warner, G.R. and Hintz, H.F. 1961. Value of corn distillers dried grains , soybean oil meal, heated soybeans and soybean oil meal plus starch for milk production. J. Dairy. Sci. 43:1910-1914.
Mackie, R.J., Gilchrist, M.C., Roberts, A.M., Hannah, P.E. and Swartz, H.M. 1978.Microbiological and chemical changes in the rumen during a stepwise adaptation of sheep to high concentrate diets. J. Agric. Sci. Camb. 90:124-254.
Mantysaari, P.E., Sniffen, C.J. and Muscato, T.V. 1989. Performance of cows in early lactation fed isonitrogenous diets containing soybean meal or animal by-product meals. J. Dairy. Sci. 72(2):2958-2967. -
McAllister, T.A., Rode, L.M., Major, D.J., Cheng, K.J. and Buchnan-Smith, J.G. 1990. Effect of ruminal microbial colonization on cereal grain digestion. Can. J. Anim. Sci. 70:571-579.
McCarthy, R.D. Jr., Klusmeyer, T.H., Vicini, J.L., Clark, J. H. and Nelson, D.R. 1989 Effects of source of protein and carbohydrate on ruminal fermentation and passage of nutrients to the small intestines of lactating dairy cows. J. Dairy. Sci. 72:2002-2016.
McCaughey, W.P. 1989. Management of pastures using plant growth regulators and nitrogen fertilizer. Ph.D. Dissertation.

115
McKinnon, J.J., 1992. Protein requirements of feedlot cattle that differ in mature body size. Ph.D. Dissertation. Univ. of Saskatchewan, Saskatoon, SK.
McKinnon, J.J., Cohen, R.D.H., Jones, S.D.M., Laarveld, B. and Christensen, D.A. 1993. The effects of dietary energy and crude protein concentration on growth and serum insulin-like growth factor-1 levels of cattle that differ in mature body size. Can. J. Anim. Sci. 73: 303-313.
McKinnon, J.J., Olubobokun, J.A., Christensen, D.A. and Cohen, R.D.H. 1991. Theinfluence of heat and chemical treatment on ruminal disappearance of canola meal. Can. J. Anim. Sci. 71:773-780.
McNaught, M.L., Smith, J.A.B., Henry, K.M. and Kon, S.K. 1950. The utilization of non-protein nitrogen in the bovine rumen: 5. The isolation and nutritive value of a preparation of dried rumen bacteria. Biochem. J. 46:32-36.
McNaught, M.L., Owen, E.C., Henry, K.M. and Kon, S.K. 1954. The utilization of non-protein nitrogen in the bovine rumen :8. The nutritive value of the proteins of preparations of dried rumen bacteria, rumen protozoa and brewers yeast for rats. Biochem. J. 56:151-156.
Michalet-Doreau, B. and Ould-Bah, M Y. 1992. In vitro and in sacco methods for estimation of dietary nitrogen degradability in the rumen: a review. Anim. Feed Sci. Tech. 40:57-86.
Moran, J.B. 1986. Cereal grains in complete diets of dairy cows: A comparison of rolled barley, wheat and oats and of three methods of processing oats. Anim. Prod. 43: 27-36.
Muntifering, R.B., Burch, T.J. Miller, B.G. and Ely, D.G. 1983. Digestibility and metabolism of mature tall fescue hay reconstituted and ensiled with whole stillage. J. Anim. Sci. 57:1286-1293.
Muntifering, R.B., Wedekind, K.J., Knifley, T. and Ely, D.G. 1985. Effects of processing on the supplemental value of distillers by-products in forage diets. J. Anim. Sci. 61(3):647-653.
Murdock, F.R., Hodgson, A.S. and Riley, R.E., Jr. 1981. Nutritive value of wet brewers grains for lactating dairy cows. J. Dairy Sci. 64:1826-1832.
Mustafa, F.A., McKinnon, J.J. and Christensen, D.A. (unpublished data).
Nakamura, T. Klopfcnstaein T.J. and Britton R.A. 1994. Evaluation of acid detergent nitrogen as an indicator of protein quality in non forage proteins J. Anim. Sci. 72:1043- 1048.

116
NAS-NCR 1976. Nutrient requirements of beef cattle. National Academy Press Washington, D.C.
NAS-NCR 1981. Feeding value of ethanol by-products. Committee on Animal Nutrition, Board on Agriculture and Renewable Resources. National Academy Press Washington, D.C.
NAS-NCR 1984. Nutrient requirements of beef cattle. National Academic Press 6th ed. Washington, D.C.
NAS-NCR 1985. Ruminant nitrogen usage National Academic Press Washington, D.C.
NAS-NCR 1989 Nutrient requirements for dairy cattle. National Academic Press Washington, D.C.
Nocek, J.C. 1988. In situ and other methods to estimate ruminal energy and protein digestibility: a review. J. Dairy Sci. 71:2051-2069
Nordin, M. and Campling, R.C. 1976. Digestibility studies with cows given whole and rolled cereal grains. Anim. Prod. 23: 305-313.
Nugent, J.H.A., Jones, W.T., Jordan, D.J. and Mangan, J.L., 1983. Rates of proteolysis in the rumen of soluble protein casein, Fraction 1(18S) leaf protein , bovine serum albumin and bovine submaxillary mucoprotein. Br. J. Nutr. 50 (2):357-368.
Offer, J.E. and Offer, N.W. 1992a. Calcium hydroxide treatment of malt distillers grains. 1. Effects on chemical composition and digestibility measured in vitro and in sacco. Anim. Prod. 55:203-208.
Offer, J.E. and Offer, N.W. 1992b Calcium hydroxide treatment of malt distillers grains. 2. Effects on apparent digestibility in vivo, intake and performance in sheep. Anim. Prod. 55:209-218
Oldham, J.D. 1993. Recent progress towards matching feed quality to the amino acid needs of ruminants. Anim. Feed Sci. Tech. 45:19-34.
Olfert, E.D. Brenda, M.C. and McWilliam, A.A. 1992. Guide to the care and use ofexperimental animals. Bradda Prin. Inc. Ottawa, Ontario, Canada.
Orskov, E.R. 1976. Manipulation of protein nutrition for production in young animals. Page 123 in Reviews in rural science II University of New England publishers Unit Armidale, Australia.
Orskov, E.R. and McDonald, I. 1979. The estimation of protein degradability in the rumen from incubation measurements weighted according to rate of passage. J. Agric. Sci. Camb. 92:499-503. '

117
0rskov, E.R. 1982. Protein nutrition in ruminants. Academic Press New York. NY.
0rskov, E.R. 1992. Protein nutrition in ruminants 2nd edition. Academic Press, London, England, pp 175.
0rskov, E.R., Hughes-Jones, M. and McDonald I. 1980. Degradability of protein supplements and utilization of undegradaded protein by high producing dairy cows. Page 85, In recent advances in Animal nutrition. W. Haresign ed. Butterworths, London, Engl.
Palmquist, D.L. 1988. The feeding value of fats. Pages 293-311 in 0rskov ed. Feed Science, World Animal Science, B4. Elsevier Science Publisher B.V. Amsterdam, Holland.
Paquay, R. DeBaere, R and Lousse, A. 1972. The capacity of the mature cow to lose and recover nitrogen and the significance of protein reserves. Br. J. Nutr. 27:27-37.
Perkins, T.L., Green, R.D., Hamlin, K.E., Shepard, H.H. and Miller, M F 1992.Ultrasonic prediction of carcass merit in beef cattle: Evaluation of technician effects on ultrasonic estimates of carcass fat thickness and longissimus muscle area. J. Anim. Sci. 70:2758-2765
Pitts, S.J., McCollum, F.T. and Britton M.C. 1992 Protein supplementation of steers grazing tobosa grass in spring and summer. J. Range Mana. 45:226-231.
Polan, C.E., 1988. Dietary protein and microbial contribution. J. Nutr. 118(2):242-248.
Polan, C.E., Herrington, R.A., Wark, W.A. and Armentano, L.E. 1985. Milk production response to diets supplemented with dried brewers grains, wet brewers grains or soybean meal. J. Dairy. Sci. 68:2016-2026.
Porter, R.M. and Conrad, H.R. 1975. Comparative nutritive value of wet and dry brewers grains. J. Dairy Sci. 58:747 P32 (abstract), Ohio Agric. Res. and Dev. center Wooster, USA.
•*»
Purser, D.B. and Buechler, S.M. 1966. Amino acid composition of rumen organisms. J. Dairy. Sci. 49:81-84.
Risk, J.E., Hendrix, K.S., Perry, T.W. and Lemenager, R.P. 1982. Distillers and brewers wet grains feeding. Indiana Beef Cattle Day Report, Purdue University.
Roe, M.B. and Sniffen, C.J. 1990. Techniques for measuring protein fractions in feedstuffs. Cornell Nutr. Conf.
Rooke, J.A. and Armstrong, D.G. 1989 The importance of the form of nitrogen on microbial protein synthesis in the rumen of cattle receiving grass silage and continuous intrarumen rumen infusions of sucrose. Br. J. Nutr. 61:113-121'.

118
Rounds, 1975. Slowly degraded protein sources in ruminant rations. Ph. D. Dissertation University of Nebraska Lincoln, Nebraska.
Rouse, G. and Trenkle, G. 1980. Stillage from grain alcohol as a feed source for cattle. Iowa State University. A.S. Leaflet R307.
Russell, J.B., O’Connor, J.D., Fox, D.G., Van Soest, P.J. and Sniffen, C.J. 1992. Anet carbohydrate and protein system for evaluating cattle diets: I. Ruminal fermentation. J. Anim. Sci. 70:3551-3561.
Santos, K.A., Stern, M.D. and Satter , L.D. 1984. Protein degradation in the rumen and amino acid absorption in the small intestine of lactating dairy cattle fed various protein sources. J. Anim. Sci. 58:244-255.
Saskatchewan Feed Testing Laboratory, Department of Animal and Poultry Science University of Saskatchewan, Saskatoon (Personal communication V.J. Racz).
Satter, L.D. and Roffler, R.E. 1975a. Relationship between ruminal ammonia and non protein nitrogen utilization by cattle. 1 Development of a model for predicting non protein nitrogen utilization by cattle. J. Dairy Sci. Ed. 264.
Satter, L.D and Roffler, R.E. 1975b. Relationship between ruminal ammonia and non protein nitrogen utilization by cattle. 11 Application of published evidence to the development of a theoretical model for predicting non protein nitrogen utilization . J. Dairy Sci. Ed. 265.
Satter, L.D. and Stehr, D.B. 1984. Feeding resistant protein to dairy cows. Distillers feed conference Proc. 39-59.
Satter, L.D., and Roffler, R.E. 1974. Nitrogen requirement and utilization in dairy cattle. J. Dairy Sci. 58:8:1219-1236.
Satter, L.D., and Slyter, L.L., 1974. Effect of ammonia concentration on rumen microbial protein production in vitro. Br. J. Nutr. 32:199-217.
Shaver R.D., 1991. Feeding the high producing dairy cow: carbohydrate, protein and fat. Dist. Feed Conf. Proc. Vol. 46: April 2, Syracuse, New York, USA.
Schingoethe, D.J. Clark, A.K. and Voelker, H.H. 1983. Wet corn distillers grains in lactating dairy cattle. J. Dairy Sci. 66:345-349.
Shelford, J.A. and Tait R.M. 1986. Comparison of distillers grains with solubles from rye and corn in production and digestibility trials with lactating cows and sheep. Can. J. Anim. Sci. 66:1003-1008.
Smith, R.H. 1979. Synthesis ot microbial nitrogen compounds in the rumen and their subsequent digestion. J. Anim. Sci. 49:1604-1614.

119
Sniffen, C.J. O’Connor, J.D., Van Soest, P.J. Fox, D.G. and Russell, J.B., 1992. Anet carbohydrate and protein system for evaluating cattle diets: II. Carbohydrate and protein availability. J. Anim. Sci. 70:3562-3577.
Sosulski, F.W., Lee, W.J. and Sokhansanj, S. 1991 Wet milling and separation of wheat distillers grains with solubles into dietary fiber and protein fractions. Cereal Chem. 68(6):562-565.
Statistical Analysis System (SAS) Institute, Inc., 1990. SAS User’s guide: Statistics. Version 6. Third edition.
Statistics Canada 1993 Cereals and oil seeds review December cat No. 22-007 Page 14- 15.
Steel, R.G.D. and Torrie, J.H. 1980. Principle and procedures of statistics. McGraw- Hill Book Co., New York, N.Y.
Stern, M.D. and Satter, L.D. 1984. Evaluation of nitrogen solubility and the dracon bag technique as methods for estimating protein degradation in the rumen. J. Anim. Sci. 58(3):714-724.
Stern, M.D. and Hoover, W.H. 1979. Methods for determining and factors affecting rumen microbial protein synthesis. J. Anim. Sci. 49:1590.
Stokes, SR., Hoover, W.H., Miller, T.K. and Blauweikel, R. 1991. Ruminal digestion and microbial utilization of diets varying in type of carbohydrate and protein. J. Dairy. Sci. 74:871-881.
Storm, E.R. and 0rskov, E.R. 1977. Utilization of rumen bacteria by ruminants. Ann. Rech. Vet. 10:294.
Storm, E.R. and 0rskov, E.R. 1983. The nutritive value of rumen micro-organisms in ruminants 1. Large-scale isolation and chemical composition of rumen micro-organisms. Br. J Nutr. 50:463-470.
Storm, E.R., 0rskov, E.R. and Smart, R. 1983a The nutritive value of rumen microorganisms in ruminants. 2 The apparent digestibility and net utilization of microbial nitrogen for growing lambs. Br. J Nutr. 50:471-478.
Storm, E.R., Brown, D.S. and 0rskov, E.R. 1983b The nutritive value of rumen micro-organisms in ruminants. 3 The digestion of microbial amino and nucleic acids in, and losses of endogenous nitrogen from, the small intestine of sheep. Br. J Nutr. 50:479- 485.
Strobel, H.J. and Russell, J.B. 1986 Effect of pH and energy spilling on bacterial protein synthesis by carbohydrate limited cultures of mixed rumen bacteria. J. Dairy Sci. 69:2941-2947.

120
Swanson, E.W. 1982. In Protein requirements of cattle: Symposium, pp 183-197. F.N. Owens ed. Oklahoma State University Press, Still Water, OK.
Syvaoja, E.L. and Kreula, M. 1979. The in vitro determination of the protein quality of rumen microorganisms of cows on urea rich feed. J. Sci. Agric. Soc. Finland. 51:68.
Tamminga, S. 1979. Protein degradation in the fore stomach of ruminants. J. Anim. Sci. 49:1615-1629.
Theurer, C.B. 1986. Grain processing effects on starch utilization by ruminants. J. Anim Sci. 63:1649-1662.
Van Soest, P.J. 1982. Nitrogen metabolism. In Nutritional ecology of the ruminant ed Van Soest, Peter. J. Page 230-248, Cornell University Press, Ithaca New York.
Waller, J., Klopfenstein, T. and Poos, M. 1980. Distillers grains as a protein source for growing ruminants. J. Anim. Sci. 51 (5): 1154-1167.
Waller, J.C. 1978. Slowly degraded protein sources for ruminants. Ph. D. dissertation University of Nebraska, Lincoln Nebraska.
Weiss, W.P., Erickson, D.O., Erickson, G.M. and Fisher G.R. 1989. Barley distillers grains as a protein supplement for dairy cows. J Dairy Sci. 72:980-987.
Windschitl, P.M. and Stern, M.D. 1988. Evaluation of calcium lignosulfonate-treated soybean meal as a source of rumen protected protein for dairy cattle J. Dairy Sci. 71:3310-3322.
Wright, S.B.M. 1986. A study of nitrogen fertilization of grazed pasture in Saskatchewan. M.Sc. Thesis. Dept, of Anim. and Py. Sci. University of Saskatchewan, Saskatoon.
Yu, Y. and Thomas, J.L. 1976. Estimation of heat damage in alfalfa haylage by laboratory measurement. J. Anim. Sci. 43:(3):766-744.
Zasoski, R.J. and Burau, R.G. 1977. A rapid nitric-perchloric acid digestion method for multi-element tissue analysis. Commun. Soil Sci. Plant Anal. 8:425-436.
U n i v e r s i t y o r n a i r ,o b i l i b r a r y