Embed Size (px)
DESCRIPTION
The Oklahoma Stocker Industry. Derrell S. Peel Oklahoma State University. The Beef Industry. Demand Marketing System Production. Cattle and Beef Markets. Demand What gets produced How much gets produced Who gets it. Cattle and Beef Markets. Marketing System - PowerPoint PPT Presentation
Citation preview


The Oklahoma Stocker Industry
Derrell S. PeelDerrell S. Peel
Oklahoma State UniversityOklahoma State University
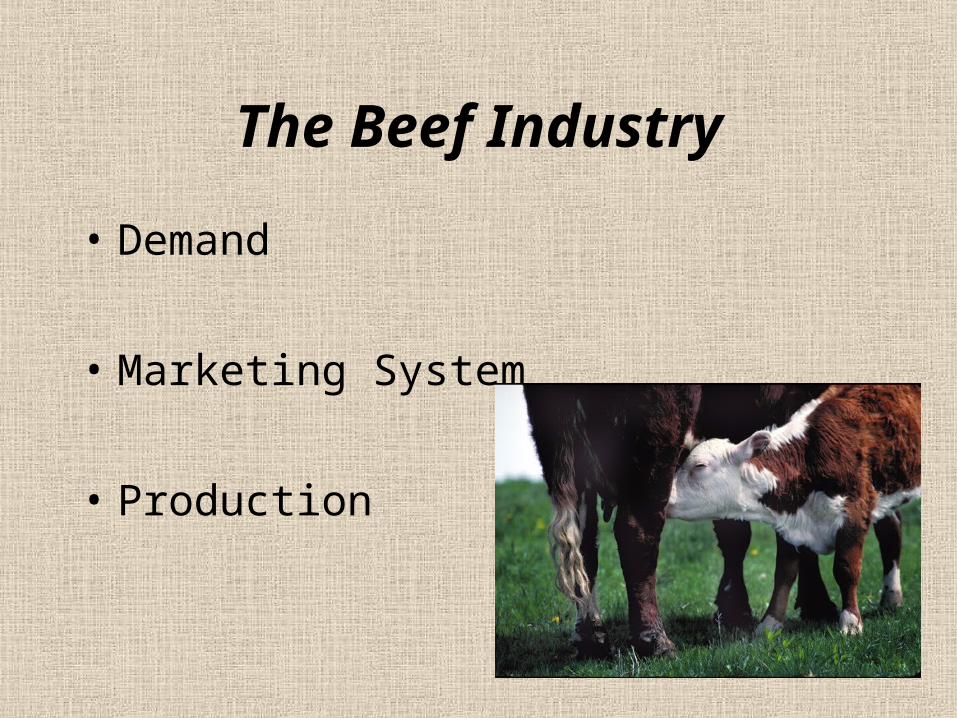
The Beef Industry
• Demand
• Marketing System
• Production
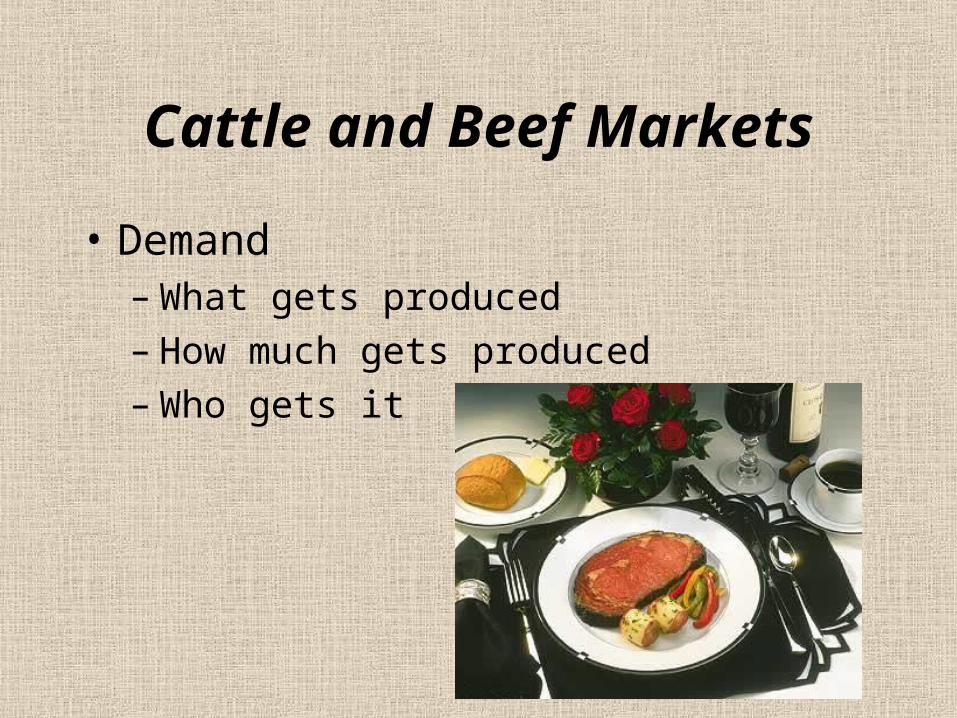
Cattle and Beef Markets
• Demand– What gets produced– How much gets produced– Who gets it
Cattle and Beef Markets
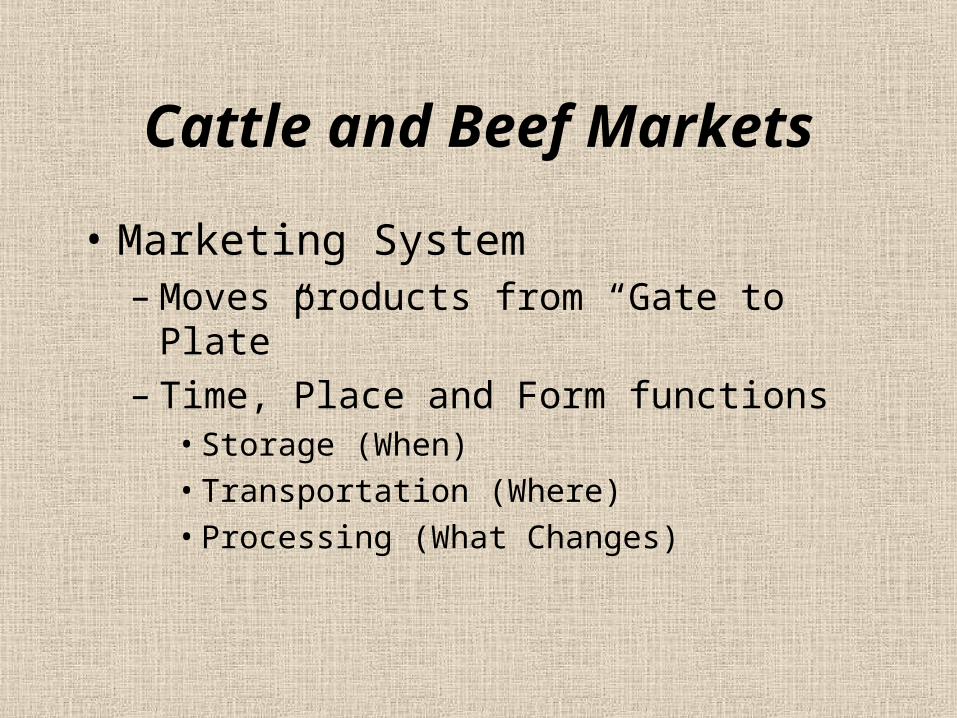
• Marketing System– Moves products from “Gate to Plate”– Time, Place and Form functions
• Storage (When)• Transportation (Where)• Processing (What Changes)
Cattle and Beef Markets
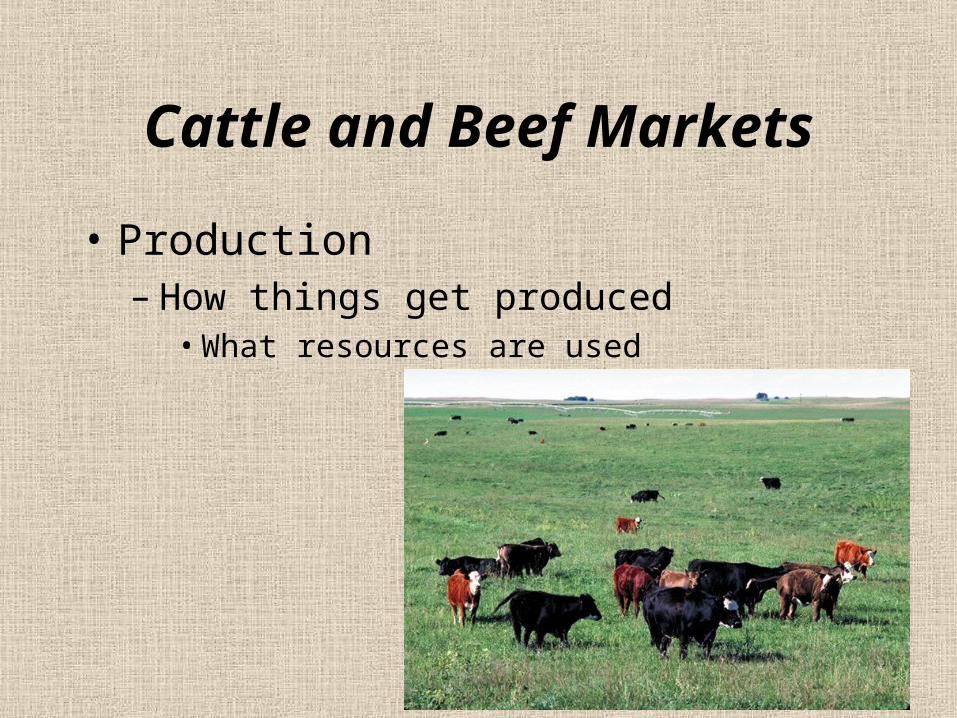
• Production– How things get produced
• What resources are used
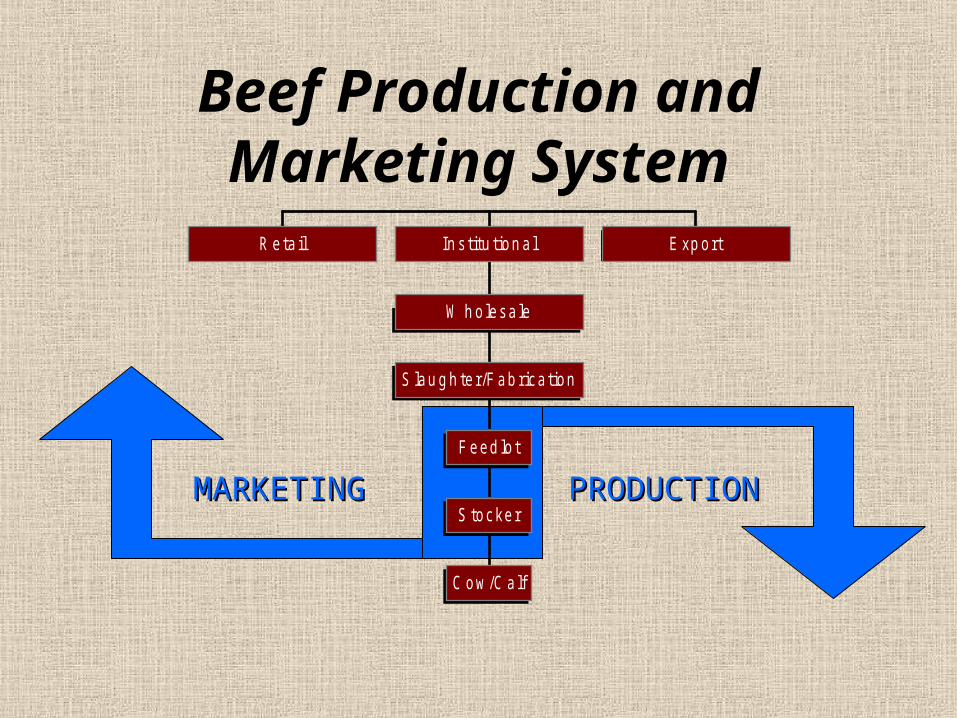
Beef Production and Marketing System
R eta il
C ow /C a lf
S tocker
F eed lo t
S lau g h te r/F ab rica tion
W h o lesa le
In s titu tion a l E xp ort
MARKETINGMARKETING PRODUCTIOPRODUCTIONN
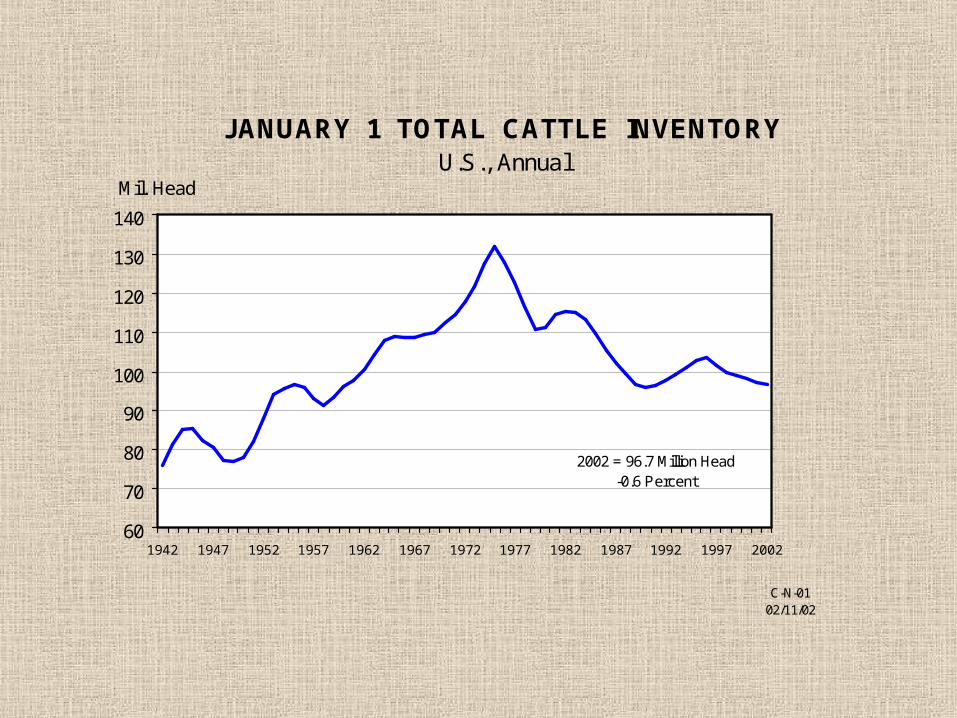
JANUARY 1 TOTAL CATTLE INVENTORYU.S., Annual
60
70
80
90
100
110
120
130
140
1942 1947 1952 1957 1962 1967 1972 1977 1982 1987 1992 1997 2002
Mil. Head
C-N-0102/11/02
-0.6 Percent2002 = 96.7 Million Head
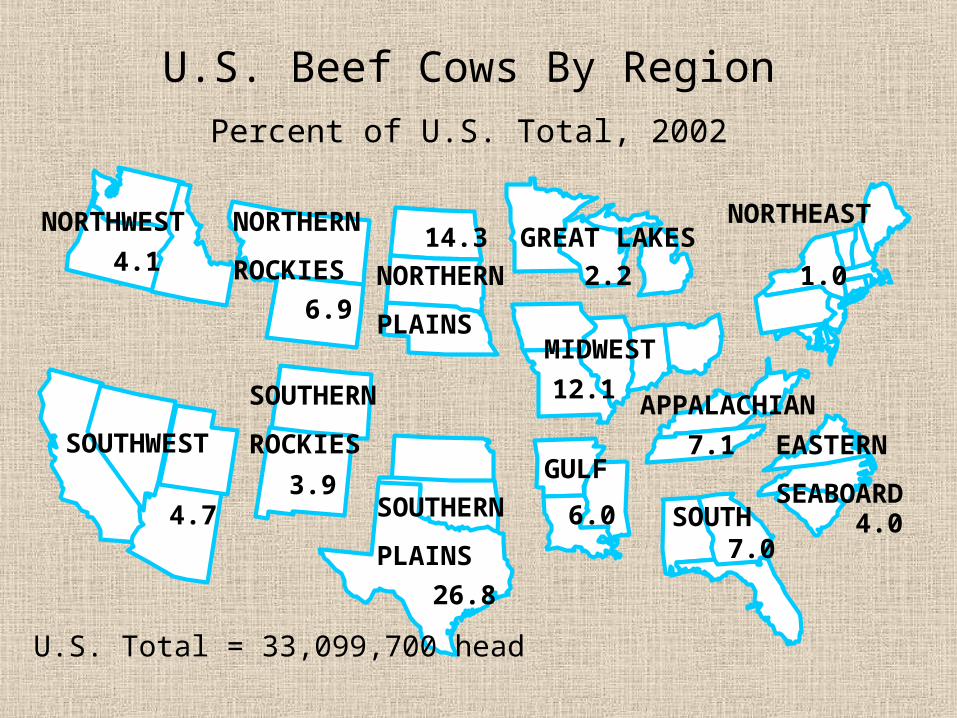
U.S. Beef Cows By RegionPercent of U.S. Total, 2002
NORTHWESTNORTHERN
ROCKIES NORTHERN
PLAINS
SOUTHERN
PLAINS
GREAT LAKESNORTHEAST
MIDWEST
GULF
APPALACHIAN
SOUTH
SOUTHWEST
SOUTHERN
ROCKIES EASTERN
SEABOARD 6.0
4.1
4.7
6.9
3.9
14.3
26.8
12.1
2.2
7.1
7.0 4.0
1.0
U.S. Total = 33,099,700 head

Regional Share of Beef Cows,
January 1, 2002
0.0%
5.0%
10.0%
15.0%
20.0%
25.0%
30.0%
North
west
South
west
N.Roc
kies
S.Roc
kies
N.Plai
ns
S.Plai
ns
G.Lak
es
Midw
est
Gulf
South
Appala
chian
E.Sea
boar
d
North
east
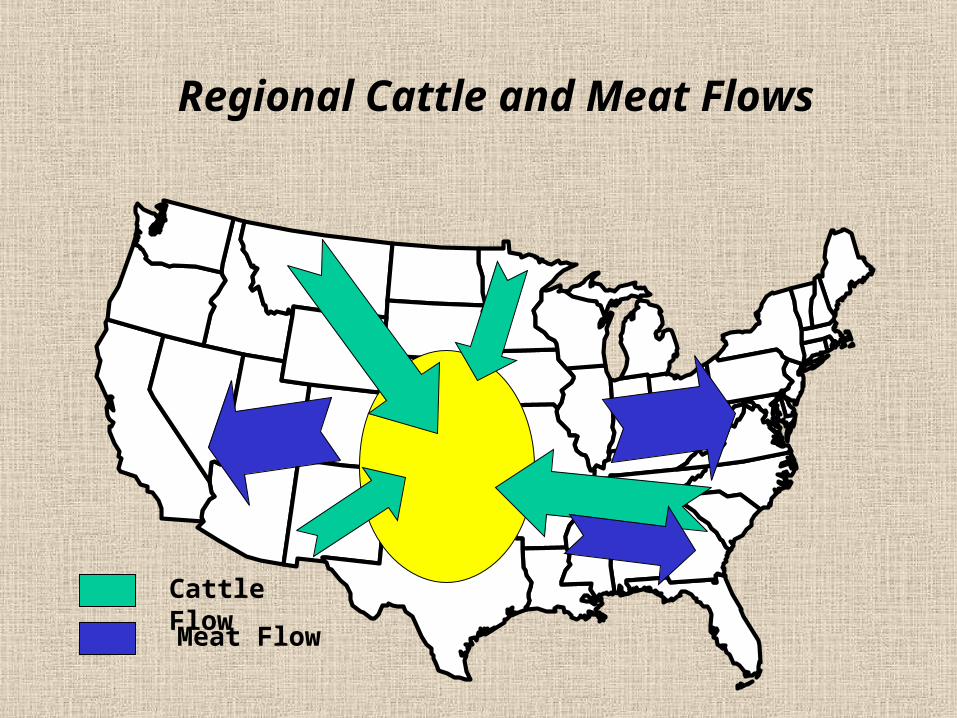
Regional Cattle and Meat Flows
Cattle Flow
Meat Flow
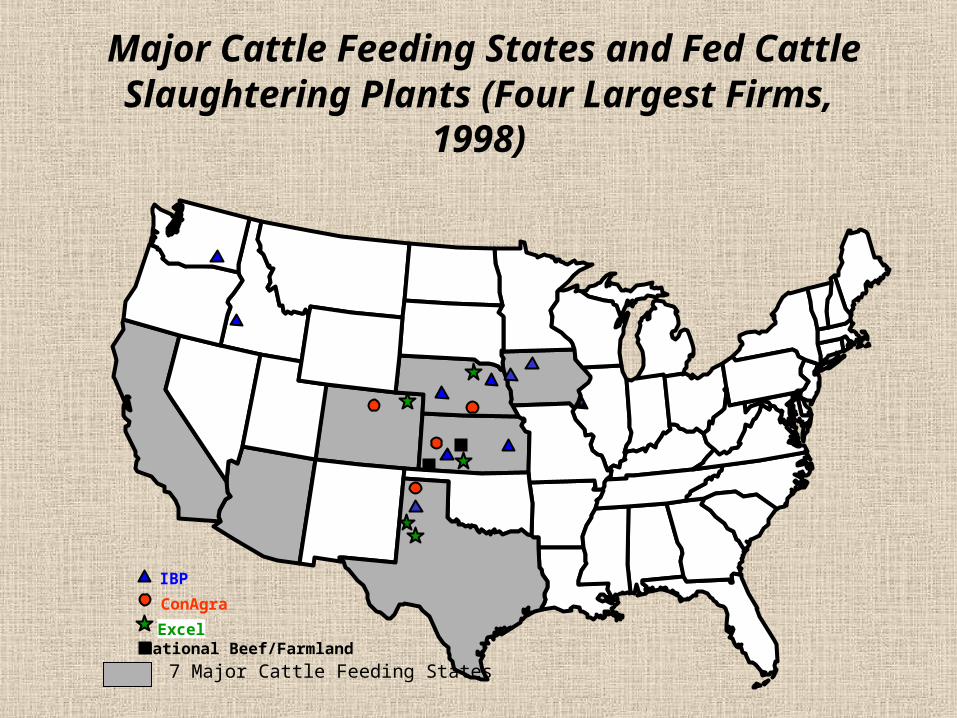
Major Cattle Feeding States and Fed Cattle Slaughtering Plants (Four
Largest Firms, 1998)
IBP
ConAgra
ExcelNational Beef/Farmland
7 Major Cattle Feeding States
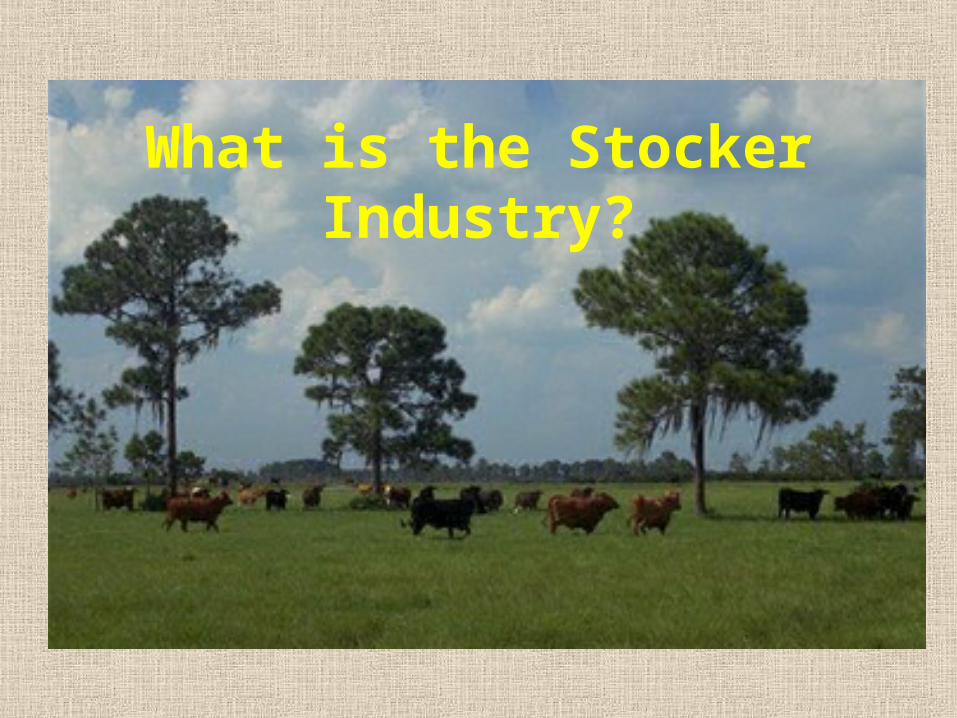
What is the Stocker Industry?
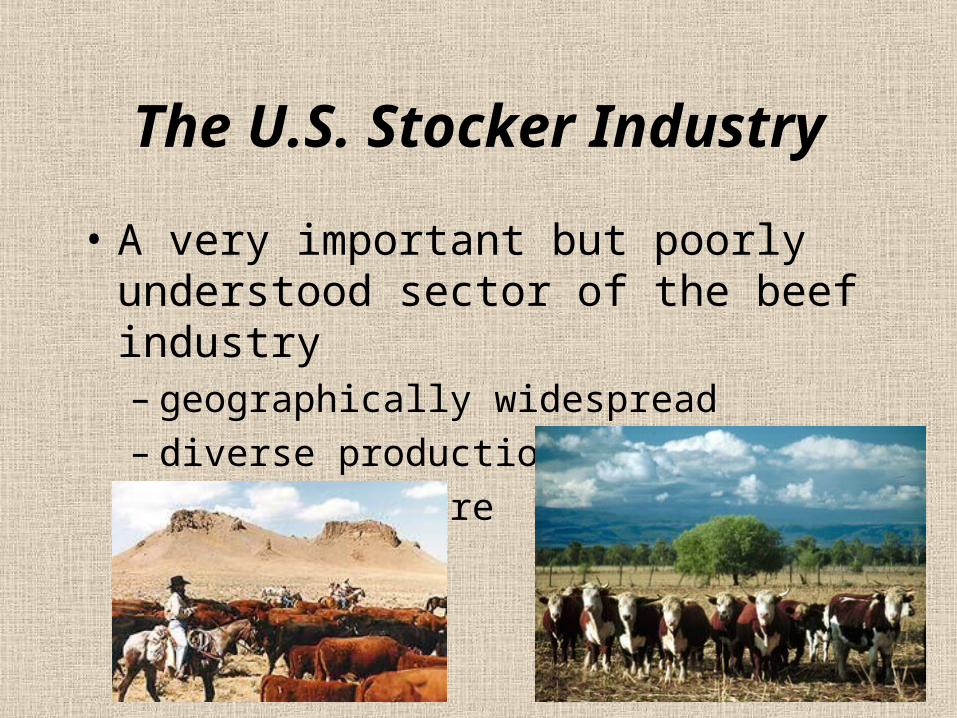
The U.S. Stocker Industry
• A very important but poorly understood sector of the beef industry– geographically widespread– diverse production systems– hard to measure
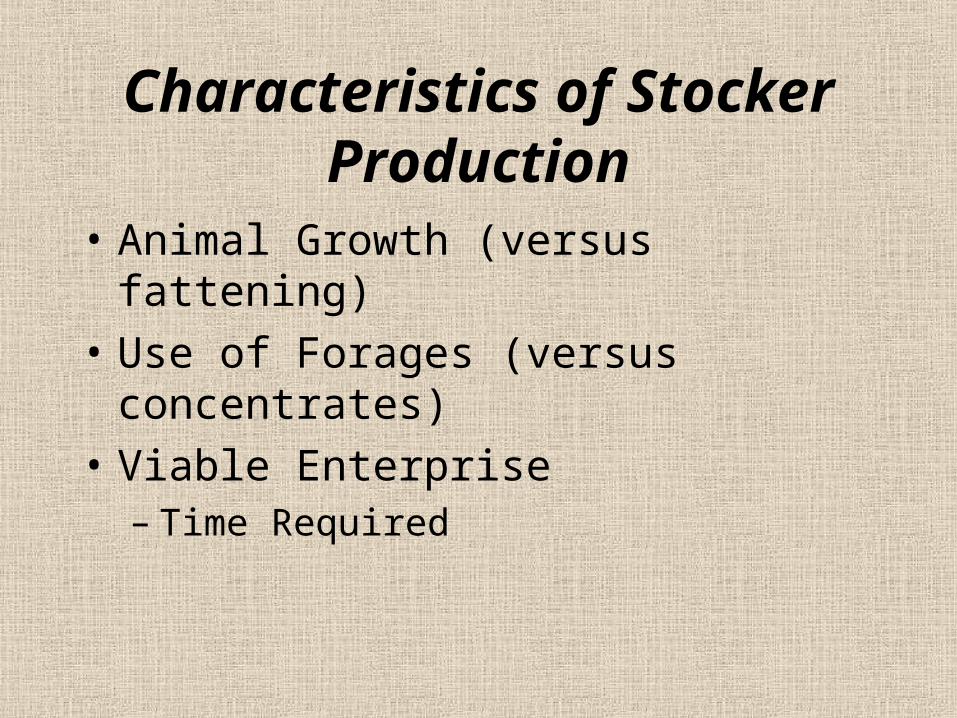
Characteristics of Stocker Production
• Animal Growth (versus fattening)• Use of Forages (versus
concentrates)• Viable Enterprise
– Time Required
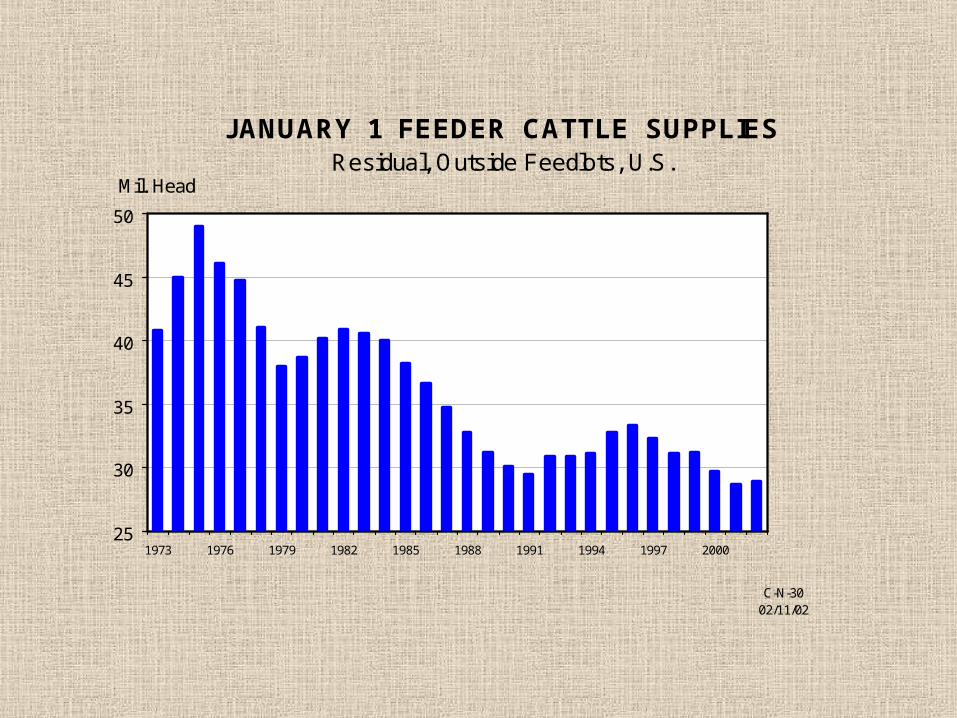
JANUARY 1 FEEDER CATTLE SUPPLIESResidual, Outside Feedlots, U.S.
25
30
35
40
45
50
1973 1976 1979 1982 1985 1988 1991 1994 1997 2000
Mil. Head
C-N-3002/11/02
Regional Share of Feeder Supplies
Outside of Feedlots, Jan. 1, 2002
0.0%
5.0%
10.0%
15.0%
20.0%
25.0%
30.0%
North
west
South
west
N.Roc
kies
S.Roc
kies
N.Plai
ns
S.Plai
ns
G.Lak
es
Midw
est
Gulf
South
Appala
chian
E.Sea
boar
d
North
east
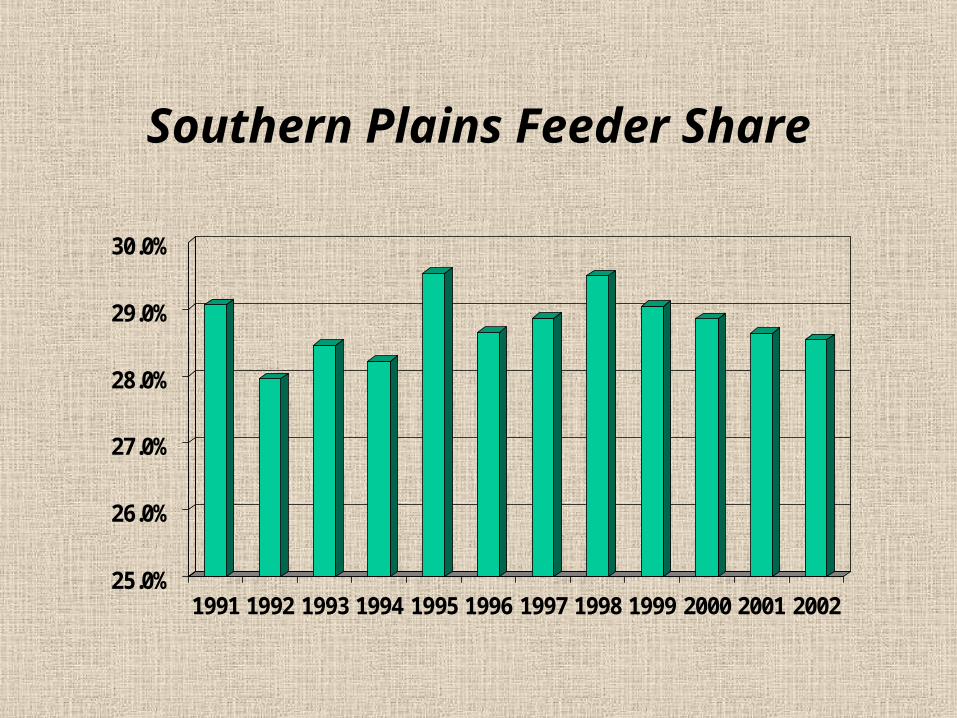
Southern Plains Feeder Share
25.0%
26.0%
27.0%
28.0%
29.0%
30.0%
1991 1992 1993 1994 1995 1996 1997 1998 1999 2000 2001 2002
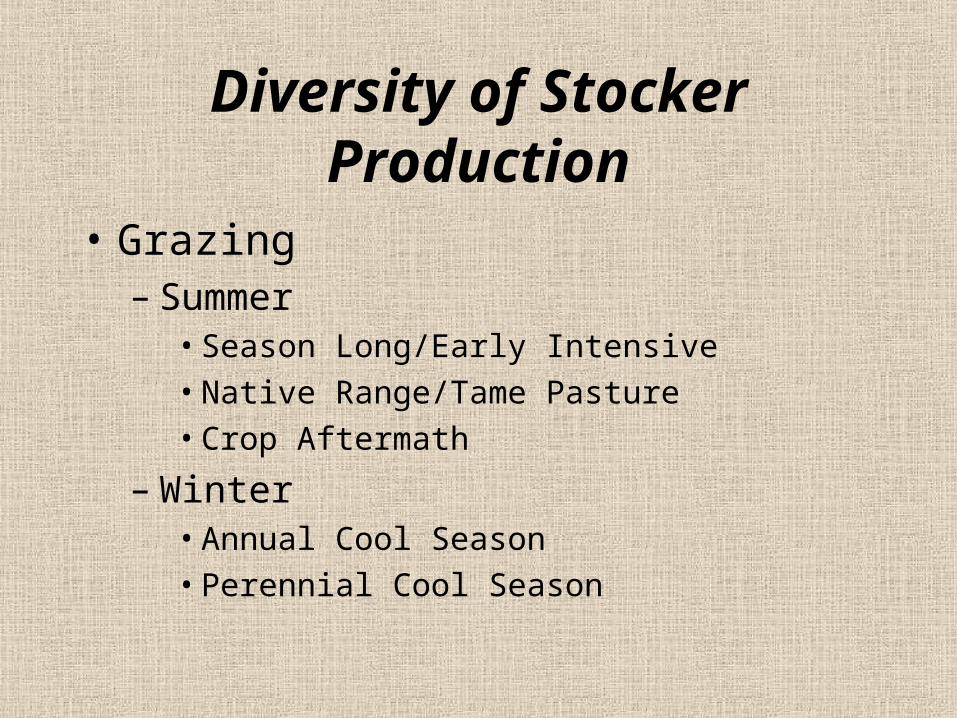
Diversity of Stocker Production
• Grazing– Summer
• Season Long/Early Intensive• Native Range/Tame Pasture• Crop Aftermath
– Winter• Annual Cool Season• Perennial Cool Season
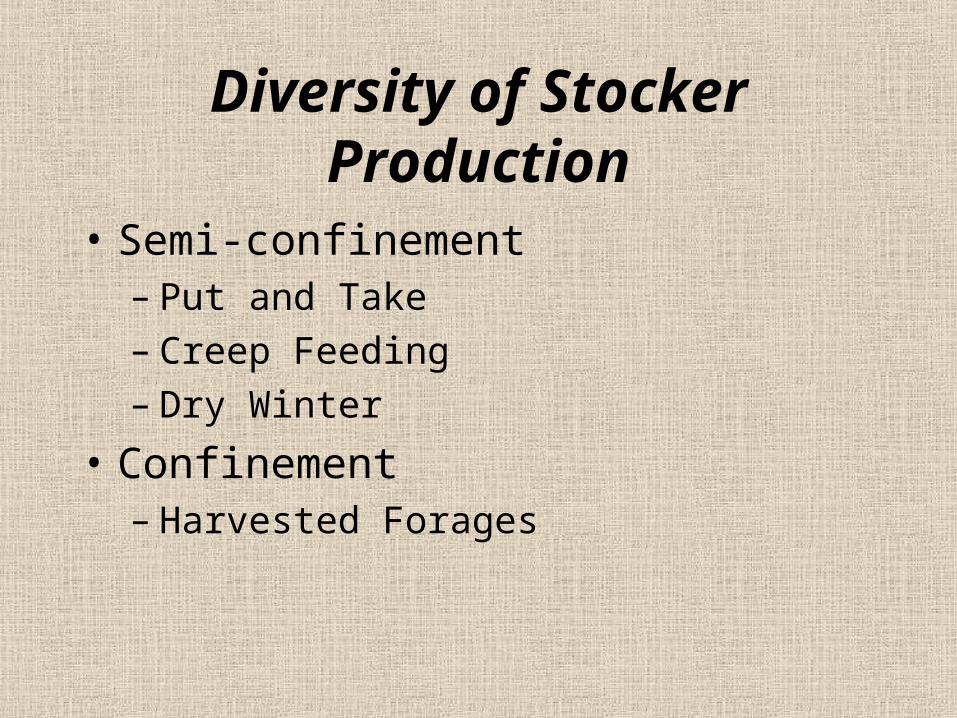
Diversity of Stocker Production
• Semi-confinement– Put and Take– Creep Feeding– Dry Winter
• Confinement – Harvested Forages
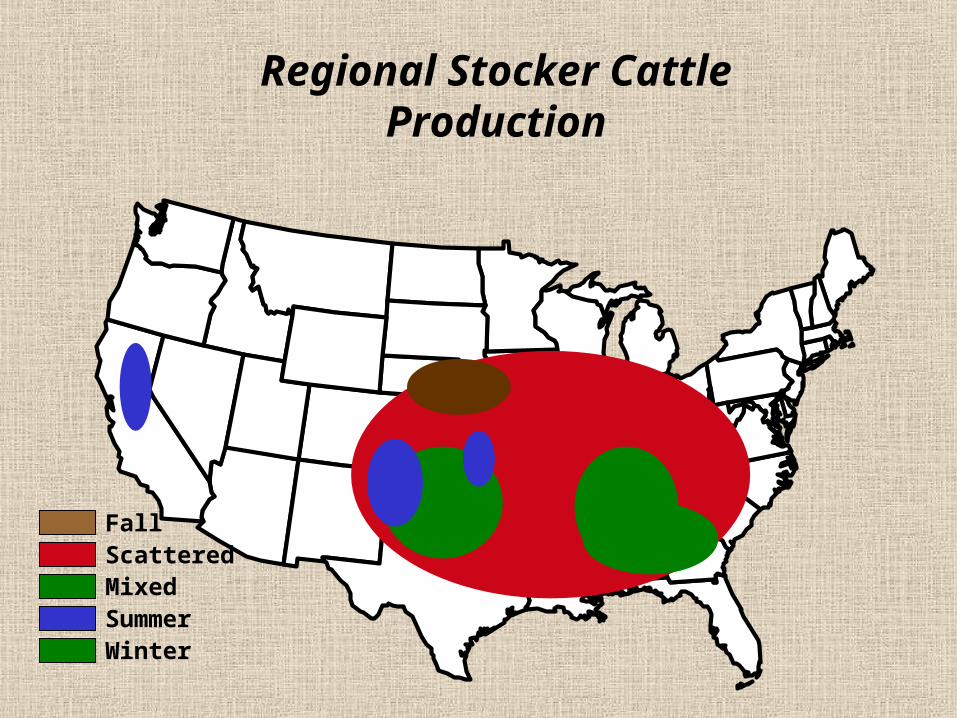
Regional Stocker Cattle Production
ScatteredMixedSummerWinter
Fall
Okla
Washington
Idaho
California
Colorado Kansas
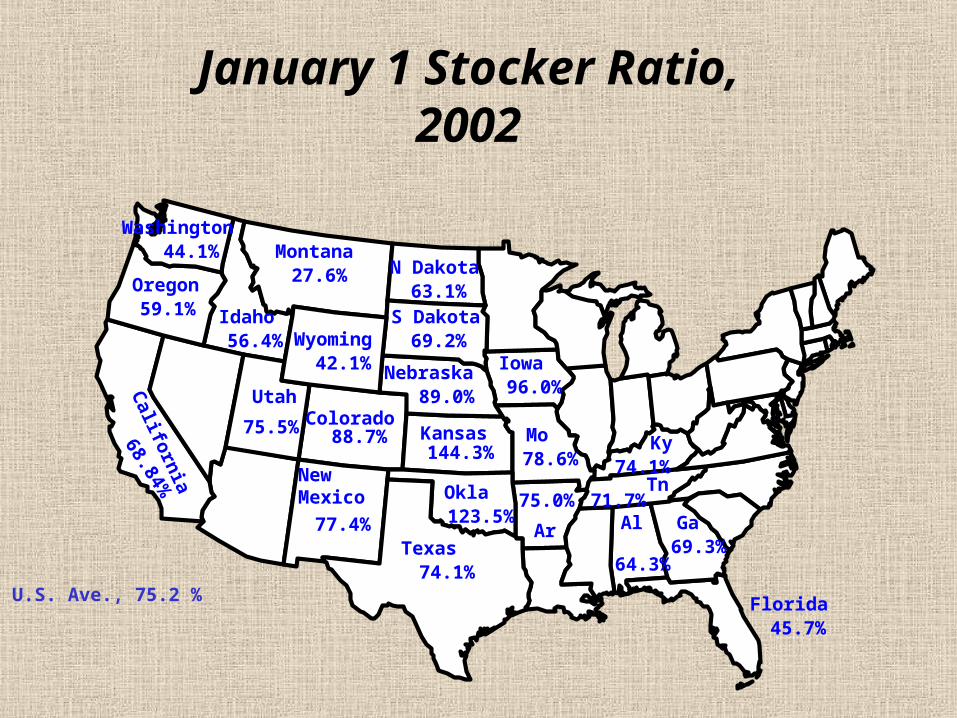
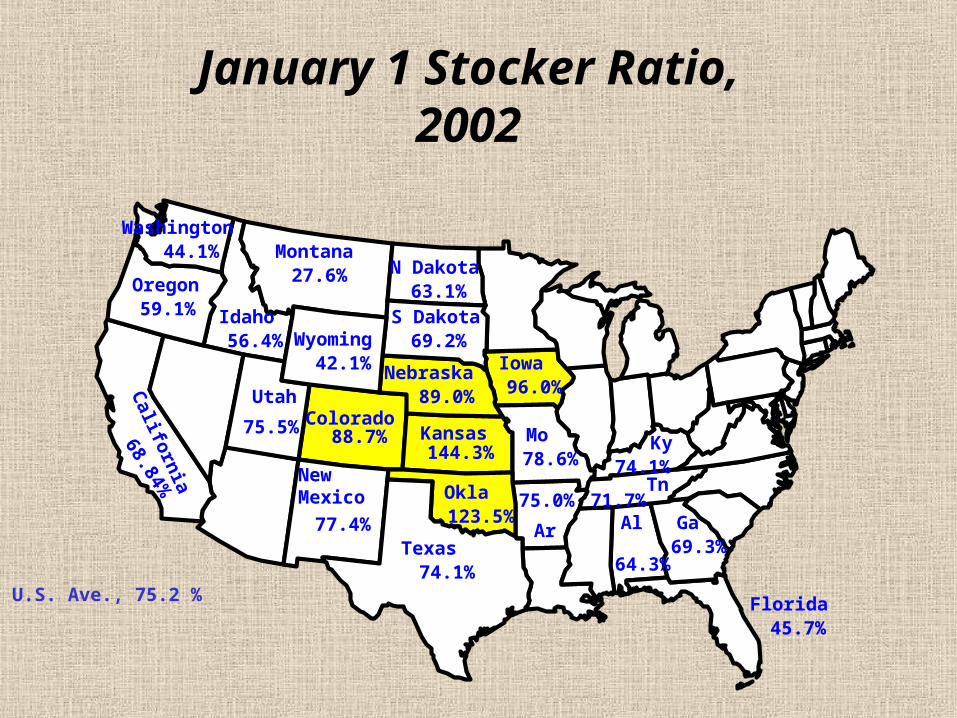
U.S. Ave., 75.2 %
January 1 Stocker Ratio, 2002
Wyoming
Montana
Oregon
New Mexico
68.84%
44.1%
59.1%
27.6%
56.4%42.1%
88.7%144.3%
123.5%77.4%
75.5%
Utah
Texas74.1%
78.6%
45.7%Florida
74.1%
63.1%N Dakota
S Dakota 69.2%
89.0%Nebraska
Mo Ky
71.7%
Tn
Al
64.3%
69.3%
GaAr
75.0%
Iowa 96.0%
Okla
Washington
Idaho
California
Colorado Kansas
U.S. Ave., 75.2 %
January 1 Stocker Ratio, 2002
Wyoming
Montana
Oregon
New Mexico
68.84%
44.1%
59.1%
27.6%
56.4%42.1%
88.7%144.3%
123.5%77.4%
75.5%
Utah
Texas74.1%
78.6%
45.7%Florida
74.1%
63.1%N Dakota
S Dakota 69.2%
89.0%Nebraska
Mo Ky
71.7%
Tn
Al
64.3%
69.3%
GaAr
75.0%
Iowa 96.0%
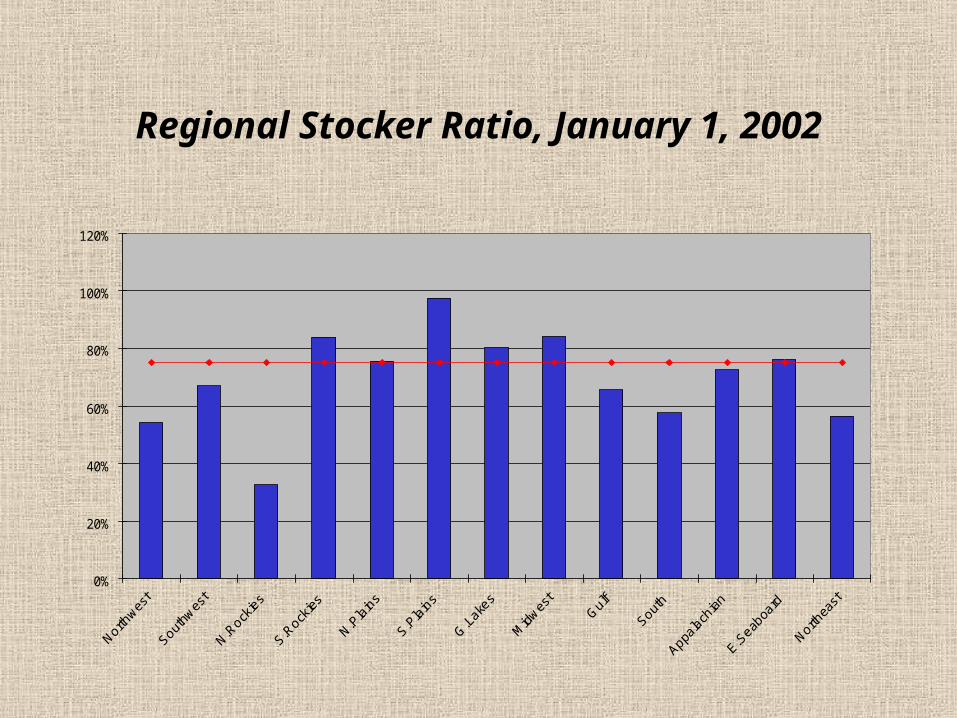
Regional Stocker Ratio, January 1, 2002
0%
20%
40%
60%
80%
100%
120%
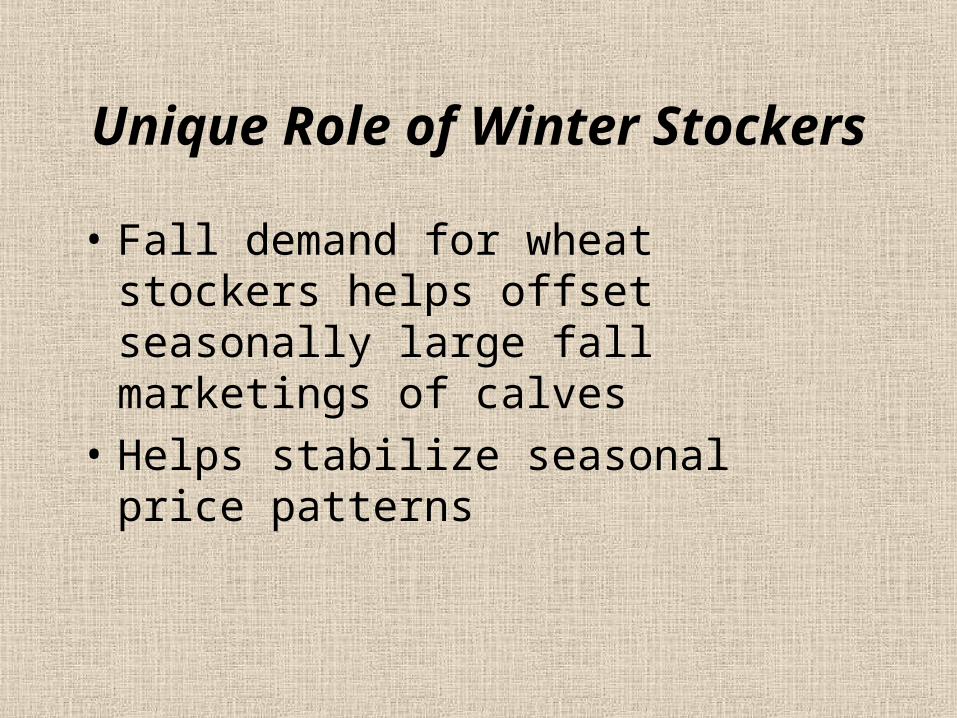
Unique Role of Winter Stockers
• Fall demand for wheat stockers helps offset seasonally large fall marketings of calves
• Helps stabilize seasonal price patterns
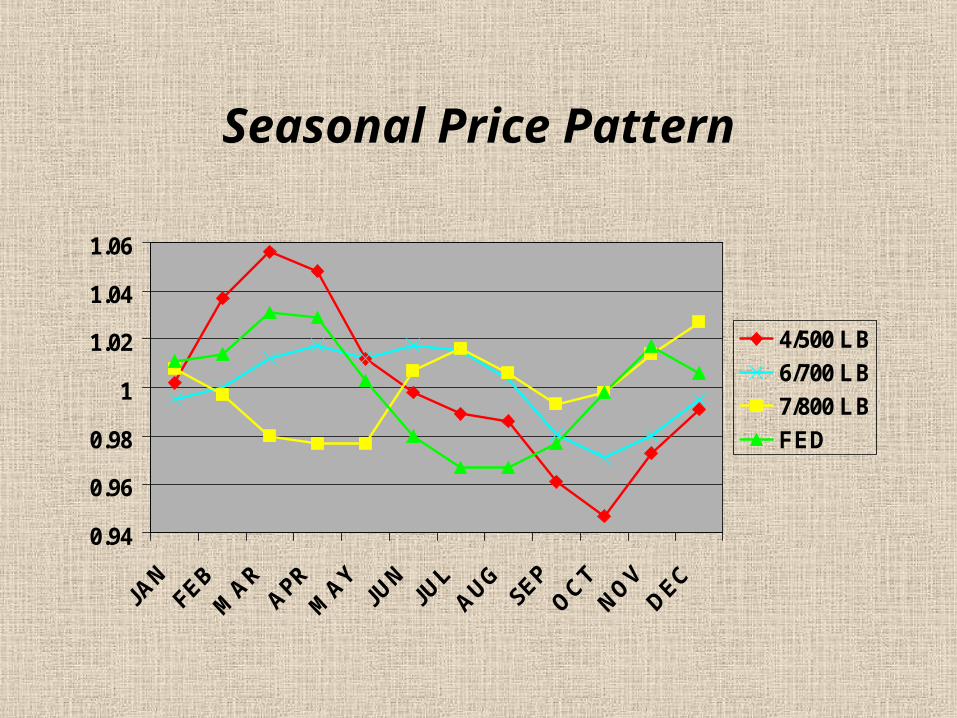
Seasonal Price Pattern
0.94
0.96
0.98
1
1.02
1.04
1.06
4/500 LB
6/700 LB
7/800 LB
FED
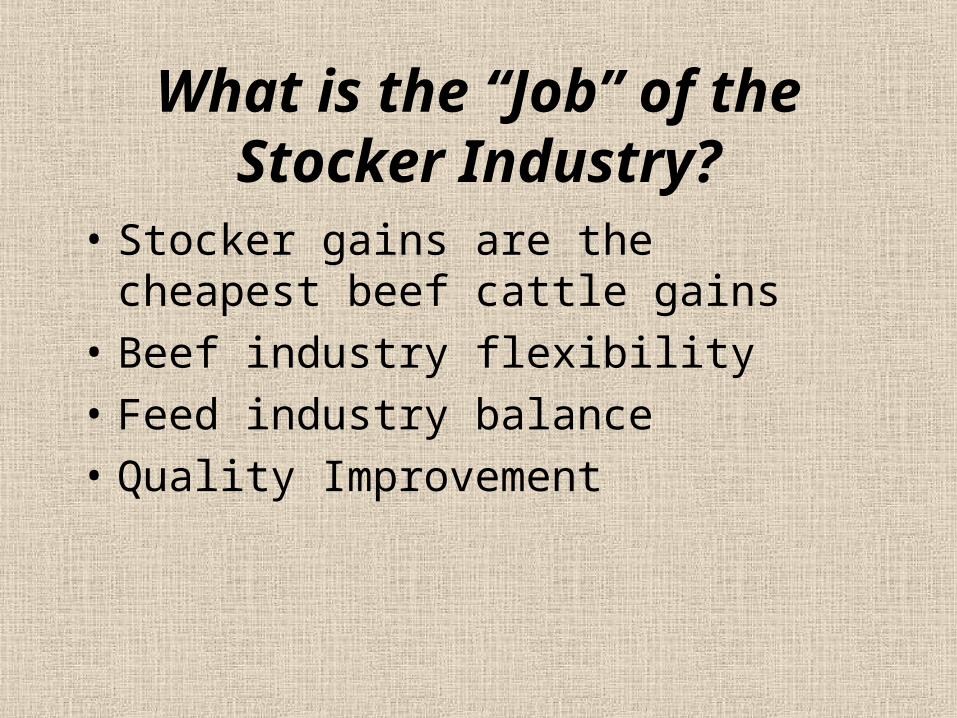
What is the “Job” of the Stocker Industry?
• Stocker gains are the cheapest beef cattle gains
• Beef industry flexibility• Feed industry balance• Quality Improvement
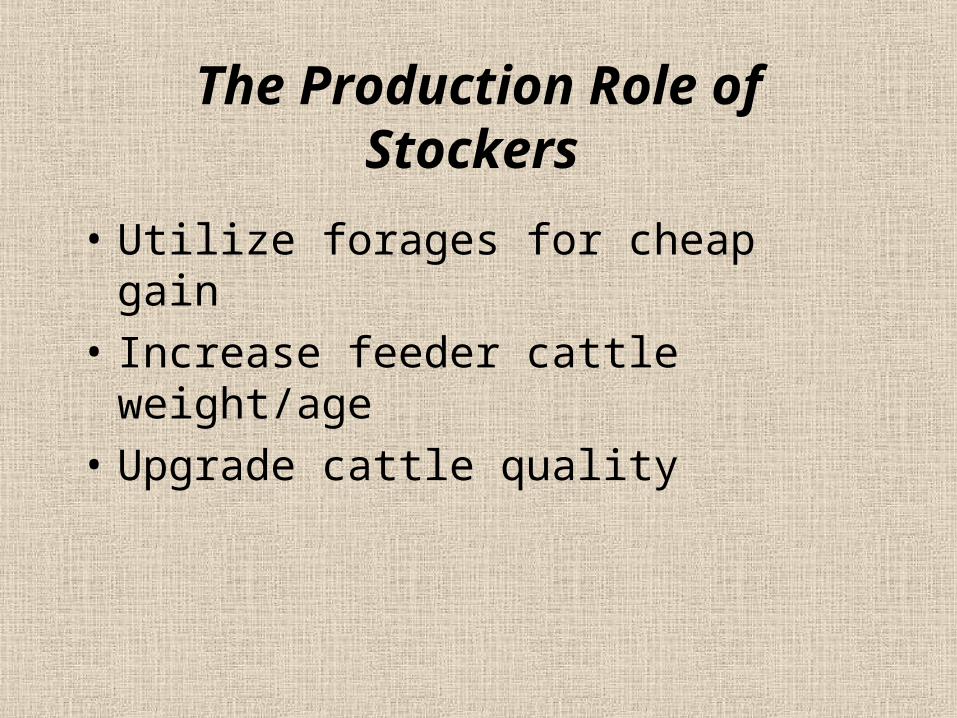
The Production Role of Stockers
• Utilize forages for cheap gain• Increase feeder cattle weight/age• Upgrade cattle quality
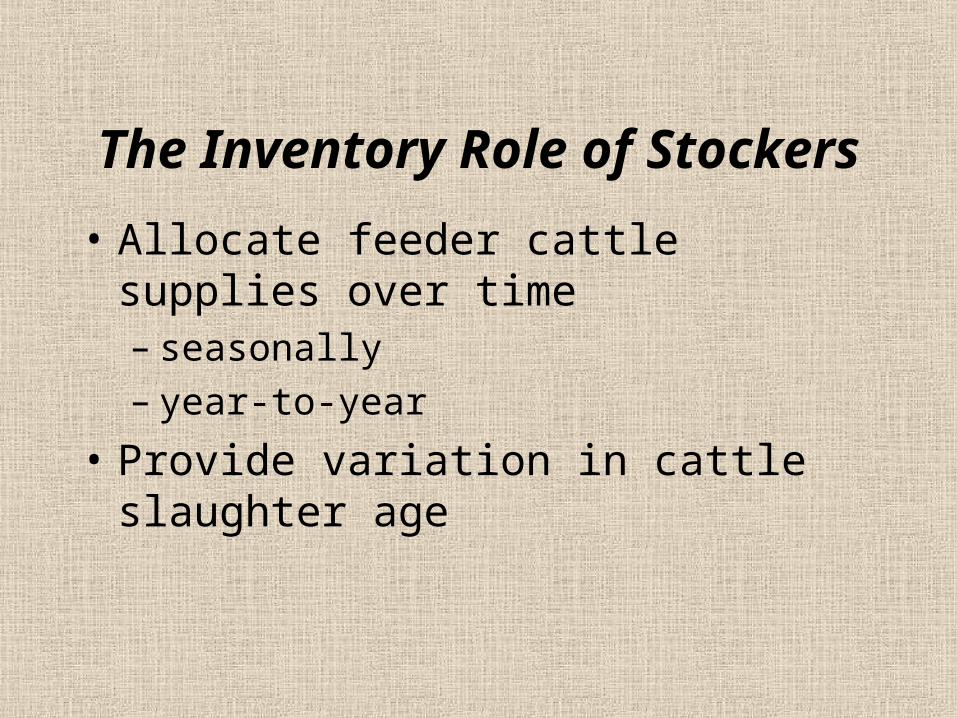
The Inventory Role of Stockers
• Allocate feeder cattle supplies over time– seasonally– year-to-year
• Provide variation in cattle slaughter age
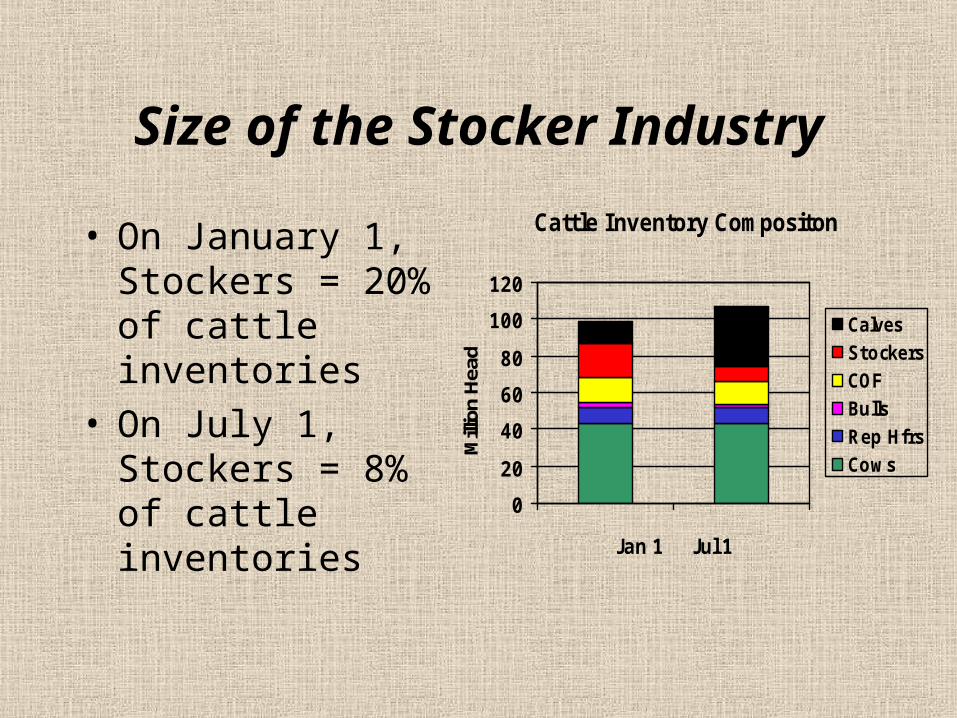
Size of the Stocker Industry
• On January 1, Stockers = 20% of cattle inventories
• On July 1, Stockers = 8% of cattle inventories
Cattle Inventory Compositon
0
20
40
60
80
100
120
Jan 1 Jul 1
Mill
ion
Hea
d
CalvesStockersCOFBullsRep HfrsCows
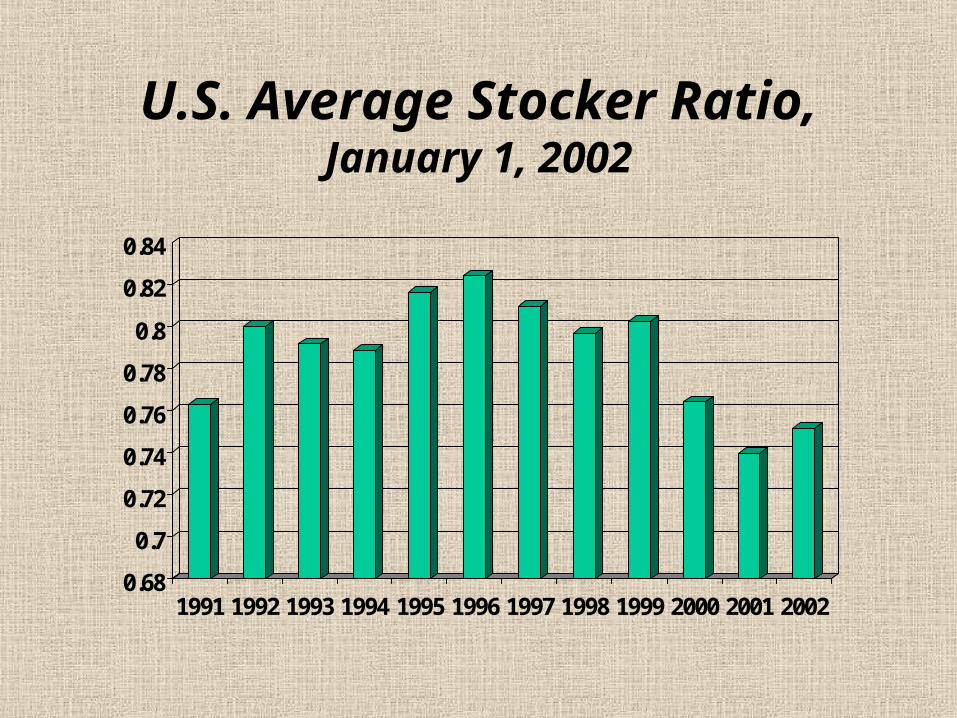
U.S. Average Stocker Ratio,
January 1, 2002
0.68
0.7
0.72
0.74
0.76
0.78
0.8
0.82
0.84
1991 1992 1993 1994 1995 1996 1997 1998 1999 2000 2001 2002
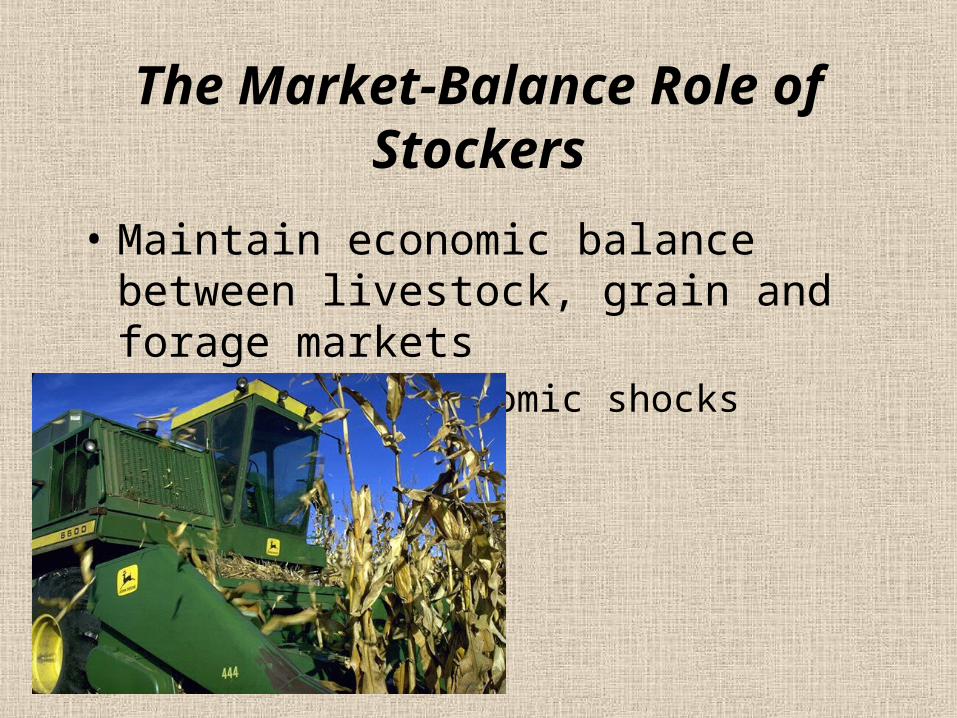
The Market-Balance Role of Stockers
• Maintain economic balance between livestock, grain and forage markets– respond to economic shocks
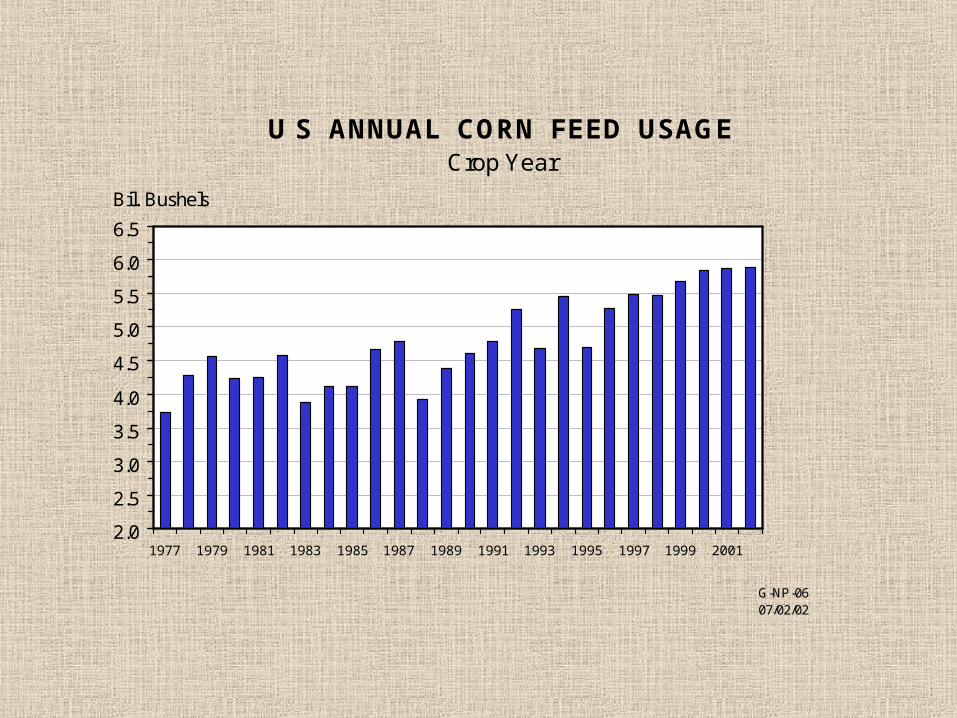
U S ANNUAL CORN FEED USAGECrop Year
2.0
2.5
3.0
3.5
4.0
4.5
5.0
5.5
6.0
6.5
1977 1979 1981 1983 1985 1987 1989 1991 1993 1995 1997 1999 2001
Bil. Bushels
G-NP-0607/02/02
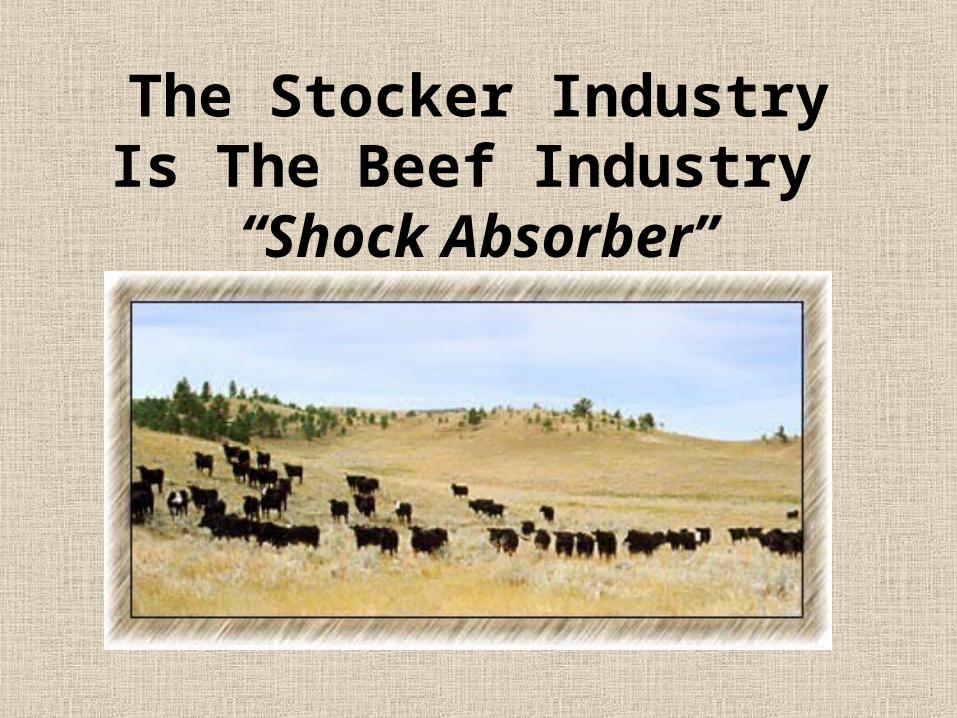
The Stocker Industry Is The Beef Industry “Shock Absorber”
How Does The How Does The Stocker Industry Stocker Industry Accomplish All Accomplish All These Things?These Things?
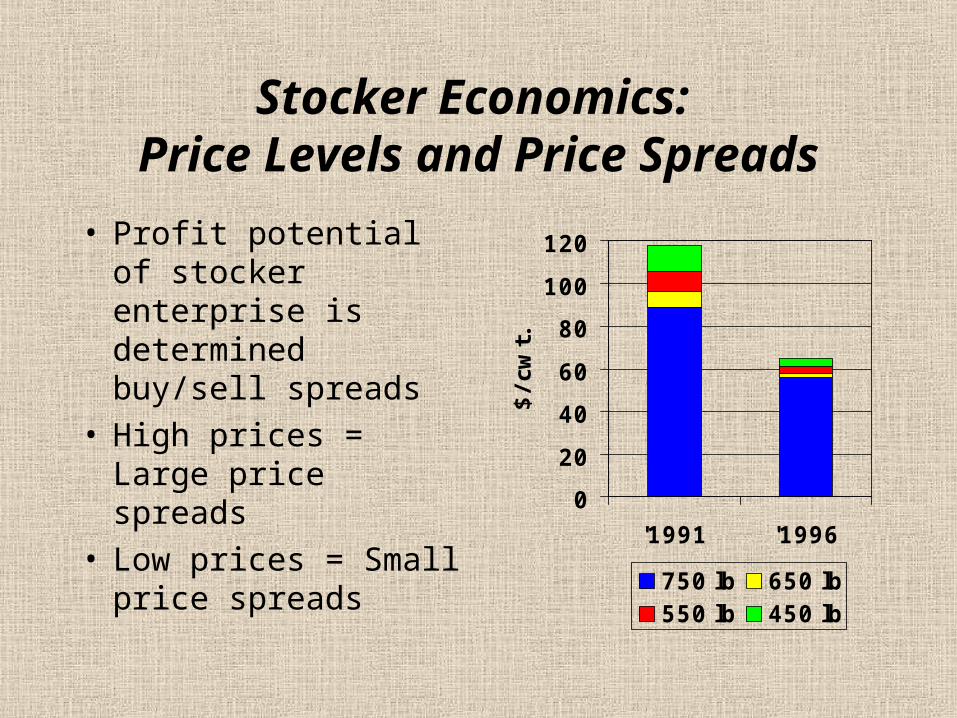
Stocker Economics: Price Levels and Price
Spreads• Profit potential of
stocker enterprise is determined buy/sell spreads
• High prices = Large price spreads
• Low prices = Small price spreads
0
20
40
60
80
100
120
'1991 '1996$/c
wt.
750 lb 650 lb550 lb 450 lb
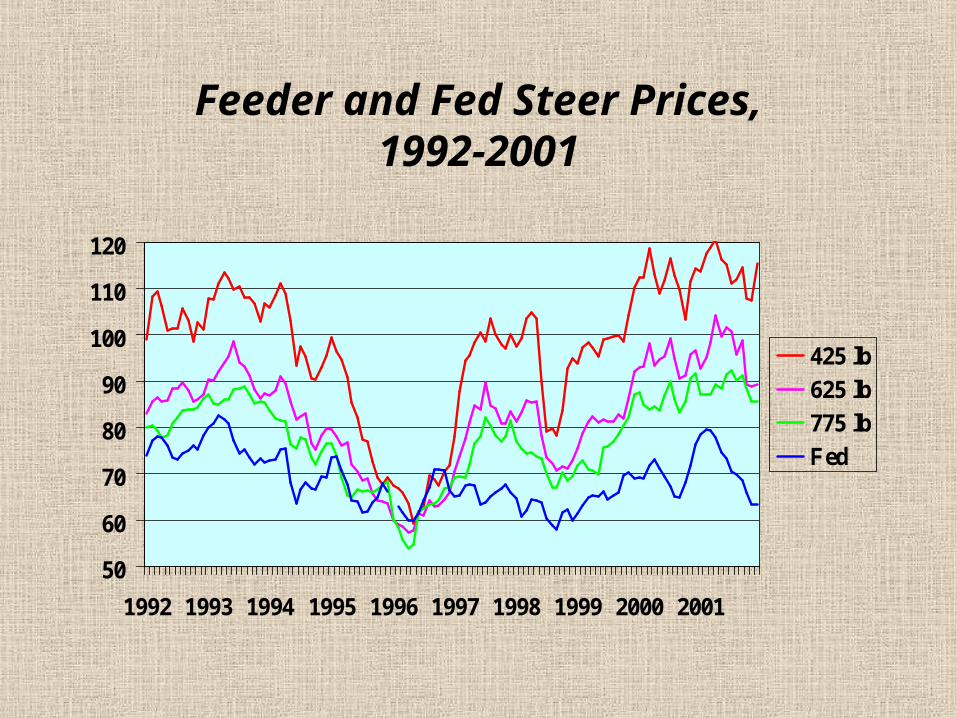
Feeder and Fed Steer Prices,1992-2001
50
60
70
80
90
100
110
120
1992 1993 1994 1995 1996 1997 1998 1999 2000 2001
425 lb
625 lb
775 lb
Fed
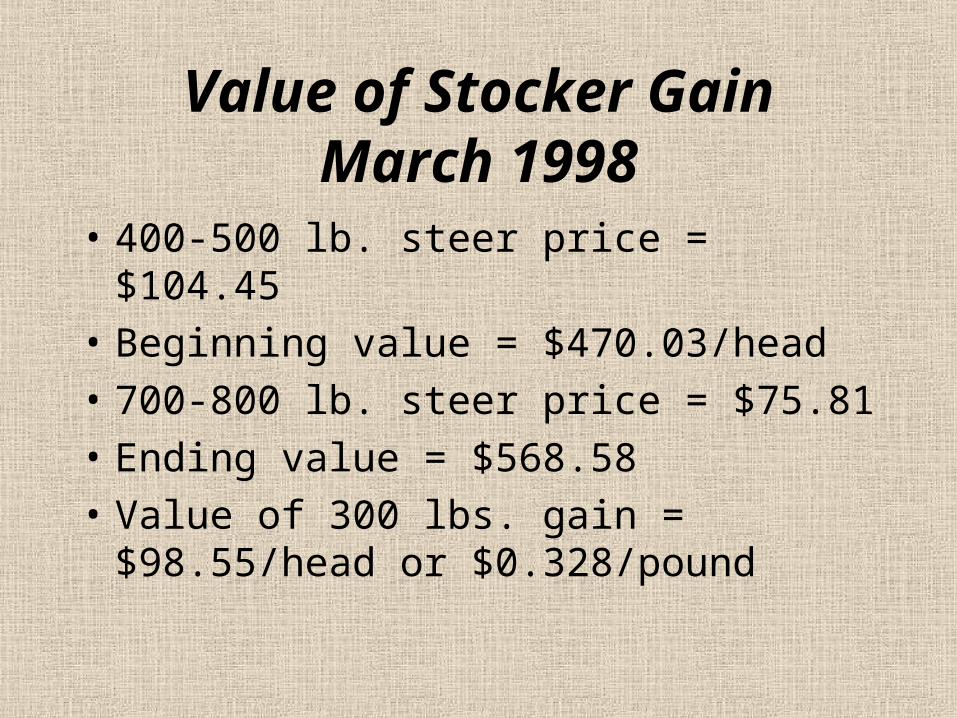
Value of Stocker GainMarch 1998
• 400-500 lb. steer price = $104.45• Beginning value = $470.03/head• 700-800 lb. steer price = $75.81• Ending value = $568.58• Value of 300 lbs. gain =
$98.55/head or $0.328/pound
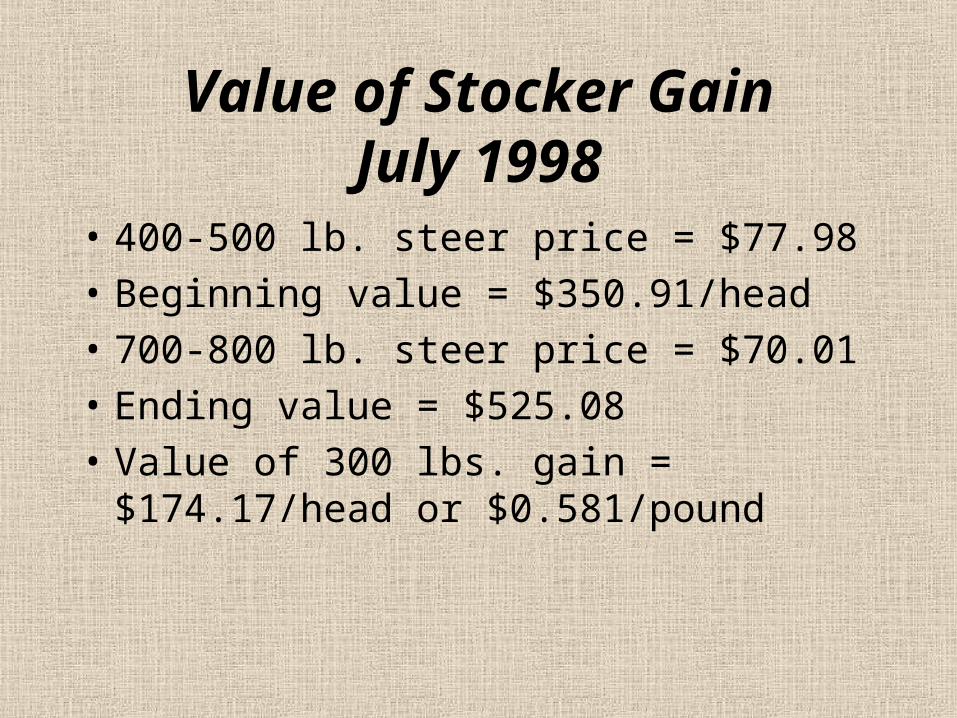
Value of Stocker GainJuly 1998
• 400-500 lb. steer price = $77.98• Beginning value = $350.91/head• 700-800 lb. steer price = $70.01• Ending value = $525.08• Value of 300 lbs. gain =
$174.17/head or $0.581/pound
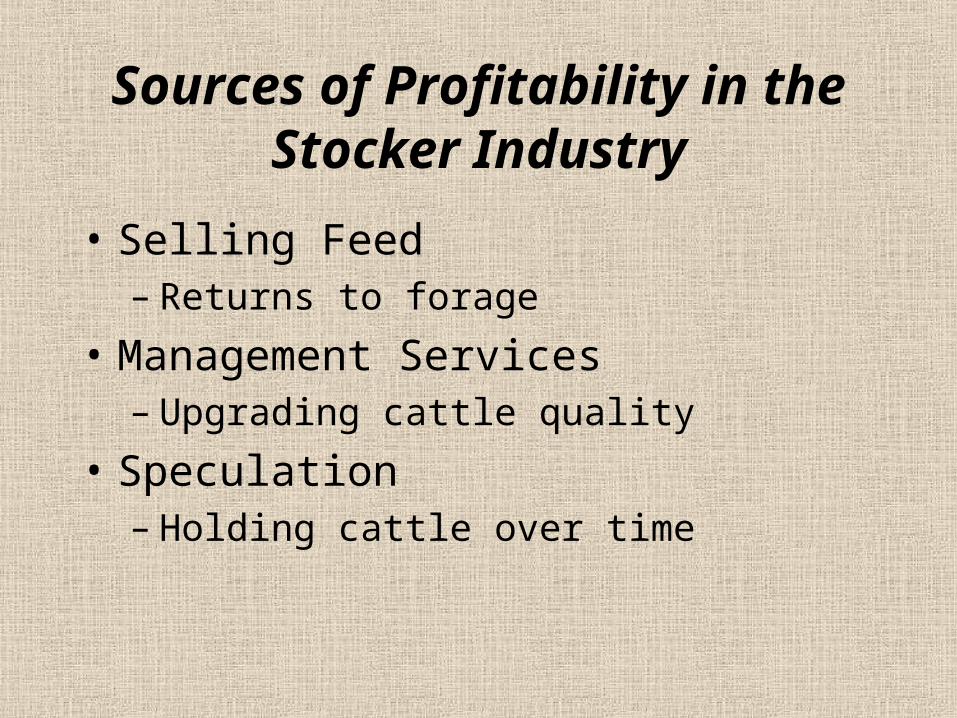
Sources of Profitability in the Stocker Industry
• Selling Feed– Returns to forage
• Management Services– Upgrading cattle quality
• Speculation– Holding cattle over time
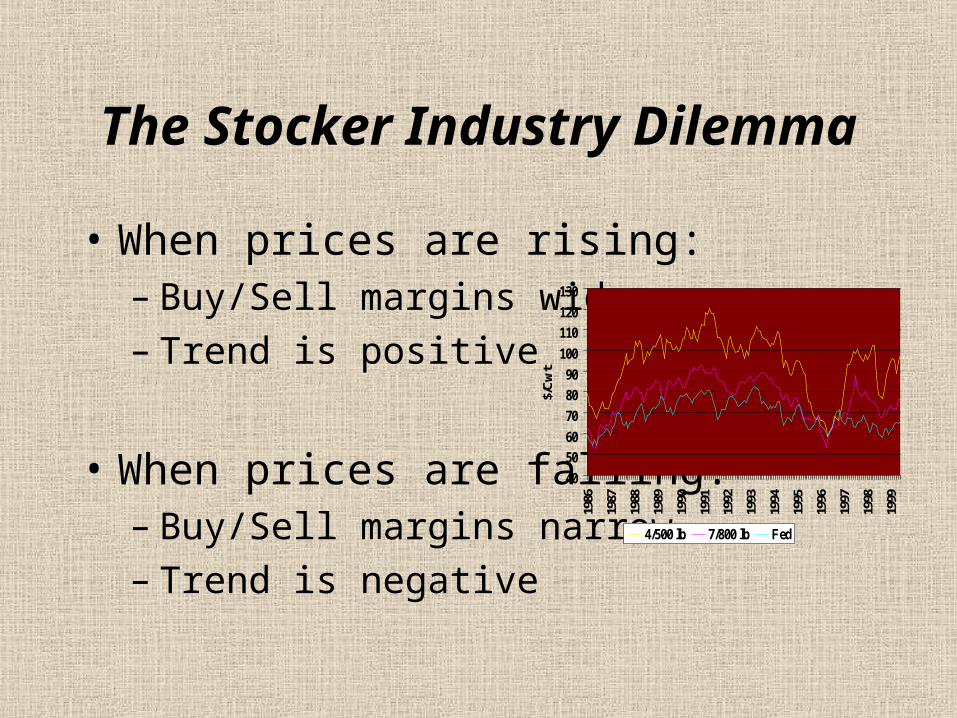
The Stocker Industry Dilemma
• When prices are rising:– Buy/Sell margins widen– Trend is positive
• When prices are falling:– Buy/Sell margins narrow– Trend is negative
40
50
60
70
80
90
100
110
120
130
1986
1987
1988
1989
1990
1991
1992
1993
1994
1995
1996
1997
1998
1999
$/C
wt
4/500 lb 7/800 lb Fed
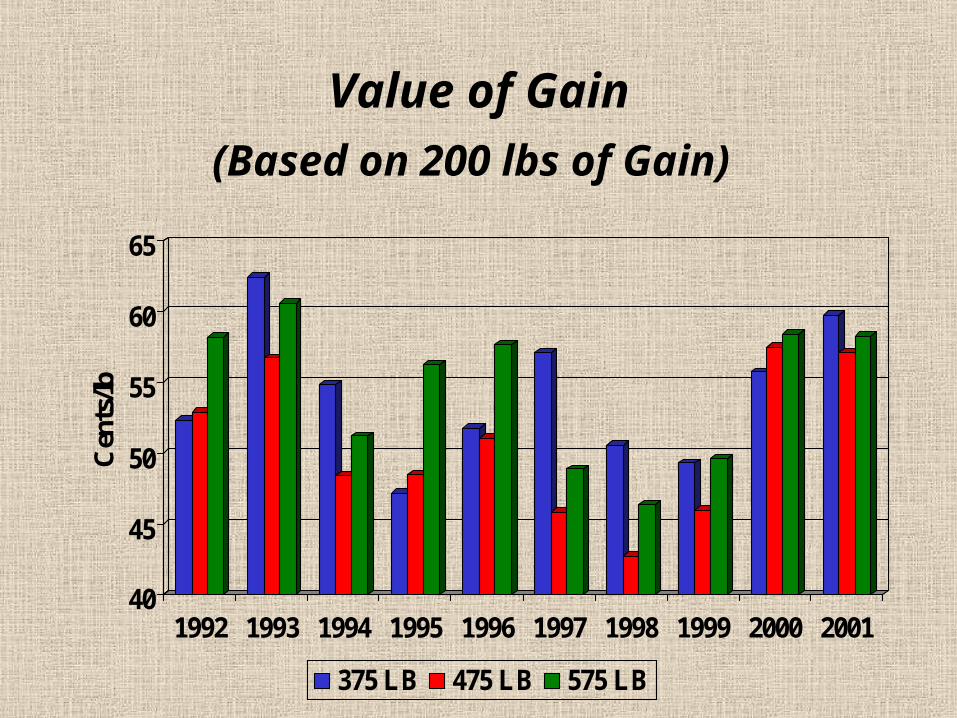
Value of Gain(Based on 200 lbs of Gain)
40
45
50
55
60
65
Cen
ts/lb
1992 1993 1994 1995 1996 1997 1998 1999 2000 2001
375 LB 475 LB 575 LB
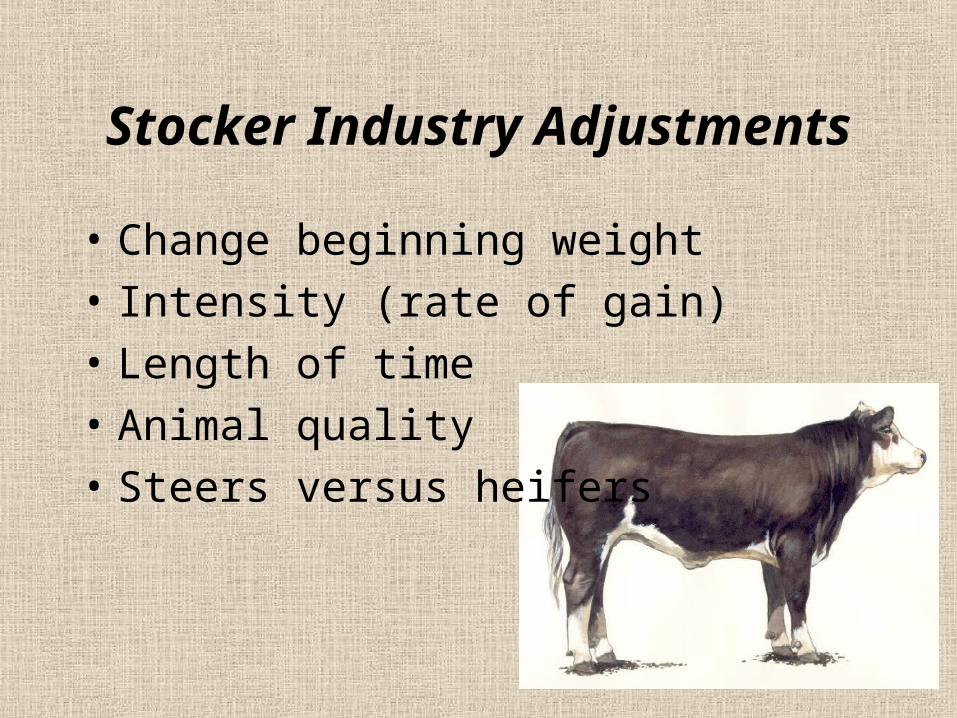
Stocker Industry Adjustments
• Change beginning weight• Intensity (rate of gain)• Length of time• Animal quality• Steers versus heifers
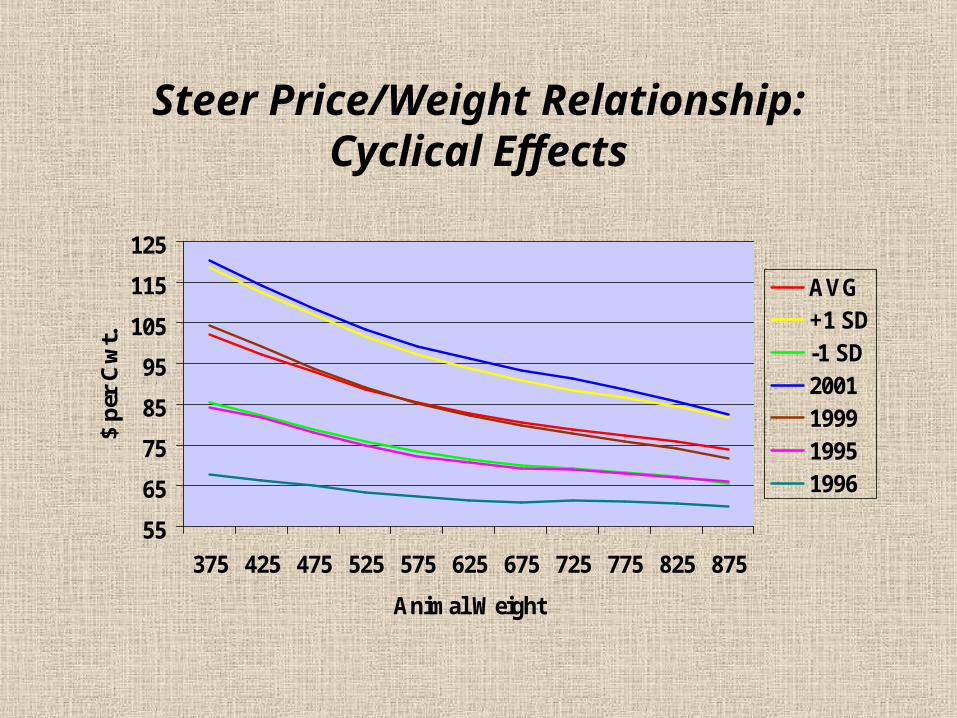
Steer Price/Weight Relationship:Cyclical Effects
55
65
75
85
95
105
115
125
375 425 475 525 575 625 675 725 775 825 875
Animal Weight
$ p
er C
wt.
AVG+1 SD-1 SD2001199919951996
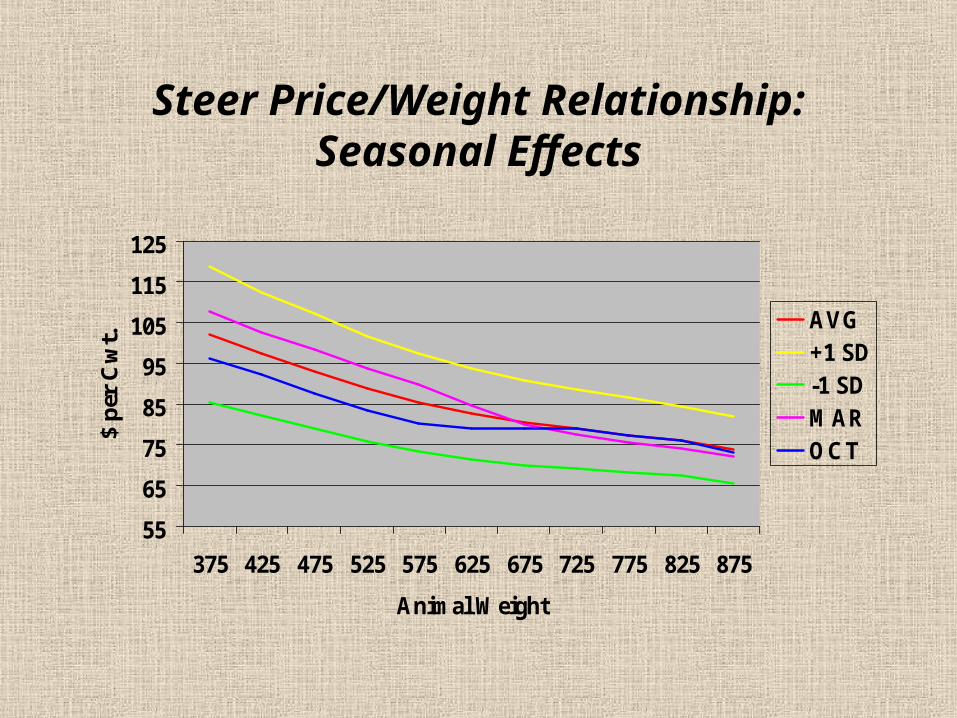
Steer Price/Weight Relationship:Seasonal Effects
55
65
75
85
95
105
115
125
375 425 475 525 575 625 675 725 775 825 875
Animal Weight
$ p
er C
wt.
AVG+1 SD-1 SDMAROCT
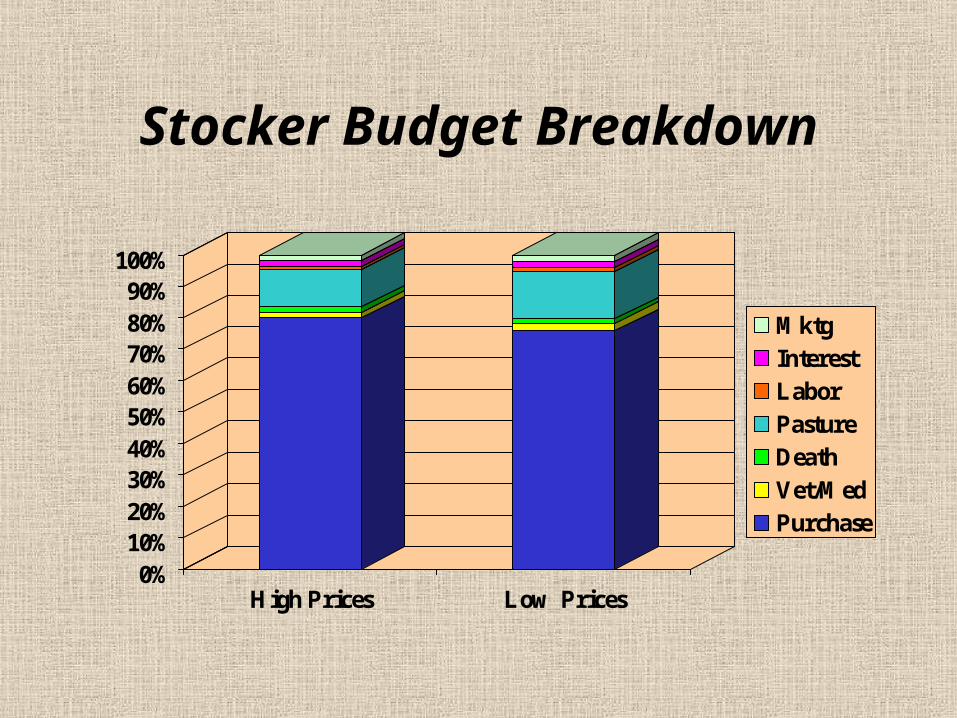
Stocker Budget Breakdown
0%10%20%30%40%50%60%70%80%90%
100%
High Prices Low Prices
MktgInterestLaborPastureDeathVet/MedPurchase
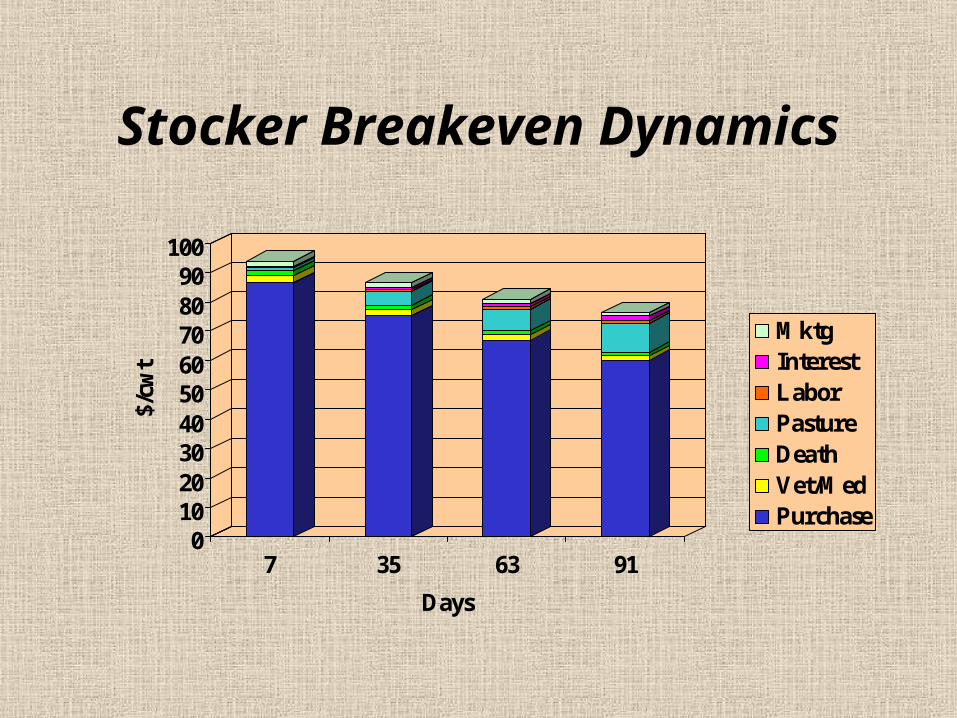
Stocker Breakeven Dynamics
0102030405060708090
100
$/cw
t
7 35 63 91
Days
MktgInterestLaborPastureDeathVet/MedPurchase
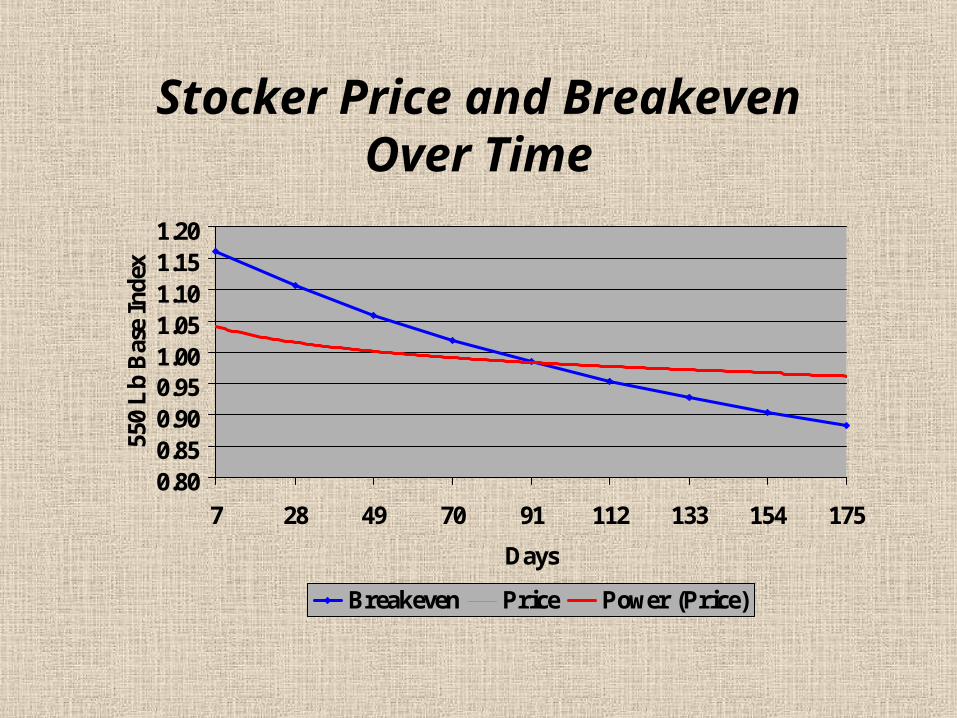
Stocker Price and BreakevenOver Time
0.800.850.900.951.001.051.101.151.20
7 28 49 70 91 112 133 154 175
Days
550
Lb
Bas
e In
dex
Breakeven Price Power (Price)
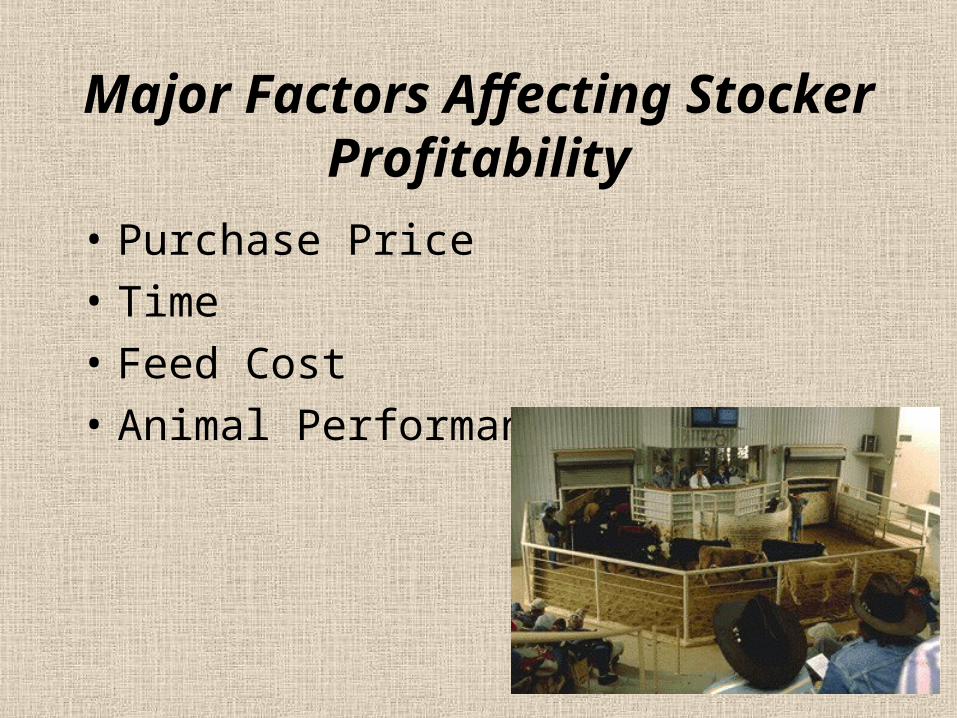
Major Factors Affecting Stocker Profitability
• Purchase Price• Time• Feed Cost• Animal Performance
Summary
• Stocker industry plays a vital role in the cattle industry
• Southern Plains winter wheat pasture grazing plays a unique role
• Stocker production is especially important in Oklahoma