Embed Size (px)
Citation preview
The Online Journal of New Horizons in Education Volume 4 Issue 1 January 2014 Editor-in-Chief Prof. Dr. Aytekin İşman Editor Prof. Dr. Cem BİROL Associate Editors Assoc. Prof. Dr. Ahmet ESKİCUMALI Assoc. Prof. Dr. Fatoş SİLMAN Assoc. Prof. Dr. Fahriye ALTINAY AKSAL Assoc. Prof. Dr. Zehra ALTINAY GAZİ Inst. Aydın KİPER
www.tojned.net 01.01.2014
ISSN: 2146-7374
The Online Journal of New Horizons in Education Volume 4, Issue 1
www.tojned.net
Copyright © 2011 - THE ONLINE JOURNAL OF NEW HORIZONS IN EDUCATION All rights reserved. No part of TOJNED’s articles may be reproduced or utilized in any form or by any means, electronic or mechanical, including photocopying, recording, or by any information storage and retrieval system, without permission in writing from the publisher. Contact Address: Prof. Dr. Aytekin İŞMAN TOJNED, Editor in Chief Sakarya-Turkey
Published in TURKEY
The Online Journal of New Horizons in Education Volume 4, Issue 1
www.tojned.net
Message from the Editors
Dear readers, The Online Journal of New Horizons in Education has published first issue of 2014. I would like to wish you good knowledge sharing and brilliant professional activities in the New Year. In this respect, I am happy to put forward gaining success of presenting international researches by my team and enhancing quality in the academic agenda. It is crucial to make a bridge between researchers and as an editor-in-chief, I would like to thank readers, researchers and academicians whose support pay attention to our journal’s development. The Online Journal of New Horizans in Education has interdisciplinary researches. We are pleased to receive your qualified research papers for the next issues. January 01.2014 Prof. Dr. Aytekin İŞMAN Editor in Chief
I would like to thank researchers and editorial team for their contributions to this current issue. It is great pleasure for me to share first issue of 2014. I wish efficient and productive activities in your academic agenda in 2014. The Online Journal of New Horizons in Education has interdisciplinary view within its quality. This issue encapsulates different methodologies and focuses on research agenda. January 01.2014 Prof. Dr. Cem BİROL Edior
The Online Journal of New Horizons in Education Volume 4, Issue 1
www.tojned.net
Editor-in-Chief Prof. Dr. Aytekin İŞMAN - Sakarya University, Turkey Editor Prof. Dr. Cem BİROL - Eastern Mediterranean University, TRNC Associate Editors Assoc. Prof. Dr. Ahmet ESKİCUMALI - Sakarya University, Turkey Assoc. Prof. Dr. Fatoş SİLMAN - Near East University, TRNC Assoc. Prof. Dr. Fahriye ALTINAY AKSAL - Near East University, TRNC Assoc. Prof. Dr. Zehra ALTINAY GAZİ - Near East University, TRNC Inst. Aydın KİPER - Sakarya University, Turkey Editorial Board
Ahmet MAHIROGLU, Gazi University, Turkey Ahmet PEHLİVAN - International Cyprus University,
TRNC Antoinette MUNTJEWERFF, University of
Amsterdam, Netherlands Arif ALTUN, Hacettepe University, Turkey
Arvind SINGHAL, University of Texas, United States Aytekin ISMAN, Sakarya University, Turkey
Brent G. WILSON, University of Colorado at Denver, United States
Buket AKKOYUNLU, Hacettepe University, Turkey Cevat CELEP, Kocaeli University, Turkey
Charlotte GUNAWARDENA, University of New Mexico, United States
Colleen SEXTON, Governor State University, United States
Coskun BAYRAK, Anadolu University, Turkey Don FLOURNOY, Ohio University, United States
Enver Tahir RIZA, Dokuz Eylul University, Turkey Erdal ZORBA, Gazi University, Turkey
Ferhan ODABASI, Anadolu University, Turkey Francine Shuchat SHAW, New York University,
United States Gianni Viardo VERCELLI, University of Genova, Italy
Giovanni ADORNI, University of Genova, Italy Gilbert Mbotho MASITSA, Universirty of The Free
State - South Africa Gregory ALEXANDER, Universirty of The Free State -
South Africa Gurhan CAN, Anadolu University, Turkey
Halil Ibrahim YALIN, Gazi University, Turkey Heli RUOKAMO, University of Lapland, Finland Huseyin BASAR, Hacettepe University, Turkey
Jerry WILLIS, Manhattanville College, United States Mariam MANJGALADZE, Institute of Linguistics,
Georgia Marina Stock MCISAAC, Arizona State University,
United States
Kenan OLGUN, Sakarya University, Turkey Mehmet CAGLAR, Near East University, TRNC Mustafa KALKAN, Dokuz Eylul Universiy, Turkey Nerguz BULUT SERIN, International Cyprus University, TRNC Nilay BUMEN, Ege University, Turkey Oguz SERIN, International Cyprus University, TRNC Selahhattin GELBAL, Hacettepe University, Turkey Selahattin GÖNEN, Dicle University, Turkey Teressa FRANKLIN, Ohio University, United States Aaron DAVENPORT, Grand View College, United States Adem UZUN, Uludag University, Turkey Ahmet AKIN, Sakarya University, Turkey Ahmet ESKİCUMALI, Sakarya University, Turkey Ali Sidki AGAZADE, Eastern Mediterranean University, TRNC Andreja Istenic STARCIC, University of Primonska, Slovenija Antonis LIONARAKIS, Hellenic Open University, Greece Bayram ÇETİN, Mustafa Kemal University, Turkey Cüneyt BİRKÖK, Sakarya University, Turkey Dale HAVILL, Dhofar University, Oman Elnaz ZAHED, University of Waterloo, UAE Fahriye ALTINAY AKSAL, Eastern Mediterranean University, TRNC Fatime BALKAN KIYICI, Sakarya University, Turkey Gulriz IMER, Mersin University, Turkey Hasan Basri GÜNDÜZ, Sakarya University, Turkey Hüseyin ÇALIŞKAN, Sakarya University, Turkey Hj. Mohd Arif Hj. ISMAIL, National University of Malaysia, Malaysia Huseyin YARATAN, Eastern Mediterranean University, TRNC Jagannath DANGE, Kuvempu University, India James C. HOLSTE, Texas A&M University at Qatar, Qatar
The Online Journal of New Horizons in Education Volume 4, Issue 1
www.tojned.net
Martin STEIN, Westfalische Wilhems University, Germany
Mehmet Ali KISAKUREK, Ankara University, Turkey Mehmet Durdu KARSLI, Canakkale 18 Mart
University, Turkey Miguel j. ESCALA, Ins. Tech. de Santa Domingo,
Dominican Republic Monte CASSIM, Ritsumeikan Asi Pacific University,
Japan Mufit KOMLEKSIZ, Ege University, Turkey Murat BARKAN, Yasar University, Turkey
Mustafa SAGLAM, Anadolu University, Turkey Nabi Bux JUMANI, Allama Iqbal Open University,
Pakistan Ozcan DEMIREL, Hacettepe University, Turkey
Petek ASKAR, Hacettepe University, Turkey Rauf YILDIZ, Canakkale 18 Mart University, Turkey
Ramazan ABACI, Sakarya University, Turkey Saedah SIRAJ, University of Malaya, Malaysia
Satilmis TEKINDAL, Turkey Sefik YASAR, Anadolu University, Turkey
Songul ALTINISIK, Abant Izzet Baysal University, Turkey
Stefan AUFENANGER, University of Mainz, Germany Suleyman DOGAN, Ege University, Turkey
Ş. Şule ERCETIN, Hacettepe University, Turkey Ulku KOYMEN, Girne American University, TRNC
Vahdettin SEVINC, Sakarya University, Turkey Yavuz AKPINAR, Bogazici University, Turkey
Yuksel KAVAK, Hacettepe University, Turkey Abdülkadir MASKAN, Dicle University, Turkey
Cem BIROL, Eastern Mediterranean University, TRNC
Danguole RUTKAUSKIENE, Kauno Tech. University, Lithuania
Eric Zhi-Feng LIU, National Cenral University, Taiwan Fatos SILMAN, Near East University, TRNC
Filiz POLAT, The University of Hong Kong, China Iman OSTA, Lebanese American Universiy, Lebanon
Kakha SHENGELIA, Caucasus University, Georgia Manoj Kumar SAXENA, M M College of Education, India Mehmet Ali DIKERDEM, Middlesex University, U.K. Mehmet ÖZDEMİR, Sakarya University, Turkey Metin YAMAN, Gazi University, Turkey Min JOU, National Taiwan Normal Uni., Taiwan Murat ISKENDER, Sakarya University, Turkey Mustafa BAYRAKCI, Sakarya University, Turkey Mustafa GAZI, Eastern Mediterranean University, TRNC Mubin KIYICI, Sakarya University, Turkey Neşe GÜLER, Sakarya University, Turkey Nilgun TOSUN, Trakya University, Turkey Nursen SUCSUZ, Trakya University, Turkey Omer Faruk TUTKUN, Sakarya University, Turkey Osman TİTREK, Sakarya University, Turkey Ozcan Erkan AKGUN, Sakarya University, Turkey Pamela EWELL, Central .College of IOWA, United States Paul KGOBE, Centre of Edu. Pol. Dev., South Africa Paul Serban AGACHI, Babes-Bolyai University, Romania Paula FITZGIBBON, University of Victoria, Canada Psaltis IACOVOS, European University Cyprus, Cyprus Partow IZADI, University of Lapland, Finland Rıfat EFE, Dicle University, Turkey Seref TAN, Uludag University, Turkey Tam Shu SIM, University of Malaya, Malaysia Vincent Ru-Chu SHIH, National Pingtung Univ. of Sci. & Tech., Taiwan Vu Thi Thanh HOA, Oxfam Great Britain, Vietnam Yuksel GUCLU, Sakarya University, Turkey Zehra ALTINAY GAZI, Near East University, TRNC
The Online Journal of New Horizons in Education Volume 4, Issue 1
www.tojned.net
Table Of Contents
A CONCEPTUAL ANALYSIS OF GRADE SPAN CONFIGURATIONS FOR 6-8 AND K-8 PUBLIC SCHOOLS 1
David M. Clark
A REVIEW OF PHYSICAL EDUCATION TEACHERS’ EFFICACY IN TEACHING-LEARNING PROCESS 25
Gökhan Çetinkol, Serap Özbaş
CREATING TEACHING MATERIALS FOR STUDENTS OF NURSING WITH THE USE OF E-LEARNING METHODS
32
Iwona Bodys-Cupak, Anna Majda, Joanna Zalewska-Puchała, Zofia Musiał
ENGLISH LANGUAGE LEARNERS AND INTERCULTURAL COMPETENCE 39
Grisel Garcia-Perez, Karen Ragoonaden, Robert Campbell
EVALUATING IMAGES OF THE ENVIRONMENT FOR EDUCATIONAL USE: EXPLORING THE USE OF A RUBRIC DERIVED FROM VISUAL INFORMATION THEORY
49
Vanessa L. Hunt , Debbie Smick Muthersbaugh, Anne Kern
OBJECTIVE STRUCTURED CLINICAL EXAMINATION (OSCE) AS A METHOD OF ASSESSMENT OF LEARNING OUTCOMES FOR STUDENTS OF NURSING
67
Kamińska A. , Majda A., Ogórek-Tęcza B. [3], Radwańska J.
SCHOOL COUNSELOR INVOLVEMENT AND COLLEGE DEGREE ATTAINMENT: A QUANTITATIVE CONUNDRUM
75
Jason Kushner, G. Michael Szirony
TOTAL QUALITY AND MANAGEMENT POLICIES IN THE EDUCATION PROCESS 80
Behçet Öznacar, Mesut Yılmaz
TOWARD A JUSTICE ORIENTED EDUCATION: AN ANALYSIS OF TURKISH EDUCATION FROM A RAWLSIAN PERSPECTIVE
85
Rasit Celik
WHAT MAKES THEM STILL TICK? A STUDY OF JOB (DIS) SATISFACTION AMONG LONG SERVING TEACHERS IN MALTA
97
Brian Vassallo
The Online Journal of New Horizons in Education Volume 4, Issue 1
A Conceptual Analysis of Grade Span Configurations for 6-8 and K-8 Public Schools David M. Clark [1]
[1] Pearson Corporation John R. Slate, Julie P. Combs, and George W. Moore Sam Houston State University
ABSTRACT
In this extensive review of the literature, we addressed the topic of grade span configurations and academic achievement as they relate to adolescents. We examined the historical trends of school organization to provide a context for understanding policies and decisions regarding grade span configurations. We also analyzed early studies regarding nonacademic student indicators and grade spans as background for more recent academic investigations. Two major school reform movements were discussed because of their prominence in the history of grade span configurations. Moreover, international, national, and state assessment data were explored regarding adolescent proficiency and student growth over the past 20 years. Finally, we outlined the two major theories (i.e., school transition and instructional environment) that have framed the grade span configuration debate from its inception
Keywords:
INTRODUCTION
In this article, literature related to grade span configurations and academic achievement pertaining to adolescent students was reviewed. The historical trends of school organization were examined to understand the social and pragmatic roots underlying policies and decisions that have been made regarding grade span configurations. Early studies pertaining to nonacademic student indicators and grade spans were also analyzed to provide context for later academic studies. Details regarding two major school reform movements were also provided, given the prominence of those two initiatives in the history of the topic. In addition, data related to international, national, and state assessments were explored to gauge adolescent proficiency and student growth over the past 20 years, and studies related to academic achievement and grade spans were analyzed. Finally, two theories are outlined that have framed the grade span configuration debate from its inception, namely school transition and instructional environment.
Early Schools in America
At the onset of compulsory public education in the United States, rural schools were primarily one-room structures containing all grade levels, whereas urban schools tended to divide students into primary (i.e., 8-year, Grades 1-8) and secondary (i.e., 4-year, Grades 9-12) schools (Schafer, 2010). In some cases, a six year-six year (grades 1-6 and 7-12) model was implemented because it provided for a more natural transition of adolescents into the workforce following the sixth grade (Elovitz, 2007). However, such early deviations were rare, and the division of primary and secondary education into eight-year elementary and four-year high schools was the principal configuration for American public schools throughout the 19th century (Manning, 2000).
One of the first calls to restructure public education’s two-tier system came in the late 1800s. Harvard University president Charles Eliot and his peers on the National Education Association’s Committee of Ten on Secondary Schools Studies argued that the later years of primary schools were wasted, and could be better utilized by introducing college
www.tojned.net
1
The Online Journal of New Horizons in Education Volume 4, Issue 1
preparatory courses to students at an earlier age (National Education Association [NEA], 1894). The committee advocated for secondary education to begin in the seventh grade rather than the ninth, in order to provide gifted and college-bound students a better opportunity to reach their full potential as early as possible. In a report published 5 years after the committee’s commission, the NEA (1899) declared that “the seventh grade, rather than ninth, [was] the natural turning point in [a] pupil’s life ... and demand[ed] new methods and wiser direction” (p. 10).
Around this same time, new ideas began emerging that recognized adolescence as a distinct phase of life, with defining characteristics and unique social needs (Angus, Mirel, & Vinovskis, 1988; Commission on the Reorganization of Secondary Education, 1918; Juvonen et al., 2004). Hall (1905), a prominent psychologist during this period, argued that when students reached puberty distinct developmental needs arose and had to be addressed. In regard to schooling, he observed:
The pupil in the age of spontaneous variation which at no period of life is so great ... suffers from mental ennui and dyspepsia, and this is why so many and an increasing number refuse some of the best prepared courses. (p. 509)
Hall would advocate for a separate transitional period for students that would ease their move from an eight-year primary school to the more demanding environment of the high school.
In addition to Eliot’s call for academic rigor at an earlier age, and the recognition of puberty’s roll in adolescence, many other factors played a significant role in the reorganization of public education’s two-tier system. An influx of immigrants into elementary urban schools resulted in overcrowding and soaring drop-out rates in the later grades (Angus et al., 1988; Juvonen et al., 2004), new child labor laws instituted in the early 20th century meant more students would be staying in school longer as opposed to working in the factories, (which exacerbated the overcrowding problem) (Elovitz, 2007), and, finally, industrialists called for an earlier secondary experience for students in the hopes that it would inject more high school graduates into the factory workforce (Juvonen et al., 2004). For all of these reasons, at the turn of the 20th century, a new three-tier model emerged that moved upper grade students out of the primary school and into junior high schools (Cook et al., 2008).
Although difficult to establish precisely when and where the first junior high school was established in the United States, it is generally accepted that the first schools began appearing around 1910 (Juvonen et al., 2004). These new schools, which typically housed Grades 7-9, were designed to expose students “to a high school-like environment without the trauma of placing them in the same building as older teenagers” (Bedard & Do, 2005, p. 660). Shortly after the debut of the junior high school, policy makers quickly realized that the new three-tier model was cost-effective, solved problems of over-crowding, and offered advanced students a more rigorous curriculum. However, Otto (1931) commented that the efficacy of the new model to general student learning had not been examined.
Expansion of the junior high school model was rapid. In the 1920s, four of five high school graduates had attended a 8-year primary school followed by a 4-year high school, and by 1960, four of five graduates reported attending an elementary school, a 3-year junior high and a 3-year senior high (Alexander & McEwin, 1989; Elovitz, 2007). However, the fast ascent of the junior high school did not occur without criticism. From the very beginning, concerns arose regarding whether the new model was appropriately addressing any of the needs of early adolescents (Hansen & Hearn, 1971). Cuban (1992) contended that the junior high schools too closely mirrored the high schools they were designed to transition to in “curriculum, instruction, organization, teacher attitudes toward subject matter, and extracurricular activities” (p. 242), offering little or no consideration to the distinct developmental issues related to pubescent teens. From 1920 to 1960 dissatisfaction with the junior high school grew substantially (Cuban, 1992; Hansen & Hearn, 1971; Schafer, 2010; Weiss & Kipnes, 2006).
The Rise of the Middle School
The junior high schools that had spread rapidly across the United States did not fit the increasingly popular view that young teens had unique social, psychological, intellectual, and emotional needs that required a different kind of education than that provided by either elementary or high schools (Schafer, 2010). As a result, Gruhn and Douglass (1956) advocated setting new goals for junior high schools that included (a) the exploration of student’s interests and abilities, (b) differentiated instruction based on students’ backgrounds and aptitudes, and (c) providing socialization experiences that would offer guidance in decision-making. In addition, Alexander and Williams (1965) called for
www.tojned.net
2
The Online Journal of New Horizons in Education Volume 4, Issue 1
organizational structures that would foster social ties between teachers and students while utilizing the strengths of teachers with different specialties. However, despite the theoretical rhetoric calling for change, junior high schools remained the same, “with ... emphasis on content rather than exploration, departmentalization rather than integration, and an adherence to rigid schedule” (Brough, 1995, p. 38).
Despite growing dissatisfaction with junior high schools, in the 1960s, policy makers began making a general call for the inclusion of sixth-grade students into the junior high school model (Bedard & Do, 2005). Part of the reason lay with the maturation process, and Tanner’s (1962) observation that young teens were reaching puberty earlier than their counterparts in the 1900s. Eichorn (1966) argued, rehashing the preliminary argument from decades earlier, that a middle school model including the sixth grade would serve as a bridge to help students make the transition from the classrooms of elementary schools to the departments and class periods of high schools. However, the primary reason for inclusion of the sixth grade into a new middle school model seems to have been based more in organizational and structural limitations rather than taking the needs of adolescent students into consideration.
In the 1960s, secondary school enrollments were declining whereas elementary school enrollments were exploding because of large birth cohorts following the war and the popularity of early childhood education (Juvonen et al., 2004). According to Alexander (1984), the resulting shortage of space at the elementary level caused the sixth grade to be pushed out into the junior high level. A 1967 survey of middle school principals gave credence to this hypothesis when the respondents stated that the most frequent reason for establishing middle schools had to do with relieving overcrowded conditions in elementary schools (Alexander & George, 1981).
Primarily as a result of enrollment pressures brought on by societal factors and encouraged by idealistic educators, scholars, and intermediate school reformers, middle schools (containing Grades 6-8 and 6-9) developed in different pockets across the United States (Eichorn, 1984; Weiss & Kipnes, 2006). As before, researchers examining the efficacy of the new model concluded that “no research with significant findings to substantiate one organizational pattern over another,” was present and remarked that “all [grade span organization] lack[ed] a validating research base” (Martin, 1974, p. 7). In spite of this deficiency, however, middle schools rapidly replaced junior high schools in the 1960s and 1970s, and became the dominant intermediate structure by the 1990s (Herman, 2004; Mizell, 2005; Paglin & Fager, 1997). Similar to the establishment of junior high schools in the early 1900s, criticism of the newly formed middle schools began shortly after their creation (Elovitz, 2007). In light of the fact that the underlying cause of the reorganization was driven by pragmatic reasons, as opposed to ideological calls for reform, the newly configured schools possessed many of the unfavorable characteristics of the junior high schools that came before them (Cuban, 1992), and led some persons to claim that the “changes were restricted largely to the names of the schools and the grades they contained” (MacIver & Epstein, 1993, p. 835).
The Middle School Concept
Despite repeated calls, going as far back as the late 19th century, for intermediate school reform based on the emerging and ever growing body of research concerning the needs of adolescents (Alexander & Williams, 1965; Gruhn & Douglass, 1956; Hall, 1905; NEA, 1894, 1899; Otto, 1931), it was not until the 1980s that the educational community, as a whole, came together to launch a nationwide movement for middle school transformation. Comprehensively summing up the problems of the middle school, which had its origins in the junior high schools of the early 1900s, and which had proliferated for 20 years since their creation in the 1960s, Alexander and George (1981) wrote:
The concept of a bridging school is not enough ... because children of middle school age have their unique characteristics and needs which cannot be subordinated to the impact of the elementary school nor to the demands of the high school. An effective middle school must not only build upon the program on earlier childhood and anticipate the program of secondary education to follow, but it must be directly concerned with the here-and-now problems and interests of its students. Furthermore, the middle school should not be envisioned as a passive link in the chain of education below the college and university, but rather as a dynamic force in improving education. (p. 2)
This newly organized middle school movement focused its attention on the “volatile mismatch ... between the organization and curriculum of middle grades schools, and the intellectual, emotional, and interpersonal needs of young adolescents” (Carnegie Council on Adolescent Development, 1989, p. 32). Comprising the views of educational leaders, psychologists, school administrators, and teachers, a new Middle School Concept was proposed as the solution to the
www.tojned.net
3
The Online Journal of New Horizons in Education Volume 4, Issue 1
woes of intermediate education in public schools. In 1985, the National Association of Secondary School Principals (NASSP) published An Agenda for Excellence at the Middle Level, detailing the primary components of the Middle School Concept, including (a) altering the culture and climate of the school to support excellence and achievement rather than intellectual conformity and mediocrity; (b) providing opportunities for students to achieve and excel in a number of domains, including the arts, athletics, academics, crafts; (c) creating a caring, supportive atmosphere that tolerates and welcomes a wide angle of student diversity; (d) establishing student advisement programs that would assure each student regular, compassionate, and supportive counsel from a concerned adult; (e) fostering sensitivity to the needs of the physical, intellectual, emotional, and social conditions of students; (f) creating opportunities for students to explore their aptitudes, interests, and special talents and to develop an accurate and positive self-concept; (g) instituting a curriculum that balances skills for continued learning with content coverage which may be outdated before it is used; and (h) relating curriculum content to the immediate concerns of the young adolescent, assuring its utility outside the classroom (pp. 2-11).
From the 1980s to the present, the Middle School Concept dominated the educational landscape in terms of espousing the best instructional and organizational practices for adolescents (Erb, 2006; George, 1999; National Middle School Association [NMSA], 2003). Shortly after Alexander and George (1981) rallied against the notion of the middle school as a mere stepping stone to high school, a huge volume of position papers and professional development sessions were produced that focused on successful pedagogy, leadership, and instructional strategies at the middle school level (Offenburg, 2001). During the course of this 30-year movement, the Middle School Concept was refined and expanded, ultimately coming together in one solid and unified philosophy regarding best practices for middle schools (Carnegie Council on Adolescent Development, 1989; NASSP, 1985; NMSA, 2003; Schafer, 2010; Tucker & Codding, 1999). Even though middle schools had been in operation since the 1960s, and were continuing many of the negative high school practices of the junior high schools that preceded them, proponents of the Middle School Concept argued that the middle school grade span configurations (i.e., 6-8, 6-9) were ideal for such best practices as team teaching, mixed level classrooms, and small learning communities (Epstein & MacIver, 1990; Hough, 2005; Lee & Smith, 1993; Midgley, 1993; Offenberg, 2001). All that was required to achieve results was successful implementation.
By 2002, the National Forum to Accelerate Middle Grades Reform had recognized eight different middle school reform models, aligned to the principles of the Middle School Concept, that were being used across the country. In addition, by 2003, as the standards and accountability movement was coming to full fruition following the NCLB Act of 2001 (U.S. Department of Education), national middle school organizations, representing both teachers and administrators, were advocating the philosophy of the Middle School Concept (Juvonen et al., 2004). However, even as the middle school movement was enjoying near universal acceptance, beginning in the 1980s and leading right up to the present, a large volume of studies started appearing that, though inconclusive at first, would eventually call the overall effectiveness of middle schools into question.
The Effectiveness of the Middle School
As the Middle School Concept was gaining universal acceptance, a number of studies started appearing in educational journals across the country that sought to determine the effectiveness of middle schools. These early studies were few and far between at first, but would grow in frequency and depth from the late 1980s to the present (Juvonen et al., 2004). Lacking an appropriate comparison group, student variables between elementary and middle schools were examined. Eventually, the methodology would shift, and comparisons would be made between middle schools and the large number of K-8 schools, also known as “elemiddle” schools (Hough, 2005, p. 10), that existed in districts that had not converted to the three-tier model. These K-8 schools only accounted for 7-9% of the school configurations containing adolescent students from the 1980s until the late 1990s, but provided the best indication of the natural progression of students unencumbered by a transition to middle school (NCES, 2011a).
Initially, researchers did not look at nationwide or statewide standardized student achievement as a dependent variable, primarily because national testing would not begin until the 1990s, and state standardized testing was not mandated until the passage of the NCLB Act. However, other student indicators such as grades, social-emotional well being, attendance, and public perceptions were explored in depth from the 1980s to the present. What follows is a brief summary of the findings of these studies in relation to the student indicators previously mentioned.
Grades/Grade Point Averages
In one of the first landmark studies concerning grades, Finkelstein (1913) concluded that “marks constitute[d] a very real and very strong inducement to work” and were “accepted [by students] as real and fairly exact measurements
www.tojned.net
4
The Online Journal of New Horizons in Education Volume 4, Issue 1
of ability or of performance” (p. 6). Given their importance as external motivators of student achievement (Butler, 2011), grades and grading practices in the middle schools were examined in early studies in which middle schools were compared to elementary schools, and K-8 schools shortly thereafter.
A number of researchers observed in early studies that individual grades and overall GPA were far lower in middle schools than in elementary schools (Eccles et al., 1991; Simmons & Blyth, 1987). In examining the grading practices between the two types of schools, Eccles and Midgley (1989) observed that middle school teachers typically graded more rigorously than did their elementary counterparts. Given the middle school’s close association with the academic model of the high school, like the junior high schools that preceded them (Cuban, 1992)—a model that involves multiple teachers focused on individual subject matter and discipline, as opposed to the elementary model that typically involves one teacher who emphasizes the growth and formation of the whole child (Whitley, Lupart, & Beran, 2007)—the discrepancy between the two, and the resulting decline in student marks, should not have been surprising. However, the more stringent grading practices in the middle school, though perhaps more reflective of actual ability, did have a negative effect on academic self-perception (Murdock, Anderman, & Hodge, 2000), making students less optimistic about their future success in school. Anderman (2002) also observed that declining grades in the middle school were closely associated with student depression and an increase in discipline problems, two issues discussed later in this article.
When examining the actual differences in grades and overall GPA between middle schools and K-8 schools, the research is far less conclusive. Offenburg (2001) compared the grades of students in middle schools to the grades of students in K-8 schools in Philadelphia and established that grades in K-8 schools were significantly higher than grades in middle schools. Offenburg noted that the difference was, on average, one tenth of a letter grade higher per class (or 0.1 in terms of GPA). However, effect sizes were not reported, making it difficult to determine the relevance of these findings. In a similar study, Abella (2005) noted that sixth-grade students had higher GPAs in K-8 schools when compared to middle schools. However, the differences in GPA between the two school settings diminished over the course of 3 years, and by the time the cohort of sixth-grade students examined in the study had transitioned to high school, the increases were completely gone. Finally, in one of the most comprehensive studies comparing 6-8 to K-8 schools, Weiss and Kipnes (2006) examined longitudinal data in Philadelphia Public Schools from the mid 1990s and commented that no significant differences were present between the two school configurations with regard to average grades or course failures.
Overall, the sharp contrast that exists between elementary and middle schools in terms of grading practices and student grades was not as pronounced and definitive when examined between middle and K-8 schools. One possible explanation for these findings could be the fact that most K-8 schools offer a more departmentalized model of instruction beginning in the sixth grade, a model which essentially mirrors the one employed by middle schools, minus the effects of transition from one school to another (Becker, 1987; Brown, 2004; Wihry et al., 1992). Though grades and GPA have been shown to be an inconclusive differentiator in direct comparisons of K-8 to middle schools, other indicators of student success have yielded more stark comparisons.
Social-Emotional Well Being
In the late 19th century educational researchers and psychologists began advocating for educational reform that acknowledged and took into account the social-emotional well being of middle-grade students (Hall, 1905; NEA, 1894, 1899). Despite the fact that early proponents of junior high schools (and middle schools decades later) believed that that moving to a three-tier model would provide a school climate more conducive to the development of adolescents (Weiss & Kipnes, 2006) and act as a transitional bridge between elementary and high schools (Eichorn, 1966), little consideration was actually given to the social-emotional needs of these students in the organization of these new schools (MacIver & Epstein, 1993). Junior high and middle schools sprouted up across the country primarily as a result of shifting enrollments and overcrowding in elementary schools (Juvonen et al., 2004). Lacking a comprehensive and universally accepted reform model for adolescent education, which would not appear until 70 years after the first junior high school opened its doors, the newly established junior high and middle schools simply adopted the practices of high schools in regard to academic structure and discipline management (Cuban, 1992). Researchers following the middle school movement of the 1980s would focus the majority of their attention on the effects that mirroring middle schools after high schools would have on the social-emotional needs of adolescents (Elovitz, 2007).
www.tojned.net
5
The Online Journal of New Horizons in Education Volume 4, Issue 1
In a study that pre-dated the Middle School Concept, Blyth, Simmons, and Bush (1978) observed that boys in
junior high schools did not experience the same levels of growth in the self-esteem during the adolescent years that students in a K-8 school setting did, and that girls actually showed a decline. In a similar study 3 years later, Blyth et al. (1981) attributed significant differences in attitudes and behaviors between junior high school and K-8 students to the organizational structure of the school itself, namely, the presence or absence of younger students on the campus. In the years that followed Blyth et al.’s initial studies, numerous researchers would document lower levels of self-esteem among students in junior high schools, and later middle schools, when compared to students in K-8 schools (Anderman, 2002; Eccles et al., 1991; Reddy et al., 2003; Simmons & Blyth, 1987; Weiss & Kipnes, 2006).
In one of the more noteworthy early studies, Simmons and Blyth (1987) examined sixth- and seventh-grade students’ ability to adapt to developmental tasks in K-6 schools (followed by a transition to a junior high school) compared to K-8 schools. Though the focus of their study was adaptation in various academic settings, the researchers observed that student self-worth, which in this case was strongly associated the students’ perceptions of belonging to either the oldest or youngest cohort on a campus, was a significant factor. More specifically, students in cohorts that were at the bottom of a campus’ grade span configuration had significantly lower levels of self-esteem than students at higher levels, though effect sizes were not provided. Observing that the junior high schools provided a far more impersonal environment than K-8 schools, Simmons and Blyth (1987) commented that transitioning from a smaller elementary school to larger impersonal junior high school had “a negative impact on the early adolescent child” (p. 226). Later researchers (e.g., Cook et al., 2008) would also comment on the negative social-emotional effects of resetting sixth-grade students back to the bottom rung of the social ladder in the three-tier middle school model. Related to social stratification in adolescents, Anderman (2002) observed that students in K-8 schools felt a greater sense of belonging when compared to middle school students.
In one of the most comprehensive studies of middle school effectiveness, Weiss and Kipnes (2006), using comparative sampling and multilevel modeling, examined longitudinal data from Philadelphia Public Schools in relation to 6-8 and K-8 schools. The data, from the 1995-1996 school year, consisted of eight student success indicators: average grades, course failures, attendance, disciplinary incidents, student safety, student threats, student satisfaction, and student self-worth. Of the eight variables examined, only two variables exhibited a statistical difference. More specifically, the researchers observed that middle school students had significantly lower levels of self-esteem and perceived their school environment as significantly more threatening than students who attended K-8 schools, though effect sizes were not reported for either finding.
In regard to Weiss and Kipnes’s (2006) second observation pertaining to safety, Astor, Meyer, and Pitner (2001) also established that sixth graders in middle schools were much more likely than sixth graders in elementary schools to perceive multiple and specific threats in their school environments. Also, Anderman (2002) noted that students who attended middle schools were more likely than students in K-8 schools to report feeling victimized, or to perceive their school as being unsafe. Finally, Cook et al. (2008) stated that sixth-grade students in middle schools were twice as likely to be cited for discipline infractions as sixth graders in a K-6 school setting. In addition, they observed that middle school students continued to exhibit higher rates of discipline infractions through the ninth grade. However, whether or not this last observation was the result of an actual increase in negative student behavior, or just the result of more students being cited for misbehavior due to an organizational structure that emphasizes rigid discipline (like the high schools they essentially model) has not been determined (Whitley et al., 2007).
Of all of the nonstandardized academic indicators examined from the late 1980s to the present, the research pertaining to the social-emotional well being of adolescents offers the strongest, most well documented case against junior high and middle school configurations as being the most appropriate organizational structure for adolescent students. Students “are lost before the educators even realize they were there” (Bateman & Karr-Kidwell, 1995, p. 29) and do not feel like they have a support system at the institution level on which they can rely (Eccles & Midgley, 1989; Murdock et al., 2000; Seidman, Allen, Aber, Mitchell, & Feinman, 1994). The studies pertaining to the social-emotional well being of adolescents naturally raised questions associated with student levels of motivation and desire to attend school.
www.tojned.net
6
The Online Journal of New Horizons in Education Volume 4, Issue 1
Attendance
Poor attendance and high drop-out rates among adolescents have been reported since the inception of junior high schools, and were among the primary reasons for the emergence of the middle school in the late 1960s (Juvonen et al., 2004). Coupled with increasing enrollments at elementary schools, demands for space at the elementary level necessitated the inclusion of sixth-grade students into the junior high school model (Alexander, 1984; Alexander & George, 1981). Though attendance was included as a factor in evaluating middle school effectiveness, primarily because of its association with student motivation, the research in which attendance rates between middle schools and K-8 schools were compared has not yielded a conclusive difference over time.
Researchers comparing attendance in middle schools to K-8 schools indicated a preference for the latter for instilling motivation in students to attend school. Alexander (1984) described higher attendance rates and more favorable attitudes toward school in seventh- and eighth-grade students in K-8 schools than in their counterparts in junior high school. Franklin and Glascock (1996) also observed higher attendance rates and lower incidents of expulsions and suspensions when comparing K-8 schools to middle schools. Finally, Abella (2005) examined student indicators in both settings and observed that students in K-8 schools had higher rates of attendance and fewer suspensions. However, in all of the studies mentioned above, statistical controls were not present in making comparisons between middle schools and K-8 schools, and effect sizes were not provided. Also, in the case of Abella, the study was based solely on a pilot program in Miami-Dade County which consisted of five K-8 schools, and no attempts were made to control for variables which could have had a far greater effect on attendance than grade span organizations (e.g., SES, school size).
In their rigorous comprehensive study of middle school effectiveness, Weiss and Kipnes (2006), using sound comparative methods, documented the lack of significant difference in attendance rates between middle schools and K-8 schools. Additionally, Offenburg’s (2001) study of middle school effectiveness, which included multiple measures of student success and controlled for SES and school size, detailed no statistical differences in regard to attendance or credits earned. When comparing the earlier studies, which lacked proper statistical modeling and controls, with later studies that were sounder in their design examining attendance as an indicator of middle school effectiveness has not demonstrated a decisive conclusion one way or another.
Perceptions of Adolescent School Settings
Adolescent students in the United States have a lower perception of their peer culture at school than students in most other nations around the world (Juvonen et al., 2004). Middle grade students report that their classmates are not “kind, helpful, [or] accepting” of each other and “do not enjoy one another’s company” (p. 56). Though the views expressed above were not limited to students enrolled in middle schools, the majority of adolescent students in the United States were in that configuration at the time of the survey (NCES, 2011a). Understanding the history of adolescent education in the United States, the connection between preference for school organization based on pragmatic factors, as opposed to research pertaining to the developmental needs of students, and resulting global student perceptions is easy to comprehend (Juvonen et al., 2004).
In one of the first studies pertaining to students’ perception of their school setting, Otto (1931) conducted a survey of student attitudes in relation to departmentalized teaching (common associated with the middle and high school model of instructional delivery) versus homeroom based teaching (where one teacher teaches his/her class in all subjects) (McPartland, Coldiron, & Braddock, 1987). In his findings, Otto concluded that students preferred departmentalized teaching when their teachers were easy and took into account their overall coursework load, and opposed it when their teachers were difficult and impersonal. As junior high and middle schools have evolved from the early 1900s, researchers have reported that students perceive their teachers in these settings as difficult and unsupportive (Anderman, 2002; Murdock et al., 2000; Seidman et al., 1994). In addition, since the advent of the NCLB Act, the academic rigor at the middle school level has only increased (Byrnes & Ruby, 2007; Schafer, 2010). Middle school students in the last 30 years have detailed numerous negative perceptions of their school environment including (a) infrequent contact with teachers, (b) unsupportive teachers, (c) receiving large and unmanageable quantities of work, and (d) being held to higher academic standards in middle schools as opposed to elementary configurations (including K-8 configurations) (Eccles & Midgley, 1989; Murdock et al., 2000; Seidman et al., 1994). Given the perceived emphasis on academic rigor that these observations seem to imply, it is interesting to note that middle school students were reporting that they were not being prepared to succeed in future academic endeavors (Bottoms & Timberlake,
www.tojned.net
7
The Online Journal of New Horizons in Education Volume 4, Issue 1
2008).
In 2008, Bottoms and Timberlake conducted a survey of middle school students in Atlanta, and examined their perceptions related to academic preparedness. The results of that survey were that only 39% of middle school students believed they were not being prepared with the necessary reading skills for college preparatory high school courses. Additionally, 49% reported being unprepared in writing, 57% reported being unprepared in mathematics, and 60% reported being unprepared in science. In 1999, a TIMSS survey revealed that 86% of eighth-grade students in the United States indicated that they worked from worksheets or textbooks on their own almost always or pretty often during mathematics lessons, significantly higher than the international average of 59% (NCES, 1999). Though TIMSS results were not disaggregated by grade span configurations, in 2000 83% of all adolescent students were in either middle or junior high school configurations (NCES, 2011a).
From the point of view of parents, the K-8 school seems to be the clear favorite in terms of school structure. In numerous studies that have included perception surveys, parents have indicated that K-8 schools provide a stronger sense of community and improve the relationship between themselves and teachers than traditional middle schools (Herman, 2004; Pardini, 2002; Offenburg, 2001; Yakimowski & Connolly, 2001). In addition, parents have commented that the longer grade spans of K-8 schools provide their families a more uniform schooling experience (Pardini, 2002), and are typically closer to their homes, reducing travel to multiple schools (Herman, 2004; Mizell, 2005). Finally, Abella (2005) surveyed parents who had recently transitioned from traditional middle schools to K-8 schools as a part of Miami-Dade County Public Schools pilot program. In that survey, parents overwhelming preferred the K-8 structure to the traditional middle school model from which they had transferred. However, when the perceptual focus shifted from students and parents to school administrators, including administrators in K-8 schools, the overwhelming preference for K-8 schools was dramatically different.
In 2004, McEwin et al. conducted a national survey of K-8 and 6-8 administrators to determine which academic model they believed was most appropriate for adolescents. They observed that the majority of the administrators favored the middle school as "the best organizational structure for young adolescents" (p. 1). Only 16% of the 101 K-8 principals surveyed favored K-8 schools, whereas 84% favored the 5-8 or 6-8 configurations. The reasons they gave for their preference of the middle school model over the K-8 school setting included (a) the fact that the physical, intellectual, and social needs of adolescents were different from the needs of students in elementary grades, and a separate school structure is better suited to address them rather than trying to tackle them in a mixed elementary/middle K-8 school; (b) elementary and middle school teachers utilize different educational practices that are easier to foster and monitor a split two-tier model; and (c) the K-8 structure is less likely to help adolescent students prepare for the transition to high school. The perceptions of the surveyed administrators mirrored the concepts espoused by the Middle School Movement (NMSA, 2003), though it has been generally acknowledged that the majority of middle schools have not correctly implemented this model today, a topic discussed in detail later in this article (Elovitz, 2007; Lounsbury, 2009; Wormeli, 2006).
When perceptions are taken together as a whole, no clear grade span configuration emerges as the universal favorite. Certainly students and parents seemed to favor the K-8 school setting for reasons related to student support and community, whereas school administrators, including those administrators in charge of K-8 schools, believed that middle schools were the most appropriate setting for adolescents. As with the topics of grades/GPA and attendance, examining perceptions “does not provide definitive answers to the myriad possible questions about grade span, [and] the questions have never gone away” (Paglin & Fager, 1997, p. 1).
Student Achievement in The Middle Grades
Early researchers attempting to determine the effectiveness of middle schools seldom focused on standardized student achievement in relation to grade span organizations (Coladarci & Hancock, 2002; Hough, 2003; Klump, 2006; Renchler, 2002; Wihry et al., 1992). Hough (2003) noted that of the more than 3,700 studies pertaining to middle schools that had been published at that time, few researchers attempted to examine the connection between student achievement and grade span configurations, and the ones who did infrequently used statistically controlled variables (Klump, 2006). The primary reason for this early deficiency in the research lay in the fact that state standardized testing was not mandated until the passage of the NCLB Act. However, prior to the NCLB Act, standardized test results at the
www.tojned.net
8
The Online Journal of New Horizons in Education Volume 4, Issue 1
national level indicated that middle grade students were not living up their potential in terms of academic achievement (Juvonen et al., 2004).
In 1990, the federal government began administering the NAEP to large samples of students in Grades 4, 8, and 12 (NCES, 2001b). Since its first administration in 1990, the NAEP has become the largest nationally representative and continuous assessment of student aptitude and progress in the United States (NCES, 2001b). Assessments given in the NAEP program are standardized and administered periodically in a variety of subjects, using essentially the same content from year to year, with only carefully documented changes (NCES, 2001b). Though NAEP results are not provided for individual students and schools, the assessments have come to represent general academic achievement and are included in the Department of Education’s National Report Card (NCES, 2001b).
Eighth grade results from the first administration of the NAEP were bleak. In 1990 only 15% of tested students obtained scores classifying them as proficient in mathematics, and in 1992 (the first year it was given), only 29% were proficient in reading (NCES, 2011c, 2011d). In the ensuing 10 years of the program, the majority of eighth-grade students taking the NAEP would fail to reach proficient levels of achievement in mathematics, reading, and science (Juvonen et al., 2004). In fact, in 1998 and 2000, only approximately one third of eighth-grade students attained proficiency in mathematics (26%), reading (32%), and science (32%) (NCES, 2009, 2011c, 2011d). The disparity between academic expectations and actual student results was even more pronounced when examining results by minority groups (Beaton et al., 1996; Juvonen et al., 2004; Schmidt, McKnight, Jakwerth, Cogan, & Houang, 1999). Results from the 1998 and 2000 NAEP administrations referenced above indicated that African American and Hispanic populations failed to reach higher than 15% proficient as a group on any subject area tested (Juvonen et al., 2004).
Five years after the federal government launched the NAEP program, the TIMSS program began with the purpose of comparing fourth- and eighth-grade student achievement in mathematics and science around the world (NCES, 1999). Unlike the NAEP, which was designed to measure academic progress against standards set by the NAGB of the United States, assessments given under the TIMSS program used a framework designed by multiple content experts, education professionals, and measurement specialists from countries around the world (NCES, 1999). After two administrations of the TIMSS, with participants in 34 countries, it was becoming apparent that eighth-grade students in the United States were not only deficient in meeting proficiency standards set by the nation, but were falling significantly behind on the international level as well (NCES, 1999)
In 1999, eighth grade results on the TIMSS assessments in mathematics were only slightly above the average international scale score of 500 (with a mean scale score of 502), ranking the United States 19th out of the 34 participating countries (NCES, 1999). In addition, 14 other countries scored significantly higher than the United States in mathematics including Singapore, Korea, China, Japan, Hungary, Canada, Russia, and Australia. On the science assessments, the results were only slightly better. As with mathematics, eighth-grade students scored only slightly above the average international scale score of 500 (with a mean scale score of 515), ranking the United States 18th (NCES, 1999). In addition, 14 other countries scored significantly higher than the United States in science, including many of the same countries that had scored higher in mathematics.
In 2000, the Program for International Student Assessment (PISA) began an additional standardized testing program at the international level to compare 15-year-old students (the point where most students internationally are near the end of compulsory education) in various countries in the areas of mathematics, reading, and science (Organisation for Economic Co-operation and Development [OCED], 2003). The United States, together with 43 other countries, participated in the new assessment program and administered tests to a national sample of students. The results from the assessments revealed that the United States, though third among participating countries in per capita gross domestic product, had below average mean scores in mathematics (ranked 20th) and science (ranked 15th), and only slightly above average mean scores in reading (ranked 16th) (OCED, 2003). Though the assessments were given to 15-year-old students (typically during their sophomore year in high school), critics of the scores were quick to point out that academic achievement in the United States began declining sharply during the adolescent years (Juvonen et al., 2004).
This lack of academic proficiency in the middle grades is the crux of the grade span configuration debate (Byrnes & Ruby, 2007). Even prior to the advent of the NCLB Act, the middle grades were identified as the turning point in a
www.tojned.net
9
The Online Journal of New Horizons in Education Volume 4, Issue 1
student’s career where academic achievement sharply declined (Bateman & Karr-Kidwell, 1995; Tucker & Codding, 1998). Given the fact that, in 2000, 53% of middle grades students were in a 6-8 school configuration, and 83% were in middle and junior high school configurations combined, the grade span configurations of these schools were targeted as the culprit (Bateman & Karr-Kidwell, 1995; NCES, 2011a; Tucker & Codding, 1998). Bateman and Karr-Kidwell (1995) declared middle schools a “floundering ground” (p. 29), and Tucker and Codding (1998) of the National Center on Education and the Economy called them “the wasteland of our primary and secondary landscape” (p. 153). The abysmal performance of middle grades students also raised questions about the middle school movement and the Middle School Concept of the 1980s, and what it had actually accomplished in the 20 years since its inception.
Student Achievement and the Middle School Concept
Despite the best efforts of the middle school movement, and the comprehensive volume of best practices that resulted from it, middle schools continued to struggle to produce adequate academic results for their students, leading to the perception that they were a dead zone between elementary and high school education (Tucker & Codding, 1998). According to advocates of the Middle School Concept, the root cause of the disconnect between theory and results lay in implementation (Lounsbury, 2009). By the time the principles of the Middle School Concept were fully flushed out in the 1980s, middle schools had already been in operation for 20 years. Despite early optimism in the 1960s that the newly configured middle schools would address the unique academic needs of adolescents (Alexander & Williams, 1965; Gruhn & Douglass, 1956), the reality was that from the 1960s to the 1980s middle schools had accomplished very little in terms of changing the educational practices that had dominated the junior high schools that preceded them (Calhoun, 1983).
Despite the prominence of the middle school movement, the lack of a federal or state mandate for the reforms the movement proposed meant that adoption was voluntary (Lounsbury, 2009). As a result, the recommended instructional practices and organizational changes were slow to catch on, and, as some authors have argued, have only recently been implemented in earnest (Elovitz, 2007; Lounsbury, 2009). As Lounsbury (2009) noted, critics of middle schools often failed to differentiate between middle schools and the Middle School Concept, assuming that all middle schools were “operating in ways that reflected the advocacy of its proponents” (p. 2). As a result, critics were more likely to blame the organizational structure of the schools, as opposed to the individual instructional practices of each school, as the cause of poor student performance (Midgley, 1993; Cuban, 1992; Juvonen et al., 2004).
Research into Student Achievement and Grade Span Configurations Pre-Nclb
In one of the first great studies in which academic achievement and grade span organizations were examined, Becker (1987), representing the Center for Research on Elementary and Middle Schools at Johns Hopkins University, studied the impact of organizational patterns on sixth-grade student achievement. Using a random sample of 8,000 students (out of approximately 30,000) in 330 schools in Pennsylvania, he compared K-6 schools to 6-8 schools using results from the Pennsylvania Education Quality Assessment (EQA). To control for SES, Becker used a “background index” score which included SES, race, and “residential instability” (p. 8) as a control element. This index score essentially represented wealth, with higher scores denoting greater affluence than lower scores. In addition, he examined schools’ instructional practices, levels of departmentalization, and ability grouping practices as sub-categories of their grade span configurations.
In his multivariate analysis of sixth-grade achievement on Pennsylvania’s EQA, Becker (1987) documented a significant difference in achievement scores in the five subject areas tested favoring the K-6 elementary schools. However, Becker observed that the advantage of the elementary configuration decreased as students’ wealth index scores increased. More specifically, sixth-grade students with low wealth index scores performed much better in the elementary setting than in the middle school setting. However, sixth-grade students with high wealth index scores actually performed slightly better in the middle school setting. Students with wealth index scores that were somewhere in the middle showed better results in the elementary setting, though the gains were only about one half as a great as students with low wealth index scores. Effect sizes for the significant differences between grade spans were not established, making it difficult to determine the relevance of these findings. Finally, Becker observed that between-class ability grouping worked well for students who had high wealth index scores, whereas within-class ability grouping was preferable for students with low wealth index scores.
www.tojned.net
10
The Online Journal of New Horizons in Education Volume 4, Issue 1
In 1992, Wihry et al. examined four grade span classifications in relation to eighth grade performance on the
Maine Educational Assessment, an assessment in which student proficiency in mathematics, reading, science, social studies, writing, and humanities is assessed. Wihry et al. classified 163 schools based on their grade span configurations into elementary, middle, junior high, and junior/senior high schools categories. In conducting their analysis, the researchers controlled for SES, teachers’ salaries, instructional expenditures, per-pupil expenditures, school size, pupil-staff ratio, post-baccalaureate education, and average teacher experience. Using a multiple regression, Wihry et al. (1992) observed that SES and average teacher experience were two large predictors of eighth-grade student achievement, whereas school size and pupil staff ratio were not statistically significant predictors.
In regard to academic achievement, Wihry et al. (1992) determined that the grade span configuration of the school influenced eighth-grade student achievement, even after SES and various school and teacher attributes were taken into account. More specifically, eighth-grade student achievement was better in the elementary school setting across the board, and significantly better when compared to the junior high and junior/senior high school categories. Wihry et al. (1992) concluded that the elementary setting appeared to be the most favorable location for eighth-grade students in Maine, resulting in achievement advantages ranging from one third to a full standard deviation over other grade span configurations. However, similar to Becker (1987), effect sizes were not reported.
Four years later, Franklin and Glascock (1996) examined the effects of grade span configurations on student performance in rural schools across Louisiana. Using several different state and national tests, the researchers controlled for SES and school size. In addition, Franklin and Glascock used a student persistence index as an additional control for each school by grade. Student persistence was defined by the researchers as “those activities that indicate the holding power of a school ... [such as] attendance, suspensions, expulsions, and dropouts” (p. 10). In their analysis, Franklin and Glascock stated that students in grades six and seven in elementary configurations (K-6, K-7, and K-12) showed significantly higher achievement results on three separate academic assessments in reading and mathematics than students in middle or junior high schools (6-8 and 7-9). Effect sizes, however, were not reported.
In Connecticut, Tucker and Andrada (1997) analyzed the academic achievement of sixth graders in K-6, 6-8, and K-8 settings using the Connecticut Mastery Test. No controls were implemented to account for independent variables such as SES or school size. Using a multivariate analysis of covariance, the researchers established that students who were at the upper end of an elementary grade span configuration (e.g., sixth graders in a K-6 setting) performed better than did students in the lower grades of a secondary configuration (e.g., sixth graders in a 6-8 setting). Reported effect sizes were extremely small (d < 0.09 in all cases where findings were statistically significant) (Cohen, 1988). Based on the performance of certain Title I schools in their study, Tucker and Andrada concluded that schools that expected to be held accountable for student results (as the Title 1 schools in their pre-NCLB study were) produced better student results than those schools that were not held accountable.
Finally, in the one of the last significant pre-NCLB studies of grade span configurations, Offenberg (2001) examined eighth-grade student achievement between middle schools and K-8 schools using the students’ ninth grade achievement data the year following their promotion to high school. The study involved 42 middle schools and 43 K-8 schools and controlled for SES and school size. In his findings, Offenburg stated that students from the K-8 schools had statistically significantly higher levels of achievement in mathematics, reading, and science on the Stanford Achievement Test, Version 9 (SAT9), than did students from middle schools. However, effect sizes were not provided.
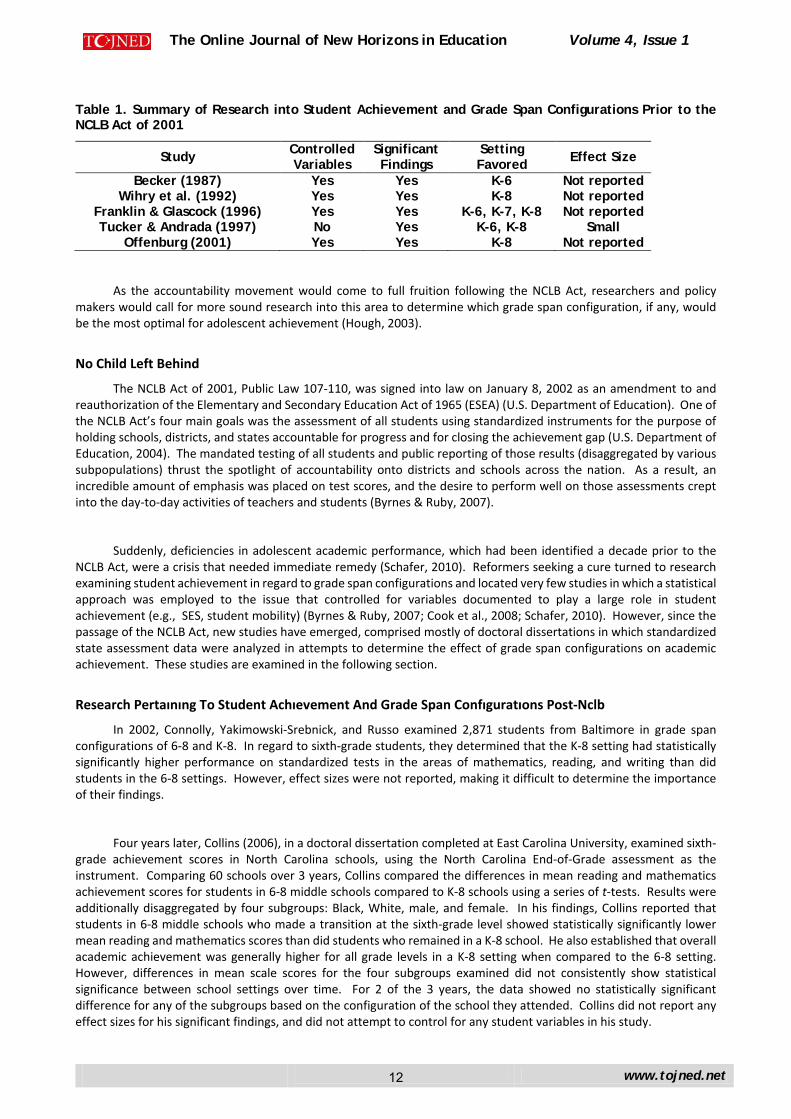
Though most all of the early researchers examining the relationship between grade span configurations and academic achievement seemed to favor elementary or K-8 school configurations, the non-reporting of effect sizes in most all of these studies, a trend in educational research at the time (Hough, 2003), makes it difficult to determine the extent of the findings. In the one case where effect sizes were reported, the magnitude of the difference was so small as to be insignificant (Tucker & Andrada, 1997). Delineated in Table 1 the results of the research into student achievement and grade span configurations prior to the NCLB Act of 2001.
www.tojned.net
11
The Online Journal of New Horizons in Education Volume 4, Issue 1
Table 1. Summary of Research into Student Achievement and Grade Span Configurations Prior to the NCLB Act of 2001
Study Controlled Variables
Significant Findings
Setting Favored Effect Size
Becker (1987) Yes Yes K-6 Not reported Wihry et al. (1992) Yes Yes K-8 Not reported
Franklin & Glascock (1996) Yes Yes K-6, K-7, K-8 Not reported Tucker & Andrada (1997) No Yes K-6, K-8 Small
Offenburg (2001) Yes Yes K-8 Not reported
As the accountability movement would come to full fruition following the NCLB Act, researchers and policy makers would call for more sound research into this area to determine which grade span configuration, if any, would be the most optimal for adolescent achievement (Hough, 2003).
No Child Left Behind
The NCLB Act of 2001, Public Law 107-110, was signed into law on January 8, 2002 as an amendment to and reauthorization of the Elementary and Secondary Education Act of 1965 (ESEA) (U.S. Department of Education). One of the NCLB Act’s four main goals was the assessment of all students using standardized instruments for the purpose of holding schools, districts, and states accountable for progress and for closing the achievement gap (U.S. Department of Education, 2004). The mandated testing of all students and public reporting of those results (disaggregated by various subpopulations) thrust the spotlight of accountability onto districts and schools across the nation. As a result, an incredible amount of emphasis was placed on test scores, and the desire to perform well on those assessments crept into the day-to-day activities of teachers and students (Byrnes & Ruby, 2007).
Suddenly, deficiencies in adolescent academic performance, which had been identified a decade prior to the NCLB Act, were a crisis that needed immediate remedy (Schafer, 2010). Reformers seeking a cure turned to research examining student achievement in regard to grade span configurations and located very few studies in which a statistical approach was employed to the issue that controlled for variables documented to play a large role in student achievement (e.g., SES, student mobility) (Byrnes & Ruby, 2007; Cook et al., 2008; Schafer, 2010). However, since the passage of the NCLB Act, new studies have emerged, comprised mostly of doctoral dissertations in which standardized state assessment data were analyzed in attempts to determine the effect of grade span configurations on academic achievement. These studies are examined in the following section.
Research Pertaınıng To Student Achıevement And Grade Span Confıguratıons Post-Nclb
In 2002, Connolly, Yakimowski-Srebnick, and Russo examined 2,871 students from Baltimore in grade span configurations of 6-8 and K-8. In regard to sixth-grade students, they determined that the K-8 setting had statistically significantly higher performance on standardized tests in the areas of mathematics, reading, and writing than did students in the 6-8 settings. However, effect sizes were not reported, making it difficult to determine the importance of their findings.
Four years later, Collins (2006), in a doctoral dissertation completed at East Carolina University, examined sixth-grade achievement scores in North Carolina schools, using the North Carolina End-of-Grade assessment as the instrument. Comparing 60 schools over 3 years, Collins compared the differences in mean reading and mathematics achievement scores for students in 6-8 middle schools compared to K-8 schools using a series of t-tests. Results were additionally disaggregated by four subgroups: Black, White, male, and female. In his findings, Collins reported that students in 6-8 middle schools who made a transition at the sixth-grade level showed statistically significantly lower mean reading and mathematics scores than did students who remained in a K-8 school. He also established that overall academic achievement was generally higher for all grade levels in a K-8 setting when compared to the 6-8 setting. However, differences in mean scale scores for the four subgroups examined did not consistently show statistical significance between school settings over time. For 2 of the 3 years, the data showed no statistically significant difference for any of the subgroups based on the configuration of the school they attended. Collins did not report any effect sizes for his significant findings, and did not attempt to control for any student variables in his study.
www.tojned.net
12
The Online Journal of New Horizons in Education Volume 4, Issue 1
In the most comprehensive study on grade span configurations to date, Byrnes and Ruby (2007) compared
student achievement between preexisting K-8 schools, emerging K-8 schools, and the 6-8 middle schools in Philadelphia. Examining longitudinal data over 5 years in 95 schools (involving 40,883 eighth-grade students), the researchers employed multilevel and hierarchical linear statistical models and controlled for the following variables: prior achievement, cohorting, teacher attendance, certification, average teacher experience, student-teacher ratios, average grade size, and region. Using the SAT9 as the instrument, and focusing on eighth-grade students, Byrnes and Ruby noted that the more established K-8 schools demonstrated higher levels of achievement than did middle schools. More specifically, normal curve equivalents in both mathematics and reading on the SAT9 were significantly higher in preexisting K-8 schools than in middle schools. Effect sizes, however, were small (d = 0.19 for mathematics and d = 0.11 for reading) (Cohen, 1988). In addition, the researchers ascertained that students at emerging K-8 schools had lower levels of achievement when compared to middle school students who were taught by less experienced teachers. Byrnes and Ruby speculated that emerging K-8 schools might require time in order for an instructional environment supporting best practices to flourish.
Byrnes and Ruby (2007) drew several stark conclusions from their research. Emphasizing the low effect sizes, and the fact that their models accounted for less than one half of the between-student variation in achievement, the researchers concluded that the K-8 school setting did not represent a “silver bullet” for raising adolescent achievement, and questioned whether or not the resources required to convert existing middle schools to the K-8 configuration was truly worthwhile (p. 132). Noting that a good deal of the unaccounted for variance resided in factors such as parental involvement and home environment (factors that schools and school administrators could not reasonably address) the researchers questioned the accountability movement in general, stating that "linking ... a school’s annual performance to [a] reward and punishment system might be the wrong method for reaching the right goals” (Byrnes & Ruby, 2007, p. 133).
In her dissertation from Fayetteville State University, Sanders-Smith (2009), similar to Collins 3 years before her, examined results on the North Carolina End-of-Grade assessment in 108 schools (81 middle schools and 27 K-8 schools) for the 2004-2005, 2005-2006, and 2006-2007 school years. Sanders-Smith compared results between middle and K-8 schools for all 3 years using a series of t-tests and reported no statistically significant differences in terms of academic achievement. However, one major drawback of the study was the fact that, although SES was identified in the methodology section as a well documented indicator of student success, no attempt was made to control for this variable in comparing schools (Sanders-Smith, 2009).
Watson (2009), in a doctoral dissertation completed at the University of Montana, examined student achievement between intermediate (5-8, 6-8, 7-8, or 7-9 grade configurations), elemiddle (schools containing both primary and middle grades—a definition that differs from Hough’s [2005] definition used in this study), and K-8 schools using the Montana Comprehensive Assessment System, Phase Two, a criterion referenced test. Test data were gathered from the 2004-2005 school year, and involved 11,690 students from 58 K-8 schools, 156 elemiddle schools, and 57 intermediate schools. Accounting for SES and school size, Watson used a factorial analysis of variance to compare student performance between schools and determined that grade span configuration did not play a statistically significant role in achievement results.
In her doctoral dissertation out of the University of Maryland, Fink (2010) analyzed the effect of grade span configuration between middle and K-8 schools in relation to student achievement and attendance. Using a multilevel statistical approach, which accounted for ethnicity and SES, Fink stated that scores on the Maryland State Assessment were statistically significantly higher for sixth-grade students in reading and mathematics in a K-8 school setting. For Grades 7 and 8, however, statistically significant differences were not reported. Though Fink noted that results were only slightly better in K-8 schools, effect sizes were not given.
Finally, in her doctoral dissertation, completed at the University of Central Florida, Schafer (2010) analyzed the achievement results of sixth-grade students on the 2009 Florida Comprehensive Assessment Test. Controlling for SES, results were compared between K-6, K-8, and 6-8 school configurations. In both mathematics and reading, the K-6 school configuration had statistically significantly higher scores over 6-8 schools, with mixed results between K-6 and K-8, and K-8 and 6-8 schools. However, Schafer did not report effect sizes for any of the comparisons made, making it difficult to determine the practical importance of her findings.
www.tojned.net
13
The Online Journal of New Horizons in Education Volume 4, Issue 1
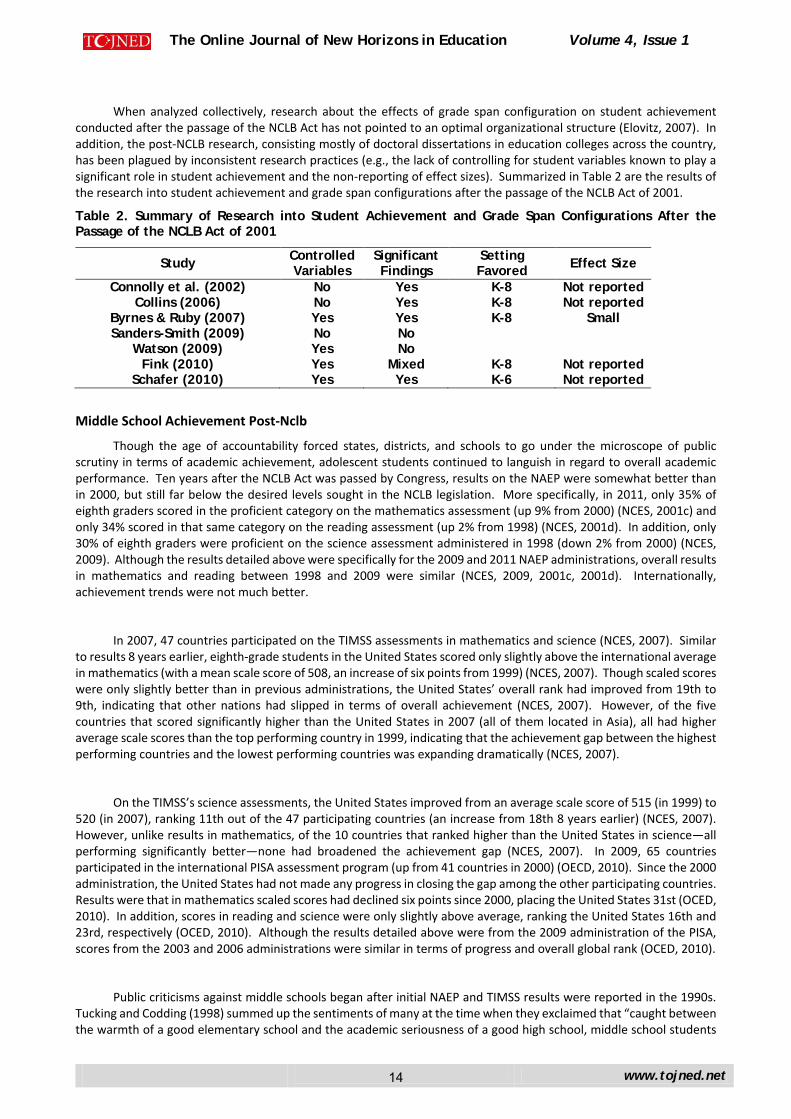
When analyzed collectively, research about the effects of grade span configuration on student achievement conducted after the passage of the NCLB Act has not pointed to an optimal organizational structure (Elovitz, 2007). In addition, the post-NCLB research, consisting mostly of doctoral dissertations in education colleges across the country, has been plagued by inconsistent research practices (e.g., the lack of controlling for student variables known to play a significant role in student achievement and the non-reporting of effect sizes). Summarized in Table 2 are the results of the research into student achievement and grade span configurations after the passage of the NCLB Act of 2001.
Table 2. Summary of Research into Student Achievement and Grade Span Configurations After the Passage of the NCLB Act of 2001
Study Controlled Variables
Significant Findings
Setting Favored Effect Size
Connolly et al. (2002) No Yes K-8 Not reported Collins (2006) No Yes K-8 Not reported
Byrnes & Ruby (2007) Yes Yes K-8 Small Sanders-Smith (2009) No No
Watson (2009) Yes No Fink (2010) Yes Mixed K-8 Not reported
Schafer (2010) Yes Yes K-6 Not reported
Middle School Achievement Post-Nclb
Though the age of accountability forced states, districts, and schools to go under the microscope of public scrutiny in terms of academic achievement, adolescent students continued to languish in regard to overall academic performance. Ten years after the NCLB Act was passed by Congress, results on the NAEP were somewhat better than in 2000, but still far below the desired levels sought in the NCLB legislation. More specifically, in 2011, only 35% of eighth graders scored in the proficient category on the mathematics assessment (up 9% from 2000) (NCES, 2001c) and only 34% scored in that same category on the reading assessment (up 2% from 1998) (NCES, 2001d). In addition, only 30% of eighth graders were proficient on the science assessment administered in 1998 (down 2% from 2000) (NCES, 2009). Although the results detailed above were specifically for the 2009 and 2011 NAEP administrations, overall results in mathematics and reading between 1998 and 2009 were similar (NCES, 2009, 2001c, 2001d). Internationally, achievement trends were not much better.
In 2007, 47 countries participated on the TIMSS assessments in mathematics and science (NCES, 2007). Similar to results 8 years earlier, eighth-grade students in the United States scored only slightly above the international average in mathematics (with a mean scale score of 508, an increase of six points from 1999) (NCES, 2007). Though scaled scores were only slightly better than in previous administrations, the United States’ overall rank had improved from 19th to 9th, indicating that other nations had slipped in terms of overall achievement (NCES, 2007). However, of the five countries that scored significantly higher than the United States in 2007 (all of them located in Asia), all had higher average scale scores than the top performing country in 1999, indicating that the achievement gap between the highest performing countries and the lowest performing countries was expanding dramatically (NCES, 2007).
On the TIMSS’s science assessments, the United States improved from an average scale score of 515 (in 1999) to 520 (in 2007), ranking 11th out of the 47 participating countries (an increase from 18th 8 years earlier) (NCES, 2007). However, unlike results in mathematics, of the 10 countries that ranked higher than the United States in science—all performing significantly better—none had broadened the achievement gap (NCES, 2007). In 2009, 65 countries participated in the international PISA assessment program (up from 41 countries in 2000) (OECD, 2010). Since the 2000 administration, the United States had not made any progress in closing the gap among the other participating countries. Results were that in mathematics scaled scores had declined six points since 2000, placing the United States 31st (OCED, 2010). In addition, scores in reading and science were only slightly above average, ranking the United States 16th and 23rd, respectively (OCED, 2010). Although the results detailed above were from the 2009 administration of the PISA, scores from the 2003 and 2006 administrations were similar in terms of progress and overall global rank (OCED, 2010).
Public criticisms against middle schools began after initial NAEP and TIMSS results were reported in the 1990s. Tucking and Codding (1998) summed up the sentiments of many at the time when they exclaimed that “caught between the warmth of a good elementary school and the academic seriousness of a good high school, middle school students
www.tojned.net
14
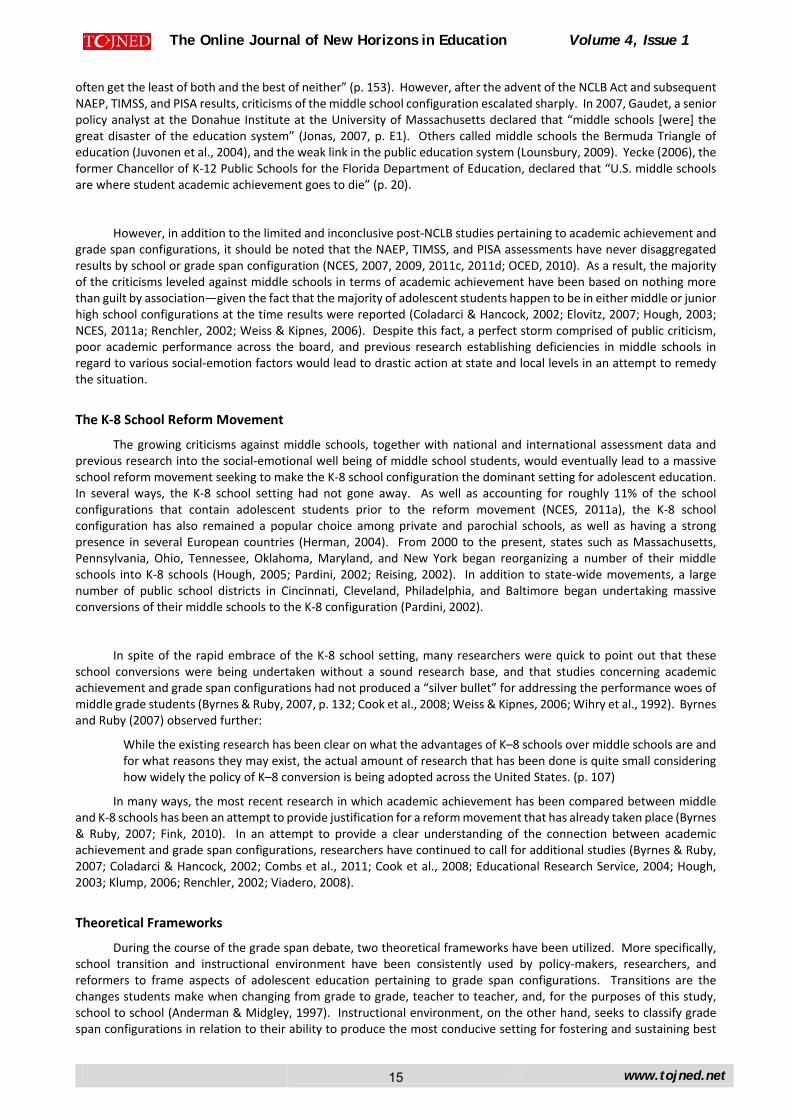
The Online Journal of New Horizons in Education Volume 4, Issue 1
often get the least of both and the best of neither” (p. 153). However, after the advent of the NCLB Act and subsequent NAEP, TIMSS, and PISA results, criticisms of the middle school configuration escalated sharply. In 2007, Gaudet, a senior policy analyst at the Donahue Institute at the University of Massachusetts declared that “middle schools [were] the great disaster of the education system” (Jonas, 2007, p. E1). Others called middle schools the Bermuda Triangle of education (Juvonen et al., 2004), and the weak link in the public education system (Lounsbury, 2009). Yecke (2006), the former Chancellor of K-12 Public Schools for the Florida Department of Education, declared that “U.S. middle schools are where student academic achievement goes to die” (p. 20).
However, in addition to the limited and inconclusive post-NCLB studies pertaining to academic achievement and grade span configurations, it should be noted that the NAEP, TIMSS, and PISA assessments have never disaggregated results by school or grade span configuration (NCES, 2007, 2009, 2011c, 2011d; OCED, 2010). As a result, the majority of the criticisms leveled against middle schools in terms of academic achievement have been based on nothing more than guilt by association—given the fact that the majority of adolescent students happen to be in either middle or junior high school configurations at the time results were reported (Coladarci & Hancock, 2002; Elovitz, 2007; Hough, 2003; NCES, 2011a; Renchler, 2002; Weiss & Kipnes, 2006). Despite this fact, a perfect storm comprised of public criticism, poor academic performance across the board, and previous research establishing deficiencies in middle schools in regard to various social-emotion factors would lead to drastic action at state and local levels in an attempt to remedy the situation.
The K-8 School Reform Movement
The growing criticisms against middle schools, together with national and international assessment data and previous research into the social-emotional well being of middle school students, would eventually lead to a massive school reform movement seeking to make the K-8 school configuration the dominant setting for adolescent education. In several ways, the K-8 school setting had not gone away. As well as accounting for roughly 11% of the school configurations that contain adolescent students prior to the reform movement (NCES, 2011a), the K-8 school configuration has also remained a popular choice among private and parochial schools, as well as having a strong presence in several European countries (Herman, 2004). From 2000 to the present, states such as Massachusetts, Pennsylvania, Ohio, Tennessee, Oklahoma, Maryland, and New York began reorganizing a number of their middle schools into K-8 schools (Hough, 2005; Pardini, 2002; Reising, 2002). In addition to state-wide movements, a large number of public school districts in Cincinnati, Cleveland, Philadelphia, and Baltimore began undertaking massive conversions of their middle schools to the K-8 configuration (Pardini, 2002).
In spite of the rapid embrace of the K-8 school setting, many researchers were quick to point out that these school conversions were being undertaken without a sound research base, and that studies concerning academic achievement and grade span configurations had not produced a “silver bullet” for addressing the performance woes of middle grade students (Byrnes & Ruby, 2007, p. 132; Cook et al., 2008; Weiss & Kipnes, 2006; Wihry et al., 1992). Byrnes and Ruby (2007) observed further:
While the existing research has been clear on what the advantages of K–8 schools over middle schools are and for what reasons they may exist, the actual amount of research that has been done is quite small considering how widely the policy of K–8 conversion is being adopted across the United States. (p. 107)
In many ways, the most recent research in which academic achievement has been compared between middle and K-8 schools has been an attempt to provide justification for a reform movement that has already taken place (Byrnes & Ruby, 2007; Fink, 2010). In an attempt to provide a clear understanding of the connection between academic achievement and grade span configurations, researchers have continued to call for additional studies (Byrnes & Ruby, 2007; Coladarci & Hancock, 2002; Combs et al., 2011; Cook et al., 2008; Educational Research Service, 2004; Hough, 2003; Klump, 2006; Renchler, 2002; Viadero, 2008).
Theoretical Frameworks
During the course of the grade span debate, two theoretical frameworks have been utilized. More specifically, school transition and instructional environment have been consistently used by policy-makers, researchers, and reformers to frame aspects of adolescent education pertaining to grade span configurations. Transitions are the changes students make when changing from grade to grade, teacher to teacher, and, for the purposes of this study, school to school (Anderman & Midgley, 1997). Instructional environment, on the other hand, seeks to classify grade span configurations in relation to their ability to produce the most conducive setting for fostering and sustaining best
www.tojned.net
15
The Online Journal of New Horizons in Education Volume 4, Issue 1
practices in instructional delivery (McPartland et al., 1987).
Since the early 1900s, these two frameworks have served as the focal point for almost every researcher seeking to answer questions about the effectiveness of various grade span configurations, and the twin lenses through which all results have been discussed. Additionally, though both frameworks have remained constant in definition and understanding, their implications in relation to the debate surrounding middle schools have changed drastically over the course of time, representing a near 180 degree shift in perception for both frameworks. In the late 1800s, school transition was seen as the vehicle for providing students better opportunities in education, serving as a preparatory stepping stone to high school (Bedard & Do, 2005; Eichorn, 1966). Since that time, school transitions have come to represent the root cause for most of the negative outcomes associated with grade span research (Byrnes & Ruby, 2007). In similar fashion, proponents for the creation of junior high schools in the early 1900s, and middle schools 60 years later, would cite the grade span configurations of these schools as being the most optimal for producing an instructional environment in which the unique needs of adolescent students could be addressed (Epstein & MacIver, 1990; Hough, 2005; Lee & Smith, 1993; Midgley, 1993; Offenberg, 2001). However, researchers have indicated that just the opposite might be true (Byrnes & Ruby, 2007; Coladarci & Hancock, 2002; Hough, 2005; Offenberg, 2001; Yakimowski & Connolly, 2001). Both frameworks are discussed in more detail in the next section.
SCHOOL TRANSITION
Since the early 1900s, school transition has played a major role in the grade span configuration debate. In fact, grade span configurations have always been “inextricably linked” to school transitions “because grade spans dictate to a large degree when children will move between schools” (Burkam et al., 2007, p. 290). Although transitions occur within schools as students move from grade to grade and teacher and teacher, students face the most transitional effects when they move from school to school (Anderman & Midgley, 1997). These transitional effects include adjusting to new environments, buildings, faculties, routines, schedules, and instructional configurations (Combs et al., 2011). Although schedule changes and shifts in instructional configurations have been more commonly associated with transitions between the major tiers of the public education system (e.g., from elementary to middle school or from middle school to high school), these changes are present to a lesser degree when dealing with transitions within tiers (e.g., changing elementary schools).
From the early 1900s to the late 1970s, transitioning to a junior high or middle school was seen as a benefit to the student in their overall progression through the schooling system—preparing them for the rigors of high school (Bedard & Do, 2005; Eichorn, 1966). However, in the late 1970s, prior to the middle school movement, Feld et al. (1979) suggested that transitioning to new schools might not be entirely beneficial for students, and commented that early adolescent students experienced so much change that they could benefit from a secure, familiar school setting. Eight years later, Simmons and Blyth (1987) pointed out that middle grade students had to undergo two major transitions in their adolescent years: puberty and a change in schools. They suggested that if students only had to deal with one of those transitions, namely puberty, by remaining in a single school setting through their adolescent years, the reduced stress could lead to higher levels of student achievement, motivation, and self-esteem.
In the last two decades, numerous researchers studying various social-emotional aspects of grade span configurations would come to associate the negative outcomes they observed (such as lower self-esteem and increased behavioral problems) with school transition (Anderman & Midgley, 1997; Arcia, 2007; Bergquist et al., 2004; Cook et al., 2008; Cromwell, 1999; Kennedy, 1993; Malaspina & Rimm-Kaufman, 2008; Mendez & Knoff, 2003; Simmons et al., 1991; Weiss & Kipnes, 2006). In addition, researchers observed that negative social-emotional trends were more pronounced when students shifted from being the oldest members of their school community to being the youngest members, a common occurrence when elementary students transition to a middle school (Byrnes & Ruby, 2007). Reported declines in student confidence, leadership capabilities, and overall maturity levels would be tied back to the phenomena of social stratification, a by-product of school transition (Coladarci & Hancock, 2002; Herman, 2004; Simmons & Blyth, 1987; Yakimowski & Connolly, 2001).
In 2007, Whitley et al. stated that student transitions have “long been associated with a decline in academic performance” (p. 650). However, researchers examining academic achievement in relation to grade span configurations have yet to produce such a clear conclusion. Over time numerous researchers have hypothesized that declining
www.tojned.net
16
The Online Journal of New Horizons in Education Volume 4, Issue 1
achievement in the middle grades could be traced to school transition (Alspaugh & Harting, 1995; Alspaugh, 1998; Byrnes & Ruby, 2007; Mizell, 2005); however, researchers have not firmly established that academic progress significantly differs between students who have undergone a school change during their adolescent years versus those students who have not undergone such a school change. In other words, declining academic achievement among adolescents has not been isolated to middle schools with any degree of certainty (where students typically make their first transition from elementary to middle school). As criticisms against middle schools have increased in light of unacceptable student progress on national and international assessments, proponents of the K-8 school reform movement began to cite the school transition framework as the foundation for their reform policies. In 2002, Byrd-Bennett, the CEO of Cleveland Schools, a district embarking on a massive K-8 reform program, remarked:
Here we were, taking children at 10—at their most delicate—and ripping them from a stable school environment. Then we put them in a new school where they had to move from class to class, learning to deal with a series of other adults while they were still learning to deal with each other. (Pardini, 2002, p. 6)
Instructional Environment
The instructional environment of a school encompasses a large number of school characteristics and processes such as departmentalization, climate, curriculum, class size, grading practices, homework policies, teaching styles, and emphasis on testing and assessment (Wihry et al., 1992). McPartland et al. (1987), using national and state data, noted that grade span configurations play a large role in determining staffing, scheduling, and student grouping practices of a school. Summing up the primary differences in instructional practices between elementary and secondary schools across the country they observed:
Elementary grades are much more likely to assign teachers to self-contained classes with heterogeneous student enrollments, in which within-class ability grouping is used to focus instruction in reading and sometimes in math to match individual student differences. At the other end of the continuum, secondary students are usually in departmentalized schools that establish separate tracks and/or classes in which enrollment is determined by students' measured academic performance, and in which between-class groupings usually remain static for the entire school term or school year. (p. 26)
Conceptually, middle schools should fall somewhere in the middle of this spectrum. In practice, however, middle schools have always been more closely aligned with high schools in organizational structure and instructional practice. They typically employ a school day that is segmented into several subject-specific periods, with teachers specializing in academic subject areas (Weiss & Kipnes, 2006). As a result, middle school teachers typically see many students every day for a short period of time, a structure that does not allow for much individualized student attention or personal student-teacher relationships (Weiss & Kipnes, 2006).
One of the key assumptions of the Middle School Concept was the belief that the grade span configuration of the middle school was ideal to foster an instructional environment that could better support team teaching, mixed level classrooms, and small learning communities (Epstein & MacIver, 1990; Hough, 2005; Lee & Smith, 1993; Midgley, 1993; Offenberg, 2001). However, 20 years after the rise of the middle school, researchers (e.g., Lounsbury, 2009; Wormeli, 2006) have indicated that the majority of middle schools across the nation had failed to institute many of these strategies. Lounsbury (2009) noted that even though middle schools were able to foster an instructional environment conducive to best practices, most instructional leaders at those schools had simply not chosen to do so. However, advocates of the middle school movement were quick to point out that in cases where middle schools had embraced the model, students flourished (Felner et al., 1997).
In response, policy makers began making the argument that the instructional environment the Middle School Concept espoused was not better suited to one particular grade span or another, but, rather, was indicative of an instructional climate that could be implemented in any school configuration (Wihry et al., 1992). Proponents of the Middle School Concept essentially agreed with this assertion in the 2000s, claiming that documented successes in K-8 school configurations were simply the result of those schools employing Middle School Concept recommendations (Borman, Hewes, Overman, & Brown, 2003; Wormeli, 2006). With the admission that academic and social-emotional success was more a product of sound instructional practices, as opposed to grade span configurations, the theoretical claim made by the middle school movement that middle schools were better suited to support those practices was questioned. In the 1990s, little evidence was available on whether or not the grade span configuration of a school made it more susceptible to fostering a particular instructional environment (Wihry et al., 1992). However, since the passage of the NCLB Act, and spurred further along by the K-8 school reform movement, a small number of studies have been
www.tojned.net
17
The Online Journal of New Horizons in Education Volume 4, Issue 1
introduced that reinforce the idea that the K-8 school setting may be, in fact, more conducive to an instructional environment that supports best practices—a complete reversal of the initial claims of the middle school movement.
Researchers examining the staffing practices of middle schools observed that they were plagued by lower rates of retention, less experience, and lower rates of certification than at the elementary and high school levels (Jackson & Davis, 2000; McEwin et al., 1996; National Forum to Accelerate Middle Grades Reform, 2002). Though comparisons were not made between K-8 and middle schools, Erb (2006) noted that the problems associated with staffing at the middle school level negatively impacted their ability to foster a positive instructional environment. In addition, data related to school size detail that K-8 schools typically have fewer students in each grade-level than do middle schools (Byrnes & Ruby, 2007). After numerous researchers confirmed that strategies such as team teaching, professional learning communities, and mixed level classrooms were more commonly present in the K-8 school setting than in the middle school setting, researchers speculated that the smaller grade cohorts observed in K-8 schools were more conducive to such practices (Byrnes & Ruby, 2007; Coladarci & Hancock, 2002; Hough, 2005; Offenberg, 2001; Yakimowski & Connolly, 2001). Although more research needs to be conducted, early findings in relation to instructional environment seem to indicate that the organizational structure of the K-8 school is better suited to support the best practices put forward by the Middle School Concept. Because determining which instructional practices are being used by any given school in a large scale empirical study can be extremely difficult, academic achievement has become the surrogate indicator for a sound instructional environment (Byrnes & Ruby, 2007).
SUMMARY
The history of grade span configurations pertaining to adolescent students has been characterized as the “the longest-running debate in middle level educational research” (MacIver & Epstein, 1993, p. 520), and the “most extensive educational reform movement in the United States” (Lounsbury, 1991, p. 68). From the establishment of the first junior high school in the early 1900s to the reorganization of middle schools into K-8 schools in the 2000s, policy decisions pertaining to school organization appear to have been formulated more in regard to pragmatic and structural considerations than sound research. Even though negative outcomes related to various social-emotional variables have been firmly linked to middle schools in the body of research, the connection between middle schools and poor academic performance has yet to be established with any degree of certainty. What has been undeniable is the fact that adolescent students are not meeting society’s academic expectations. Moreover, middle schools have taken the brunt of the criticism for results that reinforce that conclusion. In addition, the body of research pertaining to grade span configurations and their effect on academic performance is limited and riddled with inconsistent and flawed research practices. Finally, the history of grade span configurations in relation to adolescent education has seen the rise of two major reform movements (i.e., the initial conversion of K-8 schools in the early 1900s to junior high schools [and then to middle schools by the 1980s] and the K-8 School Reform Movement of the 2000s), and although the two major theoretical frameworks associated with this topic (i.e., School Transitions and Instructional Environments) have remained consistent in regard to definition and understanding, they have, at the same time, been used to justify both the creation and the dismantling of middle schools.
REFERENCES
Abella, R. (2005). The effects of small K-8 centers compared to large 6-8 schools on student performance. Middle School Journal, 37(1), 29-35.
Alexander, W. M. (1984). The middle school emerges and flourishes. In J. Lounsbury (Ed.), Perspectives: Middle school education, 1964-1984 (pp. 14-29). Columbus, OH: National Middle School Association.
Alexander, W. M., & George, P. S. (1981). The exemplary middle school. New York, NY: Holt, Rinehart & Winston.
Alexander, W. M., & Williams, E. L. (1965). Schools for the middle years. Educational Leadership, 23(3), 217-223.
www.tojned.net
18
The Online Journal of New Horizons in Education Volume 4, Issue 1
Alexander, W. M., & McEwin, K. (1989, September). Schools in the middle: Progress 1968-1988.
Schools in the middle: A report on trends and practices. Reston, VA: National Association of Secondary School Principals.
Alspaugh, J. W., & Harting, R. D. (1995). Transition effects of school grade-level organization on student achievement. Journal of Research and Development in Education, 28, 145-149.
Alspaugh, J. W. (1998). Achievement loss associated with the transition to middle school and high school. Journal of Educational Research, 92(1), 20-25.
Anderman, E. M. (2002). School effects on psychological outcomes during adolescence. Journal of Educational Psychology, 94(4), 795-809. doi:10.1037/0022-0663.94.4.795
Anderman, E. M., & Midgley, C. (1997). Changes in achievement goal orientations, perceived academic competence, and grades across the transition to middle-level schools. Contemporary Educational Psychology, 22, 269-298. doi:10.1006/ceps.1996.0926
Angus, D. L., Mirel, J. E., & Vinovskis, M. A. (1988). Historical development of age-stratification in schooling. Teachers College Record, 90(2), 211-236.
Arcia, E. (2007). A comparison of elementary/K-8 and middle schools' suspension rates. Urban Education, 42, 456-469. doi:10.1177/0042085907304879
Astor, R. A., Meyer, H. A., & Pitner, R. O. (2001). Elementary and middle school students’ perceptions of violence-prone school subcontexts. Elementary School Journal, 101(5), 511-528. doi:10.1086/499685
Bateman, S., & Karr-Kidwell, P. J. (1995). At-risk programs for middle school and high school: Essential components and recommendations for administrators and teachers. (ERIC Document Reproduction Service No. ED384954).
Beaton, A. E., Mullis, I. V., Martin, M. O., Gonzalez, E. J., Kelly, D. L., & Smith, T. A. (1996). Mathematics achievement in the middle school years: IEA’s third international mathematics and science study (TIMSS). Chestnut Hill, MA: TIMSS International Study Center.
Becker, H. J. (1987). Addressing the needs of different groups of early adolescents: Effects of varying school and classroom organizational practices on students from different social backgrounds and abilities (Report No. 16). Baltimore, MD: The Johns Hopkins University Center for Research on Elementary and Middle Schools.
Bedard, K., & Do, C. (2005). Are middle schools more effective? The impact of school structure on student outcomes. Journal of Human Resources, 40, 660-682.
Bergquist, C. C., Bigbie, C. L., Groves, L., & Richardson, G. H. (2004). Evaluation report for the study of alternatives to suspension. Tallahassee, FL: Evaluation Systems Design.
Blyth, D. A, Hill, J. P., & Smyth, C. K. (1981). The influence of older adolescents on younger adolescents: Do grade-level arrangements make a difference in behaviors, attitudes, and experiences? Journal of Early Adolescence, 1, 85-110. doi:10.1177/027243168100100109
Blyth, D. A., Simmons, R. G., & Bush, D. (1978). The transition into early adolescence: A longitudinal comparison of youth in two educational contexts. Sociology of Education, 51(3), 149-162. doi:10.2307/2112661
Borman, G., Hewes, G., Overman, L., & Brown, S. (2003). Comprehensive school reform and achievement: A meta-analysis. Review of Educational Research, 73(2), 125-230. doi:10.3102/00346543073002125
Bottoms, G., & Timberlake, A. (2008). Preparing middle grades students for high school success: A comparative study of most- and least-improved middle grades schools. Atlanta, GA: Southern Regional Education Board.
Brough, J. A. (1995). Educating young adolescents: Life in the middle. New York, NY: Garland Publishing.
Brown, E. L. (2004). The effect of number of school-to-school transitions on district performance. Doctoral dissertation, Ohio University, OH. Retrieved from http://www.ohio.edu/orgs/resig/upload/brown.pdf
Burkam, D. T., Michaels, D. L., & Lee, V. E. (2007). School grade span and kindergarten learning. The Elementary School Journal, 107, 287-303. doi:10.1086/511708
www.tojned.net
19
The Online Journal of New Horizons in Education Volume 4, Issue 1
Butler, R. (2011). Enhancing and undermining intrinsic motivation: The effects of task-involving and
ego-involving evaluation on interest and performance. British Journal of Educational Psychology, 58(1), 1-14. doi:10.1111/j.2044-8279.1988.tb00874.x
Byrnes, V., & Ruby, A. (2007). Comparing achievement between K-8 and middle schools: A large-scale empirical study. American Journal of Education, 114, 101-135. doi:10.1086/520693
Calhoun, F. S. (1983). Organization of the middle grades: A summary of research. Arlington, VA: Educational Research Service.
California Department of Education. (1994). The 1994 CLAS assessment technical report. Monterey, CA: CTB/McGraw-Hill.
Carnegie Council on Adolescent Development. (1989). Turning points: Preparing American youth for the 21st century. New York, NY: Carnegie Corporation.
Coladarci, T., & Hancock, J. (2002). The (limited) evidence regarding effects of grade-span configurations on academic achievement: What rural educators should know. Journal of Research in Rural Education, 17(3), 189-192.
Collins, B. D. (2006). School grade level configuration and sixth-grade student achievement in North Carolina. Doctoral dissertation, East Carolina University, NC. Retrieved from https://ezproxy.shsu.edu/login?url=http://search.proquest.com/docview/304938341?accountid=7065
Commission on the Reorganization of Secondary Education. (1918). Cardinal principles of education. Washington, DC: U.S. Bureau of Education.
Connolly, F., Yakimowski-Srebnick, M. E., & Russo, C. V. (2002). An examination of K-5, 6-8 versus K-8 grade configurations. ERS Spectrum, 20(2), 28-37.
Combs, J. P., Clark, D., Moore, G., Edmonson, S. L., Onwuegbuzie, A. J., & Slate, J. R. (2011). Academic achievement for fifth-grade students in elementary and intermediate school settings. Current Issues in Education, 4(1). Retrieved from http://cie.asu.edu/ojs/index.php/cieatasu/article/view/677
Cook, P. J., MacCoun, R., Muschkin, C., & Vigdor, J. ( 2008). The negative impacts of starting middle school in sixth grade. Journal of Policy Analysis and Management, 27, 104-121. doi:10.1002/pam.20309
Cromwell, S. (1999). K-8 schools: An idea for the new millennium? EducationWorld. Retrieved from http://www.educationworld.com/a_admin/admin/admin115.shtml
Cronbach, L. J., Bradburn, N. L., & Horvitz, D. F. (1994). Sampling and statistical procedures used in the California Learning Assessment System: Report of the Select Committee to the California State Department of Education. Sacramento, CA: California State Department of Education.
Cuban, L. (1992). What happens to reforms that last? The case of the junior high school. American Educational Research Journal, 29(2), 227-251. doi:10.2307/1163367
Eccles, J. S., & Midgley, C. (1989). Stage/environment fit: Developmentally appropriate classrooms for early adolescents. In C. Ames & R. Ames (Eds.), Research on motivation in education (Vol. 3, pp. 139-186). New York, NY: Academic Press.
Eccles, J. S., Lord, S., & Midgley, C. (1991). What are we doing to early adolescents? The impact of educational contexts on early adolescents. American Journal of Education, 99, 521-542. doi:10.1086/443996
Educational Research Service. (2004). The informed educator series: Grade configuration. Arlington, VA: Author.
Eichorn, D. H. (1966). The middle school. New York, NY: Center for Applied Research in Education.
Eichorn, D. H. (1984). The nature of transescents. In J. Lounsbury (Ed.), Perspectives: Middle school education (pp. 30-37). Columbus, OH: National Middle School Association.
Elovitz, L. H. (2007). Middleschoolsaurus Rex: Is the middle school becoming extinct? Principal Leadership, 7(7), 26-30.
Epstein, J. L., & MacIver, D. J. (1990). Education in the middle grades: Overview of national practices and trends. Columbus, OH: National Middle School Association.
Erb, T. O. (2006). Middle school models are working in many grade configurations to boost student performance. American Secondary Education, 34(3), 4-13.
Feld, M. M., et al. (1979). A report on the feasibility of a grade level reorganization for the Providence School System: Phase 1 Final Report. Providence, RI: University of Rhode Island.
www.tojned.net
20
The Online Journal of New Horizons in Education Volume 4, Issue 1
Felner, R., Jackson, A. Kasak, D., Mulhall, P., Brand, S, & Flowers, N. (1997). The impact of school
reform for the middle years: A longitudinal study of a network engaged in turning points-based comprehensive school transformation. Phi Delta Kappan, 78(7), 528-532, 541-550.
Fink, L.L. (2010). A comparison of grade configuration on urban sixth to eighth grade student outcomes in regular and special education. Doctoral dissertation, University of Maryland, College Park, MD. Retrieved from http://drum.lib.umd.edu/handle/1903/10836
Finkelstein, I. (1913). The marking system in theory and practice. Baltimore, MD: Warwick and York, Inc.
Franklin, B. J., & Glascock, C. H. (1996, October). The relationship between grade configuration and student performance in rural schools. Paper presented at the Annual Conference of the National Rural Education Association, San Antonio, TX (ERIC Document Reproduction Service No. ED403083). Retrieved from http://www.eric.ed.gov/PDFS/ED403083.pdf
George, P. S. (1999). A middle school - If you can keep it: Part II. Westerville, OH: National Middle School Association.
Gruhn, W., & Douglass, H. (1956). The modern junior high school (2nd ed.). New York, NY: Ronald Press.
Hall, S. G. (1905). Adolescence: Its psychology and its relations to physiology, anthropology, sociology, sex, crime, religion and education, Vol. II. New York, NY: D. Appleton and Co.
Hansen, J. H., & Hearn, A. C. (1971). The middle school program. Chicago, IL: Rand McNally.
Herman, B. E. (2004). The revival of K–8 schools. Phi Delta Kappa Fastbacks, 519, 7-37.
Ho, R. (2006). Handbook of univariate and multivariate data analysis and interpretation with SPSS. London, England: Chapman and Hall. doi:10.1201/9781420011111
Hough, D. L. (2003). R3: Research, rhetoric, and reality: A study of studies addressing NMSA’s 21st century research agenda and this we believe. Westerville, OH: National Middle School Association.
Hough, D. L. (2005). The rise of the ‘elemiddle’ school. School Administrator, 62(3), 10-14.
Howell, D. C. (2007). Statistical methods for psychology (6th ed.). Belmont, CA: Thomson Wadsworth.
Howley, C. B. (2002). Grade-span configurations. School Administrator, 59(3), 24-29.
Jackson, A. W., & Davis, G. A. (2000). Turning points 2000: Educating adolescents in the 21st Century. New York, NY: Teachers College Press.
Jonas, M. (2007, January 28). Junior high. The Boston Globe, p. 1E.
Juvonen, J., Le, V., Kaganoff, T., Augustine, C., & Constant, L. (2004). Focus on the wonder years: Challenges facing the American middle school. Santa Monica, CA: RAND.
Kennedy, E. (1993). A study of out-of-school suspensions and expulsions in Louisiana public schools (Research Report, 93-1). Baton Rouge, LA: Louisiana Department of Education.
Klump, J. (2006). What the research says (or doesn’t say) about K-8 versus middle school grade configurations. Portland, OR: Northwest Regional Educational Laboratory.
Lee, V. E., & Smith, J. B. (1993). Effects of school restructuring on the achievement and engagement of middle grade students. Sociology of Education, 66(3), 164-187. doi:10.2307/2112735
Lounsbury, J. H. (2009). Deferred but not deterred: A middle school manifesto. Middle School Journal, 40(5), 31-36.
MacIver, D. J., & Epstein, J. L. (1993). Middle grades research: Not yet mature, but no longer a child. Elementary School Journal, 93(5), 519-533. doi:10.1086/461738
Malaspina, D., & Rimm-Kaufman, S. E. (2008). Early predictors of school performance declines at school transition points. Research in Middle Level Education, 31(9), 1-16.
Manning, M. L. (2000). A brief history of the middle school. The Clearing House, 73(4), 192. doi:10.1080/00098650009600946
Martin, J. H. (1974). Report of the national panel on high schools and adolescent education. Washington, DC: U.S. Office of Education.
www.tojned.net
21
The Online Journal of New Horizons in Education Volume 4, Issue 1
McEwin, C. K., Dickinson, T. S., & Jacobson, M. G. (2004). Programs and practices in K-8 schools: Do
they meet the educational needs of young adolescents? Westerville, OH: National Middle School Association.
McEwin, C. K., Dickinson, T. S., & Swaim, J. (1996). Middle level teacher preparation: A national status report. Boone, NC: Appalachian State University.
McPartland, J. M., Coldiron, J. R., & Braddock, J. H. (1987). School structures and classroom practices in elementary, middle, and secondary schools (Report No. 14). Baltimore, MD: The Johns Hopkins University Center for Research on Elementary and Middle Schools.
Mendez, L. M. R., & Knoff, H. M. (2003). Who gets suspended from school and why: A demographic analysis of schools and disciplinary infractions in a large school district. Education and Treatment of Children, 26, 30-51.
Midgley, C. (1993). Motivation and middle-level schools. In M. Maehr & P. Pintrich (Eds.), Motivation and adolescent development. Vol. 8 of advances in motivation and achievement. Greenwich, CT: JAI.
Mizell, H. (2005). Grade configurations for educating young adolescents: Are we still crazy after all these years? Middle School Journal, 37(1), 14-23.
Murdock, T. B., Anderman, L. H., & Hodge, S. A. (2000). Middle-grade predictors of students’ motivation and behavior in high school. Journal of Adolescent Research, 15(3), 327-351. doi:10.1177/0743558400153002
Musil, C. M., Warner, C. B., Yobas, P. K., & Jones, S. L. (2002). A comparison of imputation techniques for handling missing data. Western Journal of Nursing Research, 24, 815-829. doi:10.1177/019394502762477004
National Association of Secondary School Principals. (1985). An agenda for excellence at the middle level. Reston, VA: Author.
National Center for Education Statistics. (1999). Mathematics and science achievement of eighth graders in 1999. Washington, DC: United States Department of Education: Institute of Education Sciences. Retrieved from http://nces.ed.gov/timss/results99_1.asp
National Center for Education Statistics. (2007). TIMSS 2007 results. Washington, DC: United States Department of Education: Institute of Education Sciences. Retrieved from http://nces.ed.gov/timss/results07.asp
National Center for Education Statistics. (2009). The nation’s report card: Science 2009. Washington, DC: United States Department of Education: Institute of Education Sciences. Retrieved from http://nces.ed.gov/nationsreportcard/pdf/main2009/2011451.pdf
National Center for Education Statistics. (2011a). Common core of data (CCD). Washington, DC: United States Department of Education: Institute of Education Sciences. Retrieved from http://nces.ed.gov/ccd/search.asp
National Center for Education Statistics. (2011b). NAEP overview. Washington, DC: United States Department of Education: Institute of Education Sciences. Retrieved from http://nces.ed.gov/nationsreportcard/about/
National Center for Education Statistics. (2011c). The nation’s report card: Mathematics 2011. Washington, DC: United States Department of Education: Institute of Education Sciences. Retrieved from http://nces.ed.gov/nationsreportcard/pdf/main2011/2012458.pdf
National Center for Education Statistics. (2011d). The nation’s report card: Reading 2011. Washington, DC: United States Department of Education: Institute of Education Sciences. Retrieved from http://nces.ed.gov/nationsreportcard/pdf/main2011/2012457.pdf
National Education Association. (1894). Report of the committee of ten on secondary school studies. New York, NY: American Book Company.
National Education Association. (1899). Report of the committee on college entrance requirements. Los Angeles, CA: Journal of Proceedings and Addresses of the Thirty-Eighth Annual Meeting.
National Forum to Accelerate Middle Grades Reform. (2002). Policy statement: Teacher preparation, licensure, and recruitment. Newton, MA: Author.
National Middle School Association. (2003). This we believe: Successful schools for young adolescents. Westerville, OH: Author.
www.tojned.net
22
The Online Journal of New Horizons in Education Volume 4, Issue 1
Offenberg, R. M. (2001). The efficacy of Philadelphia’s K-to-8 schools compared to middle grades
schools. Middle School Journal, 32(4), 23-29.
Organisation for Economic Co-operation and Development. (2003). 2000 PISA results. Paris, France. Retrieved from http://www.oecd.org/dataoecd/43/9/33690591.pdf
Organisation for Economic Co-operation and Development. (2010). PISA 2009 scores and rankings by country/economy. Paris, France. Retrieved from http://www.pisa.oecd.org/dataoecd/54/12/46643496.pdf
Otto, H. J. (1931). Shall the teacher teach all subjects? The Elementary School Journal, 32(2), 125-134. doi:10.1086/456685
Paglin, C., & Fager, J. (1997). Grade configuration: Who goes where? Portland, OR: Northwest Regional Education Laboratory.
Pardini, P. (2002). Revival of the K–8 school. School Administrator, 59(3), 6-12.
Reddy, R., Rhodes, J. E., & Mulhall, P. (2003). The influence of teacher support on student adjustment in the middle school years: A latent growth curve study. Development and Psychopathology, 15(1), 119-138. doi:10.1017/S0954579403000075
Reising, B. (2002). Middle school models. The Clearing House, 76(2), 60-61. doi:10.1080/00098650209604949
Renchler, R. (2002). School organization: Grade span. Eugene, OR: ERIC Clearinghouse on Educational Management. (ERIC Document Reproduction Service No. ED472994).
Sanders-Smith, P. (2009). A comparative analysis of grade configuration and academic achievement among eastern North Carolina 6-8 and K-8 schools. Doctoral dissertation (UMI No. 3406567), Fayetteville State University, NC.
Shafer, J. L., & Graham, J. W. (2002). Missing data: Our view of the state of the art. Psychological Methods, 2, 147-177. doi:10.1037/1082-989X.7.2.147
Schafer, K. L. (2010). The impact of grade configuration on sixth grade academic achievement in Florida Public schools. Doctoral dissertation (UMI No. 3415047), University of Central Florida, FL.
Schmidt, W. H., McKnight, C. C., Jakwerth, P. M., Cogan, L. S., & Houang, R. T. (1999). Facing the consequences: Using TIMSS for a closer look at the United States. Dordrecht, Netherlands: Kluwer Mathematics and Science Education.
Seidman, E., Allen, L., Aber, J. L., Mitchell, C., & Feinman, J. (1994). The impact of school transitions in early adolescence on the self-system and social context of poor urban youth. Child Development, 65(4), 507-522. doi:10.2307/1131399
Simmons, R., & Blyth, D. (1987). Moving into adolescence: The impact of pubertal changes and school context. New York, NY: Aldine de Gruyter.
Simmons, R., Black, A., & Zhou, Y. (1991). African-American versus White children and the transition into junior high school. American Journal of Education, 99(4), 521-542. doi:10.1086/443995
Tanner, J. M. (1962). Growth at adolescence. Oxford, England: Blackwell Scientific Publications.
Tucker, C. G., & Andrada, G. N. (1997, March). Accountability works: Analysis of performance by grade span of school. Paper presented at the annual meeting of the American Educational Research Association, Chicago, IL.
Tucker, M. S., & Codding, J. B. (1998). Standards for our schools: How to set them, measure them, and reach them. San Francisco, CA: Jossey-Bass.
Tucker, M. S., & Codding, J. B. (1999). Education and the demands of democracy in the next millennium. In D. D. Marsh (Ed.), Preparing our schools for the 21st century (1999 ASCD Yearbook) (pp. 24-44). Alexandria, VA: Association for Supervision and Curriculum Development.
U.S. Department of Education. (2001). Public Law 107-110, No Child Left Behind Act. Retrieved from http://www2.ed.gov/policy/elsec/leg/esea02/107-110.pdf
U.S. Department of Education. (2004). Four pillars of NCLB. Retrieved from http://ed.gov/nclb/overview/intro/4pillars.html
Viadero, D. (2008, January 12). Evidence for moving to K-8 model not airtight. Education Week, 27(19), 1.
www.tojned.net
23
The Online Journal of New Horizons in Education Volume 4, Issue 1
Watson, R. J. (2009). A comparison study of Montana’s intermediate and K-8 schools with regard to
student performance on a criterion referenced test, incident of at-risk behaviors, and perceptions of educators from both grade configurations. Doctoral dissertation (UMI No. 3342328), University of Montana, MT.
Weiss, C. C., & Kipnes, L. (2006). Reexamining middle school effects: A comparison of middle grade students in middle schools and K-8 schools. American Journal of Education, 112, 239-272. doi:10.1086/498996
Whitley, J., Lupart, J. L., & Beran, T. (2007). Differences in achievement between adolescents who remain in a K-8 school and those who transition to a junior high school. Canadian Journal of Education, 30, 649-669. doi:10.2307/20466657
Wihry, D. F., Coladarci, T., & Meadow, C. (1992). Grade span and eighth-grade academic achievement: Evidence from a predominantly rural state. Journal of Research in Rural Education, 8(2), 58-70.
Wormeli, R. (2006, Summer). Misleading in the middle: A rebuttal to Cheri Pierson Yecke. Educational Leadership, 63. Retrieved from http://www.ascd.org/publications/educational-leadership/summer06/vol63/num09/[email protected]
Yakimowski, M. E., & Connolly, F. (2001). An examination of K–5, 6–8, and K–8 grade configurations. Report prepared for the board of school commissioners. Baltimore, MD: Division of Research, Evaluation, and Accountability, Baltimore City Public School System.
Yecke, C. P. (2006, April). Mayhem in the middle: Why we should shift to K–8. Educational Leadership, 63(7), 20-25.
www.tojned.net
24
The Online Journal of New Horizons in Education Volume 4, Issue 1
A Review of Physical Education Teachers’ Efficacy in Teaching-Learning Process
Gökhan ÇETİNKOL [1], Serap ÖZBAŞ [2]
[1] Near East University [email protected]
[2] Near East University [email protected]
This study is based on the Master’s Dissertation written by Gökhan ÇETİNKOL
ABSTRACT
The aim of this research is to determine the efficacy of physical education teachers in teaching-learning process and to compare them in accordance with several variables. In this study, “Teacher Efficacy Scale”was utilized in order to examine the physical education teachers’ efficacy in the teaching-learning process. The research was carried out in the Spring Term 2011-2012 with 142 physical education teachers working in the public secondary and high schools in Turkish Republic of Northern Cyprus. The value of reliability was measured 0.96. As the result of research, teachers replied “I strongly feel confident” to the efficacy scale in teaching-learning process. Education level does not contribute to their efficacy in this process. The variables in gender or vocational seniority in their professions have neither separate nor shared impacts on their efficacy in teaching-learning process.
Keywords: Physical Education Teachers, Teacher Efficacy
INTRODUCTION
In order to have a regular and demanded education process in the educational institutions, it is compulsory to plan and programme each phase of education (Küçükahmet, 2005). The planned and programmed education is called “teaching”; so, curriculum is the major part of educational programme (Laska and Gürbüztürk, 1984). Curriculum: “special objectives and their subsidiary components and critical behaviours are constituted of “test conditions which show whether these components and critical behaviours are taught or not” (Özçelik, 1992). In the curriculums was interiorised constructivist approach to fulfil the objectives of the curriculums. The teachers were given new roles in this approach in which students adopt their own learning (T.C. MEB-Öğretim Programları).
Teachers are the important figures in educational system (Bilgen, 1998). They are responsible for raising man power which is necessary for new generations and their countries and play a role model for those who they raise at the same time (Karaküçük, 1999). Therefore, teachers are supposed to have sufficient knowledge, skills and attitudes. Their sufficient knowledge, skills and attitudes are also related to their vocational efficacy.
Consisting of knowledge, skills, attitudes and behaviours, teacher efficacy can be both observed and testified. The behaviour and skills observed and testified are concerned with the assessment and evaluation of behaviour, attitudes and skills. This indicates that teacher efficacy can be assessed and evaluated (www.egyankosh.ac). These evaluations of efficacy put forth teachers’ tasks and success (T. C. MEB-TTKB-Öğretmen Yeterlilikleri, 2008). For that reason, teachers’ sufficient knowledge, skills, attitudes and behaviours, namely their vocational efficacy, should be put into practice in order to determine their tasks and success. The evaluation of Physical Education Teachers’ Efficacy in is of great importance in terms of the practice of their craft knowledge, responsibility and skills, and it must be investigated. This study is viewed to be of high importance because it helps reveal the physical education teachers’ efficacy in Turkish Republic of Northern Cyprus (TRNC).
www.tojned.net 25
The Online Journal of New Horizons in Education Volume 4, Issue 1
The aim of this study is to determine the efficacy of physical education teachers who work at secondary schools and high schools in TRNC and compare them with its variables (gender, education level, vocational seniority). In this light, answers were sought to the following questions.
1. At what level is the physical education teachers’ efficacy in the teaching-learning process?
2. What are descriptive characteristics associated with sub-efficacies in lesson planning, material preparation, arranging learning environments, arranging extracurricular activities, diversifying teaching considering individual differences, time management and behaviour management?
3. Is it significant difference between physical education teachers’ efficacy in teaching-learning process according to education levels?
4. Is it significant difference between physical education teachers’ efficacy in teaching-learning process according to gender?
5. Is it significant difference between physical education teachers’ efficacy in teaching-learning process according to vocational seniority?
6. Is there significant interaction between gender, and vocational seniority on the teacher efficacy.
THE STUDY
The research horizon includes secondary and high schools in TRNC. A maximum sampling that would represent each county homogeneously was tried to be reached. Sampling involves 38 schools which were randomly selected (13 secondary schools and 25 high schools). The research included a total of 142 volunteer physical education teacher participants.
“Teacher Efficacy Scale” was used as data collection tool. Teacher Efficacy Scale was developed by Oskay et al. in 2010. The scale including 56 items comprises of 7 sub-efficacy fields as “Lesson Planning” (LP, 9 items), “Material Preparation” (MP, 10 items), “Arranging Learning Environments” (ALE, 9 items), “Arranging Extracurricular Activities” (AEA, 6 items), “Diversifying Teaching Considering Individual Differences” (DTCID 8 items), “Time Management” (TM, 3 items), “Behaviour Management” (BM, 11 items) and measured through Likert’s Scale with 7 items (“1= Never Feel Confident, ......... 7= Strongly Feel Confident”). Oskay et al. (2010) found the reliability coefficient value as .94 in their research while it is .96 in this research.
While analysing the data, standard deviation (Sd) techniques as frequency (N), percentage (%) and mean ( ) were made of use. Parametric statistics techniques were used so as to figure out if there are any distinctions among the Physical Education Teachers in terms of gender, education level, and vocational seniority. Numerical data was checked for normalisation. The measures of skewness and kurtosis were analysed and Kolmogrov-Sminorov was measured since the number of samples was more than 50. The measures of skewness and kurtosis were 0.44 and 0.49, and level of significance was measured .31 in Kolmogrov-Sminorov test. Parametric Statistics Techniques were decided to be used in line with the measures of skewness and kurtosis, and Kolmogrov-Sminorov test questions. The techniques of T test and bilateral analysis of variance (ANOVA) from parametric statistics techniques were utilised. Score ranges of measuring tool are normal at a level of p> 0.05 significance. In the research, the items are interpreted as follow: items 1-3 represent “Never Feel Confident”; item 4: Neutral; 5-7 represent “Strongly Feel Confident”. The data collected in the research was assessed via SPSS 17.0 package programme.
FINDINGS
Results of Descriptive Statistics Analysis
The mean value of physical education teacher efficacy in teaching-learning process is = 6.13 (Sd= .63, skewness= -0.44 and Kurtosis= -0.49). The rates of efficacy and sub-efficacy of the physical education teachers involved in the research were figured in Table 2.
www.tojned.net
26
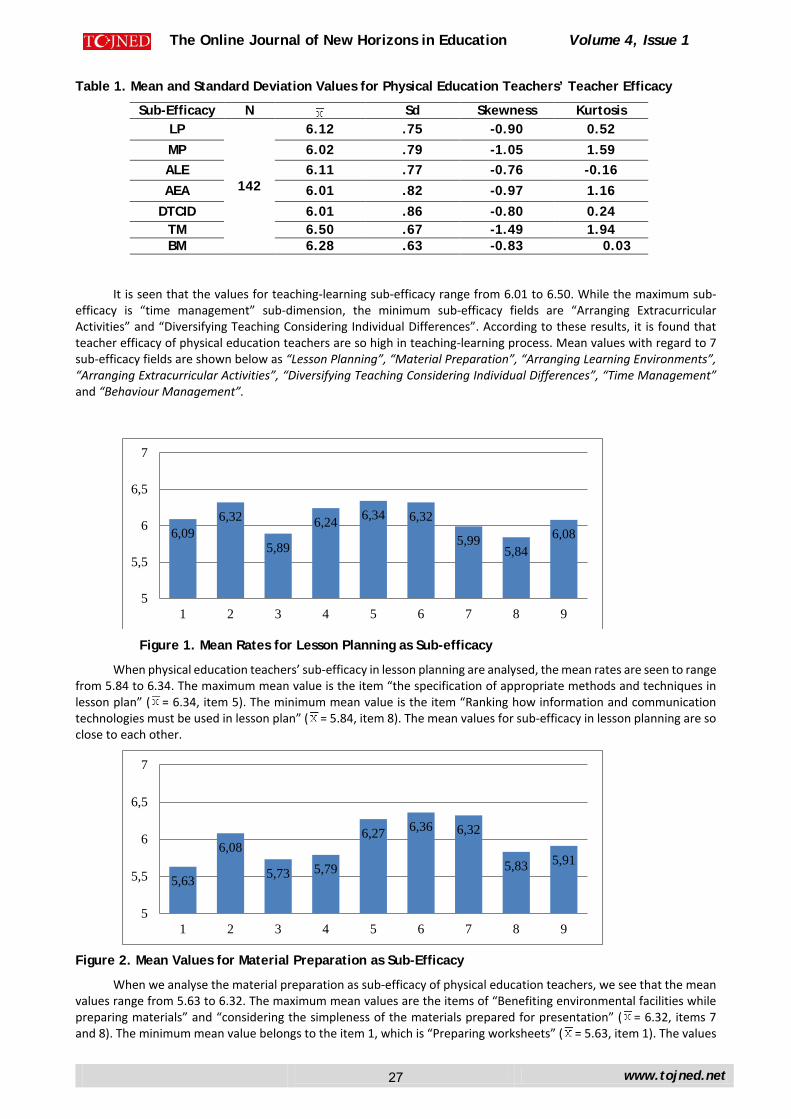
The Online Journal of New Horizons in Education Volume 4, Issue 1
Table 1. Mean and Standard Deviation Values for Physical Education Teachers’ Teacher Efficacy
Sub-Efficacy N Sd Skewness Kurtosis LP
142
6.12 .75 -0.90 0.52 MP 6.02 .79 -1.05 1.59 ALE 6.11 .77 -0.76 -0.16 AEA 6.01 .82 -0.97 1.16
DTCID 6.01 .86 -0.80 0.24 TM 6.50 .67 -1.49 1.94 BM 6.28 .63 -0.83 0.03
It is seen that the values for teaching-learning sub-efficacy range from 6.01 to 6.50. While the maximum sub-efficacy is “time management” sub-dimension, the minimum sub-efficacy fields are “Arranging Extracurricular Activities” and “Diversifying Teaching Considering Individual Differences”. According to these results, it is found that teacher efficacy of physical education teachers are so high in teaching-learning process. Mean values with regard to 7 sub-efficacy fields are shown below as “Lesson Planning”, “Material Preparation”, “Arranging Learning Environments”, “Arranging Extracurricular Activities”, “Diversifying Teaching Considering Individual Differences”, “Time Management” and “Behaviour Management”.
Figure 1. Mean Rates for Lesson Planning as Sub-efficacy
When physical education teachers’ sub-efficacy in lesson planning are analysed, the mean rates are seen to range from 5.84 to 6.34. The maximum mean value is the item “the specification of appropriate methods and techniques in lesson plan” ( = 6.34, item 5). The minimum mean value is the item “Ranking how information and communication technologies must be used in lesson plan” ( = 5.84, item 8). The mean values for sub-efficacy in lesson planning are so close to each other.
Figure 2. Mean Values for Material Preparation as Sub-Efficacy
When we analyse the material preparation as sub-efficacy of physical education teachers, we see that the mean values range from 5.63 to 6.32. The maximum mean values are the items of “Benefiting environmental facilities while preparing materials” and “considering the simpleness of the materials prepared for presentation” ( = 6.32, items 7 and 8). The minimum mean value belongs to the item 1, which is “Preparing worksheets” ( = 5.63, item 1). The values
6,096,32
5,89
6,24 6,34 6,32
5,995,84
6,08
5
5,5
6
6,5
7
1 2 3 4 5 6 7 8 9
5,63
6,08
5,73 5,79
6,27 6,36 6,32
5,83 5,91
5
5,5
6
6,5
7
1 2 3 4 5 6 7 8 9
www.tojned.net
27
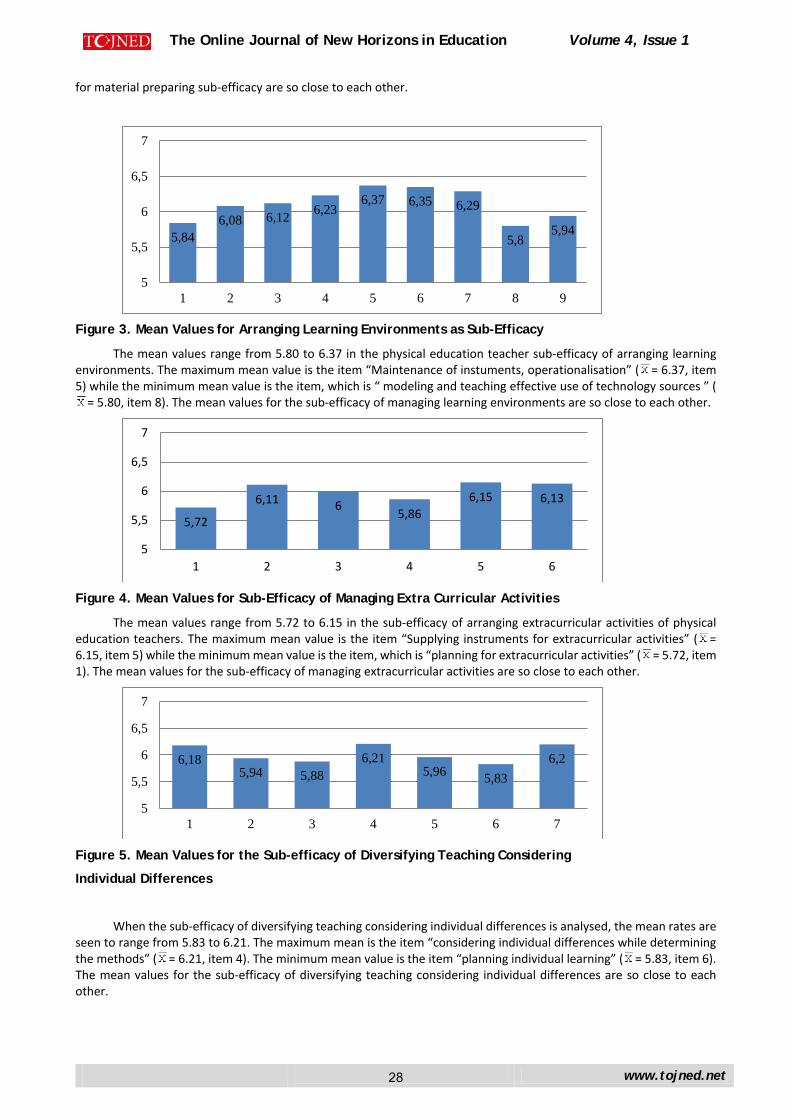
The Online Journal of New Horizons in Education Volume 4, Issue 1
for material preparing sub-efficacy are so close to each other.
Figure 3. Mean Values for Arranging Learning Environments as Sub-Efficacy
The mean values range from 5.80 to 6.37 in the physical education teacher sub-efficacy of arranging learning environments. The maximum mean value is the item “Maintenance of instuments, operationalisation” ( = 6.37, item 5) while the minimum mean value is the item, which is “ modeling and teaching effective use of technology sources ” (
= 5.80, item 8). The mean values for the sub-efficacy of managing learning environments are so close to each other.
Figure 4. Mean Values for Sub-Efficacy of Managing Extra Curricular Activities
The mean values range from 5.72 to 6.15 in the sub-efficacy of arranging extracurricular activities of physical education teachers. The maximum mean value is the item “Supplying instruments for extracurricular activities” ( = 6.15, item 5) while the minimum mean value is the item, which is “planning for extracurricular activities” ( = 5.72, item 1). The mean values for the sub-efficacy of managing extracurricular activities are so close to each other.
Figure 5. Mean Values for the Sub-efficacy of Diversifying Teaching Considering
Individual Differences
When the sub-efficacy of diversifying teaching considering individual differences is analysed, the mean rates are seen to range from 5.83 to 6.21. The maximum mean is the item “considering individual differences while determining the methods” ( = 6.21, item 4). The minimum mean value is the item “planning individual learning” ( = 5.83, item 6). The mean values for the sub-efficacy of diversifying teaching considering individual differences are so close to each other.
5,846,08 6,12 6,23
6,37 6,35 6,29
5,85,94
5
5,5
6
6,5
7
1 2 3 4 5 6 7 8 9
5,72
6,11 6 5,866,15 6,13
5
5,5
6
6,5
7
1 2 3 4 5 6
6,185,94 5,88
6,215,96 5,83
6,2
5
5,5
6
6,5
7
1 2 3 4 5 6 7
www.tojned.net
28
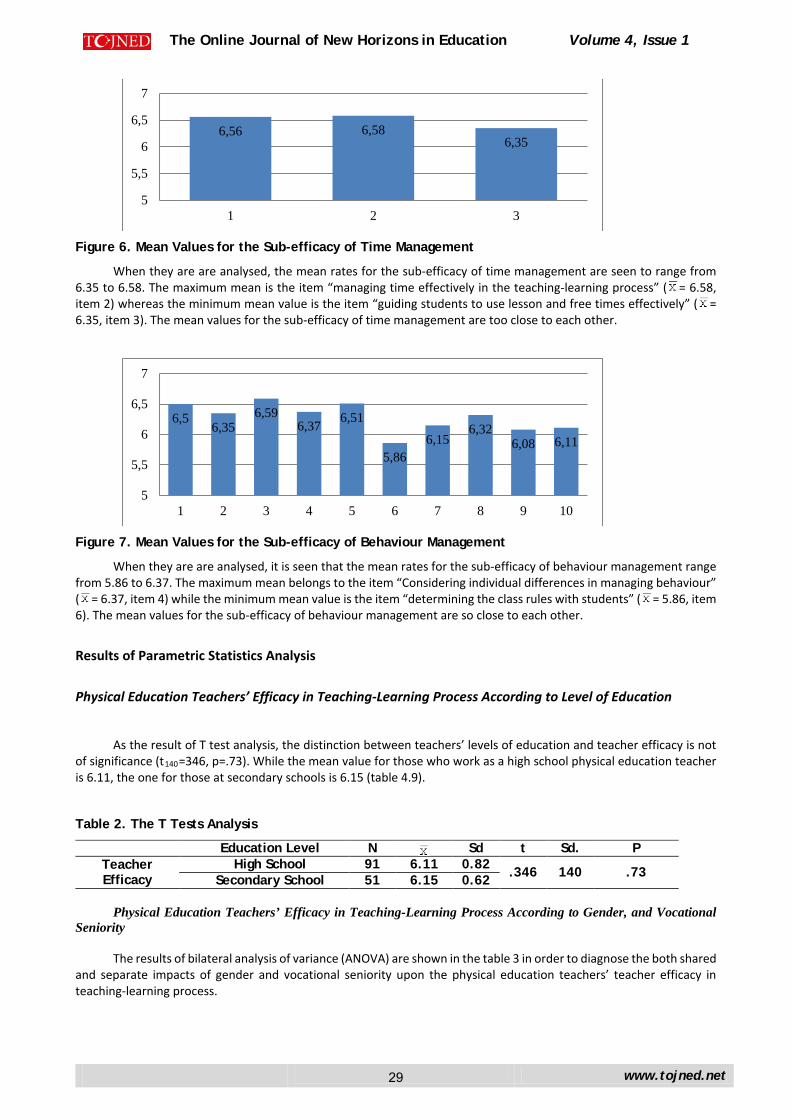
The Online Journal of New Horizons in Education Volume 4, Issue 1
Figure 6. Mean Values for the Sub-efficacy of Time Management
When they are are analysed, the mean rates for the sub-efficacy of time management are seen to range from 6.35 to 6.58. The maximum mean is the item “managing time effectively in the teaching-learning process” ( = 6.58, item 2) whereas the minimum mean value is the item “guiding students to use lesson and free times effectively” ( = 6.35, item 3). The mean values for the sub-efficacy of time management are too close to each other.
Figure 7. Mean Values for the Sub-efficacy of Behaviour Management
When they are are analysed, it is seen that the mean rates for the sub-efficacy of behaviour management range from 5.86 to 6.37. The maximum mean belongs to the item “Considering individual differences in managing behaviour” ( = 6.37, item 4) while the minimum mean value is the item “determining the class rules with students” ( = 5.86, item 6). The mean values for the sub-efficacy of behaviour management are so close to each other.
Results of Parametric Statistics Analysis
Physical Education Teachers’ Efficacy in Teaching-Learning Process According to Level of Education
As the result of T test analysis, the distinction between teachers’ levels of education and teacher efficacy is not of significance (t140=346, p=.73). While the mean value for those who work as a high school physical education teacher is 6.11, the one for those at secondary schools is 6.15 (table 4.9).
Table 2. The T Tests Analysis
Education Level N Sd t Sd. P Teacher Efficacy
High School 91 6.11 0.82 .346 140 .73 Secondary School 51 6.15 0.62
Physical Education Teachers’ Efficacy in Teaching-Learning Process According to Gender, and Vocational Seniority
The results of bilateral analysis of variance (ANOVA) are shown in the table 3 in order to diagnose the both shared
and separate impacts of gender and vocational seniority upon the physical education teachers’ teacher efficacy in teaching-learning process.
6,56 6,586,35
5
5,5
6
6,5
7
1 2 3
6,56,35
6,596,37 6,51
5,866,15
6,326,08 6,11
5
5,5
6
6,5
7
1 2 3 4 5 6 7 8 9 10
www.tojned.net
29
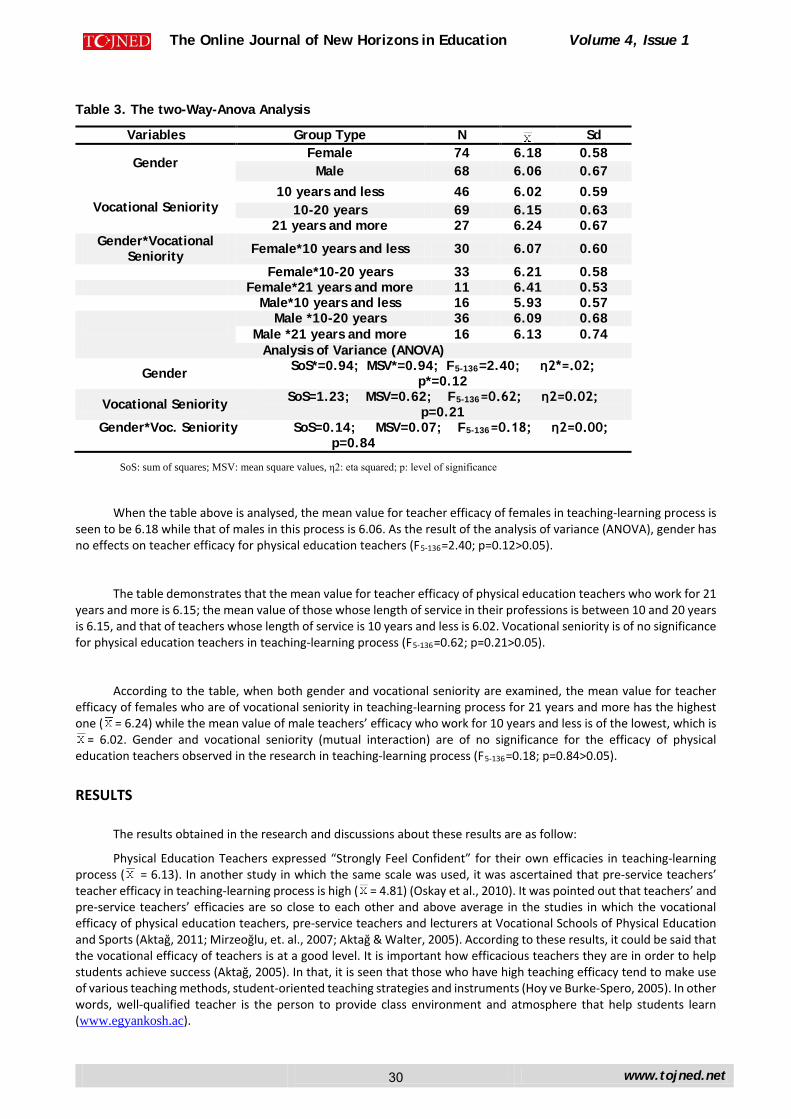
The Online Journal of New Horizons in Education Volume 4, Issue 1
Table 3. The two-Way-Anova Analysis
Variables Group Type N Sd
Gender Female 74 6.18 0.58
Male 68 6.06 0.67
Vocational Seniority 10 years and less 46 6.02 0.59
10-20 years 69 6.15 0.63 21 years and more 27 6.24 0.67
Gender*Vocational Seniority Female*10 years and less 30 6.07 0.60
Female*10-20 years 33 6.21 0.58 Female*21 years and more 11 6.41 0.53 Male*10 years and less 16 5.93 0.57
Male *10-20 years 36 6.09 0.68 Male *21 years and more 16 6.13 0.74
Analysis of Variance (ANOVA)
Gender SoS*=0.94; MSV*=0.94; F5-136=2.40; η2*=.02; p*=0.12
Vocational Seniority SoS=1.23; MSV=0.62; F5-136=0.62; η2=0.02; p=0.21
Gender*Voc. Seniority SoS=0.14; MSV=0.07; F5-136=0.18; η2=0.00; p=0.84
SoS: sum of squares; MSV: mean square values, η2: eta squared; p: level of significance
When the table above is analysed, the mean value for teacher efficacy of females in teaching-learning process is seen to be 6.18 while that of males in this process is 6.06. As the result of the analysis of variance (ANOVA), gender has no effects on teacher efficacy for physical education teachers (F5-136=2.40; p=0.12>0.05).
The table demonstrates that the mean value for teacher efficacy of physical education teachers who work for 21 years and more is 6.15; the mean value of those whose length of service in their professions is between 10 and 20 years is 6.15, and that of teachers whose length of service is 10 years and less is 6.02. Vocational seniority is of no significance for physical education teachers in teaching-learning process (F5-136=0.62; p=0.21>0.05).
According to the table, when both gender and vocational seniority are examined, the mean value for teacher efficacy of females who are of vocational seniority in teaching-learning process for 21 years and more has the highest one ( = 6.24) while the mean value of male teachers’ efficacy who work for 10 years and less is of the lowest, which is
= 6.02. Gender and vocational seniority (mutual interaction) are of no significance for the efficacy of physical education teachers observed in the research in teaching-learning process (F5-136=0.18; p=0.84>0.05).
RESULTS
The results obtained in the research and discussions about these results are as follow:
Physical Education Teachers expressed “Strongly Feel Confident” for their own efficacies in teaching-learning process ( = 6.13). In another study in which the same scale was used, it was ascertained that pre-service teachers’ teacher efficacy in teaching-learning process is high ( = 4.81) (Oskay et al., 2010). It was pointed out that teachers’ and pre-service teachers’ efficacies are so close to each other and above average in the studies in which the vocational efficacy of physical education teachers, pre-service teachers and lecturers at Vocational Schools of Physical Education and Sports (Aktağ, 2011; Mirzeoğlu, et. al., 2007; Aktağ & Walter, 2005). According to these results, it could be said that the vocational efficacy of teachers is at a good level. It is important how efficacious teachers they are in order to help students achieve success (Aktağ, 2005). In that, it is seen that those who have high teaching efficacy tend to make use of various teaching methods, student-oriented teaching strategies and instruments (Hoy ve Burke-Spero, 2005). In other words, well-qualified teacher is the person to provide class environment and atmosphere that help students learn (www.egyankosh.ac).
www.tojned.net
30
The Online Journal of New Horizons in Education Volume 4, Issue 1
Education level of their school does not effect on their level of efficacy. In a study in which senses of vocational efficacy were investigated, there is no significant difference between the high school and primary school physical education teachers’ teacher efficacy (Mirzeoğlu et al., 2007). According to these results, it could be inferred that the vocational efficacies of physical education teachers who teach at schools with different education levels compare to each other.
Another result displays that gender also has no impact on the physical education teachers’ efficacy in teaching-learning process. In this respect, it is also possible to declare that the male physical education teachers’ efficacy in teaching-learning process compare to those of female teachers. While this result is similar to some research results (Aktuğ, 2011; Mirzeoğlu, et. al., 2007), it has no similarities to some others (Aktağ & Walter, 2005; Şeker et al., 2005). We see that vocational seniority has no important impact on the teacher efficacy.
REFERENCES
Oskay, O., Erdem, E., Akkoyunlu, B., Soran, H. ve Yılmaz, A. (2010). Öğretmenlerin Öğretme ve Öğrenme Sürecindeki Yeterlilikler Açısından Kendilerini Değerlendirme Üzerine Bir Çalışma. Uluslararası Öğretmen Yetiştirme Politikaları ve Sorunları Sempozyumu II., Hacettepe Üniversitesi, Ankara.
Aktağ, I. (2007). Öğretmen Uygulaması Dersinin Öğretmen Yeterliği Üzerine Duygusu. 10th International Sport Sciences Congress. October 23-25, 2008, Bolu-Turkey.
Aktağ, I. ve Walter, J. (2005). Öğretmen Adaylarının Mesleki Yeterlilik Duygusu. Spormetre Beden Eğitimi ve Spor Bilimleri Dergisi, 3(4): 127-131.
Aktağ, I. Walter, J. (2005). “ Teacher Efficacy of Pre-service Teachers’ Spormetre, Journal of
Physical Education and Sports Sciences 2005; 3(4): 127-131
Bilgen, N. (1998). Öğretmen ve Eğitimi. Milli Eğitim Dergisi. Issue:137, p.62.
Karakuçuk, S. (1999). Rekreasyon (Boş Zamanları Değerlendirme), 3. Baskı, Bağırgan Yayınevi, Ankara.
Küçükahmet, L. (2005). Planning and Evaluation in Teaching. 15. Baskı, Nobel Yayınevi, Ankara.
Laska, John A. “The relationship between instruction and curriculum: A conceptual clarification”
(Cited in: Instructional Science, 13, 1984, s. 203-213. Elsevier Science Publishers B.V. Amsterdam). Trans. Oğuz Gürbüztürk. A.Ü. Eğitim Bilimleri Fakültesi Dergisi, c.22, issue 1, p. 251-259, Ankara, 1989.
T.C.-MEB-Öğretim Programları (2006). İlköğretim Beden Eğitimi ve Spor Dersi Öğretim Programı (1-8. Grades) Ankara. [Online]:http://ttkb.meb.gov.tr/
T.C. MEB (2008). Öğretmen Yeterlilikleri. Ankara: MEB Yayınları.
T.C.-MEB-Öğretim Programları (2009). Ortaöğretim Beden Eğitimi ve Spor Dersi Öğretim Programı (9-12. Grades), Ankara. [Online]:http://ttkb.meb.gov.tr/
Mirzeoğlu, D., Aktağ, I. ve Boşnak, M. (2007). Beden Eğitimi Öğretmeni, Öğretmen Adayı Ve
Beden Eğitimi Ve Spor Yüksekokullarında Görev Yapan Öğretim Elemanlarının Mesleki Yeterlik Duygusunun Karşılaştırılması. Hacettepe University, Journal of Sports Sciences, 18(3), 109-125.
Özçelik, (1992). Eğitim Programları ve Öğretim. Ankara: ÖSYM Publications.
Şeker, H., Deniz, S. ve Görgel, İ. (2005). Tezsiz Yüksek Lisans Öğretmen Adaylarının Öğretmenlik
Yeterlilikleri Üzerine Değerlendirmeleri. Kuram ve Uygulamada Eğitim Yönetimi Dergisi, 11(42), 237-253.
Woolfolk Hoy, A., & Burke-Spero, R. (2005). Changes in teacher efficacy during the early years of
teaching: A Comparison of four measures. Teaching and Teacher Education, 21, 343-356.
www.egyankosh.ac, “Teacher Efficacy in Higher Education”, unite 6, retrieved on 30.11.2012).
www.tojned.net
31
The Online Journal of New Horizons in Education Volume 4, Issue 1
Creating Teaching Materials for Students of Nursing with the Use of E-Learning MethodsIwona Bodys-Cupak [1], Anna Majda [2], Joanna Zalewska-Puchała [3], Zofia Musiał [4]
[1] Theory and Fundamentals of Nursing Laboratory Institute of Nursing and Midwifery, Faculty of Health Sciences, Jagiellonian University Medical College, Cracow, Poland e-mail: [email protected]
ABSTRACT
Background With the widespread introduction of computers and Internet access, distance education becomes increasingly poluar and is accepted as a form of supplementing or replacing traditional teaching methods. Changes in education systems and socio-technological transformations have affected various areas of life, especially the education process. Development of information technology offering interactive software multimedia for education, obliges academic teachers to create courses provided through e-learning. One of the most important stages of e-learning involves developing educational materials, as the quality of prepared and presented content should be reflected in the students’ knowledge. Aim of the study The aim of the study is to present a way to create and use educational materials for e-learning methods of teaching.Materials and method The educational tool in the form of a "virtual case of a patient with bedsores" developed as part of teaching materials using e-learning is the result of the authors’ own conceptual work and a review of available scientific literature on the creation and practical use of distance education tools.Results The educational tool in the form of "a virtual case of a patient with bedsores" was prepared using the CASUS system for first-year students of nursing (full-time first-degree studies) as part of a lesson/course unit concerning the care and treatment of bedsores on the basis of content tailored to the requirements of the curriculum for Fundamentals of Nursing. The tool's content concerned the problems of nursing care provided to a patient runs the risk of bedsores and a patient who actually has such lesions. ConclusionsSolving the problems of a "virtual patient" running the risk of bedsores and a patient suffering from such lesions made it possible for the students to learn about daily practice; it also encouraged them to acquire knowledge. Most of the students were satisfied with that method of learning. It was an interesting supplement to traditional teaching.
Keywords: education, information technology, e-learning, virtual patient, nursing
INTRODUCTION
Education, like other areas of human activity, is undergoing constant transformation. Directions of change are determined by educational systems and naturally result from general social and technological transformations. Advancements in information technology, easy access to the Internet and the students' expectations all influence the methods of knowledge transfer and determine certain changes in the existing educational methods [4, 6, 18].
Development of information technology offering interactive and multimedia educational software forces teachers to convert their traditional course format into distance courses and to combine elements of traditional teaching with e-learning (e-teaching) [18].
E-learning is used in distance teaching which applies information technology and eliminates the need to directly
www.tojned.net 32
The Online Journal of New Horizons in Education Volume 4, Issue 1
contact the student. That is possible due to the provisions included in the Regulation of the Minister of Science and Higher Education dated 2nd November 2011 and in the Act on Higher Education of 2005. The directives therein impose certain obligations on educational institutions related to teacher training related to teaching with the use of such methods, e.g. development of teaching materials in an electronic format and equipping universities with the necessary infrastructure. It is also necessary to supervise the students' activities and verify the quality of education provided through the use of new methods [6, 14, 16, 17].
E-learning is carried out with the use of distance learning platforms such as Pegasus and Blackboard and systems such as CASUS. Each platform consists of modules that make it easy to communicate remotely, to create, process and store documents, and to manage e-courses. CASUS allows the creation of virtual patient cases [8].
A distance format course is managed by a tutor who has full control over its settings. The teacher can modify the contents on a regular basis, add and remove individual elements and adapt them to the goals. E-course participants can take part in activities on the platform as a whole course group, or they may be divided into task groups performing identical or different tasks. One of the most important elements of e-learning is the need to develop educational materials, as the quality of content to be prepared and presented will be reflected in the students’ knowledge [3].
People who prepare e-courses face many difficulties. One of them is how to transfer the elements of verbal communication (voice intonation and its impact on the selection of content) into the system and another is how to focus and motivate students to acquire knowledge. Distance format materials should be interesting enough to engage students in the problems of patients and to motivate them to find the best ways to help such patients.
To meet the above-mentioned educational requirements, education materials should be much more attractive and varied than the materials used in traditional teaching; therefore, several standards to help build educational materials have been developed. One of the most famous is the Sharable Content Object Reference Model (SCORM) which includes technical tips to help develop virtual learning content and the E-Learning Courseware Certification (ECC) designed for asynchronous courses based on websites and mixed media [3,12].
Course content developed by a teacher or a group of teachers may be presented according to the themes and concepts of the course’s author(s) as written words, tables, figures, charts, photos, videos, etc. Each of the course units (lessons) can have attachments in the form of supervisory elements and self-check tools (examination and educational cases). Students, using the synchronous (real-time communication) or asynchronous technique (at any time), can interactively participate in the classes and assess their own knowledge or skills, e.g. by answering test questions [6, 16].
E-learning has a special place in the teaching of medical courses. With this teaching method one can use various graphic forms and images that may be zoomed-in or apply real-life descriptions, which is extremely valuable. These features are highly useful in acquiring knowledge in the fields of anatomy, physiology, histology, microbiology and other subjects (like the fundamentals of nursing or specialist nursing) which fall within the standards of education in the nursing curriculum [6, 13].
E-learning courses also use problem-solving methods, which is another advantage. In problem-solving education (e.g. Problem Based Learning, PBL) the students are encouraged to find solutions independently. The role of the teacher is also changed from an authoritative transmitter of knowledge into an accompanying mentor ready to assist in their independent search for knowledge. The teacher points out errors in the student's reasoning and suggests further paths of research. Teaching with PBL involves identifying ways to acquire knowledge instead of transferring that knowledge. The concept of PBL is associated with a related type of education based on examples (Case Based Learning, CBL) which originally uses examples from real life based on case reports; it may be used in the creation of e-learning courses [7, 13].
A "virtual patient" is an example of a tool to assist the implementation of problem-solving teaching methods. The concept (virtual patient) refers to a computer program that simulates a meeting between a healthcare professional (doctor, nurse, dentist, nutritionist, or physiotherapist) and the patient. A student who plays the role of a doctor, nurse or physiotherapist has a wide range of information to use (description of the patient, signs, symptoms, test results). Working with the virtual patient translates into a number of therapeutic, diagnostic, nursing and rehabilitation decisions; the decision-making process is aided by teaching materials and the information contained in the program. The student has the opportunity to apply their knowledge and skills on a hypothetical patient. Students have to demonstrate their independence and the ability to synthesize facts and knowledge from many fields in order to make the right decisions before having contact with a real patient. Simulating a direct encounter with a patient is similar to daily practice and encourages learning by showing the application of knowledge in practice [7].
Electronic Virtual Patients (e-ViP) is a repository of e-learning tools. It is a place to store documents for sharing data in an orderly manner. Making e-ViP popular is to make the teaching of clinical skills more attractive and more effective. However, creating a variety of cases as part of e-ViP is associated with a significant amount of work and high
www.tojned.net
33
The Online Journal of New Horizons in Education Volume 4, Issue 1
costs. The way to reduce these costs is to collaborate and share/exchange cases of virtual patients among educational institutions. That idea is the basic premise of the European e-ViP project. Its participants are European medical schools (including the Jagiellonian University Medical College) [12].
The Department of Bioinformatics and Telemedicine of the Medical College at the Jagiellonian University in Kraków, in order to meet the expectations of teachers and students, has organized a number of courses as part of the "Pro bono Collegii Medici Universitatis Jagiellonicae" project. One of them was the course entitled "Advanced educational techniques in medical education: e-learning tools in the teaching of medicine." The course inspired the authors of this article to prepare the case of a "virtual patient with bedsores," which – in cooperation with the Department of Bioinformatics and Telemedicine of the Jagiellonian University – was uploaded to CASUS and made available to first-year students of nursing at the Faculty of Health Sciences at the Jagiellonian University.
AIM OF THE STUDY
The aim of the study is to present a way to create and use educational materials for e-learning methods of teaching.
MATERIALS AND METHODS
The educational case developed as part of teaching materials using e-learning is the result of the authors’ own conceptual work and a review of available scientific literature on the creation and practical use of distance education tools.
The educational tool in the form of "a virtual case of a patient with bedsores" was prepared for first-year students of nursing (full-time studies) as part of a lesson/course unit concerning the care and treatment of bedsores. The contents to form the basis for the case of a "virtual patient with bedsores" were aligned with the curricular requirements for the Fundamentals of Nursing. The idea which steered the authors was to facilitate the understanding of the problems of nursing care provided to a patient running the risk of bedsores and one with such lesions. The case of a "virtual patient with bedsores" was to help students decide on the issues of nursing during practical training in hospitals.
RESULTS
The educational case of a "virtual patient with bedsores" for nursing students was based on the linear model, in which events have a certain cause-and-effect order. The tool in the form of a "virtual patient case" consists of five parts which contain certain content and questions about the health of, laboratory tests on and nursing of that patient, his/her dietary care, and bedsore treatment. Each section contains tabs with card content, a question, a field for the student's answer and another one for the expert's comments on the answer. Photos and diagrams to clarify or further describe an issue are included as well. There was also a feature to upload a short video.
www.tojned.net
34
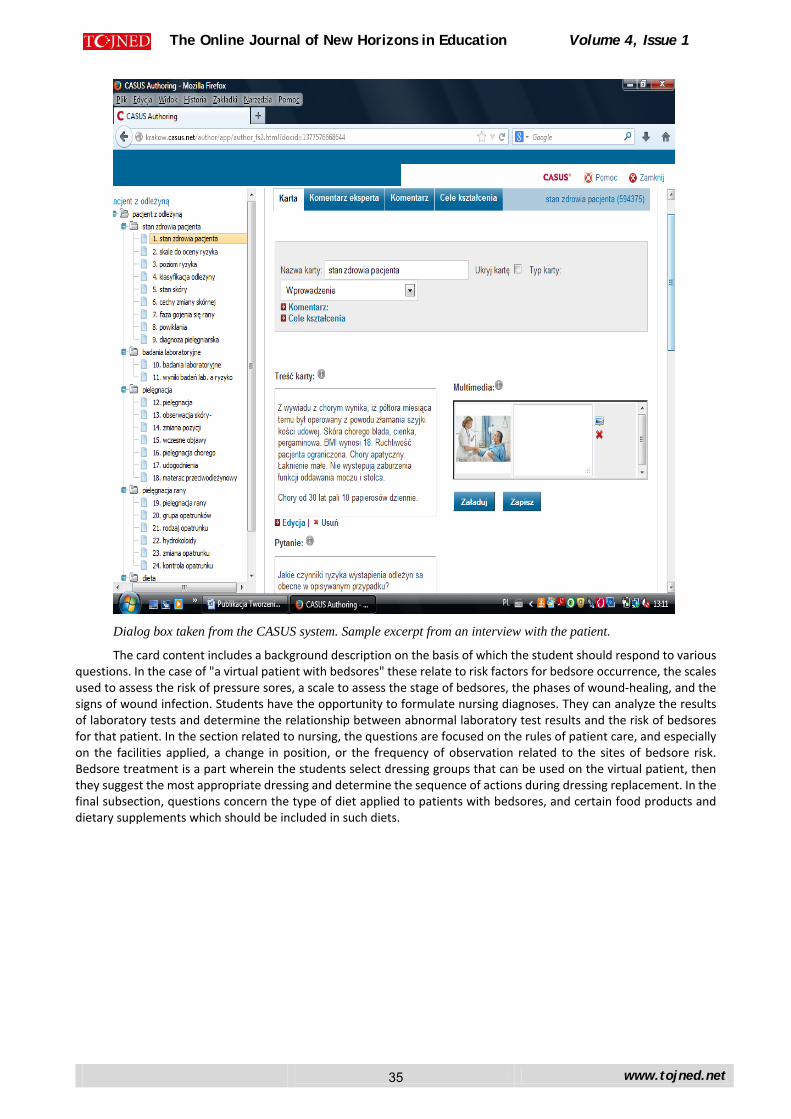
The Online Journal of New Horizons in Education Volume 4, Issue 1
Dialog box taken from the CASUS system. Sample excerpt from an interview with the patient.
The card content includes a background description on the basis of which the student should respond to various questions. In the case of "a virtual patient with bedsores" these relate to risk factors for bedsore occurrence, the scales used to assess the risk of pressure sores, a scale to assess the stage of bedsores, the phases of wound-healing, and the signs of wound infection. Students have the opportunity to formulate nursing diagnoses. They can analyze the results of laboratory tests and determine the relationship between abnormal laboratory test results and the risk of bedsores for that patient. In the section related to nursing, the questions are focused on the rules of patient care, and especially on the facilities applied, a change in position, or the frequency of observation related to the sites of bedsore risk. Bedsore treatment is a part wherein the students select dressing groups that can be used on the virtual patient, then they suggest the most appropriate dressing and determine the sequence of actions during dressing replacement. In the final subsection, questions concern the type of diet applied to patients with bedsores, and certain food products and dietary supplements which should be included in such diets.
www.tojned.net
35
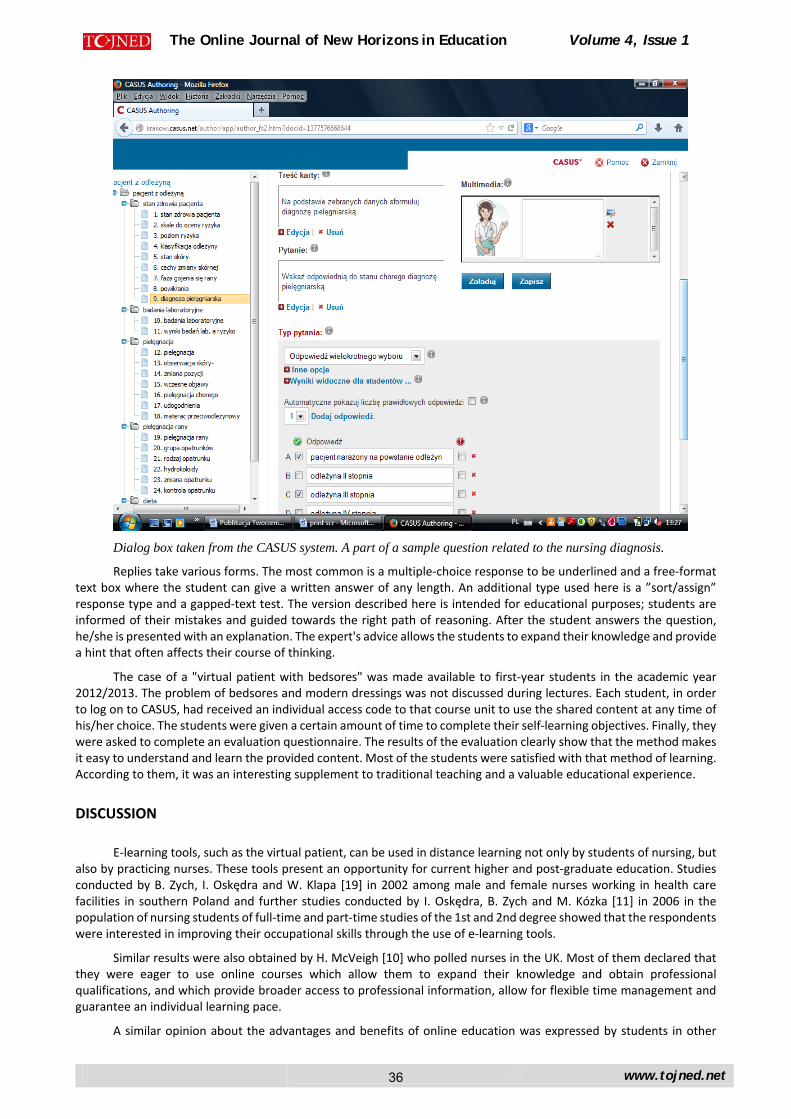
The Online Journal of New Horizons in Education Volume 4, Issue 1
Dialog box taken from the CASUS system. A part of a sample question related to the nursing diagnosis.
Replies take various forms. The most common is a multiple-choice response to be underlined and a free-format text box where the student can give a written answer of any length. An additional type used here is a ”sort/assign” response type and a gapped-text test. The version described here is intended for educational purposes; students are informed of their mistakes and guided towards the right path of reasoning. After the student answers the question, he/she is presented with an explanation. The expert's advice allows the students to expand their knowledge and provide a hint that often affects their course of thinking.
The case of a "virtual patient with bedsores" was made available to first-year students in the academic year 2012/2013. The problem of bedsores and modern dressings was not discussed during lectures. Each student, in order to log on to CASUS, had received an individual access code to that course unit to use the shared content at any time of his/her choice. The students were given a certain amount of time to complete their self-learning objectives. Finally, they were asked to complete an evaluation questionnaire. The results of the evaluation clearly show that the method makes it easy to understand and learn the provided content. Most of the students were satisfied with that method of learning. According to them, it was an interesting supplement to traditional teaching and a valuable educational experience.
DISCUSSION
E-learning tools, such as the virtual patient, can be used in distance learning not only by students of nursing, but also by practicing nurses. These tools present an opportunity for current higher and post-graduate education. Studies conducted by B. Zych, I. Oskędra and W. Klapa [19] in 2002 among male and female nurses working in health care facilities in southern Poland and further studies conducted by I. Oskędra, B. Zych and M. Kózka [11] in 2006 in the population of nursing students of full-time and part-time studies of the 1st and 2nd degree showed that the respondents were interested in improving their occupational skills through the use of e-learning tools.
Similar results were also obtained by H. McVeigh [10] who polled nurses in the UK. Most of them declared that they were eager to use online courses which allow them to expand their knowledge and obtain professional qualifications, and which provide broader access to professional information, allow for flexible time management and guarantee an individual learning pace.
A similar opinion about the advantages and benefits of online education was expressed by students in other
www.tojned.net
36
The Online Journal of New Horizons in Education Volume 4, Issue 1
fields. Studies conducted in 2007 by P. Betlej [1] among the students of the University of Information Technology and Management in Rzeszów and studies conducted by J. Karewicz [5] among the students of Organization and Management at the Silesian University of Technology who took part in a course on a Distance Teaching Platform based on Moodle software confirm that e-learning does not require note-taking and provides unlimited access to knowledge databases and training. The teaching process is individualized, and it saves time and learning costs. Additionally, students of the Silesian University of Technology found that classes conducted with the use of e-learning tools are more effective than traditional lessons. The students were convinced that the use of distance teaching methods and tools is connected with better teaching results.
To meet these expectations, the Maria Curie-Skłodowska University in Lublin and the School of Humanities and Economics in Łódź (currently the Academy of Humanities and Economics), with the use of information technology and a wide range of mixed media, established the Polish Virtual University in 2002. The institution aims to provide distance training and studies. Nursing classes for university students have been provided there since 2003. Studies conducted in 2009, assessing the level of satisfaction expressed by the nursing graduates of the Polish Virtual University related to the online teaching system, confirmed that it is a good alternative to traditional teaching. In the respondents’ opinion, it has more advantages than disadvantages. Nurses valued the curriculum subjects, cooperation with the coordinators of classes, the working rules and the evaluation system applied in the course. The nurses also expressed their satisfaction by their willingness to continue education by means of the online system and recommend it to others as a good method to supplement nursing education [2].
In 2008, A. Stachoń, E. Walewska, L. Ścisło et al. [15] prepared an examination case in CASUS and introduced it into the teaching process of the Medical College at the Jagiellonian University. The case of a virtual patient concerned a person with gastrointestinal bleeding; it was prepared for third-year nursing students who had already attended classes in surgical nursing within the module of specialist nursing. All the students admitted to the exam were provided with a room equipped with computers with access to the Internet and the CASUS system. While simultaneously gaining access to the examination case, they were able to solve the problem within a specified time-frame. The results generally showed a high examination passing rate in that area. An evaluation questionnaire related to the presented case of a "virtual patient with gastrointestinal bleeding" showed that most of the students had positive impressions.
The Fundamentals of Maternity Care Laboratory, as one of the first units of the Medical College at the Jagiellonian University, also joined in the implementation of the e-ViP objectives. Two obstetric cases were created. They related to a 19-year-old pregnant patient at risk of preterm labor, and a preterm delivery in the case of a 41-year-old pregnant woman. The cases were presented to second- and third-year students of midwifery in the academic year 2009/2010. Most of the students had positive impressions in relation to the cases solved. The training element of the case, allowing the students to consolidate and expand their knowledge, was very important to the students. The tutors appreciated the chance to use the cases in the teaching process. They also claimed that these attracted more interest and motivated the students to work independently [9].
Preparation and implementation of the case of a "virtual patient with bedsores" in education as part of the course on the Fundamentals of Nursing at the Faculty of Health Sciences of the Medical College at the Jagiellonian University in 2013 was also very popular among students. They were satisfied with the features offered by that form of independent learning. The cases made a very good test before real-life contact with the patient, which is normally associated with additional stress, as the student is really responsible for his/her actions. An important advantage of the tool used in teaching is unlimited access to knowledge and the opportunity to choose any place and time for learning.
It may take some time before the library of virtual patients within the e-ViP project becomes available to the general community of medical schools in Europe (www.virtualpatients.eu). Therefore there is a need to create new cases of virtual patients with varying degrees of difficulty to be used in Polish medical schools for nursing students. Such cases could be tested and improved, so that they can make the teaching process more attractive and enhance the quality of education; in future, they could be available from a bank and exchanged between Polish and foreign universities.
CONCLUSIONS
1. The "case of a virtual patient" helps students prepare for nursing activities during practical sessions in hospitals and allows them to verify their clinical reasoning.
2. Preparation of teaching materials in the form of a virtual patient is extremely time-consuming and requires the ability to operate computer systems.
3. E-learning methods make it possible to re-use the "case of a virtual patient" in the teaching process, improve it and introduce changes related to the evolving best practices or the new means emerging on the market of medical services.
www.tojned.net
37

The Online Journal of New Horizons in Education Volume 4, Issue 1
EXPECTATIONS
1. It is expected that university authorities should make efforts to include the working hours devoted to the creation of teaching materials using e-learning in the university staff teaching load.
2. To prepare or improve the computers and technical facilities used to teach with e-learning methods. 3. To create a bank for an inter-university exchange of materials used to teach with e-learning methods. 4. To provide access to the database of materials for nurses and students with no registration required.
REFERENCES
1. Betlej P.: E-learning w organizacji zajęć i opinii studentów – studium przypadku. E- mentor 2009; 1, 56- 60. 2. Bodys-Cupak I., Wądolny D., Grochowska A.: Satysfakcja pielęgniarek z kształcenia on line na przykładzie
Polskiego Uniwersytetu Wirtualnego. W: Inovacie v osetrovatelstve. Rozwoj osetrovatelstva od Florence Nightingale po sucastnost. Kober L. (red.), Vysoke Tatry 2012, 289-302.
3. Drążek Z., Komorowski T.: Problemy tworzenia materiałów dydaktycznych w technologii e-learningu. W: E-learning w kształceniu akademickim. Dąbrowski M., Zając M.: (red.), Fundacja Promocji i Akredytacji Kierunków Ekonomicznych, Warsaw 2006, 64.
4. Hankiewicz K.: Ocena oferty e-learningowej poznańskich uczelni publicznych. Zeszyty Naukowe Uniwersytetu Szczecińskiego nr 703. Ekonomiczne Problemy Usług 2012; 88, 156-164.
5. Karcewicz J.: E- learning jako narzędzie wspomagające dydaktykę studiów stacjonarnych. Zeszyty Naukowe Politechniki Śląskiej. Organizacja i Zarządzanie 2007; 40, 147- 151.
6. Kononowicz A., Pyrczak W., Roterman-Konieczna I.: E-learning in medicine. Problemy Higieny i Epidemiologii, 2006; 87(4), 364-371.
7. Kononowicz A., Stachoń A., Roterman-Konieczna I.: Wirtualny pacjent jako narzędzie nauczania problemowego w kontekście europejskiego projektu eViP. E-mentor 2008; 1(23), 26-30.
8. Materiały szkoleniowe z kursu „Zaawansowane techniki edukacyjne w naukach medycznych” realizowanego w ramach projektu „Pro bono Collegii Medici Universitatis Jagiellonicae” w 2012 roku, współfinansowanego ze środków Unii Europejskiej w ramach Europejskiego Funduszu Społecznego.
9. Matuszyk D., Guratowska M., Stachoń A., Dziedzic M., Kononowicz A.: Wirtualni pacjenci jako innowacyjna metoda e-learningowa dla studentów położnictwa. W: Technologie i narzędzia e-learningu. Ochnio L., Orłowski A. (red.), Warsaw 2011, 105-114.
10. McVeigh H.: Factors influencing the utilisation of e-learning in post-registration nursing students. Nurse Education Today 2009; 29(1), 91-99.
11. Oskędra I., Zych B., Kózka M.: Zapotrzebowanie studentów studiów stacjonarnych i niestacjonarnych I i II stopnia na kształcenie w systemie distance learning. Materiały konferencyjne V Mezinarodni Sympozium Osetrovatelsvi, Ostrava 2006, 271- 278.
12. Przybyła W., Ratalewska M.: Poradnik dla projektujących kursy e-learningowe. Wydawnictwo Naukowe Instytutu Technologii Eksploatacji Państwowego Instytutu Badawczego, Warsaw 2012.
13. Riuz J., Mintzer M., Leipzig R.: The Impact of E-learning in Medical Education. Academic Medicine 2006; 81(3), 207-212.
14. Rozporządzenie Ministra Nauki i Szkolnictwa Wyższego z dnia 2 listopada 2011 roku, zmieniające rozporządzenie w sprawie warunków, jakie muszą być spełnione, aby zajęcia dydaktyczne na studiach mogły być prowadzone z wykorzystaniem metod i technik kształcenia na odległość. Dz. U. 2011 Nr 246, poz. 1470.
15. Stachoń A., Walewska E., Ścisło L., Matuszyk D., Dziedzic M., Kononowicz A.: Authoring and implementation of virtual patients in nursing - the new challenge at the Jagiellonian University Medical College. Bio-Algorithms Med-Syst 2009, Vol. 5(9), 87.
16. Szaflarski K., Sobczyk-Kolbuch A.: Wykorzystanie platform e-learningowych w strategii edukacyjnej uczelni niepublicznej jako szansa na budowanie przewagi konkurencyjnej na rynku edukacyjnym. Zeszyty Naukowe Uniwersytetu Szczecińskiego nr 703. Ekonomiczne Problemy Usług 2012; 88, 203-212.
17. Ustawa z dnia 27 lipca 2005 roku. Prawo o szkolnictwie wyższym. Dz. U. 2005 Nr 164, poz. 1365. 18. Walecki P., Pyrczak W., Lasoń W., Sarapata K.: E-Learning i telemedycyna - problemy strukturyzacji wiedzy.
W: Komputer w edukacji. Morbitzer J. (red.), Krakow 2006, 243-248. 19. Zych B., Oskędra I., Klapa W.: Kształcenie pielęgniarek w systemie distance learning- oczekiwania, możliwości i
propozycje rozwiązań. Materiały konferencyjne V Międzynarodowej Konferencji Naukowej „Media a edukacja”, Poznań 20-23 IV 2002.
www.tojned.net
38

The Online Journal of New Horizons in Education Volume 4, Issue 1
English Language Learners and Intercultural Competence Grisel Garcia-Perez [1], Karen Ragoonaden[2], Robert Campbell [3]
[2] The University of British Columbia Kelowna, British Columbia Canada [email protected]
ABSTRACT
This study explores the correlation between comprehensibility and intercultural development of Chinese English Language Learners (ELL) at a Canadian university. Students received 30 hours of an English language instruction which focused on developing linguistic and intercultural competence. The experimental design included a pretest-posttest procedure in order to compare the subject’s performance before and after instruction. A direct comparison between the scores on the comprehensibility pretest and posttest showed a minimal improvement in the subjects’ performance. The causal relationship between intercultural competence and language learning was assessed by comparing the results of the Intercultural Development Inventory (IDI) with the comprehensibility test.
Keywords:
INTRODUCTION
Competence in English has become a highly rated ability, in some cases a necessary skill, for citizens actively participating in the globalized economy of the twenty-first century. Approximately one quarter of the world’s population (1.5 billion people) is already fluent or competent in English. Furthermore, English is growing faster than any other language in the world. English as second language speakers now outnumbering those for whom English is a mother tongue (Crystal, 2003). In keeping with this trend, China is home to approximately 300 million people studying Shakespeare’s language (Yunbao & Huaying, 2008).
Within the globalized context of contemporary society, the juxtaposition of teaching and learning about the cultural values and mores of the acquired second language has been an area which has garnered considerable interest (Paige, Jorstad, Siaya, Klein & Colby, 2003). Linguistic knowledge as well as cultural integration into professional and academic contexts has become a necessary condition leading to successful international pathways. In fact, recent research focuses on the impact of intercultural training and the ensuing proficiency of English Language Learners (ELL) (Utley, 2002; Coleman, 1998; Hess, 1977).
Post-secondary institutions, populated by increasing numbers of English Language Learners (ELL), are becoming fertile grounds for an emergent dynamic and global community. The aim of the language students is bilateral: to learn a second language and to integrate into a culture that is very different to their own (Lupart, 2009; Chamberlin-Quinlisk, 2005; Sapir, 1921).
Previous publications recognize that an important skill development in second language learning is related to a good command of the sound system (Rossiter, et. al., 2010). In particular, English Language Learners (ELL) need to know how units of meaning are formed into words, the grammar of sentence formation and the vocabulary (Liceras, 2008; Lightbown and Spada, 1999). However, pronunciation studies have shown that when students are presented with phonemes that are not used in their own language, they typically show performance that is not as good as first language
www.tojned.net
39
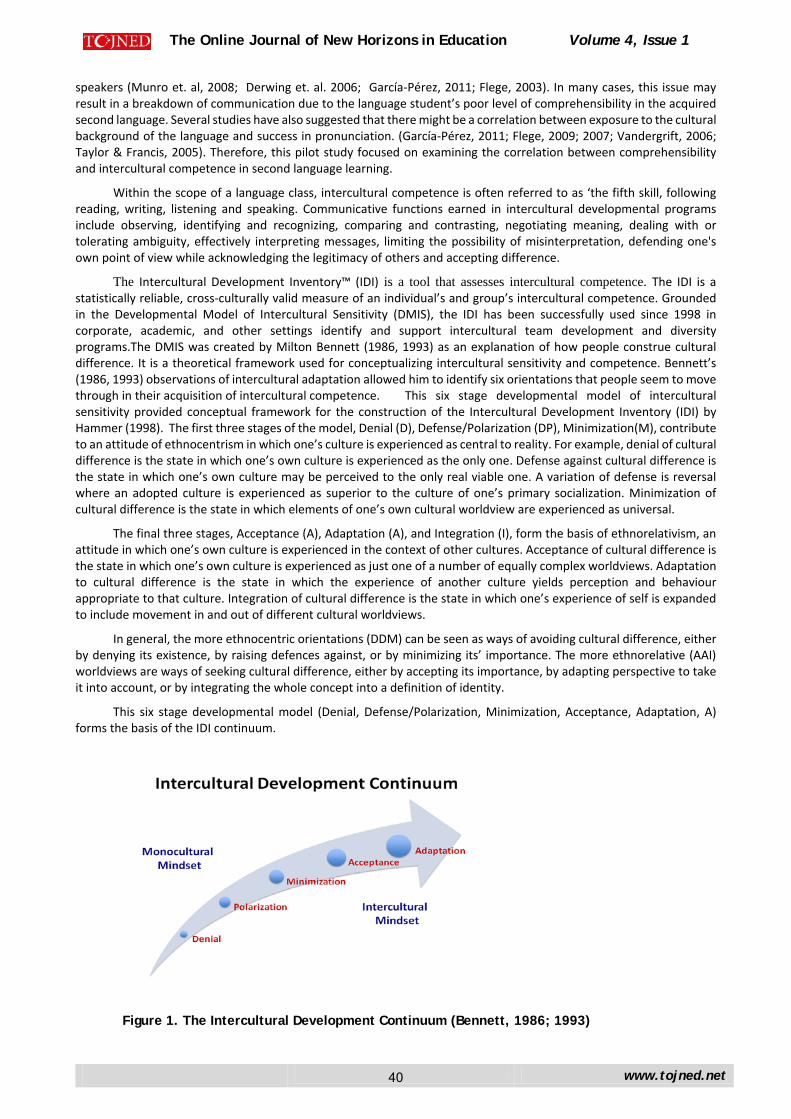
The Online Journal of New Horizons in Education Volume 4, Issue 1
speakers (Munro et. al, 2008; Derwing et. al. 2006; García-Pérez, 2011; Flege, 2003). In many cases, this issue may result in a breakdown of communication due to the language student’s poor level of comprehensibility in the acquired second language. Several studies have also suggested that there might be a correlation between exposure to the cultural background of the language and success in pronunciation. (García-Pérez, 2011; Flege, 2009; 2007; Vandergrift, 2006; Taylor & Francis, 2005). Therefore, this pilot study focused on examining the correlation between comprehensibility and intercultural competence in second language learning.
Within the scope of a language class, intercultural competence is often referred to as ‘the fifth skill, following reading, writing, listening and speaking. Communicative functions earned in intercultural developmental programs include observing, identifying and recognizing, comparing and contrasting, negotiating meaning, dealing with or tolerating ambiguity, effectively interpreting messages, limiting the possibility of misinterpretation, defending one's own point of view while acknowledging the legitimacy of others and accepting difference.
The Intercultural Development Inventory™ (IDI) is a tool that assesses intercultural competence. The IDI is a statistically reliable, cross-culturally valid measure of an individual’s and group’s intercultural competence. Grounded in the Developmental Model of Intercultural Sensitivity (DMIS), the IDI has been successfully used since 1998 in corporate, academic, and other settings identify and support intercultural team development and diversity programs.The DMIS was created by Milton Bennett (1986, 1993) as an explanation of how people construe cultural difference. It is a theoretical framework used for conceptualizing intercultural sensitivity and competence. Bennett’s (1986, 1993) observations of intercultural adaptation allowed him to identify six orientations that people seem to move through in their acquisition of intercultural competence. This six stage developmental model of intercultural sensitivity provided conceptual framework for the construction of the Intercultural Development Inventory (IDI) by Hammer (1998). The first three stages of the model, Denial (D), Defense/Polarization (DP), Minimization(M), contribute to an attitude of ethnocentrism in which one’s culture is experienced as central to reality. For example, denial of cultural difference is the state in which one’s own culture is experienced as the only one. Defense against cultural difference is the state in which one’s own culture may be perceived to the only real viable one. A variation of defense is reversal where an adopted culture is experienced as superior to the culture of one’s primary socialization. Minimization of cultural difference is the state in which elements of one’s own cultural worldview are experienced as universal.
The final three stages, Acceptance (A), Adaptation (A), and Integration (I), form the basis of ethnorelativism, an attitude in which one’s own culture is experienced in the context of other cultures. Acceptance of cultural difference is the state in which one’s own culture is experienced as just one of a number of equally complex worldviews. Adaptation to cultural difference is the state in which the experience of another culture yields perception and behaviour appropriate to that culture. Integration of cultural difference is the state in which one’s experience of self is expanded to include movement in and out of different cultural worldviews.
In general, the more ethnocentric orientations (DDM) can be seen as ways of avoiding cultural difference, either by denying its existence, by raising defences against, or by minimizing its’ importance. The more ethnorelative (AAI) worldviews are ways of seeking cultural difference, either by accepting its importance, by adapting perspective to take it into account, or by integrating the whole concept into a definition of identity.
This six stage developmental model (Denial, Defense/Polarization, Minimization, Acceptance, Adaptation, A) forms the basis of the IDI continuum.
Figure 1. The Intercultural Development Continuum (Bennett, 1986; 1993)
www.tojned.net
40
The Online Journal of New Horizons in Education Volume 4, Issue 1
The Study
In the context of preparing students for life in a foreign community, the notion of cultural adapatation presupposes that some cultural norms are likely to differ from the student’s homeland. Moreover, the experience of living and studying in a foreign country physically separates the students from their normal micro-communities and transports them to a new community where they will have to be able to appreciate, adapt to, and function within the norms of a new reality (Mikk, et. al., 2009; Gielen, et. al., 2004; Utley, 2002).
Within this context, the study explores the correlation of comprehensibility and intercultural development in Chinese English Language Learners (ELL) at a Canadian university. Students received 30 hours of an English language/cultural instruction which focused on developing linguistic and intercultural competence. The experimental design included a pretest-posttest procedure in order to compare the subject’s performance before and after instruction.
This research proposal was submitted and approved by the university ethics review board. International students from China were sent a letter (in the form of an e-mail attachment) inviting them to participate in the study. Eighteen students responded and were invited to attend information session where the objectives of the study were explained. Those who decided to participate were asked to sign a consent form.
During this initial phase, the participants completed a language background questionnaire as well as the Intercultural Development Inventory (IDI). An interview was conducted prior to the 30 hour language and cultural classes. This interview was recorded using a Sony IC Recorder and the speech samples were edited using Audacity 1.3.13 Beta, a free and easy-to-use multilingual audio editor available online. Once all the initial data was collected, the students were randomly assigned to, either, the experimental group, or the control group. The subjects in the experimental group undertook a thirty hour English language and cultural course highlighting the commonalities and differences between Chinese and Canadian cultures. Feedback on the suprasegmental features of the language was given. The control group did not receive this training. Both groups were interviewed a second time and the same set of questions was used.
Eighteen students agreed to participate in the study. Out of these students, ten withdrew because of personal reasons, conflict with the schedule, and illness. The eight students remaining were administered a questionniare designed to obtain detailed information about their language background. Then, the subjects were randomly grouped into the experimental group and the control group (4 students each). The control group, made up of one female and three male International students, were between the ages of 18 and 30 years old. Originating from the Asia Pacific, all participants had lived in another country ranging from 3-6 months to 6-10 years. The experimental group was made up of International students, two females and two males between the ages of 22 and 40 years old. Originating from the Asia Pacific, all students had limited experiences with overseas studies and/or travel between 7 -11 months and 3-5 years. This information was collected through a series of demographic questions included in the IDI questionnaire.
Content of the 30 hour language and cultural classes were drawn from the textbook More Than Words, written by Pamela M. Elder and Barbara Chen, and published in 1997 by Hartcourt Brace and Company, Canada. The book is intended for high-intermediate to advanced ESL students and offers factual information for new students to Canada. The topics include Canadian history and Geography, famous Canadians, native animals, Canadian education and art, and Canada’s relationship with the world. The readings and exercises were completed in class, and students were asked to present and contrast information from their country (China) in relation to the Canadian theme discussed in class. The presentations were done individually and the students devoted a considerable amount of time and effort in the completion of these activities. The control group did not receive any type of language/cultural training.
At the end of the 30 hour course, speech samples focusing on comprehensibility were collected from the experimental group using a Sony IC Recorder. The samples were attained by asking the subjects to respond to the following questions:
1. How long have you been learning English? 2. What do you know about life in Canada? 3. What do you know about culture in Canada? 4. Have you had the opportunity to interact with locals in Kelowna? And what cultural differences did you
notice?
The recording of responses to each question was repeated in the post-interview. All of the speech samples were inserted into a PowerPoint program so that each slide had a button that, when pressed, would play one recorded speech
www.tojned.net
41
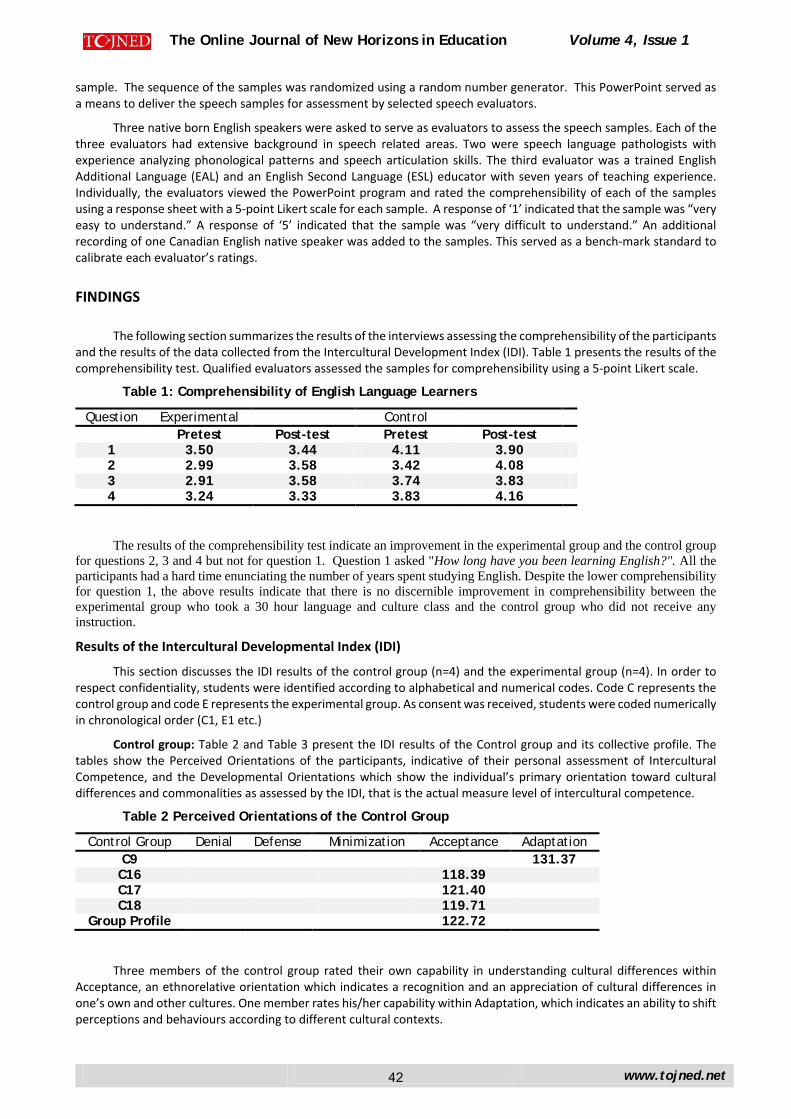
The Online Journal of New Horizons in Education Volume 4, Issue 1
sample. The sequence of the samples was randomized using a random number generator. This PowerPoint served as a means to deliver the speech samples for assessment by selected speech evaluators.
Three native born English speakers were asked to serve as evaluators to assess the speech samples. Each of the three evaluators had extensive background in speech related areas. Two were speech language pathologists with experience analyzing phonological patterns and speech articulation skills. The third evaluator was a trained English Additional Language (EAL) and an English Second Language (ESL) educator with seven years of teaching experience. Individually, the evaluators viewed the PowerPoint program and rated the comprehensibility of each of the samples using a response sheet with a 5-point Likert scale for each sample. A response of ‘1’ indicated that the sample was “very easy to understand.” A response of ‘5’ indicated that the sample was “very difficult to understand.” An additional recording of one Canadian English native speaker was added to the samples. This served as a bench-mark standard to calibrate each evaluator’s ratings.
FINDINGS
The following section summarizes the results of the interviews assessing the comprehensibility of the participants and the results of the data collected from the Intercultural Development Index (IDI). Table 1 presents the results of the comprehensibility test. Qualified evaluators assessed the samples for comprehensibility using a 5-point Likert scale.
Table 1: Comprehensibility of English Language Learners
Question Experimental Control Pretest Post-test Pretest Post-test 1 3.50 3.44 4.11 3.90 2 2.99 3.58 3.42 4.08 3 2.91 3.58 3.74 3.83 4 3.24 3.33 3.83 4.16
The results of the comprehensibility test indicate an improvement in the experimental group and the control group for questions 2, 3 and 4 but not for question 1. Question 1 asked "How long have you been learning English?". All the participants had a hard time enunciating the number of years spent studying English. Despite the lower comprehensibility for question 1, the above results indicate that there is no discernible improvement in comprehensibility between the experimental group who took a 30 hour language and culture class and the control group who did not receive any instruction.
Results of the Intercultural Developmental Index (IDI)
This section discusses the IDI results of the control group (n=4) and the experimental group (n=4). In order to respect confidentiality, students were identified according to alphabetical and numerical codes. Code C represents the control group and code E represents the experimental group. As consent was received, students were coded numerically in chronological order (C1, E1 etc.)
Control group: Table 2 and Table 3 present the IDI results of the Control group and its collective profile. The tables show the Perceived Orientations of the participants, indicative of their personal assessment of Intercultural Competence, and the Developmental Orientations which show the individual’s primary orientation toward cultural differences and commonalities as assessed by the IDI, that is the actual measure level of intercultural competence.
Table 2 Perceived Orientations of the Control Group
Control Group Denial Defense Minimization Acceptance Adaptation C9 131.37 C16 118.39 C17 121.40 C18 119.71
Group Profile 122.72
Three members of the control group rated their own capability in understanding cultural differences within Acceptance, an ethnorelative orientation which indicates a recognition and an appreciation of cultural differences in one’s own and other cultures. One member rates his/her capability within Adaptation, which indicates an ability to shift perceptions and behaviours according to different cultural contexts.
www.tojned.net
42
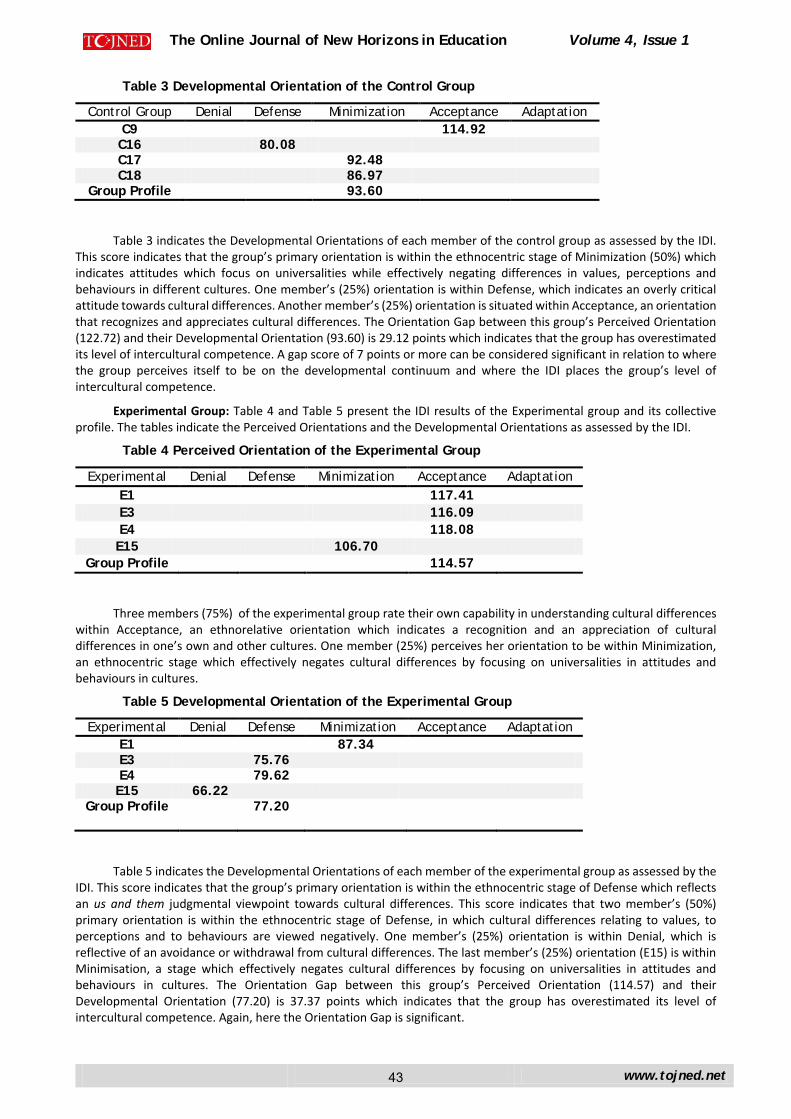
The Online Journal of New Horizons in Education Volume 4, Issue 1
Table 3 Developmental Orientation of the Control Group
Control Group Denial Defense Minimization Acceptance Adaptation C9 114.92 C16 80.08 C17 92.48 C18 86.97
Group Profile 93.60
Table 3 indicates the Developmental Orientations of each member of the control group as assessed by the IDI. This score indicates that the group’s primary orientation is within the ethnocentric stage of Minimization (50%) which indicates attitudes which focus on universalities while effectively negating differences in values, perceptions and behaviours in different cultures. One member’s (25%) orientation is within Defense, which indicates an overly critical attitude towards cultural differences. Another member’s (25%) orientation is situated within Acceptance, an orientation that recognizes and appreciates cultural differences. The Orientation Gap between this group’s Perceived Orientation (122.72) and their Developmental Orientation (93.60) is 29.12 points which indicates that the group has overestimated its level of intercultural competence. A gap score of 7 points or more can be considered significant in relation to where the group perceives itself to be on the developmental continuum and where the IDI places the group’s level of intercultural competence.
Experimental Group: Table 4 and Table 5 present the IDI results of the Experimental group and its collective profile. The tables indicate the Perceived Orientations and the Developmental Orientations as assessed by the IDI.
Table 4 Perceived Orientation of the Experimental Group
Experimental Denial Defense Minimization Acceptance Adaptation E1 117.41 E3 116.09 E4 118.08 E15 106.70
Group Profile 114.57
Three members (75%) of the experimental group rate their own capability in understanding cultural differences within Acceptance, an ethnorelative orientation which indicates a recognition and an appreciation of cultural differences in one’s own and other cultures. One member (25%) perceives her orientation to be within Minimization, an ethnocentric stage which effectively negates cultural differences by focusing on universalities in attitudes and behaviours in cultures.
Table 5 Developmental Orientation of the Experimental Group
Experimental Denial Defense Minimization Acceptance Adaptation E1 87.34 E3 75.76 E4 79.62 E15 66.22
Group Profile 77.20
Table 5 indicates the Developmental Orientations of each member of the experimental group as assessed by the IDI. This score indicates that the group’s primary orientation is within the ethnocentric stage of Defense which reflects an us and them judgmental viewpoint towards cultural differences. This score indicates that two member’s (50%) primary orientation is within the ethnocentric stage of Defense, in which cultural differences relating to values, to perceptions and to behaviours are viewed negatively. One member’s (25%) orientation is within Denial, which is reflective of an avoidance or withdrawal from cultural differences. The last member’s (25%) orientation (E15) is within Minimisation, a stage which effectively negates cultural differences by focusing on universalities in attitudes and behaviours in cultures. The Orientation Gap between this group’s Perceived Orientation (114.57) and their Developmental Orientation (77.20) is 37.37 points which indicates that the group has overestimated its level of intercultural competence. Again, here the Orientation Gap is significant.
www.tojned.net
43
The Online Journal of New Horizons in Education Volume 4, Issue 1
CONCLUSIONS
Despite the fact that there were no observable differences in the Comprehensibility Test between the control group and the experimental group, there were differences in the level of intercultural competence of the ELLs.
The control group (n=4), which did not receive the language/cultural instruction, was composed of younger students enrolled in undergraduate classes who had on average 6-10 years outside their native countries (Asia Pacific). In identifying Acceptance as a primary orientation, this group had overestimated its level of intercultural competence (see Table 1). However, the Developmental Orientation of this younger group was situated within Minimization, a stage which emphasizes universality over differences (see Table 2). Leading Orientations for this group were Acceptance through Adaptation which indicated a desire to increase cultural self-awareness and learning culture specific frameworks. This group was well positioned to recognize and appreciate cultural differences and to adapt behaviour around cultural differences.
The experimental group (n=4) which did receive the language/cultural instruction, was composed of older students who had spent on average 1-2 years outside their native countries (Asia Pacific). This group’s Perceived Orientation was within the stages of Acceptance (75%) and Minimisation (25%). However, the Developmental Orientation indicated that all students overestimated their level of intercultural competence. This score indicated that two members’ (50%) primary orientation is within the ethnocentric stage of Defense, in which cultural differences relating to values, to perceptions and to behaviours are viewed negatively. One student (25%) was at the Minimisation stage, two students (50%) were at the Defense stage, and one student (25%) was at the Denial stage. Within the Intercultural Continuum, Minimization, Defense and Denial represent an ethnocentric stage in which one’s own culture is viewed as superior and other cultures are viewed with fear and trepidation. Leading Orientations for this group were Minimization through Acceptance. In order to improve intercultural competence, this group could have begun to focus identifying cultural patterns of difference in an objective, critical manner in order to increase cultural awareness within themselves and the communities in which they live. This should have occurred in the language/culture class.
The above results found no causal relationship between intercultural competence, pronunciation and language/cultural classes. The Comprehensibility Test results did indicate improvement in both the experimental group and control group for questions 2, 3 and 4 but not for question 1 where the students had to respond with a number, stating how many years they had been studying English. The discrepancy in the IDI results may be attributed to the following factors: age, phonetic ability, length of residence outside the home country and motivation. For example, these differences in intercultural competence between the experimental group and the control group may be attributed to factors relating to age, phonetic ability, years of residence outside the home country and motivation.
The experimental group, which received the language/cultural instruction, was composed of students who were older than the ones in the control group. These subjects had spent less time abroad than their counterparts: 1-2 years on average. The participants tested at either at a Defense stage in the IDI in which cultural differences relating to values, to perceptions and to behaviours are viewed negatively or the Minimization stage in which effectively negates cultural differences by focusing on universalities in attitudes and behaviours in cultures. Despite the IDI results demonstrating a progression towards intercultural competence, there was no visible impact on comprehensibility. The control group, which did not receive any language/cultural instruction, was assessed at a higher level of intercultural competence. Leading Orientations for this group were Acceptance through Adaptation which indicated a desire to increase cultural self-awareness and learning culture specific frameworks. Chronologically younger, these participants had spent more time abroad than their counterparts. This exposure to different countries and culture may have impacted their intercultural awareness by sensitizing them to differences in linguistic and cultural mores.
There is a commonly held belief that there is a strong relationship between L2 language acquisition, cultural adaptation, years abroad and age (Flege, 2007; Hess, 1997: Utley, 2002). However, there is controversy on whether there is an age-related limit on the mastery of pronunciation and intercultural competence. Some researchers support the idea that pre-pubescent children have an excellent chance of acquiring a native like accent and a better understanding of the secondary culture if they have continued exposure to a native context. In addition, it is generally believed learners who study a second language after puberty will retain their native accent in an additional language. That is, a seventy-year old SL learner will be just as successful as a twenty-year old SL learner provided all other learning factors are equal for both. So, there is no advantage attributed to age after puberty (Scovel, 1969; Krashen, 1973).
In our study, all students improved. Pronunciation improved as the year progressed in both the experimental and control group. This has been substantiated by the fact that there are accounts about adult learners who have studied a second language after puberty and have achieved a native like pronunciation. Phonetic ability is the capacity some people have to discriminate foreign sounds; that is; to have an ear for a foreign language (Brown, 2001; Nunan, 2000).
www.tojned.net
44
The Online Journal of New Horizons in Education Volume 4, Issue 1
Motivation is another important factor affecting language learning. All students had improved their scores in the
comprehensibility test. The participants reported to have a specific interest in improving their pronunciation. In keeping with the literature, the correlation between motivation and comprehensibility can be established (Garcia-Perez, 2011).
Analysis of exposure to a second language indicate that International students living in foreign countries do not often take advantage of exposure to the foreign language (Derwing et al. 2006). For example, in this study, the students estimated that during 40% of their time they spoke English to a native speaker. However, the average time the majority of the students were exposed to an English speaking environment was 30%. Studies have shown that length of residence does make a difference in the accuracy of the production of foreign sounds (Bohn & Flege, 1992). If according to research most of the improvement in L2 pronunciation takes place within a 2-year period (Flege, Bohn, & Jang, 1997), a correlation between length of residence and pronunciation could be established in this study.
Despite the limitations of this small scale study, the observable results indicate that the increased exposure to the second language in either a formal (language/culture class) or informal (no classes) in the country of residence had a positive impact on comprehensibility but not necessarily on intercultural competence. Research recognizes that communication in today’s world requires not only linguistic competence but also an intercultural competence emphasizing awareness of the values, traditions and ways of being of the language being acquired (Cummings, 2009; Egbo, 2009; Bennet, 2007). Previous research and anecdotal evidence indicate that Chinese students in first year classes in North American universities lack these skills (Bloch & Chi, 1995; Ferris & Hedgcock, 2005; Silva & Matsuda, 2001). Research also reveals that a lack of intercultural competence often results in students’ experiencing ‘culture shock’ (Killick & Parry, 1999; Roberts, 1998; Oberg, 1960). This has serious implications because trauma to the learners’ affective and behavioral disposition can prevent success in second language learning and in academic performance. If a student is tense, worried or anxious due to intercultural issues, second language acquisition and subject area knowledge may be affected (Krashen, 1985). Furthermore, comprehensibility in the spoken language may be affected. This may explain the IDI results of older, less-travelled experimental group who were assessed at a lower level of intercultural competence, the Defense and Minimization Stages.
From a Second Language Teaching (SLT) point of view, these interconnections between language and culture can have both practical and theoretical implications. In practice, the teacher can foresee the linguistic difficulties the students may experience arising from cultural differences. Theoretically, the teacher could determine the conditions that facilitate the development of the second language student’s ability to develop intercultural competence, the ability to successfully communicate with people of other cultures as well as comprehensibility in the second language. However, practically, the present study did not determine correlation between language/cultural instruction, comprehensibility and intercultural competence. In fact, exposure to the L2 in informal settings seems to have been more beneficial to comprehensibility than the language/cultural class as well as the amount of time spent abroad in a foreign culture.
In this case, the limitations of the sample do not promote generalizations regarding ELL’s language acquisition and intercultural competence but emphasizes the need for more research in this direction.
REFERENCES
Bennett, C.I. (2007). Comprehensive Multicultural Education: Theory and Practice, 6th Edition,
Boston: Allyn and Bacon.
Bennett, M. J. (1993). Towards ethnocentricism: A developmental model of intercultural sensitivity. In R.M. Paige (Ed.), Education for the intercultural experience. (2nd Edition). Yarmouth, ME:Intercultural Press.
Bennett, M. J. (1986) Towards ethnorelativism: a development model of intercultural Sensitivity.
In R. M. Paige (Ed.). Education for the Intercultural Experience (pp. 109-136).
Yarmouth, ME: Intercultural Press.
Bloch, J., & Chi, L. (1995). A comparison of the use of citations in Chinese and English
www.tojned.net
45
The Online Journal of New Horizons in Education Volume 4, Issue 1
Academic Discourse in Academic Writing. In Belcher, D. & Braine, G (Eds.),
(pp. 231-276). Second Language: Essays on Research and Pedagogy Westport: Greenwood Publishing Group Inc.
Bohn, O. S. & Flege, J. E. (1992). The production of new and similar vowels by adult German learners of English. Studies in Second Language Acquisition, 14, (pp. 131-158)
Brown, H. D. (2001). Teaching by Principles: An Interactive Approach to Language Pedagogy. (Second edition). White Plains, NY: Addison Wesley Longman.
Chamberlin- Quinlisk, C. (2005). Across continents or across the street: Using local resources to
cultivate intercultural awareness. Intercultural Education, 16 (5), 469-479.
Coleman, J. (1998). Evolving intercultural perceptions among university language learners in Europe. In M. Byram & M. Fleming (Eds.), Language learning in intercultural Perspective. (pp. 45-76). Cambridge, England: Cambridge University Press.
Coleman J. A. (1998) “Student Preparation for Residence Abroad: Two Stages in Acquiring
Cross –Cultural Capability” in Killick & Parry (eds.) (1998) Languages for Cross –Cultural Capability. Promoting the Discipline: Marking Boundaries and Crossing Borders. Leeds Metropolitan University.
Cummings, J. (2009) From Literacy to Multiliteracies: Designing Learning Environments for
Knowledge Generation in Culturally and Linguistically Diverse Schools. In The Challenges of Student Diversity in Canadian Schools: Essays on Building a Better Future for Exceptional Children. Fitzhenry and Whiteside Ltd. Markham, Ontario.
Crystal, D. (2003). English as a global language. Cambridge, UK: Cambridge University Press.
Derwing, T. M., Thomson, R. I. & Munro, M. J. (2006). English pronunciation and fluency
development in Mandarin and Slavic speakers. System, 34, 183-193.
Díaz, R., Lynne T. & Weed, Kathryn Z. (2010) The Crosscultural, Language, and Academic Development Handbook: A complete K-12 Reference Guide. 4th Edition. Pearson Education Inc.
Egbo, E. (2009) Teaching for Diversity in Canadian Schools. Toronto: Pearson Prentice Hall.
Elder, P.M., & Chen, B. (1997). Hartcourt Brace and Company, Canada.
Ferris, D., & Hedgcock, J. (2005). Teaching ESL Compostion. Routledge.
Flege, J. (2009). Give input a chance! In T. Piske & M. Young-Scholten (Eds) Input Matters
in SLA. Briston, England: Multilingual Matters, Pp. 175-190.
Flege, J. (2007). Language contact in bilingualism: Phonetic system interactions. In J. Cole
& J.I. Hualde (Eds), Laboratory Phonology 9. Berlin: Mouton de Gruyter. Pp. 353-382.
Flege, J. (2003). Assessing constraints on second-language segmental production and perception.
In A. Meyer & N. Schiller (Eds) Phonetics and Phonology in Language Comprehension
and Production, Differences and Similarities. Berlin: Mouton de Gruyter. Pp. 319-355.
Flege in Meyer 2003.
Flege, J. (2003). Methods for assessing the perception of vowels in a second language. In
E. Fava & A. Mioni
Flege, J. E., Bohn, 0.-S., & Jang, S. (1997). Effects of experience on non-native speakers’ production and perception of English vowels. Journal of Phonetics, 25, (pp. 437-470).
Fromkin,V.,Rodman,R.,Hyams,N.(2007)An Introduction to Language. Eighth Edition. Thomson-Nelson, Canada.
García-Pérez, G. M (2011) Training Spanish Speakers to Perceive and Pronounce English Vowels. First Edition. The Edwin Mellen Press. Lewiston, New York.
García-Pérez, G. M. & McLeod, A. (2010) ESL listening and speaking challenges in the multicultural classroom. Paper presented at the BCTEAL, 2010)
www.tojned.net
46
The Online Journal of New Horizons in Education Volume 4, Issue 1
García-Pérez, G. M & Ragoonaden, K.(2009) Intercultural Competence and Second Language Teaching
in Canada. Paper presented at the Canadian Federation for the Humanities and Social Sciences Congress, Ottawa, May, 2009.
Gielen, U., Fish, J. & Juris, D. (2004). Handbook of Culture, Therapy and Healing. London:
Lawrence Erlbaum Associates.
Hammer, M.R. & Bennett, M.J. (1998) The Intercultural Development Inventory (IDI)
Manuel. Portland, OR: The Intercultural Communication Institute.
Hess, J. D. (1997) Studying Abroad / Learning Abroad Yarmouth, ME: Intercultural Press.
Coleman J. A. (1998) “Student Preparation for Residence Abroad: Two Stages in Acquiring Cross –Cultural Capability” in Killick and Parry (eds. ) (1998)
Krashen, S. (1985) The Input Hypothesis: Issues and Implications. London: Longman.
Killick, D. & M. Parry (eds) 1999 Languages for Cross –Cultural Capability. Promoting the
Discipline: Marking Boundaries and Crossing Borders. Proceedings of the conference at Leeds Metropolitan University, December 1998, Leeds: Leeds Metropolitan University.
Liceras, J. M., H. Zobl & H. Goodluck (Eds.). 2008. The Role of Formal Features in Second Language Acquisition. Mahawah, New Jersey: Lawrence Erlbaum.
Lightbown, P. M., & Spada, N. (1999). How Languages are Learned. Oxford: Oxford University Press.
Lupart, J. L. (2009) The Challenges of Student Diversity in Canadian Schools. Fitzhenry and Whiteside Ltd.
Mikk, B. K., Cohen, A. D., Paige, R. M., Chi, J. C., Lassegard,J. P., Meagher, M., & Weaver, S. (2009). Maximizing study abroad: An instructional guide to strategies for language and culture learning and use. Minneapolis, MN: Center for Advanced Research on Language Acquisition, University of Minnesota.
Munro, M.J. & Derwing, T.M. (2008). Segmental acquisition in adult ESL learners: A longitudinal study of vowel production. Language Learning, 58, 479-502.
Nunan, D. (2000). Language Teaching Methodology: A textbook for language
teachers. (Second edition). London: Longman.
Oberg. K (1960). “Culture Shock: the Problem of Adjustment to New social Environments”
Practical Anthropology 7, pp. 177-82.
Paige, R. M., Jorstad, J., Siaya, L., Klein, F., & Colby, J. (2003). Culture learning in language education: A review of the literature. In D. Lange, & R. M. Paige (Eds.), Culture as the core: Integrating culture into the language education (pp. 173-236). Greenwich, CT: Information Age
Roberts, C. (1998) “Awareness in Intercultural Communication”. Language Awareness, Vol. 7
No. 3.
Rossiter, M. J., Derwing, T. M., Manimtim, L. G., & Thomson, R. I. (2010). Oral fluency: The neglected component in the communicative language classroom. Canadian Modern Language Review, 66(4), 583-606.
Sapir, E. (1921) Language: An introduction to the study of speech. Harcourt, Brace and
Company, New York.
Scovel, T. (1969). Foreign Accent. Language acquisition and cerebral dominance.
Language Learning, 19, (pp. 245-254).
Silva, T., & Matsuda, P.K. (Eds.). (2001) Landmark Essays on ESL Writing. Mahwah, NJ: Laurence, ErlbaumAssociates, Hermagoras Press.
Taylor & Francis. (2005). Across continents or across the street: Using local resources to cultivate intercultural awareness. Intercultural Education, 16(5), 469-479.
Utley D. (2002) The Culture Pack: Intercultural communication resources for trainers. York
Associates.
www.tojned.net
47

The Online Journal of New Horizons in Education Volume 4, Issue 1
Vandergrift, L. (2006). Second language listening: Listening ability or language proficiency? The
Modern Language Journal, 90, 6-18.
Yunbao, Y., & Huaying, Z. (2008). What ‘Crazy English’ can tell us? Inspiration and motivation from Li Yang. International Education Studies, 1(2), 18-21.
www.tojned.net
48
The Online Journal of New Horizons in Education Volume 4, Issue 1
www.tojned.net
Evaluating Images of the Environment for Educational Use: Exploring the Use of a Rubric Derived From Visual Information Theory Vanessa L. Hunt [1], Debbie Smick Muthersbaugh [2] Anne Kern [3]
[1] PhD Science Education Director, Seattle/Western Washington, Department of Science Education Central Washington University, PO Box 13490, Des Moines, WA 98198 [email protected] [2] School of Education and Psychology, Walla Walla University [3] Department of Curriculum and Instruction, University of Idaho
ABSTRACT
This study explored whether a rubric based upon criteria from visual information theory and intended to facilitate selection of images for environmental education purposes would be robust among users of differing backgrounds. Five higher education faculty evaluated 40 images for the criteria of content, context, information density, and credibility of source. Cronbach’s Alpha Reliability Coefficient was utilized to calculate internal consistency of user responses and findings indicated that the rubric was robust for the four criteria. Responses to different subject matter within environmental images were also considered using a qualitative interpretive methodology. Very different responses to the image categories of maps, terrain, plants and animals emerged. Images of terrain and of animals in terrain were highly ranked compared to map images and images of plants, likely due to relatively poor map understanding and lack of familiarity with plants. The majority of evaluator comments targeted human interactions with the environment, indicating a tendency to focus upon companion meanings of the images rather than environmental science content.
Keywords: Evaluating Images, Environment, Rubric Derived, Visual Information Theory
INTRODUCTION
Images mediate the environmental experience of many people (including students), and the term ‘environmental images’ conjures both compelling landscapes and depictions of actual or imminent environmental disasters or problems (e.g., oil spills and degraded rivers). However, this category of image is broad, as is the subject matter of environmental science and environmental education. In addition to fine art or photographic representations of landscapes or the causes and sustainable resolution of environmental problems, environmental imagery may include maps, technical illustrations of organisms that are intended for explanation and identification (such as in botanical watercolors and field guides to bird life) and diagrams of scientific phenomena such as the water-cycle and carbon cycle. Explicit and implicit content depicted by environmental imagery includes: matter and energy, water and soil chemistry, ecosystems and evolution, biodiversity, species interactions and population dynamics, water resources, waste and hazardous waste, energy issues, and the processes and technology of urbanization. Additionally, environmental concepts and issues in physical geography, geology, limnology, and oceanography may be addressed visually at a number of systemic levels. Such images fulfill a number of possible educational and cognitive functions as they engage the viewer aesthetically (Robin, 1992). They may describe and explain an organism or phenomenon, demonstrate cause and effect relationships, provoke inductive reasoning about the subject matter, teach visual classification skills by example, promote the development of explanations, and force the utilization of previously learned concepts in turn.
Thus there are many compelling reasons to give substantial consideration to selection of images for use in formal and informal environmental education settings. Conservationist Aldo Leopold understood this and utilized appealing illustrations of organisms in their natural habitat in A Sand County Almanac (1970/1949), a work that became influential in both the conservation movement and in environmental philosophy and aesthetics (Ito, 2008). More recently, images of the maned wolf in a traveling environmental cinema in central Brazil was one tool that proved effective in gaining
49

The Online Journal of New Horizons in Education Volume 4, Issue 1
www.tojned.net
support for conservation of the species in a rural area (Bizerril, Soares, & Santos, 2011). However, not all images are equal in potential and power to fulfill Robin’s (1992) functions: an examination of images of the environment in more than 500 modern picture books about the natural world found that, exclusive of straightforward information texts, less than ten received the researcher’s unreserved recommendation as contributing to the environmental education of young readers (Marriott, 2002). Marriott concluded, that although images of nature are plentiful, there are ‘a few jewels, but a huge quantity of dross” (p.182), indicating that the reasoned and purposeful selection of images for environmental education is called for, and that use of a rubric based upon appropriate criteria might be appropriate and helpful in this process.
Although the cognitive and educational potential of any image naturally depends somewhat upon the visual literacy and previous knowledge of the viewer, the informational quality and design of the image is of paramount importance to the effectiveness of the image. In a four- volume work addressing data visualization and visual information theory, Edward Tufte (1983; 1990; 1997; 2006) expounds upon design strategies that maximize information representation, thus providing a potentially useful basis for image choice for environmental education use. Although many of Tufte’s exemplars are from the fields of cartography, fine artwork and graphic design, recent refinements in image processing capabilities render photography amenable to adjustment to meet many of Tufte’s criteria. The ability of a convincing photograph to transform and express a ‘created’ concept is consonant with the individual viewpoint and explanation of the subject matter offered by fine art painting (Gordin, 2013), and environmental images created by informed photographers have the potential to satisfy the criteria of visual information theory.
This study explores two questions. First, is it possible to develop a simple and robust rubric by which educators in environmental science or environmental education can evaluate images for their cognitive and educational power utilizing Tufte’s (1983; 1990; 1997; 2006) visual information theory? Second, given that environmental imagery is so wide in scope and includes such a range of genres and subject matter, we examine how different categories of image (maps, terrain, and images of organisms) are perceived in terms of information extracted and responses evoked in viewers.
BACKGROUND: EDWARD Tufte’s Visual Information Theory
Edward Tufte’s (1983: 1996; 1999; 2006) visual information theory provides a framework for effectively evaluating images in general, and pictures with environmental science content in particular. Tufte (1983) insists that an educational graphic exceed the function of ‘showing the obvious to the ignorant’ (p.53) and posits a standard of excellence for images that rests upon two major axioms: that the maximum possible information about the subject is to be communicated as efficiently as possible, and that the image is ‘relational’, explicitly showing relationships between variables or different components of the illustration wherever possible. Relational images link two variables and encourage the viewer to assess possible causal relationships and respond to their visual experience with thoughtful and meaningful questions. Expectations underlying these axioms are expounded upon throughout the four-volume exposition of visual information theory, but for purposes of informing image evaluation relating to environmental science and environmental science education can be summarized by attention to six key elements: content, context, data-ink, integrity, causal reasoning, and visual hierarchies.
Content
Content describes the explicit and implicit information provided within the image. In terms of environmental images, this might refer to the presence of visually accessible information about the abiotic environment, organisms, ecosystems, populations, or sustainability. Tufte (2006) has proposed that the initial issue to be addressed in image selection is to determine the content reasoning task that the image is intended to assist. Clarification of essential reasoning tasks will suggest necessary content elements, of primary importance in the image selection process as “presentations ultimately stand or fall depending on the quality, relevance, and integrity of their content” (p.136).
Context
A second criterion for an effective image choice is context. Environmental image selection requires that the targeted content is portrayed in authentic and accurate context (such as a cactus plant in a desert landscape), and that misconceptions are avoided. Context is an essential component of integrity in the illustration or image, and can be a difficult criterion to satisfy, as strict realism or authentic scenes that provide rich information while eschewing gratuitous detail (Tufte, 1983) are frequently not considered by artists and photographers to be pleasing or marketable. The principle of proper context in environmental imagery requires that illustrations of organisms provide direct answers to relevant questions about size, form, morphological and behavioral adaptations, and ecology (Hunt, 2006) and that images depicting multiple species of organisms indicate how the these are related, i.e., by taxonomy or by habitat. Modern illustrations in technical publications, such as field guides to birds, generally do organize their species according to a strict taxonomic arrangement (e.g., Kaufmann, 1990; King, Dickinson, &Woodcock,1975), while some field guides intended for the beginner, and many narrative paintings show organisms related by niche or habitat (e.g., Coe, 2001;
50
The Online Journal of New Horizons in Education Volume 4, Issue 1
www.tojned.net
Lansdowne, 1968; Matthiesson, 1967).
Maps are a category of environmental image that illustrate how the power of an image can be enhanced by visual emphasis of causal and contributory factors to provide context: differences in of natural resources, population, rainfall, etc. are superb vehicles for geographic comparisons. The classic exemplar of this genre is Minard’s figurative map of Napoleon’s march through Russian in 1812 (Minard, 1869), in which both the advance and retreat of the army on and from Moscow are depicted with respect to six contextually relevant variables: environmental temperature, environmental hazards such as the crossing of the icy Berezina river, direction of movement of the army, the (decreasing) size of the army along the route, geographical coordinates, and dates at which the arm passed through key locations. Lesser known works of Minard include more than 50 thematic maps, most of which described and explained issues of economic rather than environmental geography, but which nonetheless demonstrate how maps with data shown in enriched context can summarize and convey impressive amounts of information (Friendly, 2013).
Information Density
A third element to be considered in image selection for environmental education is information density, or ‘data- ink’ (Tufte, 1983, pp. 91-105). Data-ink is the proportion of the image devoted to content, thus an image rich in information content will have a high ‘data-ink’ index (p.93). Data- ink can relay features of the environment that are explicitly portrayed or implied in the image. For example, the proportion of the image devoted to a nuclear reactor when illustrating energy sources, or to an urbanized river valley when the environmental topic is water conversation would be relevant to information density, or the data-ink index. Tufte (1983) has explained his concept of data-ink in more general terms:
Data graphics should draw the viewer’s attention to the sense and substance of the data, not to something else…graphics are instruments to help people reason about quantitative information (p. 91)… A large share of ink on a graphic should present data-information, the ink changing as the data change. Data-ink is the non-erasable core of a graphic, the non-redundant ink arranged in response to variation in the numbers represented (p. 93).
Thus when selecting an appropriate image for educational purposes, the percentage of the image area containing directly applicable content or information relevant to that content should be assessed: information density of the image increases with this percentage (Tufte, 1983;1997;2006).
Causal Reasoning
A fourth element Tufte (1997; 2006) to be considered in image selection is the extent to which it is likely invoke causal reasoning, encouraging viewers to ask reasoned questions about both the explicit content displayed and also that which is implied: “Scientific research involves causal thinking, for Nature’s laws are causal laws.…principles of design should attend to the fundamental intellectual task in the analysis of evidence…causality, mechanism, explanation, systematic structure” (Tufte, 2006, p. 128).
Credibility
The element of integrity (Tufte, 1983, 1990, 1997) is described in terms of a number of dimensions, including design strategies that prevent the viewer from having to guess at missing information, or from being unintentionally deceived by misleading proportions or the optical plane in which the subject is depicted. However, integrity is primarily concerned with credibility: the scientific and historical credibility and the reliability of the source, this latter being of paramount importance when images are sourced from the Internet. Tufte (1997) is insistent on the matter of examination of image sources: “If images are to be considered credible, their source and history must be documented. And if an image is to serve as serious evidence, a more rigorous accounting should reveal the overall pool of images from which the displayed image was selected” (p. 25).
Visual Hierarchies
Tufte (1990) describes “confusion and clutter…as the failures of design” (p.53), impeding the comprehension of information. Thus the sixth and final element of image assessment generated from visual information theory is that of the provision of a visual hierarchy within the image. A visual hierarchy indicating the relative importance of content within the images can be provided by varying line weight, use of texture and patterns, color variation, and choice of compositional strategy. Color and line function in layering and separation of visual information, reducing noise and enriching the content of image by effective visual emphasis. Although beyond the scope of the current study, Envisioning Information (Tufte, 1990) also includes considerable attention to design strategies that sharpen the information resolution of illustrations.
51
The Online Journal of New Horizons in Education Volume 4, Issue 1
www.tojned.net
METHODOLOGY
Criteria Employed
From the six criteria discussed throughout Tufte’s (1983; 1990; 1997; 2006) work in visual information theory, four were identified that were judged basic to guiding image choice for environmental education purposes, and that were suitable for a non-specialist in visual information concerns to comprehend quickly. Content, context, information density, and credibility of the source of the image were the criteria selected. Causal reasoning and the provision of visual hierarchies were judged to be beyond the scope of this study.
Content (Criterion 1) required that the image be rich in explicit and implicit environmental content.
Context (Criterion 2) required that the image content be shown in an accurate environmental context and that content was not diluted by gratuitous decorative material.
Information density (Criterion 3)) was the percentage of the image containing relevant information about the environment (from Tufte’s (1983) concept of Data-Ink).
Credibility of source (Criterion 4) required that the Internet source of the image be considered scientifically and historically credible.
To address the first question of whether a rubric for environmental image selection based upon visual information theory would be robust among users (i.e., that users would make similar judgments pertaining to our chosen criteria), we designed a questionnaire (see Appendix I) that was distributed to five evaluators, along with a 40 item image set. The questionnaire featured a Likert-type response to each of the four criteria, with a justifying written comment requested for each. For the criteria of content, context, and credibility of source we asked that the evaluator classify the images as fully, mostly, partly, or not met for each criterion and assigned each classification a numeric score (4 for fully met, 3 for mostly met, 2 for partly met, and 1 for not met.). The criterion of information density asked that evaluators estimate the proportion of the image that depicted environmentally relevant information, with available selections of 0 – 25%, 25% - 50%, 50% - 75%, and 75% - 100%.
Image Selection
The 40 images selected for evaluation (Muthersbaugh and Kern, 2012) were drawn from a set of 100 images, collected from Internet sources, that had previously been utilized in an elementary social studies and science study in which students explored the local (Pacific Northwest region of the United States) environment during the time of the Lewis and Clark expedition in the early 1800’s, and compared this to current environmental conditions. For the current study, images were selected from this larger collection to fit four general categories of ‘environmental image’: maps, terrain (landscapes), plants, and animals. Ten images were provided for each of these four categories, and of the ten images in each category, five were historic images (from the 1800’s) and five were contemporary.
Participants
Five educators were selected to evaluate the image set. These educator-evaluators had diverse professional lives, but all were positioned such that selecting images of the environment for educational purposes comprised part of their practice. All evaluators also possessed sufficient environmental science background to make a credible appraisal of the images. All individuals (four female, one male) were current or former higher education faculty with five to twenty-plus years of teaching experience at institutions in the Pacific Northwest region of the United States. Three have taught public schools and all have experience in science teacher preparation. The environmental science expertise of the evaluators varied from completion of relevant college coursework through actually teaching environmental science at the college level. One evaluator was employed in the private environmental sector, one was primarily a biological scientist, one was in engineering, one specialized in elementary education, and one was specifically science education faculty.
Data Analysis
To inform the first question of whether an image rubric would be robust to the subjectivity inherent in having different individuals evaluate images, Cronbach’s Alpha Based on Standardized Items (SPSS) was employed to estimate the internal consistency of the different evaluators’ scores for each of the criteria in the rubric for the 40 images (Cronbach, 1951). Scores were analyzed with n = 5, and an overall reliability agreement score of 0.700 preferred per criterion. Thus a Cronbach’s alpha of 0.700 or greater would indicate that the evaluators reached an acceptable level of agreement for that criterion on the entire image set (see Table 1).
To address the second question of how different categories of image were perceived, the numerical values of
52
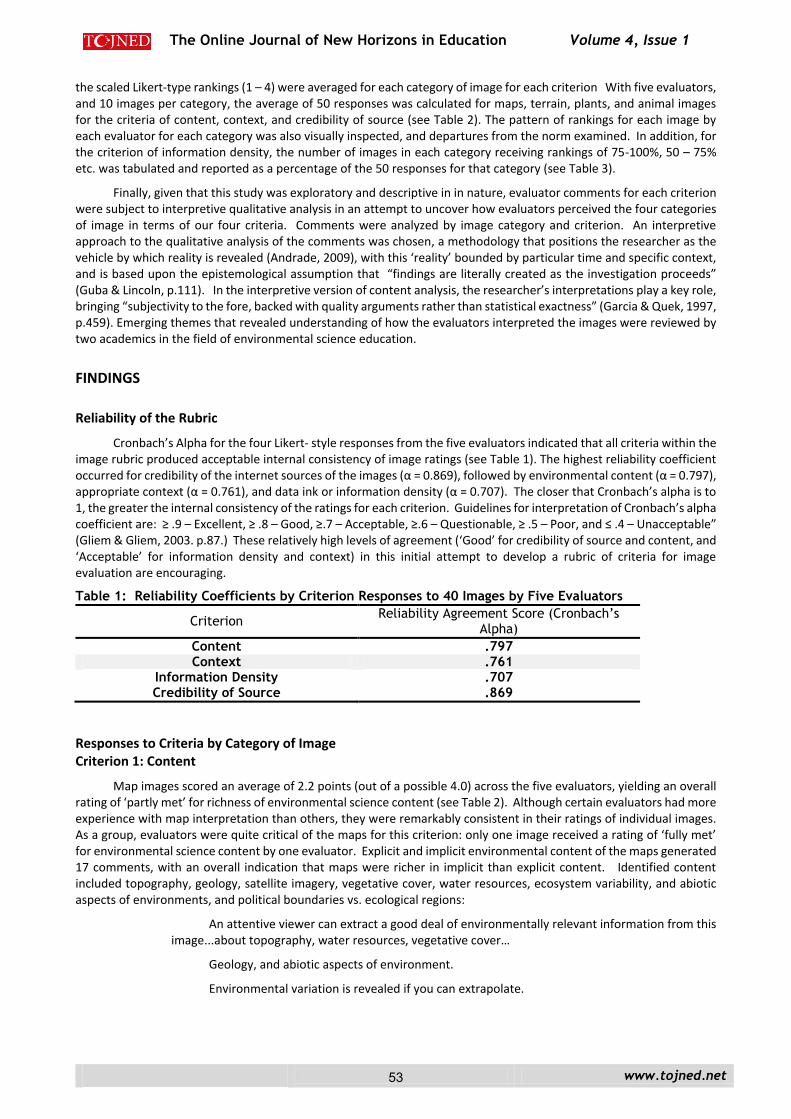
The Online Journal of New Horizons in Education Volume 4, Issue 1
www.tojned.net
the scaled Likert-type rankings (1 – 4) were averaged for each category of image for each criterion With five evaluators, and 10 images per category, the average of 50 responses was calculated for maps, terrain, plants, and animal images for the criteria of content, context, and credibility of source (see Table 2). The pattern of rankings for each image by each evaluator for each category was also visually inspected, and departures from the norm examined. In addition, for the criterion of information density, the number of images in each category receiving rankings of 75-100%, 50 – 75% etc. was tabulated and reported as a percentage of the 50 responses for that category (see Table 3).
Finally, given that this study was exploratory and descriptive in in nature, evaluator comments for each criterion were subject to interpretive qualitative analysis in an attempt to uncover how evaluators perceived the four categories of image in terms of our four criteria. Comments were analyzed by image category and criterion. An interpretive approach to the qualitative analysis of the comments was chosen, a methodology that positions the researcher as the vehicle by which reality is revealed (Andrade, 2009), with this ‘reality’ bounded by particular time and specific context, and is based upon the epistemological assumption that “findings are literally created as the investigation proceeds” (Guba & Lincoln, p.111). In the interpretive version of content analysis, the researcher’s interpretations play a key role, bringing “subjectivity to the fore, backed with quality arguments rather than statistical exactness” (Garcia & Quek, 1997, p.459). Emerging themes that revealed understanding of how the evaluators interpreted the images were reviewed by two academics in the field of environmental science education.
FINDINGS
Reliability of the Rubric
Cronbach’s Alpha for the four Likert- style responses from the five evaluators indicated that all criteria within the image rubric produced acceptable internal consistency of image ratings (see Table 1). The highest reliability coefficient occurred for credibility of the internet sources of the images (α = 0.869), followed by environmental content (α = 0.797), appropriate context (α = 0.761), and data ink or information density (α = 0.707). The closer that Cronbach’s alpha is to 1, the greater the internal consistency of the ratings for each criterion. Guidelines for interpretation of Cronbach’s alpha coefficient are: ≥ .9 – Excellent, ≥ .8 – Good, ≥.7 – Acceptable, ≥.6 – Questionable, ≥ .5 – Poor, and ≤ .4 – Unacceptable” (Gliem & Gliem, 2003. p.87.) These relatively high levels of agreement (‘Good’ for credibility of source and content, and ‘Acceptable’ for information density and context) in this initial attempt to develop a rubric of criteria for image evaluation are encouraging.
Table 1: Reliability Coefficients by Criterion Responses to 40 Images by Five Evaluators
Criterion Reliability Agreement Score (Cronbach’s
Alpha)
Content .797 Context .761
Information Density .707 Credibility of Source .869
Responses to Criteria by Category of Image Criterion 1: Content
Map images scored an average of 2.2 points (out of a possible 4.0) across the five evaluators, yielding an overall rating of ‘partly met’ for richness of environmental science content (see Table 2). Although certain evaluators had more experience with map interpretation than others, they were remarkably consistent in their ratings of individual images. As a group, evaluators were quite critical of the maps for this criterion: only one image received a rating of ‘fully met’ for environmental science content by one evaluator. Explicit and implicit environmental content of the maps generated 17 comments, with an overall indication that maps were richer in implicit than explicit content. Identified content included topography, geology, satellite imagery, vegetative cover, water resources, ecosystem variability, and abiotic aspects of environments, and political boundaries vs. ecological regions:
An attentive viewer can extract a good deal of environmentally relevant information from this image...about topography, water resources, vegetative cover…
Geology, and abiotic aspects of environment.
Environmental variation is revealed if you can extrapolate.
53
The Online Journal of New Horizons in Education Volume 4, Issue 1
www.tojned.net
The different ecosystems depicted in a large scale map drew evaluator attention:
Different limiting factors are implied by the different environments.
Variation in ecosystems (across the route) as mountain ranges, Great Plains, plateaus are labeled.
Food webs and diversity implied…will be very different in marine, coastal, vegetated mountainous regions and high desert environments.
Implied interactions between humans and the environment were also a topic of comment for the set of map images:
There are implications about the natural resources available to the (Lewis and Clark) expedition.
Natural vs. anthropogenic change is suggested.
The 10 images in the category of ‘Terrain’ scored an average of 3.3 points across the five evaluators, an average rating between ‘mostly met’ and ‘fully met’ for richness of environmental science content (see Table 2). Ratings of individual images were consistent between evaluators and all provided comments (24 comments total) on the content identified in this category. Evaluator comments tended to emphasize human interactions with, and modifications to, the environment.
Modifications of the environment based on the major highway.
Diversity may have changed over time as humans monopolized the prairie.
Negative results (on the environment) due to the dam and barge traffic.
Images in the ‘Plants’ category scored an average rating of ‘partly met’ (2.1 out of a possible 4.0) for depiction of explicit and implicit environmental science content. Ratings were consistent between images, and moderately consistent between evaluators, although two individuals (one with a ‘naïve’ interest in botanical illustration, and one with some academic background in this area) gave the plants images higher ratings for content. These two evaluators were the only individuals to offer comments on the content of the plant images. Most of the comments made by the more ‘naïve’ evaluator keyed on flowers and fruiting structures or focused upon human interactions with plants, while the ‘informed’ evaluator appeared to be searching for ecological content:
Examples of ‘Informed’ comments:
Plant appears to be in a woody landscape where it will be competing with other plant species for resources. It is providing a food source, which is beneficial to other species.
Cottonwoods increase biological diversity in riverine environments by providing food and shelter for other organisms.
Examples of ‘Naïve’ comments:
The seed pods are intriguing.
Humans affected the plants’ environment in some way as they harvested wood.
Plant used by humans for utilitarian and medicinal functions.
Evaluators indicated that depictions of unfamiliar plants such as wildflowers are more useful when an informative label was provided:
The accompanying explanation brings the missing content to the image.
The image alone does not provide much information – photos of flowers and foliage have limited usefulness.
54
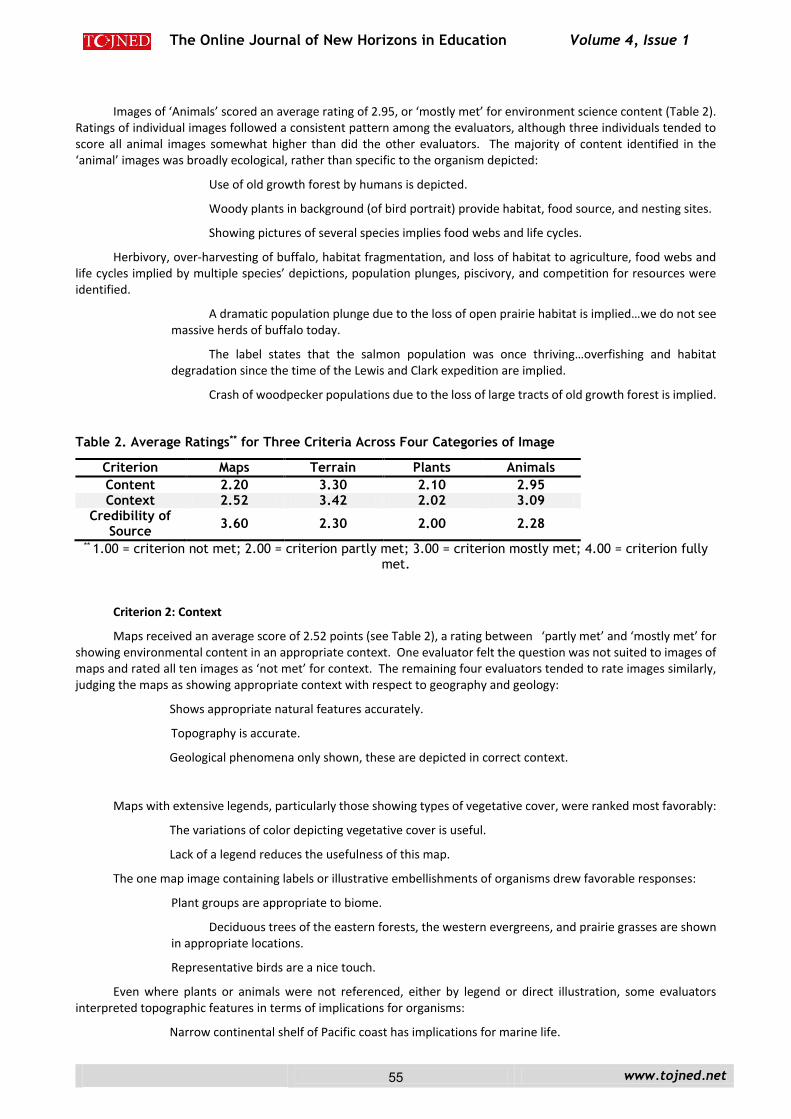
The Online Journal of New Horizons in Education Volume 4, Issue 1
www.tojned.net
Images of ‘Animals’ scored an average rating of 2.95, or ‘mostly met’ for environment science content (Table 2). Ratings of individual images followed a consistent pattern among the evaluators, although three individuals tended to score all animal images somewhat higher than did the other evaluators. The majority of content identified in the ‘animal’ images was broadly ecological, rather than specific to the organism depicted:
Use of old growth forest by humans is depicted.
Woody plants in background (of bird portrait) provide habitat, food source, and nesting sites.
Showing pictures of several species implies food webs and life cycles.
Herbivory, over-harvesting of buffalo, habitat fragmentation, and loss of habitat to agriculture, food webs and life cycles implied by multiple species’ depictions, population plunges, piscivory, and competition for resources were identified.
A dramatic population plunge due to the loss of open prairie habitat is implied…we do not see massive herds of buffalo today.
The label states that the salmon population was once thriving…overfishing and habitat degradation since the time of the Lewis and Clark expedition are implied.
Crash of woodpecker populations due to the loss of large tracts of old growth forest is implied.
Table 2. Average Ratings** for Three Criteria Across Four Categories of Image
Criterion Maps Terrain Plants Animals
Content 2.20 3.30 2.10 2.95 Context 2.52 3.42 2.02 3.09
Credibility of Source
3.60 2.30 2.00 2.28
** 1.00 = criterion not met; 2.00 = criterion partly met; 3.00 = criterion mostly met; 4.00 = criterion fully met.
Criterion 2: Context
Maps received an average score of 2.52 points (see Table 2), a rating between ‘partly met’ and ‘mostly met’ for showing environmental content in an appropriate context. One evaluator felt the question was not suited to images of maps and rated all ten images as ‘not met’ for context. The remaining four evaluators tended to rate images similarly, judging the maps as showing appropriate context with respect to geography and geology:
Shows appropriate natural features accurately.
Topography is accurate.
Geological phenomena only shown, these are depicted in correct context.
Maps with extensive legends, particularly those showing types of vegetative cover, were ranked most favorably:
The variations of color depicting vegetative cover is useful.
Lack of a legend reduces the usefulness of this map.
The one map image containing labels or illustrative embellishments of organisms drew favorable responses:
Plant groups are appropriate to biome.
Deciduous trees of the eastern forests, the western evergreens, and prairie grasses are shown in appropriate locations.
Representative birds are a nice touch.
Even where plants or animals were not referenced, either by legend or direct illustration, some evaluators interpreted topographic features in terms of implications for organisms:
Narrow continental shelf of Pacific coast has implications for marine life.
55
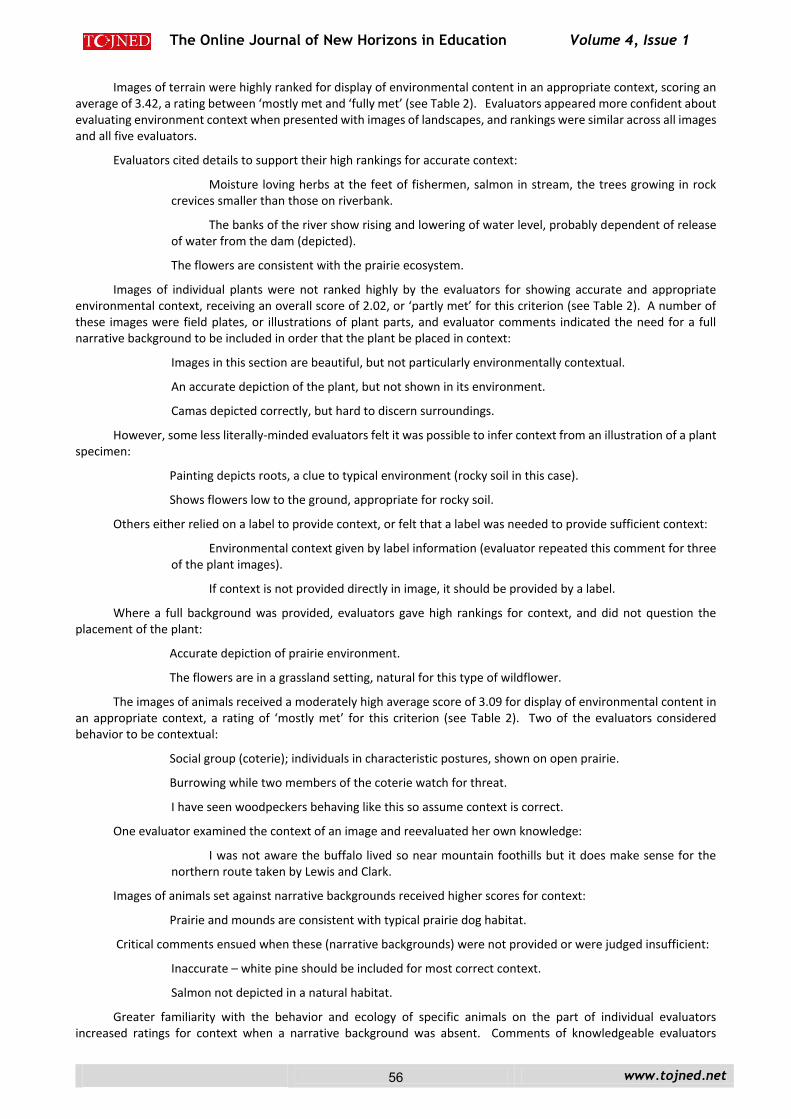
The Online Journal of New Horizons in Education Volume 4, Issue 1
www.tojned.net
Images of terrain were highly ranked for display of environmental content in an appropriate context, scoring an average of 3.42, a rating between ‘mostly met and ‘fully met’ (see Table 2). Evaluators appeared more confident about evaluating environment context when presented with images of landscapes, and rankings were similar across all images and all five evaluators.
Evaluators cited details to support their high rankings for accurate context:
Moisture loving herbs at the feet of fishermen, salmon in stream, the trees growing in rock crevices smaller than those on riverbank.
The banks of the river show rising and lowering of water level, probably dependent of release of water from the dam (depicted).
The flowers are consistent with the prairie ecosystem.
Images of individual plants were not ranked highly by the evaluators for showing accurate and appropriate environmental context, receiving an overall score of 2.02, or ‘partly met’ for this criterion (see Table 2). A number of these images were field plates, or illustrations of plant parts, and evaluator comments indicated the need for a full narrative background to be included in order that the plant be placed in context:
Images in this section are beautiful, but not particularly environmentally contextual.
An accurate depiction of the plant, but not shown in its environment.
Camas depicted correctly, but hard to discern surroundings.
However, some less literally-minded evaluators felt it was possible to infer context from an illustration of a plant specimen:
Painting depicts roots, a clue to typical environment (rocky soil in this case).
Shows flowers low to the ground, appropriate for rocky soil.
Others either relied on a label to provide context, or felt that a label was needed to provide sufficient context:
Environmental context given by label information (evaluator repeated this comment for three of the plant images).
If context is not provided directly in image, it should be provided by a label.
Where a full background was provided, evaluators gave high rankings for context, and did not question the placement of the plant:
Accurate depiction of prairie environment.
The flowers are in a grassland setting, natural for this type of wildflower.
The images of animals received a moderately high average score of 3.09 for display of environmental content in an appropriate context, a rating of ‘mostly met’ for this criterion (see Table 2). Two of the evaluators considered behavior to be contextual:
Social group (coterie); individuals in characteristic postures, shown on open prairie.
Burrowing while two members of the coterie watch for threat.
I have seen woodpeckers behaving like this so assume context is correct.
One evaluator examined the context of an image and reevaluated her own knowledge:
I was not aware the buffalo lived so near mountain foothills but it does make sense for the northern route taken by Lewis and Clark.
Images of animals set against narrative backgrounds received higher scores for context:
Prairie and mounds are consistent with typical prairie dog habitat.
Critical comments ensued when these (narrative backgrounds) were not provided or were judged insufficient:
Inaccurate – white pine should be included for most correct context.
Salmon not depicted in a natural habitat.
Greater familiarity with the behavior and ecology of specific animals on the part of individual evaluators increased ratings for context when a narrative background was absent. Comments of knowledgeable evaluators
56
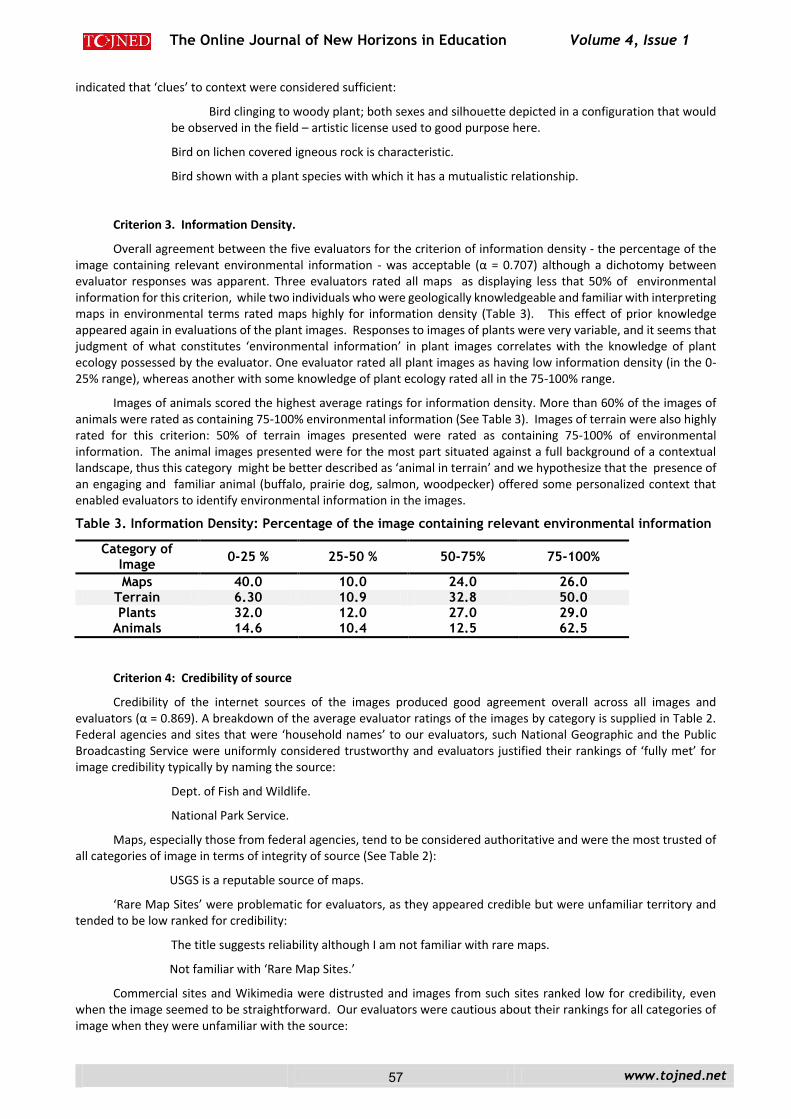
The Online Journal of New Horizons in Education Volume 4, Issue 1
www.tojned.net
indicated that ‘clues’ to context were considered sufficient:
Bird clinging to woody plant; both sexes and silhouette depicted in a configuration that would be observed in the field – artistic license used to good purpose here.
Bird on lichen covered igneous rock is characteristic.
Bird shown with a plant species with which it has a mutualistic relationship.
Criterion 3. Information Density.
Overall agreement between the five evaluators for the criterion of information density - the percentage of the image containing relevant environmental information - was acceptable (α = 0.707) although a dichotomy between evaluator responses was apparent. Three evaluators rated all maps as displaying less that 50% of environmental information for this criterion, while two individuals who were geologically knowledgeable and familiar with interpreting maps in environmental terms rated maps highly for information density (Table 3). This effect of prior knowledge appeared again in evaluations of the plant images. Responses to images of plants were very variable, and it seems that judgment of what constitutes ‘environmental information’ in plant images correlates with the knowledge of plant ecology possessed by the evaluator. One evaluator rated all plant images as having low information density (in the 0-25% range), whereas another with some knowledge of plant ecology rated all in the 75-100% range.
Images of animals scored the highest average ratings for information density. More than 60% of the images of animals were rated as containing 75-100% environmental information (See Table 3). Images of terrain were also highly rated for this criterion: 50% of terrain images presented were rated as containing 75-100% of environmental information. The animal images presented were for the most part situated against a full background of a contextual landscape, thus this category might be better described as ‘animal in terrain’ and we hypothesize that the presence of an engaging and familiar animal (buffalo, prairie dog, salmon, woodpecker) offered some personalized context that enabled evaluators to identify environmental information in the images.
Table 3. Information Density: Percentage of the image containing relevant environmental information
Category of Image
0-25 % 25-50 % 50-75% 75-100%
Maps 40.0 10.0 24.0 26.0 Terrain 6.30 10.9 32.8 50.0 Plants 32.0 12.0 27.0 29.0
Animals 14.6 10.4 12.5 62.5
Criterion 4: Credibility of source
Credibility of the internet sources of the images produced good agreement overall across all images and evaluators (α = 0.869). A breakdown of the average evaluator ratings of the images by category is supplied in Table 2. Federal agencies and sites that were ‘household names’ to our evaluators, such National Geographic and the Public Broadcasting Service were uniformly considered trustworthy and evaluators justified their rankings of ‘fully met’ for image credibility typically by naming the source:
Dept. of Fish and Wildlife.
National Park Service.
Maps, especially those from federal agencies, tend to be considered authoritative and were the most trusted of all categories of image in terms of integrity of source (See Table 2):
USGS is a reputable source of maps.
‘Rare Map Sites’ were problematic for evaluators, as they appeared credible but were unfamiliar territory and tended to be low ranked for credibility:
The title suggests reliability although I am not familiar with rare maps.
Not familiar with ‘Rare Map Sites.’
Commercial sites and Wikimedia were distrusted and images from such sites ranked low for credibility, even when the image seemed to be straightforward. Our evaluators were cautious about their rankings for all categories of image when they were unfamiliar with the source:
57
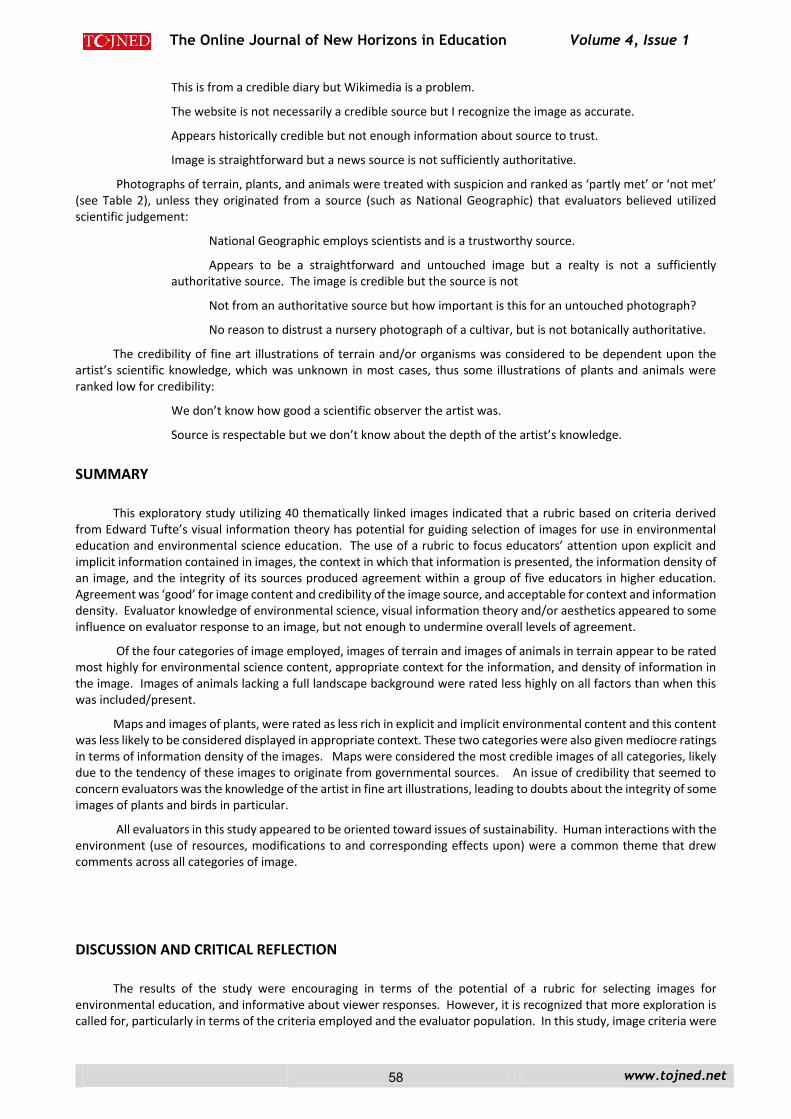
The Online Journal of New Horizons in Education Volume 4, Issue 1
www.tojned.net
This is from a credible diary but Wikimedia is a problem.
The website is not necessarily a credible source but I recognize the image as accurate.
Appears historically credible but not enough information about source to trust.
Image is straightforward but a news source is not sufficiently authoritative.
Photographs of terrain, plants, and animals were treated with suspicion and ranked as ‘partly met’ or ‘not met’ (see Table 2), unless they originated from a source (such as National Geographic) that evaluators believed utilized scientific judgement:
National Geographic employs scientists and is a trustworthy source.
Appears to be a straightforward and untouched image but a realty is not a sufficiently authoritative source. The image is credible but the source is not
Not from an authoritative source but how important is this for an untouched photograph?
No reason to distrust a nursery photograph of a cultivar, but is not botanically authoritative.
The credibility of fine art illustrations of terrain and/or organisms was considered to be dependent upon the artist’s scientific knowledge, which was unknown in most cases, thus some illustrations of plants and animals were ranked low for credibility:
We don’t know how good a scientific observer the artist was.
Source is respectable but we don’t know about the depth of the artist’s knowledge.
SUMMARY
This exploratory study utilizing 40 thematically linked images indicated that a rubric based on criteria derived from Edward Tufte’s visual information theory has potential for guiding selection of images for use in environmental education and environmental science education. The use of a rubric to focus educators’ attention upon explicit and implicit information contained in images, the context in which that information is presented, the information density of an image, and the integrity of its sources produced agreement within a group of five educators in higher education. Agreement was ‘good’ for image content and credibility of the image source, and acceptable for context and information density. Evaluator knowledge of environmental science, visual information theory and/or aesthetics appeared to some influence on evaluator response to an image, but not enough to undermine overall levels of agreement.
Of the four categories of image employed, images of terrain and images of animals in terrain appear to be rated most highly for environmental science content, appropriate context for the information, and density of information in the image. Images of animals lacking a full landscape background were rated less highly on all factors than when this was included/present.
Maps and images of plants, were rated as less rich in explicit and implicit environmental content and this content was less likely to be considered displayed in appropriate context. These two categories were also given mediocre ratings in terms of information density of the images. Maps were considered the most credible images of all categories, likely due to the tendency of these images to originate from governmental sources. An issue of credibility that seemed to concern evaluators was the knowledge of the artist in fine art illustrations, leading to doubts about the integrity of some images of plants and birds in particular.
All evaluators in this study appeared to be oriented toward issues of sustainability. Human interactions with the environment (use of resources, modifications to and corresponding effects upon) were a common theme that drew comments across all categories of image.
DISCUSSION AND CRITICAL REFLECTION
The results of the study were encouraging in terms of the potential of a rubric for selecting images for environmental education, and informative about viewer responses. However, it is recognized that more exploration is called for, particularly in terms of the criteria employed and the evaluator population. In this study, image criteria were
58
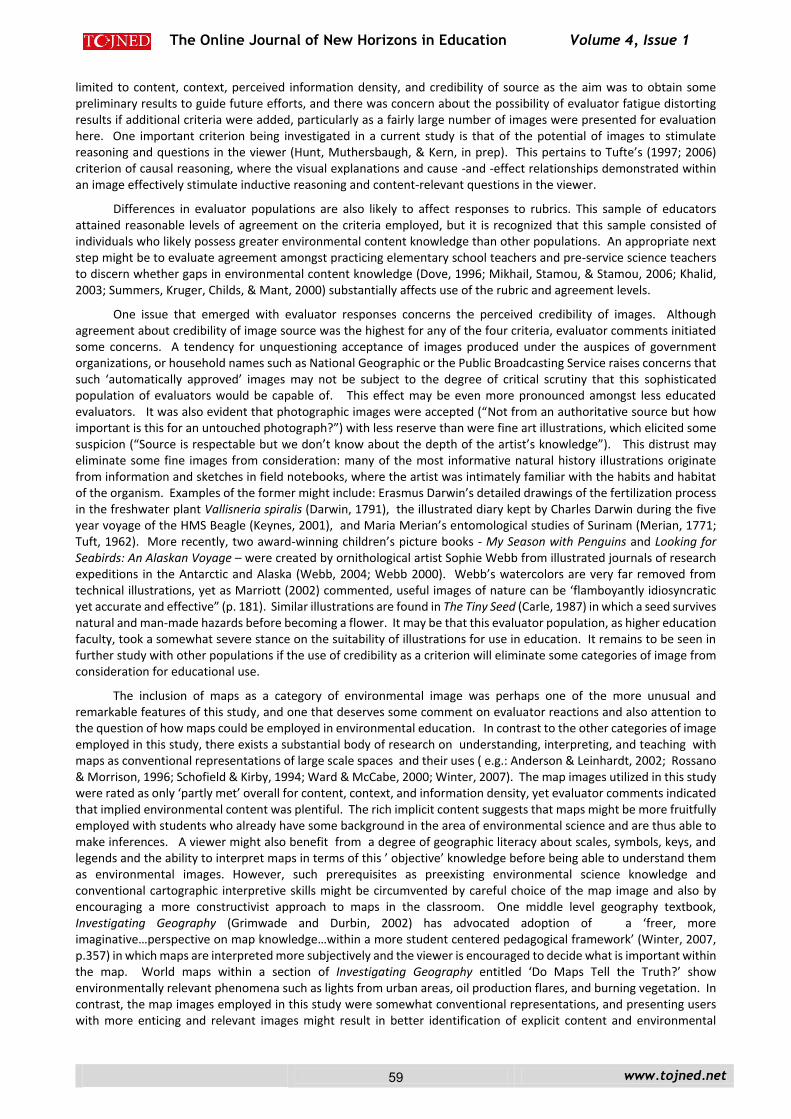
The Online Journal of New Horizons in Education Volume 4, Issue 1
www.tojned.net
limited to content, context, perceived information density, and credibility of source as the aim was to obtain some preliminary results to guide future efforts, and there was concern about the possibility of evaluator fatigue distorting results if additional criteria were added, particularly as a fairly large number of images were presented for evaluation here. One important criterion being investigated in a current study is that of the potential of images to stimulate reasoning and questions in the viewer (Hunt, Muthersbaugh, & Kern, in prep). This pertains to Tufte’s (1997; 2006) criterion of causal reasoning, where the visual explanations and cause -and -effect relationships demonstrated within an image effectively stimulate inductive reasoning and content-relevant questions in the viewer.
Differences in evaluator populations are also likely to affect responses to rubrics. This sample of educators attained reasonable levels of agreement on the criteria employed, but it is recognized that this sample consisted of individuals who likely possess greater environmental content knowledge than other populations. An appropriate next step might be to evaluate agreement amongst practicing elementary school teachers and pre-service science teachers to discern whether gaps in environmental content knowledge (Dove, 1996; Mikhail, Stamou, & Stamou, 2006; Khalid, 2003; Summers, Kruger, Childs, & Mant, 2000) substantially affects use of the rubric and agreement levels.
One issue that emerged with evaluator responses concerns the perceived credibility of images. Although agreement about credibility of image source was the highest for any of the four criteria, evaluator comments initiated some concerns. A tendency for unquestioning acceptance of images produced under the auspices of government organizations, or household names such as National Geographic or the Public Broadcasting Service raises concerns that such ‘automatically approved’ images may not be subject to the degree of critical scrutiny that this sophisticated population of evaluators would be capable of. This effect may be even more pronounced amongst less educated evaluators. It was also evident that photographic images were accepted (“Not from an authoritative source but how important is this for an untouched photograph?”) with less reserve than were fine art illustrations, which elicited some suspicion (“Source is respectable but we don’t know about the depth of the artist’s knowledge”). This distrust may eliminate some fine images from consideration: many of the most informative natural history illustrations originate from information and sketches in field notebooks, where the artist was intimately familiar with the habits and habitat of the organism. Examples of the former might include: Erasmus Darwin’s detailed drawings of the fertilization process in the freshwater plant Vallisneria spiralis (Darwin, 1791), the illustrated diary kept by Charles Darwin during the five year voyage of the HMS Beagle (Keynes, 2001), and Maria Merian’s entomological studies of Surinam (Merian, 1771; Tuft, 1962). More recently, two award-winning children’s picture books - My Season with Penguins and Looking for Seabirds: An Alaskan Voyage – were created by ornithological artist Sophie Webb from illustrated journals of research expeditions in the Antarctic and Alaska (Webb, 2004; Webb 2000). Webb’s watercolors are very far removed from technical illustrations, yet as Marriott (2002) commented, useful images of nature can be ‘flamboyantly idiosyncratic yet accurate and effective” (p. 181). Similar illustrations are found in The Tiny Seed (Carle, 1987) in which a seed survives natural and man-made hazards before becoming a flower. It may be that this evaluator population, as higher education faculty, took a somewhat severe stance on the suitability of illustrations for use in education. It remains to be seen in further study with other populations if the use of credibility as a criterion will eliminate some categories of image from consideration for educational use.
The inclusion of maps as a category of environmental image was perhaps one of the more unusual and remarkable features of this study, and one that deserves some comment on evaluator reactions and also attention to the question of how maps could be employed in environmental education. In contrast to the other categories of image employed in this study, there exists a substantial body of research on understanding, interpreting, and teaching with maps as conventional representations of large scale spaces and their uses ( e.g.: Anderson & Leinhardt, 2002; Rossano & Morrison, 1996; Schofield & Kirby, 1994; Ward & McCabe, 2000; Winter, 2007). The map images utilized in this study were rated as only ‘partly met’ overall for content, context, and information density, yet evaluator comments indicated that implied environmental content was plentiful. The rich implicit content suggests that maps might be more fruitfully employed with students who already have some background in the area of environmental science and are thus able to make inferences. A viewer might also benefit from a degree of geographic literacy about scales, symbols, keys, and legends and the ability to interpret maps in terms of this ’ objective’ knowledge before being able to understand them as environmental images. However, such prerequisites as preexisting environmental science knowledge and conventional cartographic interpretive skills might be circumvented by careful choice of the map image and also by encouraging a more constructivist approach to maps in the classroom. One middle level geography textbook, Investigating Geography (Grimwade and Durbin, 2002) has advocated adoption of a ‘freer, more imaginative…perspective on map knowledge…within a more student centered pedagogical framework’ (Winter, 2007, p.357) in which maps are interpreted more subjectively and the viewer is encouraged to decide what is important within the map. World maps within a section of Investigating Geography entitled ‘Do Maps Tell the Truth?’ show environmentally relevant phenomena such as lights from urban areas, oil production flares, and burning vegetation. In contrast, the map images employed in this study were somewhat conventional representations, and presenting users with more enticing and relevant images might result in better identification of explicit content and environmental
59
The Online Journal of New Horizons in Education Volume 4, Issue 1
www.tojned.net
context.
Despite these caveats, a number of articles in practitioner journals have described successful routes to teaching about environmental science with conventional maps. Woolever (1956) describes use of local city, county, state, national, and world maps in teaching about foods, natural enemies, fisheries, insects, migrations, erosion, agriculture, natural parks, reclamation areas, sanctuaries, hunting areas, soil types, population changes, rainfall, watersheds, climate, altitudes and depths, natural barriers, and artificial boundaries by expanding the function of a map from ‘what is where’ to a vehicle for posing and answering questions about why, when, or how it got there. Locke (1963) employed road maps in biology teaching in elementary and middle grades by having students identify biological terms in town names (e.g., Parsley, Cotton, Buffalo, Coyote, and Salmon) and then tracking down their origin and relevance. Swab (2010) illuminates a college seminar with maps developed during the voyage of the HMS Beagle. Thus it seems that there are routes to developing uses of maps as environmental images , but this particular category of image may require its own carefully scaffolded rubric.
Plants as environmental images also seem somewhat problematic. Given the critical importance of plant life in a sustainable environment, the response of evaluators to the plant images was overall quite disappointingly unenthusiastic. The majority of evaluators had difficulty identifying environmental science content, ranked the plant images low for appropriate context unless placed in a narrative background, and considered few of the images information-dense. It is reasonable to suppose that less scientifically educated viewers would echo this negativity in their responses. This lack of engagement with this category may be a manifestation of the phenomenon of ‘plant-blindness’, defined and described by Wandersee & Schussler (2001) as “the inability to see or notice the plants in one's own environment—leading to: (a) the inability to recognize the importance of plants in the biosphere, and in human affairs; (b) the inability to appreciate the aesthetic and unique biological features of the life forms belonging to the Plant Kingdom; and (c) the misguided, anthropocentric ranking of plants as inferior to animals, leading to the erroneous conclusion that they are unworthy of human consideration” ( p.2). Schussler & Olzak (2008) provided evidence in support of the plant-blindness model by demonstrating that plant images were recalled less frequently than animal images by undergraduates enrolled in psychology and biology classes at a large state university. These authors have proposed that plant-blindness be combated by biology teachers by presentation of equal numbers of plant and animal examples, and selection of the most memorable plant images possible to offset selective attention to animals. In this study, it is possible that the evaluations of content, context, and information richness of the plant images were affected by a zoocentric orientation on the part of the evaluators.
In addition to the overall poor evaluations of the plant images, the specific images rendered by botanical illustrators were also given low rankings for credibility, as the evaluators appeared uncertain of the artists’ credentials in science. Given that botanical illustration as visual scientific description has a long and illustrious history (e.g., Sherwood, Harris, & Juniper, 2005), and is an area of scientific endeavor that is still emerging in the form of image-driven digital plant keys (Simpson, 2011: Valkenburg, Duisstermatt, & Boer, 2013), this response is curious. This lack of appreciation for the field by the evaluators in this study may be a further manifestation of plant-blindness, reflecting the lack of emphasis on botany in life science curricula in recent decades (e.g., Darley 1990; Hershey, 1993, 1996; Nichols, 1919; Uno, 1994): evaluators may simply not have been exposed to scientific botanical illustration. Evaluator comments on the plant images tended to focus on plant—human interactions (e.g., ‘Used around encampments to deter evil spirits’), implicitly supporting the suggestion that ‘plant-blindness’ at all educational levels is most effectively countered by approaching plant study through ethnobotany (Babaian and Twigg, 2011).
The high rankings given by evaluators to images of terrain, and to images of animals situated within a landscape background reinforce the common perception that the allure of attractive landscape images ‘(nature pictures’) increases engagement with the environment. A potential drawback of this response is that an emotionally charged aesthetic response to a landscape may distract and detract from a thoughtful and critical response to the environmental content. Popular concepts of the environment are frequently constructed from a vision of “nature as exotic and idyllic, enigmatic and inscrutable, precarious yet romantic” (Marriott, 2002, p.176) and the educator will not wish to further propagate such misconceptions in the images chosen for environmental education. Landscape images are undoubtedly engaging, but identifying environmental content from images in this category may be especially challenging for those viewers whose encounters with animals consists mostly of contact with domestic pets and zoo inhabitants, who are disconnected from natural landscapes outside of visitor-centers and highway way stations, who are ‘plant-blind’ (Wandersee & Schussler, 2001), and who have no sense of the role of abiotic forces such as water, wind, and sun (Marriott, 2002). Viewers of images intended to educate about the environment will benefit from a visual challenge to their preconceptions, and to be effective, the landscape images presented for this purpose (particularly those in which animals appear) might be deliberately selected to confront both romantic pastoralism and suburban familiarity.
Human interactions with the environment, such as medicinal use of plants, over-fishing, and diversion of water
60
The Online Journal of New Horizons in Education Volume 4, Issue 1
www.tojned.net
resources were the dominant theme of evaluator comments in all four categories of image, echoing and reinforcing other findings that many individuals, including students, are considerably aware of environmental problems due to human activity, although understanding of the mechanisms connecting cause to effect is frequently lacking. Empirical evidence across cultures - the United States, the United Kingdom, Mexico, Australia, Germany, and Russia - indicates that children and teenagers are aware of and concerned about environmental issues, most commonly those of pollution, global warming, lack of water, and deforestation (Barraza, 1999; Hicks & Holden, 2007; Hutchinson, 1997; Strife, 2012). Investigations into these environmental concerns of children and youth have indicated that feelings of helplessness and the ensuing pessimism engendered by this anxiety tends to result in a disengagement from environmental issues and impacts the willingness of youth to engage in pro-environmental behaviors (Barratt & Barratt Hacking, 2003; Connell, Fien, Less, Sykes, & Yencken, 1999; Sobel, 1999). Presentation of thoughtfully selected environmental images might assist in combating this resignation to environmental degradation: it is more difficult to disengage from a striking visual, and such may be effectively used in the classroom and other educational forums as a springboard to conversations that unearth pessimism and redirect this negativity into active engagement with possible solutions. Sobel (1999) has demonstrated in educational practice that children’s connection with the natural world begins locally, in their own neighborhoods and towns. By extension, making environmental connection through images may also be best accomplished by choice of visuals that depict local and otherwise familiar environments and organisms.
A well-designed rubric that takes into account all of the issues previously discussed might considerably facilitate the selection of the richest and most effective images for environmental education, but the ability of educators to utilize the rubric to its fullest capacity is also critical to the selection process. . The extent to which educators understand environmental science concepts, and the causes, mechanics, and effects of environmental issues affects their ability to identify images containing appropriate content, and gaps in knowledge and understanding have been documented at a number of educator levels. Khalid (2003) noted an array of misconceptions about the causes and effects of the greenhouse effect, ozone depletion, and acid rain in pre-service high school teachers. A study of 155 practicing elementary school teachers (Michail et al., 2007) found that although 70% expressed ‘rather great’ or ‘great’ interest in environmental issues, and could frequently identify the human activities contributing to pollution, climate change etc., many were fairly uninformed of the mechanisms of the problems (e.g., the names of specific gases contributing to the greenhouse effect). Other studies of teachers’ ideas about anthropogenically initiated environmental concerns such as acid rain (Dove, 1996; Khalid, 2003)), biodiversity (Gayford, 2000; Summers et al., 2000), the greenhouse effect (Dove, 1996; Khalid, 2003), and depletion of the ozone layer (Boyes, Chamber, & Stanisstreet, 1995; Dove, 1996; Khalid, 2003; Summers et al., 2000) have indicated a similar lack of scientific understanding: findings indicate that many teachers have difficulty distinguishing between issues and separating causes and consequences. Likely contributing factors to this haphazard and inadequate knowledge of environmental issues are: poor quality of information in the mass media (which Michail et al. (2007) found to be the major source of environmental information for many elementary teachers), interference from a romantic image of nature that conceptualizes the natural world as a place of perfect harmony that is endangered by changes and fluctuations (Cooper, 2001; Cuddington, 2001), and a tendency to focus on companion meanings at the expense of cognitive meanings in science education (including environmental science) discourse (Michail et al, 2007). Companion meanings (Roberts, 1998) are the social and humanistic implications that accompany science content, and while these promote engagement and ‘relevance’ of the factual content, student focus on such connections may conceal that underlying content understanding is incomplete or faulty (Michail et al., 2007). It was apparent in this study that even higher education faculty were vulnerable to focusing upon these companion meanings, evidenced by the number of comments that focused on human interactions with the environment. Thus as the process of image selection is further developed and refined, it will be appropriate to develop a rubric designed specifically to orient teachers to the science content of the images rather than companion meanings.
REFERENCES
Anderson, K. C., & Leinhardt, G. (2002). Maps as representations: expert-novice comparisons of projection understanding. Cognition and Instruction, 20(3), 283-328.
61
The Online Journal of New Horizons in Education Volume 4, Issue 1
www.tojned.net
Andrade, A. D. (2009). Interpretive research aiming at theory building: Adopting and adapting the case study design. The Qualitative Report, 14(1), 42-60.
Babaian, C., & Twigg, P. (2011). The power of plants: Introducing ethnobotany and biophilia into your biology class. American Biology Teacher, 73(4), 217-221.
Barratt, R., & Barratt Hacking, E. (2003). Rethinking the geography national curriculum: A case for community relevance. Teaching Geography, 18(2), 29-33.
Barraza, L. (1999). Children's drawings about the environment. Environmental Education Research, 5(1), 49-66.
Bizerril, M. A., Soares, C., & Santos, J. (2011). Linking community communication to conservation of the maned wolf in central Brazil. Environmental Education Research, 17(6), 815 -827.
Boyes, E., Chamber, W., & Stanisstreet, M. (1995). Trainee primary teachers' ideas about the ozone layer. Environmental Education Research, 1(2), 133-145.
Carle, E. (1987). The Tiny Seed. New York: Picture Book Studio.
Coe, J. (2001). Eastern Birds. New York: St. Martin's Press.
Connell, S., Fien, J., Less, J., Sykes, H., & Yencken, D. (1999). If it doesn't directly affect you, you don't think about it: A qualitative study of young people's environmental attitudes in two Australian cities. Environmental Education Research, 5(1), 95-113.
Cooper, G. (2001). Must there be a balance of nature? Biology and Philosophy, 16, 463-479.
Cronbach, L. J. (1951). Coefficient Alpha and the Internal Structure of Tests. Psychometrika, 16(3), 297 - 334.
Cuddington, K. (2001). The "balance of nature" metaphor and equilibrium in population biology. Biology and Philosophy, 16, 463-479.
Darley, W. M. (1990). The essence of "plantness". The American Biology Teacher, 52, 354-357.
Darwin, E. (1791). The lives of the plants (Vol. 2). London: J. Johnson.
Dove, J. (1996). Student teacher understanding of the greenhouse effect, ozone layer depletion, and acid rain. Environmental Education Research, 2(1), 89-100.
Friendly, M. (2013). The Graphic Works of Charles Joseph Minard.
Garcia, L., & Quek. (1997). Qualitative research in information systems: Time to be subjective? International Conference on Information Systems and Qualitative Research. Philadelphia, PA.
Gayford, C. (2000). Biodiversity education: A teacher's perspective. Environmental Education Research, 6(4), 348-361.
Gliem, J. A., & Gliem, R. R. (2003). Calculating, interpreting, and reporting Cronbach's Alpha reliability coefficient for Likert-type scales, 2003 Midwest Research to Practice Conference in Adult, Continuing, and Community Education.
Gordin, M. (2013). Conceptual photography: Idea, process, truth. World Literature Today, 87(2), 76-80.
Grimwade, K., & Durbin, C. (Eds.). (2002). Investigating geography. London: Hodder & Stoughton.
Guba, E. G., & Lincoln, Y. S. (1994). Competing paradigms in qualitative research. In N. K. Denzin, Y. S. Lincoln & N. K. Denzin (Eds.), Handbook of Qualitative Research (pp. 105-117). Thousand Oaks, CA: Sage.
Hershey, D. R. (1993). Plant neglect in biology education. Bioscience, 43, 418-418.
Hershey, D. R. (1996). A historical perspective on problems in botany teaching. The American Biology Teacher, 58, 340-347.
Hicks, D., & Holden, C. (2007). Remembering the future: What do children think? Environmental Education Research, 13, 501-512.
Hunt, V. (2006). Art informing science education: The potential contributions of ornithological illustration to ecology education. The Louisiana State University and Agricultural and Mechanical College, Baton Rouge, LA.
62
The Online Journal of New Horizons in Education Volume 4, Issue 1
www.tojned.net
Hunt, V., Muthersbaugh, D., & Kern, A. Reasoning and questions prompted by four categories of environmental images: In prep.
Hutchinson, F. (1997). Our children's futures: Are there lessons for environmental educators? Environmental Education Research, 3(2), 189-201.
Ito, M. (2008). Seeing Animals, Speaking of Nature: Visual Culture and the Question of the Animal. Theory, Culture, and Society, 25(4), 119-138.
Kaufman, K. (1990). Advanced Birding. New York: Houghton Mifflin Company.
Keynes, R. D. (Ed.). (2001). Charles Darwin's Beagle Diary. Cambridge, UK: Cambridge University Press.
Khalid, T. (2003). Pre-service high school teachers' perceptions of three environmental phenomena. Environmental Education Research, 9(1), 35-50.
King, B. F., Dickinson, E. C., & Woodcock, M. (1975). Birds of southeast Asia. Norfolk, CT: Easton Press.
Lansdowne. (1968). Birds of the eastern forest (Vol. 1). Boston: Houghton Mifflin Company.
Leopold, A. (1970 (1949)). A Sand County almanac: With essays on conservation from Round River. New York: Ballantine Books.
Locke, D. H. (1963). Road maps aid in biological instruction. The American Biology Teacher, 25(4), 265-266.
Marriott, S. (2002). Red in tooth and claw? Images of nature in modern picture books. Children's Literature in Education, 33(3), 175-183.
Matthiesson, P. (1967). The shorebirds of North America. New York: The Viking Press.
Merian, M. S. (1771). Histoire gaenaerale des insectes de Surinam et de toute l'Europe, contenant leurs descriptions, leurs figures, leurs differentes metamorphoses, de maeme que les descriptions des plantes, fleurs & fruits, dont ils se nourissent. Paris: L.C. Desnos.
Michail, S., Stamou, A.G., & Stamou, G.P. (2007). Greek primary teachers' understanding of current environmental issues: An exploration of their environmental knowledge and images of nature. Science Education, 91, 244-259.
Minard, C.J. (1869) Napoleon's March to Moscow. In K. Borner and D. Macpherson (Eds.), 1st Iteration (2005): The Power of Maps. Places & Spaces: Mapping Science. Retrieved from:
http://scimaps.org/maps/map/napoleons_march_to_m_9/
Muthersbaugh, D., & Kern, A. (2012). Pre-service teachers' use of images in integrating environmental sustainability lessons. Journal of Teacher Education for Sustainability, 14(1), 67-79.
Nichols, G. E. (1919). The general botany course and the teaching of elementary botany and zoology in American colleges and universities. Science 50, 509-517.
Roberts, D. A. (1998). Analyzing school science courses: the concept of companion meaning. In D. A. Roberts & L. Ostman (Eds.), Problems of meaning in science curriculum (pp. 5-12). New York: Teachers College Press.
Robin, H. (1992). The scientific image from cave to computer. New York: Harry N. Abrams, Inc.
Rossano, M. T., & Morrison, T. T. (1996). Learning from maps: General processes and map-structure influences. Cognition and Instruction, 14(1), 109-129.
Schofield, N. T., & Kirby, J. R. (1994). Position location on topographical maps: Effects of task factors, training, and strategies. Cognition and Instruction, 12(1), 15.
Schussler, E. E., & Olzak, L. A. (2008). It's not easy being green: student recall of plant and animal images. Journal of Biological Education, 42(3), 112-118.
Sherwood, S., Harris, S. A., & Juniper, B. E. (2005). A new flowering: 1000 years of botanical art. Oxford, UK: Ashmolean Museum.
Simpson, N. (2011). Colour and contemporary digital botanical illustration. Optics and Laser Technology, 43(2), 330-336.
Sobel, D. (1999). Beyond ecophobia. In: YES! Magazine: Education for Life. Retrieved from: http://www.yesmagazine.org/issues/education-for-life/803
63
The Online Journal of New Horizons in Education Volume 4, Issue 1
www.tojned.net
Strife, S. J. (2012). Children's environmental concerns: Expressing ecophobia. The Journal of Environmental Education, 43(1), 37-55.
Summers, M., Kruger, C., Childs, A., & Mant, J. (2000). Primary school teachers' understanding of environmental issues: An interview study. Environmental Education Research, 6(4), 293-312.
Swab, J. C. (2010). Introducing students to Darwin via the voyage of the HMS Beagle. The American Biology Teacher, 72(5), 281-286.
Tuft, E. (1962). A Surinam portfolio. Natural History, 71(10), 28-41.
Tufte, E. R. (1983). The visual display of quantitative information. Cheshire, CT.: Graphics Press.
Tufte, E. R. (1990). Envisioning information. Cheshire, CT.: Graphics Press.
Tufte, E. R. (1997). Visual explanations. Cheshire, CT: Graphics Press.
Tufte, E. R. (2006). Beautiful evidence. Cheshire, CT: Graphics Press.
Uno, G. E. (1994). The state of precollege botanical education. The American Biology Teacher, 56, 263-267.
Valkenburg, J. L. C. H., Duisstermatt, H., & Boer, E. (2013). Image-driven electronic identification keys for invasive plant species in the Netherlands. EPPO Bulletin, 43(2), 250-254.
Wandersee, J. H., & Schussler, E. E. (2001). Toward a theory of plant blindness. Plant Science Bulletin, 47(1), 2-9.
Ward, R. M., & McCabe, C. (2000). Plat maps as a history and geography teaching tool. The History Teacher, 33(2), 153-173.
Webb, S. (2000). My season with penguins. Boston: Houghton Mifflin.
Webb, S. (2004). Looking for seabirds: Journal from an Alaskan voyage. Boston: Houghton Mifflin.
Winter, C. (2007). Just maps: The geography curriculum in English schools. Oxford Review of Education, 33(3), 349-366.
Woolever, J. D. (1956). Using Maps as a Teaching Aid in Biology. The American Biology Teacher, 18(2), 17-19.
64

The Online Journal of New Horizons in Education Volume 4, Issue 1
www.tojned.net
APPENDIX 1
Rubric for Environmental Image Selection
Criteria based on Tufte’s (1983; 1990; 1997; 2006) Visual Information Theory
Reviewer Name _______________________________________________
Image Title______________________________________________ Image Number _______
Criterion 1: Content - The image is rich in explicit and implicit environmentally relevant science content. Question: Does the image explicitly depict environmental science content?
Examples of possible content based on National Science Content Standards (NRC, 1996): a) Interdependence of organisms.
___ The image depicts an ecosystem (biological and physical community of interacting organisms). ___ The image depicts organisms engaged in interactions beneficial to one or more of the participant species, by providing food, shelter, or some other resource. ___ The image depicts organisms competing or engaged in interactions, which have negative effects on one or more of the participant species (such as predation). ___ The image depicts modifications to the natural ecosystem by humans. ___ The image depicts or suggests negative results of ecosystem modifications by humans (E.g., pollution, over-harvesting, atmospheric changes). b) Population growth and natural resources)
___ The image depicts an ecosystem reaching its carrying capacity (number of people in relation to resources able to support the given environment). ___ The image depicts humans using natural resources to improve quality of life.
Fully Met-
4
Mostly Met-3
Partly Met-2
Not Met-
1
☐ ☐ ☐ ☐
Comments: Please note the content you identify in this image
Criterion 2: Context - The image shows content in an accurate environmental context.
Question: Does the image portray organisms in an accurate environmental context, and does the image emphasize environmental science content and data rather than decorative elements?
Examples of accurate contextual environmental content: (e.g., a giraffe in a
savannah eating acacia leaves.)
Fully Met-
4
Mostly Met-3
Partly Met-2
Not Met-
1
☐ ☐ ☐ ☐
Comments:
65
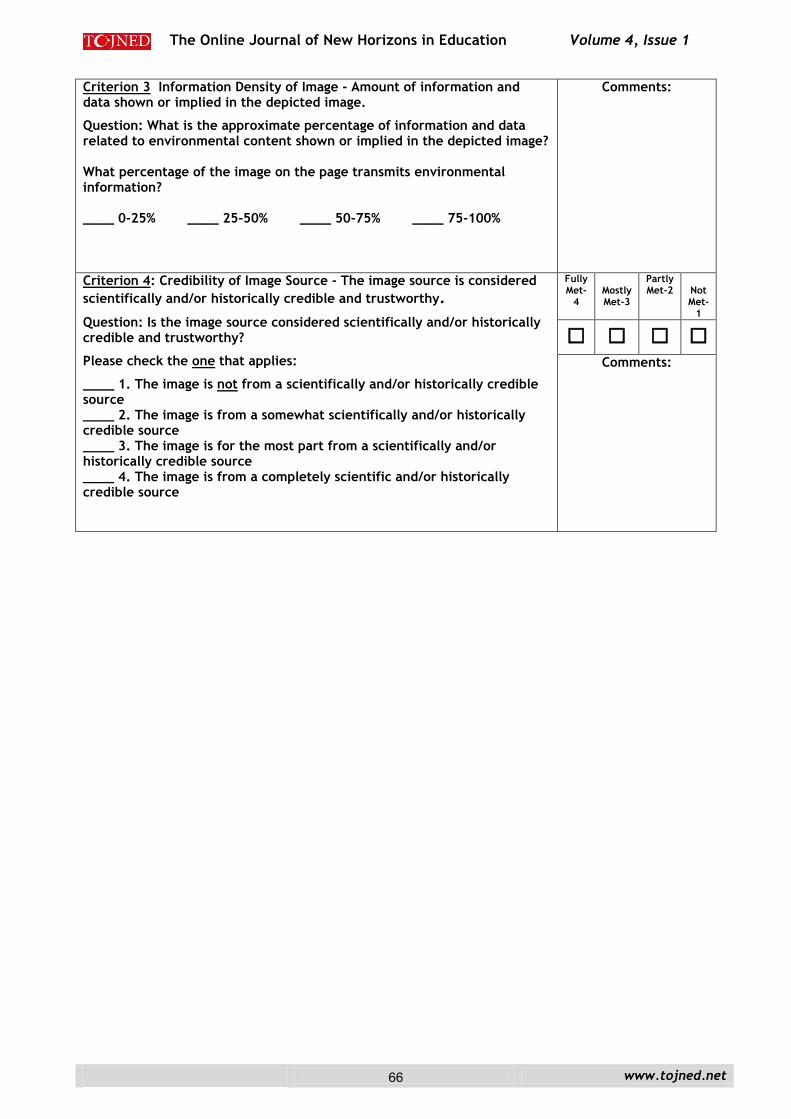
The Online Journal of New Horizons in Education Volume 4, Issue 1
www.tojned.net
Criterion 3 Information Density of Image - Amount of information and data shown or implied in the depicted image.
Question: What is the approximate percentage of information and data related to environmental content shown or implied in the depicted image? What percentage of the image on the page transmits environmental information? ____ 0-25% ____ 25-50% ____ 50-75% ____ 75-100%
Comments:
Criterion 4: Credibility of Image Source - The image source is considered
scientifically and/or historically credible and trustworthy.
Question: Is the image source considered scientifically and/or historically credible and trustworthy?
Please check the one that applies:
____ 1. The image is not from a scientifically and/or historically credible source ____ 2. The image is from a somewhat scientifically and/or historically credible source ____ 3. The image is for the most part from a scientifically and/or historically credible source ____ 4. The image is from a completely scientific and/or historically credible source
Fully Met-
4
Mostly Met-3
Partly Met-2
Not Met-
1
☐ ☐ ☐ ☐ Comments:
66
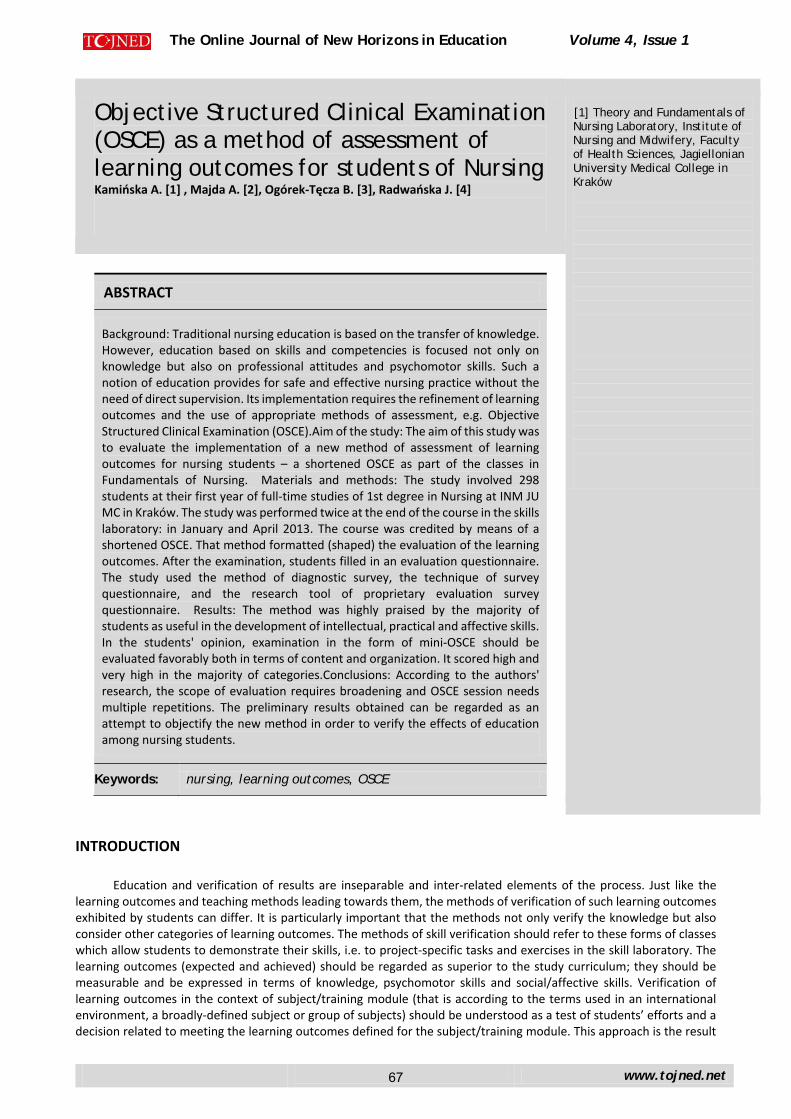
The Online Journal of New Horizons in Education Volume 4, Issue 1
Objective Structured Clinical Examination (OSCE) as a method of assessment of learning outcomes for students of Nursing Kamińska A. [1] , Majda A. [2], Ogórek-Tęcza B. [3], Radwańska J. [4]
[1] Theory and Fundamentals of Nursing Laboratory, Institute of Nursing and Midwifery, Faculty of Health Sciences, Jagiellonian University Medical College in Kraków
ABSTRACT
Background: Traditional nursing education is based on the transfer of knowledge. However, education based on skills and competencies is focused not only on knowledge but also on professional attitudes and psychomotor skills. Such a notion of education provides for safe and effective nursing practice without the need of direct supervision. Its implementation requires the refinement of learning outcomes and the use of appropriate methods of assessment, e.g. Objective Structured Clinical Examination (OSCE).Aim of the study: The aim of this study was to evaluate the implementation of a new method of assessment of learning outcomes for nursing students – a shortened OSCE as part of the classes in Fundamentals of Nursing. Materials and methods: The study involved 298 students at their first year of full-time studies of 1st degree in Nursing at INM JU MC in Kraków. The study was performed twice at the end of the course in the skills laboratory: in January and April 2013. The course was credited by means of a shortened OSCE. That method formatted (shaped) the evaluation of the learning outcomes. After the examination, students filled in an evaluation questionnaire. The study used the method of diagnostic survey, the technique of survey questionnaire, and the research tool of proprietary evaluation survey questionnaire. Results: The method was highly praised by the majority of students as useful in the development of intellectual, practical and affective skills. In the students' opinion, examination in the form of mini-OSCE should be evaluated favorably both in terms of content and organization. It scored high and very high in the majority of categories.Conclusions: According to the authors' research, the scope of evaluation requires broadening and OSCE session needs multiple repetitions. The preliminary results obtained can be regarded as an attempt to objectify the new method in order to verify the effects of education among nursing students.
Keywords: nursing, learning outcomes, OSCE
INTRODUCTION
Education and verification of results are inseparable and inter-related elements of the process. Just like the learning outcomes and teaching methods leading towards them, the methods of verification of such learning outcomes exhibited by students can differ. It is particularly important that the methods not only verify the knowledge but also consider other categories of learning outcomes. The methods of skill verification should refer to these forms of classes which allow students to demonstrate their skills, i.e. to project-specific tasks and exercises in the skill laboratory. The learning outcomes (expected and achieved) should be regarded as superior to the study curriculum; they should be measurable and be expressed in terms of knowledge, psychomotor skills and social/affective skills. Verification of learning outcomes in the context of subject/training module (that is according to the terms used in an international environment, a broadly-defined subject or group of subjects) should be understood as a test of students’ efforts and a decision related to meeting the learning outcomes defined for the subject/training module. This approach is the result
www.tojned.net
67
The Online Journal of New Horizons in Education Volume 4, Issue 1
of the tasks contained in the Bologna Declaration signed on 19 June 1999 by the Ministers of Education of 29 countries, including Poland, and by the Ministers of other 11 countries in 2005, in order to create a harmonious system of higher education in Europe, and in the National Qualifications Framework for Higher Education in the amended Act – the Law on Higher Education in 2011 [1, 2, 3, 4, 5, 6, 7, 8].
The effectiveness of training is often used interchangeably with the ‘effectiveness of teaching,’ ‘teaching efficiency’ or the ‘efficacy of training.’ The term is not only understood differently, but also evaluated and investigated from different perspectives, e.g. in terms of educational, economic and sociological background. From a pedagogical point of view, it is the information related to the learning and teaching results achieved by students, reflected in assessments and in promotion to further years of study [9].
According to U. Jeruszka [10], the effectiveness of vocational training is the relevance between the effects of vocational training and the adopted objectives of that training, i.e. the degree of achievement, with evaluation of the scope and level of these objectives, considering the job requirements for their formulation, with minimal means and resources in the process of achieving these outcomes.
The effectiveness of training is often equated with the quality of education understood as ‘fitting for purpose’ or meeting social needs – the ones which are observed and expected. Constructing a training program based on professional qualification standards and their accreditation are some of the elements that guarantee the provision of educational quality [8, 11].
Achievement of the expected learning outcomes is possible while respecting the taxonomy of purposes, or arranging them in order of importance. The taxonomy of educational objectives by B. S. Bloom is the most well-known taxonomy in and outside Poland. The theory and practice related to learning objectives in Polish didactics was extensively developed by B. Niemierko. He divided the purposes into cognitive, practical and motivational classes. The use of taxonomies in vocational education enforces the use of such modern teaching methods by academics that allow students to achieve their objectives independently [8, 12, 13, 14]. So far, in the vocational training of nurses, attempts were made to formulate learning objectives in terms of taxonomy, especially in the specialization subjects (the fundamentals of nursing, specialist nursing), and to a much lesser extent or not at all in the core subjects (anatomy, physiology, psychology, pedagogy) [15]. Development of educational objectives may become the basis for standardization of measurement tools [12].
Monitoring and evaluation are integral to the teaching-learning process [16]. Vocational training at schools of nursing should distinguish three types of assessment [8]:
- Formative assessment defined as current assessment carried out in the course of theoretical and practical training designed to detect and remove defects in students’ information and skills, stimulating their development, abilities and interests, and implementing self-control and self-evaluation.
- Summative or final assessment carried out at the end of an educational stage, .e.g. a module or year of study. The purpose of this assessment is to determine the degree of students’ achievement of educational goals adopted for a given stage. This assessment requires identifying at least one qualification for students to master at a given stage of education as separated from the whole structure of professional qualifications. It enables further education on a higher level. An applicant for admission to second-degree studies in nursing must already have the first-level qualifications (knowledge, skills, attitudes) and competences (qualifications, responsibility, authority) necessary for continuing education at second-cycle studies of nursing.
- Formal assessment carried out at the end of the whole cycle of training, the aim of which is to confirm the overall professional qualifications obtained by the student. It is used to formulate opinions on the effectiveness and accuracy of university’s work.
So far, there has been no single method identified as effective in all the cases of practical training assessment in relation to students of nursing. Literature presents various methods to evaluate the students of nursing and dentistry: a list of skills [17, 18], a form of clinical profile [8], a test with multiple-choice questions unrelated to the clinical context (Multiple Choice Question), a test with multiple-choice questions based on clinical cases (Case-based Multiple Choice Question), a written examination (essay), every-day clinical assessment (daily evaluation), one-time immediate observation (single direct observation), long-term evaluation (longitudinal assessment), immediate monitoring of procedural skills (direct observation of procedural skills), record review, Triple Jump Exercise, assessment based on portfolio (portfolio), self-evaluation performed by the student (student’s self-assessment), computer-based simulation, evaluation of the scientific report and presentation (paper and presentation assessment), assessment based on the number of required treatments (unit requirements), 360-degree assessment, critical and summative task assessment (Critically Appraised Topic Summary), Clinical Competency Examination and OSCE (Objective Structured Clinical Examination) [19, 20].
www.tojned.net
68
The Online Journal of New Horizons in Education Volume 4, Issue 1
To date in Poland, there has been no study presenting the use of the OSCE-type examination methods in practice;
few studies are devoted to theoretical considerations [19, 20, 21, 22]. Several years ago, that form of examination in selected subjects was introduced at the Medical Institute at the Faculty of Medicine and Dentistry in Kraków, and in 2013 in relation to Nursing and The Fundamentals of Nursing at the Faculty of Health Sciences for full-time first-degree studies. The above-mentioned form examination method was introduced after the teachers of nursing completed the course in "Advanced Techniques in Medical Education" as part of the project entitled "Pro bono Collegii Medici Universitatis Jagiellonicae" carried out in 2010-2013 by the Jagiellonian University Medical College under the Operational Programme Human Capital (Priority IV, Higher Education and Science, Measure 4.1 Strengthening and developing the didactic potential of universities and increasing the number of graduates of key importance to the knowledge-based economy, Sub-Measure 4.1.1 Strengthening the capacity of university teaching potential).
Literature mentions different terms for OSCE: as a form, a method of examination, and a clinical skills assessment tool [19, 20, 21, 22]. For the purposes of this article the authors adopted the term of ‘the method of assessment of learning outcomes’. OSCE is considered the "gold standard", a model for the assessment of clinical skills in the field of clinical sciences [23]. In Western Europe (especially the UK), the United States of America and in Canada it has been used for several years now and already is an integral part of medical education, although, as based on the questionnaire surveys among 93% of dental schools (43/45) in the USA, Albino et al. [as cited in: 20, pp. 469] showed that the most common method in the evaluation of training results/outcomes of dental students is a multiple-choice test based on clinical cases (16%) and OSCE is rarely used (3%). The method was introduced in 1970 by R. Harden. It is used for standardized assessment of skills in simulation conditions. It can be also used as formative or formal examination. It is designed to assess such competencies as interviewing the patient, performing physical examination, dealing with ethical issues in a variety of clinical situations, patient education and counseling, exhibiting technical skills (blood pressure measurement), coping with life-threatening conditions (for the patient), being able to communicate, evaluating the patient's mental status and interpreting clinical data [21, 22, 24, 25]. For the training of nurses and midwives, it can be used to monitor vital signs or perform personal hygiene activities [19], etc. Competencies are assessed by special lists (checklists) while rotating students through a series of stations where they perform specific tasks. These actions are observed by the examiners. Typically, each task is awarded 1 or 0 points. However, exceptions to this rule are possible, depending on the importance of the assessed activity. Negative points are usually not awarded, except the cases of gross negligence. It is assumed that the optimal number of stations is 14-18, with about 10 minutes to perform each of them (the acceptable range is 7-20 minutes, depending on the complexity of task). The time for each station also depends on the total number of tasks and people taking part in the examination [24, 26]. Stations may also be related to one another: one examines clinical skills, another one examines the synthesis of information, another one assesses the ability to interpret the information and the ability to think critically. Thematic division of stations is possible, e.g. if the examination consists of 10 stations, 3 of them deal with the physical examination, another 3 deal with patient interview, another 3 are related to communication, and 1 station contains a question that must be answered [27].
AIM OF THE STUDY
The aim of this study was to evaluate the implementation of a new method of assessment of learning outcomes for nursing students – a shortened OSCE as part of the classes in Fundamentals of Nursing.
MATERIAL AND METHODS
The study involved 298 students of Nursing at their first year of full-time 1st degree studies at the Institute of Nursing and Midwifery, Faculty of Health Sciences in the Jagiellonian University Medical College. The study was performed twice at the end of the course in the skills laboratory as part of the subject entitled ‘The Fundamentals of Nursing – classes’ in January (the winter semester) and April (the summer semester) 2013. The course could be credited by means of a shortened OSCE. The method formatted (shaped) the evaluation of learning outcomes. Due to the limitations of staff and time and its pilot nature, the study took a shortened form. Also some of its assumptions were modified, i.e. a student would draw a ticket with one of the 4 stations, but it would take him/her 15 minutes to do the entire task because the preparatory, proper and cleaning activities making up the performance of a given procedure (nursing, diagnosis, treatment, rehabilitation) were linked. In accordance with a special list (checklist) tasks were evaluated in terms of knowledge (each station resulted with a response to one of the several questions prepared), technical skills (the first (winter) semester: re-making the bed with the patient in it, arterial blood pressure taking, insulin administration using an insulin pen, inhaling the patient; the second (summer) semester: measuring capillary blood drawn from the patient’s finger and determining the level of blood glucose, inserting an intravenous cannula, preparing and connecting drip infusion, sterile perineum washing) and communication skills. The correctness of each task performed by individual students in simulation conditions was verified by two teachers.
www.tojned.net
69
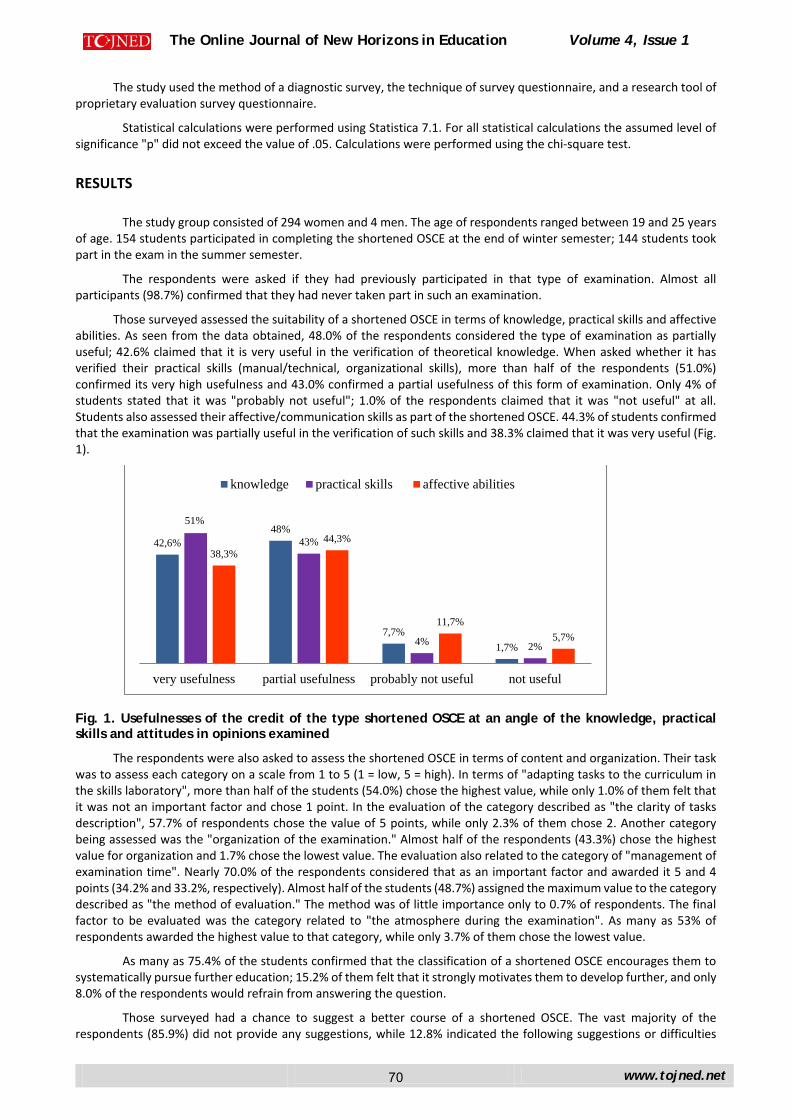
The Online Journal of New Horizons in Education Volume 4, Issue 1
The study used the method of a diagnostic survey, the technique of survey questionnaire, and a research tool of
proprietary evaluation survey questionnaire.
Statistical calculations were performed using Statistica 7.1. For all statistical calculations the assumed level of significance "p" did not exceed the value of .05. Calculations were performed using the chi-square test.
RESULTS
The study group consisted of 294 women and 4 men. The age of respondents ranged between 19 and 25 years of age. 154 students participated in completing the shortened OSCE at the end of winter semester; 144 students took part in the exam in the summer semester.
The respondents were asked if they had previously participated in that type of examination. Almost all participants (98.7%) confirmed that they had never taken part in such an examination.
Those surveyed assessed the suitability of a shortened OSCE in terms of knowledge, practical skills and affective abilities. As seen from the data obtained, 48.0% of the respondents considered the type of examination as partially useful; 42.6% claimed that it is very useful in the verification of theoretical knowledge. When asked whether it has verified their practical skills (manual/technical, organizational skills), more than half of the respondents (51.0%) confirmed its very high usefulness and 43.0% confirmed a partial usefulness of this form of examination. Only 4% of students stated that it was "probably not useful"; 1.0% of the respondents claimed that it was "not useful" at all. Students also assessed their affective/communication skills as part of the shortened OSCE. 44.3% of students confirmed that the examination was partially useful in the verification of such skills and 38.3% claimed that it was very useful (Fig. 1).
Fig. 1. Usefulnesses of the credit of the type shortened OSCE at an angle of the knowledge, practical skills and attitudes in opinions examined
The respondents were also asked to assess the shortened OSCE in terms of content and organization. Their task was to assess each category on a scale from 1 to 5 (1 = low, 5 = high). In terms of "adapting tasks to the curriculum in the skills laboratory", more than half of the students (54.0%) chose the highest value, while only 1.0% of them felt that it was not an important factor and chose 1 point. In the evaluation of the category described as "the clarity of tasks description", 57.7% of respondents chose the value of 5 points, while only 2.3% of them chose 2. Another category being assessed was the "organization of the examination." Almost half of the respondents (43.3%) chose the highest value for organization and 1.7% chose the lowest value. The evaluation also related to the category of "management of examination time". Nearly 70.0% of the respondents considered that as an important factor and awarded it 5 and 4 points (34.2% and 33.2%, respectively). Almost half of the students (48.7%) assigned the maximum value to the category described as "the method of evaluation." The method was of little importance only to 0.7% of respondents. The final factor to be evaluated was the category related to "the atmosphere during the examination". As many as 53% of respondents awarded the highest value to that category, while only 3.7% of them chose the lowest value.
As many as 75.4% of the students confirmed that the classification of a shortened OSCE encourages them to systematically pursue further education; 15.2% of them felt that it strongly motivates them to develop further, and only 8.0% of the respondents would refrain from answering the question.
Those surveyed had a chance to suggest a better course of a shortened OSCE. The vast majority of the respondents (85.9%) did not provide any suggestions, while 12.8% indicated the following suggestions or difficulties
42,6%48%
7,7%1,7%
51%
43%
4% 2%
38,3%44,3%
11,7%5,7%
very usefulness partial usefulness probably not useful not useful
knowledge practical skills affective abilities
www.tojned.net
70
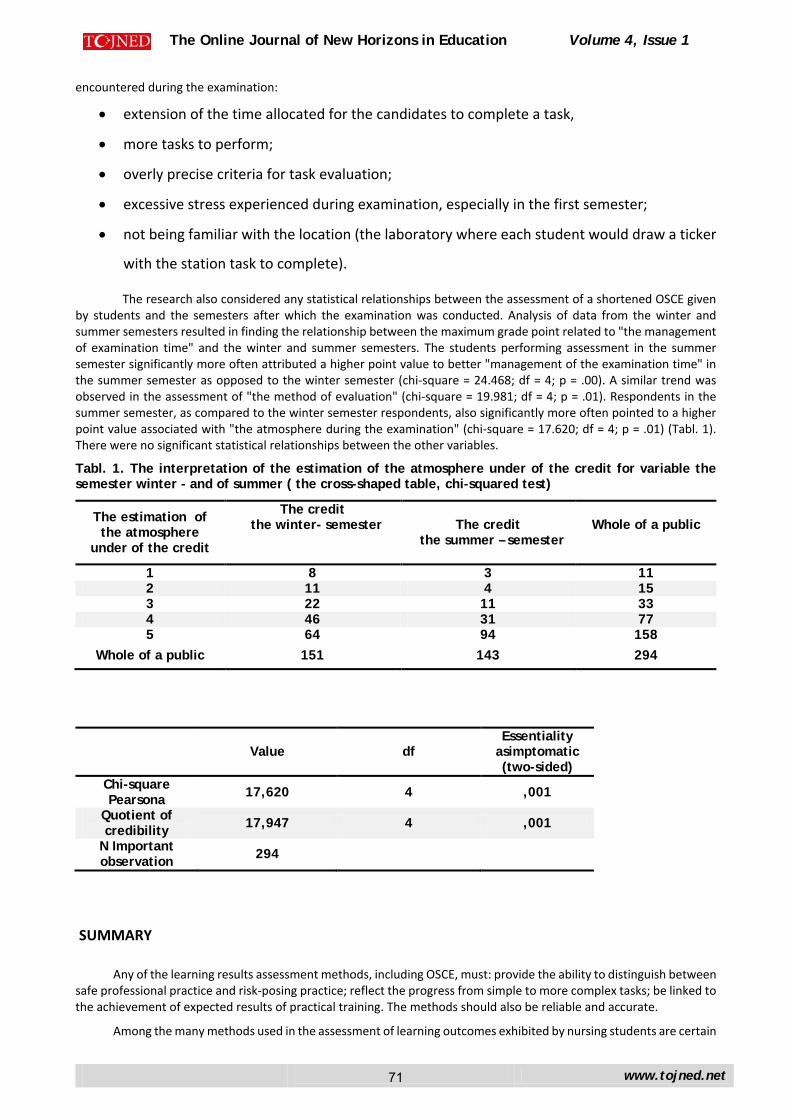
The Online Journal of New Horizons in Education Volume 4, Issue 1
encountered during the examination:
• extension of the time allocated for the candidates to complete a task,
• more tasks to perform;
• overly precise criteria for task evaluation;
• excessive stress experienced during examination, especially in the first semester;
• not being familiar with the location (the laboratory where each student would draw a ticker
with the station task to complete).
The research also considered any statistical relationships between the assessment of a shortened OSCE given by students and the semesters after which the examination was conducted. Analysis of data from the winter and summer semesters resulted in finding the relationship between the maximum grade point related to "the management of examination time" and the winter and summer semesters. The students performing assessment in the summer semester significantly more often attributed a higher point value to better "management of the examination time" in the summer semester as opposed to the winter semester (chi-square = 24.468; df = 4; p = .00). A similar trend was observed in the assessment of "the method of evaluation" (chi-square = 19.981; df = 4; p = .01). Respondents in the summer semester, as compared to the winter semester respondents, also significantly more often pointed to a higher point value associated with "the atmosphere during the examination" (chi-square = 17.620; df = 4; p = .01) (Tabl. 1). There were no significant statistical relationships between the other variables.
Tabl. 1. The interpretation of the estimation of the atmosphere under of the credit for variable the semester winter - and of summer ( the cross-shaped table, chi-squared test)
The estimation of the atmosphere
under of the credit
The credit the winter- semester
The credit the summer – semester
Whole of a public
1 8 3 11 2 11 4 15 3 22 11 33 4 46 31 77 5 64 94 158
Whole of a public 151 143 294
Value df Essentiality
asimptomatic (two-sided)
Chi-square Pearsona 17,620 4 ,001
Quotient of credibility 17,947 4 ,001
N Important observation 294
SUMMARY
Any of the learning results assessment methods, including OSCE, must: provide the ability to distinguish between safe professional practice and risk-posing practice; reflect the progress from simple to more complex tasks; be linked to the achievement of expected results of practical training. The methods should also be reliable and accurate.
Among the many methods used in the assessment of learning outcomes exhibited by nursing students are certain
www.tojned.net
71
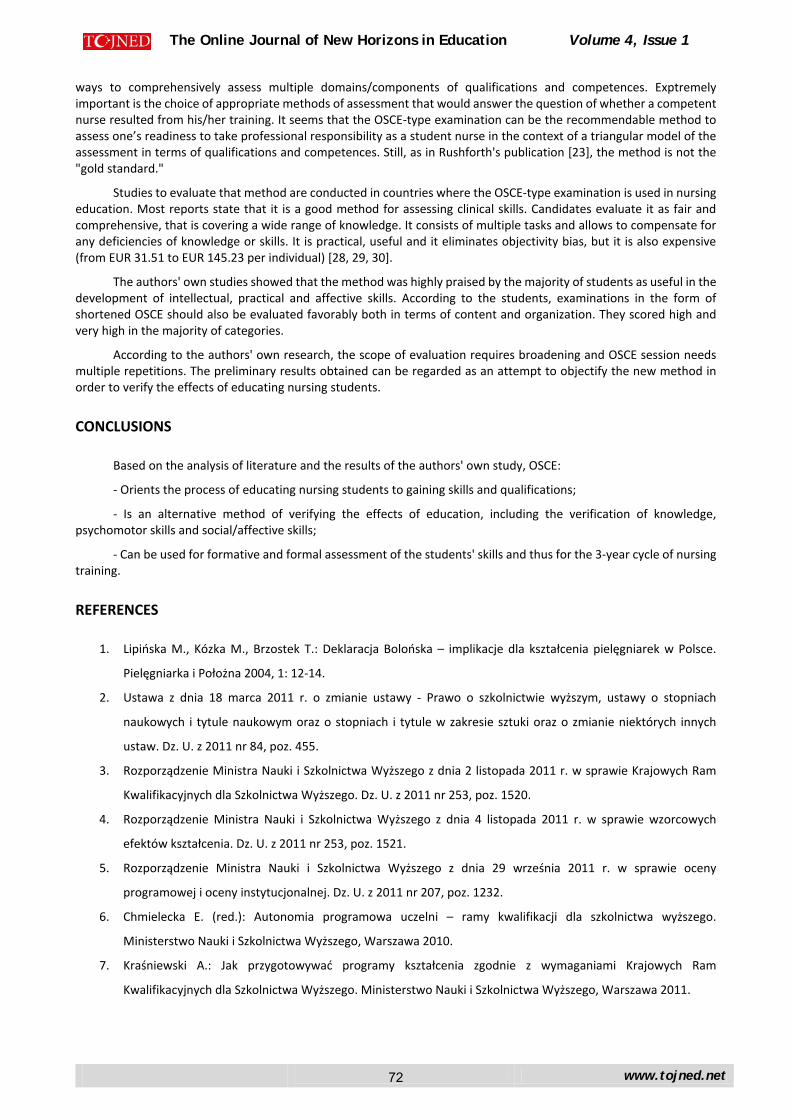
The Online Journal of New Horizons in Education Volume 4, Issue 1
ways to comprehensively assess multiple domains/components of qualifications and competences. Exptremely important is the choice of appropriate methods of assessment that would answer the question of whether a competent nurse resulted from his/her training. It seems that the OSCE-type examination can be the recommendable method to assess one’s readiness to take professional responsibility as a student nurse in the context of a triangular model of the assessment in terms of qualifications and competences. Still, as in Rushforth's publication [23], the method is not the "gold standard."
Studies to evaluate that method are conducted in countries where the OSCE-type examination is used in nursing education. Most reports state that it is a good method for assessing clinical skills. Candidates evaluate it as fair and comprehensive, that is covering a wide range of knowledge. It consists of multiple tasks and allows to compensate for any deficiencies of knowledge or skills. It is practical, useful and it eliminates objectivity bias, but it is also expensive (from EUR 31.51 to EUR 145.23 per individual) [28, 29, 30].
The authors' own studies showed that the method was highly praised by the majority of students as useful in the development of intellectual, practical and affective skills. According to the students, examinations in the form of shortened OSCE should also be evaluated favorably both in terms of content and organization. They scored high and very high in the majority of categories.
According to the authors' own research, the scope of evaluation requires broadening and OSCE session needs multiple repetitions. The preliminary results obtained can be regarded as an attempt to objectify the new method in order to verify the effects of educating nursing students.
CONCLUSIONS
Based on the analysis of literature and the results of the authors' own study, OSCE:
- Orients the process of educating nursing students to gaining skills and qualifications;
- Is an alternative method of verifying the effects of education, including the verification of knowledge, psychomotor skills and social/affective skills;
- Can be used for formative and formal assessment of the students' skills and thus for the 3-year cycle of nursing training.
REFERENCES
1. Lipińska M., Kózka M., Brzostek T.: Deklaracja Bolońska – implikacje dla kształcenia pielęgniarek w Polsce.
Pielęgniarka i Położna 2004, 1: 12-14.
2. Ustawa z dnia 18 marca 2011 r. o zmianie ustawy - Prawo o szkolnictwie wyższym, ustawy o stopniach
naukowych i tytule naukowym oraz o stopniach i tytule w zakresie sztuki oraz o zmianie niektórych innych
ustaw. Dz. U. z 2011 nr 84, poz. 455.
3. Rozporządzenie Ministra Nauki i Szkolnictwa Wyższego z dnia 2 listopada 2011 r. w sprawie Krajowych Ram
Kwalifikacyjnych dla Szkolnictwa Wyższego. Dz. U. z 2011 nr 253, poz. 1520.
4. Rozporządzenie Ministra Nauki i Szkolnictwa Wyższego z dnia 4 listopada 2011 r. w sprawie wzorcowych
efektów kształcenia. Dz. U. z 2011 nr 253, poz. 1521.
5. Rozporządzenie Ministra Nauki i Szkolnictwa Wyższego z dnia 29 września 2011 r. w sprawie oceny
programowej i oceny instytucjonalnej. Dz. U. z 2011 nr 207, poz. 1232.
6. Chmielecka E. (red.): Autonomia programowa uczelni – ramy kwalifikacji dla szkolnictwa wyższego.
Ministerstwo Nauki i Szkolnictwa Wyższego, Warszawa 2010.
7. Kraśniewski A.: Jak przygotowywać programy kształcenia zgodnie z wymaganiami Krajowych Ram
Kwalifikacyjnych dla Szkolnictwa Wyższego. Ministerstwo Nauki i Szkolnictwa Wyższego, Warszawa 2011.
www.tojned.net
72
The Online Journal of New Horizons in Education Volume 4, Issue 1
8. Kózka M.: Efektywność kształcenia zawodowego na studiach pielęgniarskich pierwszego stopnia w okresie
transformacji systemu edukacji. Uniwersyteckie Wydawnictwo Medyczne „Vesalius”, Kraków 2008.
9. Nowacki T.W., Korabiowska-Nowacka K., Baraniak B.: Nowy Słownik Pedagogiki pracy. WSP TWP, Warszawa
2000.
10. Jeruszka U.: Efektywność kształcenia zawodowego. Kształcenie zawodowe a rynek pracy. IPiSS, Warszawa
2000.
11. Szubański R.: Elementy systemu zapewniania jakości w kształceniu zawodowym. Nowa Edukacja Zawodowa
2000, 2: 31-36.
12. Niemierko B.: Pomiar wyników kształcenia zawodowego. BKKK, Warszawa 1997.
13. Ochenduszko J.: Planowanie pracy dydaktycznej nauczyciela. Wyd. II. WOM, Bydgoszcz 1999.
14. Denek K., Kuźniak I.: Projektowanie celów kształcenia w reformowanej szkole. Wyd. Eruditus, Poznań 2001.
15. Ogarek M.: Taksonomia celów kształcenia zawodowego pielęgniarek – teoria i praktyka. Annales Academiae
Medicae Lodzensis 2002, 2: 60-62.
16. Okoń W.: Słownik Pedagogiczny. PWN, Warszawa 1997.
17. Różyczka E., Majda A., Walewska E., Kózka M., Brzostek T., Czaja E., Gajos M.: Przygotowanie pielęgniarek-
mentorów do prowadzenia zajęć praktycznych ze studentami pielęgniarstwa. Wydawnictwo UJ, Kraków 2004.
18. Ziarko E. (red.): Przewodnik dydaktyczny dla pielęgniarek opiekunów praktyk zawodowych. Skrzat, Kraków
2005.
19. Woźniak K.: Egzaminowanie w przebiegu kształcenia podyplomowego pielęgniarek i położnych oraz propozycja
implementacji egzaminowania typu OSCE. Pielęgniarstwo XXI wieku 2012, 2(39): 63-67.
20. Kaczmarek U.: Assessment methods of the effects of dental students’ education. J Stoma 2011, 64, 7: 457-475.
21. Zaawansowane techniki edukacyjne w naukach medycznych. Kurs zaawansowany – Nowoczesne metody
dydaktyczne w kształceniu pielęgniarek i położnych. Projekt „Pro bono Collegii Medici Universitatis
Jagiellonicae. Materiały źródłowe, Kraków 31 stycznia - 2 luty 2012.
22. Mirecka J.: Standaryzowane formy sprawdzania umiejętności praktycznych. Dostępne pod
adresem: www.umlub.pl (data dostępu: 10.11.2012).
23. Rushforth H.E.: Objective structured clinical examination (OSCE): Review of literature and implications for
nursing education. Nurse Education Today 2007, 27: 481-490.
24. Harden R.M., Dent J.: Apractical guide for medical teachers. Wydawnictwo Elsevier, Oxford 2009.
25. Ward H., Barratt J.: Assessment of nurse practitioner advanced clinical practice skills: using the objective
structured clinical examination (OSCE). Primary Health Care 2005, 15(10): 37-42.
26. Alinier G.: Nursing Students’ and lecturers’ perspectives of objective structured clinical examination
incorporating simulation. Nurse Education Today 2003, 23(6): 419-426.
27. Mitchell L.M., Henderson A., Groves M. et al. The objective structured examination (OSCE): Optimising its value
in the undergraduate nursing curriculum. Nurse Education Today 2009, 29: 398-404.
28. El-Nemer A., Kandeel N.: Using OSCE as an assessment tool for clinical skills: nursing students’ feedback.
Australian Journal of Basic and Applied Sciences 2009, 3(3): 2465-2472.
www.tojned.net
73

The Online Journal of New Horizons in Education Volume 4, Issue 1
29. Selim A.A. Ramadan F.H., El-Gueneidy M.M. et al.: Using Objectives structured clinical examination (OSCE) in
undergraduate psychiatric nursing education: Is it reliable and valid? Nurse Education Today 2012, 32(6): 283-
288.
30. Palese A., Bulfone G., Venturato E. et al. The cost of the objective structured clinical examination on an Italian
nursing bachelor’s degree course. Nurse Education Today 2012, 32(4): 422-426.
www.tojned.net
74
The Online Journal of New Horizons in Education Volume 4, Issue 1
School Counselor Involvement and College Degree Attainment: A Quantitative Conundrum Jason Kushner [1], G. Michael Szirony [2]
[1] Ph.D. University of Arkansas at Little Rock Department of Counseling, Adult, & Rehabilitation Education 2801 S. University Ave, Little Rock, AR 72204, USA [email protected] [2]Ph.D. Walden University, School of Counseling 100 Washington Avenue, S., Minneapolis, MN 55401 [email protected]
ABSTRACT
One of the most salient protectors of individual and family economic growth both is achievement in the area of education. Higher education in particular can serve as a mediator for those who come from lower socioeconomic backgrounds or other roadblocks to success. In the United States school counselors provide substantial assistance to students regarding academic planning. In this study, data collected from the National Education Longitudinal Study (NELS) reviewed participants (N = 12,144) who sought assistance from school counselors in an attempt to identify factors salient to college degree attainment. Data were analyzed using Logistic Regression in an effort to determine whether school counselor involvement resulted in the prediction of successful achievement of postsecondary education. Results were mixed, suggesting the need for further research in this area.
Keywords: Education Attainment, School Counselors, SES, college degree attainment
INTRODUCTION
School counselor involvement and college degree attainment: A quantitative conundrum.
One of the most salient protectors of individual and family economic growth both in the United States and, indeed, the world, is achievement in the area of education, and in particular post-secondary education. (Pong, 1998; Powell & Downey, 1997; Delaney, Harmon, & Redmond, 2011). Discussion going on in the United States at this particular juncture is the notion that higher education can help to mediate the roadblocks people face who come from low socioeconomic backgrounds, poor schools, difficult family environments, lack of history of success in school, and those who may not be motivated to achieve in the area of education. While a cultural context is framed within the view of the Western notion of individual achievement by higher education, and measured by educational and economic success, the idea of achievement in whatever form is a universal goal, regardless of the context. Given the relative global uncertainty about the economy in many nations, it is still very much true that wherever people are seeking to advance, higher education is one of the best predictors of the likelihood of success across the world (Horn & Berger, 2004). Understanding which factors contribute to the success of students is critical so that scarce resources are not invested in programs and policies that bear little success in helping students to attain postsecondary education.
Helping professionals in schools are in a unique position to help bridge the success gap between students of lower socioeconomic status, hereafter SES, and those who came from high SES homes. Knowing and applying the factors that contribute to educational achievement is critical for secondary and postsecondary counselors to help students meet their educational goals. Academic counselors work in concert with other support systems to ensure student success as they are unable to mediate all the contributors to student attrition due to the high student to counselor ratio in secondary and postsecondary institutions (American School Counselor Association, 2003). Factors for baccalaureate degree attainment begin as early as middle school, and they remain constant in predicting postsecondary educational attainment years later (Trusty, 2004). Research for the effect of counseling interventions for specific populations is needed. While there is plenty of evidence to suggest that postsecondary education is an important vehicle for status attainment in the world, the specific programs, interventions, dispositions, and motivators for students remains less
www.tojned.net
75
The Online Journal of New Horizons in Education Volume 4, Issue 1
clear. In fact, in the United States in 2012, less than 26% of its population (NCES, 2012) has a post-secondary education level equivalent to a baccalaureate degree, and in the rest of the world, that number fluctuates as well, but even in the most advanced nations when it comes to postsecondary education, that number is hovers around 50% of the population; however, defining completion varies by type of educational attainment and degree. (Miller, Warren, & Owen, 2011). Even with access to postsecondary education becoming financially prohibitive relatively speaking compared to a generation earlier in the United States, college enrollments remain at or near the historical high mark, indicating little slowing in the perceived value of postsecondary education. Moreover, given the need for some form of high-level training to attain a quality job in most of the world today, national governments, including that of the United States Department of Education, are seeking ways to increase the number of students enrolled in higher education, and, more importantly, increasing the likelihood of success for those students who do choose to enroll in higher education programs. United States Secretary of Education Arne Duncan, has promoted the idea that some form of postsecondary education, in his view, is necessary for all citizens. Academic researchers, Trusty (2004), have suggested further research should focus on the use and effect of individual planning on long-term educational achievement, and the goal of the present study is to determine outcome data for the use of school counseling services in predicting postsecondary education, defined here by the attainment of a baccalaureate degree.
School counselors are the main source of academic planning information and resources in high schools in the United States, and because school counselors are charged with, among other tasks, providing college planning, career guidance, college information, academic readiness, preparation for standardized testing, and an limitless pantheon of related pro-academic services to students, they are perhaps in the best position to lay the foundation for helping students to attain the skills necessary to find success in postsecondary education. The research question investigated here is what effect does academic and personal counseling have on college degree attainment in the United States.
Background
Completing a degree program, or even graduating from high school, takes a certain amount of initiative on the part of the student, and credit is to be given where it is due. The research also indicates that other personnel help to guide students along the path to their overall goals. Helping professionals in the schools play a key role in helping students to achieve their graduation, but more than that, they are charged with the task of aiding students in their selection of which college to attend, the major of study to choose, and the career options available to them at the completion of their degree.
The model of the American School Counselor Association (ASCA), serves as a framework to unify school counseling services to deliver guidance and counseling to students in a consistent fashion across the United States. The model was developed in response to administrators, teachers, parents, and others being unaware of what school counselors do. ASCA states “The ASCA National Model supports the school’s overall mission by promoting academic achievement, career planning and personal/social development” (ASCA, 2003). ASCA’s mission continues in the college years in that ASCA’s three areas of emphasis are aligned with the goals of many of the student retention programs discussed the persistence literature.
Studies on the ASCA model’s use and effectiveness illustrate that its comprehensive scope is useful even though the model is applied inconsistently. For instance, Foster, Young, and Hermann (2005) studied the ASCA model’s application and found school counselors to devote most of their time and resources to the academic counseling component of their positions but that the respondents to their survey thought they did not address career development and personal/social development in as complete a fashion as they perceived necessary by the National Standards for School Counseling Programs (NSSCP, 2001), the standards from which the ASCA model was developed. The authors note, however, that a limitation of their study was that it sampled only National Certified Counselors (NCC), a non-representative demographic, as most school counselors are not NCC credentialed.
To be effective counselors for students, Trusty and Brown (2005) suggest school counselors develop advocacy competencies to define their role and delineate their activities. The authors explained that counselors need to develop competency in family empowerment, social advocacy, resource development, systems change, assessment, collaboration, organization, and problem solving, among other areas. Trusty and Brown devised a model for achieving advocacy dispositions which concern following through on what is recommended by the ASCA model.
Advocacy is important as school counselors often influence students in their future plans, and they often serve as bridge personnel between students’ secondary education and higher education. Dickey and Satcher (1994) found that school counselors often are not aware of the postsecondary educational options for students with learning disabilities, a disturbing finding because colleges and universities are increasingly accessible to the population of students with learning disabilities. Mills-Novoa (1999) suggested that students of color also may feel disenfranchised on campus, and to remedy the situation, college counselors can play a pivotal role in helping students of color to negotiate the barriers of high majority campuses. While institutional programs address the needs of unique campuses, the overall
www.tojned.net
76
The Online Journal of New Horizons in Education Volume 4, Issue 1
trend continues to evidence a separation of educational delivery between the primary, secondary, and postsecondary systems of education in the United States.
The separation of interventions by the type of institution is not unusual given the generally parochial nature of the way that education is structured in the United States. The ASCA model, and the state models that simulate it, sought to decrease the substantial differences between guidance delivery programs across the United States, and even the individual schools within districts. In addition, the variables that make the biggest difference for whether or not a person ultimately graduates from college is somewhat of a moving target in the sense that there are a number of qualitative issues that influence whether or not a student persists or not, and those variables are quite individual. For this reason, it is complicated to determine exactly what it is that makes the biggest difference. Some college admissions officers in the United States have determined that it is something called "grit," (Hoover, 2012), while others prefer to quantify those college success variables in very obvious predictable formulations based upon grade point average and standardized test scores, the best predictor of college degree attainment (Adelman, 2006). Trusty (2004) called for implementation of a long-term educational development (LTED) model to remedy the problem of the compartmentalized educational structure currently in place. Indeed, most of the literature on education focused on specific populations or categories (middle, high, college), which is a problem because, as Trusty argues, education is a life-long process victimized by the present structure of education. This project aimed to add clarity to the role of school counseling professionals in the attainment of a baccalaureate degree.
METHODS
Data were collected from the National Education Longitudinal Study (NELS). The NELS is one of many comprehensive studies sponsored by the National Center for Education Statistics (NCES), USA, to address the need for large-scale nationally representative data on educational characteristics and achievement in the United States. The NELS was developed to study the “educational, vocational and personal characteristics of students at various stages in their educational careers and the personal, familial, social, institutional, and cultural factors that may influence that development” (NCES, 2002). The NELS is one of three completed longitudinal surveys conducted by the United States National Center for Education Statistics.
Participants
Participants were 12,144 members interviewed in the fourth follow-up of the NELS:88 base year, twelve years following the beginning of the study. The participants represented students from intact and single-parent families, high, middle, and low SES groups, both genders, and each of the race/ethnicity categories delineated by NCES, African-American, Asian, Hispanic/Latino, White, and Native American in the United States. To control for statistical significance based upon large samples, statistical weighting was applied to compensate for the effect, and to increase the likelihood that the findings are valid in the representation of a realistic portrait of the population under study.
Variables
Counselor involvement was measured using items selected from the NELS where students were asked about academically related counseling received in high school as well as the frequency of visits to college counselors, academic advisors, and financial aid advisors. Questions for this construct were taken directly from the NELS analysis variables by the researcher to develop the measure of counselor involvement. Specifically, the questions representing the frequency of academic and personal counseling constituted the overall variable of counselor involvement. Although this is a broad measure of counseling, it is the best estimate available in the NELS for information regarding the level of involvement of counseling professionals for college students. The construct aims to determine the effect of institutional support personnel in helping students to attain their degrees. Socioeconomic Status was used as a control variable in order to test the effects of the variables under study. Research indicates that socioeconomic status (SES) is the best predictor of academic attainment, and that low-SES forecasts low attainment (Ginther & Pollack, 2004). In this study, SES is characterized by the economic, social and physical environments in which individuals live and work, as well as by demographic and educational factors. For the purpose of this study, measures of SES included five equally weighted, standardized components: father’s education, mother’s education, family income, father’s occupation, and mother’s occupation (National Center for Education Statistics, 2004). The dependent variable is a dichotomous variable indicating degree attainment or no degree attainment by eight years following graduation from high school in the United States.
Logistic regression analyses were computed to address the research questions and to determine the degree to which the predictor variables contribute to the outcome. The dependent variable, degree attainment, was coded as a “0” or a “1” to indicate degree completion or not. Logistic regression tests multiple independent variables against a discrete dependent variable (Kirk, 1995). The regression technique tests each variable and the combined variables on degree attainment.
www.tojned.net
77
The Online Journal of New Horizons in Education Volume 4, Issue 1
RESULTS
Counselor involvement did not contribute to postsecondary degree attainment in the sample in the study. The variables selected for counselor involvement from NELS consisted of items related to whether students sought information or counseling from their high school counselor concerning academic or personal matters. The academic counseling factor contained questions about the number and duration of counseling sessions devoted to selecting courses, seeking information about postsecondary education, and information regarding preparation for college such as what courses to take and information regarding the ACT/SAT exams and financial aid. The personal counseling factor was comprised of questions related to the amount and duration of counseling for personal reasons. An interesting finding is that personal counseling had a significant negative association with postsecondary degree completion. That is, students who saw a high school counselor for personal reasons were less likely to graduate college. Counselor involvement did not influence postsecondary degree attainment in the positive direction. The academic counseling and personal counseling variables that comprised the counselor involvement factor had a neutral relationship for academic counseling and a significant negative relationship for personal counseling (p < .001).
DISCUSSION
While there is plenty of anecdotal evidence that school counselors, college counselors, and other influential people can make a substantial difference in the likelihood of students matriculating through college degree graduation, the present study indicates that it remains a challenge to quantify what it is that counselors do. Indeed, capturing counseling outcome research, particularly in the absence of research like the present study, where counselor influence is tested years after the counselor engagement, is difficult because there is little research published on the subject from a quantitative methodology not only because it is difficult to find a sample for such a study, it is also true that studies that do not find promotion of counseling services are less likely to be published in the counseling literature. The findings of this particular research were that academic counseling did not have any substantial effect toward degree attainment, and personal counseling had a significant negative relationship to college degree attainment. The findings are not too surprising in that personal counseling would lead to a decrease in the likelihood of college degree attainment because students who have personal problems of a nature so severe that they need to seek counseling are likely to continue to have problems later in life that decrease the chances of graduating from college, as supported by the findings in this study.
The particular challenge of understanding the influence of school counselors on college degree attainment is that quantitative studies are limited because of the problem of finding from a counseling view particular data points associated with college degree attainment. Indeed, large-scale data sets such as that used in this study find that the strongest predictors of success in college degree attainment largely cluster around the academic areas, and, in particular, the taking of high-level courses, in math and science, which is a measurement easier to capture because transcript analysis can be correlated with college degree attainment in a way that is less challenging than quantifying matters of a more interpersonal nature related to personal counseling or even academic counseling for personal reasons. The limitations of the study are clear. It is limited to the frequency counts of seeing a school counselor for personal reasons or academic reasons where the academic reasons for seeking school counseling tend to be for low performance in academic areas. Students who do well in school generally do not see school counselors for reasons related to deficits either in a personal or academic sense, and because of this, there is some selection bias in the sample because students who do well in school would not necessarily be singled out for counseling because of academic deficits: i.e., they would not have seen the school counselor at all, and so would not have been in the sample.
Policymakers have been able to shape the direction of the curriculum of schools for acknowledging the research related to high-level course taking and college degree success. Indeed, many school counselors recommend, and districts require, students take high-level courses in the areas of algebra, geometry, and calculus, along with biology, chemistry, and physics. In addition, most school districts in the United States require four years of English and writing skills along with courses in history, government, and economics. School counselors are in a unique position to shape the future direction of students in their schools, and while outcome data related to personal counseling is dubious when it comes to predicting college degree attainment, the services are particularly necessary because they do contribute to the likelihood that students will graduate from high school, an important variable alone. Finally, the present study indicates the difficulty of trying to quantify counseling outcomes because there is plenty of research both qualitative and anecdotal that suggests that school counselors do make a positive influence for students, and it is a particular challenge of the counseling profession though, making the case that counselors can quantify empirically the effect the counseling has over the course of years for students’ academic, personal, and career aspirations.
www.tojned.net
78
The Online Journal of New Horizons in Education Volume 4, Issue 1
REFERENCES
Adelman, C. (2006). The toolbox revisited: Paths to degree completion from high school through college. Washington: US Department of Education.
American School Counselor Association. (2003). The American School Counselor Association national model: A framework for school counseling programs. Alexandria, VA: Author.
Delaney, L., Harmon, C., & Redmond, C. (2011). Parental education, grade attainment and earnings expectations among university students. Economics of Education Review, 30(6), 1136-1152. doi:10.1016/j.econedurev.2011.04.004
Dickey, K. D., & Satcher, J. (1994). The selection of postsecondary placement options by school counselors for students with learning disabilities. School Counselor, 41(5), 347-352.
Foster, L. H., Young, J. S., & Hermann, M. (2005). The work activities of professional
school counselors: Are the national standards being addressed? Professional School Counseling, 8(4), 313-323
Ginther, D. K., & Pollack, R. A. (2004). Family structure and children’s educational outcomes: Blended families, stylized facts, and descriptive regressions. Demography, 41(4), 671-696.
Hoover, E. (2012). The 4-letter word everyone is talking about. Chronicle of Higher Education,
59(8), A3.
Horn, L., & Berger, R. (2004). College persistence on the rise? Changes in 5-year degree
completion and postsecondary persistence rates between 1994-2000. US Department of Education, National Center of Education Statistics. Washington, DC: U.S. Government Printing
Office
Kirk, R. E. (1995). Experimental design: Procedures for the behavioral sciences
(3rd ed.). Pacific Grove, CA: Brooks/Cole
Miller, D.C., Warren, L.K., & Owen, E. (2011). Comparative indicators of education in the
United States and other G-8 countries: 2011. Washington, DC: National Center for Education Statistics.
Mills-Novoa, A. (1999). Potential roles a college counselor can play in promoting the academic success of students of color. Journal of College Counseling, 2(1), 99-103.
National Center for Education Statistics (2002). User’s Manual: NELS:88 Base Year through Fourth Follow-up. Washington DC: U.S. Government Printing Office.
National Center for Education Statistics (2012). The digest of education statistics. U.S. Department of Education Office of Educational Research and Improvement.
Pong, S. (1998). The school compositional effect of single parenthood on 10th grade
achievement. Sociology of Education, 71, 24-43.
Powell, B., & Downey, D. B. (1997). Living in single-parent households: An investigation of the
same-sex hypothesis. American Sociological Review, 62, 521-539.
Trusty, J. (2004). Effects of students’ middle-school and high-school experiences on completion of the bachelor’s degree. [Monograph]. Center for School Counseling Outcome Research: University of Massachusetts, Amherst.
Trusty, J., & Brown, D. (2005). Advocacy competencies for school counselors. Professional School Counseling, 8(3), 259-265.
www.tojned.net
79
The Online Journal of New Horizons in Education Volume 4, Issue 1
Total Quality and Management Policies in the Education Process Behçet Öznacar [1], Mesut Yılmaz [2]
[1] [email protected] North Cyprus [2] North Cyprus
ABSTRACT
In this research, from Total Quality Management, in order to find out the convenience of sectors down to earth quality efforts, total quality management main principles context, the views of total quality management was argued. The studies about this topic have been examined with literature scan. Some findings have been reached in this research. Total Quality Management shows qualifications about organizational activities and improving efficiency. As a result of the analysis, “general quality” and “product/service quality” there are differences between the sectors. However, between “worker quality” and “customer quality” there is no reliable difference. Total Quality Management, produces the combination of classic and Neo-classic approaches. The particular efficiency values about classics and in the other hand agreeing on divisions particularly includes Neo- classic values such as, social responsibility, like people and focusing (Erkılıç, Soc. & Appl. 2007)
Keywords: Competition power, Management approaches Management System, Quality Politics.
INTRODUCTION
The main objective of this study is to determine the proficiency level of sectors according to the achievability of quality efforts and if there is, to put forth the level differences between sectors. For this purpose, a survey was carried out from 1059 businesses which some of them are manufacturing and the others are non-manufacturing and it is asked to the administrators’ of these businesses how they evaluate their sectors according to “overall quality”, “employee quality”, “product / service quality” and “customer quality” (Başaran and Aydemir 2005). These studies, starting from the idea that quality efforts are a journey, the point that the businesses started to the journey is based on the assumption that it is vitally important. The importance of the starting point to the quality studies is understood better when we look the businesses which are witnessed the high momentum exchange in the areas of social, cultural, economic and political as of the last quarter of the twentieth century and at this process when it is take into account the features like quality culture, participation and customer focus which are indispensable and also difficult to access for the Total Quality and Management Policies. It can be possible to access a quality product and service with a good education. With John Akers’s expressions “how will the businesses compete if the students do not compete today?” (Schargel 1993: 67).
Deming, one of the quality masters, expresses that the education has a key role in the production of quality goods and services (Schargel 1993: 68). The quality education is one of the most important conditions to keep pace with the modern and technological changes taking place in the world. But it is not seen possible to keep pace with this change in Turkish Republic of North Cyprus with the traditional (classical) education concept. In this study the outlines of the inadequacies of the traditional educational approach will be introduced and Total Quality Management concept will be tried to be explained as an alternative in the education area.
www.tojned.net
80
The Online Journal of New Horizons in Education Volume 4, Issue 1
Classical (Traditional) Educational Conception
In educational institutions in our country, the traditional concept of education is dominant. This understanding trains the students to be the human model who is largely passive, insecure, weak quality researcher, not adaptable quickly to changes and innovations. In the understanding of classical education according to the “closed system” the education carries on with the passive education understanding. While acknowledging the importance of the education’s inputs, it is not possible to mention in a development that can improve the quality of inputs. Higher education institutions are not cooperated with the sub-institutions (secondary schools and high schools) which will provide inputs to increase the quality of the students. In our country, education activities are in the form of a one-way transfer of information which is usually from teacher to student with the method of deductive. Students are not required to participate actively, listening quietly courses are seen as a suitable environment for teaching. In this environment, the success is the remainder of the informations which are transmitted to students by the teachers. It is not important if the outputs which are graduated from universities are appropriate or not to the societal needs. In traditional education approach it is seen that there is almost no information exchange between the education institutions and “Suppliers” and “customers”. The success of the system at this level depends on planning all inter-agency activities.
While educational institutions are searching the reason for not reaching their desired goal in training in disobeying the determined rules, they are not required to cooperate with the agencies where our graduates work at. In this understanding the motivation of the teachers and the students are not cared.
Total Quality Understanding in Education
Total Quality Management (TQM)'s main aim; by determining the quality requirements of customers, according to this satisfying the customer by providing accurate output and continue on improving the quality by ongoing researches. The most important feature of TQM is that it is not leaving the whole work to a few of people shoulders’; it shares with all of the people in the system. “Do the right job, in the right way” is detected (King and Cichy 2006). In management science, especially in TQM’s work, it is expected to meet with the needs of the quality, cost or service offered to people (customers) (Yamak, 1998). In this context, in an increasingly competitive environment, hospitals, supermarkets, transport companies and educational institutions see the TQM as an alternate method in order to offer customers the services they expect and the quality concept which is usually seen as “The most beautiful, the most accurate form of” is seen that undergoes a transformation to offer the most beautiful and the most accurate of goods or services to the customers.
Features of Total Quality Education Relations with Suppliers
Unlike traditional management, TQM envisages close cooperation with the other educational institutions which provides students to itself. The understanding in here is; if the “input” quality is low, it is not possible to provide an education at the desired level. For this purpose, it is very important to give high quality education by the institutions which are providing students for the receiving educational institutions. Today in universities the education is not at the expected quality because of the secondary and high schools are not educating the students at the expected standard before the education activities take place in universities. In this situation the universities administrations’ should cooperate closely with the institutions and organizations related to secondary and high schools, they should mention what they are waiting from the profile and the features of the students’ and to provide these they should give the necessary support.
TQM is a modern management approach and it should be discussed as a synthesis of the contemporary approaches in management science, classical and neo-classical management approaches. When it is evaluated from this basis, TKY gives importance neither only the effectiveness-efficiency nor only human-environment. This bilateral relationship should be maintained at the same level in the organizations that provide the other inputs of the education system. Otherwise the faulty “production” cannot be avoided in the system.
Take into Account the Customer and Employee Needs
Focus on customer feedback is important in developing their expectations. In order to achieve a successful training all employees are required to create the perfect conditions. In an educational institution, one of the most important problems which need to be solved is “self-confidence” problem. Students and teachers should be together against failure problems due self-confidence. The teachers have great roles and responsibilities to help students to get rid of the failure due to self-esteem. These problems will be solved almost entirely especially with a serious dialogue between the teachers and students. As well as leadership and production processes partnership, continuous learning, to adopt time-market approach for efficiency, to measure competition, increase competition in renewal and commitment to customer satisfaction may be considered as the success winning formula (Zairi, 1995). The quality sense of product accepts that the outputs are the quality criteria to meet with the customers’ prompts and requirements
www.tojned.net
81
The Online Journal of New Horizons in Education Volume 4, Issue 1
(James, 1996). The quality in contemporary management science is not only focused on the product, it is the collection of works which aims to run the entire production process reliable, efficient and effective (Pamela and Goodman, 1998). The dimensions of quality can be summarized as performance, possessed qualifications, trust, conformity to standard, uniformity, durability, the service assurance in maintenance and repairing, aesthetics and perceived (Bartol and Martin 1998).
Continuous Improvement
In Total Quality the development requires the continuous improvement of the educational process. The innovations in the education should instantly be reflected in the curriculum and the new learning methods must be applied. This process will also enhance the quality of the trained students and the quality of the products. In the process of education, while implementing the principles of Total Quality, determining quality requirements, policies and plans can be demonstrated is vitally important for organizations. Quality policy and quality objectives should be in applicable processes. After TQM incorporated into the system, it will be required to apply the determined strategy to the all employees. With its strategic quality leadership which is like paradoxical is not only for management; TQM tries to provide everybody to feel like a leader in the institution. This situation gives the responsibility of assuming leadership roles to everybody around his/her responsibility environment in an integrated way with the institutions. During this process the institution which applies TQM is the “learning organization” and the employees are “learning leaders.” (James, 1996).
TQM which have started to take an important part in public opinion in terms of management approaches since the first half of the 2000s constantly debated in terms of application integrity theory, benefits which it provides to employers and employees.
The applications like the increasing performance of TQM with the continuous development, the creation of individual, community and corporate vision, to ensure auto-control, the creation of synergies by doing team works to show the people’s talents, to ensure the functioning of the reward system at all stages and with applications such as participation in making decisions reviving the significant successes in the institutions and it is seen that they are achieving (Cafaoğlu, 1999).
The keyword used continuously in the evolution is “learning”. The most important part of the TQM’s healing process is learning and the process of improving what you have learned. Removing the teachers from the knowledge transfer position using one-way communication channel; they become a part of preparing the learning environments to accelerate the education, guiding, in the router of developing knowledge and skills also supporting, therefore provides a status through continual success. With the effective implementation of Total Quality, the teachers become a supporter to the learner instead of judging themselves, they guide instead of giving the information directly, the teachers start working together with families, students, administrators, teachers, employees with workplace and all public rather than being isolated in a classroom.
Working with Data
It is a very important status to solve the data in TQM. Like Lord Kelvin mentioned, if we can evaluate the thing that we are talking about and expressing it in figures we can say that we know something about it. If we are evaluating the data but cannot show them in figures mean that we do not have enough information in this topic. Appropriate data are needed to manage the process properly and in order to monitor the developments closely. Data will express the truth. This data is only achieved by the “measurement”. There are two key metrics which are used in TQM; these are the internal and the external measurement methods. The first is related to the measurement of the basic processes. The second refers to the measurement of external customer satisfaction (Dahlgaard and others, 1995: 450). In order to raise the quality of educational institutions, it is important that the implementation of the reporting system by collecting the data related measurement and quality.
The purpose of the quality of educational institutions is employee’s and customer’s satisfaction inherently. Employee is the teacher and the customer is the student. Educational institutions can be defined as a sum of the processes related to each other which are producing “input” to the next process or “output” to the costumers. TQM is a process oriented activity which requires to be aware of the causes of the problems or failures and to care about them by the corporate managers, employees and students in internal processes (Dahlgaard 1995: 451).
Participation in Education
The teaching staffs are not only people who have to realize the quality in educational activities. As we mentioned before the purpose is not to load the information. The administrators in the educational institutions are responsible from maturing the educational conditions. To ensure the maximum participation the motivation of the teaching staffs, students and other workers should be increased. The basic condition to ensure quality is to provide the active participation of whole participants to the work teams or quality circles. The teams related with the education are
www.tojned.net
82
The Online Journal of New Horizons in Education Volume 4, Issue 1
an important and inseparable part of the institution quality organization (Dahlgaard vd. 1995: 454). Quality politics are mentioned as a number of basic assumptions which show what an institution should do in the future (Iman ve Turan, 2001).
One of the musts to create an institution that works in a planned and systematic way can be possible by managing the system with managing the processes (Kavrakoğlu, 1996). Process management includes all the businesses and operations linked with suppliers, partners and customers like the purpose and functioning agency identification, production of goods and services, distribution and providing service support services (Hellriegel and the others, 1999).
In teamwork the whole subject can be grasped, he will know that he will have a role in the team which he is in when overcoming the problems and to improve the success he will be in solidarity with himself and his teammates with claiming his responsibilities. TQM is a systematic approach for the marketing which is connected to product, service, process and quality control functions and the development of production in accordance with customer expectations (Boone and Kurtz 1996).
RESULT
Total Quality Management has superiors compared to the classical education approach in the development of education system and in educating qualified personnel whom answer the contemporary expectations of the individuals. Total Quality Management creates an opportunity to the development of the educational system. The personnel who are needed by the businesses and the modern world will be possible with the continuous development of the education system. It is not possible with the closed traditional system to keep pace with the amazing development in the world. The improvement of education system with Total Quality Management will cause the production power of a country to increase. For this reason Total Quality Management Approach should be applied in the education system before it is applied to the manufacturing enterprises. The educational works which are connected to the research can be supported with TQM for the purpose of solving problems. It is needed to be prepared to the awards processes to increase the participation to the TQM applications. It can be advised to give education, research, development and motivation to internalize the TQM (not to make it just for awards). In addition to this it can be advised to compare the institutions which are using TQM and institutions which are not using. The businesses will catch the social change in the modern world market and they will compete with the other markets by TQM. TQM will give a new pale to the educational system by providing important successes.
REFERENCES
Basık, Feryal Orhan (1997), “Eğitim ve Toplam Kalite”, Kalder (Önce Kalite Dergisi),
Zuhal (1996), Eğitimde Toplam Kalite Yönetimi, İstanbul: Avni Akyol Ümit Kültür ve Eğitim Vakfı Yayınları.
Dahlgaard, Jeans; Kai Kristensen ve Coopal K.Kanji (1995),
“Total Quality Management and Education” ; Total Quality Management, Vol: 6, No:5-6. Özdemir Servet (1995),
Verimlilik (Toplam Kalite Özel Sayısı). Schargel, Franklin (1993),
“Total Quality in Education”, Quality Progress, October. Weawer, Charles N. (1997),
Toplam Kalite Yönetiminin Dört Aşaması (Çeviren: Birkan ve Akınhay),
İstanbul: Sistem Yayıncılık. Yenersoy, Gönül (1997),
Toplam Kalite Yönetimi, İstanbul: Rota Yayıncılık. Yıldız, Gültekin (1994),
İşletmelerde Toplam Kalite Yönetimine Geçişte Stratejik Bir Yaklaşım, Adapazarı: SAÜ Yayınları
Boone LE, Kurtz DL, 1996. Contemporary business.
Cafoğlu Z, 1999. Eğitimde toplam kalite. Yeni Türkiye Kalite. Gökçen Teknik Semih Ofset, Ankara. Special Number. 26, 303 – 314 .
Coffey KE; Cook CW, Hunsaker PL, 1994. Management and organizatonal behaviour.
Austen Press, Sydney. Dessler G, 1998.
James P 1996. Total quality management: An introductory text. Prentice Hall, London.
www.tojned.net
83

The Online Journal of New Horizons in Education Volume 4, Issue 1
Kal Der, 2003. EFQM mükemmellik modeli 2003: Kamu ve sivil toplum. İstanbul:
King J, Cichy RF, 2006. Managing for quality in the hospitality industry.
Miner JB, Lunchsinger VP, 1985. Introduction to management.
Pamela SL, Goodman SH, 1998. Management: Challenges in the 21st century. South Western College Publishing, Paul Minn.
Rao A, and the others, 1996. Total quality management.
John Wiley & Sons, New York. Rossiter J, 1998.
ÇELiK, V.; “Eğitim Örgütlerinde Örgütsel Kültür ve Kalite”4.Ulusal Kalite Kongresi, Ist.,TÜSiAD&Kal-Der, 1995
www.tojned.net
84
The Online Journal of New Horizons in Education Volume 4, Issue 1
www.tojned.net
Toward A Justice Oriented Education: An Analysis of Turkish Education from a Rawlsian Perspective Rasit Celik [1]
[1] Philosophy of Education, Indiana University [email protected]
ABSTRACT
It is argued that a narrow overlapping consensus on education may allow applying a politically liberal account of justice oriented education in a developing democratic society. In this regard, this article examines whether there is a narrow overlapping consensus on education in Turkey.
Keywords: Turkish Education, Justice, Political Liberalism
INTRODUCTION
John Rawls (1993) argues in his Political Liberalism that in a politically liberal democracy – or what he calls a well-ordered society – citizens live as free and equal individuals under their society’s democratic institutions and public political culture based on the principles of justice that are secured by an overlapping consensus agreed by various incommensurable comprehensive doctrines that are reasonably affirmed by the members of such society. The stability of this justice oriented society is dependent upon the characteristics of its citizens. Citizens in a well-ordered society are free insofar as they know that each individual has the ability to have a conception of the good and conceive of every one as not bound to pursue a specific conception of the good inescapably but as able to revise or abandon their conceptions of the good. Additionally, they are equal insofar as each individual is conceived of having the two moral powers in order for them to be lifelong participants in social cooperation and insofar as each member is represented equally in political discussions while arriving at agreements and framing the principles of political justice. The idea of citizenship in a politically liberal society is defined by the conception of reasonableness. Reasonable citizens in such society take justice as the first virtue and they are ready to propose and accept principles of justice that never assign anyone lesser basic rights than others. Also, they are always willing to comply with the fair terms and principles of political justice.
In this sense, creating reasonable citizens in a politically liberal society is highly crucial for the survival of the culture of justice. In fact, justice oriented reasonable individuals can be developed based on the inherent capacities that each individual have. According to Rawls, individuals have the two moral powers, a capacity for a sense of justice and a capacity for a conception of the good. In Rawls’s (2001) words, the former is “the capacity to understand, to apply, and to act from (not in accordance with) the principles of political justice that specify the fair terms of social cooperation” (pp. 18-19), while the latter is “the capacity to have, to revise, and rationally to pursue a conception of the good” (p. 19) that specifies what is valuable for one’s life. In such a developed democratic society, according to Rawls (1993), citizens develop their own conceptions of the good and senses of justice through their participation in democratically organized social and political life, which is called by him as the wide educational role of the public political culture. Primarily for this reason, Rawls does not provide a full-developed educational account that may aim at helping individuals to develop their senses of justice and conceptions of the good, and thus at producing reasonable citizens.
85
The Online Journal of New Horizons in Education Volume 4, Issue 1
www.tojned.net
Yet, Rawlsian educational scholars have developed essential aspects of politically liberal approach to education based on Rawls’s politically liberal theory. For example, Macedo (1995) discusses that an explicit emphasis is to be put on citizenship and some liberal values such as public reason and tolerance. Reidy (1996) argues that idea of citizen as free and equal, the rule of law, reasonable pluralism, and some basic liberal principles such as mutual respect and toleration are to be taught in schools. Bull (2008, 2012), in addition, identifies basic curriculum elements of civics education in order to help students to develop their own conceptions of the good and senses of justice, and defines basic principles of social justice in higher education from a politically liberal perspective. In short, Rawlsian scholars have framed general principles, content, and aims of politically liberal approach to education. One thing that is common to those Rawlsian educational thinkers, however, is the general aim at contributing to the advancement of a well-ordered society through its education system. More specifically, they intend to educate reasonable citizens so that the stability of a developed politically liberal democracy is secured and the society’s just order is perpetuated by new generations. This common aim, in part, comes from the general idea that liberal theories are limited to Western democracies (Levinson, 1999; Shils, 1995). Beyond this general idea and in contribution to the overall discussion about the politically liberal approach to education, I argue that a developing democracy may also apply an educational account that is established based on politically liberal theory in order to contribute to the advancement of a culture of justice in such a developing democracy. But how?
The idea of an overlapping consensus is a basic element of Rawls’s politically liberal theory. Basically, an overlapping consensus in a well-ordered society is a constitutional agreement on a political conception of justice among those who hold incommensurable reasonable comprehensive doctrines, which is achieved through public reason with citizens’ equal participation and which guarantees the just order of the society under the administrations of different political parties in different periods. An overlapping consensus is agreed by different groups of a pluralistic society because they believe that it is just since an overlapping consensus is not based upon a particular comprehensive doctrine. In other words, an overlapping consensus is supported by all the reasonable comprehensive doctrines in a pluralistic society because it provides justice to all without committing to any comprehensive doctrine but limiting itself to the domain of the political, and it guarantees freedom and equality of each citizens of a well-ordered society. In such a society, developing and implementing a politically liberal educational account is justified because an overlapping consensus ensures – among various aspects of the basic structure – the basic principles that specify the content, aims, and purposes of education in a politically liberal society.
In this sense, I argue that a developing democracy may have an agreement on some of its social and political organizations, such as its judiciary system. Yet, such society may still be in need of arriving at agreements on various aspects of its basic structure. In this sense, if a developing democracy has reached an agreement on its education system including its content, aims, and purposes based upon basic liberal principles such as individual liberties and freedom, then it becomes legitimate to apply an educational account developed from a politically liberal perspective. This may be called as a narrow overlapping consensus on education. To exemplify, let us take the case of the European Union (EU). A candidate state is to comply with the acquis based on different chapters on various topics in order to become a member state. Yet, each candidate state may align its legislation with the acqius through complying with different chapters at different times. For example, while bringing its legislation into line with the acquis regarding the chapter on Judiciary and Fundamental Rights, a candidate state may still need to show more progress on the chapter on Social Policy and Employment. In the same manner, a candidate state may already fulfill the requirements of the chapter on Education and Culture, while falling short of complying with some other chapters on different topics. Now, consider this society as a developing democracy that has not reached an overlapping consensus on all aspects but has reached an agreement on its education system including its content, aims, and purposes, which may be called a narrow overlapping consensus on education. Therefore, it appears to be legitimate to implement an educational account developed from a politically liberal perspective in such a developing democracy since the agreements on its education system do not conflict with the basic liberal principles.
After clarifying the basic idea about how a politically liberal approach to education can be promoted in a developing democracy, I intend to analyze whether an educational account developed from a politically liberal perspective may be applicable to Turkish education system. To do so, I will examine if there is a narrow overlapping consensus on the education system in Turkey. With this in mind, I will, in the section below, look at the constitution of the Turkish Republic with reference to the key articles about education and the Basic Law of National Education that, along with other laws, regulates educational policy in Turkey. Then, I will examine whether the current agreement on education is consistent with the main conditions for a narrow overlapping consensus on education. Finally, I shall conclude, in accordance with the basic ideas of political liberalism, whether the agreement on education in Turkey satisfies the conditions for a narrow overlapping consensus, in order to understand if a justice oriented educational approach that is developed from a politically liberal perspective can be applied to Turkish education.
86
The Online Journal of New Horizons in Education Volume 4, Issue 1
www.tojned.net
General Structure and Legal Basis of the Education System In Turkey General Structure
The Constitution of the Republic of Turkey, the Basic Law of National Education, and the Law for the Unification of Education fundamentally determine the principles of the education system and frame the organization and responsibilities of educational institutions in Turkey. For example, Article 42 of the Constitution secures the right to education by stating that no one shall be deprived of a right to education and specifying that primary education is compulsory for everyone and free of charge in state schools. The Law for the Unification of Education, which was enacted in 1924, makes all educational institutions the responsibility of the Ministry of National Education (MONE). The MONE is organized in accordance with the Basic Law of National Education and with related laws that regulate the education system.
The MONE is the central state agency that is responsible for administrating all educational services in Turkey, including formal and non-formal education. The MONE includes central, provincial, and foreign offices. Provincial and district directorates represent the MONE in each province in Turkey and are responsible for administrating educational activities in accordance with decisions of the MONE and its various offices. In addition, the MONE’s educational inspectors supervise all educational activities at local, provincial, and central levels.
Currently, compulsory basic education lasts for 12 years in Turkey, beginning at the age of six. After four years of primary education, students continue to four years of middle school and complete compulsory education with four years of high school. Higher education is available for those who wish to continue, based on their performance on a standardized examination that is developed and conducted by a state organization that is primarily responsible for selection and placement of students in higher education institutions nationwide.
In this highly centralized education system, some organizations play important roles in determining the nature of education in Turkey. For example, the Board of Education, which reports directly to the Minister, is responsible for developing and revising curriculum and for defining the content of course books that are used at all levels of compulsory education nationwide. Decisions taken by the Board of Education about curriculum, educational materials, and other educational issues are submitted for final approval by the Minister of National Education. In addition, while the MONE administers all stages and types of education up to higher education, the Council for Higher Education is responsible for educational planning, coordination, allocation of budgets, faculty appointments, and defining the core curriculum and guidelines for undergraduate programs. The Council for Higher Education sponsors different affiliated organizations that are responsible for organizing higher education activities, such as the Teacher Training Committee that is responsible for organizing and evaluating teacher training programs in collaboration with the MONE and faculties of education. The Council for Higher Education is a non-governmental national board of trustees. However, the president of the Council for Higher Education is appointed by the President of the Republic of Turkey. Both the basic education and higher education systems, in short, are centrally organized and administered, which leaves little autonomy for educational institutions in Turkey.
Aims and Principles of Turkish National Education
The general aims of Turkish national education are defined in Article 2 of the Basic Law of National Education. According to the Article, Turkish national education aims to:
(1) develop citizens who are committed to Atatürk’s reforms, principles, and nationalism as defined in the Constitution; who internalize, protect, and promote the national, moral, and cultural values of the Turkish nation; who love and foster their families, homeland, and nation; who have knowledge of their duties and responsibilities toward the Republic of Turkey – a democratic, secular, and social state of law based on human rights and the basic principles defined in the Constitution – and reflect this knowledge in their behaviors,
(2) develop persons who are in physical, mental, moral, spiritual, and emotional balance and have a healthy personality and character, thinking ability that is independent and scientific, and a broad worldview; who respect human rights, value enterprise and individuality, and are responsible toward society; and who are constructive, creative, and productive,
(3) prepare all members of the Turkish nation – by means of developing their own interests and abilities and of providing them with knowledge, skills, and cooperative working habits – for life and professions that will make them happy and will contribute to the welfare and happiness of society.
The Article further specifies that:
In this way, Turkish national education aims, on the one hand, to enhance the happiness of Turkish citizens and society and, on the other, to promote economic, social, and cultural development by means of national
87
The Online Journal of New Horizons in Education Volume 4, Issue 1
www.tojned.net
solidarity so that eventually Turkey will become a distinguished member of modern civilizations.
The same Law – in Articles from 4 to 17 – also specifies the principles of Turkish national education, which are:
(1) Universality and equality: educational institutions are open to all without any consideration of race, religion, language, or sex and without any privilege given to any family, group, or class
(2) Social and individual needs: educational services are to fulfill needs of individuals and society
(3) Orientation: individuals are directed to programs in accordance with their interests and abilities
(4) Right to education: basic education is everyone’s right
(5) Equal opportunity: men or women, and those who suffer from poverty or who need special care are to be equally provided with education
(6) Continuity: general and vocational education are provided throughout life
(7) Atatürk’s principles, reforms, and nationalism: all types and levels of education are to give special emphasis to Ataturk’s reforms, principles, and nationalism and to promote the use of the Turkish language in educational and scientific areas
(8) Democracy education: students are to be provided with a notion of democratic ways of life
(9) Secularism: Turkish national education acknowledges secularism as fundamental
(10) Scientific approach: in accordance with developments in science, educational programs and materials are to be revised continually
(11) Planning: educational services are to be planned in accordance with economic, social, and cultural development goals
(12) Co-education: students are educated together regardless of sex
(13) School-parent cooperation: school and parent cooperation for the realization of educational goals is to be promoted
(14) Education everywhere: education not only in formal educational institutions but also in non-formal environments – including family, work, and other places – is to be promoted. Any educational institution – including state, private, or charity organizations – are under the control of the MONE.
As primarily specified in the Basic Law of National Education and as stated in various laws that regulate the education system in Turkey, specific aims of educational institutions of different types and at all levels are defined in accordance with the general aims and principles of Turkish national education. Thus, primary education, as defined in Article 23 of the Basic Law of National Education, aims to generate good citizens by providing students with the skills and knowledge necessary for national moral values and to prepare them for the next level of education. Secondary education, as specified in Article 28 of the same law, aims to provide students with a common basic culture, to introduce them to social problems, to encourage them to seek possible ways to resolve those problems, to enable them to acquire the ability to contribute to economic and cultural development, and to lead them to higher education in accordance with their interests and skills. Also, as framed in Article 35 of the same law, higher education aims to fulfill professional work needs, to teach scientific knowledge, to enhance scientific knowledge for resolving Turkish society’s cultural, technical, and scientific problems, to do research on the country’s problems that benefits the society, to publish research results that will contribute to the development of science, and to educate society through disseminating scientific data in both written and oral forms.
The general aims and principles of Turkish national education as specified in the Basic Law of National Education are derived from the Constitution of the Republic of Turkey. For example, Articles 42 and 58 of the Constitution secure the right to education, unity in language, free compulsory basic education for all citizens, state control over the education system, science as the basis of education, Atatürk’s principles and reforms, and education for the integrity of the state. Article 27 ensures the right to study and teach science and art freely, unless this freedom is used for changing the form, characteristics, and national traits of the state as defined in the first three articles of the Constitution. Article 24 guarantees the freedom of conscience, belief, and religious commitment. It also specifies that moral and religious
88
The Online Journal of New Horizons in Education Volume 4, Issue 1
www.tojned.net
education, which is among compulsory courses in basic education, is provided under the control and supervision of the state. Alternative religious education is optional according to students’ and their legal representatives’ desires. In addition, Article 62 allows the state to provide education for citizens’ children who live abroad. Articles 130, 131, and 132 of the Constitution specify the organization and administration of higher education system in detail.
IS THERE A NARROW OVERLAPPING CONSENSUS ON EDUCATION IN TURKEY?
The general structure and legal basis of education in Turkey imply a highly centralized education system with clearly defined principles and aims that are secured by the Constitution. Now, the question is whether this well-defined agreement on education system of Turkey can be considered to be a narrow overlapping consensus about education. In order to clarify this inquiry, let us first recall the basic conditions for an agreement to be an overlapping consensus. In accordance with what Rawls (1993) discusses, it can concisely be stated that in order for an agreement to be conceived of as an overlapping consensus, it is to be reached thorough free public justification and equal participation of the members of a pluralistic society, and it is to be affirmed and complied with by those who hold incommensurable comprehensive doctrines from their own perspectives – not from the perspective of a particular comprehensive doctrine – and because they consider the agreement to be just. Now, let us discuss the agreement on education in Turkish society in light of these conditions to determine if it can be counted as a narrow overlapping consensus.
A Historical Overview of Educational Reforms in Turkey
The Tanzimat era appears to be a phase of history to which the modernization of Turkish society and the Turkish education system can be traced. For this reason, an overview of this modernization process may be a plausible first step in determining whether the current system meets the conditions for a narrow overlapping consensus. The educational reforms implemented during the early republican period and the current educational developments that have been undertaken by the Justice and Development Party (JDP) administration appear to have special importance in arriving at a conclusion about this matter. The long debate between secular and Islamic worldviews has been reflected in the educational policy of the Turkish Republic. Thus, after a historical discussion about educational reforms and the current situation of Turkish education, I shall conclude whether currently there is a narrow overlapping consensus on education in Turkey.
Early Republican Period and Foundations of Education. Before the Tanzimat era, the main types of schools were Sibyan schools, Enderun, and Medreses. Sibyan schools were private primary schools that taught students based on Islam. Enderun schools taught children from non-Muslim families and educated them to become soldiers, commanders, and statesmen for the Ottoman Empire at different levels up to the position of Grand Vizier and Sheikh-ul Islam. Medreses in general, correspond to contemporary universities, in which various but mostly religious fields were studied as taught by prominent scholars. Those who graduated from Medreses also served the Empire at various places and levels.
Beginning with the Tanzimat era, modernization also affected the education system of the Ottoman Empire. Different types of schools were established in order to modernize the education system based on western education systems. However, while new schools were introduced, the old system was barely changed. Consequently, the Ottoman Empire operated a dual education system during its last decades (Tekeli & İlkin, 1993; Evered, 2012). Also, the first modern course books appear during the Tanzimat era (Doğan, 2011). More specifically, the first western-style course books were introduced in 1850 (Arslan, 2010). However, most of the books taught in schools were translations and adaptations of western course books until the establishment of the Republic of Turkey (Arslan, 2010).
The social and political problems that led the Ottoman Empire to collapse also created a fundamental concern for the integrity of the newly established Republic of Turkey. Safeguarding the survival of the new state appeared to be a most vital issue for the founders. Nationalism based on Turkism was embraced as the basis for the new nation-state. Creating national solidarity based on a common language, history, and cultural traits regardless of ethnic and religious differences was the aim of the social and political reforms implemented during the early Republican period, with the ultimate goal of Turkey becoming a developed western-style democratic state. A complete transition to democracy, including political, economic, and cultural transformation, was vital in creating a specifically Turkish nation-state. Education in this transition process was conceived of an essential instrument for reshaping the social order, informing citizens about democratic ways of life, and disseminating the new ideology. For this reason, a basic feature of Turkish modernization since the establishment of the Turkish Republic appears to be a state-centric educational project (Akinoglu, 2008; Çayır & Gürkaynak, 2008; İrem, 2012; Özsoy, 2009).
To realize this transition to democracy, the Atatürk administration appealed to the experiences of foreign educators during the establishment of the Republic of Turkey. For example, John Dewey, who has been the most influential foreign thinker within the Turkish education system, was invited to make an educational proposal for Turkey
89
The Online Journal of New Horizons in Education Volume 4, Issue 1
www.tojned.net
in 1924. His notion of progressive education in this proposal influenced educational reforms and regulations in the following decades (Bilgi & Özsoy, 2005; Kazamias, 1966; Tarman, 2011; Uygun, 2008). Dewey’s idea of democratic education helped in developing among new generations an understanding of democracy in Turkey, even though the educational reforms influenced by Dewey’s report reveal a conceptual gap between Dewey’s ideas about democracy and the ideology of the Turkish Republic (Dorn & Santoro, 2011).
One of the most important educational reforms at this time is the Law for the Unification of National Education, enacted on March 3, 1924, which is still in effect as mentioned above. Also, the adoption of Latin script in 1928 and the law passed in 1931 that required all children to attend Turkish schools in order to develop a national consciousness and prevent foreign influence over children are seen as among the most important policies (Önsoy, 1991). The 1924 educational law primarily aimed at establishing a single system to replace the dual system established in the Tanzimat era. The old system was abandoned and the new education system was reorganized under the control of the Ministry of National Education.
In fact, the educational policy of the Atatürk era primarily aimed at overcoming the duality between the old and new education systems, organizing the new system based upon a state-centric ideology derived from Turkish nationalism, and disseminating the Kemalist worldview to every corner of the country through education (Ergün, 1982). For example, the first curriculum of the Republic, which was developed in 1924, disregarded such topics as the sultanate, the Ottoman dynasty, and the Caliphate while introducing new topics such as the Turkish Independence War, the establishment of the Turkish Republic, and the abandonment of the Caliphate in order to develop national solidarity and obedience to the newly established state (Arslan, 2010). In the following years, the main civic aims of education became obvious. For example, the aim of primary education program was stated as “raising good citizens” in 1926, “raising people physically and psychologically fit to be Turkish citizens” in 1929, and “raising republican, statist, secular, [and] revolutionary citizens” in 1936 (Çayır & Gürkaynak, 2008, p.51).
Disseminating a new worldview of the Turkish Republic was a main educational strategy to achieve a democratic culture in Turkey. By 1935, Kemalism became a complete system of thought. Kemalism was announced in the 1935 congress of the Republican People’s Party (RPP) as a systematized ideology with four cardinal principles – Fatherland, Nation, Constitution, and Public Rights – and six essential principles – Republicanism, Nationalism, Populism, Statism, Secularism, and Reformism – which were later adopted in Article 2 of the Constitution of the Republic of Turkey (Kili, 2003). As mentioned above, these principles still constitute the legal foundations of Turkish education based on the current Constitution of the Turkish Republic. Education in the early Republican period, in sum, was conceived of as a main instrument in organizing society and forming citizens’ notions of democracy and was aimed at disseminating an understanding of a democratic nation-state and developing a society unified by sentimental allegiance to national traits.
Civic Knowledge in Course Books. As stated in the Constitution and Laws that regulate the education system in Turkey, education is to develop citizens in accordance with what is officially defined by the state. At this point, a look at course books on citizenship that have been influential in developing students’ conceptions of themselves as citizens may be of help in arriving at a conclusion about whether a narrow overlapping consensus on education exists in Turkey. These books are significant because the MONE, which is responsible for administering the centralized education system, is also the sole authority over curriculum and course books throughout the nation.
As briefly mentioned above, the Board of Education is an important organization of the MONE reporting to the Minister of Education. The Board of Education as it was renamed in 1983, was first established in 1926 as the National Education and Instruction Office based on the law about the organization of education (Law No: 789). The Board of Education is primarily responsible for analyzing the progress of the education system, providing suggestions that may lead to future progress of Turkish education, developing and revising curriculum, determining the content of course books, and approving course books to be used in schools. In other words, no book can be taught in any course without approval of the Board of Education. Course books are developed in accordance with educational programs that comply with the general aims and principles of Turkish national education and represent the aims of education as outlined by the Board of Education. Particularly, the course books that are related to civic education reveal the conception of citizenship to be cultivated in students because all course books taught in that specific course align with the state’s perspective on democracy, the nation, and the individual.
Citizenship education was initiated using a course book entitled Information about the Fatherland in 1924 (Kadıoğlu, 2005). While the first course books did not state a definition of a citizen, those after 1929 began providing a definition of citizenship (İnce, 2012a). Until the 1950’s, course books taught in primary and secondary education stated a communitarian definition of the citizen as one who is devoted to the state and nation (Üstel, 2004). Course books during the early republican period emphasize such concepts as national unity and solidarity based on the idea of Turkishness (Çayır & Gürkaynak, 2008). Citizenship education in this period was based on duties rather than rights of citizens (Kadıoğlu, 2005).
90
The Online Journal of New Horizons in Education Volume 4, Issue 1
www.tojned.net
With the transition to a multi-party democracy, course books taught in 1950’s began including a notion of democracy with reference to that system (Çayır & Gürkaynak, 2008). The Democratic Party (DP), did not make substantial changes in the political order after defeating the RPP (Özbudun, 2008). Accordingly, the DP kept the educational policy of the previous period intact during its ruling period (İnce, 2012b). During the 1960’s, the duty-based notion of citizenship was replaced with an active and participatory notion of citizenship in accordance with the overall social and political atmosphere that is characterized as the most liberal period in the history of Turkey (Çayır & Gürkaynak, 2008; İnce, 2012b, Soyarık-Şentürk, 2005). Accordingly, course books emphasized pluralist democracy and rights of citizens rather than duties. However, as an outcome of the 1971 military involvement in politics, duties and passive citizenship became dominant notions in course books again (İnce, 2012b). The social and political chaos of the 1970’s and the following military coup of 1980 led authorities to intensify the emphasis on the conception of a single nation and shared national traits, while emphasizing internal and external threats to national unity as a central theme of course books (İnce, 2012b, Üstel, 2004). Until 2012, for example, a course titled National Security Knowledge was compulsory in tenth grade and was taught by military officers using course books written by a commission consisting of military staff. This course aimed at teaching students that the military was vital for Turkey given regional and global politics and at imposing upon students a comprehensive ideal of the military (Altınay, 2004). It also put an emphasis on external threats to the Turkish state, such as secret plans of neighboring states to seize the Turkish lands, which promoted xenophobia in students toward the neighbors of Turkey. This course was justified as preserving national unity and order (Çayır & Gürkaynak, 2008).
All the periods mentioned in the history of Turkish education share a common set of characteristics concerning citizenship education. For example, emphasis on citizenship, duties toward society and state, territorial integrity, principles and reforms of Atatürk, and unity in national features such as history, language, and ideals appear to be common to all these periods. As Çayır and Gürkaynak (2008) observe, all school curricula and courses have been developed in order to create patriotic and responsible citizens, and citizenship education, which emphasizes nationalist, duty-based, and militarist perspectives, is a cross-curricular theme in the Turkish education system.
Recent Developments in the Turkish Education System. A fundamental change in approach to primary school curriculum in Turkey was made in 2005. Prior to 2005, the approach to the primary education curriculum placed teachers at the center of instruction so that teachers were considered as the ultimate source of knowledge in classrooms while students were passive information receivers who were not encouraged to think critically (Koç et al., 2007). In 2005, in reaction to the inability of this approach to enable students to meet contemporary educational expectations, primary school education was reorganized in accordance with a student-centered model. With the new primary school curriculum, students began to be conceived of as individual beings with their own characteristics and relations to the environment, to their families, and to others. Students also became the center of instruction while teachers supposedly became instructors who encourage students to construct their own knowledge through inquiry, exploration, discussion, and reasoning (Koç et al., 2007).
For this reason, the new curriculum approach can be labeled student-centered. However, it appears to be more society-centered with regard to some other issues. For example, a competency-based curriculum also became a core element. The EU’s reports on Turkey and some non-governmental organizations contributed to this curriculum. For example, the EU’s progress reports on Turkey put emphasis on the importance of changing the education system to reflect the needs of a competition-based economy, which was also supported by some influential business associations in Turkey (Koşar-Altınyelken & Akkaymak, 2012). The main reasons for the changes in the structure of the curriculum appear to be based on the economic outcomes of the education system. For this reason, the JDP administration is criticized on the grounds that the demands of the market economy were the primary concern while social values of education were ignored. In this sense, therefore, the new approach to the curriculum places emphasis on society-centered educational aims more than student-centered outcomes.
In addition, critics argue that the JDP government adopted this reform because epistemological constructivism appealed to Islamist intellectuals – even though constructivism is often valued by secularists – because this version of constructivism allows a pedagogical method that supports a relativist understanding of scientific knowledge that rejects the universality of that knowledge (Ünder, 2012). According to Ünder (2012), the JDP adopted this version of the constructivist, student-centered approach to enable students to construct their own knowledge since it, as opposed to a positivist approach, provides space for religion, promotes a justification for religious education in schools, and enables students to interpret scientific knowledge from Islamic perspectives. It is also important to note that the content of the curriculum remained significantly the same as in the previous curriculum while the approach to instruction methods changed (Koç et al., 2007). In addition, teachers were neither sufficiently prepared for properly implementing the new approach in classrooms nor provided with the underlying philosophy that led this curriculum reform (Bıkmaz, 2006). Moreover, the educational outcomes of courses such as mathematics and social sciences remained predetermined, which indicates a contradiction with the student-centered approach in which students construct their own knowledge through their personal experiences (Bıkmaz, 2006).
91
The Online Journal of New Horizons in Education Volume 4, Issue 1
www.tojned.net
Considering these aspects of and criticisms of the new approach to the primary school curriculum, it appears that the JDP administration created a mixed and self-contradictory approach to curriculum while placing economic outcomes and religious education at the center of educational policy. In fact, this educational program of the JDP points to an important aspect of the Turkish education system. Education in Turkey has been subject to a dispute among secularists, the military, and Islamists since the establishment of the Turkish Republic. Most recent changes in the Turkish education system continue this conflict over education in Turkey.
With the most recent educational reform under Law No: 6287 enacted on March 30, 2012, compulsory education became twelve years long starting with the 2012-13 education year. Critics of the JDP and opposition parties opposed this reform primarily because they believed that the real purpose of the reform was to promote intensive religious education in schools and to enable Imam and Preacher Schools (IPSs) to flourish again. The RPP brought a suit against Law No: 6287 to the Supreme Court charging that some articles of the Law are in contradiction with various articles of the Constitution, especially with those that secure the secular structure of the Republic of Turkey. Yet, the Supreme Court concluded in September 20, 2012, in favor of Law No: 6287 as it was framed.
What has been brought about by this educational reform? Law No: 6287 made various changes in several laws that regulate the education system in Turkey. For example, compulsory basic education was previously eight years of primary school. Now compulsory education includes eight years of basic education, divided into four years of primary school and four years of middle school. Four years of high school education also became compulsory. Also, Law No: 6287 enabled middle schools to be integrated into either primary schools or high schools.
These aspects of Law No: 6287 aim to increase the amount of schooling and to develop an education system that complies with the demands of contemporary societies. However, such changes in the structure of primary education have raised concerns over the secular foundations of the Republic of Turkey. This reform is seen in secularist circles as a response to the previous educational reform that was enacted in 1997 in which compulsory basic education became an uninterrupted eight years long. Because of the military’s involvement in politics in 1997, the Islamist-oriented government resigned and various sanctions were imposed against Islamist organizations. At this time, the middle school system was abandoned and grades 6, 7, and 8 were included in primary education, which increased compulsory education to eight years of schooling from five. For this reason, middle school levels of high schools, including IPSs, were closed down, and religious education was limited to the high school level. With the most recent educational reform, however, not only were various elective religious courses included in the curriculum but also IPSs began flourishing and grades five to eight of such schools were reopened since Law No: 6287 allows combining the second four-year level with the third four-year level of compulsory education.
Why are IPSs of importance to this analysis? As mentioned above, the traditional dual education system was unified under the control of the MONE with the Law for Unification of Education in 1924. This Law also enabled the state to control religious education while closing down the old religious institutions, Medresses. IPSs were established in the first year of the Republic of Turkey in 29 districts and abandoned in 1932 on the grounds that the aims of the IPSs were in conflict with the secular structure of the education system of the Turkish Republic. IPSs were reopened in 1952 when the DP was in power. In the following decades, the number of IPSs increased, especially once religious education became compulsory in primary and secondary schools after the 1980 military coup as was required by the 1982 constitution (Öcal, 2007; Önsoy, 1991). Since the introduction of the multiparty system, right-wing conservative parties have used the dispute over IPSs as a way to gain popular support. Yet, the JDP’s educational policies reveal a closer relationship between the JDP and IPSs than was the case of any previous conservative party (Coşkun & Şentürk, 2012).
CONCLUSION
Turkish education is a profoundly centralized and state-controlled system. The Constitution and the Basic Law of National Education articulate the foundations of the education system and specify aims and principles of Turkish national education. The first significant educational reform in the twentieth century Turkish education appears with the Law for Unification of Education in 1924. This law unified and centralized the education system under the control of the MONE. It also placed religious education under the control of the state, which in the following decades led to tension between secularists and Islamists.
Early republican governments carried out a state-sponsored democratization project that primarily relied on the education of citizens about democracy and on disseminating the foundational principles of the state, such as secularism and nationalism. The Kemalist worldview and its principles became an essential component of the ideology of the Turkish Republic throughout the early period. The principles and reforms of Atatürk were codified in the Constitution, and their promotion has been a main aim of the Turkish education system.
Accordingly, civics education that aims to develop citizens for the Turkish Republic based on fundamental
92
The Online Journal of New Horizons in Education Volume 4, Issue 1
www.tojned.net
principles that are defined in the Constitution has been a main aspect of education in Turkey. In this manner, Turkish education has aimed at developing national citizens who are devoted to the indivisible Turkish nation, imbued with national sentiments, habituated to work for the ideals of the nation, and committed to secular democracy since the Atatürk era. In addition, the civic aims of Turkish education have been achieved not only through specific citizenship courses but also through various courses in the entire curriculum.
However, Turkish education that was established upon a Kemalist worldview has been a target for, especially, Islamist elements in Turkey who conceive of themselves as marginalized by the secularist structure of the state since they are committed to religious ways of life. Beginning with the multiparty system, the tension between secular and religious elements has been a central theme in Turkish politics, which also led the military to become involved in politics at different times as a self-proclaimed guardian of the Kemalist state.
IPSs, in which citizens are educated to be committed to an Islamic worldview have been at the center of this secular-religious conflict over education. Since the DP administration, conservative political parties have favored IPSs. The most recent educational reform revitalized the IPSs in reaction against the 1997 policy of the military and not only enabled IPSs to flourish but also introduced into the national curriculum various religious courses (Ünder, 2012). The JDP, moreover, has been unwilling to provide equal opportunities for other religious groups and even Islamic sects different from the one supported by the JDP. For example, the European Court of Human Rights, after considering the case that was brought against Turkey by an Alevi Muslim family, concluded on October 9, 2007, that the Turkish education system does not provide appropriate methods for ensuring respect for parents’ convictions and does not meet the requirements of objectivity and pluralism with regard to religious instruction (Akbulut & Usal, 2008). In the following school year, some information about the Alevi faith was included in religious course books at the twelfth-grade level, which was seen as a reluctant and unsatisfactory response to the case and did not alter the general opinion that the government has tried to Sunnify Alevis, since the state imposes a Sunni-Islamic worldview through religious education in state schools in Turkey (Akbulut & Usal, 2008).
These and various other incidents have led to the conclusion among the critics that the JDP has been imposing its worldview through education. This widely shared anxiety in secular circles was intensified when Erdoğan stated in early 2012 that the JDP administration aims to create “pious generations,” a statement that dominated public educational discussions especially during February 2012 and increased the worry among critics of the JDP that it is imposing a religious worldview through education. For some critics, such an aim has always been an underlying educational goal of the JDP government, which was eventually declared by Erdoğan once gaining political power over institutions of the state, such as the military and the Supreme Court, as well as the media (Ünder, 2012).
The first significant educational reform undertaken by the JDP administration was the 2005 curriculum reform. With the support of some influential international organizations and non-governmental associations in Turkey, the JDP government placed importance on the demands of the market economy. Course books after this reform began emphasizing certain personal characteristics such as those of producers, consumers, and entrepreneurs, while ignoring individual liberties and giving special prominence to religious elements in the curriculum as mentioned above (Koşar-Altınyelken & Akkaymak, 2012). For this reason, it can be argued that the educational aims of the JDP government have been, on the one hand, developing individuals for the market economy and, on the other hand, creating a society based on Islamic morals and values (İnal & Akkaymak, 2012). However, neither the 2005 curriculum reform nor the 2012 education reform were universally accepted. For example, some scholars and non-governmental organizations criticized the development process of the 2005 curriculum on the grounds that it excluded their involvement (Aksit, 2007). As mentioned above, the ongoing dissatisfaction with the 2012 reform also signifies that it was controversial.
In the final analysis, the Turkish education system was established as a part of a modernization project conducted by the central state authorities and has remained centralized and authoritarian. From the early republican period to the JDP administration, education has been a powerful instrument in the hands of ruling political organizations. Although the Turkish education system ostensibly aims to create a culture of democracy, ruling parties have shaped their educational policies in accordance with their own conceptions of democracy. In this sense, it can be concluded that a ruling political organization in Turkey uses political power – that is gained through democratic means – to promote its own comprehensive doctrine by means of the education system. In fact, considering the democratization project of the early republican period, the 1997 educational reform, and the recent educational reforms implemented by the JDP, none of the important phases in the recent history of Turkish education provides an example of a popular agreement on education achieved through free public justification and citizens’ equal participation in discussions on educational matters. Moreover, considering minority controversies including the Alevi-Sunni dispute over religious education and the tension between secular and religious worldviews, none of the educational reforms has been accepted by various groups in light of the comprehensive doctrines they affirm and because they believe that these reforms are just. In sum, considering the conditions given above for an agreement to be regarded as an overlapping consensus, it can be concluded that the educational reforms in the recent history of Turkish education and the principles derived from the
93
The Online Journal of New Horizons in Education Volume 4, Issue 1
www.tojned.net
Constitution have not been reached through free and equal participation of citizens based on public discussions of the meaning of equality and justice for education. Thus, there is not and has never been a narrow overlapping consensus on education in Turkey.
Moreover, the organizational structure of Turkish education system makes the state the sole authority over the education system and leaves almost no authority to local educational agencies, schools, parents, and students. As mentioned, the MONE has the right to determine curricula of all courses and books that are to be taught in classrooms nationwide, for example. Teachers are obliged to educate students in accordance with what is dictated by the central authority. In other words, teachers are responsible for implementing the decisions taken by the MONE. Unfortunately, with these characteristics and organizational features, the Turkish education system does not represent a narrow overlapping consensus on education.
However, the authoritarian and centralized structure of the Turkish education system that provides the ruling party with absolute power over education does not undermine the argument that Turkish society can agree upon a justice oriented education system. Turkey is a constitutional democracy. Yet, the common understanding of democracy in Turkey appears to be one that is not wide and deep enough to establish a culture of a just constitutional democracy that goes beyond a procedure to arrive at decisions in democratic ways. One way to contribute to the development of a culture of justice in a developing democracy, however, is promoting a proper educational approach that may help developing justice oriented reasonable citizens who may further the advancement of such culture in their society. In this regard, even though there is not a narrow overlapping consensus on education in Turkey that could allow us to discuss how to integrate a justice based educational approach into the current agreement on education, there might be other means to discuss how to, first, develop and, later, advance a justice oriented educational approach in Turkey. Therefore, a further research is to be conducted on the possibility of developing and applying a justice oriented educational account under the absence of a narrow overlapping consensus on education in Turkey.
ACKNOWLEDGEMENT
This article has been extracted from the author’s doctoral dissertation. The author expresses his gratitude to the committee members.
REFERENCES
Akbulut, O., & Usal, Z. O. (2008). Parental Religious Rights vs. Compulsory Religious Education in Turkey. International Journal on Minority and Group Rights, 15, 433-455.
Akinoglu, O. (2008). Primary Education Curriculum Reforms in Turkey. Word Applied Science Journal 3(2), 195-199.
Aksit, N. (2007). Educational Reform in Turkey. International Journal of Educational Development, 27, 129-137.
Arslan, E. (2010). The First Course Books of Turkish Republic. Education and Science, 35(158), 215-231.
Altınay, A. G. (2004). Human Rights or Militarist Ideals?: Teaching National Security in High Schools. In D. T. Ceylan & G. Irzık (Eds.), Human Rights Issues in Textbooks: The Turkish Case (76-90). Istanbul: The History Foundations of Turkey.
Bıkmaz, F. (2006). An Analysis of the Curriculum Reform Movement in Turkey. International Journal of Educational Reform, 15(2), 202-212.
Bilgi, S., & Özsoy, S. (2005). John Dewey’s Traveling into the Project of Turkish Modernity. In T. S. Popkewitz (Ed.), Inventing Modern Self and John Dewey: Modernities and the Traveling of Pragmatism in Education (153-177). New York: Palgrave Macmillan.
Bull, B. L. (2008). A Politically Liberal Conception of Civic Education. Studies in Philosophy and Education, 26(6), 449-460.
Bull, B. L. (2012). A Sketch of Politically Liberal Principles of Social Justice in Higher Education. Philosophical Studies in Education, 43, 26-38.
94
The Online Journal of New Horizons in Education Volume 4, Issue 1
www.tojned.net
Çayır K., & Gürkaynak İ. (2008). The State of Citizenship Education in Turkey: Past and Present. Journal of Social Science Education, 6(2), 50-58.
Coşkun, M. K., & Şentürk B. (2012). The Growth of Islamic Education in Turkey: The AKP’s Policies toward Imam-Hatip Schools. In K. İnal & G. Akkaymak (Eds.), Neoliberal Transformation of Education in Turkey (165-177). New York: Palgrave Macmillan.
Doğan, N. (2011). An Analysis of the idea of State in Textbooks from Ottoman Empire to the Republic in Terms of the Relation between Education and Power. Educational Sciences: Theory and Practice, 11(4), 2084-2090.
Dorn C., & Santoro, D. A. (2011). Political Goals and Social Ideals: Dewey, Democracy, and the Emergence of the Turkish Republic. Education and Culture, 27(2), 3-27.
Ergün, M. (1982). Atatürk Devri Türk Eğitimi. Ankara: Ankara Universitesi Basımevi.
Evered, E. (2012). Empire and Education Under the Ottomans: Politics, Reforms, and Resistance from the Tanzimat to the Young Turks. New York: I.B. Taurus.
İnal K., & Akkaymak, G. (Eds.). (2012). Neoliberal Transformation of Education in Turkey. New York: Palgrave Macmillan.
İnce, Başak. (2012a). Citizenship and Identity in Turkey: From Ataturk’s Republic to the Present Day. New York: I.B. Tauris.
İnce, B. (2012b). Citizenship Education in Turkey: Inclusive or Exclusive. Oxford Review of Education, 38(2), 115-131.
İrem, Nazım. (2002). Turkish Conservative Modernism: Birth of a Nationalist Quest for Cultural Renewal. International Journal of Middle East Studies, 34(1), 87-112.
Kadıoğlu, A. (2005). Can We Envision Turkish Citizenship as Non-membership?. In E. F. Keyman & A. İçduygu (Eds.), Citizenship in a Global World: European Questions and Turkish Experiences (105-123). New York: Routledge.
Kazamias, A. M. (1999). Education and the Quest for Modernity in Turkey. London: George Allen & Unwin Ltd.
Kili, S. (2003). The Ataturk Revolution: A Paradigm of Modernization. İstanbul: Turkiye İş Bankası Kültür Yayınları.
Koç, Y., Isiksal, M., & Bulut, S. (2007). Elementary School Curriculum Reform in Turkey. International Education Journal, 8(1), 30-39.
Koşar-Altınyelken, H., & Akkaymak, G. (2012). Curriculum Change in Turkey: Some Critical Reflections. In K. İnal & G. Akkaymak (Eds.), Neoliberal Transformation of Education in Turkey (59-70). New York: Palgrave Macmillan.
Levinson, M. (1999). The Demands of Liberal Education. New York: Oxford University Press.
Macedo, S. (1995). Liberal Civic Education and Religious Fundamentalism: The Case of God v. John Rawls? Ethics, 105(3), 468-96.
Öcal, M. (2007). From Past to the Present: Imam and Preacher Schools in Turkey: An Ongoing Quarrel. Religious Education, 102(2), 191-205.
Önsoy, R. (1991). Cumhuriyetten Bugüne İlk ve Ortaöğretimimiz ve Bazı Meseleleri. Hacettepe University the Journal of Education 6, 1-23.
Özbudun, E. (2008). The Politics of Constitution Making. In A. Çakıroğlu & W. Hale (Eds.), The Politics of Modern Turkey, vol. 2, (3-21). New York: Routledge, 2008.
Özsoy, S. (2009). “Turkish Modernization,” Democracy, and Education: An Analysis from Dewey’s Perspective. Educational Sciences: Theory and Practice, 9(4), 1925-1931.
Rawls, J. (1993). Political Liberalism. New York: Columbia University Press.
Rawls, J. (2001). Justice as Fairness: A Restatement. Erin Kelly (Ed.). Cambridge: Harvard University Press.
Reidy, D. (1996). Education for Citizenship in a Pluralist Liberal Democracy. The Journal of Value Inquiry, 30, 25-42.
95
The Online Journal of New Horizons in Education Volume 4, Issue 1
www.tojned.net
Shils, E. (1995). Some of the Modern Roots of Liberal Democracy. International Journal on World Peace, 12(3), 3-37.
Soyarık-Şentürk, N. (2005). Legal and Constitutional Foundations of Turkish Citizenship: Changes and Continuities. In F. Keyman & A. İcduygu (Eds.), Citizenship in a Global World: European Questions and Turkish Experiences (124-143). New York: Routledge.
Tarman, B. (2011). Development of Social Studies Curriculum in Turkey and John Dewey’s Effect on the Modernization of Turkish Education. International Journal of Progressive Education, 7(1), 45-61.
Tekeli, İ., & and İlkin, S. (1993). Osmanlı İmparatorluğu’nda Eğitim ve Bilgi Sisteminin Oluşumu ve Dönüşümü. Ankara: Turk Tarih Kurumu Basımevi.
Ünder, H. (2012). Constructivism and the Curriculum Reform of the AKP. In K. İnal & G> Akkaymak (Eds.), Neoliberal Transformation of Education in Turkey (33-45). New York: Palgrave Macmillan, 2012.
Üstel, F. (2004). Makbul Vatandaşın Peşinde. İstanbul: İletişim Yayınları.
Uygun, S. (2008). The Impact of John Dewey on the Teacher Education System in Turkey. Asia-Pacific Journal of Teacher Education, 36(4), 291-307.
On-Line Sources
John Dewey, “Report and Recommendation upon Turkish Education,” The Middle Works of John Dewey, 1899-1924, Volume 15: 1923-1924, Essays (Electronic Edition): http://www.library.nlx.com/xtf/view?docId=dewey_ii/dewey_ii.20.xml;chunk.id=div.mw.15.57;toc.depth=1;toc.id=div.mw.15.57;brand=default#), 274-99.
The Basic Law of National Education. Available: http://mevzuat.meb.gov.tr/html/88.html, accessed November 18, 2013.
The Constitution of the Republic of Turkey. Available: http://global.tbmm.gov.tr/docs/constitution_en.pdf, accessed November 18, 2013.
The ECHR’s decision on the Case of Hasan and Eylem Zengin vs. Turkey, available at the official website of the ECHR http://hudoc.echr.coe.int/sites/eng/pages/search.aspx?i=001-82580#{"itemid":["001-82580"]} accessed April 24, 2013.
The Law for the Unification of Education. Available: http://mevzuat.meb.gov.tr/html/110.html, accessed November 18, 2013.
The Law No: 4306 can be found at http://mevzuat.meb.gov.tr/html/126.html, accessed May 9, 2013.
The official declaration of the Law No: 6287, Resmi Gazete http://www.resmigazete.gov.tr/main.aspx?home=http://www.resmigazete.gov.tr/eskiler/2012/04/20120411.htm&main=http://www.resmigazete.gov.tr/eskiler/2012/04/20120411.htm, accessed May 9, 2013.
96
The Online Journal of New Horizons in Education Volume 4, Issue 1
What Makes Them Still Tick? A Study of Job (Dis) Satisfaction among Long Serving Teachers in Malta Brian Vassallo [1]
[1] Malta [email protected]
ABSTRACT
The paper seeks to investigate factors leading to teacher job satisfaction or dissatisfaction among a sample of 108 long-serving teachers in Malta. Literature on teacher satisfaction shows that teachers are increasingly dissatisfied with their work and this has prompted the researcher to delve into the concept to teacher job (dis)satisfaction among long-serving Maltese teachers by identifying factors affecting both phenomena. The researcher identifies the relationships which job satisfaction has with respect to a number of teachers’ characteristics such as age, teaching experience and sector of education. He also identifies the frequency of factors responsible for levels of job dis(satisfaction). A mixed method of investigation was used throughout the study. Results show that long-serving teachers derive great satisfaction from working with their students and from contributing to society. The study concludes by suggestions aimed at counteracting the effects of job dissatisfaction factors.
Keywords:
INTRODUCTION
Job satisfaction as a social construct does not have a precise definition despite having drawn the attention of a number of researchers. Teacher job satisfaction may be defined as the teacher’s “affective relation to his or her teaching role and is a function of the perceived relationship between what one wants from teaching and what one perceives it is offering to a teacher” (Zembylas &Papanastasiou, 2006). According to Spector (1997), job satisfaction is defined as “simply how people feel about the different aspects of their jobs”. Additionally, Mbua (2003) defines job satisfaction as “the fulfillment acquired by experiencing various job activities and rewards” whereas for Robbins (2005), the concept job satisfaction refers to the employee’s feelings about her or his job. Similarly, job satisfaction is “a positive feeling about one’s job resulting from an evaluation of its characteristics” (Robbins & Judge, 2008). However, Evans (1997) contends that whether researchers in this field agree or disagree on the definition of certain concepts is not an issue of significance. Job dissatisfaction is not the contrary of job satisfaction. According to the Merriam-Webster online dictionary (Merriam-Webster, online, 2013) the term dissatisfaction denotes “an emotion felt when one’s expectations are not met”. This is similar to Saari and Judge (2004), who argue that an employee’s attitudes towards her or his work are either positive or negative. Therefore, if workers have negative attitudes towards their work, they are then said to be dissatisfied.
Research on Teacher Satisfaction
Research on job satisfaction is one the most classic in academic literature. Among the most famous is the Hawthorne study carried out by the Western Electric company at their Hawthorne plant in the 1920's (Franke &Kaul, 1978). Recent studies have however devoted particular focus on particular professions notably the teaching profession. Naylor (2001) claims that teaching is mirroring society’s tendency towards harder while (Hargreaves, 1994) suggested that teaching is becoming more “intensified”. Lack of professional autonomy, imposed accountability procedures,
www.tojned.net
97
The Online Journal of New Horizons in Education Volume 4, Issue 1
curricular changes, meager resources, lack of recognition from society and low pay have an impact on low teacher job satisfaction levels in many countries. (e.g. Dinham and Scott, 1998, 2000a; Scott et al., 2001; Vandenberghe & Huberman, 1999; van den Berg, 2002). The effects of these trends include lower job satisfaction levels, lack of aptitude to meet students’ needs, increase in emotional disorders leading to stress, anxiety, and increased absenteeism (Farber, 1991; Troman & Woods, 2000). Also, and perhaps more significant, is the link between teacher dissatisfaction and teachers leaving the profession (Huberman, 1993; Woods et al., 1997). Thus, job satisfaction research among those in the teaching profession is becoming an integral part of policy making exercises since a significant number of teachers are leaving the profession and those who remain are besieged by feelings of discontent and distress.
Research on job satisfaction conducted by Dinham and Scott (2002) has shown that teachers derive satisfaction
by matters intrinsic to the role of teaching such as student successes, counseling students, positive relationships with parents and students, and personal growth. External factors such as salaries, holidays and working hours did not rank high in teacher satisfaction levels. It is for this multiplicity of reasons that researchers (Eg: Bonsangand & Farber, 1991; Friedman & Farber, 1992; Kyriacou, 1987; Mykletun, 1984; Kyriacou & Sutcliffe, 1979; Smithers & Robinson, 2001) argue that context seems to be the most powerful predictor of overall satisfaction. As Cherniss (1995) points out: “People can make their lives better or worse but what they think, how they feel and what they do are strongly shaped by the social contexts in which they live”.
Other studies have concluded that teacher job satisfaction is clearly related to levels of intrinsic motivators such as the intellectual challenge of teaching and promoting professional growth. On the other hand, teachers perceived job dissatisfaction has also been linked to work overload, poor pay and the portrayal of teachers by the media. A number of studies have also focused on individual and school characteristics as determinants of job satisfaction (Eg: Rapti & Karaj, 2012). Lawler (1973) argued that teacher satisfaction refers to a teacher’s affective relation to his or her job and depends on perceived relationship between what one wants and what one achieves from the teaching itself. On a similar line of thought, Watt and Richardson (2008) argue that career development aspirations are important factors in job satisfaction. Therefore if the teaching environment does not facilitate the satisfaction needs of teachers, then teachers are unhappy and unproductive. On a rather parallel track, Maeroff described teachers’ “sense of empowerment” as a major way “to make teachers more professional and to improve their performance” (1998).
Singh and Rawat (2010) and Shann (2001) identified other factors that contribute to increased teacher discontentment: problems arising from changes in administrative routines, overwork – especially paperwork, students’ evaluations, schools’ grading procedures, behavior problems, low pay, student indiscipline, few possibilities for career progression and the overall decline of society’s esteem towards teaching. Furthermore, Arnett and Polkinghorne (2010) identified the following factors as contributing to teacher’s satisfaction or dissatisfaction: nature of recent education reforms, inclusion of students with special needs, support and recognition from school administrators, teacher’s salary, physical conditions of the school, daily work of teaching itself, class size, student discipline and behavior, lack of resources and lack of opportunities for career progression.
In 1997, the US Department of Education conducted a large scale on American teachers. The study showed that a large proportion of American teachers were not happy with their workload, lacked resources to perform their duties, lacked support school administrators and were not happy with the auditing procedures used to evaluate their work. The report identified “more administrative support and leadership, good student behavior, a positive school atmosphere, and teacher autonomy” as the working conditions that were associated with higher teacher satisfaction (US Department of Education, 1997). Other factors such as sector of education (state or independent schools), teachers’ background characteristics or school demographics were not influential towards increasing levels of job satisfaction. The study also found that those teachers who received parental support reported higher levels of job satisfaction than teachers who did not. The study also revealed that there was no correlation between teacher satisfaction and benefits such as salary, holidays and working hours. Research conducted by Lumsden (1998) showed that teachers spent most of their time in the classroom and therefore had few opportunities to share their successes with colleagues. Hence they tended to rely more often on the students’ level of response.
The MetLife Survey of the American Teacher (Markow & Pieters, 2012) revealed some interesting results which
are interesting to the context of our study:
www.tojned.net
98
The Online Journal of New Horizons in Education Volume 4, Issue 1
o Teacher job satisfaction has dropped 15 points since 2009, from 59% who were very satisfied to 44% who are
very satisfied, the lowest level in over 20 years. o The percentage of teachers who say they are very or fairly likely to leave the profession has increased by 12
points since 2009, from 17% to 29%. o The percentage of teachers who do not feel their job is secure has grown since 2006 from eight percent to
34%. o Majorities of parents and teachers say that public school teachers are treated as professionals by the
community (71% of parents, 77% of teachers), that public school teachers’ health insurance benefits are fair for the work they do (63% of parents, 67% of teachers), and that public school teachers’ retirement benefits are fair for the work they do (60% of parents, 61% of teachers).
o Slightly more than half (53%) of parents and two-thirds (65%) of teachers say that public school teachers’ salaries are not fair for the work they do.
o Teachers with lower job satisfaction are less likely than others to feel that their job is secure (56% vs. 75%) or that they are treated as a professional by the community (68% vs. 89%).
o Teachers with lower job satisfaction are more likely to be in schools that have had layoffs of teachers (49% vs. 37%) or other school staff (66% vs. 49%), or the reduction or elimination of arts or music programs (28% vs. 17%), after-school programs (34% vs. 23%), or health or social services (31% vs. 23%).
o Teachers with lower job satisfaction are more likely to report that in the last year they have seen increases in: average class size (70% vs. 53%), students and families needing health or social services (70% vs. 56%), students coming to school hungry (40% vs. 30%), students leaving to go to another school (22% vs. 12%), and students being bullied/harassed (17% vs. 10%), (ibid, 2012).
Other factors have been suggested that promote teacher’s enthusiasm and how these factors are related to teacher satisfaction. These include opportunities to try new ideas, participation in decision-making and reform efforts, social relations, self-esteem, independence, intellectual growth, expression of creativity and opportunity for learning (Barnabe and Burns, 1994; Bishay, 1996; Borg and Riding, 1991; Dinham and Scott, 2000b; Evans, 1998, 2001; Odell and Ferraro, 1992; Zigarelli, 1996). Researchers of the International Teacher 2000 Project also identified a “three domain model” of teacher career satisfaction which highlights “the growing yet variable influence and importance of societal based factors and forces which are acting to influence teacher and school executive career satisfaction, dissatisfaction and stress” (Dinham and Scott, 2000a). The report also highlighted that, an overemphasis on educational attainment, lack of participation in decision-making processes, failure to provide essential instructional resources, lack of administrative support, and lack of trust in the professional expertise of teachers seem to increase the degree of teacher dissatisfaction (Kelchtermans, 1999; van den Berg, 2002). Dinham et al, (2000) reported that teachers rated their overall satisfaction as low and many found themselves more dissatisfied as their career into teaching progressed however, levels of dissatisfaction were not uniform across all aspects of the work.
The Organization for Economic Co-operation and Development (OECD)’s report Teachers Matter found that the numbers of teachers retiring reached large proportions in schools residing in disadvantaged areas and could not predict a positive change in the recruitment and retention of teachers in such schools (McKenzie & Santiago, 2005; Quartz, 2003; Guin, 2004). Some of these studies also portrayed long-serving teachers as being unmotivated as they reached the final stages of their career (e.g. Huberman, 1993). Other researchers presented more positive images of teachers who, in these later years, have reached a sense of purpose and fulfillment (Cohen and Moffitt, 2009; Day and Gu, 2013). Similarly, Woods and Weasner explain that teachers who began teaching in the 1980s have had to engage in identity work “as they have had to realign their values in their later working lives as the human element gives way to the commodified experience” (2002: 96). Goodson and Hargreaves suggest that this has been a deliberate consequence of globalised educational discourses such as “school improvement” and “performance management” (1996). Long serving teachers have experienced a move to a performance culture, characterized by targets and accountability, within the workplace where, according to Ball, ‘value replaces values –commitment and service are of dubious worth within the new policy regime’ (2003: 217). It is this emphasis on accountability and the administrative aspects of teaching that has led to the production of policy documents encapsulating the official view of what constitutes teachers’ work. It has also been recognized that experienced teachers differ from less experienced ones in terms of knowledge, attitudes and skills and therefore it can be concluded that they also differ in their professional and development needs. Hence, as teachers continue to advance in their career, the importance of lifelong professional learning becomes of vital importance.
www.tojned.net
99
The Online Journal of New Horizons in Education Volume 4, Issue 1
The Maltese Educational System and the Social Context of the Study
The Maltese Educational system offers a three tier system of elementary and secondary education. The Maltese
government offers free and compulsory education to all children from the age of 5 to the age of 16, regardless of gender, beliefs or socio-economic background. The system provides education from state, church and independent schools which offer curricula to children and adolescents from elementary to secondary, and sometimes even upper-secondary education. The Education Act of 1988 provides the necessary guidelines upon which schools operate. Students may then proceed to Junior College or opt to study at the Malta College of Arts Science and Technology or the Institute for Tourism Studies. Here students specialize in specific subject and may also further their studies at the University of Malta.This study took place in parallel with a consultation strategy for the Maltese National Curriculum framework which took place between May 2011 and January 2012. In the document entitled ‘The National Curriculum Framework 2011, The Way Forward’, the Ministry of Education, Employment and the Family is calling for a paradigm shift in the way learning, teaching and the curriculum are perceived by the various professionals working within the educational system. Through its document, the Maltese Ministry of Education is furthering its commitment towards a collective effort to “challenge the status quo, to challenge entrenched views and positions and to create meaning with different stakeholders” (MEDE, 2011). The document emphasizes the commitment from all stakeholders and is strongly urging everyone to take part in the consultation and implementation phases. Currently, the Maltese National Curriculum framework is under a period of evaluation and it is hoped that the study provides insight into the various reforms intended by the Ministry.
METHODOLOGY
The snowball sampling method was used to recruit teachers for the study. Teachers were asked to indicate other teachers with long term experience as teachers and who were willing to participate in the questionnaire and interviews. The research was carried out over two years, from March 2010-March 2012. The first part of the study consisted of data collection through a survey sent by e-mail to elementary and secondary school teachers (with at least 20 years of teaching experience) in Malta and in its sister island Gozo. The purpose of the questionnaire was primarily to elicit demographic data and other information related to Teacher Job Satisfaction. Secondly, the survey would also provide the researcher with a group of teachers that would compose a solid base on which interviews could be conducted. Overall, there were 108 respondents who took part in this phase. In the second phase of the study, interviews were conducted through skype (a voice-over-Internet Protocol service) with 52 teachers. While the quantitative method provided insight as to what factors are incumbent on satisfaction or dissatisfaction, the qualitative method provided more opportunity to examine other sources which might have a contribution and also to triangulate evidence obtained from quantitative methods.
Quantitative Method
The main objectives of the quantitative method was to investigate the extent to which in-service teachers differ in their satisfaction levels on a number of background variables namely age, gender, years of experience, sector of education and highest qualification reached. The first part of the questionnaire consisted of demographic data related to respondents. The second part of the questionnaire asked participants questions related to their level of satisfaction with regards to their teaching profession, including whether they were influenced in choice of profession, the extent of which they are satisfied with the school administration, their current working conditions, opportunities to participate in seminars, involvement in school decision making, the current auditing procedures and others. The questions on this section of the questionnaire were measured on a 7-point likert scale that ranged from 1=highly dissatisfying, to 7= highly satisfying. Hence, the maximum score of job satisfaction as indicated by the questionnaire was that of 294 (42x7) while minimum was 42 (42x1).
Qualitative Method The qualitative study was designed to shed light to the following research questions:
1. What are the critical factors influencing job satisfaction among long-serving Maltese teachers? 2. What are the critical factors influencing job dissatisfaction among long-serving Maltese teachers? 3. To what extent are these factors (satisfying or dissatisfying) influencing the commitment of teachers to
further extend (or not extend) their number of years in teaching.
The interviews typically lasted around 45 minutes providing plenty of opportunity for interviewees to express themselves freely. The interviews were semi-structured based on a small number of basic questions on what satisfied
www.tojned.net
100
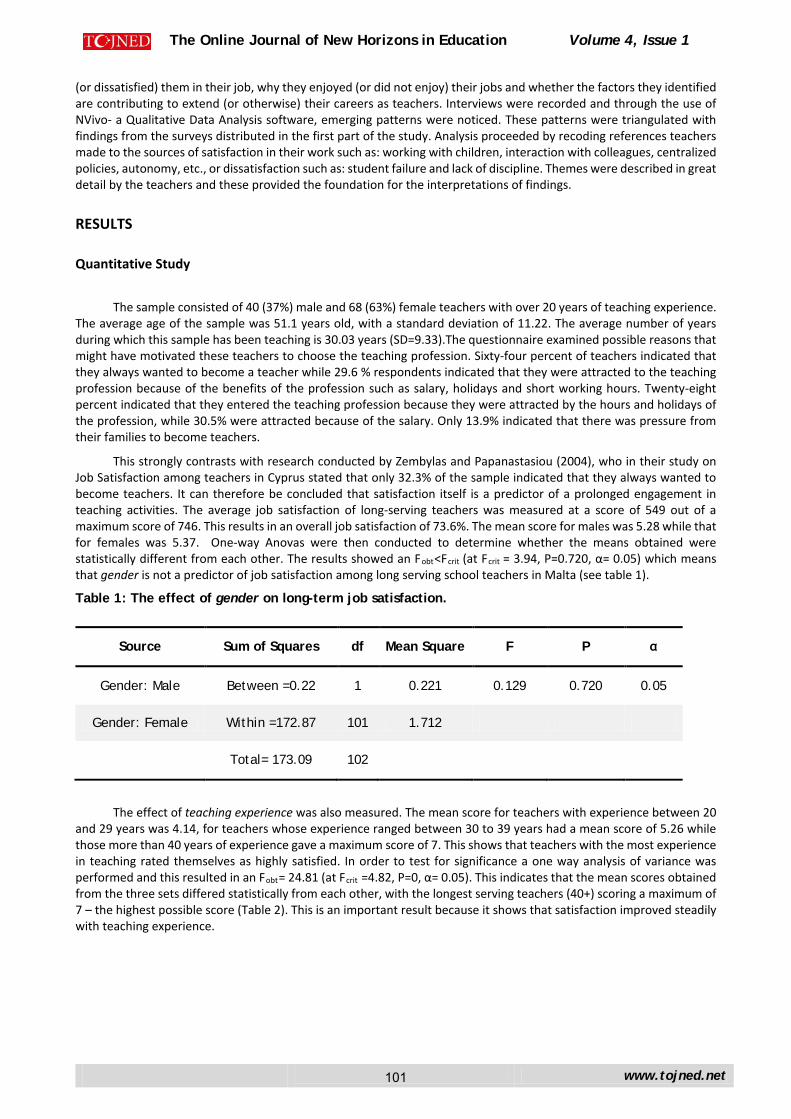
The Online Journal of New Horizons in Education Volume 4, Issue 1
(or dissatisfied) them in their job, why they enjoyed (or did not enjoy) their jobs and whether the factors they identified are contributing to extend (or otherwise) their careers as teachers. Interviews were recorded and through the use of NVivo- a Qualitative Data Analysis software, emerging patterns were noticed. These patterns were triangulated with findings from the surveys distributed in the first part of the study. Analysis proceeded by recoding references teachers made to the sources of satisfaction in their work such as: working with children, interaction with colleagues, centralized policies, autonomy, etc., or dissatisfaction such as: student failure and lack of discipline. Themes were described in great detail by the teachers and these provided the foundation for the interpretations of findings.
RESULTS
Quantitative Study
The sample consisted of 40 (37%) male and 68 (63%) female teachers with over 20 years of teaching experience. The average age of the sample was 51.1 years old, with a standard deviation of 11.22. The average number of years during which this sample has been teaching is 30.03 years (SD=9.33).The questionnaire examined possible reasons that might have motivated these teachers to choose the teaching profession. Sixty-four percent of teachers indicated that they always wanted to become a teacher while 29.6 % respondents indicated that they were attracted to the teaching profession because of the benefits of the profession such as salary, holidays and short working hours. Twenty-eight percent indicated that they entered the teaching profession because they were attracted by the hours and holidays of the profession, while 30.5% were attracted because of the salary. Only 13.9% indicated that there was pressure from their families to become teachers.
This strongly contrasts with research conducted by Zembylas and Papanastasiou (2004), who in their study on Job Satisfaction among teachers in Cyprus stated that only 32.3% of the sample indicated that they always wanted to become teachers. It can therefore be concluded that satisfaction itself is a predictor of a prolonged engagement in teaching activities. The average job satisfaction of long-serving teachers was measured at a score of 549 out of a maximum score of 746. This results in an overall job satisfaction of 73.6%. The mean score for males was 5.28 while that for females was 5.37. One-way Anovas were then conducted to determine whether the means obtained were statistically different from each other. The results showed an Fobt<Fcrit (at Fcrit = 3.94, P=0.720, α= 0.05) which means that gender is not a predictor of job satisfaction among long serving school teachers in Malta (see table 1).
Table 1: The effect of gender on long-term job satisfaction.
The effect of teaching experience was also measured. The mean score for teachers with experience between 20 and 29 years was 4.14, for teachers whose experience ranged between 30 to 39 years had a mean score of 5.26 while those more than 40 years of experience gave a maximum score of 7. This shows that teachers with the most experience in teaching rated themselves as highly satisfied. In order to test for significance a one way analysis of variance was performed and this resulted in an Fobt= 24.81 (at Fcrit =4.82, P=0, α= 0.05). This indicates that the mean scores obtained from the three sets differed statistically from each other, with the longest serving teachers (40+) scoring a maximum of 7 – the highest possible score (Table 2). This is an important result because it shows that satisfaction improved steadily with teaching experience.
Source Sum of Squares df Mean Square F P α
Gender: Male Between =0.22 1 0.221 0.129 0.720 0.05
Gender: Female Within =172.87 101 1.712
Total= 173.09 102
www.tojned.net
101

The Online Journal of New Horizons in Education Volume 4, Issue 1
Table 2: The effect of teaching experience on job satisfaction of long-serving teachers
Then, the effect of age on job satisfaction of long serving teachers was calculated. The mean score of teachers between 40-49 years of age was 4.54 while for those between 50 and 59 years was 5.06 while for those teachers whose age was more than 60, the mean score was 5.73. A One-way Analysis of Variance was computed to determine whether these results have statistical significance on the entire sample of teachers. This revealed an Fobt of 14.47 (against an Fcrit of 4.82, P=0, α=0.05). This means that the three means obtained were statistically different from each other with the oldest age scoring the highest on Job Satisfaction (Table 3). This result is of great significance since it illustrated the need for educational authorities to nurture teachers as they move into the later stages in their careers, as these are the most satisfactory.
Table 3: The effect of age on job satisfaction of long-serving teachers
Next, the effect of level of education (elementary or secondary) on job satisfaction was investigated and analysed. The sample revealed that from a sample of 108 teachers, 45(42%) were elementary school teachers while 63 (48%) were secondary school teachers. The mean score for long serving teachers at primary level of education was 5.66 while that at secondary level was 5.81. A one-way Analysis of Variance revealed that the two means did not differ statistically from one another (Fobt < Fcrit) with Fobt being scored as 0.88 (as compared with Fcrit of 6.90, p=0.35, α = 0.01) (Table 3). This means that the level of education taught (elementary or secondary) is not a predictor of job satisfaction for long-serving Maltese teachers.
Source Sum of Squares df Mean
Square F P α
Years of Experience (between 20 and 29 years)
Between =112.93 2 56.47 24.81 0 0.05
Years of Experience (between 30 and 39)
Within =238.97 105 2.28
Years of Experience (40+)
Total = 359.90 107
Source Sum of Squares df Mean
Square F P α
Years of Experience (between 40 and 49 years)
Between =20.59 2 10.30 14.47 0 0.05
Years of Experience (between 50 and 59)
Within =74.72 105 0.71
Years of Experience (60+)
Total = 95.31 107
www.tojned.net
102
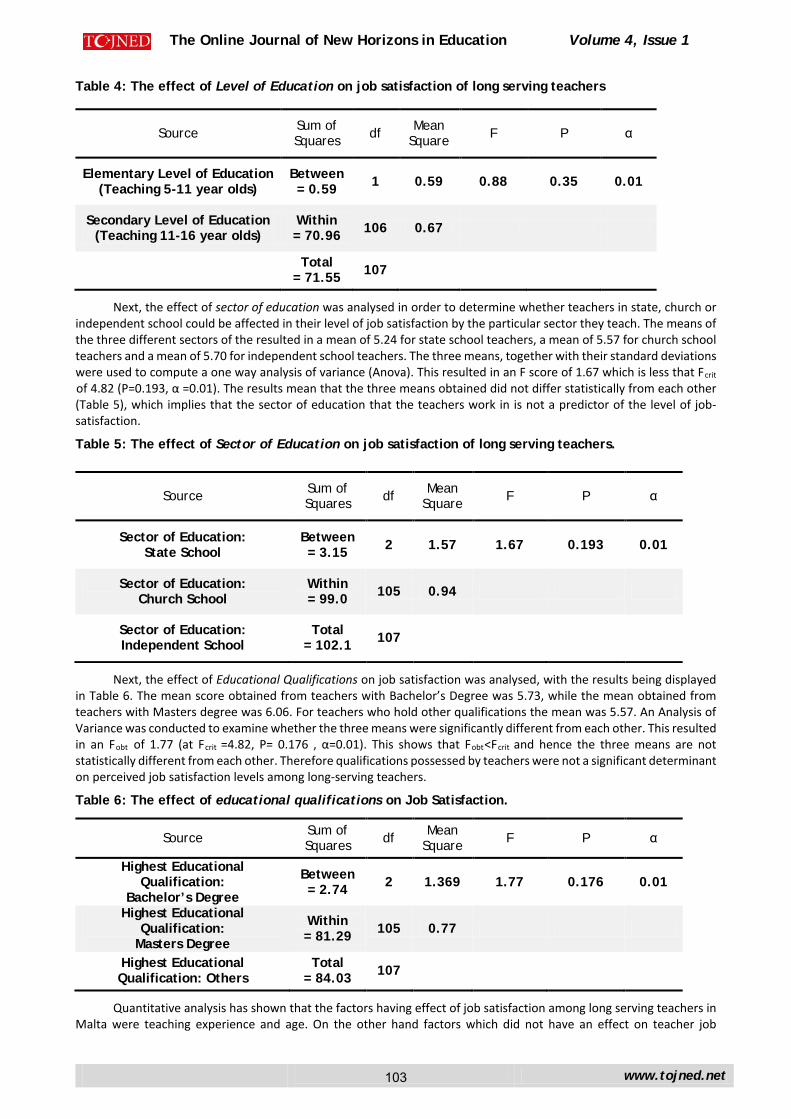
The Online Journal of New Horizons in Education Volume 4, Issue 1
Table 4: The effect of Level of Education on job satisfaction of long serving teachers
Next, the effect of sector of education was analysed in order to determine whether teachers in state, church or independent school could be affected in their level of job satisfaction by the particular sector they teach. The means of the three different sectors of the resulted in a mean of 5.24 for state school teachers, a mean of 5.57 for church school teachers and a mean of 5.70 for independent school teachers. The three means, together with their standard deviations were used to compute a one way analysis of variance (Anova). This resulted in an F score of 1.67 which is less that Fcrit
of 4.82 (P=0.193, α =0.01). The results mean that the three means obtained did not differ statistically from each other (Table 5), which implies that the sector of education that the teachers work in is not a predictor of the level of job-satisfaction.
Table 5: The effect of Sector of Education on job satisfaction of long serving teachers.
Next, the effect of Educational Qualifications on job satisfaction was analysed, with the results being displayed in Table 6. The mean score obtained from teachers with Bachelor’s Degree was 5.73, while the mean obtained from teachers with Masters degree was 6.06. For teachers who hold other qualifications the mean was 5.57. An Analysis of Variance was conducted to examine whether the three means were significantly different from each other. This resulted in an Fobt of 1.77 (at Fcrit =4.82, P= 0.176 , α=0.01). This shows that Fobt<Fcrit and hence the three means are not statistically different from each other. Therefore qualifications possessed by teachers were not a significant determinant on perceived job satisfaction levels among long-serving teachers.
Table 6: The effect of educational qualifications on Job Satisfaction.
Quantitative analysis has shown that the factors having effect of job satisfaction among long serving teachers in Malta were teaching experience and age. On the other hand factors which did not have an effect on teacher job
Source Sum of Squares df Mean
Square F P α
Elementary Level of Education (Teaching 5-11 year olds)
Between = 0.59 1 0.59 0.88 0.35 0.01
Secondary Level of Education (Teaching 11-16 year olds)
Within = 70.96 106 0.67
Total = 71.55 107
Source Sum of Squares df Mean
Square F P α
Sector of Education: State School
Between = 3.15 2 1.57 1.67 0.193 0.01
Sector of Education: Church School
Within = 99.0 105 0.94
Sector of Education: Independent School
Total = 102.1 107
Source Sum of Squares df Mean
Square F P α
Highest Educational Qualification:
Bachelor’s Degree
Between = 2.74 2 1.369 1.77 0.176 0.01
Highest Educational Qualification:
Masters Degree
Within = 81.29 105 0.77
Highest Educational Qualification: Others
Total = 84.03 107
www.tojned.net
103
The Online Journal of New Horizons in Education Volume 4, Issue 1
satisfaction were gender, level of education, sector of education and qualification.
Qualitative Study
Fifty-two teachers from the initial sample of 108 teachers wished to take part in the second part of the study. This consisted of an interview of about 45 minutes in which long-serving teachers explained the factors leading to their job satisfaction or dissatisfaction and also explained the influence that these factors had on their long term experience as teachers. The results of the interviews were then grouped according to the importance which teachers themselves gave to the factors identified. Factors were then ranked and categorized into themes that most clearly captured the emotions of satisfaction and dissatisfaction underlying teachers’ work.
Sources of Satisfaction
Findings in this study confirmed those documented in many studies (Eg: Dinham and Scott, 1999, 2000a), i.e. that the main sources of teacher job satisfaction are the daily satisfactions derived from working with children, aiding their development and seeing them being actively involved in society whilst making a contribution to the welfare of others. Many expressed the joy of seeing past students in their school establishing themselves in society and earning a good living. Long Serving Teachers also derived high levels of satisfaction when working collaboratively with colleagues and achieving personal professional growth. Teachers being interviewed also confirmed earlier findings that salary, short working hours and holidays were not high in their satisfaction list. According to the teachers, these were merely associated benefits which made the profession more attractive.
All teachers interviewed revealed that their primary source of satisfaction is the children themselves. Many recounted different experiences of ‘miracles’ which they performed while taking care of their students. Many teachers spoke about feelings of excitement at the beginning of every scholastic year and of their ability to ‘touch lives’. These findings confirm the results obtained by Cockburn, 2000; Lortie, 1975 and Nias, 1989 who contended that the satisfaction of working with children, forming relationships with them, having the opportunity to contribute to the growth and achievement of young individuals, may be common internationally, regardless of country context. The emotional rewards of teaching effect what teachers teach, the way it is taught and the modalities and curricular adaptations which they undergo in order to make sure that all students under their care are benefiting from the teaching they are providing. Many teachers spoke about “loving their children”, “going out of their way to help them” and “establishing a warm and safe environment in their classrooms”. From the interviews it became clear that long-serving teacher have successfully attempted to develop warm and lasting emotional relationships with students and their parents. Such relationships are so inherent in this work that “… separating myself from such experiences is almost impossible” (teacher’s statement).
An area from which teachers appear to derive a sense of self-fulfillment and satisfaction is their contribution to society. They highlighted the importance of being able to guide students in their life choices and thus contributing effectively to society. Most teachers emphasized their commitment to society as an important precept towards their general job satisfaction despite the negative effect that social problems have on their work and the “lack of respect for teachers nowadays”. Most teachers felt proud that some of their past students are now teachers themselves and that they are following their own footsteps. As one teacher commented:
I feel proud of my work. When I remember my students and recall their achievements, some in politics, some in medicine, some in teaching, I say to myself… well this is my contribution to society! Well done! … and I think that this is what kept me going for so long in my career.
Many teachers emphasized the importance of collegial relationships as a prime determinant towards strong feelings of job satisfaction. Although some emphasized that colleagues are cooperative, others shared different opinions, stating that sometimes, the drive for promotion overrides the spirit of collaboration among teachers. Thus, collegial collaboration can both be a source of satisfaction and of dissatisfaction. This is concomitant with research conducted by Cockburn (2000) who found out that colleagues at work are seen as a source of friendship and a source of social and emotional support. When this emotional support is absent, teachers feel sad, depressed and lonely.
Most of the teachers interviewed stated that during their career that had some opportunities for professional growth but they would have liked tailor-made courses which took into account their experience. These comments clearly indicate that the teachers’ sense of satisfaction is connected to intellectual and professional stimulation and also opportunities for growth. As long as teachers are provided with opportunities for innovation, stimulation of their intellectual curiosity and increased creative outputs, then they would still be kindling the passion for their profession and further contribute towards students’ achievements.
www.tojned.net
104
The Online Journal of New Horizons in Education Volume 4, Issue 1
During the interviews teachers repeatedly stressed that their long staying in the profession was not at all
influenced by holidays, salaries and short working hours. This is similar to research conducted by Bastick (2002), who found that long-serving teachers were less extrinsically motivated (e.g. by salary) and significantly more intrinsically motivated (e.g. from working with children) than were teachers with lesser experience. Nevertheless teachers highlighted the importance of good salary. Although many teachers, in the first part of the study commented that their salary was adequate for their daily needs, they still felt that their salary was rather low compared to the amount of work they perform and compared to the salaries of other professions.
With regards to short working hours most teachers commented that working hours are not at all short. They firmly iterated that after a long day of work they are expected to prepare resources, construct lesson plans and schemes of work, and correct an ‘infinite’ number of copybooks, workbooks and examination papers. As one teacher stated, “ … if I am paid for the amount of hours I spend correcting and preparing material for the next day, then my salary will have to be at least double” (her emphasis). Another teacher however had a different view about teaches benefits and stated that for many teachers, benefits such as salary, short hours and holidays are important factors when one chooses a profession. He stated that teaching still provides “a lure for women who need that amount of flexibility to manage a profession and at the same time execute all functions of a full time mother”.
With regards to holidays most teachers emphasized that these were not the primary reason for the choice of their career. However, similar to the concept of short working hours, holidays were certainly an important factor which kept them going so long in their career. As one teacher eloquently states:
if it weren’t for the holidays, it wouldn’t be possible to sustain the stress which teaching itself brings with it … just imagine … piles (of copybooks) for correction, handouts, past papers, designing examination papers, construction of Individualized Educational Programs for the students, etc etc. I think that holidays are a right and much deserved too.
Sources of Dissatisfaction
The study also researched sources of dissatisfaction among long serving school teachers. These were ranked according to the number of times these were mentioned by the teachers. Student failure, the effect of social problems, work overload, lack of student discipline, lack of respect from students and parents, lack of recognition from society, lack of autonomy as a result of perceived centralization, lack of collegial relationships, time constrictions and extensive syllabi were the factors mentioned by teachers and contributing to job satisfaction.
Most teachers recounted that the major source of dissatisfaction lies in the failure of students to achieve the desired academic outcomes. As one teacher emphatically puts it:
I plan, I organize, I approach students as groups and individually, I speak to their parents … but sometimes there are situations that you cannot do away with… there are situations where all your efforts result in nothing…These are, by far, most dissatisfactory.
“Work overload” is an expression which came up often during interviews. Teachers seem to derive particular dissatisfaction at the amount of paper work they do especially “piles of copybooks”, “file keeping”, “printed lesson plans”, “schemes of work”, “individualized educational plans” and “paperwork, paperwork, paperwork…too daunting!” (teachers’ emphasis). Most teachers commented that while they saw the validity of organizing one’s work, teaching has become “too technical” and “(work overload)…is robbing the joy of teaching”.
Many social problems were mentioned in the interviews. These included both the teachers’ social problems and the student ones. Social problems interfere in communication processes between teachers and students and these have an effect on the performance of both teachers and students in the teaching and learning process. Among those mentioned were the steady rise in family problems, increased number of marital separations and divorces, arrival of children from immigrant parents, multiculturalism in the classroom, poverty and others. During interviews teachers shared intense feelings of dissatisfaction as a result of having to deal with the effects of social problems in their classrooms. A number of teachers shared the fact that many a time they had to deal with students’ lack of resources themselves. As one teacher states:
It is not the first time that I had to deal with pupils who did not have lunch or adequate stationary. These are the things which everyone takes for granted but they are very much in existence… yes in 2012! There is no
www.tojned.net
105
The Online Journal of New Horizons in Education Volume 4, Issue 1
recognition whatsoever for the work a teacher does where s/he have to go beyond their duties to make sure a child gets the necessary care. This is very disappointing and demotivating.
Many of the teachers interviewed insisted that respect towards teachers from both parents and students has diminished. Most comments conveyed a sense the disenchantment resulting from perceived expectations for respect and recognition which have never been fulfilled through the years. This has given rise to general feelings of dissatisfaction and low morale. The lack of respect and recognition of teachers has been the subject of research in many studies (eg: Konanc,1996; Lumsden, 1998; Ingersoll, 2001). Hence, these sources of dissatisfaction are not unique to Malta but are present in many countries across the world.
Some of the strongest feelings of disappointment expressed by teachers during interviews were related students’ academic failure, discipline problems and morality issues such as cheating, bullying, threatening, stealing and others. According to the teachers interviewed, there have been many times that they have it difficult to cope with the situations outlined above and there were also times when they considered quitting because “it was simply too much to take”.
Some of the teachers interviewed commented about their perceived lack of autonomy as a result of the Maltese Educational System. Some teachers were dissatisfied with their lack of autonomy, others with imposition of extensive curricula and others with “too many changes in such a short time”. This issue was intensified by the fact that the present research study was carried put in the midst of Educational reform for which, some felt, haven’t been consulted enough. During their interviews teachers compared their autonomy to that of other professionals such as doctors and lawyers. That stated that, being professionals, teachers need to have more autonomy so that they could direct students to better career paths.
Many of them mentioned the auditing process (part of the current reform) at which they expressed concern over the way it is being managed. This is concomitant with research conducted by Ball who claims that teachers are overwhelmed by the ‘…performance culture, characterized by targets and accountability, within the workplace where value replaces values –commitment and service are of dubious worth within the new policy regime’ (2003: 217). Interviewed teachers stated that they felt a sense of disempowerment over a number of issues being discussed. These findings are also concomitant with results published by Dinham & Scott (1998, 2000) who state that a major influence in determining how teachers feel about their work comes from factors at the system level, as well as wider social forces, such as teacher status, centralized policies, and the portrayal of teachers in the media. Findings from interviews suggest parallelism with research conducted by Dinham and Scott, 2000) who claim the existence of a ‘third domain’ i.e. the existence of societal based factors in teacher job (dis)satisfaction. Promotion prospects were also cited as sources of great dissatisfaction for the majority of long-serving school teachers. Many teachers expressed their intense disdain about their perceived lack fairness in the current teacher evaluation system which, according to the teachers interviewed: “is creating negative feelings and undesirable consequences on teachers’ motivation, general health and perceived job satisfaction levels”.
DISCUSSION
The purpose of this work was to use a mixed-methods approach to investigate factors leading to satisfaction and dissatisfaction of long-serving Maltese teachers. Both methods of investigation showed that long-serving teachers in Malta chose the teaching profession for intrinsic reasons since the majority of them indicated that they always wanted to become teachers. On the one hand, a deeper look at qualitative data indicated that Maltese teachers were, to some extent, also influenced by external factors to choose their career such as salary, short working hours and holidays associated with this profession. The discrepancy between the results obtained from the two methods could be explained from the fact that the sample in the two methods of investigation was different (108 teachers for the quantitative method and 52 teachers for the qualitative method). Hence, the results obtained from the two methods have to be interpreted differently based on the respective samples and methodology. Also, the quantitative method of investigation provided statements which did not necessarily come up in the teacher interviews during the qualitative method. The qualitative method dealt with the presence of factors related to teacher job (dis)satisfaction rather than with their frequency and this could explain the disparities in results.
The findings presented in this paper make a significant contribution to the investigation of job (dis)satisfaction
www.tojned.net
106
The Online Journal of New Horizons in Education Volume 4, Issue 1
among long-serving school teachers in Malta. Maltese teachers’ perceptions of their job-satisfaction strongly correlated to the pleasure derived from working with children, overseeing their growth and their contribution to their general well being. Maybe surprising is the emphases that teachers placed on the importance of their job into making a ‘contribution to society’. The importance of this powerful source of satisfaction cannot be ignored and more research needs to be done as to how Educational authorities can extend this source of satisfaction into meaningful activities. Salary, short working hours and holidays were considered important but not superseded by the satisfaction derived from working with children and contribution to society.
The study shows that teachers’ (dis)satisfaction is a complex social construct which is influenced by a number of factors in continuous flux. Research findings also reveal many aspects of dissatisfaction which need to be counteracted effectively to limit dissatisfaction among teachers. Particular attention need to be directed to measures which deal effectively with social problems, students’ misbehavior, a decline in teachers’ respect and status, improving relationships with educational directorates, and increase in teachers’ contribution in the educational decision-making processes. A greater recognition and understanding of teachers’ work would enable them to focus on those factors that they enjoy most, i.e. working with children and contributing to society. A change in criteria for teacher evaluations could develop into a fairer system of auditing. If teachers’ work was more positively expressed, especially through the media, then an increase in perceived job satisfaction levels would be expected. This would, in turn, have a positive effect on the performance of both teachers and students.
Limitations of The Study The sample of 198 teachers and the selection of 52 teachers for interviews could in no way be representative of the entire teaching population Besides, the further categorization of teachers into gender, sector of education and years of teaching experience has given rise to even smaller numbers to be considered in any way representative. As with all self-reporting studies, the results are limited by the participants’ responses. The participants may have felt the need to provide answers the researcher was looking for rather than what they believed to be true. Also, singular interviews have limitations in terms of trust and comfortableness in disclosing feelings which can touch the personal lives of respondents.
CONCLUSIONS AND RECOMMENDATIONS
This study brings to the surface the complexities involved in understanding teacher job satisfaction in a manner which could be way which could be of utility to policy making. The study, however does give food for thought towards more serious considerations of how the understanding of the concept of teacher job satisfaction could be applied when considering reforms in the Maltese educational system and how these reforms are incumbent on teachers’ working lives. The findings clearly indicate that there is an urgent need for school directorates and administrators to recognize the fact that educational quality is closely linked teacher job satisfaction. As teachers continue to evolve, so do their professional needs. Professional training courses emphasizing the importance of lifelong learning is central to this goal (Zeichner & Noffke, 2001).
Improvement in teachers’ working conditions is not a luxury we can do away with, but an essential component of effective policy-making (Hargreaves, 1994; Pollard et al., 1994). As Hean & Garrett (2001) eloquently phrase it: ‘happier teachers are better teachers’ and it is therefore important for all educational stakeholders to be vigilant on teachers’ needs and do their utmost to maximize teacher’s job satisfaction and minimize dissatisfaction not only for the benefit of teachers themselves but also for the sake of the learners under their care. Surely, the experience of long-serving teachers must not be disregarded when considering reforms. Judging from the responses of teachers interviewed and from the body language during the interviews it was clear that long-serving teachers could contribute a great towards policy making and effecting reform implementation. This research has clearly raised further questions for research: What factors transform some teachers’ perceptions from satisfaction to dissatisfaction over time? Why do some teachers enjoy their jobs while others do not? What can be done to counteract feelings of dissatisfaction and what can be done to cultivate increased satisfaction? How might long-serving teachers be more included into policy-making processes? How can increased autonomy help in increasing satisfaction levels among teachers? Are there other factors which can give rise to fluctuating levels of job satisfaction? Experienced teachers need opportunities to share collaborative and self-reflective practices in an environment which recognizes the acquired knowledge and sensitive judgment developed in the course of their careers. Professional development seminars should be designed in a way which challenges them to take other roles and functions within schools (Zeichner & Noffke, 2001). For example they might be challenged to act as mentors for newly qualified teachers, as this
www.tojned.net
107
The Online Journal of New Horizons in Education Volume 4, Issue 1
would ensure that their experience is positively transmitted to others, while at the same time providing them with opportunities to rekindle their enthusiasm for teaching whilst keeping abreast to new theoretical frameworks. More research needs to be commissioned to delve into other factors affecting job satisfaction among teachers. Such research would be an indispensable tool towards a collective effort to ‘…challenge the status quo, to challenge entrenched views and positions and to create meaning with different stakeholders’ (MEDE, 2011).
REFERENCES
Arnett, S.E. and Polkinghorne, F.W. (2010). Job dissatisfaction: a factor in maintaining a
highly qualified family and consumers sciences teacher workforce. Online Journal of Workforce Education and Development Volume IV, Issue 4 – Fall 2010
Barnabe, C. and Burns, M. (1994), “Teachers’ job characteristics and motivation”,
Educational Research, Vol. 36, pp. 171-185.
Bastick, T. (2002). Materialist culture and teacher attrition in the Caribbean:
Motivational differences between novice and experienced Jamaican teacher trainees. Paper presented at the Second Annual Conference on Caribbean Culture, Kingston, Jamaica.
Ball, S.J. 2003 The teacher's soul and the terrors of performativity. Journal of Education Policy, V 18, N 2
Bishay, A. (1996). Teacher motivation and job satisfaction: a study employing the experience
sampling method. Journal of Undergraduate Sciences, 3, 147-154.
Bivona, K. (2002). Teacher morale: The impact of teaching experience, workplace
conditions, and workload. Retrieved from ERIC database. (ED467760)
Bonsang, E. and van Soest, A.(2012). Satisfaction with Job and Income among Older Individuals across European Countries. Social Indicators Research, v105 n2 p227-254 Jan 2012
Borg, M. G. and Riding, R. J. (1991). “Occupational stress and satisfaction in teaching”,
British Educational Research Journal, Vol. 17, pp. 263-281.
Buhmeyer, K. J. and Hunt, H.H. (2000). Job Satisfaction and Level of Aspiration in
Academic Employees. Perceptual and Motor Skills: V54.
Cherniss, C. (1995). Beyond Burnout: Helping Teachers, Nurses, Therapists and Lawyers Recover from Stress
and Disillusionment, Routledge, New York.
Cockburn, A. D. (2000). Elementary teachers’ needs: Issues of retention and recruitment, Teaching and Teacher
Education, 16, 223-238.
Cohen, D.K. and Moffitt, S.L. (2009) The Ordeal Of Equality: Can Federal Regulation Fix
The Schools? Cambridge: Harvard University Press.
Day, C. and Gu, Q. (2013). Challenges to teacher resilience: conditions count. British
Educational Research Journal. 39(1), 22-44
Dinham, S. and Scott, C. (2002), “The international Teacher 2000 Project: An international study of teacher and school executive satisfaction, motivation and health in Australia, England, USA, Malta and New Zealand”, a paper presented to the Challenging Futures Conference, University of New England, Armidale, Australia.
Dinham, S. and Scott, C. (2000a). “Moving into the third, outer domain of teacher satisfaction”, Journal of
www.tojned.net
108
The Online Journal of New Horizons in Education Volume 4, Issue 1
Educational Administration, Vol. 38, pp. 379-396.
Dinham, S. and Scott, C. (2000b). “Teachers’ work and the growing influence of societal
expectations and pressures”, a paper presented to the American Educational Research Association Annual Meeting, New Orleans, LA, April.
Dinham, S. and Scott, C. (1999). “The relationship between context, type of school and position held in school
and occupational satisfaction, and mental stress”, a paper presented to the Australian College of Education/Australian Council for Educational Administration, National Conference, Darwin, Australia.
Dinham, S. and Scott, C. (1998). “A three domain model of teacher and school executive satisfaction”, Journal
of Educational Administration, Vol. 36, pp. 362-378.
Evans, L. (2001). “Delving deeper into morale, job satisfaction and motivation among education professionals:
Re-examining the leadership dimension”, Educational Management Administration, Vol. 29, pp. 291-306.
Evans, L. (1998). Teacher Morale, Job Satisfaction and Motivation, Chapman, Paul Publishing, Limited,
London.
Evans, L. (1997). Addressing problems of conceptualization and construct validity in
researching teachers’ job satisfaction. Educational Research, 39, No. 3, 319-331.
Farber, B. A. (1991). Crisis in Education: Stress and Burnout in the American Teacher, Jossey-Bass, San
Francisco.
Friedman, I. A. and Farber, B. A. (1992). “Professional self-concept as a predictor of teacher burnout”, Journal
of Educational Research, Vol. 86, pp. 28-35.
Guin, K. (2004). Chronic teacher turnover in urban elementary schools. Education Policy
Analysis Archives. 12, 1-30.
Hargreaves, A. (1994). Changing Teachers, Changing Times, Cassell, London.
Herzberg, F. (1964), “The motivation-hygiene concept and problems of manpower”, Personnel Administration, Vol. 27, pp. 3-7.
Huberman, M. (1993). The model of the independent artisan in teachers' professional
relations. In: Little, J. W. & McLaughlin, M.W. (ed.) Teachers' work: Individuals, colleagues and contexts. New York: Teachers' College Press.
Ingersoll, R. M. (2001). Teacher turnover, teacher shortages, and the organization of schools.
Seattle, WA: University of Washington, Center for the Study of Teaching and Policy.
Retrieved November 20, 2012, from http://www.ctpweb.org/
Kelchtermans, G. (1999. “Teaching career: Between burnout and fading away? Reflections from a narrative and
biographical perspective”, in Vandenberghe, R. and Huberman, H. (Eds.), Understanding and Preventing Teacher Burnout: A Sourcebook of International Research and Practice, Cambridge University Press, Cambridge, England, pp. 176-91.
Kyriacou, C. (1987). “Teacher stress and burnout: An international review”, Educational
Research, Vol. 29, 146-152.
www.tojned.net
109
The Online Journal of New Horizons in Education Volume 4, Issue 1
Kyriacou, C. and Sutcliffe, J. (1979).“Teacher stress and satisfaction”, Educational Research, Vol. 21,
89-96.
Lawler, E. E. (1973). Motivation in Work Organizations, Brooks/Cole, Monterey, CA.
Lumsden, L. (1998). Teacher morale. ERIC Digest, Number 120. Eugene, OR: ERIC
Clearinghouse on Educational Management. (ERIC Document Reproduction Service No. ED422601)
Lunenburg, F. C. & Ornstein (2004). Educational Administration: Concepts and Practices.
Belmont: Wadsworth/Thomson.
Mbua, F. N. (2003). Educational Administration: Theory and Practice. Limbe, South West
Province, Cameroon: Design House.
Martin, N. K., Yin, Z., & Mayall, H. (2006, February). Classroom management training,
teaching experience and gender: Do these variables impact teachers’ attitudes and beliefs toward classroom management style? Paper presented at the Annual Conference of the Southwest Educational Research Association, Austin, TX. Retrieved from ERIC database. (ED494050)
Maslow, A. H. (1987). Motivation and Personality. New York: HarperCollins Publishers.
McKenzie, P. and Santiago, P. (2005). Teachers matter: Attracting, developing and retaining
effective teachers. Paris: OECD Publishing
Maeroff, G. I. (1988), The Empowerment of Teachers: Overcoming the Crisis of Confidence, Teachers College
Press, New York.
Markow, D. and Pieters, A. (2012). MetLife Survey of Teacher Education – Teachers,
Parents and the Economy , Report Accessed Online on 12th March 2012.
Ministry of Education and Culture. (1996). Development of Education, 1994-96: National
Report Cyprus, Nicosia, Ministry of Education and Culture.
Mykletun, R. J. (1984). “Teacher stress: Perceived and objective sources, and quality of life”, Scandinavian
Journal of Educational Research, Vol. 28, pp. 17-45.
Naylor, C. (2001). “Teacher workload and stress: An international perspective on human
costs and systemic failure”, ERIC Document Reproduction Service No. ED 464 028.
Norton, M. S. and Kelly, L. K. (1997). Resource Allocation: Managing Money and People, Eye on Education,
Larchmont, New York.
Odell, S. and Ferraro, D. (1992). “Teacher mentoring and teacher retention”, Journal of Teacher Education, Vol.
43, pp. 200-204.
Organ, D. W. & Bateman, T. S., (1991). Organizational Behavior. Homewood, IL: IRWIN.
Quartz, K. (2003). Too angry to leave: Supporting new teachers’ commitment to transform
urban schools. Journal of Teacher Education. 54, 1-35.
Rapti, E. and Karaj, T. (2012) The Relationship between Job Satisfaction and Democratic
and School Characteristics among Basic Education Teachers in Albania, Problems of Education in the 21st Century,V45 73-80.
Robbins, S. P. (2005). Organizational Behavior. China: Pearson Education Asia LTD.
Robbins, S. P. & Judge, T. A. (2008). Essentials of Organizational Behavior. New Jersey:
Pearson Education.
www.tojned.net
110
The Online Journal of New Horizons in Education Volume 4, Issue 1
Rodgers-Jenkison, F., & Chapman, D. W. (1990). Job satisfaction of Jamaican elementary school
teachers,
International Review of Education, 36, 299-313.
Rosenholtz, S. J. (1991). Teachers’ Workplace: The Organization of Schools, Teachers College Press, New
York.
Saari L.M. and Judge T.A. (2004). Employee Attitudes and Job Satisfaction, Wiley Periodicals, Inc. Accessed
Online on 8 August 2013 from http://utm.edu/staff/mikem/documents/jobsatisfaction.
Scott, C., Dinham, S. (2003). The development of scales to measure teacher and school executive occupational satisfaction. Journal of Educational Administration, 41, 74-86.
Scott, C. and Dinham, S. (2001). “In search of the third domain: Teacher satisfaction in Malta”, a paper
presented to the Australian Association for Research in Education, Fremantle, Australia.
Scott, C., Stone, B. and Dinham, S. (2001). “‘I love teaching but....’ International patterns of discontent”,
Education Policy Analysis Archives, Vol. 9, No 28, retrieved on-line http://epaa.asu.edu/epaa/v9n28.html [12/7/06].
Sergiovanni T. (1967). “Factors which affect satisfaction and dissatisfaction of teachers”, Journal of
Educational Administration, Vol. 5, pp. 66-81.
Shann, M. H. (2001). Professional Commitment and Satisfaction among Teachers in Urban
Middle schools. The Journal of Educational Research, 92 No. 2, 67- 73.
Singh, H.R. and Rawat. H.S. (2010) The Study of Factors Affecting the Satisfaction
Level of Private School Teachers’ in Haryana. VSRD-TNTJ, Vol. I (4), 2010, 188-197
Spector, P. E. (1997). Job Satisfaction: Application, Assessment, Causes, and Consequences.
California: Sage Publications.
Spear, M., Gould, K. and Lee, B. (2000). Who Would be a Teacher? A Review of Factors
Motivating and Demotivating Prospective and Practising teachers, NFER, Slough.
Smithers, A. and Robinson, P. (2001). Teachers Leaving. London: NUT.
Stenlund, K. V. (1995). “Teacher perceptions across cultures: The impact of students on
teacher enthusiasm and discouragement in a cross-cultural context”, The Alberta Journal of Educational Research, Vol. 41, pp. 145-61.
Troman, G. and Woods, P. (2000).“Careers under stress: Teacher adaptations at a time of intensive reform”,
Journal of Educational Change, Vol. 1, pp. 253-275.
Tsui, A. B. (2005). Understanding expertise in teaching: Case studies of ESL teachers. New
York: Cambridge University Press.
US Department of Education. (1993).“America’s teachers: Profile of a profession”, US
Government Printing Office, Washington, DC.
US Department of Education, National Center for Education Statistics. (1997), “Job satisfaction among
America’s teachers: effects of workplace conditions, background characteristics, and teacher compensation”, US Department of Education, Washington, DC, retrieved on-line http://nces.ed.gov/pubs/ce/c9749a01.html [12/7/06]
van den Berg, R. (2002). “Teachers’ meanings regarding educational practice”, Review of Educational
www.tojned.net
111
The Online Journal of New Horizons in Education Volume 4, Issue 1
Research, Vol. 72, 577-625.
Vandenberghe, R. and Huberman, A. M. (1999). Understanding and Preventing Teacher Burnout, Cambridge
University Press, Cambridge, England.
Watt, H.M.G. and Richardson, P.W. ( 2008)Motivations, perceptions, and aspirations
concerning teaching as a career for different types of beginning teachers. Learning and Instruction V18, 408-428.
Waters, A. (2006). Facilitating follow-up in ELT INSET. Language Teaching Research,
10(1), 32-52.
Weiss, H.M., Cropanzano, R. (1996). Affective events theory: a theoretical discussion of the
structure, causes and consequences of affective experiences at work. Research in Organizational Behavior 8: 1-74
Woods, A. M. & Weasmer, J. (2002). Maintaining job satisfaction: Engaging professionals as
active participants. The Clearing House. 75, No. 4, 186 – 189.
Wood, S. (2008). Job characteristics, employee voice and wellbeing in Britain. Industrial
Relations Journal, 39, No. 2, 153-168.
Woods, P., Jeffrey, B., Troman, G. and Boyle, M. (1997), Restructuring Schools; Reconstructing
Teachers: Responding to Change in the Primary School, Open University Press, Buckingham.
Zeichner, K. M., & Noffke, S. E. (2001). Practitioner Research. In V. Richardson (Ed.), Handbook of research
on teaching (pp. 298-330). Washington, DC: AERA.
Zembylas, M. & Papanastasiou, E. (2006). Sources of job satisfaction and dissatisfaction in
Cyprus. British Association for International and Comparative Education. Vol. 36, No.
2, 229-247.
Zembylas, M. & Papanastasiou, E. (2004). Job satisfaction among school teachers in Cyprus. Journal of
Educational Administration, 42, 357-374.
Zigarelli, M. A. (1996).“An empirical test of conclusions from effective schools research”, The
Journal of Educational Research, Vol. 90, pp. 103-109.
www.tojned.net
112
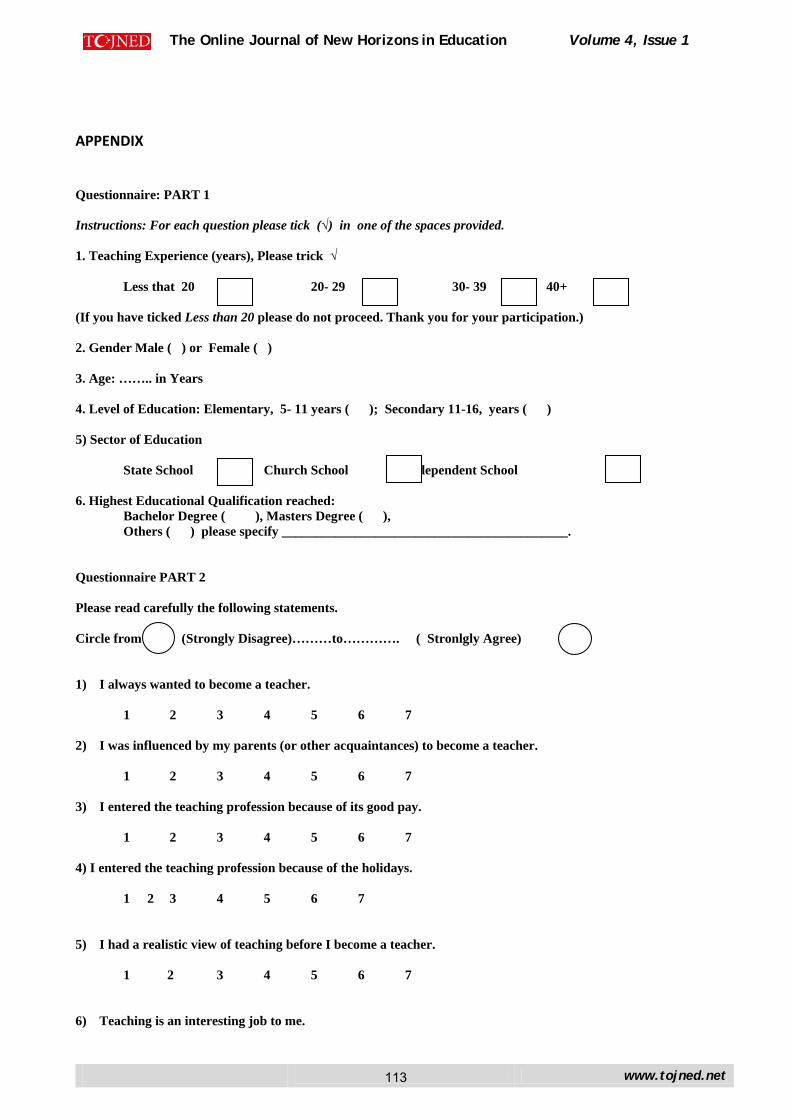
The Online Journal of New Horizons in Education Volume 4, Issue 1
APPENDIX
Questionnaire: PART 1 Instructions: For each question please tick (√) in one of the spaces provided. 1. Teaching Experience (years), Please trick √
Less that 20 20- 29 30- 39 40+
(If you have ticked Less than 20 please do not proceed. Thank you for your participation.) 2. Gender Male ( ) or Female ( ) 3. Age: …….. in Years 4. Level of Education: Elementary, 5- 11 years ( ); Secondary 11-16, years ( ) 5) Sector of Education
State School Church School Independent School 6. Highest Educational Qualification reached:
Bachelor Degree ( ), Masters Degree ( ), Others ( ) please specify ___________________________________________.
Questionnaire PART 2 Please read carefully the following statements. Circle from (Strongly Disagree)………to…………. ( Stronlgly Agree)
1) I always wanted to become a teacher.
1 2 3 4 5 6 7
2) I was influenced by my parents (or other acquaintances) to become a teacher.
1 2 3 4 5 6 7
3) I entered the teaching profession because of its good pay.
1 2 3 4 5 6 7
4) I entered the teaching profession because of the holidays. 1 2 3 4 5 6 7
5) I had a realistic view of teaching before I become a teacher.
1 2 3 4 5 6 7
6) Teaching is an interesting job to me.
www.tojned.net
113
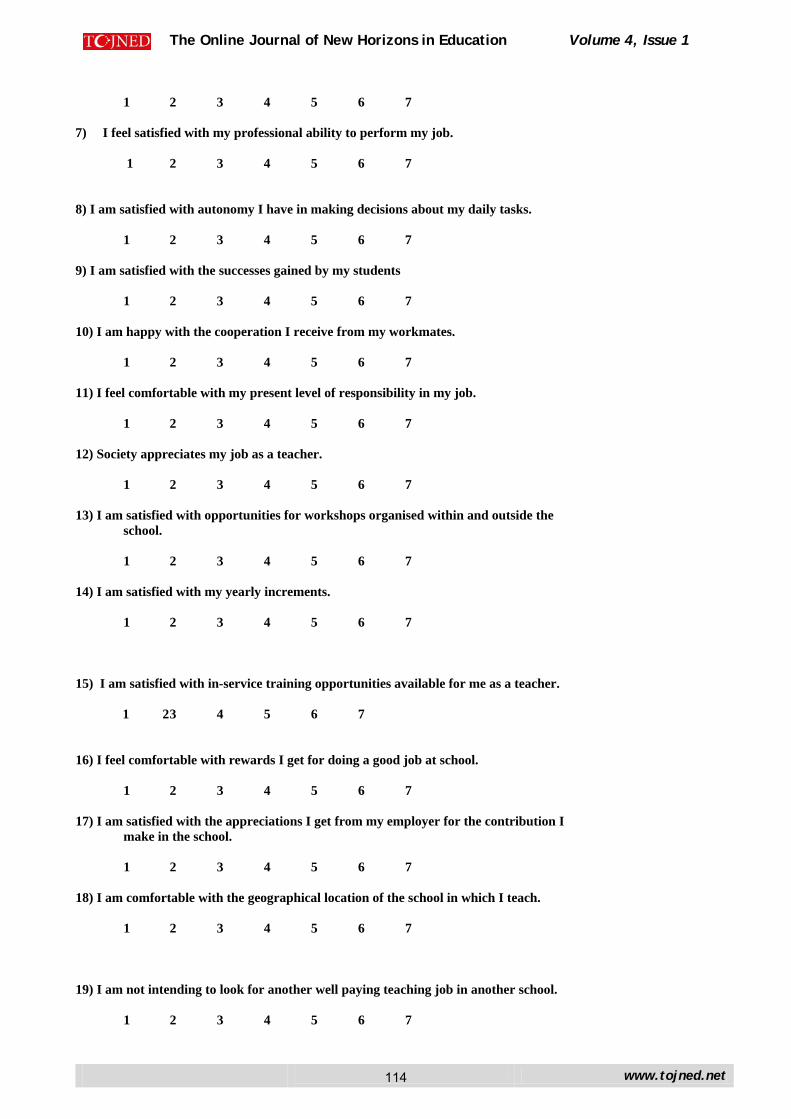
The Online Journal of New Horizons in Education Volume 4, Issue 1
1 2 3 4 5 6 7
7) I feel satisfied with my professional ability to perform my job.
1 2 3 4 5 6 7
8) I am satisfied with autonomy I have in making decisions about my daily tasks. 1 2 3 4 5 6 7
9) I am satisfied with the successes gained by my students
1 2 3 4 5 6 7
10) I am happy with the cooperation I receive from my workmates.
1 2 3 4 5 6 7
11) I feel comfortable with my present level of responsibility in my job.
1 2 3 4 5 6 7
12) Society appreciates my job as a teacher.
1 2 3 4 5 6 7
13) I am satisfied with opportunities for workshops organised within and outside the school. 1 2 3 4 5 6 7
14) I am satisfied with my yearly increments.
1 2 3 4 5 6 7
15) I am satisfied with in-service training opportunities available for me as a teacher. 1 2 3 4 5 6 7
16) I feel comfortable with rewards I get for doing a good job at school. 1 2 3 4 5 6 7
17) I am satisfied with the appreciations I get from my employer for the contribution I
make in the school. 1 2 3 4 5 6 7
18) I am comfortable with the geographical location of the school in which I teach.
1 2 3 4 5 6 7
19) I am not intending to look for another well paying teaching job in another school.
1 2 3 4 5 6 7
www.tojned.net
114
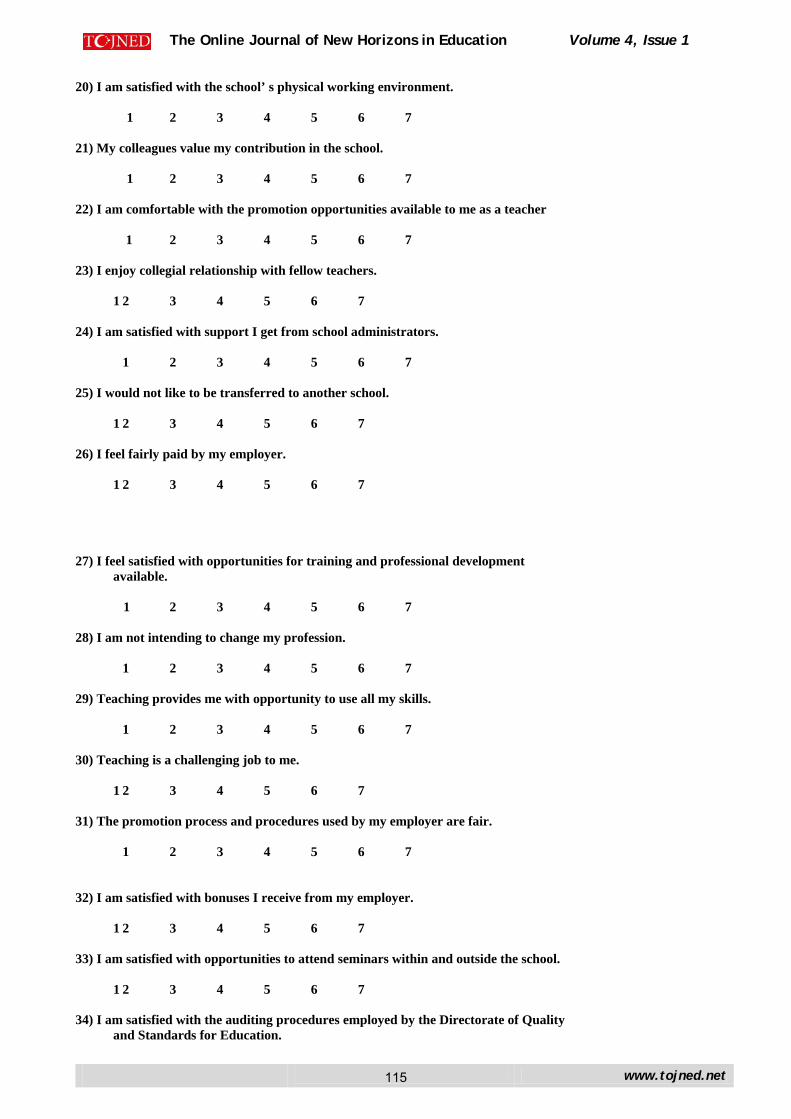
The Online Journal of New Horizons in Education Volume 4, Issue 1
20) I am satisfied with the school’ s physical working environment.
1 2 3 4 5 6 7
21) My colleagues value my contribution in the school.
1 2 3 4 5 6 7
22) I am comfortable with the promotion opportunities available to me as a teacher 1 2 3 4 5 6 7 23) I enjoy collegial relationship with fellow teachers.
1 2 3 4 5 6 7 24) I am satisfied with support I get from school administrators. 1 2 3 4 5 6 7 25) I would not like to be transferred to another school.
1 2 3 4 5 6 7
26) I feel fairly paid by my employer.
1 2 3 4 5 6 7 27) I feel satisfied with opportunities for training and professional development
available.
1 2 3 4 5 6 7 28) I am not intending to change my profession. 1 2 3 4 5 6 7 29) Teaching provides me with opportunity to use all my skills. 1 2 3 4 5 6 7 30) Teaching is a challenging job to me.
1 2 3 4 5 6 7 31) The promotion process and procedures used by my employer are fair.
1 2 3 4 5 6 7 32) I am satisfied with bonuses I receive from my employer.
1 2 3 4 5 6 7 33) I am satisfied with opportunities to attend seminars within and outside the school.
1 2 3 4 5 6 7
34) I am satisfied with the auditing procedures employed by the Directorate of Quality
and Standards for Education.
www.tojned.net
115
The Online Journal of New Horizons in Education Volume 4, Issue 1
1 2 3 4 5 6 7 35) I am satisfied with my perceived level of professional autonomy.
1 2 3 4 5 6 7
36) I am satisfied with my involvement in school decisions.
1 2 3 4 5 6 7 37) I am satisfied with the changes the Maltese Educational System is currently undergoing.
1 2 3 4 5 6 7
38) I am satisfied with the amount of resources I am given to work with.
1 2 3 4 5 6 7
39) I am satisfied with my current working hours.
1 2 3 4 5 6 7
40) I am satisfied with the way the educational system recruits teachers
1 2 3 4 5 6 7
41) I am satisfied with media criticism on teachers’ work
1 2 3 4 5 6 7
42) It is my intention to continue teaching
1 2 3 4 5 6 7 Please indicate whether you would like to participate further in the study by volunteering for an interview based on your responses: YES NO
www.tojned.net
116