Embed Size (px)
Citation preview
The OPTALYSE PE Trial – Reducing thrombolytic dose and treatment times with
EKOS™ in the treatment of pulmonary embolism patients
Keith M. Sterling, M.D.Director, Cardiovascular & Interventional Radiology
Inova Alexandria Hospital
Alexandria, VA, US
Associate Professor of Radiology
George Washington University School of Medicine
Washington, DC, US
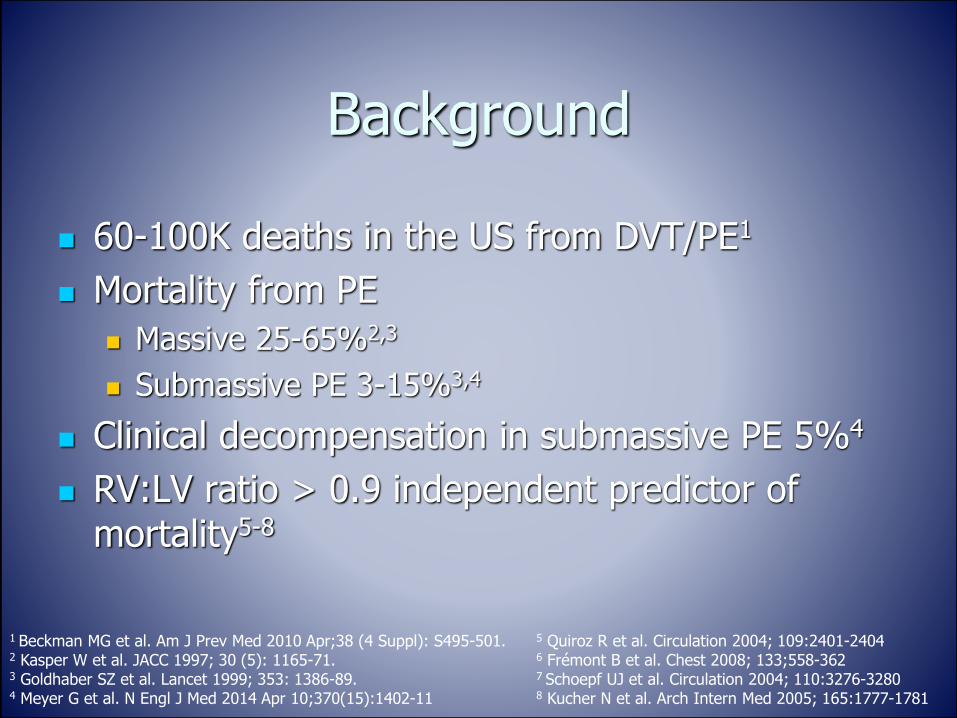
Background
60-100K deaths in the US from DVT/PE1
Mortality from PE
Massive 25-65%2,3
Submassive PE 3-15%3,4
Clinical decompensation in submassive PE 5%4
RV:LV ratio > 0.9 independent predictor of mortality5-8
1 Beckman MG et al. Am J Prev Med 2010 Apr;38 (4 Suppl): S495-501. 5 Quiroz R et al. Circulation 2004; 109:2401-24042 Kasper W et al. JACC 1997; 30 (5): 1165-71. 6 Frémont B et al. Chest 2008; 133;558-3623 Goldhaber SZ et al. Lancet 1999; 353: 1386-89. 7 Schoepf UJ et al. Circulation 2004; 110:3276-32804 Meyer G et al. N Engl J Med 2014 Apr 10;370(15):1402-11 8 Kucher N et al. Arch Intern Med 2005; 165:1777-1781

Full-Dose Systemic Fibrinolysis for Submassive PE: Efficacy at the Cost of Safety
TNK
Placebo
0
1
2
3
4
5
Hemodynamic Collapse Hemorrhagic Stroke
TNK Placebo
1.6
5.0
2.0 0.2
p=0.002 p=0.003
%
Meyer G et al. N Engl J Med. 2014 Apr 10;370(15):1402-11

Goals of Catheter-Directed Therapy
Recovery of right ventricular dysfunction
Decrease in pulmonary vascular resistance and pulmonary artery pressure
Increase in systemic arterial pressure
Improvement of symptoms and survival
Decrease the risk of developing chronic thromboembolic pulmonary hypertension (CTEPH)
Minimize the bleeding risk associated with systemic therapy
Kucher N, Goldhaber SZ. Circulation 2006;112:e28-32Piazza and Goldhaber. Vascular Medicine 2010; 15(5):419-428

Possible candidates for Catheter-based Therapy
Patient risk stratification (per AHA 2011 guidelines)
Massive PE Submassive PE Minor/Nonmassive PE
High risk Moderate risk Low risk
Sustained hypotension (systolic BP <90 mmHg for 15 min)
Inotropic support
Pulselessness
Persistent profound bradycardia (HR <40 bpm with signs or symptoms of shock)
Systemically normotensive (systolic BP 90 mmHg)
Myocardial necrosis
RV dysfunction
Systemically normotensive (systolic BP 90 mmHg)
No RV dysfunction
No myocardial necrosis
Jaff et al. Management of massive and submassive pulmonary embolism, iliofemoral deep vein thrombosis, and chronic thromboembolic pulmonary hypertension: A scientific statement from the American Heart Association. Circulation 2011;123(16):1788-1830.

Risk Stratification – ESC
Konstantinides S et al. 2014 ESC Guidelines on the diagnosis and management of acute pulmonary embolism. The Task Force for the Diagnosis
and Management of Acute Pulmonary Embolism of the European Society of Cardiology (ESC). Eur Heart J 2014; 35:3033-3080.
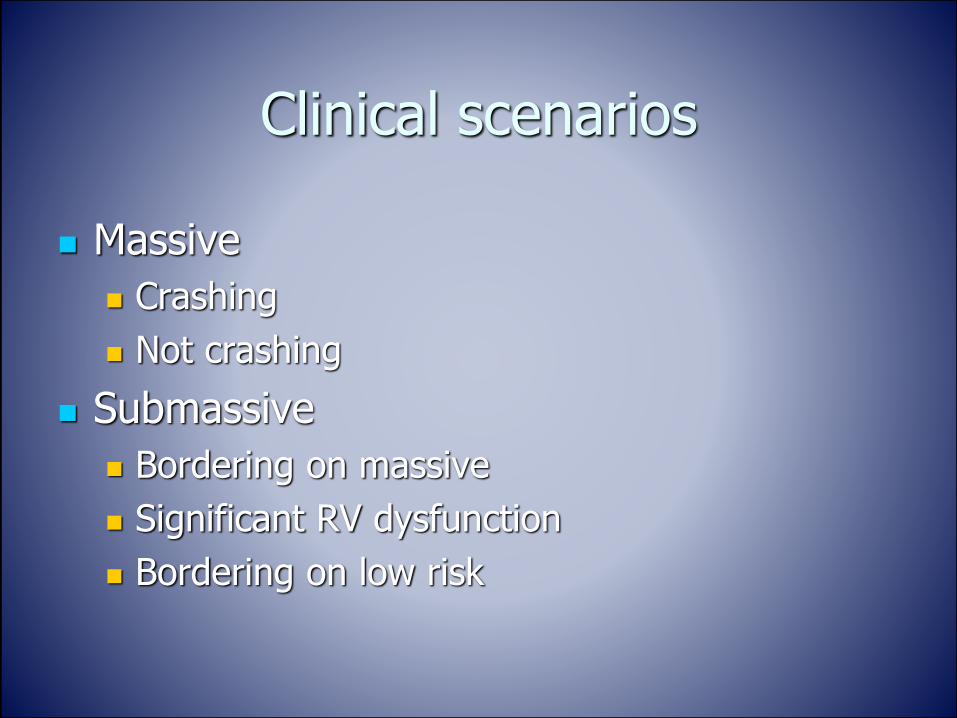
Clinical scenarios
Massive
Crashing
Not crashing
Submassive
Bordering on massive
Significant RV dysfunction
Bordering on low risk

Background
ULTIMA Prospective multicenter randomized trial Submassive PE 30 patients USCDT
10 mg (U) or 20 mg (B) r-tPA over 15 hours
29 patients randomized to AC with UFH
Confirmed that fixed dose USCDT regimen superior to AC alone in improving RV dysfunction without increase in bleeding complications
Kucher N et al. Circulation 2014;129:479-486

Background
SEATTLE II Prospective multicenter single-arm trial
Massive: 31 patients
Submassive: 119 patients
24 mg r-tPA over 12 hours (B) or 24 hours (U)
30% decrease in RV:LV ratio in patients treated with USCDT
Rapid reduction in PA HTN and PA obstruction
No ICH
Piazza G et al. J Amer Coll Cardiol: Cardiovasc Interventions 2015; 8(10):1382-1392

Author (year) No. of pts
No. of high risk PEs
(%)
tPA dose (mg)
tPA duration (hr)
RV:LV PAP (mmHg)
Pre Post Pre Post
Chamsuddin (2008) 10 N/A 21.8 24.8+8.4 N/A N/A N/A N/A
Lin (2009) 11 2 (18) 17.2+2.4 17.4+5.2 N/A N/A N/A N/A
Engelhardt (2011) 24 5 (21) 33.5+15.5 19.7+8.1 1.33+0.24 1.0+0.13 N/A N/A
Kennedy (2013) 60 12 (20) 35.1+11.1 19.6+6.0 N/A N/A 27+9 20+6
Engelberger (2013) 52 14 (27) 21.0+5.7 15.2+1.7 1.42+0.21 1.06+0.23 37+9 25+8
Quintana (2014) 10 2 (20) 18 (7-38) 20.8 (12-49) N/A N/A N/A N/A
Kucher (2014) 30 0 20.8+3.0 15+1.0 1.28+0.19 0.99+0.17 30+9 24+7
Dumantepe (2014) 22 5 (26) 23 (16-35) 20.5 (14-25) 1.29+0.17 0.92+0.11 67+14 34+11
Bagla (2015) 45 0 24 12.8 (12-24) 1.59+0.54 0.93+0.17 49.8+13.76 31.1+9.9
Piazza (2015) 150 31 (21) 23.7+2.9 ≈13.6 (12-24) 1.55+0.39 1.13+0.20 51.4+16 37.5+11.9
Nykamp (2015) 45 12 (27) 30.5 (14-66) 14.2+4.0 N/A N/A 53.5 (38-110) 32 (24-45)
Graif (2017) 24 3 (13) 27.1+11.3 23.9+8.8 1.6+0.25 N/A 56+12.9 44.6+11.8
Total 483 89 (18.5) 25.7 16.2 1.49 1.05 45.8 31.6

Author (year) No. of pts
No. of high risk PEs
(%)
tPA dose (mg)
tPA duration
(hr)
Bleeding comp Mortality(1-6 months)
Minor Major ICH
Chamsuddin (2008) 10 N/A 21.8 24.8+8.4 2 (20) 0 (0) 0 (0) 0 (0)
Lin (2009) 11 2 (18) 17.2+2.4 17.4+5.2 0 (0) 0 (0) 0 (0) 1 (9)
Engelhardt (2011) 24 5 (21) 33.5+15.5 19.7+8.1 2 (8) 4 (17) 0 (0) 0 (0)
Kennedy (2013) 60 12 (20) 35.1+11.1 19.6+6.0 1 (2) 1 (2) 0 (0) 4 (7)
Engelberger (2013) 52 14 (27) 21.0+5.7 15.2+1.7 11 (21) 2 (4) 0 (0) 2 (4)
Quintana (2014) 10 2 (20) 18 (7-38) 20.8 (12-49) 2 (20) 0 (0) 0 (0) 0 (0)
Kucher (2014) 30 0 20.8+3.0 15+1.0 3 (10) 0 (0) 0 (0) 0 (0)
Dumantepe (2014) 22 5 (26) 23 (16-35) 20.5 (14-25) 2 (9) 0 (0) 0 (0) 3 (13.6)
Bagla (2015) 45 0 24 12.8 (12-24) 4 (8.9) 2 (4.4) 0 (0) 0 (0)
Piazza (2015) 150 31 (21) 23.7+2.9 ≈13.6 (12-24) 0 (0) 15 (1.0) 0 (0) 4 (2.7)
Nykamp (2015) 45 12 (27) 30.5 (14-66) 14.2+4.0 0 (0) 0 (0) 0 (0) 0 (0)
Graif (2017) 24 3 (13) 27.1+11.3 23.9+8.8 0 (0) 2 (8.3) 0 (0) 2 (8.3)
Total 483 89 (18.5) 25.7 16.2 41 (9) 26 (5.4) 0 (0) 16 (3.3)

Background
FDA approval for treatment of acute PE in May 2014
Broad adoption of SEATTLE II protocol

Case Example
54 y/o female presenting with acute onset of chest pain and syncope
PE: HR 110/min, BP 82/50, SaO2 92% on 100% non-rebreather facemask
Troponin I = 0.92 ng/ml (↑)
BNP = 572 pg/ml (↑)


RV:LV Ratio = 2.5

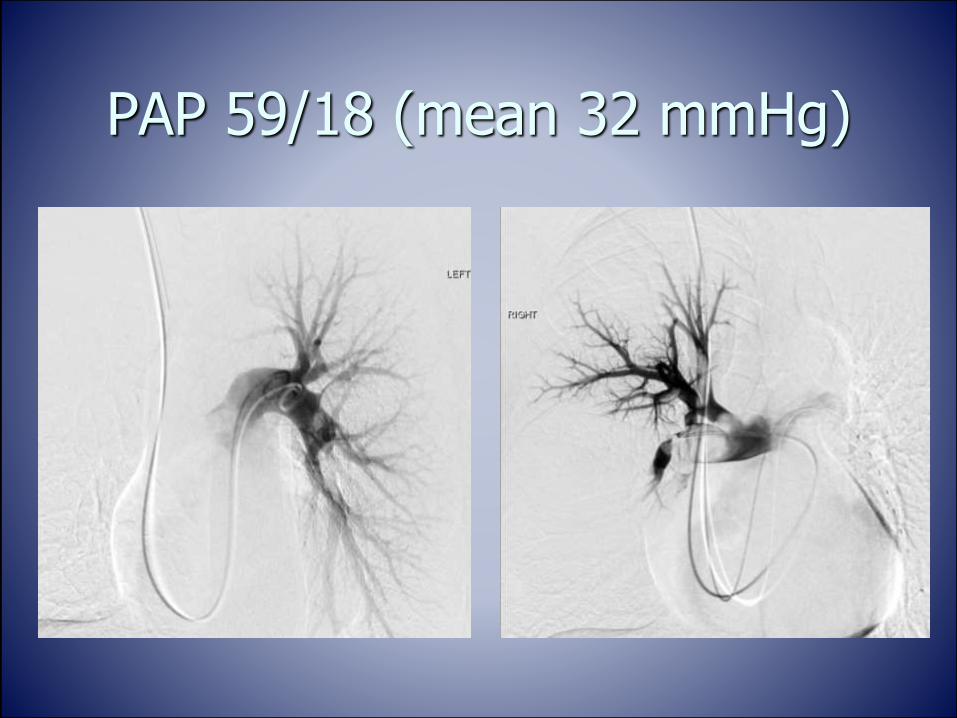
PAP 59/18 (mean 32 mmHg)


tPA 1mg/hr via each catheter x 12 hours
Heparin 500 units/hr
At 90 minutes post initiation of USCDT
HR 90/min, BP 114/72, SaO2 98% on 4L
Easier to breathe, speak
Next morning
HR 74/min, BP 122/74, SaO2 99% on 2L

USCDT protocol
Infusion ended at 4 am
Drug delivery ports converted to NS
Conversion to heparin moderate intensity protocol
Follow up PA pressures measured through EKOS catheter at bedside after removing ultrasound core at 7 am
R PA = 24/10 (mean 15 mm Hg)
L PA = 23/10 (mean 14 mm Hg)
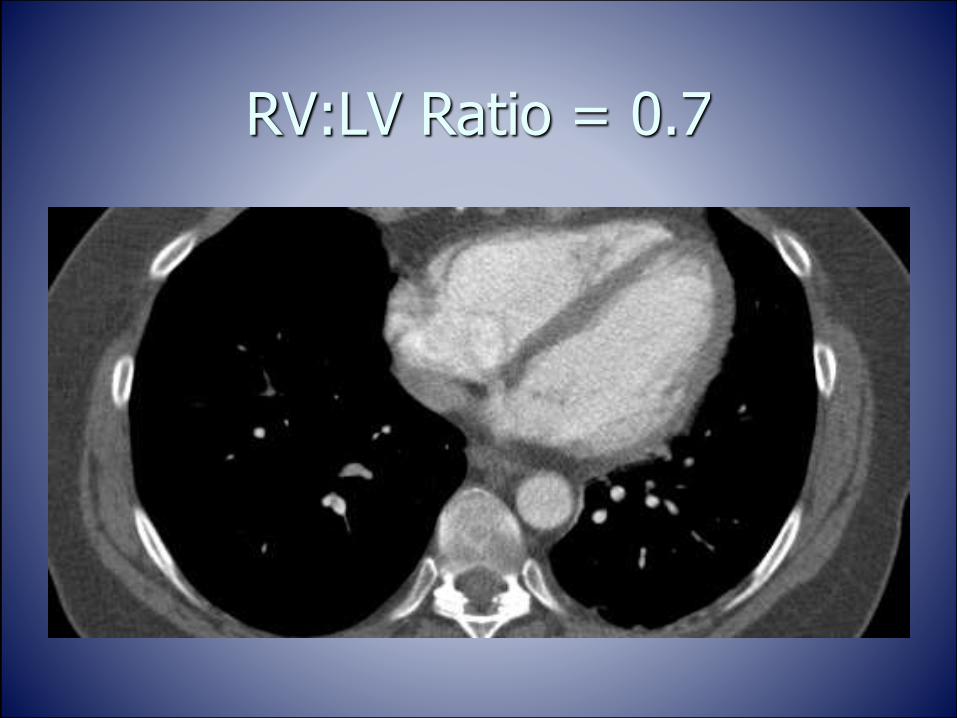
RV:LV Ratio = 0.7

Pre and Post USCDT
RV:LV = 2.5 RV:LV = 0.7

Follow up
LOS = 3 days
Discharged on Rivaroxaban
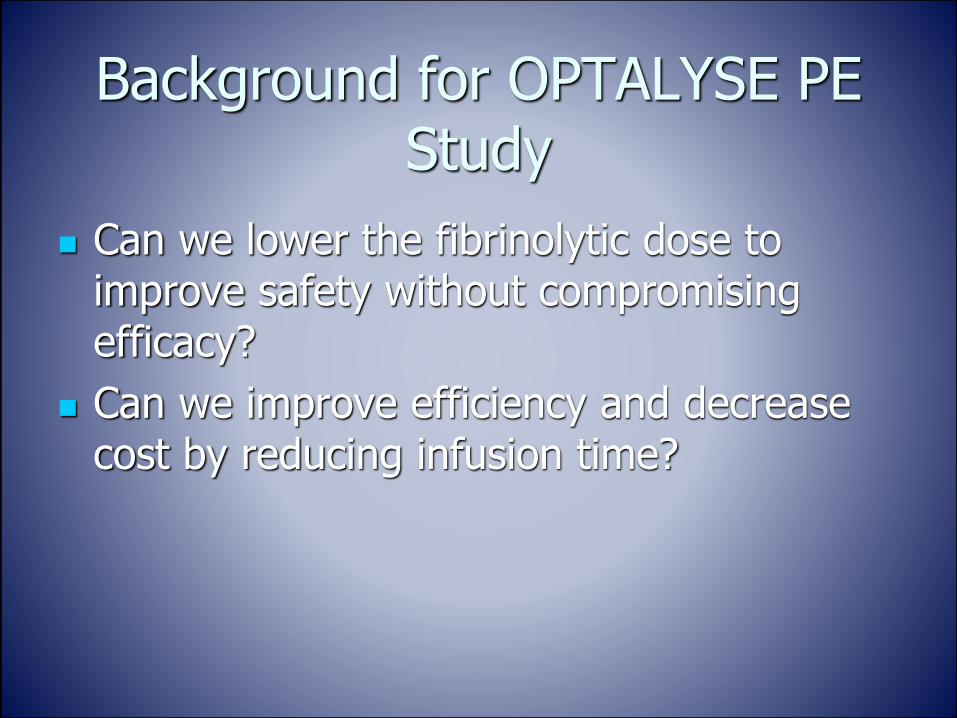
Background for OPTALYSE PE Study
Can we lower the fibrinolytic dose to improve safety without compromising efficacy?
Can we improve efficiency and decrease cost by reducing infusion time?
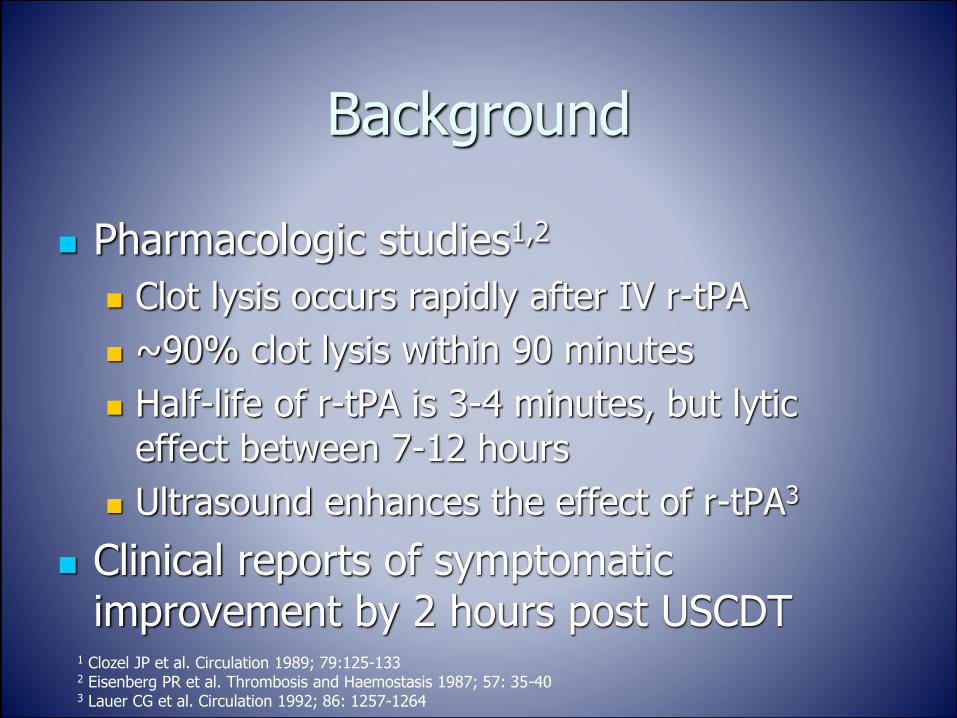
Background
Pharmacologic studies1,2
Clot lysis occurs rapidly after IV r-tPA
~90% clot lysis within 90 minutes
Half-life of r-tPA is 3-4 minutes, but lytic effect between 7-12 hours
Ultrasound enhances the effect of r-tPA3
Clinical reports of symptomatic improvement by 2 hours post USCDT
1 Clozel JP et al. Circulation 1989; 79:125-1332 Eisenberg PR et al. Thrombosis and Haemostasis 1987; 57: 35-403 Lauer CG et al. Circulation 1992; 86: 1257-1264

Optimum duration and dose of r-tPA with the acoustic pulse thrombolysis procedure
for intermediate-risk (submassive) pulmonary embolism (OPTALYSE PE)

Purpose
To explore optimal duration of the EkoSonic™ Endovascular System ultrasound-facilitated, catheter-directed thrombolysis (USCDT) and dose of r-tPA in patients with acute submassive pulmonary embolism (PE)

Patient Selection
Main Inclusion Criteria
18-75 years of age AND
CTA evidence of proximal PE (unilateral or bilateral) AND
Acute PE (symptom duration ≤14 days) AND
Submassive PE (RV:LV diameter ≥ 0.9 and hemodynamically stable)
Main Exclusion Criteria
No recent history of stroke, TIA, head trauma, active bleeding from a major organ, major surgery, or catheter-based pharmacomechanical treatment for PE
No high-risk for catastrophic bleeding

Randomized to 1 of 4 treatment groups

Material and Methods
Eligible subjects received treatment with USCDT within 48h of the diagnostic CTA

Primary Endpoints
Efficacy
Reduction of RV:LV by >0.2 on CTA 48h after starting treatment
Safety
Major bleeding events within 72h after initiating the procedure (ISTH criteria)

Secondary Efficacy Endpoints
Technical success of APT procedure as assessed by Adjudication Committee
Change in baseline echo parameters (4h, 48h, 30d, 90d, 365d post APT procedure)
◼RV:LV ratio ◼TAPSE
◼Estimated RVSP ◼Collapse of the IVC with respiration
Change in thrombus burden by MMS as assessed by CTA at 48h post APT procedure
6MWD with BORG score and requirement for oxygen therapy
QOL as measured by PROMIS PF-6 and PEmb-QOL at all post-hospitalization visits

Secondary Safety Endpoints
Technical procedural complications
Symptomatic recurrent PE
All-cause mortality

Analysis Flow Diagram
101 patients
•Randomized
•17 centers
•Enrollment 6/2015-10/2016
•Intention to Treat (ITT) group
100 patients
•Treated with APT procedure
86 patients
•With bilateral catheters to treat bilateral disease
83 patients
•In modified per protocol (mPP) analysis
•3 excluded for receiving additional r-tPA
77 patients
•Complete, technically adequate echo data

Study Population
Demographics 2hr; 2 mg/hr/catheter 4hr; 1 mg/hr/catheter 6hr; 1 mg/hr/catheter 6hr; 2 mg/hr/catheter Overall
N 28 27 28 18 101
Age (y) 56 57 59 59 57.6
Female 43% 44% 61% 39% 48%
Caucasian 57% 52% 68% 61% 59%
BMI (k/m2) 36 36 40 29 35.8
Diabetes 39% 37% 39% 17% 35%
Hypertension 57% 67% 79% 56% 65%

Study Population
Signs/Symptoms 2hr; 2 mg/hr/catheter 4hr; 1 mg/hr/catheter 6hr; 1 mg/hr/catheter 6hr; 2 mg/hr/catheter Overall
Dyspnea 86 89 100 100 93
Tachycardia 54 33 46 28 42
Hypoxemia 18 33 25 22 25
Chest pain 54 41 46 44 47
DVT (US) 43 41 36 56 43
*All values in percentages

OPTALYSE PE CTA Results
Results
Tx Group N
RV/LV Change
at 48h (%);
p-value*, 1-sided
MMS % Change;
p-value**, 2-sided
Arm 1: 2hr; 2 mg/hr/catheter 27 -0.40 (24); 0.0046 -6%; 0.0083
Arm 2: 4hr; 1 mg/hr/catheter 26 -0.35 (23); 0.0039 -9%; 0.0002
Arm 3: 6hr; 1 mg/hr/catheter 27 -0.42 (26); 0.0006 -14%; <0.0001
Arm 4: 6hr; 2 mg/hr/catheter 18 -0.48 (26); 0.0179 -26%; 0.0006
*100 patients treated (ITT)

mPP = 83 patients (Bilateral only)
Results
Tx Group N
RV/LV Change
at 48h (%);
p value*, 1-sided
Arm 1: 2hr; 2 mg/hr/catheter (8 mg) 21 -0.46 (27); 0.0030
Arm 2: 4hr; 1 mg/hr/catheter (8 mg) 21 -0.40 (25); 0.0014
Arm 3: 6hr; 1 mg/hr/catheter (12 mg) 24 -0.44 (27); 0.0006
Arm 4: 6hr; 2 mg/hr/catheter (24 mg) 16 -0.52 (27); 0.0145
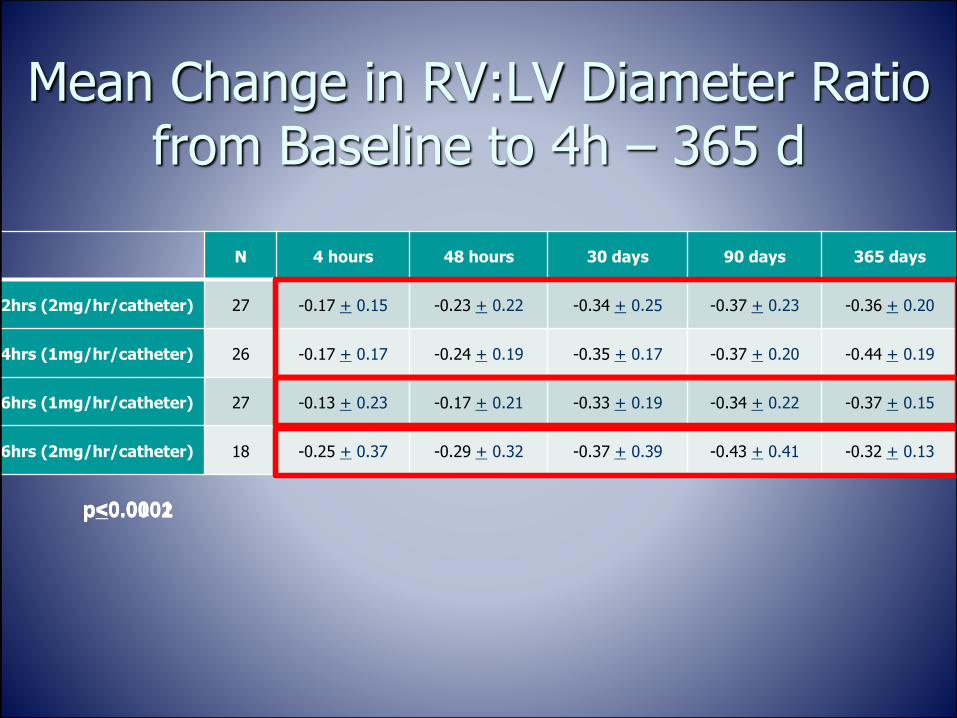
Mean Change in RV:LV Diameter Ratio from Baseline to 4h – 365 d
N 4 hours 48 hours 30 days 90 days 365 days
2hrs (2mg/hr/catheter) 27 -0.17 + 0.15 -0.23 + 0.22 -0.34 + 0.25 -0.37 + 0.23 -0.36 + 0.20
4hrs (1mg/hr/catheter) 26 -0.17 + 0.17 -0.24 + 0.19 -0.35 + 0.17 -0.37 + 0.20 -0.44 + 0.19
6hrs (1mg/hr/catheter) 27 -0.13 + 0.23 -0.17 + 0.21 -0.33 + 0.19 -0.34 + 0.22 -0.37 + 0.15
6hrs (2mg/hr/catheter) 18 -0.25 + 0.37 -0.29 + 0.32 -0.37 + 0.39 -0.43 + 0.41 -0.32 + 0.13
p<0.0001p<0.0002p<0.01

0,79
0,74
0,78
0,73
0,6
0,7
0,8
0,9
1
1,1
1,2
Baseline 4h 48h 30d 90d 365d
RV/LV RatioP<0.0001 at 365d
Cohort 1 Cohort 2 Cohort 3 Cohort 4
At 365d, the mean RV/LV ratio was in the 0.7 range for all cohorts
Mean Change in RV:LV Diameter Ratio from Baseline to 4h – 365 d

6-minute walk distance
Follow up interval
Tx Group 30 d 90 d 365 d
Arm 1: 2hr; 2 mg/hr/catheter 351.6 352.2 383.3
Arm 2: 4hr; 1 mg/hr/catheter 336.0 411.3 362.3
Arm 3: 6hr; 1 mg/hr/catheter 343.1 375.9 417.0
Arm 4: 6hr; 2 mg/hr/catheter 327.3 348.2 357.9

300
320
340
360
380
400
420
440
Cohort 1 Cohort 2 Cohort 3 Cohort 4
30d 365d
6-minute walk distance
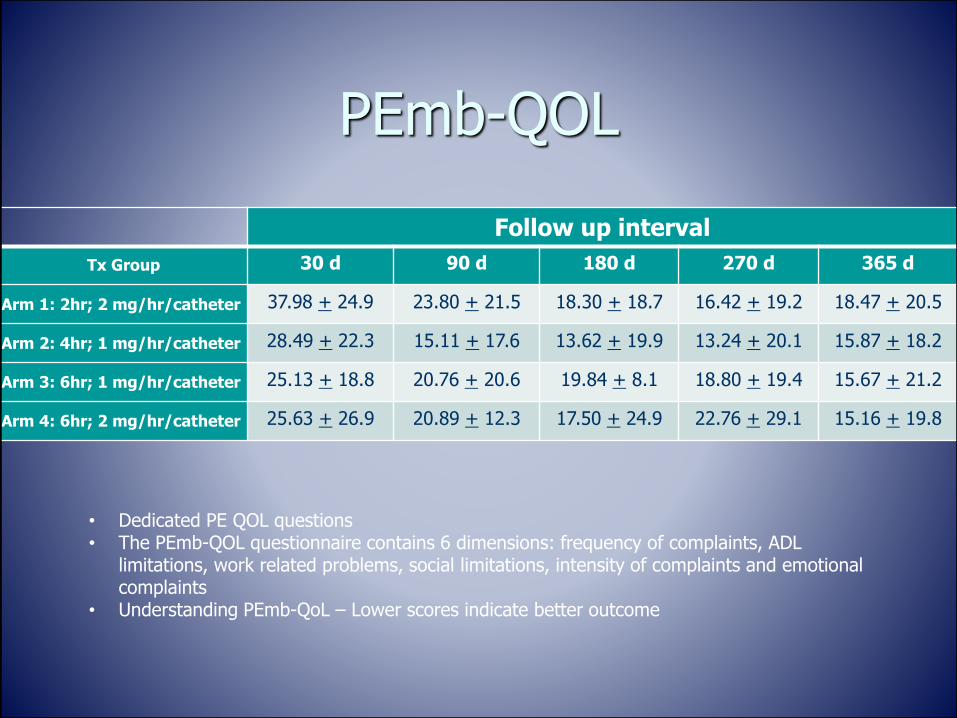
PEmb-QOL
Follow up interval
Tx Group 30 d 90 d 180 d 270 d 365 d
Arm 1: 2hr; 2 mg/hr/catheter 37.98 + 24.9 23.80 + 21.5 18.30 + 18.7 16.42 + 19.2 18.47 + 20.5
Arm 2: 4hr; 1 mg/hr/catheter 28.49 + 22.3 15.11 + 17.6 13.62 + 19.9 13.24 + 20.1 15.87 + 18.2
Arm 3: 6hr; 1 mg/hr/catheter 25.13 + 18.8 20.76 + 20.6 19.84 + 8.1 18.80 + 19.4 15.67 + 21.2
Arm 4: 6hr; 2 mg/hr/catheter 25.63 + 26.9 20.89 + 12.3 17.50 + 24.9 22.76 + 29.1 15.16 + 19.8
• Dedicated PE QOL questions• The PEmb-QOL questionnaire contains 6 dimensions: frequency of complaints, ADL
limitations, work related problems, social limitations, intensity of complaints and emotional complaints
• Understanding PEmb-QoL – Lower scores indicate better outcome

PEmb-QOL
0
5
10
15
20
25
30
35
40
Cohort 1 Cohort 2 Cohort 3 Cohort 4
30d 365d
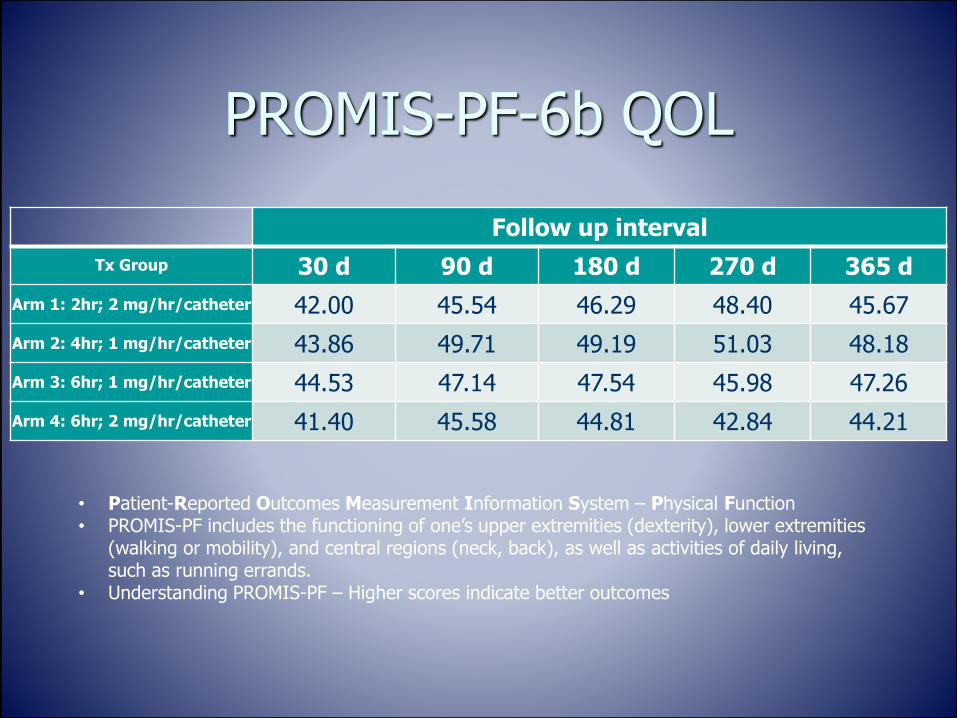
PROMIS-PF-6b QOL
Follow up interval
Tx Group 30 d 90 d 180 d 270 d 365 d
Arm 1: 2hr; 2 mg/hr/catheter 42.00 45.54 46.29 48.40 45.67
Arm 2: 4hr; 1 mg/hr/catheter 43.86 49.71 49.19 51.03 48.18
Arm 3: 6hr; 1 mg/hr/catheter 44.53 47.14 47.54 45.98 47.26
Arm 4: 6hr; 2 mg/hr/catheter 41.40 45.58 44.81 42.84 44.21
• Patient-Reported Outcomes Measurement Information System – Physical Function • PROMIS-PF includes the functioning of one’s upper extremities (dexterity), lower extremities
(walking or mobility), and central regions (neck, back), as well as activities of daily living, such as running errands.
• Understanding PROMIS-PF – Higher scores indicate better outcomes

PROMIS-PF-6b QOL
38
40
42
44
46
48
50
Cohort 1 Cohort 2 Cohort 3 Cohort 4
30d 365d

Recurrent PE and Mortality
All-cause mortality, n (%)
Confirmed recurrent PE, n (%)
Suspected recurrent PE, n (%)
Tx Arm N 30 d 365 d 30 d 365 d 30 d 365 d
Arm #1 27 0 1 (3.7)b 0 0 0 0
Arm #2 27 0 0 0 1 (3.7)d 1 (3.7)e 1 (3.7)e
Arm #3 28 0 0 1 (3.6)c 1 (3.6)c 0 0
Arm #4 18 1 (5.6)a 1 (5.6)a 0 0 0 0
All 100 1 (1) 2 (2) 1 (1) 2 (2) 1 (1) 1 (1)
**Analysis performed on intention to treat populationa Death attributed to cardiac arrest. No follow up imaging or autopsy.b Death attributed to complications of COPD and multi-organ failure 177 days post USCDT procedure.c Recurrent symptomatic PE within 30 d (patient was off anticoagulation).d Recurrent symptomatic PE at 9 months post USCDT.e Patient presented with acute symptoms, but no diagnostic imaging performed prior to treatment with systemic tPA.

Major Bleeding within 72 Hours after Initiating the Procedure
Tx Arm N N (%) Events (%)
Arm #1 27 0 0
Arm #2 27 1 (3.7)1 2 (7.4)
Arm #3 28 1 (3.6)2 1 (3.6)
Arm #4 18 2 (11.1)3,4 2 (11.1)
All 100 4 (4) 5 (5)1 61 y/o female experienced anemia secondary to facial trauma caused by syncopal event; later received additional 50mg systemic tPA post study treatment and experienced ICH.
2 35 y/o female experienced anemia secondary to bleeding uterine fibroid after receiving 12mg additional tPA after study treatment.
3 75 year old male with history of platelet abnormality, pancytopenia and labile hypertension experienced ICH and died 11 days after study procedure while in rehab facility.
4 50 y/o male with S/P splenectomy 2 months prior to presentation. Experienced hemoperitoneum post procedure secondary to splenic artery pseudoaneurysm. Treated successfully with coil embolization.

Case Example
50 y/o female presents to the ED with CP, SOB and syncope
BP 102/51 HR 116/min O2 sat 94% on RA
Troponin I = 2.13 ng/ml (↑)
CTA: Saddle and Bilateral PE
RV:LV =1.6


sPAP = 42 mmHg

tPA 1mg/hr via each catheter x 6 hours
Heparin 500 units/hr

3 hours post infusion patient reports noticeably less SOB
6 hours post infusion
Heparin moderate intensity protocol
BP 124/86 HR 96/min SaO2 98% RA
sPAP = 23 mmHg
TTE
RV:LV = 0.64
Discharged on Day #3 on Rivaroxaban

Case Example #2
70 y/o male with history of prior DVT/PE in setting of postoperative period following neck surgery
Sedentary to due chronic back and knee pain
SOB x 2 days
Vitals stable
Troponin I = 0.4ng/ml, BNP = 504 pg/ml
ECG normal

RV:LV = 1.41

OPTALYSE PE tPA at 2 mg/hr x 2 h = 8 mg

Pre-procedure TTE Post-procedure TTE

OPTALYSE PEtPA at 2mg/hr x 2 h = 8 mg
Pre-USCDTRV:LV = 1.41
Post-USCDTRV:LV = 1.12

Case Example #3
82 y/o male with sudden onset of CP and SOB
SaO2 89% → 94% Non-rebreather
BP 110/64 mm Hg, HR 90/min
Lactic acid = 4.5 mmol/l
Troponin I = 0.63 ng/ml
BNP = 493 pg/ml
AKI: eGFR = 44


RV:LV = 2.8

Admitted to telemetry
Started on anticoagulation with UFH moderate intensity protocol
Foley catheter placed for strict I/Os
Experienced hematuria due to traumatic catheter placement
Hgb: 14.7 → 10.2 g/dl
CBI with clearing
AC continued

Worsening respiratory status with need for non-rebreather for SaO2 > 90%
Initial TTE
RV:LV = 1.8
TAPSE = 8 mm
RVSP = 41 mm Hg


R PAP = 77/19 mmHg (µ = 38 mm Hg)
L PAP = 35/21 (µ = 26 mm Hg)
Bilateral 12 cm EkoSonic™ catheters
tPA at 1 mg/hr x 6 hours
UFH 500 units/hr

Follow up
RV:LV = 0.8 Clinical
SOB resolved
SaO2 98% on 3L NC
RVSP: 20 mm Hg
Urine cleared
Discharged on Eliquis
LOS = 4 days
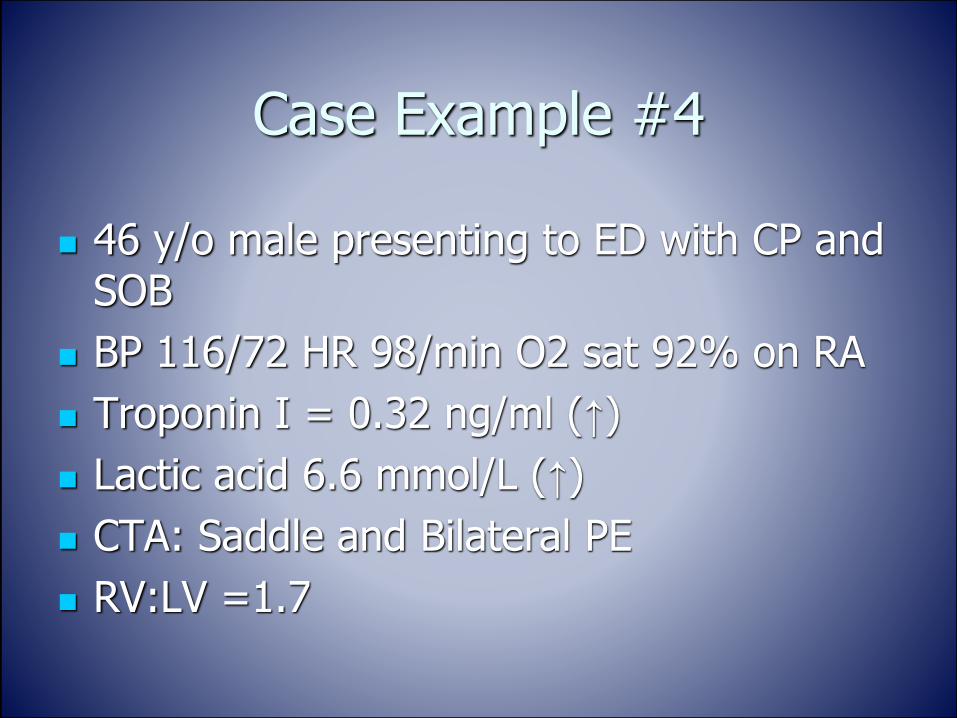
Case Example #4
46 y/o male presenting to ED with CP and SOB
BP 116/72 HR 98/min O2 sat 92% on RA
Troponin I = 0.32 ng/ml (↑)
Lactic acid 6.6 mmol/L (↑)
CTA: Saddle and Bilateral PE
RV:LV =1.7
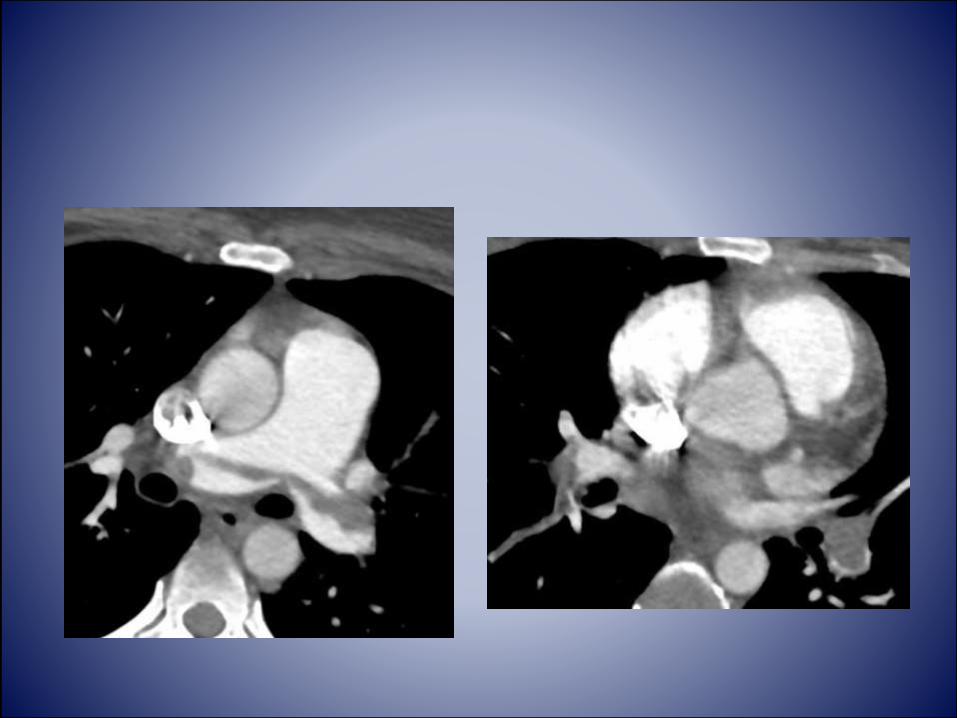


PAP = 56/21 mmHg
Bilateral 12 cm EkoSonic™ catheters
tPA at 1 mg/hr x 6 hours
UFH 500 units/hr
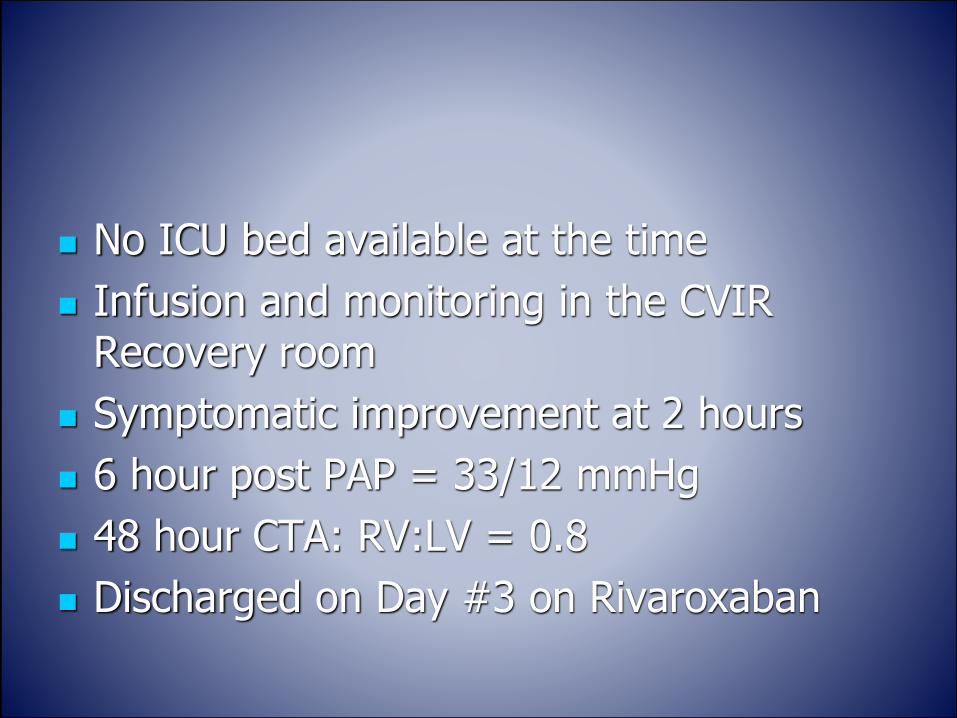
No ICU bed available at the time
Infusion and monitoring in the CVIR Recovery room
Symptomatic improvement at 2 hours
6 hour post PAP = 33/12 mmHg
48 hour CTA: RV:LV = 0.8
Discharged on Day #3 on Rivaroxaban

OPTALYSE PE conclusions
Statistically significant reduction in RV:LV in all 4 treatment groups
Lower-dose, shorter duration USCDT appears to be as effective as the regimens employed in other USCDT studies
Reduced dose and treatment duration with r-tPA minimizes risk of major bleeding
Very low long-term mortality
Improved quality of life
Impact of OPTALYSE PE Treatment Regimen
Potential use of USCDT in patients with relative contraindication to lytic therapy
Change treatment duration with comfort that effective
Potential to avoid ICU stay
What’s Next
KNOCKOUT PE worldwide trial
1500 patients with acute submassive PE treated with USCDT

The OPTALYSE PE Trial – Reducing thrombolytic dose and treatment times with
EKOS™ in the treatment of pulmonary embolism patients
Keith M. Sterling, M.D.Director, Cardiovascular & Interventional Radiology
Inova Alexandria Hospital
Alexandria, VA, US
Associate Professor of Radiology
George Washington University School of Medicine
Washington, DC, US