Embed Size (px)
Citation preview
1
The Pacific islands: an analysis of the status of species as listed on the 2008 IUCN Red List of
Threatened Species™
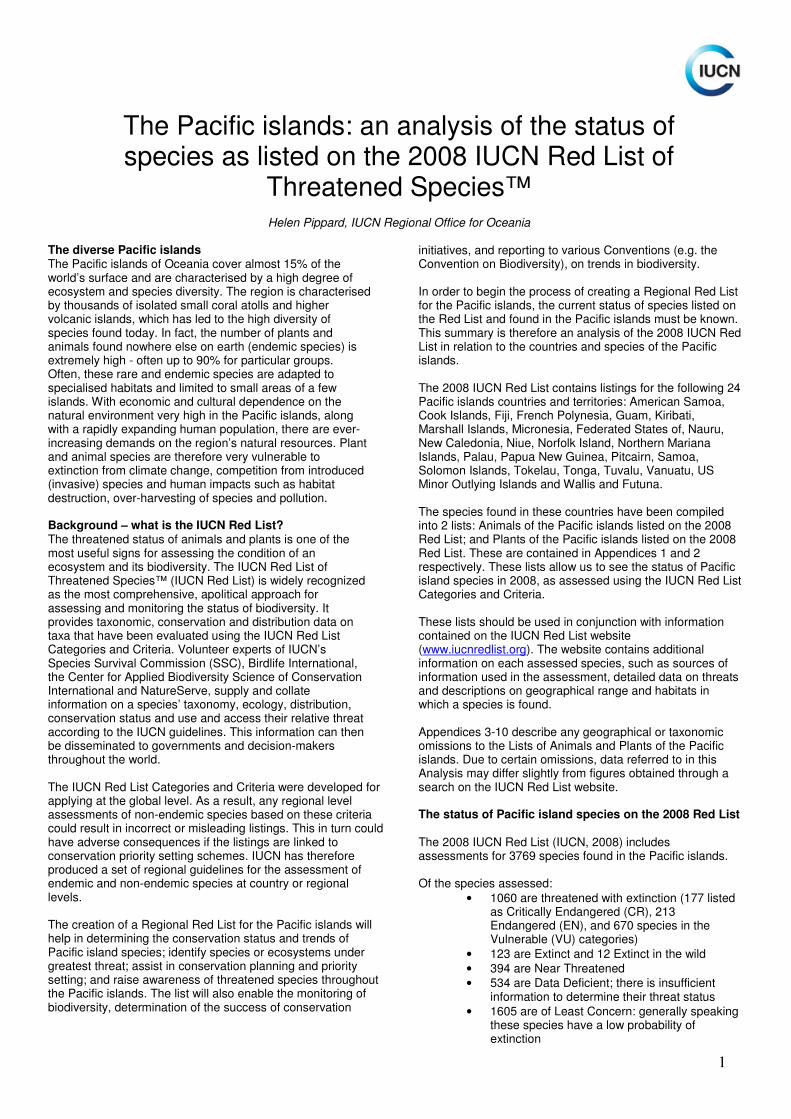
Helen Pippard, IUCN Regional Office for Oceania The diverse Pacific islands The Pacific islands of Oceania cover almost 15% of the world’s surface and are characterised by a high degree of ecosystem and species diversity. The region is characterised by thousands of isolated small coral atolls and higher volcanic islands, which has led to the high diversity of species found today. In fact, the number of plants and animals found nowhere else on earth (endemic species) is extremely high - often up to 90% for particular groups. Often, these rare and endemic species are adapted to specialised habitats and limited to small areas of a few islands. With economic and cultural dependence on the natural environment very high in the Pacific islands, along with a rapidly expanding human population, there are ever-increasing demands on the region’s natural resources. Plant and animal species are therefore very vulnerable to extinction from climate change, competition from introduced (invasive) species and human impacts such as habitat destruction, over-harvesting of species and pollution. Background – what is the IUCN Red List? The threatened status of animals and plants is one of the most useful signs for assessing the condition of an ecosystem and its biodiversity. The IUCN Red List of Threatened Species™ (IUCN Red List) is widely recognized as the most comprehensive, apolitical approach for assessing and monitoring the status of biodiversity. It provides taxonomic, conservation and distribution data on taxa that have been evaluated using the IUCN Red List Categories and Criteria. Volunteer experts of IUCN’s Species Survival Commission (SSC), Birdlife International, the Center for Applied Biodiversity Science of Conservation International and NatureServe, supply and collate information on a species’ taxonomy, ecology, distribution, conservation status and use and access their relative threat according to the IUCN guidelines. This information can then be disseminated to governments and decision-makers throughout the world. The IUCN Red List Categories and Criteria were developed for applying at the global level. As a result, any regional level assessments of non-endemic species based on these criteria could result in incorrect or misleading listings. This in turn could have adverse consequences if the listings are linked to conservation priority setting schemes. IUCN has therefore produced a set of regional guidelines for the assessment of endemic and non-endemic species at country or regional levels. The creation of a Regional Red List for the Pacific islands will help in determining the conservation status and trends of Pacific island species; identify species or ecosystems under greatest threat; assist in conservation planning and priority setting; and raise awareness of threatened species throughout the Pacific islands. The list will also enable the monitoring of biodiversity, determination of the success of conservation
initiatives, and reporting to various Conventions (e.g. the Convention on Biodiversity), on trends in biodiversity. In order to begin the process of creating a Regional Red List for the Pacific islands, the current status of species listed on the Red List and found in the Pacific islands must be known. This summary is therefore an analysis of the 2008 IUCN Red List in relation to the countries and species of the Pacific islands. The 2008 IUCN Red List contains listings for the following 24 Pacific islands countries and territories: American Samoa, Cook Islands, Fiji, French Polynesia, Guam, Kiribati, Marshall Islands, Micronesia, Federated States of, Nauru, New Caledonia, Niue, Norfolk Island, Northern Mariana Islands, Palau, Papua New Guinea, Pitcairn, Samoa, Solomon Islands, Tokelau, Tonga, Tuvalu, Vanuatu, US Minor Outlying Islands and Wallis and Futuna. The species found in these countries have been compiled into 2 lists: Animals of the Pacific islands listed on the 2008 Red List; and Plants of the Pacific islands listed on the 2008 Red List. These are contained in Appendices 1 and 2 respectively. These lists allow us to see the status of Pacific island species in 2008, as assessed using the IUCN Red List Categories and Criteria. These lists should be used in conjunction with information contained on the IUCN Red List website (www.iucnredlist.org). The website contains additional information on each assessed species, such as sources of information used in the assessment, detailed data on threats and descriptions on geographical range and habitats in which a species is found. Appendices 3-10 describe any geographical or taxonomic omissions to the Lists of Animals and Plants of the Pacific islands. Due to certain omissions, data referred to in this Analysis may differ slightly from figures obtained through a search on the IUCN Red List website. The status of Pacific island species on the 2008 Red List The 2008 IUCN Red List (IUCN, 2008) includes assessments for 3769 species found in the Pacific islands. Of the species assessed:
• 1060 are threatened with extinction (177 listed as Critically Endangered (CR), 213 Endangered (EN), and 670 species in the Vulnerable (VU) categories)
• 123 are Extinct and 12 Extinct in the wild
• 394 are Near Threatened
• 534 are Data Deficient; there is insufficient information to determine their threat status
• 1605 are of Least Concern: generally speaking these species have a low probability of extinction
2
Rainbow Reef, Vanua Levu, Fiji Islands © Helen Pippard
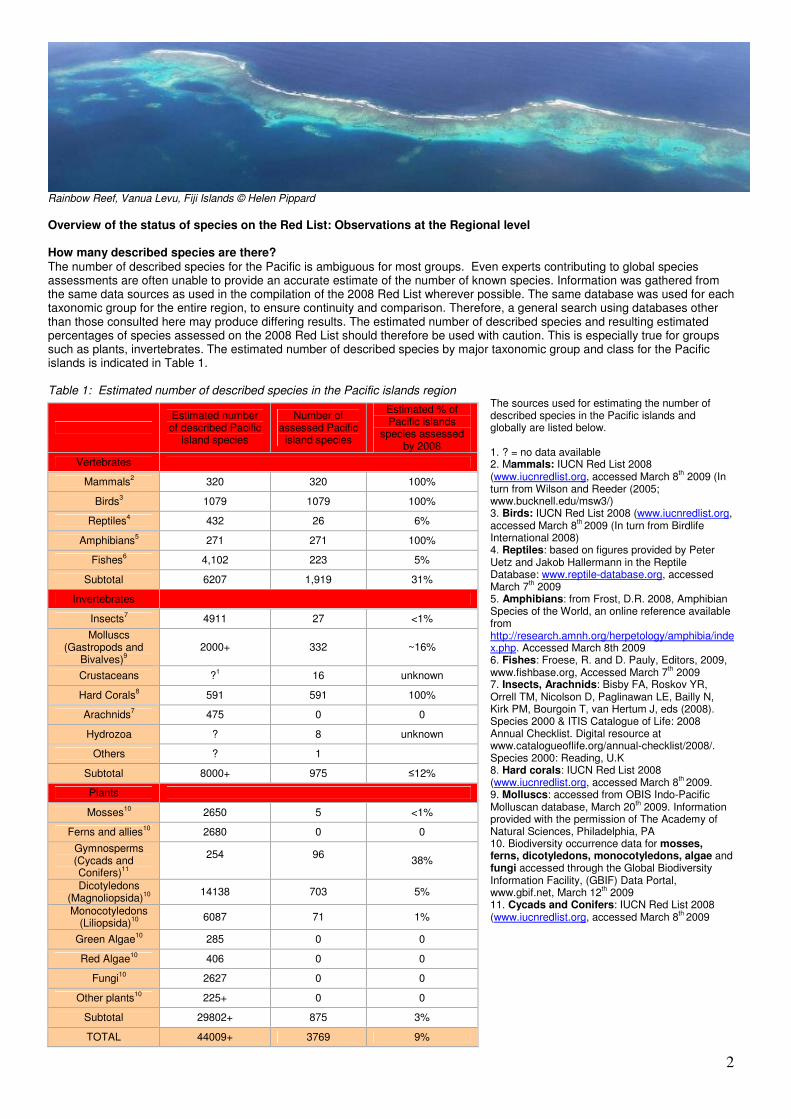
Overview of the status of species on the Red List: Observations at the Regional level How many described species are there? The number of described species for the Pacific is ambiguous for most groups. Even experts contributing to global species assessments are often unable to provide an accurate estimate of the number of known species. Information was gathered from the same data sources as used in the compilation of the 2008 Red List wherever possible. The same database was used for each taxonomic group for the entire region, to ensure continuity and comparison. Therefore, a general search using databases other than those consulted here may produce differing results. The estimated number of described species and resulting estimated percentages of species assessed on the 2008 Red List should therefore be used with caution. This is especially true for groups such as plants, invertebrates. The estimated number of described species by major taxonomic group and class for the Pacific islands is indicated in Table 1. Table 1: Estimated number of described species in the Pacific islands region
The sources used for estimating the number of described species in the Pacific islands and globally are listed below. 1. ? = no data available 2. Mammals: IUCN Red List 2008 (www.iucnredlist.org, accessed March 8
th 2009 (In
turn from Wilson and Reeder (2005; www.bucknell.edu/msw3/) 3. Birds: IUCN Red List 2008 (www.iucnredlist.org, accessed March 8
th 2009 (In turn from Birdlife
International 2008) 4. Reptiles: based on figures provided by Peter Uetz and Jakob Hallermann in the Reptile Database: www.reptile-database.org, accessed March 7
th 2009
5. Amphibians: from Frost, D.R. 2008, Amphibian Species of the World, an online reference available from http://research.amnh.org/herpetology/amphibia/index.php. Accessed March 8th 2009 6. Fishes: Froese, R. and D. Pauly, Editors, 2009, www.fishbase.org, Accessed March 7
th 2009
7. Insects, Arachnids: Bisby FA, Roskov YR, Orrell TM, Nicolson D, Paglinawan LE, Bailly N, Kirk PM, Bourgoin T, van Hertum J, eds (2008). Species 2000 & ITIS Catalogue of Life: 2008 Annual Checklist. Digital resource at www.catalogueoflife.org/annual-checklist/2008/. Species 2000: Reading, U.K 8. Hard corals: IUCN Red List 2008 (www.iucnredlist.org, accessed March 8
th 2009.
9. Molluscs: accessed from OBIS Indo-Pacific Molluscan database, March 20
th 2009. Information
provided with the permission of The Academy of Natural Sciences, Philadelphia, PA 10. Biodiversity occurrence data for mosses, ferns, dicotyledons, monocotyledons, algae and fungi accessed through the Global Biodiversity Information Facility, (GBIF) Data Portal, www.gbif.net, March 12
th 2009
11. Cycads and Conifers: IUCN Red List 2008 (www.iucnredlist.org, accessed March 8
th 2009
Estimated number of described Pacific
island species
Number of assessed Pacific
island species
Estimated % of Pacific islands
species assessed by 2008
Vertebrates
Mammals2 320 320 100%
Birds3 1079 1079 100%
Reptiles4 432 26 6%
Amphibians5 271 271 100%
Fishes6 4,102 223 5%
Subtotal 6207 1,919 31%
Invertebrates
Insects7 4911 27 <1%
Molluscs (Gastropods and
Bivalves)9
2000+ 332 ~16%
Crustaceans ?1 16 unknown
Hard Corals8 591 591 100%
Arachnids7 475 0 0
Hydrozoa ? 8 unknown
Others ? 1
Subtotal 8000+ 975 ≤12%
Plants
Mosses10
2650 5 <1%
Ferns and allies10
2680 0 0
Gymnosperms (Cycads and Conifers)
11
254
96
38%
Dicotyledons (Magnoliopsida)
10
14138 703 5%
Monocotyledons (Liliopsida)
10
6087 71 1%
Green Algae10
285 0 0
Red Algae10
406 0 0
Fungi10
2627 0 0
Other plants10
225+ 0 0
Subtotal 29802+ 875 3%
TOTAL 44009+ 3769 9%
3
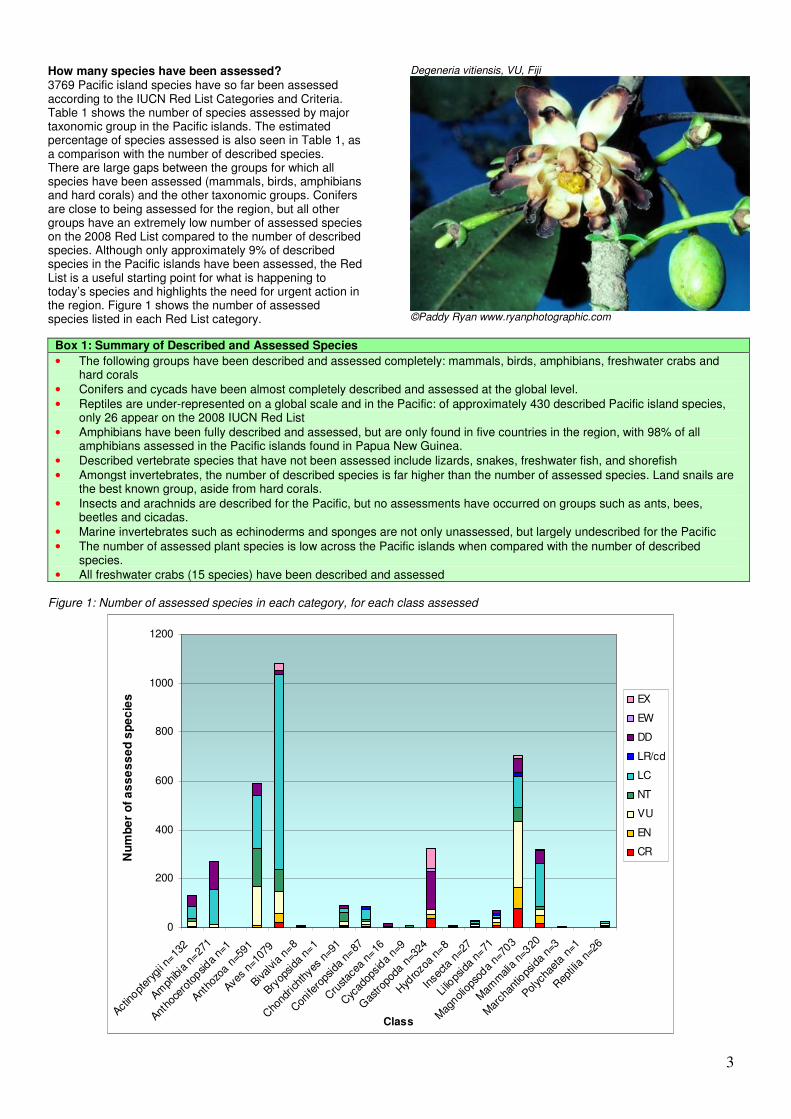
How many species have been assessed? 3769 Pacific island species have so far been assessed according to the IUCN Red List Categories and Criteria. Table 1 shows the number of species assessed by major taxonomic group in the Pacific islands. The estimated percentage of species assessed is also seen in Table 1, as a comparison with the number of described species. There are large gaps between the groups for which all species have been assessed (mammals, birds, amphibians and hard corals) and the other taxonomic groups. Conifers are close to being assessed for the region, but all other groups have an extremely low number of assessed species on the 2008 Red List compared to the number of described species. Although only approximately 9% of described species in the Pacific islands have been assessed, the Red List is a useful starting point for what is happening to today’s species and highlights the need for urgent action in the region. Figure 1 shows the number of assessed species listed in each Red List category.
Degeneria vitiensis, VU, Fiji
©Paddy Ryan www.ryanphotographic.com
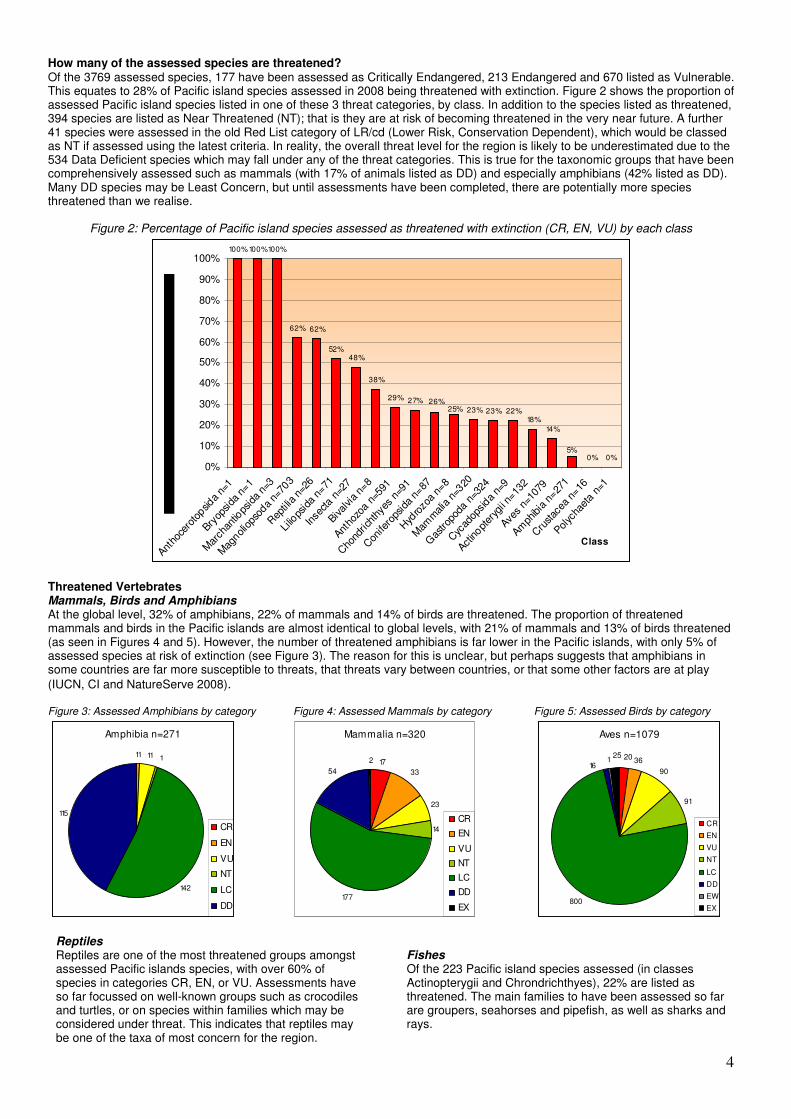
Figure 1: Number of assessed species in each category, for each class assessed
0
200
400
600
800
1000
1200
Actinopt
eryg
ii n=
132
Amph
ibia
n=27
1
Antho
cero
topsid
a n=
1
Antho
zoa n
=591
Aves
n=10
79
Bival
via
n=8
Bryop
sida
n=1
Cho
ndric
hthy
es n
=91
Con
ifero
psid
a n=
87
Cru
stac
ea n
=16
Cyc
adop
sida
n=9
Gas
tropo
da n
=324
Hyd
rozo
a n=
8
Inse
cta n
=27
Lilio
psid
a n=
71
Mag
nolio
psod
a n=
703
Mam
malia
n=3
20
Mar
chan
tiops
ida
n=3
Polyc
haet
a n=
1
Rep
tilia
n=2
6
Class
Nu
mb
er
of
as
se
ss
ed
sp
ec
ies
EX
EW
DD
LR/cd
LC
NT
VU
EN
CR
Box 1: Summary of Described and Assessed Species • The following groups have been described and assessed completely: mammals, birds, amphibians, freshwater crabs and
hard corals
• Conifers and cycads have been almost completely described and assessed at the global level.
• Reptiles are under-represented on a global scale and in the Pacific: of approximately 430 described Pacific island species, only 26 appear on the 2008 IUCN Red List
• Amphibians have been fully described and assessed, but are only found in five countries in the region, with 98% of all amphibians assessed in the Pacific islands found in Papua New Guinea.
• Described vertebrate species that have not been assessed include lizards, snakes, freshwater fish, and shorefish
• Amongst invertebrates, the number of described species is far higher than the number of assessed species. Land snails are the best known group, aside from hard corals.
• Insects and arachnids are described for the Pacific, but no assessments have occurred on groups such as ants, bees, beetles and cicadas.
• Marine invertebrates such as echinoderms and sponges are not only unassessed, but largely undescribed for the Pacific
• The number of assessed plant species is low across the Pacific islands when compared with the number of described species.
• All freshwater crabs (15 species) have been described and assessed
4
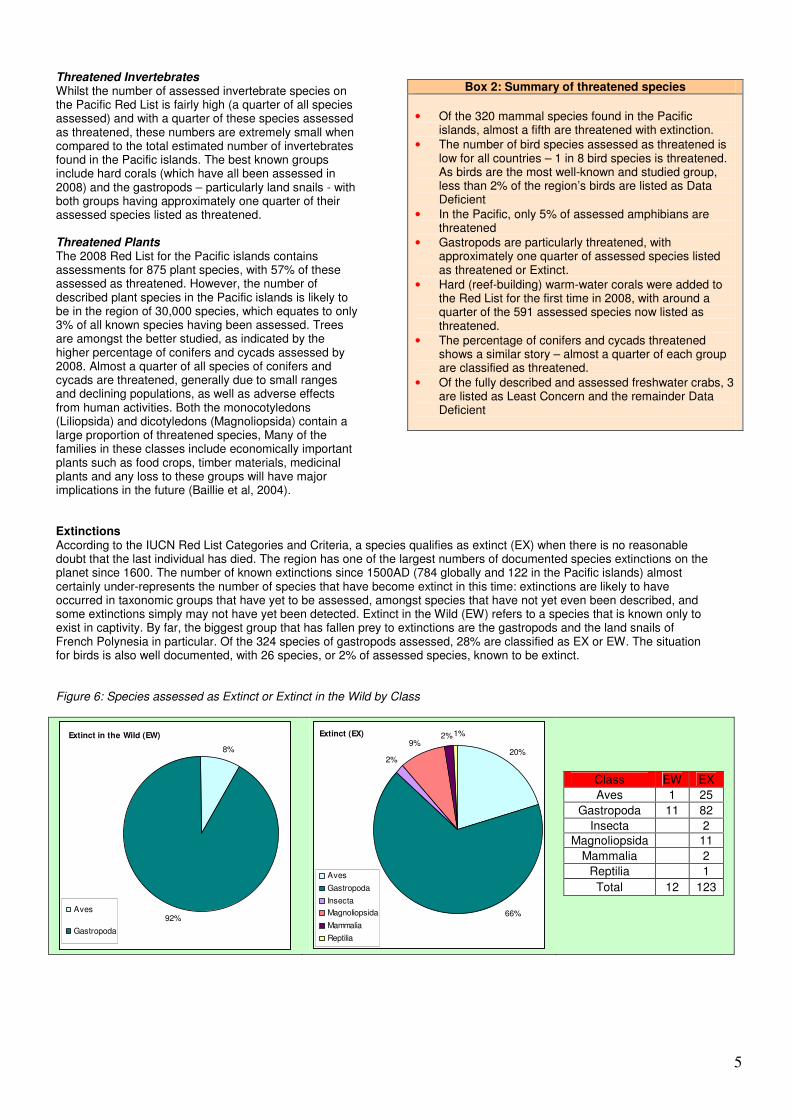
How many of the assessed species are threatened? Of the 3769 assessed species, 177 have been assessed as Critically Endangered, 213 Endangered and 670 listed as Vulnerable. This equates to 28% of Pacific island species assessed in 2008 being threatened with extinction. Figure 2 shows the proportion of assessed Pacific island species listed in one of these 3 threat categories, by class. In addition to the species listed as threatened, 394 species are listed as Near Threatened (NT); that is they are at risk of becoming threatened in the very near future. A further 41 species were assessed in the old Red List category of LR/cd (Lower Risk, Conservation Dependent), which would be classed as NT if assessed using the latest criteria. In reality, the overall threat level for the region is likely to be underestimated due to the 534 Data Deficient species which may fall under any of the threat categories. This is true for the taxonomic groups that have been comprehensively assessed such as mammals (with 17% of animals listed as DD) and especially amphibians (42% listed as DD). Many DD species may be Least Concern, but until assessments have been completed, there are potentially more species threatened than we realise.
Figure 2: Percentage of Pacific island species assessed as threatened with extinction (CR, EN, VU) by each class
100%100%100%
62% 62%
52%48%
38%
29% 27%
23% 23% 22%18%
14%
0% 0%
25%
5%
26%
0%
10%
20%
30%
40%
50%
60%
70%
80%
90%
100%
Antho
cero
topsid
a n=
1
Bryop
sida
n=1
Mar
chan
tiops
ida
n=3
Mag
nolio
psod
a n=
703
Rep
tilia
n=2
6
Lilio
psid
a n=
71
Inse
cta n
=27
Bival
via
n=8
Antho
zoa n
=591
Cho
ndric
hthy
es n
=91
Con
ifero
psid
a n=
87
Hyd
rozo
a n=
8
Mam
malia
n=3
20
Gas
tropo
da n
=324
Cyc
adop
sida
n=9
Actinopt
eryg
ii n=
132
Aves
n=10
79
Amph
ibia
n=27
1
Cru
stac
ea n
=16
Polyc
haet
a n=
1
Class
Threatened Vertebrates Mammals, Birds and Amphibians At the global level, 32% of amphibians, 22% of mammals and 14% of birds are threatened. The proportion of threatened mammals and birds in the Pacific islands are almost identical to global levels, with 21% of mammals and 13% of birds threatened (as seen in Figures 4 and 5). However, the number of threatened amphibians is far lower in the Pacific islands, with only 5% of assessed species at risk of extinction (see Figure 3). The reason for this is unclear, but perhaps suggests that amphibians in some countries are far more susceptible to threats, that threats vary between countries, or that some other factors are at play
(IUCN, CI and NatureServe 2008). Figure 3: Assessed Amphibians by category
Amphibia n=271
11 11 1
115
142
CR
EN
VU
NT
LC
DD
Figure 4: Assessed Mammals by category
Mammalia n=320
17
33
23
177
54
2
14
CR
EN
VU
NT
LC
DD
EX
Figure 5: Assessed Birds by category
Aves n=1079
36
90
91
800
1 2025
16
CR
EN
VU
NT
LC
DD
EW
EX
Reptiles Reptiles are one of the most threatened groups amongst assessed Pacific islands species, with over 60% of species in categories CR, EN, or VU. Assessments have so far focussed on well-known groups such as crocodiles and turtles, or on species within families which may be considered under threat. This indicates that reptiles may be one of the taxa of most concern for the region.
Fishes Of the 223 Pacific island species assessed (in classes Actinopterygii and Chrondrichthyes), 22% are listed as threatened. The main families to have been assessed so far are groupers, seahorses and pipefish, as well as sharks and rays.
5
Threatened Invertebrates Whilst the number of assessed invertebrate species on the Pacific Red List is fairly high (a quarter of all species assessed) and with a quarter of these species assessed as threatened, these numbers are extremely small when compared to the total estimated number of invertebrates found in the Pacific islands. The best known groups include hard corals (which have all been assessed in 2008) and the gastropods – particularly land snails - with both groups having approximately one quarter of their assessed species listed as threatened. Threatened Plants The 2008 Red List for the Pacific islands contains assessments for 875 plant species, with 57% of these assessed as threatened. However, the number of described plant species in the Pacific islands is likely to be in the region of 30,000 species, which equates to only 3% of all known species having been assessed. Trees are amongst the better studied, as indicated by the higher percentage of conifers and cycads assessed by 2008. Almost a quarter of all species of conifers and cycads are threatened, generally due to small ranges and declining populations, as well as adverse effects from human activities. Both the monocotyledons (Liliopsida) and dicotyledons (Magnoliopsida) contain a large proportion of threatened species, Many of the families in these classes include economically important plants such as food crops, timber materials, medicinal plants and any loss to these groups will have major implications in the future (Baillie et al, 2004).
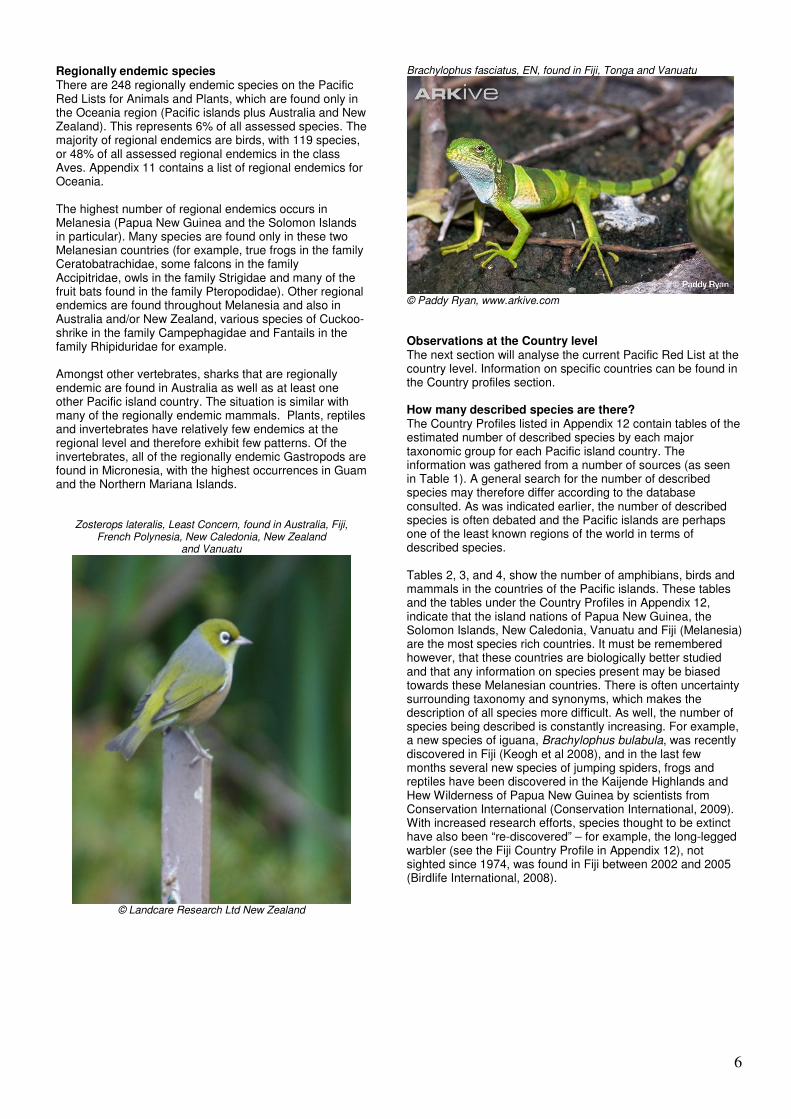
Extinctions According to the IUCN Red List Categories and Criteria, a species qualifies as extinct (EX) when there is no reasonable doubt that the last individual has died. The region has one of the largest numbers of documented species extinctions on the planet since 1600. The number of known extinctions since 1500AD (784 globally and 122 in the Pacific islands) almost certainly under-represents the number of species that have become extinct in this time: extinctions are likely to have occurred in taxonomic groups that have yet to be assessed, amongst species that have not yet even been described, and some extinctions simply may not have yet been detected. Extinct in the Wild (EW) refers to a species that is known only to exist in captivity. By far, the biggest group that has fallen prey to extinctions are the gastropods and the land snails of French Polynesia in particular. Of the 324 species of gastropods assessed, 28% are classified as EX or EW. The situation for birds is also well documented, with 26 species, or 2% of assessed species, known to be extinct. Figure 6: Species assessed as Extinct or Extinct in the Wild by Class
Extinct in the Wild (EW)
8%
92%Aves
Gastropoda
Extinct (EX)
20%2%
9%2%
66%
1%
Aves
Gastropoda
Insecta
Magnoliopsida
Mammalia
Reptilia
Class EW EX
Aves 1 25
Gastropoda 11 82
Insecta 2
Magnoliopsida 11
Mammalia 2
Reptilia 1
Total 12 123
Box 2: Summary of threatened species
• Of the 320 mammal species found in the Pacific islands, almost a fifth are threatened with extinction.
• The number of bird species assessed as threatened is low for all countries – 1 in 8 bird species is threatened. As birds are the most well-known and studied group, less than 2% of the region’s birds are listed as Data Deficient
• In the Pacific, only 5% of assessed amphibians are threatened
• Gastropods are particularly threatened, with approximately one quarter of assessed species listed as threatened or Extinct.
• Hard (reef-building) warm-water corals were added to the Red List for the first time in 2008, with around a quarter of the 591 assessed species now listed as threatened.
• The percentage of conifers and cycads threatened shows a similar story – almost a quarter of each group are classified as threatened.
• Of the fully described and assessed freshwater crabs, 3 are listed as Least Concern and the remainder Data Deficient
6
Regionally endemic species There are 248 regionally endemic species on the Pacific Red Lists for Animals and Plants, which are found only in the Oceania region (Pacific islands plus Australia and New Zealand). This represents 6% of all assessed species. The majority of regional endemics are birds, with 119 species, or 48% of all assessed regional endemics in the class Aves. Appendix 11 contains a list of regional endemics for Oceania. The highest number of regional endemics occurs in Melanesia (Papua New Guinea and the Solomon Islands in particular). Many species are found only in these two Melanesian countries (for example, true frogs in the family Ceratobatrachidae, some falcons in the family Accipitridae, owls in the family Strigidae and many of the fruit bats found in the family Pteropodidae). Other regional endemics are found throughout Melanesia and also in Australia and/or New Zealand, various species of Cuckoo-shrike in the family Campephagidae and Fantails in the family Rhipiduridae for example. Amongst other vertebrates, sharks that are regionally endemic are found in Australia as well as at least one other Pacific island country. The situation is similar with many of the regionally endemic mammals. Plants, reptiles and invertebrates have relatively few endemics at the regional level and therefore exhibit few patterns. Of the invertebrates, all of the regionally endemic Gastropods are found in Micronesia, with the highest occurrences in Guam and the Northern Mariana Islands.
Zosterops lateralis, Least Concern, found in Australia, Fiji, French Polynesia, New Caledonia, New Zealand
and Vanuatu
© Landcare Research Ltd New Zealand
Brachylophus fasciatus, EN, found in Fiji, Tonga and Vanuatu
© Paddy Ryan, www.arkive.com
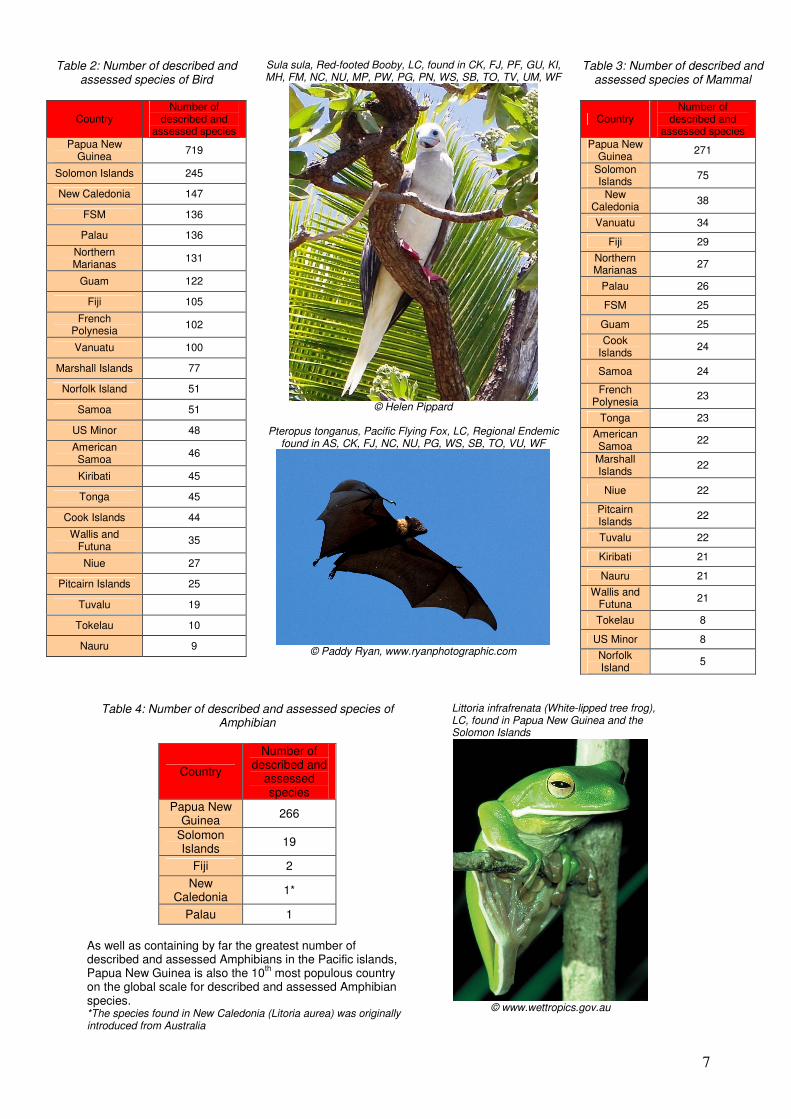
Observations at the Country level The next section will analyse the current Pacific Red List at the country level. Information on specific countries can be found in the Country profiles section. How many described species are there? The Country Profiles listed in Appendix 12 contain tables of the estimated number of described species by each major taxonomic group for each Pacific island country. The information was gathered from a number of sources (as seen in Table 1). A general search for the number of described species may therefore differ according to the database consulted. As was indicated earlier, the number of described species is often debated and the Pacific islands are perhaps one of the least known regions of the world in terms of described species. Tables 2, 3, and 4, show the number of amphibians, birds and mammals in the countries of the Pacific islands. These tables and the tables under the Country Profiles in Appendix 12, indicate that the island nations of Papua New Guinea, the Solomon Islands, New Caledonia, Vanuatu and Fiji (Melanesia) are the most species rich countries. It must be remembered however, that these countries are biologically better studied and that any information on species present may be biased towards these Melanesian countries. There is often uncertainty surrounding taxonomy and synonyms, which makes the description of all species more difficult. As well, the number of species being described is constantly increasing. For example, a new species of iguana, Brachylophus bulabula, was recently discovered in Fiji (Keogh et al 2008), and in the last few months several new species of jumping spiders, frogs and reptiles have been discovered in the Kaijende Highlands and Hew Wilderness of Papua New Guinea by scientists from Conservation International (Conservation International, 2009). With increased research efforts, species thought to be extinct have also been “re-discovered” – for example, the long-legged warbler (see the Fiji Country Profile in Appendix 12), not sighted since 1974, was found in Fiji between 2002 and 2005 (Birdlife International, 2008).
7
Table 4: Number of described and assessed species of Amphibian
Country
Number of described and
assessed species
Papua New Guinea
266
Solomon Islands
19
Fiji 2
New Caledonia
1*
Palau 1
As well as containing by far the greatest number of described and assessed Amphibians in the Pacific islands, Papua New Guinea is also the 10
th most populous country
on the global scale for described and assessed Amphibian species. *The species found in New Caledonia (Litoria aurea) was originally introduced from Australia
Littoria infrafrenata (White-lipped tree frog), LC, found in Papua New Guinea and the Solomon Islands
© www.wettropics.gov.au
Table 2: Number of described and assessed species of Bird
Country Number of
described and assessed species
Papua New Guinea
719
Solomon Islands 245
New Caledonia 147
FSM 136
Palau 136
Northern Marianas
131
Guam 122
Fiji 105
French Polynesia
102
Vanuatu 100
Marshall Islands 77
Norfolk Island 51
Samoa 51
US Minor 48
American Samoa
46
Kiribati 45
Tonga 45
Cook Islands 44
Wallis and Futuna
35
Niue 27
Pitcairn Islands 25
Tuvalu 19
Tokelau 10
Nauru 9
Sula sula, Red-footed Booby, LC, found in CK, FJ, PF, GU, KI, MH, FM, NC, NU, MP, PW, PG, PN, WS, SB, TO, TV, UM, WF
© Helen Pippard
Pteropus tonganus, Pacific Flying Fox, LC, Regional Endemic
found in AS, CK, FJ, NC, NU, PG, WS, SB, TO, VU, WF
© Paddy Ryan, www.ryanphotographic.com
Table 3: Number of described and assessed species of Mammal
Country Number of
described and assessed species
Papua New Guinea
271
Solomon Islands
75
New Caledonia
38
Vanuatu 34
Fiji 29
Northern Marianas
27
Palau 26
FSM 25
Guam 25
Cook Islands
24
Samoa 24
French Polynesia
23
Tonga 23
American Samoa
22
Marshall Islands
22
Niue 22
Pitcairn Islands
22
Tuvalu 22
Kiribati 21
Nauru 21
Wallis and Futuna
21
Tokelau 8
US Minor 8
Norfolk Island
5
8
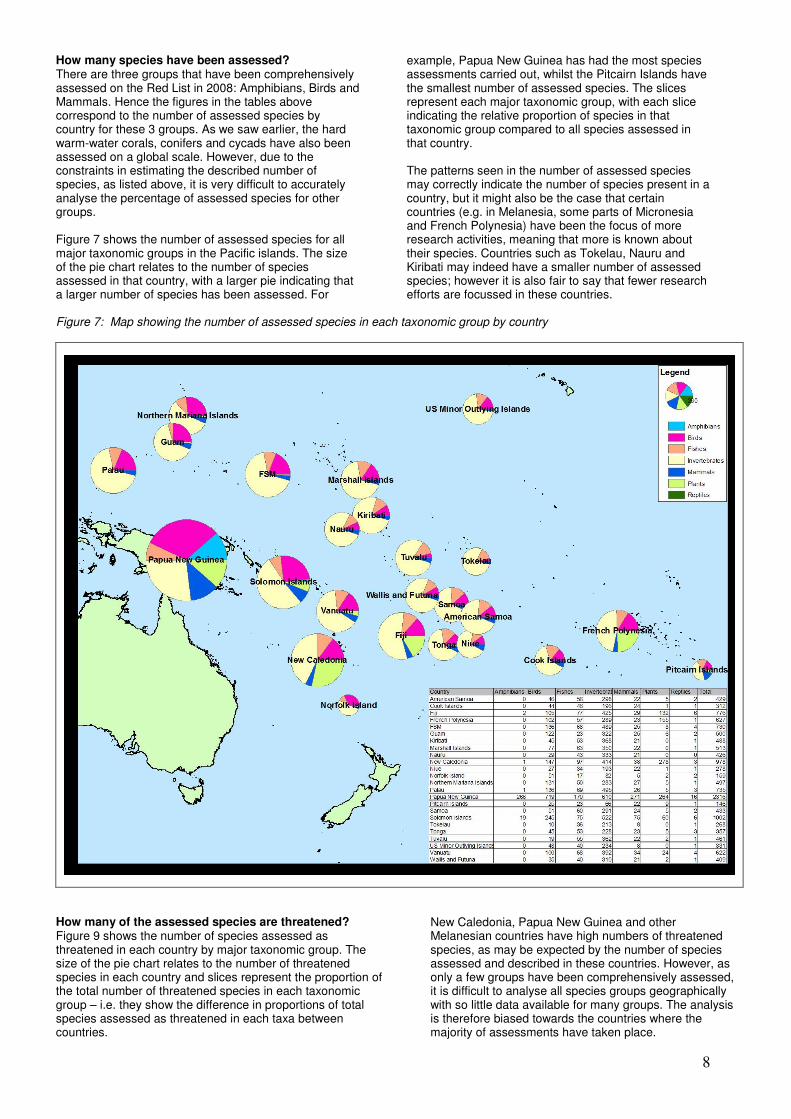
How many species have been assessed? There are three groups that have been comprehensively assessed on the Red List in 2008: Amphibians, Birds and Mammals. Hence the figures in the tables above correspond to the number of assessed species by country for these 3 groups. As we saw earlier, the hard warm-water corals, conifers and cycads have also been assessed on a global scale. However, due to the constraints in estimating the described number of species, as listed above, it is very difficult to accurately analyse the percentage of assessed species for other groups. Figure 7 shows the number of assessed species for all major taxonomic groups in the Pacific islands. The size of the pie chart relates to the number of species assessed in that country, with a larger pie indicating that a larger number of species has been assessed. For
example, Papua New Guinea has had the most species assessments carried out, whilst the Pitcairn Islands have the smallest number of assessed species. The slices represent each major taxonomic group, with each slice indicating the relative proportion of species in that taxonomic group compared to all species assessed in that country. The patterns seen in the number of assessed species may correctly indicate the number of species present in a country, but it might also be the case that certain countries (e.g. in Melanesia, some parts of Micronesia and French Polynesia) have been the focus of more research activities, meaning that more is known about their species. Countries such as Tokelau, Nauru and Kiribati may indeed have a smaller number of assessed species; however it is also fair to say that fewer research efforts are focussed in these countries.
Figure 7: Map showing the number of assessed species in each taxonomic group by country
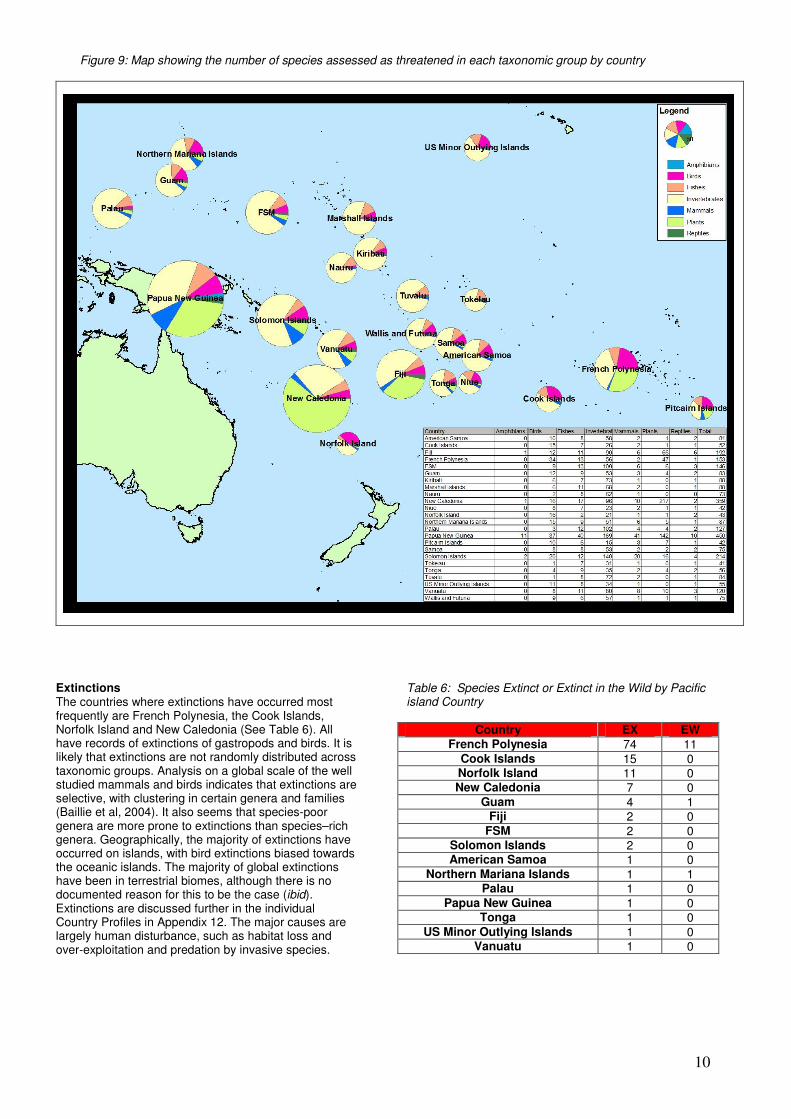
How many of the assessed species are threatened? Figure 9 shows the number of species assessed as threatened in each country by major taxonomic group. The size of the pie chart relates to the number of threatened species in each country and slices represent the proportion of the total number of threatened species in each taxonomic group – i.e. they show the difference in proportions of total species assessed as threatened in each taxa between countries.
New Caledonia, Papua New Guinea and other Melanesian countries have high numbers of threatened species, as may be expected by the number of species assessed and described in these countries. However, as only a few groups have been comprehensively assessed, it is difficult to analyse all species groups geographically with so little data available for many groups. The analysis is therefore biased towards the countries where the majority of assessments have taken place.
9
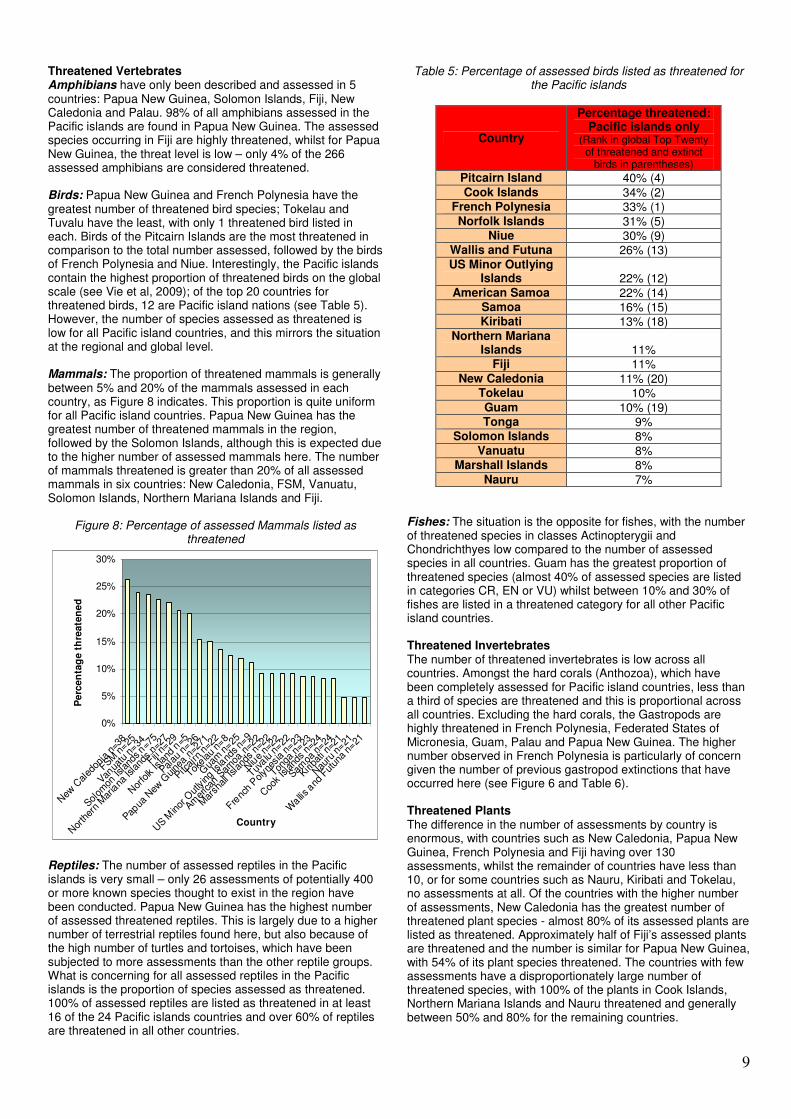
Threatened Vertebrates Amphibians have only been described and assessed in 5 countries: Papua New Guinea, Solomon Islands, Fiji, New Caledonia and Palau. 98% of all amphibians assessed in the Pacific islands are found in Papua New Guinea. The assessed species occurring in Fiji are highly threatened, whilst for Papua New Guinea, the threat level is low – only 4% of the 266 assessed amphibians are considered threatened. Birds: Papua New Guinea and French Polynesia have the greatest number of threatened bird species; Tokelau and Tuvalu have the least, with only 1 threatened bird listed in each. Birds of the Pitcairn Islands are the most threatened in comparison to the total number assessed, followed by the birds of French Polynesia and Niue. Interestingly, the Pacific islands contain the highest proportion of threatened birds on the global scale (see Vie et al, 2009); of the top 20 countries for threatened birds, 12 are Pacific island nations (see Table 5). However, the number of species assessed as threatened is low for all Pacific island countries, and this mirrors the situation at the regional and global level. Mammals: The proportion of threatened mammals is generally between 5% and 20% of the mammals assessed in each country, as Figure 8 indicates. This proportion is quite uniform for all Pacific island countries. Papua New Guinea has the greatest number of threatened mammals in the region, followed by the Solomon Islands, although this is expected due to the higher number of assessed mammals here. The number of mammals threatened is greater than 20% of all assessed mammals in six countries: New Caledonia, FSM, Vanuatu, Solomon Islands, Northern Mariana Islands and Fiji.
Figure 8: Percentage of assessed Mammals listed as threatened
0%
5%
10%
15%
20%
25%
30%
New
Cal
edon
ia n
=38
FSM n
=25
Vanua
tu n
=34
Solom
on Is
land
s n=7
5
Nor
ther
n M
aria
na Is
land
s n=
27
Fiji n=
29
Nor
folk Is
land
n=5
Palau
n=26
Papua
New
Guine
a n=
271
Pitcai
rn n
=22
Tokela
u n=
8
Gua
m n
=25
US M
inor
Out
lying
Isla
nds n=
9
Amer
ican
Sam
oa n
=22
Mar
shall I
slan
ds n
=22
Niu
e n=
22
Tuvalu
n=22
Frenc
h Polyn
esia n
=23
Tonga
n=23
Coo
k Isla
nds
n=24
Samoa
n=24
Kiriba
ti n=
21
Nau
ru n
=21
Wallis
and
Fut
una
n=21
Country
Perc
en
tag
e t
hre
ate
ne
d
Reptiles: The number of assessed reptiles in the Pacific islands is very small – only 26 assessments of potentially 400 or more known species thought to exist in the region have been conducted. Papua New Guinea has the highest number of assessed threatened reptiles. This is largely due to a higher number of terrestrial reptiles found here, but also because of the high number of turtles and tortoises, which have been subjected to more assessments than the other reptile groups. What is concerning for all assessed reptiles in the Pacific islands is the proportion of species assessed as threatened. 100% of assessed reptiles are listed as threatened in at least 16 of the 24 Pacific islands countries and over 60% of reptiles are threatened in all other countries.
Table 5: Percentage of assessed birds listed as threatened for the Pacific islands
Country
Percentage threatened: Pacific islands only
(Rank in global Top Twenty of threatened and extinct
birds in parentheses)
Pitcairn Island 40% (4) Cook Islands 34% (2)
French Polynesia 33% (1) Norfolk Islands 31% (5)
Niue 30% (9) Wallis and Futuna 26% (13) US Minor Outlying
Islands 22% (12) American Samoa 22% (14)
Samoa 16% (15) Kiribati 13% (18)
Northern Mariana Islands 11%
Fiji 11% New Caledonia 11% (20)
Tokelau 10% Guam 10% (19) Tonga 9%
Solomon Islands 8% Vanuatu 8%
Marshall Islands 8% Nauru 7%
Fishes: The situation is the opposite for fishes, with the number of threatened species in classes Actinopterygii and Chondrichthyes low compared to the number of assessed species in all countries. Guam has the greatest proportion of threatened species (almost 40% of assessed species are listed in categories CR, EN or VU) whilst between 10% and 30% of fishes are listed in a threatened category for all other Pacific island countries. Threatened Invertebrates The number of threatened invertebrates is low across all countries. Amongst the hard corals (Anthozoa), which have been completely assessed for Pacific island countries, less than a third of species are threatened and this is proportional across all countries. Excluding the hard corals, the Gastropods are highly threatened in French Polynesia, Federated States of Micronesia, Guam, Palau and Papua New Guinea. The higher number observed in French Polynesia is particularly of concern given the number of previous gastropod extinctions that have occurred here (see Figure 6 and Table 6). Threatened Plants The difference in the number of assessments by country is enormous, with countries such as New Caledonia, Papua New Guinea, French Polynesia and Fiji having over 130 assessments, whilst the remainder of countries have less than 10, or for some countries such as Nauru, Kiribati and Tokelau, no assessments at all. Of the countries with the higher number of assessments, New Caledonia has the greatest number of threatened plant species - almost 80% of its assessed plants are listed as threatened. Approximately half of Fiji’s assessed plants are threatened and the number is similar for Papua New Guinea, with 54% of its plant species threatened. The countries with few assessments have a disproportionately large number of threatened species, with 100% of the plants in Cook Islands, Northern Mariana Islands and Nauru threatened and generally between 50% and 80% for the remaining countries.
10
Figure 9: Map showing the number of species assessed as threatened in each taxonomic group by country
Extinctions The countries where extinctions have occurred most frequently are French Polynesia, the Cook Islands, Norfolk Island and New Caledonia (See Table 6). All have records of extinctions of gastropods and birds. It is likely that extinctions are not randomly distributed across taxonomic groups. Analysis on a global scale of the well studied mammals and birds indicates that extinctions are selective, with clustering in certain genera and families (Baillie et al, 2004). It also seems that species-poor genera are more prone to extinctions than species–rich genera. Geographically, the majority of extinctions have occurred on islands, with bird extinctions biased towards the oceanic islands. The majority of global extinctions have been in terrestrial biomes, although there is no documented reason for this to be the case (ibid). Extinctions are discussed further in the individual Country Profiles in Appendix 12. The major causes are largely human disturbance, such as habitat loss and over-exploitation and predation by invasive species.
Table 6: Species Extinct or Extinct in the Wild by Pacific island Country
Country EX EW French Polynesia 74 11
Cook Islands 15 0 Norfolk Island 11 0 New Caledonia 7 0
Guam 4 1 Fiji 2 0
FSM 2 0 Solomon Islands 2 0 American Samoa 1 0
Northern Mariana Islands 1 1 Palau 1 0
Papua New Guinea 1 0 Tonga 1 0
US Minor Outlying Islands 1 0 Vanuatu 1 0
11
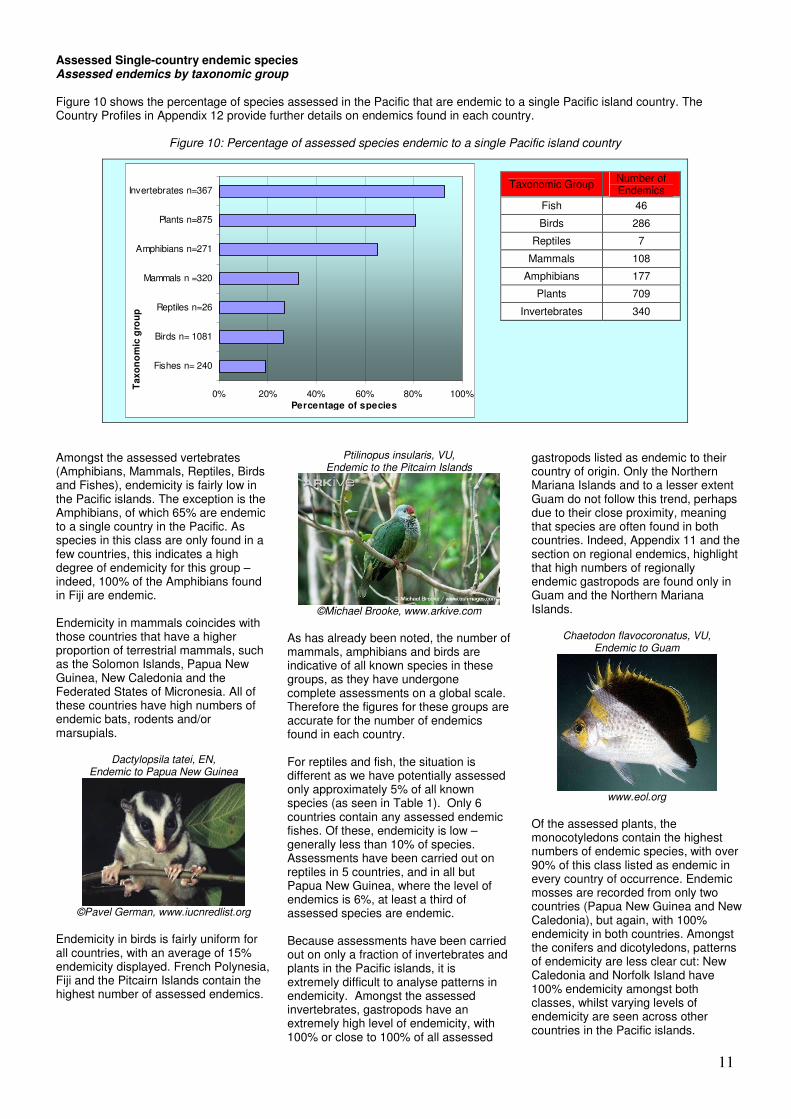
Assessed Single-country endemic species Assessed endemics by taxonomic group Figure 10 shows the percentage of species assessed in the Pacific that are endemic to a single Pacific island country. The Country Profiles in Appendix 12 provide further details on endemics found in each country.
Figure 10: Percentage of assessed species endemic to a single Pacific island country
0% 20% 40% 60% 80% 100%
Fishes n= 240
Birds n= 1081
Reptiles n=26
Mammals n =320
Amphibians n=271
Plants n=875
Invertebrates n=367
Tax
on
om
ic g
rou
p
Percentage of species
Taxonomic Group Number of Endemics
Fish 46
Birds 286
Reptiles 7
Mammals 108
Amphibians 177
Plants 709
Invertebrates 340
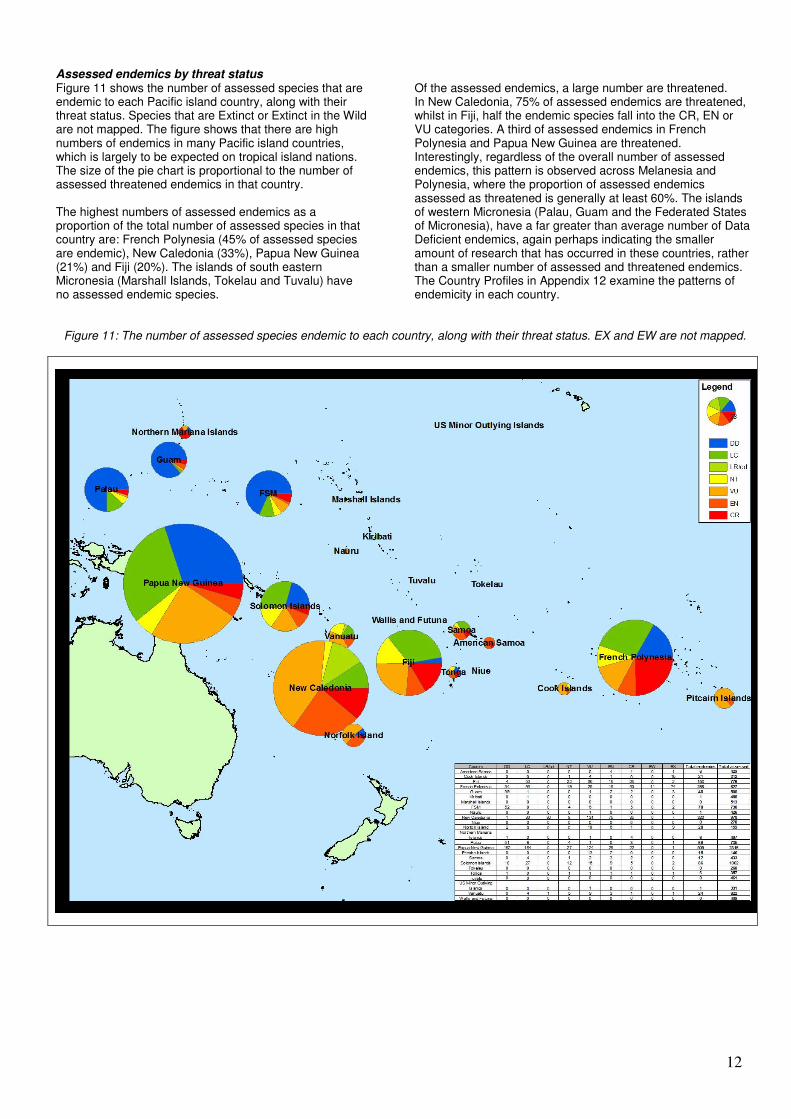
Amongst the assessed vertebrates (Amphibians, Mammals, Reptiles, Birds and Fishes), endemicity is fairly low in the Pacific islands. The exception is the Amphibians, of which 65% are endemic to a single country in the Pacific. As species in this class are only found in a few countries, this indicates a high degree of endemicity for this group – indeed, 100% of the Amphibians found in Fiji are endemic. Endemicity in mammals coincides with those countries that have a higher proportion of terrestrial mammals, such as the Solomon Islands, Papua New Guinea, New Caledonia and the Federated States of Micronesia. All of these countries have high numbers of endemic bats, rodents and/or marsupials.
Dactylopsila tatei, EN, Endemic to Papua New Guinea
©Pavel German, www.iucnredlist.org
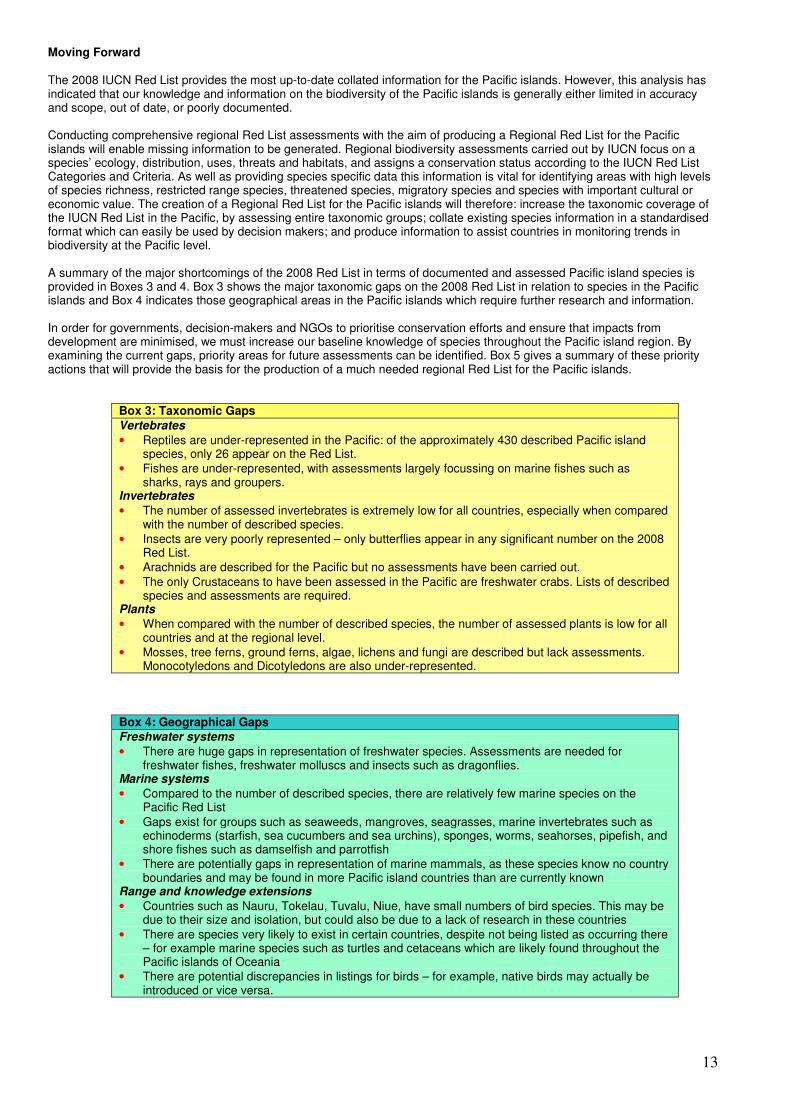
Endemicity in birds is fairly uniform for all countries, with an average of 15% endemicity displayed. French Polynesia, Fiji and the Pitcairn Islands contain the highest number of assessed endemics.
Ptilinopus insularis, VU,
Endemic to the Pitcairn Islands
©Michael Brooke, www.arkive.com
As has already been noted, the number of mammals, amphibians and birds are indicative of all known species in these groups, as they have undergone complete assessments on a global scale. Therefore the figures for these groups are accurate for the number of endemics found in each country. For reptiles and fish, the situation is different as we have potentially assessed only approximately 5% of all known species (as seen in Table 1). Only 6 countries contain any assessed endemic fishes. Of these, endemicity is low – generally less than 10% of species. Assessments have been carried out on reptiles in 5 countries, and in all but Papua New Guinea, where the level of endemics is 6%, at least a third of assessed species are endemic. Because assessments have been carried out on only a fraction of invertebrates and plants in the Pacific islands, it is extremely difficult to analyse patterns in endemicity. Amongst the assessed invertebrates, gastropods have an extremely high level of endemicity, with 100% or close to 100% of all assessed
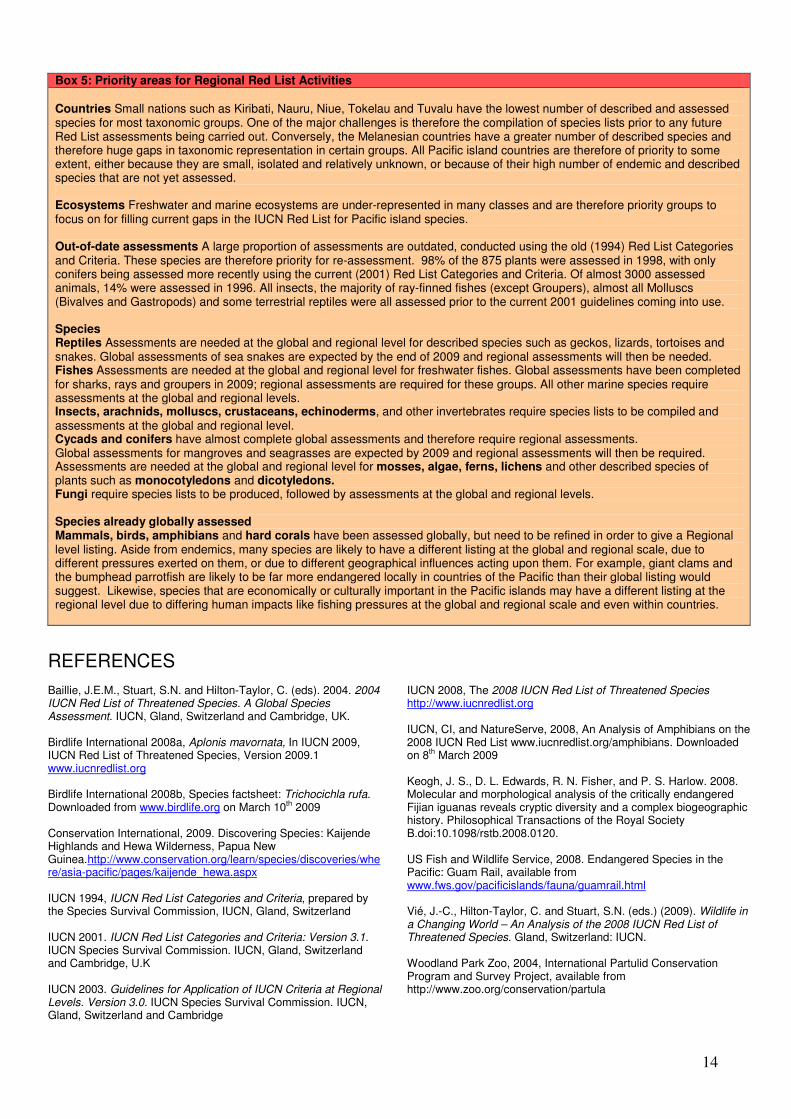
gastropods listed as endemic to their country of origin. Only the Northern Mariana Islands and to a lesser extent Guam do not follow this trend, perhaps due to their close proximity, meaning that species are often found in both countries. Indeed, Appendix 11 and the section on regional endemics, highlight that high numbers of regionally endemic gastropods are found only in Guam and the Northern Mariana Islands.
Chaetodon flavocoronatus, VU, Endemic to Guam
www.eol.org
Of the assessed plants, the monocotyledons contain the highest numbers of endemic species, with over 90% of this class listed as endemic in every country of occurrence. Endemic mosses are recorded from only two countries (Papua New Guinea and New Caledonia), but again, with 100% endemicity in both countries. Amongst the conifers and dicotyledons, patterns of endemicity are less clear cut: New Caledonia and Norfolk Island have 100% endemicity amongst both classes, whilst varying levels of endemicity are seen across other countries in the Pacific islands.
12
Assessed endemics by threat status Figure 11 shows the number of assessed species that are endemic to each Pacific island country, along with their threat status. Species that are Extinct or Extinct in the Wild are not mapped. The figure shows that there are high numbers of endemics in many Pacific island countries, which is largely to be expected on tropical island nations. The size of the pie chart is proportional to the number of assessed threatened endemics in that country. The highest numbers of assessed endemics as a proportion of the total number of assessed species in that country are: French Polynesia (45% of assessed species are endemic), New Caledonia (33%), Papua New Guinea (21%) and Fiji (20%). The islands of south eastern Micronesia (Marshall Islands, Tokelau and Tuvalu) have no assessed endemic species.
Of the assessed endemics, a large number are threatened. In New Caledonia, 75% of assessed endemics are threatened, whilst in Fiji, half the endemic species fall into the CR, EN or VU categories. A third of assessed endemics in French Polynesia and Papua New Guinea are threatened. Interestingly, regardless of the overall number of assessed endemics, this pattern is observed across Melanesia and Polynesia, where the proportion of assessed endemics assessed as threatened is generally at least 60%. The islands of western Micronesia (Palau, Guam and the Federated States of Micronesia), have a far greater than average number of Data Deficient endemics, again perhaps indicating the smaller amount of research that has occurred in these countries, rather than a smaller number of assessed and threatened endemics. The Country Profiles in Appendix 12 examine the patterns of endemicity in each country.
Figure 11: The number of assessed species endemic to each country, along with their threat status. EX and EW are not mapped.
13
Moving Forward The 2008 IUCN Red List provides the most up-to-date collated information for the Pacific islands. However, this analysis has indicated that our knowledge and information on the biodiversity of the Pacific islands is generally either limited in accuracy and scope, out of date, or poorly documented. Conducting comprehensive regional Red List assessments with the aim of producing a Regional Red List for the Pacific islands will enable missing information to be generated. Regional biodiversity assessments carried out by IUCN focus on a species’ ecology, distribution, uses, threats and habitats, and assigns a conservation status according to the IUCN Red List Categories and Criteria. As well as providing species specific data this information is vital for identifying areas with high levels of species richness, restricted range species, threatened species, migratory species and species with important cultural or economic value. The creation of a Regional Red List for the Pacific islands will therefore: increase the taxonomic coverage of the IUCN Red List in the Pacific, by assessing entire taxonomic groups; collate existing species information in a standardised format which can easily be used by decision makers; and produce information to assist countries in monitoring trends in biodiversity at the Pacific level. A summary of the major shortcomings of the 2008 Red List in terms of documented and assessed Pacific island species is provided in Boxes 3 and 4. Box 3 shows the major taxonomic gaps on the 2008 Red List in relation to species in the Pacific islands and Box 4 indicates those geographical areas in the Pacific islands which require further research and information. In order for governments, decision-makers and NGOs to prioritise conservation efforts and ensure that impacts from development are minimised, we must increase our baseline knowledge of species throughout the Pacific island region. By examining the current gaps, priority areas for future assessments can be identified. Box 5 gives a summary of these priority actions that will provide the basis for the production of a much needed regional Red List for the Pacific islands.
Box 3: Taxonomic Gaps
Vertebrates
• Reptiles are under-represented in the Pacific: of the approximately 430 described Pacific island species, only 26 appear on the Red List.
• Fishes are under-represented, with assessments largely focussing on marine fishes such as sharks, rays and groupers.
Invertebrates
• The number of assessed invertebrates is extremely low for all countries, especially when compared with the number of described species.
• Insects are very poorly represented – only butterflies appear in any significant number on the 2008 Red List.
• Arachnids are described for the Pacific but no assessments have been carried out.
• The only Crustaceans to have been assessed in the Pacific are freshwater crabs. Lists of described species and assessments are required.
Plants
• When compared with the number of described species, the number of assessed plants is low for all countries and at the regional level.
• Mosses, tree ferns, ground ferns, algae, lichens and fungi are described but lack assessments. Monocotyledons and Dicotyledons are also under-represented.
Box 4: Geographical Gaps
Freshwater systems
• There are huge gaps in representation of freshwater species. Assessments are needed for freshwater fishes, freshwater molluscs and insects such as dragonflies.
Marine systems
• Compared to the number of described species, there are relatively few marine species on the Pacific Red List
• Gaps exist for groups such as seaweeds, mangroves, seagrasses, marine invertebrates such as echinoderms (starfish, sea cucumbers and sea urchins), sponges, worms, seahorses, pipefish, and shore fishes such as damselfish and parrotfish
• There are potentially gaps in representation of marine mammals, as these species know no country boundaries and may be found in more Pacific island countries than are currently known
Range and knowledge extensions
• Countries such as Nauru, Tokelau, Tuvalu, Niue, have small numbers of bird species. This may be due to their size and isolation, but could also be due to a lack of research in these countries
• There are species very likely to exist in certain countries, despite not being listed as occurring there – for example marine species such as turtles and cetaceans which are likely found throughout the Pacific islands of Oceania
• There are potential discrepancies in listings for birds – for example, native birds may actually be introduced or vice versa.
14
Box 5: Priority areas for Regional Red List Activities
Countries Small nations such as Kiribati, Nauru, Niue, Tokelau and Tuvalu have the lowest number of described and assessed species for most taxonomic groups. One of the major challenges is therefore the compilation of species lists prior to any future Red List assessments being carried out. Conversely, the Melanesian countries have a greater number of described species and therefore huge gaps in taxonomic representation in certain groups. All Pacific island countries are therefore of priority to some extent, either because they are small, isolated and relatively unknown, or because of their high number of endemic and described species that are not yet assessed. Ecosystems Freshwater and marine ecosystems are under-represented in many classes and are therefore priority groups to focus on for filling current gaps in the IUCN Red List for Pacific island species. Out-of-date assessments A large proportion of assessments are outdated, conducted using the old (1994) Red List Categories and Criteria. These species are therefore priority for re-assessment. 98% of the 875 plants were assessed in 1998, with only conifers being assessed more recently using the current (2001) Red List Categories and Criteria. Of almost 3000 assessed animals, 14% were assessed in 1996. All insects, the majority of ray-finned fishes (except Groupers), almost all Molluscs (Bivalves and Gastropods) and some terrestrial reptiles were all assessed prior to the current 2001 guidelines coming into use. Species Reptiles Assessments are needed at the global and regional level for described species such as geckos, lizards, tortoises and snakes. Global assessments of sea snakes are expected by the end of 2009 and regional assessments will then be needed. Fishes Assessments are needed at the global and regional level for freshwater fishes. Global assessments have been completed for sharks, rays and groupers in 2009; regional assessments are required for these groups. All other marine species require assessments at the global and regional levels. Insects, arachnids, molluscs, crustaceans, echinoderms, and other invertebrates require species lists to be compiled and assessments at the global and regional level. Cycads and conifers have almost complete global assessments and therefore require regional assessments. Global assessments for mangroves and seagrasses are expected by 2009 and regional assessments will then be required. Assessments are needed at the global and regional level for mosses, algae, ferns, lichens and other described species of plants such as monocotyledons and dicotyledons. Fungi require species lists to be produced, followed by assessments at the global and regional levels. Species already globally assessed Mammals, birds, amphibians and hard corals have been assessed globally, but need to be refined in order to give a Regional level listing. Aside from endemics, many species are likely to have a different listing at the global and regional scale, due to different pressures exerted on them, or due to different geographical influences acting upon them. For example, giant clams and the bumphead parrotfish are likely to be far more endangered locally in countries of the Pacific than their global listing would suggest. Likewise, species that are economically or culturally important in the Pacific islands may have a different listing at the regional level due to differing human impacts like fishing pressures at the global and regional scale and even within countries.
REFERENCES
Baillie, J.E.M., Stuart, S.N. and Hilton-Taylor, C. (eds). 2004. 2004 IUCN Red List of Threatened Species. A Global Species Assessment. IUCN, Gland, Switzerland and Cambridge, UK. Birdlife International 2008a, Aplonis mavornata, In IUCN 2009, IUCN Red List of Threatened Species, Version 2009.1 www.iucnredlist.org Birdlife International 2008b, Species factsheet: Trichocichla rufa. Downloaded from www.birdlife.org on March 10th 2009 Conservation International, 2009. Discovering Species: Kaijende Highlands and Hewa Wilderness, Papua New Guinea.http://www.conservation.org/learn/species/discoveries/where/asia-pacific/pages/kaijende_hewa.aspx IUCN 1994, IUCN Red List Categories and Criteria, prepared by the Species Survival Commission, IUCN, Gland, Switzerland IUCN 2001. IUCN Red List Categories and Criteria: Version 3.1. IUCN Species Survival Commission. IUCN, Gland, Switzerland and Cambridge, U.K IUCN 2003. Guidelines for Application of IUCN Criteria at Regional Levels. Version 3.0. IUCN Species Survival Commission. IUCN, Gland, Switzerland and Cambridge
IUCN 2008, The 2008 IUCN Red List of Threatened Species http://www.iucnredlist.org IUCN, CI, and NatureServe, 2008, An Analysis of Amphibians on the 2008 IUCN Red List www.iucnredlist.org/amphibians. Downloaded on 8th March 2009 Keogh, J. S., D. L. Edwards, R. N. Fisher, and P. S. Harlow. 2008. Molecular and morphological analysis of the critically endangered Fijian iguanas reveals cryptic diversity and a complex biogeographic history. Philosophical Transactions of the Royal Society B.doi:10.1098/rstb.2008.0120. US Fish and Wildlife Service, 2008. Endangered Species in the Pacific: Guam Rail, available from www.fws.gov/pacificislands/fauna/guamrail.html Vié, J.-C., Hilton-Taylor, C. and Stuart, S.N. (eds.) (2009). Wildlife in a Changing World – An Analysis of the 2008 IUCN Red List of Threatened Species. Gland, Switzerland: IUCN. Woodland Park Zoo, 2004, International Partulid Conservation Program and Survey Project, available from http://www.zoo.org/conservation/partula