Embed Size (px)
Citation preview
The Peer Relations of Mildly Delayed and Nonhandicapped Preschool Children in Mainstreamed Playgroups
:MichaelJ.Guralnick University of Washington
Joseph M. Groom Ohio State University
GURALNICK, MICHAEL} .• and GROOM, JOSEPH M. The Peer Relations of Mildly Delayed and Nonhandicapped Preschool Children in Mainstreamed Playgroups. CHILD DEVELOPMENT, 1987, 58, 1556-1572. Previously unacquainted groups of nonnally developing and mildly developmentally delayed preschool-age boys (N = 64) were brought together to form a series of8 mainstreamed playgroups. Each playgroup consisted of 3 normally developing 3-year-olds, 3 nonnally developing 4-year-olds, and 2 mildly developmentally delayed 4-year-olds. The delayed children were matched with the normally developing olde r group for chronological age and with the normally deve loping younger group for developmental level. Each playgroup operated 5 days per week for 2 hours per day for a 4-week period. During that time, the peer-related social and play interactions of each child were videotaped, and peer sociometric ratings were obtained at the completion of each playgroup. Analyses of social participation and individual social behavior measures revealed that the analogue playgroup setting was appropriate for evaluating peer interactions, as expected developmental patterns emerged despite the presence of children heterogeneous with respect to chronological age and developmental status. The existence of a deficit in peer-related social interactions for mildly delayed children was supported in this investigation-a deficit that could not be attributed to reputational factors, the unavailability of responsive peers, inadequate matching procedures, unusual sample characte.ristics, or similar factors. Selected observational measures, peer preference patterns during free play, and peer sociometric ratings also indicated that the delayed children were perceived to be less competent and of lower social status. Howeve r, despite their relative isolation, important developmental opportunities we re available for mildly delayed children in the mainstreamed playgroups. Possible processes responsible for these outcomes were discussed.
Establishing relationships with one's peers during the preschool years is now recognized as an important process with diverse developmental benefits (Hartup, 1983). Considerable information has been gathered that provides both a developmental perspective of the growth of peer relations and the possible negative consequences for those children failing to form appropriate social relationships with their peers (Hartup, 1983; Rubin & Ross, 1982; Schneider, Rubin, & Ledingham, 1985).
Interest in the study of peer relations has extended naturally to children with general developmental (cognitive) delays. Unfortunately, recent research has indicated that even young children with mild developmental delays may experience problems in establishing successful peer relationships.
Compared to normally developing children at similar developmental levels, delayed children exhibit lower rates of social interaction with their peers, participate to only a limited extent in group play, present an atypical pattern of growth in peer interactions across the preschool period, and are especially deficient in using social behaviors most associated with peer-related social competence (Field, 1980; Guralnick & Groom, 1985; Guralnick & Weinhouse, 1984). Many possible explanations exist for this presumed peer-interaction deficit and include a corresponding deficit in expressive language common to delayed children, extensions of difficulties encountered in establishing effective parent-child relationships, and information-processing problems that are especially apparent in social situa-
This research was supported by grant G008300051 from the U. S. Department of Education. The authors wish to thank L. Massen, A. Newstedt, L. Haskell, and W. Wichienwongsa for assistance in data collection and T. Nygren for advice on data analysis. Requests for reprints should be sent to Michael J. Guralnick, Child Development and Mental Retardation Center, WJ-10, University of Washington, Seattle, WA 98195.
[Child Development, 1987, 58, 1556--1572. ~ 1987 by the Society for Research In ChUd Development, Inc. All rights reseived. 0009-3920/87/580&0014$01.00]

tions (Brooks-Gunn & Luciano, 1985; Guralnick, 1986a; Krakow & Kopp, 1983).
It is important to note that developmental studies of delayed children's peer relations have been conducted exclusively in specialized programs, that is, in settings containing only other delayed children usually with similar characteristics and skills. Comparisons to studies of nonnally developing children in typical nursery or preschool programs who were similar in developmental level to delayed children constituted the basis for conclusions regarding a peer-interaction deficit. However, despite the consistency of the findings and the magnitude of the deficits obtained, comparisons of this type must remain questionable in that different sample characteristics and environmental conditions may have existed in the separate studies of delayed and nonhandicapped children. Moreover, it could be argued that the deficit primarily reflects the limitations imposed by the social skill levels of the delayed children's companions, as observations were obtained only in specialized programs. Accordingly, research on the peer interactions of developmentally delayed preschool children could be infonned by specially designed studies that integrate or mainstream developmentally delayed children who are carefully matched in tenns of developmental level with the noohandicapped children in the setting.
Io fact, beyond humanistic and legal considerations, proponents of early childhood mainstreaming argue that these heterogeneous groupings may well be effective in promoting the peer interactions of delayed children (Guralnick, 1978). Considerable evidence is available to suggest that mainstreamed settings are potentially more stimulating from a social and communicative perspective and are more responsive to children's social bids than are specialized settings (Guralnick, 1986b). However, the studies that have examined this issue directly for children with mild delays have found that the presence of nonhandicapped children yields only minimal changes in social and play interactions (Field, Roseman, DeStefano, & Koewler, 1981; Guralnick, 1981).
To some extent, the absence of more positive findings in mainstreamed settings may be the result of a lack of social integration of the delayed children. A pattern of isolation and even overt rejection is possible and would, of course, render any potentially stimulating or responsive social environment nonfunctional. However, analyses of the social integration of mildly delayed preschool
Guralnick and Groom 1557
children in mainstreamed programs have been equivocal, as considerable variability in outcome has been obtained across studies (Cavallaro & Porter, 1980; Dunlop, Stoneman, & Cantrell, 1980; Guralnick, 1980; Ispa, 1981). A major contributor to this variability has been the fact that studies have varied widely in sampling practices, often selecting to observe preexisting groups of subjects. As a consequence, sample characteristics appear to differ substantially, and studies have been unable to match children systematically in tenns of developmental level or chronological age. In addition, a variety of narrow-band and often noncomparable measures of social integration have been employed. Finally, as part of the educational program, delayed children often fonned a separate subgroup in non-free play and instructional activities, thereby allowing the possibility that reputational factors could have contributed to any pattern of social isolation and to observed deficits in peer interactions.
Taken together, our understanding of the developmental characteristics of the peer relationships of mildly delayed children has been hampered by a variety of methodological problems as well as by the limited nature of the settings in which observations have taken place. Yet the developmental significance of peer relations and the consequences of any deficits in this area are certainly as vital for delayed as nondelayed children. Accordingly, in the present study, these issues were addressed by employing an analogue playgroup setting and design similar to that described by Coie and Kupersmidt (1983) and Dodge (1983). A series of mainstreamed playgroups containing 3- and 4-year-old nonhaodicapped and 4-year-old mildly delayed children were fonned to allow answers to important questions related to possible peer-related social deficits of mildly delayed children, social integration patterns, sociometric status, and the responsiveness of companions varying in tenns of chronological age and developmental status. Noteworthy features of this analogue approach were as follows: (1) sampling bias inherent in the study of intact groups in mainstreamed settings was minimized through control over subjectselection procedures in the formation of the playgroups; (2) control over subject selection and group composition permitted matching of mildly delayed 4-year-olds in terms of chronological age to nonnally developing 4-year-olds and in terms of developmental level to normally developing 3-year-olds; (3) recording techniques allowed the application of multiple coding systems; and (4) children un-
1558 Child Development
acquainted with one another were brought together in the playgroups, thereby allowing the study of peer-related social interactions and social integration patterns free of reputational factors or previously established social status hierarchies.
Method Overview
Previously unacquainted groups of nonhandicapped and mildly developmentally delayed preschool-age boys were brought together to form a series of mainstreamed playgroups. Eight such playgroups were formed, each composed of three normally developing 3-year-olds, three normally developing 4-year-olds, and two mildly developmentally delayed 4-year-olds. 1 The delayed children were selected to achieve a chronological age match with the normally developing 4-yearolds and a developmental age match with the normally developing 3-year-olds. The social and play interactions of each child were videotaped from an adjacent observation room during a designated free-p lay period,2 and an array of demographic and child characteristic information was obtained through inspection of records, individual testing, and parent and teacher interviews. At the conclusion of each playgroup, sociometric ratings were completed by each of the eight children.
Subjects Normally developing children were re
cruited through advertisements in local newspapers and newsletters and through direct contact with administrators and teachers of public and private nursery schools. Delayed children meeting specific inclusion criteria (see below) were recruited from the rosters of appropriate service programs in a Midwestern community of moderate size. The sample of mildly delayed children participating in this study appeared to be highly representative of this population, as all identified mildly de-
layed children were served by a limited number of providers in the community, and a relatively low refusal rate (15%) was obtained. Primary reasons for refusal were transportation problems or limited family resources. Parents typically brought their children to the playgroup and were paid $100 plus transportation expenses for their participation.
Specific chronological age (CA) and intelligence test (IQ) score ranges were established as part of the inclusion criteria for each of the three groups of children constituting the playgroups. Children were screened through individual administrations of the revised Stanford-Binet Intelligence Scale (Terman & Merrill, 1973). For the nonhandicapped older (NHo) group, the CA range was established at 48-60 months and the IQ range from 90 to 125. For the nonhandicapped younger (NHy) group, established ranges were 30-42 months for CA and 90-125 for IQ. For the mildly handicapped (Mi) group, the CA range also was set at 48-60 months but with IQs ranging between 55 and 80. The categorization of children as mildly delayed is generally in accord with the classification scheme of the American Association on Mental Deficiency (Grossman, 1983) and conforms to community practice. Etiologies of their handicaps varied and were classified as follows: 18.75% chromosomal disorders, 12.5% perinatal disorders and trauma, 18.75% postnatal trauma and other causes, and 50% unknown. Corresponding mental age (MA) ranges for the NHo, NHy, and Mi groups were 49-79, 32-60, and 32-54 months, respectively. Other criteria for participation were that children were unacquainted with each other, had no prior experience in mainstreamed programs, had no handicapped siblings, and exhibited no major sensory, motor, or behavioral impairments. Available children meeting these criteria were assigned to playgroups on a random basis.3 On rare occasions, NHy children at the
1 Only two mildly delayed children were included in each playgroup since it was very difficult to identify children to form the groups that also met the matching specifications of the experimental design. The small proportion of delayed children, however, is consistent with the fact that nonhandicapped children constitute the dominant group in mainstreamed programs and does reBect current practice for mildly delayed children.
2 In addition, specially selected pairs of children were brought together in a separate experimental playroom in which each child was matched primarily with one partner similar and one different in developmental status. Details of these pairings are not described in this report.
3 Minor exceptions to these criteria were as follows: (1) two children did participate in a program that included a small number of normally developing children, but the group consisted primarily of other delayed children; (2) none of the nonhandicapped children were acquainted with one another, but it was not possible to assure total lack of contact for the delayed children given that many were served by one agency; (3) approximately 20% of the children meeting other inclusion criteria were excluded for exhibiting behavioral impairments based on teacher judgments. The absence of behavioral control and extensive acting out or aggression were the primary reasons cited; and (4) one child did exceed the IQ cut-off of 80 but was included due to the existence of a
Guralnick and Groom 1559
TABLE l
C HARACTERISTICS OF THE SAMPLE FOR EACH GROUP ACROSS PLAYCROUPS
Non handicapped MEASURE Older (N = 24)
Chronological age . . . . . . . . . . 53.75 (48-59)
Mental age . . . . . . . . . . . . . . . . . 65.50 (54-74)
Inte lligence quotient . . . . . . . 110.83 (93-124)
Language age . . . . . . . . . . . . . . 62.76 (56.3-69.8)
Socioeconomic status . . . . . . . 49.15 (20.3-81.2)
NOTE.-Ranges of scores are In parentheses.
extremes of the MA range were excluded to ensure a mean MA match between NHy and Mi.
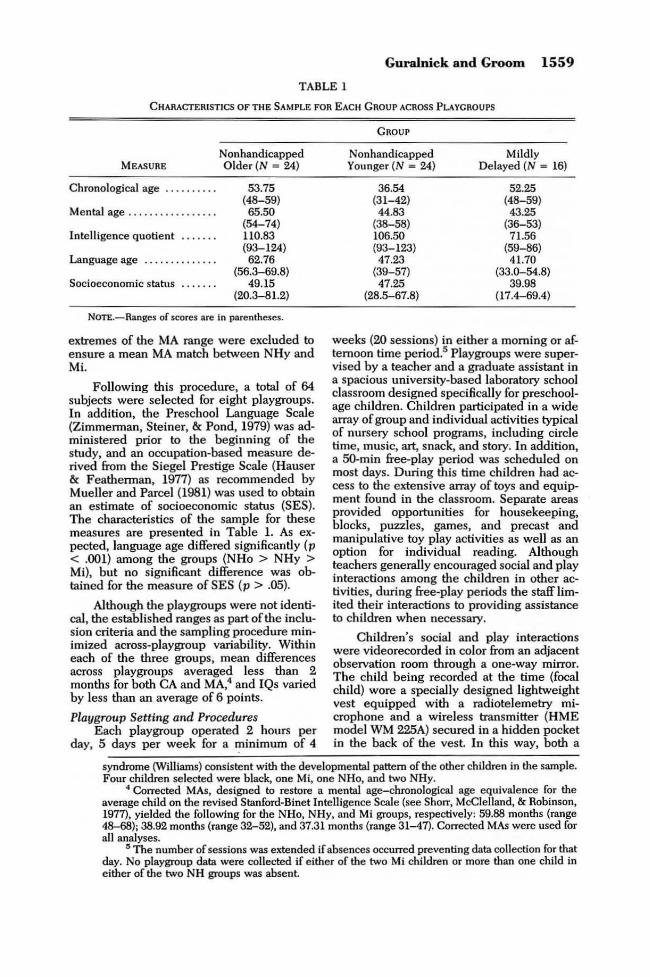
Following this procedure, a total of 64 subjects were selected for e ight playgroups. In addition, the Preschool Language Scale (Zimmerman, Steiner, & Pond, 1979) was administered prior to the beginning of the study, and an occupation-based measure derived from the Siegel Prestige Scale (Hauser & Featherman, 1977) as recommended by Mueller and Parcel (1981) was used to obtain an estimate of socioeconomic status (SES). The characteristics of the sample for these measures are presented in Table 1. As expected, language age differed significantly (p < .001) among the groups (NHo > NHy > Mi), but no significant difference was obtained for the measure of SES (p > .05).
Although the playgroups were not identical, the established ranges as part of the inclusion criteria and the sampling procedure minimized across-playgroup variability. Within each of the three groups, mean differences across playgroups averaged less than 2 months for both CA and MA,4 and IQs varied by less than an average of 6 points.
Playgroup Setting and Procedures Each playgroup operated 2 hours per
day, 5 days per week for a minimum of 4
GROUP
N onhandicapped Younger (N = 24)
36.54 (31-42) 44.83
(38-58) 106.50 (93-123) 47.23
(39-57) 47.25
(28.5-67.8)
Mildly Delayed (N = 16)
52.25 (48-59) 43.25
(36-53) 71.56
(59-86) 41.70
(33.0- 54.8) 39.98
(17.4-69.4)
weeks (20 sessions) in e ither a morning or afternoon time period.5 Playgroups were supervised by a teacher and a graduate assistant in a spacious university-based laboratory school classroom designed specifically for preschoolage children. Children participated in a wide array of group and individual activities typical of nursery school programs, including circle time, music, art, snack, and story. In addition, a 50-min free-play period was scheduled on most days. During this time children had access to the extensive array of toys and equipment found in the classroom. Separate areas provided opportunities for housekeeping, blocks, puzzles, games, and precast and manipulative toy play activities as well as an option for individual reading. Although teachers generally encouraged social and play interactions among the children in other activities, during free-play periods the staff limited their interactions to providing assistance to children when necessary.
Children's social and play interactions were videorecorded in color from an adjacent observation room through a one-way mirror. The child being recorded at the time (focal child) wore a specially designed lightweight vest equipped with a radiotelemetry microphone and a wireless transmitter (HME model WM 225A) secured in a hidden pocket in the back of the vest In this way, both a
syndrome (Williams) consistent with the developmental pattern of the other children in the sample. Four children selected were black, one Mi, one NHo, and two NHy.
4 Corrected MAs, designed to restore a mental age-chronological age equivalence for the average child on the revised Stanford-Binet Intelligence Scale (see Shorr, McClelland, & Robinson, 1977), yielded the following for the NHo, NHy, and Mi groups, respectively: 59.88 months (range 48-68); 38.92 months (range 32-52), and 37.31 months (range 31-47). Corrected MAs were used for all analyses.
5 The number of sessions was extended if absences occurred preventing data collection for that day. No playgroup data were collected if either of the two Mi children or more than one child in either of the two NH groups was absent.

1560 Child Development
visual and auditory record of each child's interactions could be obtained without imposing any restrictions on the normal flow of activities.
Across the 4-week period, each child was observed for a total of 100 min during free play. Recordings commenced on the third playgroup day and were divided into segments of 10 consecutive minutes for each of 10 recording periods per child. The order of recording children in the playgroup was randomized within blocks of eight 10-min segments, and no child was observed more than once per day (usually every other day). In addition, recordings were distributed such that each child was videotaped on five occasions within the first 2 weeks (time 1) and on five occasions during the second 2 weeks (time 2).
As described below, videotaped recordings were analyzed using two separate scales: one focusing on more global measures of social participation and cognitive play and the other on individual social behaviors. At the completion of the study, a peer sociometric measure was administered to each child.
Observational Measures Social participation and cognitive
play.-Parten's (1932) index of social participation formed the basis for characterizing global differences in children's peer relationships. Despite legitimate concerns regarding the sequential and hierarchical nature of this measure of social participation (Bakeman & Brownlee, 1980; Roper & Hinde, 1978; Rubin, Maioni, & Hornung, 1976; Smith, 1978), variations and modifications of the Parten scale, many including measures of cognitive play based on Smilansky's (1968) categories (see Rubin, 1981), appear to have considerable utility. Various forms of the scale have been shown to be sensitive to developmental changes over time (Barnes, 1971; Rubin & Krasnor, 1980; Rubin, Watson, & Jambor, 1978; Smith, 1978), to socioeconomic status (Rubin et al., 1976), to environmental conditions (Vandenberg, 1981), to the familiarity of peers (Doyle, Connolly, & Rivest, 1980), and to differences between mixed-age and sameage groupings (Goldman, 1981). Moreover, variations of the scale have been applied effectively to handicapped populations (Guralnick & Groom, 1985; Higgenbotham & Baker, 1981; Wintre & Webster, 1974) and may well be of value in identifyng children at risk for developmental problems (Rubin, 1982; Rubin, LeMare, & Lollis, in press).
A time code superimposed on each videotape in conjunction with a remotely controlled tape-stop device allowed observers to view tapes at 10-sec intervals. Coders recorded the quality of social participation and levels of cognitive play during each 10-sec interval using a slightly modified version of the scale developed by Rubin and his colleagues (Rubin et al., 1976, 1978). This scale consists of 11 mutually exclusive and exhaustive categories. The first three were derived from Parten' s (1932) social participation categories consisting of the following play classifications: (a) solitary (playing alone), (b) parallel (playing next to another child), and (c) group (playing with another child; a combination of Parten's associative and cooperative play categories). Nested within these three social participation categories are four measures of cognitive play based on the work of Smilansky (1968): (a) functional (simple repetitive play), (b) constructive (learns to use materials, creates something), (c) dramatic (role taking and pretend play), and (d) games with rules (child behaves in accordance with prearranged rules). U any 10-sec interval was coded as either solitary, parallel, or group play, then one of the four cognitive play categories was also scored.
The eight remaining categories consisted of the following: (a) unoccupied behavior (child not playing), (b) onlooker behavior (child watches other children but does not enter into play), (c) reading (reading, leafing through a book, or being read to), (d) roughand-tumble (mock and playful fighting, running after one another), (e) exploration (examining physical properties of objects), (j) active conversation (talking, questioning, and suggesting to other children but not playing), (g) transitional (moving from one activity to another), and (h) adult-directed (any activity with an adult).
In order to obtain information with regard to whom the focal child interacted with, the identity of the peer for the group, parallel play, rough-and-tumble, conversation, and onlooker categories was noted whenever these categories were coded. When more than one child was involved in the interaction, the one in closest proximity to the focal child was coded. More specific definitions for the social participation and cognitive play cate%ories can be found in Rubin's (1981) manual.
Individual social behaviors.-Each videotape was reviewed a second time in or-
6 Coding rules and related modifications of this scale as well as the coding manual for the Individual Social Behavior Scale can be obtained by writing the first author.
der to examine specific peer-related social behaviors. For this purpose, an individual social behavior scale was developed based on the work of White and Watts (1973) and adapted in a manner similar to Doyle et al. (1980) and to Guralnick and Groom (1985). The cluster of individual social behaviors originally described by White and Watts (1973), including the ability to gain the attention of others, to use others as resources, to express affection, and to direct others successfully during play, has been employed extensively. These component behaviors increase over the preschool years, correspond to other measures of social competence with peers such as teacher ratings and peer sociometrics, vary with the familiarity of interacting children, and correlate positively with social participation (ConnolJy & Doyle, 1981; Doyle et al., 1980; Wright, 1980).
Specifically, observers recorded continuously the occurrence of individual social behaviors organized within 14 major categories. Eleven categories were designed to record social interactions of the focal child as directed to peers. These were as follows: (1) gains the attention of a peer, (2) uses peer as a resource, (3) leads peer in activities-positive and neutral, (4) leads peer in activitiesnegative, (5) imitates a peer, (6) expresses affection to peer, (7) expresses hostility to peer, (8) competes with peer for adult's attention, (9) competes for equipment, (10) shows pride in product or attribute to peer, and (11) follows peer's activity without specific directions to do so. Two of the remaining categories focused on the social behaviors of the focal child in response to directed activities of a peer: (1) follows the lead of peer in response to verbal or nonverbal directions, and (2) refuses to follow or ignores peer's directions or requests. The final category was one in which the focal child served as a model for a peer.
Seven of these 14 major categories also contained subcategories that were coded separately. Gains the attention of a peer was coded in terms of the form by which that attention was sought. Specific subcategories were: (a) moving toward another child, (b) touching, (c) calling, (d) telling or showing something, and (e) showing off. When children used peers as resources, the specific purpose of that interaction was coded as: (a) seeking explanation or information, (b) seeking judgment in a dispute, (c) seeking help with clothes, or (d) seeking help with equipment. When the focal child followed the explicitly stated or indicated (nonverbal) lead of a peer, the event was coded as to whether the
Guralnick and Groom 1561
focal child folJowed in terms of(a) what to do, (b) how to do something, or (c) whether what was complied with was a modification of the original request by the peer. When the focal child followed the activities of a peer without any specific directions to do so, these spontaneous interactions were coded as: (a) involved observation of a peer, (b) verbally supporting a peer's statement, (c) following the peer, or (d) joining peer in a specific activity. Expressing affection to a peer was coded as either (a) verbal/smile, (b) physical, or (c) offering help or sharing. Similarly, expressing hostility was coded as either (a) verbal or (b) physical; and competing for equipment was divided into (a) defending property or (b) taking an unoffered object. When behaviors in subcategories occurred simultaneously, specific priority coding rules were followed (see Footnote 6).
Accordingly, with the addition of the subcategories, a total of 30 individual behavioral events were available for coding. In addition, events (1), (2), (3), (4), (8), and (9) of the 11 categories designed to record the social interactions of the focal child as directed to peers, including subcategories, were judged as either successful or unsuccessful. Definitions for successful or unsuccessful social interactions were specific to each social behavior category (see n. 6). For example, the gains-the-attention-of-peer category would be coded as successful if the peer attended within 5 sec, either visually or verbally, or moved closer to or touched the focal child. The response of the peer must be appropriate to the attention-getting effort of the focal child. Finally, the identity of the peer interacted with also was recorded following procedures outlined above for the social participation scale.
Coders were free to review any segment of the tape as often as needed. The coding protocol was divided into 30-sec intervals following the time codes superimposed on the tape. Although coding was continuous, these divisions provided a structure for the coding task and served as a framework for establishing reliability (see below) within the eventbased system.
Peer sociometric ratings.-Following Asher, Singleton, Tinsley, and Hymel (1979), at the end of the playgroup each child was individually presented with color Polaroid photographs of each playgroup participant and asked to place the photographs into one of three boxes. One box contained a drawing of a happy face for "children you really like to play with a lot," a second contained a neutral
1562 Child Development
face for "children you kinda like to play with," and the third contained a sad face for "children you don't like to play with." Prior training with pictures of different foods established that each child understood the rating procedure. Ratings were assigned a score of 3 for positive, 2 for neutral, and 1 for negative, in order to obtain a composite score in the form of an average rating. In addition, separate scores were obtained for the number of positive assignments, the number of neutral assignments, and the number of negative assignments.
Reliability.-Prior to coding, three raters were trained for a period of 6-8 weeks on the two observation scales. Videotapes of pilot playgroups only were used for training and final prestudy reliability assessments. Following the training program, all raters achieved the minimum average criterion necessary for participation of 80% interobserver agreement for each of the major categories for five consecutive 10-min segments for each of the two scales. Reliability also was obtained during the course of the study for 25% of the playgroup tapes selected on a random basis.
For the social participation and cognitive play scale, reliability was based on percent agreement obtained across each of the 10-sec observation intervals (number of agreements divided by the total number of observations and transformed to a percentage). Cohen's (1960) kappa was also calculated where appropriate . For prestudy reliability, raters agreed on a mean of 90% (range 79%-100%) of the intervals (kappa = .88) for the 11 categories of the social participation scale. Using only those instances in which observers agreed that a ·cognitive play coding was required, interobserver agreement averaged 96% (range 86%-100%) for the four cognitive play categories. Average agreement with regard to the identity of the peer involved in the social interaction was 93% (range 82%-100%). During the course of the study, average interobserver agreement continued to be high in all instances for each of the eight groups: social participation, 91% (range 88%-95%), kappa = .89 (range .86-93); cognitive play, 97% (range 89%-100%); and the identity of the peer, 98% (range 95%-99%).
For the individual social behavior scale, raters were considered to be in agreement if codes matched exactly within a specified 30-sec interval. All 30 individual social behavior categories were included, in addition to a "no-interaction" event that completed the possible options within each interval. Percent agreement was obtained for each 10-min seg-
meat by taking the total number of agreements, dividing by the total number of observed individual social interactions, and transforming to a percentage. One unit was added if both observers agreed that no interaction had occurred during an entire 30-sec interval. Calculated in this manner, the average prestudy agreement for this scale was 86% (range 77%-100%), kappa = .85. Given agreement on the occurrence of a particular social interaction, observers further agreed on an average of 84% (range 69%-100%) of the occasions as to whether the event could be classified as successful or unsuccessful, and an average of 96% (range 87%-100%) as to the identity of the peer involved in the social interaction. Mean reliabilities for observations carried out during the course of the study (25% of the total) were as follows: individual social behaviors, 90% (range 84%-93%), kappa = .87 (range .81-.90); successful/ unsuccessful , 95% (range 90%-99%); and identity of peer, 99% (range 98%-99%).
Results
In the folJowing analyses, measures reflecting the peer-related social competence of the nonhandicapped older, nonhandicapped younger, and mildly delayed groups were compared across groups and between the two time periods. For each measure, data were summed across the first five and second five observation periods, and a series of group (NHo, NHy, Mi) x time (time 1, time 2) mixed-model analyses of variance (ANOVA) were carried out. When peer-group membership (children who were the targets of social interaction) was added, analyses consisted of 3 (group) x 2 (time) x 3 (peer group: NHo, NHy, Mi) ANOVAs, with time and peer group as within factors. In those instances in which multivariate analyses of variance (MANOVA) were applied, Wilks's criterion was used (SAS Institute, Inc., 1982). Whenever frequency data were transformed to proportions, the arcsine transformation was used. However, to facilitate interpretation of the results, data presented in the tables and text are untransformed scores. Results are organized in terms of the major outcome measures of (1) social participation and cognitive play, (2) individual social behaviors, (3) derived measures of social integration, and (4) peer sociometric ratings.
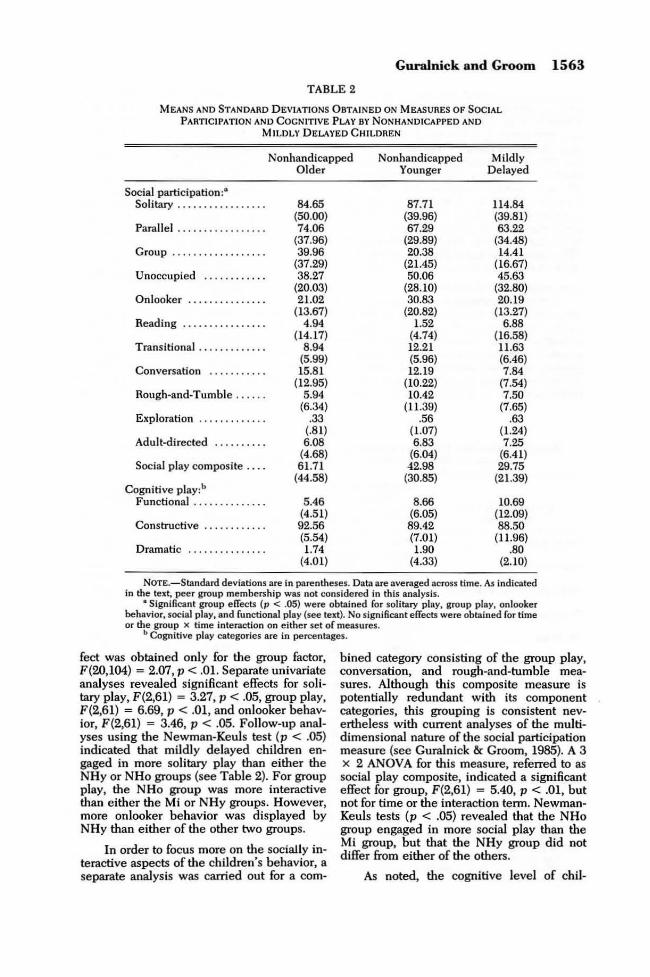
Social Participation and Cognitive Play A 3 (group) x 2 (time) MANOVA was
carried out on the frequency of intervals coded for the 11 categories of the social participation scale. A significant multivariate ef-
Guralnick and Groom 1563
TABLE 2
MEANS AND STANDARD DEVIATIONS 0BTAJNED ON MEASURES OF SOCIAL PARTICIPATION AND COGNITIVE PLAY BY NONHANDICAPPEO ANO
MILDLY DELAYED CHILDREN
Nonhandicapped Nonhandicapped Mildly Older Younger Delayed
Social participation:• Solitary ................. 84.65 87.71 114.84
(50.00) (39.96) (39.81) Parallel ................. 74.06 67.29 63.22
(37.96) (29.89) (34.48) Group .................. 39.96 20.38 14.41
(37.29) (21.45) (16.67) Unoccupied ............ 38.27 50.06 45.63
(20.03) (28.10) (32.80) Onlooker ............ . .. 21.02 30.83 20.19
(13.67) (20.82) (13.27) Reading .. . . ........... . 4.94 1.52 6.88
(14.17) (4.74) (16.58) Transitional ............ . 8.94 12.21 11.63
(5.99) (5.96) (6.46) Conversation .......... . 15.81 12.19 7.84
(12.95) (10.22) (7.54) Rough-and-Tumble ...... 5.94 10.42 7.50
(6.34) (11.39) (7.65) Exploration ............. .33 .56 .63
(.81) (1.07} (l.24) Adult-directed .......... 6.08 6.83 7.25
(4.68) (6.04) (6.41) Social play composite .. .. 61.71 42.98 29.75
Cognitive play:b (44.58) (30.85) (21.39)
Functional .............. 5.46 8.66 10.69 (4.51) (6.05) (12.09)
Constructive ............ 92.56 89.42 88.50 (5.54) (7.01) (11.96)
Dramatic ............... 1.74 1.90 .80 (4.01) (4.33) (2.10)
NoTE.-Standard deviations are in parentheses. Data are averaged across time. As indicated in the text, peer group membership was not considered in this analysis.
• Significant gTOup effects (p < .05) were obtained for solitary play, group play, onlooker behavior, social play, and functional p lay (see text). No significant effects were obtained for time or the group x time interaction oo either set of measures.
b Cognitive play categories are io percentages.
feet was obtained only for the group factor, F(20,104) = 2.07, p < .01. Separate univariate analyses revealed significant effects for solitary play, F(2,61) = 3.27, p < .05, group play, F(2,61) = 6.69, p < .01, and onlooker behavior, F(2,61) = 3.46, p < .05. Follow-up analyses using the Newman-Keuls test (p < .05) indicated that mildly delayed children engaged in more solitary play than either the NHy or NHo groups (see Table 2). For group play, the NHo group was more interactive than either the Mi or NHy groups. However, more onlooker behavior was displayed by NHy than either of the other two groups.
In order to focus more on the socially interactive aspects of the children's behavior, a separate analysis was carried out for a com-
bined category consisting of the group play, conversation, and rough-and-tumble measures. Although this composite measure is potentially redundant with its component categories, this grouping is consistent nevertheless with current analyses of the multidimensional nature of the social participation measure (see Guralnick & Groom, 1985). A 3 x 2 ANOVA for this measure, referred to as social play composite, indicated a significant effect for group, F(2,61) = 5.40, p < .01, but not for time or the interaction term. NewmanKeuls tests (p < .05) revealed that the NHo group engaged in more social play than the Mi group, but that the NHy group did not differ from either of the others.
As noted, the cognitive level of chil-
1564 Child Development
dren's play was coded whenever solitary, parallel, or group play was observed. Separate ANOV As were carried out on the percentages of functional, constructive, and dramatic play (the games category was dropped due to the very low frequency of its occurrence). Overall, constructive play was dominant for all three groups (approximately 90%; see Table 2). However, a significant effect for functional play, F(2,61) = 3.17, p < .05, indicated that the Mi group engaged in more functional play than did NHo, although the NHy children did not differ from either of the other groups (Newman-Keuls, p < .05).
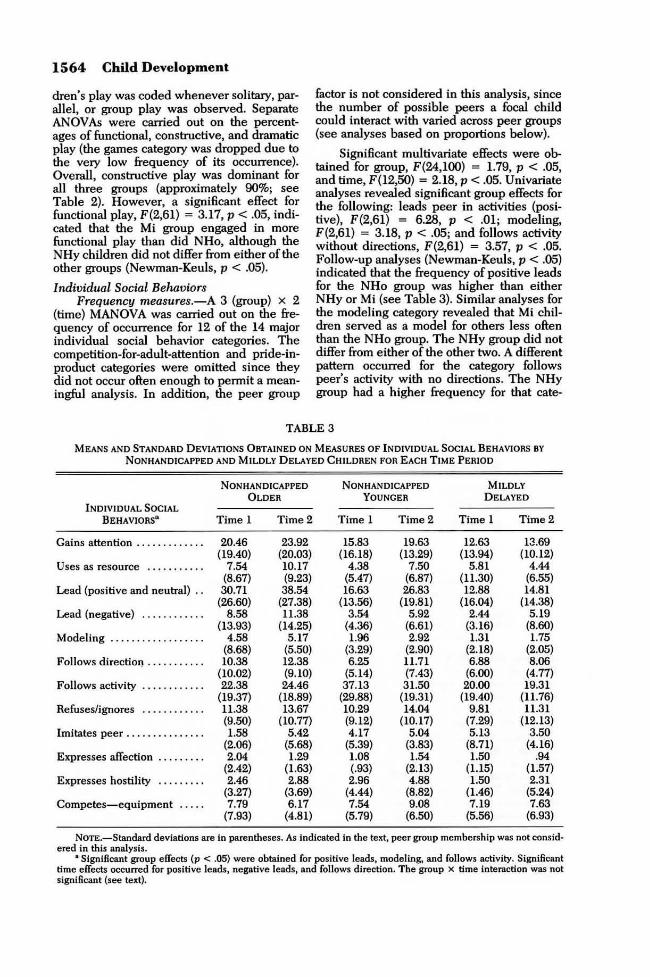
Individual Social Behaviors Frequency measures.-A 3 (group) x 2
(time} MANOVA was carried out on the frequency of occurrence for 12 of the 14 major individual social behavior categories. The competition-for-adult-attention and pride-inproduct categories were omitted since they did not occur often enough to permit a meaningful analysis. In addition, the peer group
factor is not considered in this analysis, since the number of possible peers a focal child could interact with varied across peer groups (see analyses based on proportions below}.
Significant multivariate effects were obtained for group, F(24,100) = 1.79, p < .05, and time, F(l2,50) = 2.18, p < .05. Univariate analyses revealed significant group effects for the following: leads peer in activities (positive), F(2,61) = 6.28, p < .01; modeling, F(2,61} = 3.18, p < .05; and follows activity without directions, F(2,61) = 3.57, p < .05. Follow-up analyses (Newman-Keuls, p < .05) indicated that the frequency of positive leads for the NHo group was higher than either NHy or Mi (see Table 3). Similar analyses for the modeling category revealed that Mi children served as a model for others less often than the NHo group. The NHy group did not differ from either of the other two. A different pattern occurred for the category follows peer's activity with no directions. The NHy group had a higher frequency for that cate-
TABLE 3
MEANS AND STANDARD DEVIATIONS OBTAINED ON MEASURES OF I NDIVIDUAL SOCIAL BEHAVIORS BY NONHANDICAPPED AND MILDLY DELAYED CHILDREN FOR EACH TIME PERIOD
NON HANDICAPPED NON HANDICAPPED MILDLY OLDER YOUNGER DELAYED
INDrVIDUAL SOCIAL BEHAVIORS" Time 1 Time2 Time l Time2 Timel Time2
Gains attention ............. 20.46 23.92 15.83 19.63 12.63 13.69 (19.40) (20.03) (16.18) (13.29) (13.94) (10.12)
Uses as resource ........... 7.54 10.17 4.38 7.50 5.81 4.44 (8.67) (9.23) (5.47) (6.87) (11.30) (6.55)
Lead (positive and neutral) .. 30.71 38.54 16.63 26.83 12.88 14.81 (26.60) (27.38) (13.56) (19.81) (16.04) (14.38)
Lead (negative) ....... ····· 8.58 11.38 3.54 5.92 2.44 5.19 (13.93) (14.25) (4.36) (6.61) (3.16) (8.60)
Modeling .................. 4.58 5.17 1.96 2.92 1.31 1.75 (8.68) (5.50) (3.29) (2.90) (2.18) (2.05)
Follows directiol) ........... 10.38 12.38 6.25 11.71 6.88 8.06 (10.02) (9.10) (5.14) (7.43) (6.00) (4.77)
Follows activity ............ 22.38 24.46 37.13 31.50 20.00 19.31 (19.37) (18.89) (29.88) (19.31) (19.40) (11.76)
Refuses/i gnores ............ 11.38 13.67 10.29 14.04 9.81 11.31 (9.50) (10.77) (9.12) (10.17) (7.29) (12.13)
Imitates peer ........ . . . .. . . 1.58 5.42 4.17 5.04 5.13 3.50 (2.06) (5.68) (5.39) (3.83) (8.71) (4.16)
Expresses affection . . .. . . .. . 2.04 1.29 1.08 1.54 1.50 .94 (2.42) (1.63) (.93) (2.13) (1.15) (1.57)
Expresses hostility ......... 2.46 2.88 2.96 4.88 1.50 2.31 (3.27) (3.69) (4.44) (8.82) (1.46) (5.24)
Competes- equipment ... . . 7.79 6.17 7.54 9.08 7.19 7.63 (7.93) (4.81) (5.79) (6.50) (5.56) (6.93)
NOTE.-Standard deviations are in parentheses. As indicated in the text, peer group membership was not considered in this analysis.
•Significant group effects (p < .05} were obtained for positive leads, modeling, and follows activity. Significant time effects occurred for positive leads, negative leads, and follows direction. The group x time interaction was not significant (see text).
gory than Mi, with NHo not differing from either group. Finally, increases in the frequency of individual social behaviors from time 1 to time 2 occurred for the following: positive leads, F (l ,61) = 8.01, p < .01; negative leads, F (l,61) = 7.74, p < .01; and follows lead with direction, F (l,61) = 7.17, p < .01 {see Table 3).
Although seven of the major individual social behavior categories contained subcategories, one generally dominated the coding. The subcategories coded most frequently for each of the seven categories were as follows: attention {tells or shows something to peer, 65.42%). resource (seek explanation or information, 89.72%), folJows lead with directions (what to do, 97.37%), follow peer's activity without directions (involved observation, 75.01 %), affection (offers help or shares, 58.11%), hostility (physical, 75.23%). and competes for equipment (takes unoffered object, 54.70%).
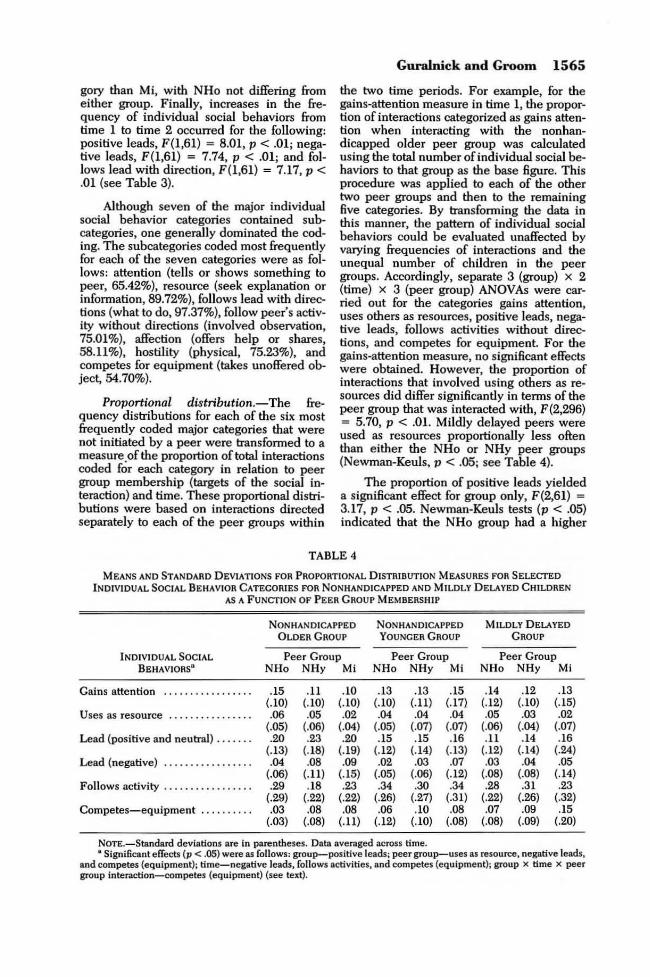
Proportional distribution.-The frequency distributions for each of the six most frequently coded major categories that were not initiated by a peer were transformed to a measure of the proportion of total interactions coded for each category in relation to peer group membership (targets of the social interaction) and time. These proportional distributions were based on interactions directed separately to each of the peer groups within
Guralnick and Groom 1565
the two time periods. For example, for the gains-attention measure in time 1, the proportion of interactions categorized as gains attention when interacting with the nonhandicapped older peer group was calculated using the total number of individual social behaviors to that group as the base figure. This procedure was applied to each of the other two peer groups and then to the remaining five categories. By transforming the data in this manner, the pattern of individual social behaviors could be evaluated unaffected by varying frequencies of interactions and the unequal number of children in the peer groups. Accordingly, separate 3 {group) x 2 (time) x 3 (peer group) ANOV As were carried out for the categories gains attention, uses others as resources, positive leads, negative leads, follows activities without directions, and competes for equipment For the gains-attention measure, no significant effects were obtained. However, the proportion of interactions that involved using others as resources did differ significantly in terms of the peer group that was interacted with, F{2,296) = 5.70, p < .01. Mildly delayed peers were used as resources proportionally less often than either the NHo or NHy peer groups (Newman-Keuls, p < .05; see Table 4).
The proportion of positive leads yielded a significant effect for group only, F(2,61) = 3.17, p < .05. Newman-Keuls tests (p < .05) indicated that the NHo group had a higher
TABLE 4
MEANS AND STANDARD DEVIATIONS FOR PROPORTIONAL DISTRIBUTION M EASURES FOR SELECTED I NDIVIDUAL SOCIAL B EHAVIOR CATECORIES FOR NONHANDICAPPED AND MILDLY D ELAYED CHILDREN
AS A FUNCTION OF PEER CROUP MEMBERSHIP
NoNHANDICAPPED NON HANDICAPPED MILDLY DELAYED 0LDE.R CROUP YOUNGER CROUP CROUP
INDIVIDUAL SOCIAL Peer Croup Peer Group Peer Group BEHAVIORS" NHo NHy Mi NHo N H y Mi N H o NHy Mi
Cains attention .......... ....... .15 .11 .10 .13 .13 .15 .14 .12 .13 (.10) (.10) (.10) (.10) (.11) (.17) (.12) (.10) (.15)
Uses as resource . .....••.••..•.. .06 .05 .02 .04 .04 .04 .05 .03 .02 (.05) (.06) (.04) (.05) (.07) (.07) (.06) (.04) (.07)
Lead (positive and n eutral) .•..•.. .20 .23 .20 .15 .15 .16 .11 .14 .16 (.13) (.18) (.19) (.12) (.14) (.13) (.12) (.14) (.24)
L ead (negative) •..•.••••.•. • •. . . .04 .08 .09 .02 .03 .07 .03 .04 .05 (.06) (.11) (.15) (.05) (.06) (.12) (.08) (.08) (.14)
Follows activity ...•..••••••..•.• .29 .18 .23 .34 .30 .34 .28 .31 .23 (.29) (.22) (.22) (.26) (.27) (.31) (.22) (.26) (.32)
Competes-equipment •.••...... .03 .08 .08 .06 .10 .08 .07 .09 .15 (.03) (.08) (.11) (.12) (.10) (.08) (.08) (.09) (.20)
NOTE.- Standard deviations are In parentheses. Data averaged across time. • Significant effects (p <.OS) were as follows: group-positive leads; peer group-uses as resource, negative leads,
and competes (equipment); time-negative leads, follows activities, and competes (equipment); group x time x peer group interaction-competes (equipment) (see text).
1566 Child Development
proportion of positive leads than the Mi group, but that the NHy children did not differ from either group. In contrast, the negative-leads category produced significant effects for both time, F (l ,296) = 5.60, p < .05, and peer group, F (2,296) = 5.66, p < .01. Overall, the proportion of negative leads increased from time 1 (M = .04) to time 2 (M = .06). The NHo peer group had a significantly (p < .05) smaller proportion of negative leads directed to them than either NHy or Mi.
Following the activities of others yielded a significant effect for time only, F(l,296) = 13.96, p < .001, as a substantial decline occurred between time 1 (M = .32) and time 2 (M = .24). Competing for equipment produced a much more complex pattern, as significant effects were obtained for time, F(l,296) = 7.19, p < .01, peer group, F(2,296) = 7.54, p < .001, and the group x time x peer group interaction, F(4,296) = 3.19, p < .05. The proportion of social interactions in which children competed for equipment declined from time 1 (M = .09) to time 2 (M = .07), and the NHo group was involved in proportionally fewer competitions (p < .05) for equipment than either of the other two groups. The significant interaction primarily reflected the fact that the Mi group had an unusually high proportion of competitions for equipment with other Mi children during time 1 (M = .22), which declined to more typical levels during time 2 (M = .08).
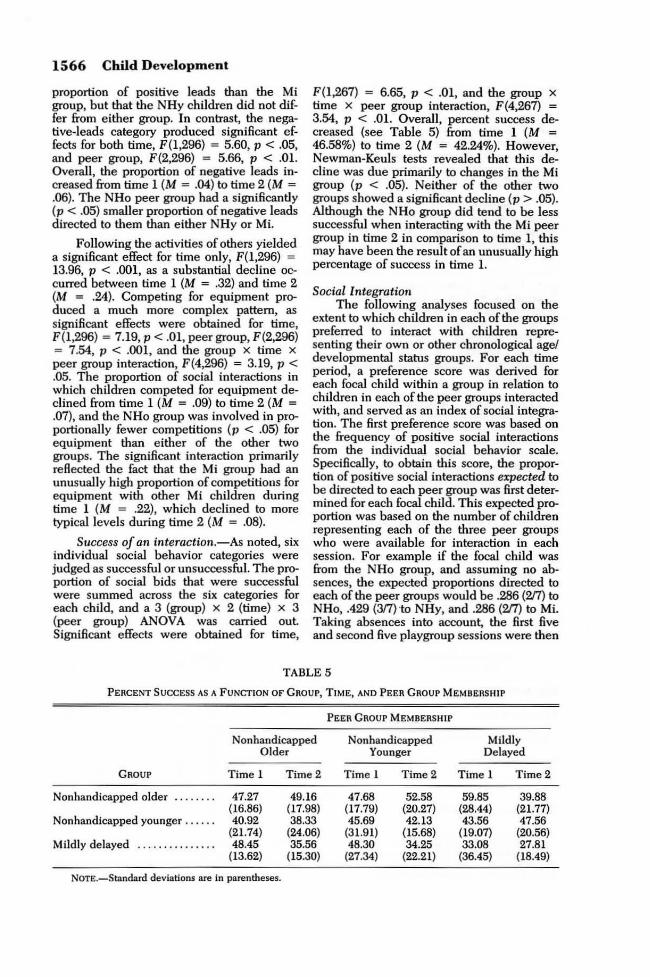
Success of an interaction.-As noted, six individual social behavior categories were judged as successful or unsuccessful. The proportion of social bids that were successful were summed across the six categories for each child, and a 3 (group) x 2 (time) x 3 (peer group) ANOVA was carried out Significant effects were obtained for time,
F(l,267) = 6.65, p < .01, and the group x time x peer group interaction, F(4,267} = 3.54, p < .01. Overall, percent success decreased (see Table 5) from time 1 (M = 46.58%) to time 2 (M = 42.24%). However, Newman-Keuls tests revealed that this decline was due primarily to changes in the Mi group (p < .05). Neither of the other two groups showed a significant decline (p > .05). Although the NHo group did tend to be less successful when interacting with the Mi peer group in time 2 in comparison to time 1, this may have been the result of an unusually high percentage of success in time 1.
Social Integration The following analyses focused on the
extent to which children in each of the groups preferred to interact with children representing their own or other chronological age/ developmental status groups. For each time period, a preference score was derived for each focal child within a group in relation to children in each of the peer groups interacted with, and served as an index of social integration. The first preference score was based on the frequency of positive social interactions from the individual social behavior scale. Specifically, to obtain this score, the proportion of positive social interactions expected to be directed to each peer group was first determined for each focal child. This expected proportion was based on the number of children representing each of the three peer groups who were available for interaction in each session. For example if the focal child was from the NHo group, and assuming no absences, the expected proportions directed to each of the peer groups would be .286 (217) to NHo, .429 (3n)to NHy, and .286 (217) to Mi. Taking absences into account, the first five and second five playgroup sessions were then
TABLE 5
PERCENT SUCCESS AS A FUNCTION OF GROUP, TIME, AND PEER GROUP MEMBERSHIP
GROUP
Nonhandicapped older
Nonhandicapped younger ......
Mildly delayed ...............
Nonhandicapped Older
Time 1 Time2
47.27 49.16 (16.86) (17.98) 40.92 38.33
(21.74) (24.06) 48.45 35.56
(13.62) (15.30)
NOTE.-Standard deviations are In parentheses.
PEER GROUP MEMBERSHIP
Nonhandicapped Younger
T ime l Time2
47.68 52.58 (17.79) (20.27) 45.69 42.13
(31.91) (15.68) 48.30 34.25
(27.34) (22.21)
Mildly Delayed
Time 1 Time2
59.85 39.88 (28.44) (21.77) 43.56 47.56
(19.07) (20.56) 33.08 27.81
(36.45) (18.49)
averaged to yield expected proportions tor time 1 and time 2. According)y, this expected value reflected the proportion of positive individual social behaviors that should have been directed to each peer group strictly on the basis of the number of children available in each peer group.
The obseroed proportion of interactions was obtained for each focal child by transforming the actual frequencies of individual positive social interactions into a proportion of the total interactions directed to children in each of the three peer groups. These were averaged for each focal child over the five sessions. A preference score was then derived consisting of tl1e observed proportion of interactions minus the expected proportion to each peer group for each of the two time periods. Positive scores reflected a preference for that peer group, whereas negative scores reflected lower than anticipated interactions with that peer group.
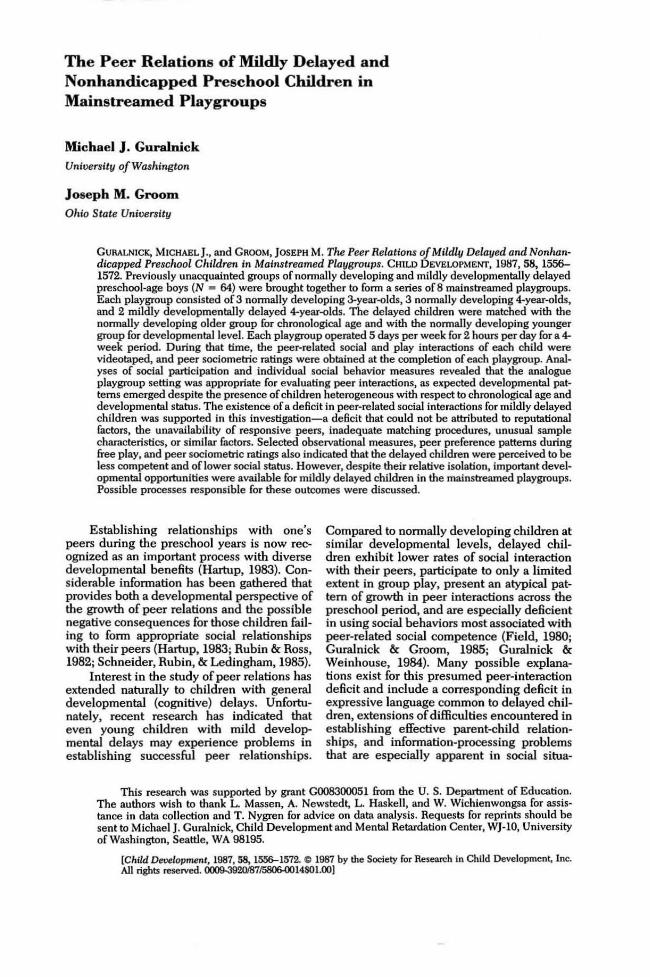
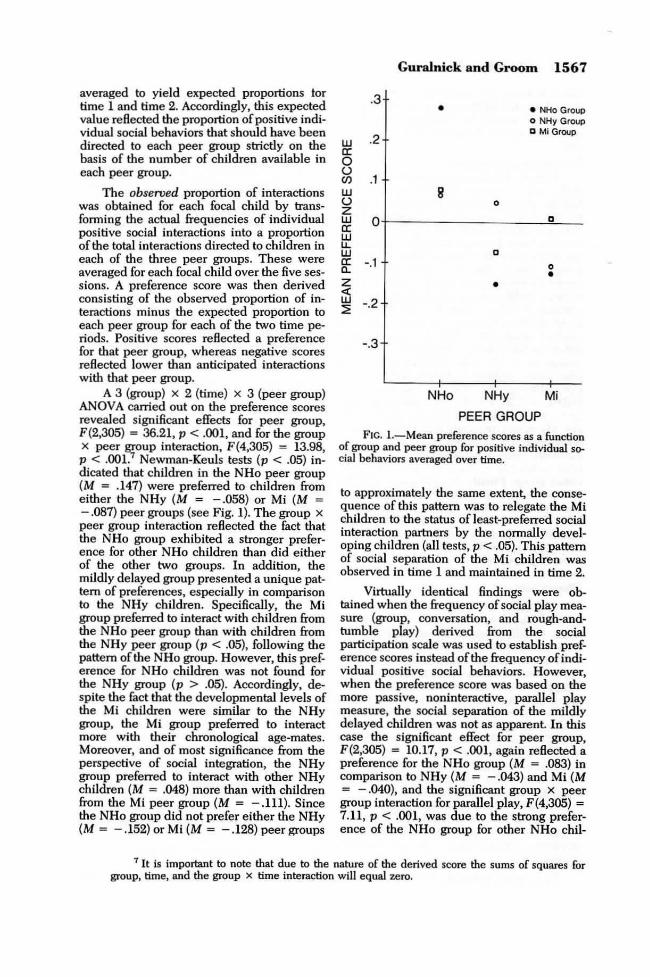
A 3 (group) x 2 (time) x 3 (peer group) ANOVA carried out on the preference scores revealed significant effects for peer group, F(2,305) = 36.21, p < .001, and for the group x peer group interaction, F (4,305) = 13.98, p < .001.7 Newman-KeuJs tests (p < .05) indicated that children in the NHo peer group (M = .147) were preferred to children from either the NHy (M = - .058) or Mi (M = - .087) peer groups (see Fig. 1). The group x peer group interaction reflected the fact that the NHo group exhibited a stronger preference for other NHo children than did either of the other two groups. In addition, the mildly delayed group presented a unique pattern of preferences, especially in comparison to the NHy children. Specifically, the Mi group preferred to interact with children from the NHo peer group than with children from the NHy peer group (p < .05), following the pattern of the NHo group. However, this preference for NHo children was not found for the NHy group (p > .05). Accordingly, despite the fact that the developmental levels of the Mi children were similar to the NHy group, the Mi group preferred to interact more with their chronological age-mates. Moreover, and of most significance from the perspective of social integration, the NHy group preferred to interact with other NHy children (M = .048) more than with children from the Mi peer group (M = - .111). Since the NHo group did not prefer either the NHy (M = - .152) or Mi (M = - .128) peer groups
.3
w .2 a: 0 () (/) .1 w () z w 0 a: w u. w a: -.1 a.. z c:x: w -.2 ~
-.3
Guralnick and Groom 156 7
•
0
D
•
• NHo Group o NHy Group D Mi Group
D
0
•
NHo NHy Mi
PEER GROUP
Fie. 1.- Mean preference scores as a function of group and peer group for positive individual social behaviors averaged over time.
to approximately the same extent, the consequence of this pattern was to relegate the Mi children to the status of least-preferred social interaction partners by the normally developing children (all tests, p < .05). This pattern of social separation of the Mi children was observed in time 1 and maintained in time 2.
Virtually identical findings were obtained when the frequency of social play measure (group, conversation, and rough-andtumble play) derived from the social participation scale was used to establish preference scores instead of the frequency of individual positive social behaviors. However, when the preference score was based on the more passive, noninteractive, parallel p lay measure, the social separation of the mildly delayed children was not as apparent In this case the significant effect for peer group, F(2,305) = 10.17, p < .001, again reflected a preference for the NHo group (M = .083) in comparison to NHy (M = - .043) and Mi (M = - .040), and the significant group x peer group interaction for parallel play, F(4,305) = 7.11, p < .001, was due to the strong preference of the NHo group for other NHo chil-
7 It is important to note that due to the nature of the derived score the sums of squares for group, time, and the group x time interaction will equal zero.
1568 Child Development
dren. However, the parallel play preferences of the NHy and Mi groups occurred in proportion to the number of children available in each peer group (Newman-Keuls tests, p > .05). Peer Sociometric Ratings
Average ratings were calculated for each child, and a one-way ANOVA on this measure for group produced a significant effect, F(2,61) = 4.77, p < .05. The Newman-Keuls test ( p < .05) revealed that the Mi group received a lower average rating (M = 2.12) than either the NHo (M = 2.43) or NHy (M = 2.38) groups. Exactly the same outcome was obtained for the measure based on the number of times children were placed in the positive category, F(2,61) = 4.96, p < .01. Mildly delayed children received the least number of positive ratings (M = 2.69) in comparison to either the NHo (M = 3.92) or NHy (M = 3.88) groups (p < .05). The number of negative placements yielded a slightly different pattern. Although the ANOVA was significant, F(2,61) = 3.26, p < .05, Newman-Keuls tests (p < .05) revealed that despite the fact that the Mi group received the most negative placements (M = 1.88), they differed significantly only from NHo (M = .92). The NHy group (M = 1.21) did not differ from either group. Finally, to determine whether the two groups of normally developing children rated the mildly delayed children similarly, average scores of the Mi children were calculated separately as rated by children in the NHo and NHy groups. No differences were obtained, t(46) = .33, N.S.
Discussion
In a series of mainstreamed playgroups, nonhandicapped 4-year-olds demonstrated more socially competent interactions with their peers than either nonhandicapped 3-year-olds or mildly delayed 4-year-olds. In comparison to these two groups, nonhandicapped older children engaged in more group play and had a higher frequency of positive leads with peers. Similar, though not as marked, results occurred for measures of overall social play and serving as a model. Moreover, many of these peer-related social interaction measures increased over the two time periods for all groups. Accordingly, these findings indicate that expected developmental patterns of peer-related social interactions emerge even in the context of short-term playgroups heterogeneous with respect to children's chronological age and developmental status.
In contrast, normally developing 3-year-
olds and mildly delayed 4-year-olds, although matched in terms of developmental level, presented a more complex pattern of childchild social interactions. On the one hand, both the frequency and proportional distribution of most individual social behaviors were similar in both groups, as was the extent to which children engaged in the various categories of social participation. However, a number of important differences were also apparent. Mildly delayed children engaged in considerably more solitary play than either of the two nonhandicapped groups, were the only group to show an overall decline in their ability to obtain positive outcomes to their social bids over time, and appeared to be less interested in their peers than nonhandicapped younger children as indicated by the follows-activities-of-peer and onlooker behavior measures. Moreover, the mildly delayed group was generally the least socially interactive group, especially as indicated by the group play, social play, and positive leads measures.
These differences between the mildly delayed and nonhandicapped younger groups support previous studies that have suggested the existence of a peer-related social deficit for mildly delayed preschool children- a deficit that cannot be attributed to the unavailability of responsive peers, to unusual characteristics of the sample, to inadequate matching with normally developing children, to preexisting interaction patterns within the playgroups, or to situational differences. As noted earlier, these methodological problems have plagued previous studies in this area. Speculation as to the underlying mechanisms for this discrepancy between cognitive development and peer interactions for mildly delayed children has included a generalized social interaction deficit, corresponding expressive language delays, and special problems in processing the more subtle and ambiguous information associated with social situations (see Guralnick, 1986a). Additional research is needed to clarify the relative contributions of these and other factors to the peer-interaction deficit for young mildly delayed children.
It is important to note as well that the peer-related social deficit of mildly delayed children obtained in this investigation appears to be less severe in comparison to previous work (Guralnick & Groom, 1985; Guralnick & Weinhouse, 1984). Since children in these prior studies were observed in specialized settings, it is possible that the presence of nonhandicapped children tended to mini-
mize differences between the nonhandicapped younger and mildly delayed groups, a point which will be returned to below. In addition, it should be recalled that mildly delayed children with behavior problems were excluded from the sample. This is a subset of delayed chiJdren who spend considerable portions of their time in nonplay activities (Guralnick & Groom, 1985), and may well account for the greater simi1arities found between nonhandicapped younger and mildly delayed groups in this study.
When viewed from the perspective of the children in the playgroup setting, however, marked distinctions in relation to competence and corresponding social status among the groups emerged. The fact that mildly delayed children rarely were sought out as resources or served infrequently as models for others (Abrarnovitch & Grusec, 1978; Akamatsu & Thelen, 1974) suggests that they were perceived as less competent by children in the playgroups. Moreover, observational measures indicated they were the least preferred play partners by the nonhandicapped children, a fact confirmed by peer sociometric ratings at the end of each playgroup.
A critical question that has both theoretical and practical implications concerns the reasons why mildly delayed children achieved this status. These findings cannot be attributed to reputational factors, as all children were unacquainted with one another. Nor were the mildly delayed children more negative or hostile. In fact, especially at the beginning of the playgroup, the social interactions of mildly delayed children received positive responses by nonhandicapped children at a high rate, and social play differences were less noticeable. Yet, perceptions of the limited competence of the mildly delayed children and their least-preferred-playmate status appeared early in the playgroups. Although factors such as prior experiences in group interactions or physical attractiveness8
are possible explanations, the most plausible alternative relates to the lack of peer-related social competence exhibited by the mildly delayed children.
Guralnick and Groom 1569
Assuming that this is the case, process analyses that track sequences of social exchanges are likely to be most productive in identifying the specific difficulties mildly delayed children experience during both initial encounters and in subsequent interactions. Nevertheless, some speculation can be offered here. One possibility to consider is the entry skills of the mildly delayed children, a major problem observed in children at lower sociometric status (Putallaz, 1983). The entry task requires complex information-processing skills and the ability to seek alternative, often less intrusive, strategies if initially rejected (Corsaro, 1979). The delayed children may have been more successful in gaining entry and access to play partners in the early stages of the playgroups because specific clusters of children were not yet well established. The relatively high initial success rate of the delayed group is consistent with this possibility. However, as groups became more firmly established, more complex entry skills would be required- skills probably beyond the ability of most delayed children in the study. In fact, the trend for the mildly delayed children was one of declining involvement in group play (time l : M = 17.25; time 2: M = 11.56). These limited entry skills by the mildly delayed children may have reinforced what was certainly a growing reputation for lack of social competence, ultimately resulting in a firmly established pattern of social separation and reduced social status. Whatever the case may be, it is likely that an en ti.re array of information-processing, affective, communicative, and behavioral factors are involved. The success of intervention strategies for mildly delayed young children will be dependent upon our increased understanding of these processes.
This study was not designed to evaluate the impact of mainstreamed environments on the peer-related social interactions of mildly delayed children, as that would require other experimental approaches. Nevertheless, the patterns of social interaction observed in this investigation provide descriptive data that are relevant to this issue. In particular, the relative exclusion of the mildly delayed group by
8 The mildly delayed children were in fact judged by undergraduate students to be less physically attractive than either of the other two groups (testing details and results can be obtained by writing the first author). Although physical attractiveness may be related to initial impressions, it is not a likely explanation for the preference patterns, perceptions of competence, or sociometric status ratings found in this study. Specifically, the relations between physical attractiveness and sociometric status, judgments of competence, and indices of social competence have not been established for preschool-age boys, especially for those acquainted with one another (Styczynski & Langlois, 1977; Vaughn & Langlois, 1983). In addition, recent research has indicated that it appears to be the social competence of attractive children, not attractiveness itself, that is responsible for any obtained relations between physical attractiveness and sociometric status (Dodge, 1983).
1570 Child Development
normally developing children as revealed by the peer-preference scores for the positive individual social behavior and social play measures are likely to attenuate any potential benefits that may be derived from placement with nonhandicapped children. Yet, this conclusion must be tempered by the finding that, from the perspective of the mildly delayed children, social interactions occurred frequently with children in normally developing groups. Children in the mildly delayed group actually preferred to interact with the normally developing older group and were generally successful in gaining an appropriate response to their social interactions, especially in the first time period. In fact, when social interactions with the nonhandicapped older children did occur, they tended to be highly productive. This can be seen by the fact that when mildly delayed children engaged in group play, the partner was a nonhandicapped older child on approximately 60% of the occasions. Moreover, it is important to note that far less social separation occurred during parallel play, providing ample opportunities for observational learning. Accordingly, despite the existence of social separation and other problematic interaction patterns, these findings suggest that mainstreamed settings may well provide important developmental opportunities for mildly delayed chiJdren, and that placement on the basis of chronological age rather than developmental level shouJd be given carefuJ consideration.
In summary, the analogue setting for this investigation proved to be valuable for evaluating the development of social interaction patterns in mainstreamed playgroups. The playgroup design enabled comparisons to be made between groups of children meet- , ing stringent inclusion criteria that minimized sampling bias and prevented reputational and other potential confounds from affecting the outcome. As a consequence, the existence of a peer-interaction deficit for mildly delayed children was established in this study-a pattern that emerged even when responsive peers were available. This deficit was detected in spite of the fact that mildly delayed children displayed many peer-related social behaviors similar to a developmentally matched group of normally developing younger children. Observational analyses of social interaction patterns and peer sociometric ratings also suggested that mildly delayed children were perceived as less competent and of lower social status by other children in the setting. Nevertheless, rniJdly delayed children preferred to interact with children simi-
lar in chronological age rather than developmental level, and were often engaged in advanced levels of play with this group. Having now firmly established these patterns and even speculated as to the possible bases for a peer-related social deficit of young mildly delayed children, future studies must direct their efforts toward an identification of those social interaction processes that may be responsible for the outcomes described in this investigation and to the design of appropriate intervention strategies.
References Abramovitch, R., & Grusec, J. (1978). Peer imita
tion in a natural setting. Child Development, 49, 60-65.
Akamatsu, T., & Thelen, M. H. (1974). A review of the literature on observer characteristics and imitation. Developmental Psychology, 10, 38-47.
Asher, S. R., Singleton, L. C., Tinsley, B. R., & Hymel, S. (1979). A reliable sociomebic measure for preschool children. Developmental Psychology, 15, 443-444.
Bakeman, R., & Brownlee, J. R. (1980). The strategic use of parallel play: A sequential analysis. Child Development, 51, 873-878.
Barnes, K. E. (1971). Preschool play norms: A replication. Developmental Psychology, 5, 99-103.
Brooks-Gunn, J., & Luciano, L. (1985). Social competence in young handicapped children: A developmental perspective. In M. Sigman (Ed.), Children with emotional disorders and developmental disabilities: Assessment and treatment (pp. 3-22). Orlando, FL: Grune & Stratton.
Cavallaro, S. A., & Porter, R. H. (1980). Peer preferences of at-risk and normally developing children in preschool mainstream classrooms. American journal of Mental Deficiency, 84, 357-366.
Cohen, J. (1960). A coefficient of agreement for nominal scales. Educational and Psycliological Measurement, 20, 37-46.
Coie, J. D., & Kupersmidt, J. B. (1983). A behavioral analysis of emerging social status in boys' groups. Child Development, 54, 1400-1416.
Connolly, J., & Doyle, A. (1981). Assessment of social competence in preschoolers: Teachers versus peers. Developmental Psychology, 17, 454-462.
Corsaro, W. A. (1979). "We're friends, right?'': Children's use of access rituals in a nursery school. Language in Society, 8, 315-336.
Dodge, K. A. (1983). Behavioral antecedents of peer social status. Child Development, 54, 1386-1399.
Doyle, A., Connolly, J., & Rivest, L. (1980). The
effect of playmate familiarity on the social interactions of young children. Child Development, 51, 217-223.
Dunlop, K. H., Stoneman, Z., & Cantrell, M. L. (1980). Social interaction of exceptional and other children in a mainstreamed preschool classroom. Exceptional Children, 47, 132-141.
Field, T. M. (1980). Self, teacher, toy, and peerdirected behaviors of handicapped preschool children. In T. M. Field, S. Goldberg, D. Stem, & A. M. Sostek (Eds.), High-risk infants and children: Adult and peer interactions (pp. 313-326). New York: Academic Press.
Field, T. M., Roseman, S., DeStefano, L., & Koewler, J. H. III. (1981). Play behaviors of handicapped preschool children in the presence and absence of nonhandicapped peers. journal of Applied Developmental Psychology, 2, 49-58.
Goldman, J. A. (1981). Social participation of preschool children in same- versus mixed-age groups. Child Development, 52, 644-650.
Grossman, H.J. (Ed.). (1983). Classification in mental retardation (rev. ed.). Washington, DC: American Association on Mental Deficiency.
Guralnick, M. J. (Ed.). (1978). Early interoention and the integration of handicapped and nonhandicapped children. Baltimore: University Park Press.
Guralnick, M. J. (1980). Social interactions among preschool children. Exceptional Children, 46, 248-253.
Guralnick, M. J . (1981). The social behavior of preschool children at differe nt developmental levels: Effects of group composition.journal of Experimental Child Psychology, 31, 115-130.
Guralnick, M. J. (1986a). The peer relations of young handicapped and nonhandicapped children. In P. S. Strain, M. J. Guralnick, & H. M. Walker (Eds.), Children's social behavior: Development, assessment, and modification (pp. 93-140). New York: Academic Press.
Guralnick, M. J. (1986b). The application of child development principles and research to preschool mainstreaming. In C . J. Meisel (Ed.), Mainstreamed handicapped children: Outwmes, controversies, and new directions (pp. 21-41). Hillsdale, NJ: Erlbaum.
Guralnick, M. J., & Groom, J. M. (1985). Correlates of peer-related social competence of developmentally delayed preschool children. American]oumal of Mental Deficiency, 90, 140-150.
Guralnick, M. J., & Weinhouse, E . M. (1984). Peerrelated social interactions of developmentally delayed young children: Development and characteristics. Developmental Psychology, 20, 815-827.
Hartup, W. W. (1983). Peer relations. In E. M. Hetherington (Ed.), P. H. Mussen (Series Ed.), Handbook of child psychology: Vol. 4. Socialization, personality, and social development (pp. 103-196). New York: Wiley.
Guralnick and Groom 1571
Hauser, R. M., & Featherman, D. L. (1977). The process of stratification: Trends and analyses. New York: Academic Press.
Higgenbotham, J.. & Baker, B. M. (1981). Social participation and cognitive play diffe.rences in hearing-impaired and normally hearing preschoolers. Volta Review, 83, 135-149.
Ispa, J. (1981). Social interactions among teachers, handicapped children, and nonhandicapped children in a mainstreamed preschool. journal of Applied Developmental Psychology, 1, 231-250.
Krakow, J. B., & Kopp, C. B. (1983). The effects of developmental delay on sustained attention in young children. Child Development, 54, 1143-1155.
Mueller, C. W., & Parcel, T. L . (1981). Measures of socioeconomic status: Alte rnatives and recommendations. Child Development, 52, 13-30.
Parten, M. B. (1932). Social participation among preschool children. ]oumal of Abnormal and Social Psycliology, 27, 243-269.
Putallaz, M. (1983). Predicting children's sociometric status from their behavior. Child Development, 54, 1417-1426.
Roper, R., & Hinde, R. A. (1978). Social behavior in a play group: Consistency and complexity. Child Development, 49, 570-579.
Rubin, K. H. (1981). Manual f or coding free play behaviors of young cliildre11. Waterloo, Ontario: University of Waterloo.
Rubin, K. H. (1982). Nonsocial play in preschoolers: Necessarily evil? Child Development, 53, 651-657.
Rubin, K. H., & Krasnor, L. R. (1980). Changes in the play behaviours of preschoolers: A shortterm longitudinal investigation. Canadian journal of Behavioural Science, 12, 278-282.
Rubin, K. H., LeMare, L., & Lollis, S. (in press). Social withdrawal in childhood: Developmental pathways to peer rejection. In S. R. Asher & J. D. Coie (Eds.), Children's status In tlie peer group. New York: Cambridge University Press.
Rubin, K. H., Maioni, T. L., & Hornung, M. (1976). Free play behaviors in middle- and lower-class preschoolers: Parten and Piaget revisited. Child Development, 47, 414-419.
Rubin, K. H., & Ross, H. S. (Eds.) Peer relationships and social skills in childliood. New York: Springer-Verlag.
Rubin, K. H., Watson, K. S., & Jambor, T. W. (1978). Free-play behaviors in preschool and kindergarten children. Child Development, 49, 534-536.
SAS Institute, Inc. (1982). SAS user's guide: Statistics. Cary, NC: SAS Institute.
Schneider, B. H., Rubin, K. H., & Ledingham, J. E. (Eds.). (1985). Children's peer relations: Issues in assessment and interoention. New York: Springer-Verlag.
1572 Child Development
Shorr, D. N., McClelland, S. E., & Robinson, H. B. (1977). Corrected mental age scores for the Stanford-Binet intelligence scale. Meawrernent and Evaluation in Guidance, 10, 144-147.
Smilansky, S. (1968). The effects of sociodramatic play on disadvantaged preschool children. New York: Wiley.
Smith, P. K. (1978). A longitudinal study of social participation in preschool children: Solitary and parallel play reexamined. Developmental Psychology, 14, 517-523.
Styczynski, L. E., & Langlois, J. H. (1977). The effects of familiarity on behavioral stereotypes associated with physical attractiveness in young children. Child Development, 48, 1137-1141.
Terman, L. M., & Merrill, M. A. (1973). StanfordBinet Intelligence Scale. Boston: Houghton Milllin.
Vaughn, B. E., & Langlois, J . H. (1983). Physical attractiveness as a correlate of peer status and social competence in preschool children. Developmental Psychology, 19, 561-567.
Vandenberg, B. (1981). Environmental and cognitive factors in social play. Journal of Experimental Child Psychology, 31, 169-175.
White, B. L., & Watts, J. C. (1973). Experience and environment (Vol. 1). Englewood Cliffs, NJ: Prentice-Hall.
Wintre, M. G., & Webster, C. D . (1974). A brief report on using a traditional social behavior scale with disturbed children. Journal of Applied Behavior Analysis, 1, 345-348.
Wright, M. J. (1980). Measuring the social competence of preschool children. Canadian Journal of Behavioural Science, 12, 17-32.
Zimmerman, I. L., Steiner, V. G., & Pond, R. E. (1979). Preschool language scale manual (rev. ed.). Columbus, OH: Merrill.