Embed Size (px)
Citation preview

The Pennsylvania State University
The Graduate School
The Department of Ecosystem Science and Management
LIFE CYCLE ASSESSMENT AND EMERGY ANALYSIS
IN BIOMASS CHP ENVIRONMENTAL ACCOUNTING
A Dissertation in
Forest Resources
by
Li Ma
2013 Li Ma
Submitted in Partial Fulfillment of the Requirements
for the Degree of
Doctor of Philosophy
December 2013

The dissertation of Li Ma was reviewed and approved* by the following: Charles D. Ray Associate Professor of Wood Products Operation Dissertation advisor Chair of Committee Judd H. Michael Professor of Wood Products Business Management Michael G. Messina Professor of Forest Science Head of Department of Ecosystem Science and Management Richard C. Stehouwer Professor of Environmental Soil Science *Signatures are on file in the Graduate School

iii
ABSTRACT
This study discusses the similarities, differences, and incompatibilities between two types
of environmental accounting tools: Life Cycle Assessment (LCA) and Emergy Analysis (EMA),
both of which are used to provide environmental assessment of products and processes. LCA
methodology provides emission-focused environmental accounting by expressing all the resource
uses (material and energy) across a product's entire life as categorized environmental impacts. In
contrast, EMA methodology presents a single unit measured, energy-focused environmental
accounting by expressing all the resource consumption (material, energy and labor) in a solar
energy equivalent or solar emjoule (sej).
A significant, albeit simplified, case study – that of a wood biomass Combined Heat and
Power (CHP) system - is used to compare the results and analytically assess merits of LCA and
EMA as well as to consider possible integration of the methods. Woodchips production,
transportation, facility construction, industrial conversion to energy and disposal of wastes are
included in the analysis. A Monte Carlo simulation model is developed by taking into account
factors that have inherent uncertainty in a biomass CHP system. The results obtained from the
two methods are compared by means of uncertainty analysis, sensitivity analysis and correlation
analysis.
This research provides three key contributions.
The findings suggest that information provided by the two methods is complementary
rather than competing. Each of these two methods displays its own unique "optimal field of
application":
1) LCA is a useful assessment method to evaluate local and global environmental
impacts of the system. Its usefulness is very limited to the assessment of a specific
system. However, LCA may be and is commonly used within clearly-stated
iv
assumptions, to compare two similar processes and thereby provides environmental
sciences a continuous benchmarking tool.
2) EMA provides a more robust assessment of interconnection between an industrial
process, its recognized environmental dynamics and its economic potential. Its
capability to account for externalities expands its usefulness over a broader spectrum
of cases, but also limits its use for improvement of a specific process. The crucial
benefit of EMA is that it provides an approach aimed for maximizing utilization
efficiency of local environmental resources in supporting industrial process and
economy. Simply speaking, EMA answers the question "What is the most efficient
product or process?" while LCA answers "How can we improve environmental
efficiency of a specific product or process?"
Secondly, LCA and EMA indicators are characterized by different degrees of uncertainty:
1) Uncertainty is inherent in the current LCA approach, and cannot be overcome even if
practitioners strictly follow the procedures described in the LCA standards. Therefore,
uncertainty and sensitivity analysis should always be reported in the LCA final
results.
2) EMA indicators are subject to free environmental service and human labor associated
with the system, which are not accounted in LCA. This uncertainty analysis of EMA
adds value to the extant literature.
Given the large degree of uncertainty of the LCA results, using LCA independently as the
sole tool for decision-making in energy policy will, in some cases, cause decisions resulting in
more environmental damage and poorer economical performance than expected and understood.
Therefore, LCA can be a useful tool for a company's internal decision-making, but should not be
solely trusted to guide public policy. EMA can quantify the contribution of natural capital for

v
sustaining economic activity. The results become more accurate as the scale of environmental
area gets larger, which makes well-executed EMA a better tool for environmentally and
economically conscious policy-making.
Finally, correlation analysis reveals no significant correlation between Global Warming
Potential (GWP), the most commonly referred-to indicator in LCA, and any EMA indicators. On
the other hand, varying correlations are found among EMA indicators, suggesting the number of
EMA indicators could be reduced as they lead to similar findings. Surprisingly, biogenic CO2
emission from LCA and Transformity (Tr) in EMA are strongly correlated. This relationship
suggests that using some LCA components and methodology could possibly increase the
applicability and long-term value of EMA in environmental decision-making as it complements
the assessment perspective.
vi
TABLE OF CONTENTS
LIST OF FIGURES ........................................................................................................................ ix
LIST OF TABLES........................................................................................................................... x
ACKNOWLEDGEMENTS............................................................................................................xi
Chapter 1: PROBLEM STATEMENT AND JUSTIFICATION ..............................................1
Problem statement....................................................................................................................1 Research framework.................................................................................................................2 Research Objectives.................................................................................................................3 Research questions and hypotheses..........................................................................................4 Value of work...........................................................................................................................5
Chapter 2: LITERATURE REVIEW ........................................................................................8
Introduction..............................................................................................................................8 Life cycle assessment...............................................................................................................8
Uncertainty of LCA ........................................................................................................12 Correlation of LCA results .............................................................................................15
Emergy analysis .....................................................................................................................16 Important concepts in EMA............................................................................................17 A review of EMA studies ................................................................................................19
Joint use of LAC and EMA....................................................................................................24 Biomass combined heat and power (CHP) ............................................................................26
Biomass CHP system factors..........................................................................................27
Chapter 3: RESEARCH METHODOLOGY...........................................................................37
Introduction............................................................................................................................37 Study scope ............................................................................................................................37
System boundary ............................................................................................................37 LCA and EMA indicators ...............................................................................................37 Functional unit ...............................................................................................................38
Overview of modeling procedure...........................................................................................38 Modeling steps................................................................................................................38 Data collection in LCA...................................................................................................39 Data collection in EMA..................................................................................................40
Processes of biomass CHP system.........................................................................................41 Woodchips production....................................................................................................41 Woodchips transportation ..............................................................................................42 Plant construction ..........................................................................................................43 Plant operation/emission................................................................................................43 Chemicals use in plant ...................................................................................................44 Waste disposal................................................................................................................44 Disposal ash ...................................................................................................................44

vii
Biomass CHP system factors .................................................................................................44 Emission control.............................................................................................................45 Moisture content.............................................................................................................45 Transportation distance .................................................................................................46 Power to heat ratio.........................................................................................................46
Data analysis ..........................................................................................................................47 Uncertainty and sensitivity analysis...............................................................................47 Correlation analysis .......................................................................................................48
Chapter 4: COMPARING UNCERTAINTY AND SENSITVITY OF LCA AND EMA RESULTS IN A BIOMASS CHP SYSTEM.................................................................................58
Abstract ..................................................................................................................................59 Introduction............................................................................................................................61 Literature review....................................................................................................................62
LCA.................................................................................................................................62 EMA................................................................................................................................63 Biomass CHP factors .....................................................................................................64
Methods..................................................................................................................................66 System boundary ............................................................................................................66 System functional unit ....................................................................................................66 Modeling Procedure.......................................................................................................66 Data Analysis .................................................................................................................70
Results....................................................................................................................................70 Uncertainty of LCA ........................................................................................................70 Sensitivity Analysis of LCA.............................................................................................71 Uncertainty and sensitivity analysis of EMA..................................................................72
Discussions and conclusions ..................................................................................................76
Chapter 5: CORRELATION ANALYSIS OF CARBON FOOTPRINTING AND EMERGY INDICATORS FOR BIOMASS CHP SYSTEM ..........................................................................92
Abstract ..................................................................................................................................93 Introduction............................................................................................................................94 Literature review....................................................................................................................95
LCA.................................................................................................................................95 EMA................................................................................................................................96 Relation of LCA and EMA indictors...............................................................................98
Methods..................................................................................................................................99 System boundary ............................................................................................................99 System functional unit ....................................................................................................99 Modeling Procedure.....................................................................................................100 Statistical analysis........................................................................................................103
Results..................................................................................................................................103 Correlation analysis of LCA and EMA results.............................................................103 Correlation between GWP/Biogenic Carbon Emission and Tr....................................104
Discussion and conclusions..................................................................................................105
Chapter 6: CONCLUSIONS AND RECOMMENDATIONS...............................................117

viii
Appendix A: List of the acronyms used in dissertation ...............................................................122
Appendix B: Global Warming Potentials of substances relative to CO2 .....................................123
Appendix C: LCA calculation worksheet for biomass CHP system............................................126
Appendix D: EMA calculation worksheet for biomass CHP system...........................................127
Appendix E: Histogram of uncertain biomass CHP system factors in Monte Carlo simulation .128
Appendix F: Classification of Emergy flows for biomass CHP system ......................................129
Appendix G: A timeline of major research events.......................................................................130
Literature Cited ............................................................................................................................131

ix
LIST OF FIGURES
Figure 1-1 Research framework.......................................................................................................7
Figure 2-1 Four distinct phases of Life Cycle Assessment according to International Organization
of Standardization........................................................................................................30
Figure 2-2 LCA results uncertainty sources...................................................................................31
Figure 2-3 Representation of biosphere in the natural environment..............................................32
Figure 2-4 System diagram of Emergy flows for EMA indicators calculation .............................33
Figure 3-1 Comparison of system boundary and accounting scope between LCA and EMA in
analyzing production chain of biomass CHP system...................................................49
Figure 3-2 Monte Carlo simulation for LCA and EMA using biomass CHP system factors ........50
Figure 3-3 Lower Heating Value as a function of moisture content (wet basis) for woodchips....51
Figure 3-4 Linear relationship between power-to-heat ratio and energy efficiency for biomass
CHP plant ....................................................................................................................52
Figure 4-1 Comparison of system boundary and accounting scope between LCA and EMA in
analyzing production chain of biomass CHP system...................................................78
Figure 4-2 Box plot of GHG emission of life cycle process..........................................................79
Figure 4-3 Scatterplots for GWP against biomass CHP system factors ........................................80
Figure 4-4 Emergy inputs by life cycle process and by inputs category........................................81
Figure 4-5 Environmental decision-making tools on scale of boundary and theoretical accuracy 82
Figure 5-1 Comparison of system boundary and accounting scope between LCA and EMA in
analyzing production chain of biomass CHP system.................................................108
Figure 5-2 Correlation between GWP and EMA indicators ........................................................109
Figure 5-3 Scatterplots of transformity against LCA-based GWP ..............................................110
Figure 5-4 Scatterplots of Tr against Biogenic CO2 emission.....................................................111

x
LIST OF TABLES
Table 2-1 Key benefits and challenges of bioenergy .....................................................................34
Table 2-2 Main indicators of EMA analysis ..................................................................................35
Table 2-3 Summary of key differences in LCA, Emergy and economic accounting methods......36
Table 3-1 Main indicators of EMA................................................................................................53
Table 3-2 Emergy analysis table for production of energy from biomass CHP system ................54
Table 3-3 Summary of life cycle processes assumptions in LCA and EMA.................................55
Table 3-4 Transformity and Emergy per unit mass of used chemical ...........................................56
Table 3-5 Disposal cost of waste ...................................................................................................57
Table 4-1 EMA indicators abbreviation and formula ....................................................................83
Table 4-2 Summary of life cycle processes assumptions in LCA and EMA.................................84
Table 4-3 Transformity and Emergy per unit mass of used chemical ...........................................85
Table 4-4 Disposal cost of waste ...................................................................................................86
Table 4-5 Regression analysis of total GWP and system factors...................................................87
Table 4-6 Descriptive statistics for GWP of life cycle process......................................................88
Table 4-7 Standardized regression coefficients between life cycle processes and factors ............89
Table 4-8 Comparative EMA results from different energy systems ............................................90
Table 4-9 Descriptive statistics of Emergy indicators ...................................................................91
Table 5-1 EMA indicators abbreviation and formula ..................................................................112
Table 5-2 Summary of life cycle processes assumptions in LCA and EMA...............................113
Table 5-3 Transformity and Emergy per unit mass of used chemical .........................................114
Table 5-4 Disposal cost of waste .................................................................................................115
Table 5-5 Correlation of determination (R2) between GWP and EMA indicators ......................116

xi
ACKNOWLEDGEMENTS
I would first like to thank my advisor, Dr. Charles D. Ray for all his contributions in the
conceptualization and development of this project at Penn State. I would also like to thank the
members of my committee, Dr. Judd Michael, Dr. Michael Messina, and Dr. Richard Stehouwer
for their thoughtful advices and guidance on all aspects of my Ph.D. research. I am also grateful
to Department of Ecosystem Science and Management (formerly known as School of Forest
Resources) at Penn State University for providing financial support until I have finished the study.
Finally, thanks to my parents, my wife, and friends who helped and motivated me through the
entire course of my graduation.
1
Chapter 1: PROBLEM STATEMENT AND JUSTIFICATION
Problem statement
To evaluate environmental benefits and challenges of a biomass combined heat and power
(CHP) system, a number of accounting methods have been proposed. Life Cycle Assessment
(LCA) and Emergy Analysis (EMA) are two environmental accounting methods used to guide
bioenergy decision making (Tonon et al., 2006). LCA and EMA are widely different in many
aspects including definition, purpose, problem addressed, accounting scope, system boundary,
measurement unit, and conversion factor, as summarized in Table 2-3.
Despite the growing use of LCA to measure the sustainability of products, McElroy
(2011) pointed out that LCA has less to do with sustainability than most people think. By design,
LCA provides a way of quantifying the environmental impacts of products and services from
cradle to grave of a manufactured product. But LCA does not really measure the sustainability of
products and services, per se, or report sustainability in any other authentic sense of the term
(Bakshi, 2002). Moreover, decision making based on LCA may result in perverse decisions that
encourage reliance on deteriorating ecosystem (Zhang et al., 2010). Decisions concerning energy
use and investments in energy technology require that decision-makers have the ability to
holistically compare net yields, environmental impact, and sustainability (Zhang and Long, 2010).
Therefore, joint use of LCA with some other environmental accounting tool or tools that measure
environmental sustainability becomes necessary to better understand environmental impacts and
long-term sustainability of any production system.
Within the LCA community, researchers have pointed out the technique can yield a wide
range of results due to the different assumptions of different analysts and/or modelers (Cherubini
et al., 2009). Even for apparently similar bioenergy chains, different LCA outcomes can be
observed (Cherubini and Strømman, 2011). How does a change of assumption impact LCA
2
results, namely, what is the uncertainty of LCA results? This is the question that environmental
accounting scientists need to answer in the future. Like LCA, the results of EMA vary with
different assumption of system parameters. Although a few studies have tried to estimate EMA
indicators for biomass CHP (Al-Sulaiman et al., 2010; Sha and Hurme, 2011; Buonocore et al.,
2012), the uncertainty of the results have not yet been addressed.
Given the large number of indicators developed by different environmental accounting
methods, researchers have started to simplify indictors that could serve as proxies for
environmental performance of a system (Laurent et al., 2012). A search of LCA and EMA
literature suggests a few studies of this type have been done on LCA, but none on EMA
indicators. In the correlation studies of LCA indicators, for instance, the ecological footprint and
the cumulative energy demand from LCA were found to show significant correlation with other
environmental impact indicators (Huijbregts et al., 2006; Huijbregts et al., 2012). Another study
by Berger and Finkbeiner (2011) observed that Primary Energy Demand (PED) and Abiotic
Depletion Potential (ADP) are strongly correlated, and moderate correlations were found between
GWP and PED as well as ADP. Taking into account the significant correlations between LCA
indicators, it is suggested that the number of indicators can be reduced as they lead to similar
findings (Berger and Finkbeiner, 2011). Therefore, the correlation between LCA and EMA
indicators could help to simplify indicators for assessing environmental sustainability of the
system, develop better integration solution and improve the quality of the ultimate environmental
evaluation.
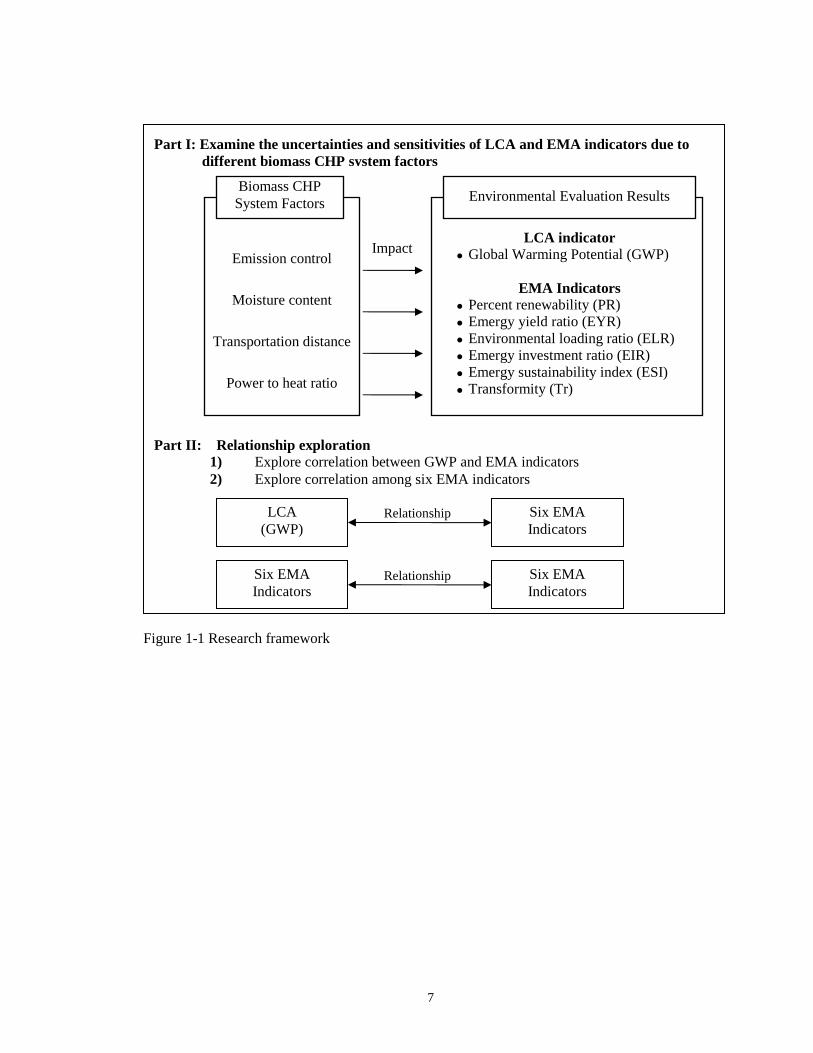
Research framework
This study contains two parts: 1) it aims to examine the uncertainties and sensitivities of
LCA and EMA outcomes due to different biomass CHP system factors; 2) it explores the
correlation between LCA-based GWP and EMA indicators, as well as the relationship between
3
CO2 equivalents and solar equivalents, which could help to reduce indicators that lead to similar
findings, and to improve the consistency and accuracy of biomass energy transformity and ease
the process of EMA for biomass energy users. The research framework for this study is displayed
below (Figure1-1).
Research Objectives
A significant, albeit simplified, case - a 6.4 MWth (1.6 MWe) wood biomass Combined
Heat and Power (CHP) system from SimaPro 7.3 database is used to compare the results and
analytically assess merits of LCA and EMA as well as possible integration of the two. The
outcomes analyzed are LCA-based GWP and six EMA indicators. Given the previous problem
statement, this study has its objectives as following:
1) The first objective is to investigate the similarities and incompatibilities between LCA
and EMA based on a wood biomass CHP system, and to discover the "optimal field of
application" for each method;
2) The second objective is to examine the uncertainties and sensitivities of LCA-based
Global Warming Potential (GWP) and EMA outcomes due to four different selected CHP system
factors, including emission control (EC), feedstock moisture content (MC), transportation
distance (TD), and power to heat ratio (PHR);
3) The third objective is to investigate the relationship between LCA-based GWP and the
selected EMA indicators to determine if there is correlation between LCA and EMA results, and
if the number of EMA indicators can be reduced.
4) The fourth objective is to explore the relationship between LCA-based GWP and
EMA-based Transformity (Tr) to see if LCA database and framework can be used in EMA for
further integration.

4
Research questions and hypotheses
Based on preceding discussion of existing literature and problems regarding these two
methods, this research intends to investigate the following specific questions:
Question 1
Are the identified biomass CHP system factors significant to the environmental
performance of biomass CHP system, in terms of GWP measured by LCA and EMA indicators?
Hypothesis: At least one of the following factors: Emission control (EC), moisture
content (MC), transportation distance (TD), and power to heat ratio (PHR) has statistically
significant impact on the environmental performance of biomass CHP system, in terms of GWP
and EMA indicators.
1) te+++++= PHR TD MC EC GWP 43210 βββββ
4 3, 2, 1, j j, oneleast at for 0:H
0:H
a
43210
=≠====
jβββββ
2) te
Tr
ESI
EIR
ELR
EYR
PR
+++++=
= PHRTDMCECindicators EMA 43210 βββββ
4 3, 2, 1, j j, oneleast at for 0:H
0:H
a
43210
=≠====
jβββββ
Question 2
What are the uncertainties and sensitivities of LCA and EMA results due to different
assumptions of biomass CHP system factors? In other words, does the change of factors impact

5
GWP and Emergy indictors of biomass CHP system differently? And to what extent do the
impacts differ?
For this research question, coefficient of variation is used to compare the difference
between LCA and EMA results
Question 3
Is there a significant linear correlation between GWP and each of EMA indicators?
indicator EMAof one as i ,0 :H
0:H
a
0
≠=
i
i
r
r
Question 4
Is there a significant linear correlation between any of the six EMA indicators?
indicators EMAare j and i ,0 :H
0:H
a
0
≠
=
ij
ij
r
r
Value of work
This study jointly uses LCA and EMA to evaluate a dynamic biomass CHP system. It is
different from previous studies in the following ways:
1) It provides a complementary view by first jointly applying two environmental
accounting methods (i.e., LCA and EMA) to evaluate the biomass CHP system. Through
the examination of the shortcomings and strengths of each methods, it provides insight
on the best use of each method;
2) Correlations between GWP and the six Emergy indictors are explored, which may help
to simplify potential indicators for assessing environmental sustainability of the system,
and to develop a better integration solution for ultimate environmental evaluation;
3) It compares the uncertainties and sensitivities of LCA and EMA case study results
related to biomass CHP system factors. This helps differentiate the uncertainty sources in

6
LCA and EMA and provides guidance for system engineers, process designers, and
policy decision-makers to seek improvements on system environmental performance;
4) The relationship between LCA-based biogenic carbon emission and EMA-based
transformity can help develop accurate and consistent methods for calculating
transformity of biomass CHP, and increase the applicability of EMA on environmental
decision making by using LCA database and framework.
7
Figure 1-1 Research framework
Relationship
Relationship
Part I: Examine the uncertainties and sensitivities of LCA and EMA indicators due to different biomass CHP system factors
Impact
Six EMA Indicators
Six EMA Indicators
Emission control
Moisture content
Transportation distance
Power to heat ratio
Biomass CHP System Factors Environmental Evaluation Results
LCA indicator � Global Warming Potential (GWP)
EMA Indicators � Percent renewability (PR) � Emergy yield ratio (EYR) � Environmental loading ratio (ELR) � Emergy investment ratio (EIR) � Emergy sustainability index (ESI) � Transformity (Tr)
Part II: Relationship exploration 1) Explore correlation between GWP and EMA indicators 2) Explore correlation among six EMA indicators
LCA (GWP)
Six EMA Indicators

8
Chapter 2: LITERATURE REVIEW
Introduction
The environmental performance of products, services and processes is gaining increased
attention in today’s world, and it is important to examine ways in which both positive and
negative effects on the environment are assessed (Zhang et al., 2010). Improving environmental
performance of an individual process does not necessarily mean less environmental impact since
the impact could be simply shifted out of the analysis boundary. This recognition urges the
environmental evaluation method to expand the analysis boundary to include the entire life cycle
of a product (Zhang et al., 2010).
Growing fossil fuels consumption is a substantial cause of the rapid increase in
greenhouse gas (GHG) emissions (IPCC, 2011). Biomass energy is considered one renewable
energy option to mitigate climate change and reduce fossil fuel consumption (Brown, 2003).
However, biomass energy development also faces many key challenges as summarized in Table
2-1. Life Cycle Assessment (LCA) and Emergy analysis (EMA) are two methods used to account
for different benefits and challenges.
Life cycle assessment
Life cycle thinking recognizes that all product life cycle stages including extracting and
processing of raw materials, manufacturing, transportation and distribution, use/reuse, recycling,
and waste management generate environmental impacts which need to be evaluated and then
reduced (Finnveden et al., 2009; Guinée et al., 2011; Rugani and Benetto, 2012). This perspective
has been the basis for the development and standardization of the Life Cycle Assessment (LCA)
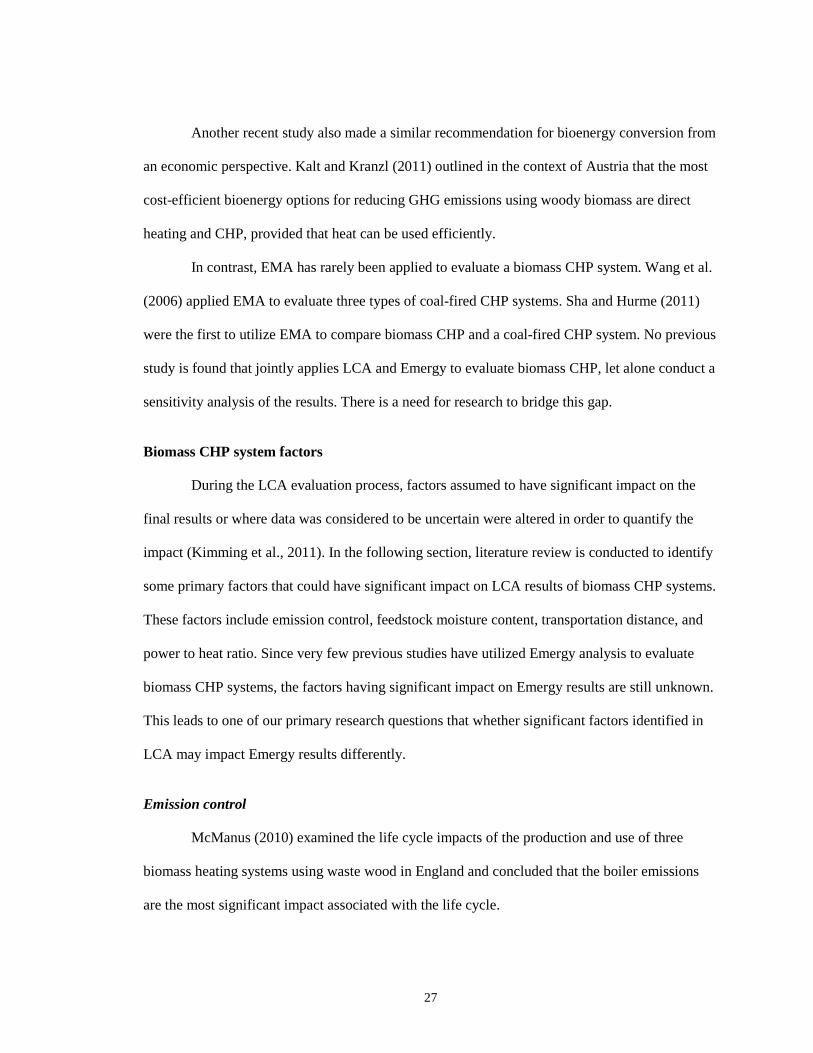
method (ISO, 2006). The standardized LCA framework is comprised of four phases: Goal and
Scope Definition, Life Cycle Inventory, Impact Assessment and Interpretation (ISO, 2006), as
shown in Figure 2-1. The phases are often interdependent in that the results of one phase will

9
inform how other phases are completed. Compared with other environmental and economic
accounting tools, LCA exhibits large differences in term of definition, purpose, problem
addressed, accounting scope, system boundary, space boundary, time boundary, measurement
unit, conversion factors and objectiveness. Table 2-3 at the end of this chapter has been compiled
as part to this study to compare LCA, EMA and Economic Cost in different aspects. Providing
information about many emissions and consumption of resources, LCA is one of the most
accepted and used tools for the environmental evaluation of products and services, and has
become a principal factor in environmental policy and energy development (Andersson, 2000;
EPA, 2012).
Although LCA was originally developed to assess the environmental burdens associated
with industrial manufacturing (Baumann and Tillman, 2004), methodological developments in
recent years have greatly improved the capacity of LCA to adequately assess the environmental
impacts of specific bioenergy systems. The majority of these studies are in the nature of
comparative. González-García et al. (2010) assessed the environmental performance of three
poplar-based ethanol applications (E10, E85 and E100) in comparison with conventional gasoline
by means of LCA approach. The findings suggest that fuel ethanol derived from poplar biomass
may help to reduce the contributions to global warming, abiotic resources depletion and ozone
layer depletion up to 62%, 72%, and 36%, respectively. Fleming et al. (2006) compared selected
life cycle-based studies of fuel alternatives for light-duty vehicles with a focus on
lignocelluloses-derived fuels including hydrogen, Fischer-Tropsch liquids, and ethanol. The
authors identified some key issues having impact on the results that are assumptions regarding
feedstock characteristics, vehicle propulsion system efficiency, land use changes and associated
carbon sequestration, nitrous oxide emissions due to agricultural practices, co-product allocation,
energy accounting practices, and expected progress on commercial-scale fuel production
processes and associated infrastructure.

10
With respect to biodiesel systems, Huo et al. (2008) investigated the life-cycle energy and
greenhouse gas (GHG) emission impacts of four soybean-derived fuels: biodiesel fuel produced
via transesterification, two renewable diesel fuels produced from different hydrogenation
processes, and renewable gasoline produced from catalytic cracking. The relative rankings of
soybean-based fuels in terms of energy and environmental impacts were found to be different
under the different allocation approaches. Results from the five allocation approaches showed that
although the production and combustion of soybean-based fuels might increase total energy use,
they could have significant benefits in reducing fossil energy use (>52%), petroleum use (>88%),
and GHG emissions (>57%) relative to petroleum fuels. This study emphasized the importance of
the methods used to deal with co-product issues and provided a comprehensive solution for
conducting a life-cycle assessment of fuel pathways with multiple co-products.
Some LCA studies have been carried out to assess the performance of different bioenergy
technologies and different feedstock. Elsayed et al., (2003) reviewed forty-three existing studies
of different biofuel technologies and produced a set of baseline energy and carbon balances for a
range of electricity, heat, combined heat and power, and transport fuel production systems based
on biomass feedstocks including wood chips from forestry residues, wood chips from short
rotation coppice, sugar beet, and wheat. Uihlein and Schebek (2009) performed LCA of a
lignocellulose feedstock biorefinery system and compared it to conventional product alternatives.
The biorefinery was found to have the greatest environmental impacts in three categories: fossil
fuel use, respiratory effects, and carcinogenics. Authors also analyzed the various variants of the
system. They noted that the optimum variant (acid and heat recoveries) yields better than fossil
alternatives, with the total environmental impacts being approximately 41% lower than those of
the fossil counterparts. Another study of Solli et al., (2009) conducted a comparative LCA of a
wood-based heating system in Norway using two stoves, one old and another modern to evaluate
the environmental effects of wood-based household heating and also estimate the total life cycle
11
benefits associated with the change from old to new combustion technology. It was found that the
new technology contributes to a significantly improved performance (28-80%) for all types of
environmental impact studied (Solli et al., 2009).
LCA has also been used to compare bioenergy systems and fossil fuel-based systems
(Eriksson et al., 2007; Steubing et al., 2011; Steubing et al., 2012). Eriksson et al. (2007)
compared the district heating system performance based on waste incineration with combustion
of biomass or natural gas by performing LCA. Their results indicate that combustion of biofuel in
a CHP is environmentally favorable and robust with respect to the avoided type of electricity and
waste management. Steubing et al. (2011) performed LCA on wood-to-synthetic natural gas
(SNG) systems for heating, electricity generation, and transportation and compared the
environmental performance with fossil and conventional wood reference systems. It was
concluded that substituting fossil technologies with SNG systems is environmentally beneficial
with regard to Global Warming Potential and for selected technologies also with regard to
aggregated environmental impact, including eutrophication, ecotoxicity, and respiratory disease
caused by inorganics. Another study by Steubing et al. (2012) developed an energy system model
comprising 13 principal fossil technologies for the production of heat, electricity, and
transportation and 173 bioenergy conversion routes. The study calculated the net environmental
benefits of substituting fossil energy with bioenergy for all approximately 1500 combinations
based on LCA results. Authors also developed an optimization model that determines the best use
of biomass availability and fossil energy utilization based on consideration of factors like
conversion efficiencies of bioenergy technologies and the kind and quantity of fossil energy
technologies that can be substituted. They concluded that optimizations for different
environmental indicators almost always indicate that woody biomass is best used for combined
heat and power generation, if coal, oil, or fuel oil based technologies can be substituted.

12
Although the extant LCA studies claim to look at bioenergy systems from a life cycle
perspective, most are limited in scope. All LCA studies focus primarily on emissions and their
impacts while ignoring the role of ecosystem goods and human labor services that industrial
processes rely upon (Odum, 1996; Urban and Bakshi, 2009; Zhang et al., 2010). Researchers have
commented that LCA suffers shortcoming of ignoring ecosystem products and services despite its
benefits and popularity (Bakshi, 2002; Duan et al., 2011). Ignoring these inputs can lead to
significant error in the analysis and misleading conclusion, since ecological services are estimated
to be twice as valuable as the global gross national product (Costanza et al., 1997). This limitation
also makes it difficult for LCA to determine the environmental sustainability of products and
processes (Bakshi, 2002).
Uncertainty of LCA
Many of the concerns that have been expressed about the accuracy of LCA results are
linked to potentially significant sources of uncertainties (Brunn, 1995; Ross et al., 2002). They
include poor data quality, invalid or non-transparent assumptions and failure to perform
sensitivity analyses (Maurice et al., 2000; Venkatesh et al., 2010). Helton (1993) noted that there
are basically two types of uncertainty present in a LCA study: objective uncertainty and
subjective uncertainty. Figure 2-2 provides different sources that lead to LCA results uncertainty
(Cherubini and Strømman, 2011). Huijbregts (1998) proposed a framework to classify types of
uncertainty and variability in LCA results, where uncertainty includes parameter uncertainty,
model uncertainty, and uncertainty due to choices, while variability covers spatial variability,
temporal variability, and variability between objects and sources. When comparing LCA results
reported by different authors and sources, a wide range of final outcomes can be observed, even
for apparently similar bioenergy chains (Cherubini and Strømman, 2011). It is suggested that
wide variation in LCA assumption and system parameters need to be considered for reducing the

13
uncertainty of LCA results (McManus, 2010; Steubing et al., 2012). Therefore, uncertainty and
sensitivity analysis are recommended or even required in LCA given the concerns over the
accuracy of its results (Steen, 1997). The International Organization for Standardization (ISO)
encourages LCA practitioners to undertake uncertainty analysis on results and conclusions, but
such analysis is not a mandatory requirement:
"Uncertainty analysis... would help to characterize uncertainty in results using ranges
and/or probability distributions to determine uncertainty in LCA results and conclusions,
whenever feasible, such analysis should be performed to better explain and support the
conclusions" (ISO, 2010).
Given the importance of the uncertainty analysis in LCA studies, much research has been
conducted to identify the uncertainty sources and to seek solutions for reducing them. Owens
(1996) presented a technical framework to evaluate the strengths and the limitations of LCA
impact assessment categories to yield accurate, useful results which indicates that the various
uncertainties in each individual category have a number of different technical origins and the
degree of uncertainty varies significant between categories. Owen (1996) concluded that
interpretation and valuation cannot presume an equivalency of processes or merit behind
numerical value for different categories. Ross et al. (2002) examined the ISO standards to
establish how they deal with uncertainties caused by the data collection during the inventory
phase and undertook an analysis of journal articles relevant to LCA uncertainties to seek how the
problem of uncertainty is handled in practice. Their findings reveal that the significance of the
limitations on the reliability of LCA results given in the standard has not been fully appreciated
by practitioners and suggest that the standards need to be revised to ensure that LCA studies
include at least a qualitative discussion on all relevant aspects of uncertainty.
Uncertainty regarding the most important environmental impact category, greenhouse gas
(GHG) emission has been given much attention in the literature. Ventakatesh et al. (2010) argued

14
that the potential greenhouse gas (GHG) emissions reductions estimated for those policies using
LCA method are predominantly based on deterministic approaches that do not account for any
uncertainty in outcomes. They used a process-based framework to examine the uncertainty of life
cycle GHG emission associated with petroleum-based fuels consumed in the United States. In the
bioenergy field, Cherubini et al. (2009) discussed the key issues in bioenergy system LCA that
have a strong influence on the final results and the overlooked uncertainty problems in the
existing literature. They noted that the energy and GHG balance of bioenergy systems differ
depending on the type of feedstock sources, conversion technologies, end-use technologies,
system boundaries and reference energy system with which the bioenergy chain is compared.
Furthermore, they suggested that regional differences can also be significant, especially with
respect to land use, biomass production patterns and the reference energy system, and the LCA
results can change as technologies evolve. The findings of Cherubini et al. (2009) reveal that all
the key issues and methodological assumptions in LCA prevent an exact quantification of the
GHG emission savings because too many variables are involved. Some of the key parameters
such as changes in soil carbon pools and nitrous oxide emissions from soils are not well known
and uncertainties cannot be completely avoided. They concluded that the presentation of LCA
results by means of probable ranges is preferred (Cherubini et al., 2009). Another study
conducted by Mullins et al. (2010) used Monte Carlo simulation to estimate life-cycle emission
distributions from ethanol and butanol from corn or switch grass and provided a wide range of the
corn ethanol emissions. The findings suggest that potential GHG emissions reductions from
displacing fossil fuels with biofuel are difficult to forecast given the high degree of uncertainty in
life cycle emissions. Mullins et al. (2010) further explained that the uncertainty is driven by the
importance and uncertainty of indirect land use change emissions and concluded that
incorporating uncertainty in the decision-making process can illuminate the risks of policy failure

15
(e.g., increased emissions), and a calculated risk of failure due to uncertainty can be used to
inform more appropriate reduction targets in future biofuel policies.
Correlation of LCA results
It is recognized that different methods provide different perspectives and sometimes
hardly comparable results (Hau and Bakshi, 2004; Sciubba and Ulgiati, 2005), the various
indicators could contribute to the complexity of interpretation and decision making. Corporations
and authorities often aim for simplicity and thus use tools for which data are readily available.
Because this might result in environmental policies solely relying on these indictors, it calls for
guaranteeing a proper reflection of the whole environmental burden (Laurent et al., 2012). A
search of LCA literature suggests correlation analysis has often been used to check the
dependencies among different indicators and ultimately to simplify LCA indicators.
Huijbregts et al. (2006) examined the correlation between the fossil cumulative energy
demand (CED) and environmental life-cycle impacts and the results show that for all products
groups but waste treatment, the fossil CED correlates well with most impact categories, such as
global warming, resource depletion, and human toxicity. Then Huijbregts et al. (2006) concluded
that the use of fossil fuels is an important driver of several environmental impacts and it may
therefore serve as a screening indicator for environmental performance. Another study by Berger
and Finkbeiner (2011) used 100 materials from the GaBi and Ecoinvent databases to observe the
correlation between resources- and emission-oriented indicators. The findings show that Primary
Energy Demand (PED) and Abiotic Depletion Potential (ADP) are strongly correlated, and a
moderate correlation was found between GWP and PED as well as ADP. Laurent et al. (2012)
modeled and analyzed the life cycle impacts from about 4,000 different products, technologies,
and services taken from several sectors, including energy generation, transportation, material
production, infrastructure, and waste management to investigate the limitations of Carbon
16
Footprint (CFP) as indicator of environmental sustainability. By examining the correlations
between the CFP and thirteen other impact categories, the study shows that some environmental
impacts, notably those related to emissions of toxic substances, often do not co-vary with climate
change impacts. In such situation, CFP is a poor representative of the environmental burden of
products, and environmental management focused exclusively on CFP runs the risk of
inadvertently shifting the problem to other environmental impacts when products are optimized to
become more “green”.
Emergy analysis
Emergy analysis (EMA) is an energy-based environmental accounting method that
expresses all the process inputs (i.e., energy, raw material, human service, etc.) and output
products in solar energy equivalent joules (Sej). Emergy measures how much energy would be
needed to do a particular task if solar radiation were the only input. The theory is based on the
fact that earth has one principal energy input: solar energy (Odum, 1996). Besides solar energy,
the other major energy inputs are tidal energy and crustal heat sourced from moon-earth
interaction and earth core, which are both converted to solar equivalents in EMA accounting
theory (Odum, 1996). In EMA theory, all the activities on earth are driven by solar energy
(Hermann, 2006): fossil fuels formation represents millions of years of embodied energy from the
sun and geological activities (Odum, 1996); wind, rain, rivers are initiated by more recent solar
energy; plant growth depends on mineral, rain and solar insolation; even money is related to
Emergy by considering the circulation of money through the environmental-economic
interface(Odum, 1996). Therefore, every product or service is comprised of some amount of solar
energy in term of energy. EMA can be used as a method for assessing the performance of the
plant on the larger time and space scales of biosphere, thus EMA is a sustainability assessment
tool (Brown and Ulgiati, 1997).

17
EMA differs from LCA on space boundary. EMA evaluates the environmental
performance of the system from biosphere perspective, while LCA employs an atmosphere
perspective. The biosphere is the global sum of all ecosystems (CUP, 2008). From the broadest
biophysiological point of view, the biosphere is the global ecological system integrating all living
beings and their relationships, including their interaction with the elements of the lithosphere,
hydrosphere, and atmosphere (Campbell et al., 2006). Figure 2-3 below depicts the differences
between biosphere and atmosphere (Simpson and Edwards, 2013).
Important concepts in EMA
Emergy and Money
EMA evaluation classifies inputs into different categories (i.e., renewable inputs - R,
non-renewable inputs - N, and purchased inputs - F), as the system diagram shown in Figure 2-4.
Purchased resources and services (F) are included in the EMA by using investment cost and an
Emergy-money index. The Emergy-money index indicates solar Emergy per unit of money
(Sej/$), which is calculated as ratio of total solar Emergy a nation used in one year to its Gross
National Product (GNP) (Cao and Feng, 2007). Total solar Emergy used by the U.S. in one year
is estimated by use of coal, natural gas, crude oil, uranium, iron ore, aluminum ore, and wood, as
well as sunlight, rain and wind for a whole year (Odum, 1996).
EMA indicators
Based on the classes of EMA inputs as shown in Figure 2-4, EMA indicators can be
computed in order to assess the advantage and disadvantage of system alternatives (Pizzigallo et
al., 2008). Six of the most commonly used ratios or indicators extracted from existing literature to
evaluate the sustainability of different systems (Ulgiati et al., 1995; Bastianoni and Marchettini,
2000; Sha and Hurme, 2011) are given in Table 2-2.

18
1) The Percent Renewability (PR) gives degree of renewability. The higher PR value
indicates higher renewability of the process. Among the existing Emergy-based
indicators, Percent Renewable (PR) represents the first measure of system
sustainability: the lower the fraction of renewable Emergy used, the higher the pressure
on the environment (Zhang and Long, 2010). Brown and Ulgiati (Brown and Ulgiati,
1997) suggested that only processes with high values of this index are sustainable in the
long run.
2) Emergy Yield Ratio (EYR) measures how much a process will contribute to the
economy, also indicating how dependent the process is on the purchased inputs. The
higher EYR value indicates a larger amount of products obtained per unit of money
spent. This index indicates the efficiency of the system using purchased inputs (Ortega
et al., 2005).
3) Environmental Loading Ratio (ELR) is given by the ratio between non-renewable and
imported Emergy used to renewable Emergy used. It represents the pressure of a
transformation process on the environment and can be considered as a measure of
ecosystem stress due to production (Ulgiati and Brown, 1998). A higher value of ELR
indicates that environmental cycles are overloaded (Pizzigallo et al., 2008).
4) Emergy Investment Ratio (EIR) is the ratio of Emergy of purchased inputs to the
indigenous Emergy input (both renewable and non-renewable), which evaluates
whether a process is an economical user of the Emergy invested in comparison with
alternatives (Brown and Ulgiati, 1997; Zhang and Long, 2010). A high level of EIR
represents a certain fragility of the system due to its dependence on inputs from other
economic systems (Pizzigallo et al., 2008).
5) Emergy Sustainability Index (ESI) is the ratio of the Emergy Yield Ratio (EYR) to the
environmental loading ratio (ELR), which measures the potential contribution of a

19
resource or process to the economy per unit of environmental loading (Zhang and Long,
2010). It is an aggregate measure of economic performance and sustainability of the
system considering both the contribution of renewable vs. non-renewable resources and
the need of purchased inputs to drive the process (Mirandola et al., 2010). To be
sustainable in the long run, a system should have a high EYR and low ELR, producing
a high ESI value (Sha and Hurme, 2011).
6) Transformity (Tr) is the amount of solar energy required to make one unit of a given
product (Odum, 1996). The larger transformity, the greater the ecological support
required to produce that product (Baral and Bakshi, 2010). The solar transformity is
very important for any Emergy study because all input flows, including materials,
energies, and currency, must first be transferred into Emergy units using appropriate
transformities. A lower transformity indicates that less solar energy is needed to
produce a given unit of product; it is one important Emergy indicator when comparing
different systems producing the same product (Peng et al., 2008; Mirandola et al.,
2010)
A review of EMA studies
Since the 1980s, EMA has been used to evaluate systems as diverse as agricultural
systems, ecological systems, industrial systems and economic systems (Brown and Ulgiati, 1997;
Brown and Ulgiati, 2002; Brown and Ulgiati, 2004; Yang et al., 2010; Ciotola et al., 2011; Ju and
Chen, 2011). Brown and Ulgiati (2002) used EMA to evaluate six electricity production systems
regarding their relative thermodynamic and environmental efficiencies. The production systems
studied included plants using both nonrenewable energy sources (natural gas, oil, and coal
thermal plants) and the so-called renewable energy sources (geothermal, hydroelectric, and wind
plants). It was concluded that environmental loading was highest with coal-thermal plants. Using

20
an Emergy index of sustainability, the study quantitatively showed how renewable energy source
plants like wind, hydroelectric, and geothermal had higher sustainability compared to thermal
plants. Ciotola et al. (2011) assessed the relative sustainability and environmental impact of
small-scale energy production using Taiwanese model plug-flow anaerobic digesters to treat
livestock manure in Costa Rica by means of EMA. The authors reported the EMA results
including the fraction of Emergy inputs from renewable sources, Emergy Yield Ratios, Emergy
Sustainability Index, and Environmental Loading Ratio for both biogas production and electricity
generation from the biogas. The results demonstrated that the production of biogas and the
generation of electricity from biogas are environmentally sustainable processes that result in the
production of energy that is largely dependent on renewable and recycled energies. Ju and Chen
(2011) presented an ecological accounting framework based on embodied energy, EMA, and CO2
emission from the whole production chain of biodiesel made from Jatropha curcas L. (JCL) oil.
In order to shed a better light into investigated production system, the authors compared the
results with bioethanol production from wheat in China and corn-ethanol production in Italy. The
findings of Ju and Chen's study suggest that EMA considering the environmental work as input
flows to support the ecosystem and human-dominated production system is a more suitable mode
for the cost or ecological footprint analysis compared to embodied energy metrics.
On a large scale, Yang et al. (2010) used EMA to evaluate the Chinese economy. A
unified evaluation integrating various forms of energy sources and natural resources, products and
services, and imports and exports was carried out systematically at the national scale for the
booming Chinese economy from 1978 to 2005, based on the solar Emergy from EMA. It was
shown that the development of the economy is heavily dependent on the consumption of
non-renewable natural resources.
With the increasingly important role that bioenergy plays in economic development and
environmental protection, EMA is being increasingly applied to bioenergy systems. Dong et al.
21
(2008) used EMA to evaluate the environmental performance of ethanol production from wheat
and corn in the two agro-industrial systems. The study reported the EMA results for wheat-based
ethanol and corn-based ethanol including the output/input energy ratio, transformity,
Renewability, Emergy Yield Ratio, Environmental Loading Ratio, and Emergy Sustainability
Index. The comparisons show that bioethanol from food crops is not a sustainable source of fuel.
Another study by Pereira and Ortega (2010) assessed the sustainability of ethanol produced from
sugarcane and examined the environmental feasibility of a large-scale production through the use
of fossil fuel embodied energy and EMA. The findings show that the Transformity of ethanol is
about the same as those calculated for fossil fuels, and the Renewability of ethanol is 30%. It was
suggested that sugarcane and ethanol products exhibit low renewability when a large-scale system
is adopted.
Alonso-pippo et al. (2004) applied EMA to bio-oil production using sugarcane biomass
residues. Emergy ratios obtained for bio-oil production including Transformity, Emergy Yield
Ratio, Environmental Loading Ratio, Renewability, Emergy Investment Ratio, Emergy Exchange
Ratio, and Emergy Sustainability Index were reported. Further, the authors identified the
tendencies that will affect the bio-oil production from energy, environmental, economical, and
social points of view.
Cavalett and Ortega (2010) and Sheng et al. (2007) evaluated biodiesel production using
EMA. Cavalett and Ortega (2010) presented the results of an environmental impact assessment of
biodiesel production from soybean in Brazil based on EMA, embodied energy analysis and
material flow accounting. The transformity of biodiesel was found to be higher than those
calculated for fossil fuel, indicating a higher demand for direct and indirect environmental
support in order to produce the biodiesel. The findings show that when crop production and
industrial conversion to fuel are supported by fossil fuels in the form of chemicals, goods, and
process energy, the fraction of fuel that can actually be considered renewable is very low.
22
There have been several studies using EMA to evaluate combined heat and power
systems (CHP) from various feedstock. Feng et al. (2005) compared a conventional coal-fired
process with two designs of waste incineration CHP plants. Wang et al. (2005) used the Emergy
approach to analyze an eco-industrial park with three alternative types of coal-fired CHP power
plant. The park with coal-fired integrated gasification combined cycle plant was found to be more
sustainable than the coal-fired pressurized fluidized bed combustion combined cycle or the
pulverized coal-fired CHP plant. Peng et al. (2008) used Emergy to evaluate three operatioal
modes of the Jiufa coal-fired CHP plant in Shandong China in an eco-industrial park context.
Their results showed that small coal-based CHP plants have lower energy efficiency, higher
environmental loading, and lower sustainability than large fossil fuel and renewable energy-based
systems. Al-Sulaiman et al. (2011) studied an integrated organic rankine cycle (ORC) process
with a biomass combustor for combined cooling, heating, and power production as a trigeneration
system by exergy assessment. Bargigli et al. (2010) studied three natural gas CHP processes (gas
turbine, internal combustion engine and a fuel cell hybrid system), also using Emergy evaluation.
No conventional CHP boiler plants were included in the analysis.
However, Sha and Hurme (2011) were the first to apply EMA in the biomass CHP
production system. Biomass and coal-based CHP alternatives were compared with independent
production of heat and power in this study. It was found that biomass-based cogeneration is 3.3
times more Emergy-efficient than coal-based independent production, heat and power production
from biomass is 2.3 times more Emergy-efficient than that from coal in a similar process; and the
Emergy sustainability index of biomass CHP plant is 15 times higher than that of a coal CHP
plant. Despite the increasing interest of EMA for bioenergy system evaluation, studies on
biomass CHP plants using forest wood or wood waste are limited.
It is suggested that EMA is a promising tool to support environmental management
actions and public dynamics of a territorial system (Campbell, 1998; Pulselli, 2010; Pulselli et al.,
23
2008). It goes beyond the accounting scope of LCA by evaluating the environmental work needed
for natural resources formation. In this application, two key features of EMA over LCA were
shown to be:
1) By using a common unit (i.e., Sej), EMA allows all resources to be compared on a fair
basis;
2) By equating Sej value to economic cost, it allows easier understanding by non-technical
audience, and compensates for the inability of money to value non-market inputs in an
objective manner (Hau and Bakshi, 2004).
However, EMA has been criticized for sweeping generalizations that still remain
unproven, in particular, the calculation of transformity (Hau and Bakshi, 2004; Rugani and
Benetto, 2012). Transformity is the conversion factor in EMA to convert material and energy
items in Sej, which is the Emergy amount required to make one unit of a given product of service
(Odum, 1988; Odum, 1996). The calculation of Transformity is rooted on the “Baseline concept”
(Odum, 1996; Odum et al., 2000; Brown and Ulgiati, 2010; Brown et al., 2011). The transformity
of a given resource (e.g., mineral, water, biomass) is quantified by dividing the baseline to the
total annual quantity of that resource, estimated by the ratio of the stored quantity of its turnover
time (Odum et al., 2000; Rugani et al., 2011), where the Emergy baseline is the sum of solar
radiation Emergy, tids Emergy, and geothermal heat Emergy (Rugani and Benetto, 2012).
Literature studies, rather than overtly confuting the baseline concept (i.e., sun, tide, and geo) are
weighted differently (Odum, 1996; Campbell, 2000; Odum et al., 2000). Sciubba identified
several uncertainty issues behind the Emergy calculation of these three primary inputs to the
geobiosphere (Sciubba, 2010). Because transformities are calculated through a sort of pyramidal
process starting from the baseline, it is not surprising to find large inconsistencies (Campbell,
2000). Furthermore, transformity calculation is based rather crude assumptions and results are
therefore seldom reproducible (Sciubba, 2010).

24
In the EMA community, a large effort has been spent to provide a uniform approach and
to increase transformity robustness. For instance, the National Environmental Accounting
Database (NEAD) addressed a global formalization of EMA (Sweeney et al., 2007). However,
this framework includes sets of aggregated and unclear data and results are therefore only useful
for comparisons at national scale (Sweeney et al., 2007). Another effort by Rugani and Benetto
(2012) provided framework to improve EMA evaluation by using LCA. The LCA method has the
great advantage of using structured software tools and large databases that make the operational
framework more flexible. In this context, it appears that the use of detailed network models
typically considered in LCA may allow improvement of the accuracy of Emergy calculations
(Raugei et al., 2006; Ulgiati et al., 2006; Ingwersen, 2011; Rugani et al., 2011).
Joint use of LAC and EMA
Given the shortcomings and advantages of both LCA and EMA, researchers have started
to jointly use them to provide complementary evaluation of products and/or processes, and/or to
seek possible integration of these two methods to provide encompassing tools for environmental
sustainability evaluation. Emergy analyses have been used for a multitude of LCA-related
purposes, including to measure cumulative energy consumption (Federici et al., 2008), to
compare environmental performance of process alternatives (La Rosa et al., 2008), to create
indices for measuring sustainability (Brown and Ulgiati, 1997), to quantify the resource base of
ecosystems (Tilley, 2003), to measure environmental carrying capacity (Cuadra and Björklund,
2007), and for nonmarket-based evaluation (Odum and Odum, 2000).
Brown and Buranakarn (2003) noted that main drawback in LCA is that the ranking and
indicators that result are of mixed units which often make comparative analysis between products
or services difficult; accordingly, they developed an Emergy-Life-Cycle-Assessment
methodology by extending Emergy to include disposal and recycling processes as a way of
25
accounting for materials, energy, and human services of building materials and three different
recycle trajectories. Their findings suggest that recycle of wood may not be advantageous on a
large scale, but metals, plastic, and glass have very positive benefits. With respect to the recycle
systems, it was concluded that materials having large refining costs have greatest potential for
high recycle benefits and that highest benefits appear to accrue from material recycle systems,
followed by adaptive reuse systems and then by byproduct reuse systems.
Pizzigallo et al. (2008) evaluated two agro-industrial productive processes in their
entirety: one organic and one semi-industrial to compare the impacts derived from the inputs and
outputs of the system using LCA, integrated with a physical evaluation of the resources and
natural services on a common basis using EMA. They noted that the joint use of LCA and EMA
contributes important elements and information useful for the comprehension of the organization
of agricultural processes and for the use of energy flows that determine their development.
Moreover, it was concluded that the combined use of the two methods gives a comparative
thermodynamic performance evaluation between organic and semi-industrial farming.
Ingwersen (2011) proposed using EMA as an indicator of aggregate resource use for
LCA based on data from the life cycle inventory of a large mine in Peru. Ingwersen (2011)
expanded the system boundary beyond traditional LCA to include flows of energy underlying the
creation of resources used as inputs to the foreground and background processes, and extracted
the relevant Emergy data from previous Emergy analyses as well as data from LCA database.
Some challenges for a theoretically and procedurally consistent integration of EMA and LCA
were discussed, including the complexities and potential inconsistencies of integrating Emergy
into LCA on issues like allocation, and the uncertainty in unit Emergy values due to the
differences in different models used to estimate Emergy in minerals.
The incorporation of EMA in LCA could enhance the ability of LCA studies to achieve
multiple purposes such as measuring cumulative energy consumption and evaluate system

26
sustainability. However, no such integration has been applied to any type of bioenergy system
yet.
Biomass combined heat and power (CHP)
Biomass energy is essentially solar energy being converted to chemical energy stored in
plants through photosynthesis (McKendry, 2002). Biomass can be used to produce heat,
electricity or transport fuels through various bioenergy conversion routes. Despite concerns over
biomass availability, it is claimed that biomass is more flexible and reliable as an energy source to
replace fossil fuels than others, such as sunlight, wind, geothermal heat, etc (Zhang and Long,
2010). Currently, most electricity is produced in independent production, where heat is lost. The
advantages of biomass CHP include a higher total efficiency than in conventional power plants
and consequent reduction of greenhouse gas and other pollutants, provided the heat can be
utilized as a by-product. From the local point of view, the application of biomass energy can
contribute to sustainable development in multiple regards, not only from the environmental aspect
but also in social ways, and by enhancing the local economy due to the demand for biomass in the
proximity of the power plant. In general, biomass-fired CHP systems are considered to have a
great market potential (Dong et al., 2009).
Two key factors determining optimal use of biomass are the conversion efficiency of
bioenergy technologies, and the kind of fossil energy technologies that can be substituted
(Steubing et al., 2012). A biomass CHP system, cogenerating electricity and usable heat in a
single unit, can enhance the overall efficiency up to 85% compared to only 50% overall
efficiency when heat and power are generated separately (Pirouti et al., 2010). Steubing et al.
(2012) suggested biomass is best used for combined heat and power production from
environmental aspects evaluated by LCA, if heat can be used efficiently and coal, oil or fuel oil
based technologies can be replaced in the process.
27
Another recent study also made a similar recommendation for bioenergy conversion from
an economic perspective. Kalt and Kranzl (2011) outlined in the context of Austria that the most
cost-efficient bioenergy options for reducing GHG emissions using woody biomass are direct
heating and CHP, provided that heat can be used efficiently.
In contrast, EMA has rarely been applied to evaluate a biomass CHP system. Wang et al.
(2006) applied EMA to evaluate three types of coal-fired CHP systems. Sha and Hurme (2011)
were the first to utilize EMA to compare biomass CHP and a coal-fired CHP system. No previous
study is found that jointly applies LCA and Emergy to evaluate biomass CHP, let alone conduct a
sensitivity analysis of the results. There is a need for research to bridge this gap.
Biomass CHP system factors
During the LCA evaluation process, factors assumed to have significant impact on the
final results or where data was considered to be uncertain were altered in order to quantify the
impact (Kimming et al., 2011). In the following section, literature review is conducted to identify
some primary factors that could have significant impact on LCA results of biomass CHP systems.
These factors include emission control, feedstock moisture content, transportation distance, and
power to heat ratio. Since very few previous studies have utilized Emergy analysis to evaluate
biomass CHP systems, the factors having significant impact on Emergy results are still unknown.
This leads to one of our primary research questions that whether significant factors identified in
LCA may impact Emergy results differently.
Emission control
McManus (2010) examined the life cycle impacts of the production and use of three
biomass heating systems using waste wood in England and concluded that the boiler emissions
are the most significant impact associated with the life cycle.

28
Feedstock moisture content
Energy density and heating value of biomass fuel change according to fuel type, fuel
composition and moisture content which in turn lead to disturbance in system operation
performance (Pirouti et al., 2010). Pirouti (2010) examined the effect of moisture content in
biomass fuel on system performance, ranging from 15 to 30%, and found that the impact of
moisture content is significant on the operation of the system.
Transportation distance
LCA includes the entire life-cycle of the product, process or activity, encompassing
extracting and processing raw materials; manufacturing; transportation and distribution; use,
re-use; maintenance; recycling and final disposal (Consoli et al., 1993). Transport distance
occurring between nearly any two process steps of a product or process system is often of major
importance for a product/process life cycle, and in turn the LCA outcomes (Spielmann and Scholz,
2005). This has been demonstrated in evaluation of different products and/or processes. For
instance, Solli et al. (2009) performed LCA on wood-based household heating system and found
that firewood transportation distances played an important role in the life cycle. A study of LCA
on U.S. industry-average corrugated product found that transportation represented a significant
factor impacting the overall life-cycle impacts for Global Warming Potential (CPA, 2010). Pisoni
et al. (2009) conducted LCA on provincial waste management plan and found that major potential
impacts of the plan are associated with waste collection and transport, they further recommended
that neglecting the effects of transport might result in a severe underestimation of the
environmental impacts.
Power-to-heat ratio
Power-to-heat ratio (PHR) indicates the ratio of generated power to the generation of
heat/steam on the basis of the same energy unit. PHR is one important concept related to CHP

29
efficiency (EPA, 2008). Both an EPA report (2008) and the study of Van Loo (2008) indicate
overall efficiency of biomass CHP systems may decrease when PHR increases. Several previous
studies pointed out that system overall efficiency can have a strong influence on the LCA results
(Cherubini et al., 2009; Solli et al., 2009; Steubing et al., 2012).
In summary, the impacts of emission control, feedstock moisture content, transportation
distance, and power-to-heat ratio on LCA results allow an identification of opportunities for
environmental improvement of a biomass CHP system. But, the influence of these factors on
EMA outcomes remains unknown. With the ability to determine the environmental sustainability
of systems, knowledge about the influences of these factors on EMA results (i.e., the six
indicators shown in Table 2-2) could help in developing strategies to improve sustainability
performance of the biomass CHP system.
30
Figure 2-1 Four distinct phases of Life Cycle Assessment according to International Organization of Standardization
Goal and Scope Definition
Inventory Analysis
Impact Assessment
Interpretation

31
Figure 2-2 LCA results uncertainty sources
LCA results
uncertainty
Objective
source
Subjective
source
System
parameters
System
boundary
Reference
system
Functional
unit
Allocation Accounting
scope

32
Figure 2-3 Representation of biosphere in the natural environment
Source: (Simpson and Edwards, 2013)

33
Figure 2-4 System diagram of Emergy flows for EMA indicators calculation
Source: (Odum, 1996)

34
Table 2-1 Key benefits and challenges of bioenergy
Key benefits of bioenergy Key challenges of bioenergy
� Renewability – renewable energy source for power, heat and transport
� Mitigation of climate change – significantly reduce GHGs emission compared to fossil fuels
� Energy security – diversify energy mix � Rural development – develop feedstock
for new markets � Retention of local energy dollar
� Ensuring sustainability – environmental, social and economic
� Guarding food security – ensure increase demand on bioenergy does not affect the hunger
� Protecting biodiversity � Managing competition for land and water � Controlling pollution of air, water and
soil. � Lower energy density increases logistical
resources and energy costs Sources: (Hazell et al., 2006; Cherubini and Strømman, 2011)

35
Table 2-2 Main indicators of EMA analysis
Number Term Abbreviation and formula Unit 1) Percent Renewability PR= R/(R+N+F) ratio 2) Emergy Yield Ratio EYR= Y/F ratio 3) Environmental Loading Ratio ELR=(F+N)/R ratio 4) Emergy Investment Ratio EIR= F/(R+N) ratio 5) Emergy Sustainability Index ESI= EYR/ELR ratio 6) Transformity Tr=R+N+F Sej/J

36
Table 2-3 Summary of key differences in LCA, Emergy and economic accounting methods
LCA Emergy Economic cost
Definition A method for assessing the environmental burden, and material and energy consumption of a product or a process across its entire life (ISO, 2010).
The availability of energy of one kind that is used up directly and indirectly to make a product or service (Odum, 1996).
A technique to obtain the approximation of project cost (Brown, 2003).
Purpose To compare the full range of environmental performances of alternative product systems for meeting the same end-use function, from a broad, societal perspective (Norris, 2001).
To present an energetic basis for quantification of valuation of ecological goods and services, from a biosphere perspective, based on thermodynamic approach(Zhang et al., 2010).
To predict probable capital cost and operating cost of a specific project, from an individual owner or investor perspective
Problem addressed
Environmental impacts Sustainability Economic Cost and benefit
Accounting scope
Primarily consider fossil fuels and minerals; Recent focus on land, water, and other service; Ignore fish, plant, genetic resources; Completely ignore supporting services (Zhang et al., 2010).
Can account for renewable and nonrenewable material and energy resources; Also account for land use and food; Consider quality difference by conversion to solar equivalents; Supporting services are considered (Zhang et al., 2010).
Capital cost: the amount of money to build a plant/facility and includes all equipments and labor associated with installation of the equipments (Brown, 2003); Operating cost: the annual expense to keep a plant in full production. It includes cost of feedstock and fuel, labor, payment of principle and interest on loans (Brown, 2003).
System boundary
When entering economic system Before entering economic system Within economic system
Space boundary
Regional and global atmosphere Biosphere Physical boundary of a plant or facility.
Time boundary
Time boundary is mostly ignored. The timing of process, emission release or consumption rate is ignored. Some impact assessment may address on fixed time, such as IPCC 2007 addresses global warming potential on 100-year time horizon.
Very large time boundary. Traveling backward in the history of thermodynamics transformation of energy, to account for solar energy used to produce resources.
Timing is critical. Focusing on present value. Specific time zone is adopted, and any cost or benefits occurring outside that range are ignored.
Measurement unit
Midpoint: No single unit (e.g.: kg CO2 eq., H+ moles eq., kg benzene eq. etc.) Endpoint: Eco-indicator single point (Pt)
Sej (solar equivalent joules) Monetary unit (e.g. US dollar)
Conversion factor
Characterization factors: emission in equivalent of another chemical
Transformities: the ratio of Emergy to available energy, or the solar Emergy required to make 1 J of a service or product (Odum, 1996)
Monetary value: the value that a product or service will bring to someone if sold
Objectiveness Objective evaluation at Midpoint, Involving subjectivity at Endpoint
Objective evaluation Subjective evaluation due to human preference, money is also subject to inflation and exchange rate

37
Chapter 3: RESEARCH METHODOLOGY
Introduction
This study aims to investigate the similarities, differences, and incompatibilities between
LCA and EMA results. The uncertainties of LCA and EMA indicators due to different
assumptions of biomass CHP system factors were examined by means of uncertainty and
sensitivity analyses. And the relationship between LCA and EMA indicators were explored
through correlation analysis.
In this study, the uncertainty in LCA and EMA results associated with a biomass CHP
system is determined using a process-based framework and statistical modeling methods.
Probability distributions fitted to available data were used to represent uncertain parameters of
biomass CHP system in the LCA and EMA model. Where data were not readily available, a
partial least-squares (PLS) regression model based on existing data was developed. Finally, a
Monte Carlo simulation was performed to generate sample output distributions for further data
analysis.
Study scope
System boundary
The life cycle of biomass CHP system is divided into seven processes listed in Figure 3-1.
These seven processes were defined as the case study system boundary in both LCA and EMA.
The detailed accounting scope of LCA is presented on the left side of Figure 3-1 within dashed
lines; the EMA scope is detailed on the right side of the figure.
LCA and EMA indicators
Since climate change mitigation and energy independence are the main driving forces for
future bioenergy (Cherubini and Jungmeier, 2010), in this study, LCA results are presented only

38
with reference to a single environmental indicator, namely, Global Warming Potential (GWP),
measured in kgCO2/MMBtu in the IPCC 2007 climate change impact assessment method on a
100-year time horizon (Appendix B). Meanwhile, the main six indicators (Table 3-1) commonly
used by previous bioenergy EMA studies are selected.
Functional unit
The reference functional unit used in this study for GWP and Transformity (Tr) is 1
MMBtu thermal energy generation. The allocation criteria for the analysis is that 1 MMBtu of
electricity is equal to 3 MMBtu of heat when electricity is used in heat pump for heat generation
(Van Loo and Koppejan, 2008; Abusoglu and Kanoglu, 2009).
Overview of modeling procedure
Modeling steps
Monte Carlo simulation was used in this study to compare LCA and EMA results in
terms of uncertainty, sensitivity, and correlation. Monte Carlo simulation use repeated random
sampling to simulate data for a given mathematical model and evaluate the outcome. Simulated
data was routinely used in situations where resources are limited or gathering real data would be
too expensive or impractical (Hung and Ma, 2009). The relationships of biomass CHP system
factors to LCA and EMA outcomes were used to develop the simulation model, which are
illustrated in Figure 3-2. The Monte Carlo simulation in this study consists of four steps as
follows:
Step 1: Develop LCA and EMA model for a specific case
A 6.4 MWth wood biomass CHP system in Europe was extracted from SimaPro 7.3
database as the case study subject. The reasons for choosing this case are: it presents the average
biomass CHP system in Europe and its life cycle inventory data was validated. For LCA study,

39
the entire life cycle of wood biomass CHP system was divided into seven processes. For EMA
study, the same life cycle processes are applied, but the inputs were classified into three groups as
required by EMA study, i.e., R-Renewable inputs, N-Nonrenewable inputs and F-Purchased
inputs.
Step 2: Define input parameters
This step was to identify input parameters that are highly uncertain and have significant
impacts on bioenergy life cycle environmental performance, and to determine the mean, standard
deviation and distribution that are most likely to encounter for each parameter. Four input
parameters of biomass CHP system were extracted from the literature, including: Emission
control (EC), feedstock moisture content (MC), transportation distance (TD), and power to heat
ratio (PHR). The detailed assumption descriptions for these four input parameters can be seen in
the later section of "Biomass CHP system factors".
Step 3: Create random data
Based on an assumed mean, standard deviation and distribution probability for each
uncertain factor identified in step 2, a large random data set for each factor was created, one
thousand sample points for each factor.
Step 4: Simulate and analyze process output
With the simulated input data in place, LCA and EMA models were used to calculate
simulated outcomes.
Data collection in LCA
In this study, LCA results are presented only with reference to a single environmental
indicator, namely, Global Warming Potential (GWP), measured in kgCO2/MMBtu in the IPCC
2007 climate change impact assessment method on 100-year time horizon. GWP was measured

40
by the total greenhouse gas emissions associated with all seven processes of biomass CHP system
(see below) which are available in the SimaPro 7.3 database. The calculation worksheet of LCA
results are outlined in Appendix C. Each life cycle process is shown as function of biomass CHP
system factors, as described below:
( )
PHR)(MC, F ash l Disposa
(PHR) F wastel Disposa
PHR)(EC, F emission Plant
PHR)(EC, Fplant in use Chemical
(PHR) F onconstructi Plant
PHR)TD, (MC, F ation transportWoodchips
PHRMC, F production Woodchips :Where
ash) Disposal waste, Disposalemission, Plant plant, in use Chemical on,constructiPlant
ation, transportWoodchips ,production (Woodchips of Sum eq./MMBtu) CO2 (kg GWP
===
==
==
=
Data collection in EMA
The same assumptions were used in EMA as specified in the LCA. All inputs were
re-classified into three groups on the common basis of solar energy equivalents, i.e.,
R-Renewable inputs, N-Nonrenewable inputs and F-Purchased inputs, as shown in Table 3-2.
Renewable inputs, Nonrenewable inputs and Purchased inputs are shown as functions of biomass
CHP system factors shown below. EMA indicators were calculated by ratios and sums using R, N
and F follow the methodology and numerical quantities used by Odum (1996). Appendix D
outlines the calculation of Emergy inputs for the biomass CHP system.

41
++
++
++++
=
=
=
FNR
ELRERY
NRF
RNF
FFNR
FNRR
/
)/(
/)(
/)(
)/(
tyTransformi
Indexlity Sustainabi Emeryg
RatioInvestmentEmergy
Ratio LoadingtalEnvironmen
RatioldEmergy Yie
ity RenewabilPercentage
Tr
ESI
EIR
ELR
EYR
PR
indicatorsEmergy
Where:
( )( )
( ) PHRTD, MC,EC,Finputs PurchasedR
PHRTD, MC,EC,Finputs leNonrenewabN
PHRMC,Finputs RenewableR
====
==
Processes of biomass CHP system
The entire life cycle of wood biomass CHP system is divided into seven processes. The
shared assumptions for each process in LCA and EMA are summarized in italics in Table 3-3;
assumptions that differ between the methods are detailed in the shaded boxes of the same table.
The assumptions in Table 3-3 are detailed in the following text.
Woodchips production
Woodchips production was assumed to be carried out by a stationary chopper in a sawmill.
The stationary chopper has electric input of 25 kw, hourly output of 3.3 m3/h bulked chips, and a
life time output of 100,000 m3 bulked chips. In addition to electric input, the chopper also
consumes lubricant oil and steel during operation.
In this study, the life cycle of the biomass CHP was assumed to begin with feedstock
production (i.e., woodchips) and processes before this such as tree harvesting and log
transportation to sawmill were not considered. The extant studies recommend different
approaches on allocation methods, for example, partitioning environmental burdens of the
systems by different co-product based on mass (Gabrielle and Gagnaire, 2008), energy (Lardon et

42
al., 2009), or economic market values (Mortimer et al., 2003). In this study, woodchips were
assumed to have low economic market value relative to that of main high-value wood products
such as lumber. In the LCA accounting, a certain degree of cut-off is allowed, that is,
specification of level of environmental significance associated with unit processes or product
system to be excluded from the study (ISO, 2006). Therefore, all emissions from pre-processes
(i.e., tree harvesting and log transportation) were not considered. The results of these preliminary
processes were not relevant to the purpose of this study, and would not have impacted the
outcome.
Besides all the material and energy uses as specified by LCA, human labor input was
added in EMA. The way of converting human labor service to Emergy units was calculated by
summing all the money spent in a process and multiplying by an Emergy-money index (Bakshi,
2002). Emergy-money index indicates solar Emergy per unit of money (Sej/$), which is
calculated as ratio of total solar Emergy an nation used in one year to the Gross National Product
(GNP) of the nation (Cao and Feng, 2007). Total solar Emergy used by the U.S. in one year was
estimated by use of coal, natural gas, crude oil, uranium, iron ore, aluminum ore, and wood, as
well as sunlight, rain and wind for a whole year (Odum, 1996). Cost of woodchips production in
this study was assumed to be consisting of capital cost of chopper, electricity use and human
labor service involved, and estimated value was $7.58 per cubic meters.
Woodchips transportation
Transportation distance, occurring between nearly any two process steps of product or
process system, is often of major importance for the product life cycle, and in turn the LCA
outcomes (Spielmann and Scholz, 2005). Emission of woodchips transportation can be calculated
given the transportation distance and type of truck used. In this study, transportation vehicle was
assumed to be lorry, with average in-bound load of 25 ton and empty on the returning trip.

43
The following processes were taken into consideration for woodchips transportation:
operation of vehicle; production, maintenance and disposal of vehicles; construction and
maintenance and disposal of road. Diesel fuel consumption and direct airborne emission were
included in operation of vehicle. All these data were collected from SimaPro 7.3 database.
Since human labor for transportation was added for EMA, the service was converted to
Emergy units through the Emergy-money index. The overall cost for transportation service was
estimated by the driver’s hourly payment and transportation distance.
Plant construction
Biomass CHP plant construction is divided into two major parts: facility building
construction and equipments construction. The lifetime of each of these two constructions was
assumed to be twenty years. Most important materials used for construction: concrete, steel,
aluminum, copper, cast iron, gravel, wood, rock wool, paint, as well as their estimated
transportation were taken into account in LCA. Emission data were obtained from SimaPro 7.3
database.
In comparison, the capital cost of plant construction was used to estimate Emergy input in
EMA, which was estimated at $3.8 million US dollar in 2010 (Salomon et al., 2011).
Plant operation/emission
Biomass CHP plant operation is a process of woodchips combustion to generate heat and
electricity. In this study, all the emission data of combustion process was extracted from SimaPro
7.3 database.
For EMA, human labor cost involved in the plant operation was used to calculate Emergy
input. The labor requirement was estimated as 1 person per shift, with one additional manager on
the day shift, with a total of 3 shifts per day. The operation time was assumed to be 7,654 hours

44
per year (87.4%). Salary and social expenses were estimated at $64,000 US per worker annually
and $90,000 US per manager annually based on the U.S. Bureau Labor Statistics (BLS, 2011).
Chemicals use in plant
The chemicals needed for plant operation include lubricant oil, ammonia, organic
chemicals, sodium chloride, chlorine and decarbonized water. Total emissions of all these
chemical production were taken into account in LCA. In contrast, transformities of these
chemicals were used to estimate Emergy input in EMA, which are shown in table 3-4.
Waste disposal
Three types of waste were assumed to be generated in the biomass CHP plant, including
used mineral oil, municipal solid waste and sewage. These waste materials require different
disposal treatments. LCA takes into account emissions from three treatments, which are
documented in SimaPro 7.3 database.
The cost of these three waste disposals was used to estimate Emergy input in EMA. The
estimated costs for each treatment are shown in Table 3-5 below.
Disposal ash
For LCA, ash disposal is also required for biomass CHP system. The amount of ash
generated was determined by the amount of wood burned and its ash content. Ash content was
assumed to be 1.1% on dry weight basis. For EMA, the cost of wood ash disposal was estimated
as $45 US per ton (Zwahr, 2004).
Biomass CHP system factors
Factors of biomass CHP system having significant impact on LCA results were used to
conduct Monte Carlo Simulation. Monte Carlo Simulation model was developed by substituting a
range of possible values for biomass CHP system factor that has inherent uncertainty (Mooney,

45
1997). Then results were repeatedly calculated with different sets of random values from the
probability functions. Each of the four factors was assumed to have normal probability
distribution, with a mean and standard deviation. Normal distribution was chosen because it is the
most likely distribution for independent random factor whose distribution is unknown according
to central limit theorem (Ott et al., 2001). Where data were not readily available, a partial
least-squares (PLS) regression model based on existing data was developed.
This study used four biomass CHP system factors in Monte Carlo Simulation, including
Emission control (EC), feedstock moisture content (MC), transportation distance (TD) and power
to heat ratio (PHR). The detailed description of factors is given below.
Emission control
Emission control factor in this study represents whether urea treatment is implemented or
not for exhaust gases release. Urea is a type of reduction agent for noxious gas, which can reduce
the NOx pollution in exhaust gases from combustion (Trautwein, 2003). The emissions data for
scenarios of with or without urea treatment are both available in SimaPro 7.3 database.
It was assumed that two scenarios (with or without urea treatment) are equally likely to
occur.
Moisture content
Moisture content is an important measurement of the biomass fuel quality and has
significant impact on heat energy released during biomass combustion. In the biomass CHP plant,
Lower Heating Value (LHV) of biomass is generally used to calculate the energy input into the
boiler (Van Loo and Koppejan, 2008), which decreases as the increase of moisture content of
biomass fuel (Figure 3-3) (Van Loo and Koppejan, 2008). The change of moisture content
influences the amount of woodchips needed to generate a given unit of energy, thus further

46
impacting other biomass CHP system processes including woodchips production, transportation,
plant emission and ash disposal.
In this study, moisture content (wet basis) of woodchips was assumed to be normally
distributed with mean MC of 25% and standard deviation of 7.5%.
Transportation distance
The transportation distance is one parameter affecting the emission from the woodchips
transporting process, where diesel fuel consumption, lubricant oil usage and road maintenance are
involved. Energy use and labor services required for woodchips transporting process vary with
the change of transportation distance. Therefore, transportation distance was modeled to estimate
Emergy input on transportation services.
In this study, transportation distance was assumed to be normally distributed with mean
of 60 km and standard deviation of 15km based on previous studies' assumptions on
transportation distance (Hoogwijk et al., 2009; Timmons and Mejía, 2010; Brechbill et al., 2011).
Power to heat ratio
The ratio of generated power to the generation of heat/steam on the basis of the same
energy unit is called the power-to-heat ratio (PHR). PHR indirectly impact every biomass CHP
system process in two ways: energy efficiency and allocation between electricity and heat.
A qualitative study on the efficiency for biomass CHP system showed higher PHR tends
to have lower energy efficiency (Van Loo and Koppejan, 2008). EPA (2008) reported biomass
CHP system can reach 85% energy efficiency when PHR is approximately equal to 0.1. Another
biomass CHP case study by Sha and Hurme’s (2011) found that 65% energy efficiency with PHR
equal to 0.4. Therefore, PHR and energy efficiency was assumed to have this linear relationship:
with increases of PHR from 0.1-0.4, the energy efficiency at facility decreases from 85% to 65%,
as shown in Figure 3-4. Secondly, allocation was carried out to attribute shares of total

47
environmental emissions and solar energy to the different products of biomass CHP system. The
allocation criteria used in this analysis was that assuming 1 MMBtu of electricity is equal to 3
MMBtu of heat when electricity is used in heat pump for heat generation (Van Loo and Koppejan,
2008; Abusoglu and Kanoglu, 2009).
In this study, PHR was assumed having normal distribution with mean of 0.25 and
standard deviation of 0.075 as suggested by Van Loo and Koppejan (2008).
Data analysis
Uncertainty and sensitivity analysis
The Monte Carlo method repeatedly sampled one thousand random data points to
generate numerical results for the LCA and EMA models, based on the assumed distribution
probabilities for the four biomass CHP system factors (Appendix E). Uncertainty and sensitivity
analyses were performed based on the simulated data to examine the similarities and differences
between LCA and EMA.
Uncertainty and sensitivity analysis are recommended or even required as a must in LCA
given the concerns over the accuracy of its results (Steen, 1997). Uncertainty analysis examines
reliability and applicability of results, while sensitivity analysis examines the differential effects
that biomass CHP system factors have on results (Guinée et al., 2011). There are basically two
types of uncertainty present in a LCA study: objective uncertainty and subjective uncertainty
(Helton, 1993). This study only focused on selected objective uncertainty (i.e., emission control,
transportation distance, power to heat ratio and moisture content). The subjective uncertainty
were not simulated into the model because there is no consensus regarding selection of CHP
system boundary, functional unit, impact assessment method, allocation methodology and other
assumptions. Due to a lack of literature on EMA uncertainty analysis, this study firstly

48
investigated the uncertainty of the EMA results due to four system factors, then explored other
potential sources that could be linked to larger uncertainties.
Correlation analysis
This study jointly used LCA and EMA to evaluate the environmental impact (i.e., GWP)
and long-term sustainability (i.e., EMA indicators) of the biomass CHP system, aiming to
investigate the relationship between LCA and EMA indicators. Correlation analysis was
conducted to check for potential dependencies between indicators and to determine if the number
of indicators could be reduced.
Correlation analysis measures the relationship between two variables and confirms the
fact that the data moves in tandem (Ott et al., 2001). It typically gives a number result that lies
between +1 and -1, with zero signifying no correlation. The closer the number moves towards +1
or -1, the stronger the correlation is. Usually for the correlation to be considered significant, the
correlation must be 0.5 or above in either direction (Ott et al., 2001).

49
Figure 3-1 Comparison of system boundary and accounting scope between LCA and EMA in analyzing production chain of biomass CHP system
Woodchips production
Woodchips Transport
Waste disposal
Chemical uses
Construction, maintenance of chipper, and energy use
Construction, maintenance of truck, and diesel use
Energy and material consumption for waste and
ash disposal
Plant operation
Construction, maintenance of plant, and combustion
emission from stack
Account for all emissions due to production and use of materials, fuels and energy
Account for all solar energy inputs of materials, fuels, energy and labor
Global Warming Potential (GWP)
Ash disposal
Plant construct
ion
Plant growing, Chipping cost, includes energy use
and labor
Delivery cost, includes diesel use and labor
MSW, mineral oil, and ash disposal cost
Construction cost, chemicals uses and
operation labor
Six EMA indicators
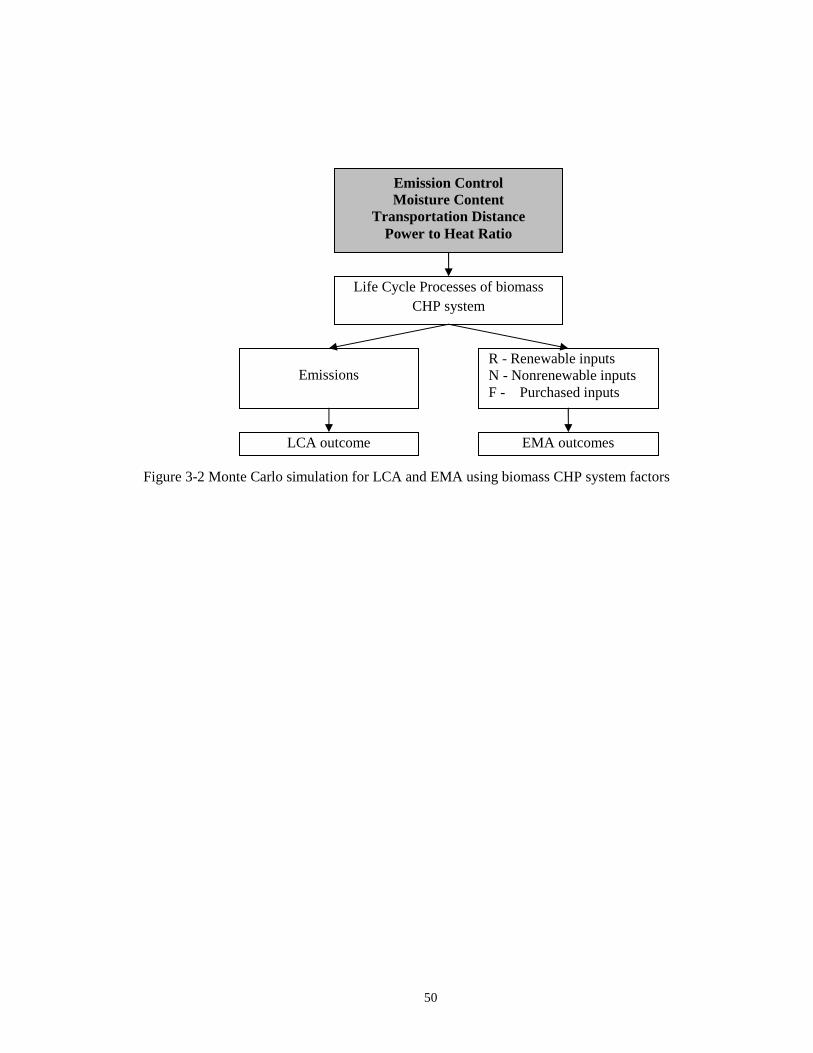
50
Figure 3-2 Monte Carlo simulation for LCA and EMA using biomass CHP system factors
Emission Control Moisture Content
Transportation Distance Power to Heat Ratio
R - Renewable inputs N - Nonrenewable inputs F - Purchased inputs
Life Cycle Processes of biomass CHP system
Emissions
LCA outcome EMA outcomes
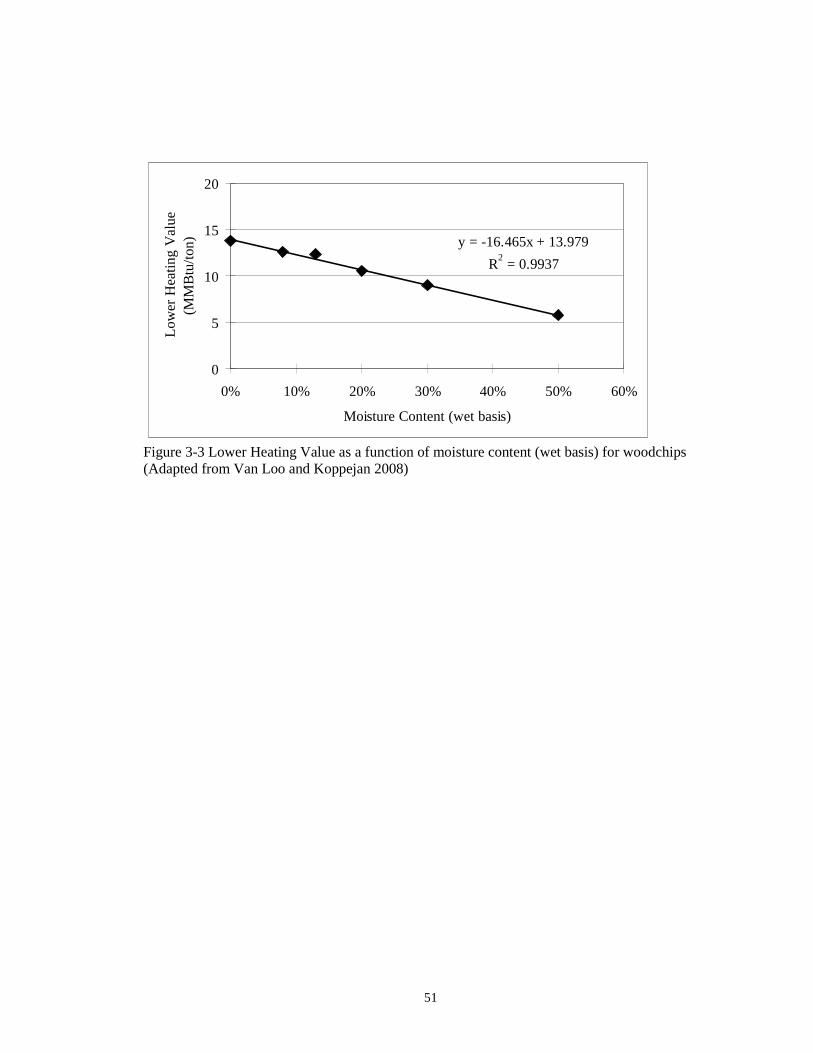
51
y = -16.465x + 13.979
R2 = 0.9937
0
5
10
15
20
0% 10% 20% 30% 40% 50% 60%
Moisture Content (wet basis)
Low
er H
eatin
g V
alue
(M
MB
tu/t
on)
Figure 3-3 Lower Heating Value as a function of moisture content (wet basis) for woodchips (Adapted from Van Loo and Koppejan 2008)

52
y = -0.6214x + 0.8954
R2 = 0.9794
0%
20%
40%
60%
80%
100%
0 0.1 0.2 0.3 0.4 0.5
Power to heat ratio
Ene
rgy
Effi
cien
cy
Figure 3-4 Linear relationship between power-to-heat ratio and energy efficiency for biomass CHP plant Source: Van Loo and Koppejan 2008

53
Table 3-1 Main indicators of EMA
Number Term Abbreviation and formula Unit 1) Percent Renewability PR= R/(R+N+F) ratio 2) Emergy Yield Ratio EYR= Y/F ratio 3) Environmental Loading Ratio ELR=(F+N)/R ratio 4) Emergy Investment Ratio EIR= F/(R+N) ratio 5) Emergy Sustainability Index ESI= EYR/ELR ratio 6) Transformity Tr=R+N+F Sej/MMBtu

54
Table 3-2 Emergy analysis table for production of energy from biomass CHP system
(Adapted from Odum 1996)
Item Unit Transformity (sej/unit) Units/year R: Renewable inputs
Oxygen in air g 5.16E+07 Woodchips g 2.57E+07
Water g 6.64E+05 N: Non-renewable inputs
Lubricant oil g 2.82E+09 Ammonia g 3.80E+09 Chemicals g 1.60E+09
Chlorine g 1.60E+09 Sodium Chloride g 1.00E+09
Emission control: Urea g 2.15E+09 F: Purchased inputs
Construction cost of facility building and equipments
$ 1.37E+12
Chipping cost* $ 1.37E+12 Transportation cost* $ 1.37E+12 Plant operation labor $ 1.37E+12
Ash disposal cost $ 1.37E+12 Waste disposal cost $ 1.37E+12
Products Heat output MMBtu Electricity output MMBtu * Estimated as estimated 125% of labor cost (WE, 2002), the labor costs are based on U.S. Bureau Labor Statistics (BLS, 2011)

55
Table 3-3 Summary of life cycle processes assumptions in LCA and EMA
Life Cycle Process LCA EMA
Equipment: stationary chopper Electric input: 25kw Hourly output: 3.3m3/hour Life time: 100,00 m3
Woodchips production
Material and energy use Additional human labor cost:
$7.58 per m3 Equipment: lorry Load capacity: 25 ton, and empty on returning trip
Transportation
Fuels and necessary maintenance Additional human labor cost: $25/hour Life time: 20 years Facility
construction All material and energy use for construction
Capital cost: $3.8 million US dollar in 2010
Operation hour: 7,654 hours/year (87.4%)
Plant operation Emissions from combustion process
Labor cost: Three shifts per day
1 person per shift with one additional manager on the day shift
Labor expense: $64,000 per worker, 90,000 per manager
Lubricant oil, ammonia, organic chemicals, sodium chloride, chlorine and decarbonized water
Chemical uses
Emissions Transformity Mineral oil Municipal solid waste Sewage
Waste disposal
Emissions due to disposal and treatments of waste
Disposal costs
Ash content: 1.1% on dry weight basis Ash disposal
Emissions due to disposal Disposal cost: $45 per ton
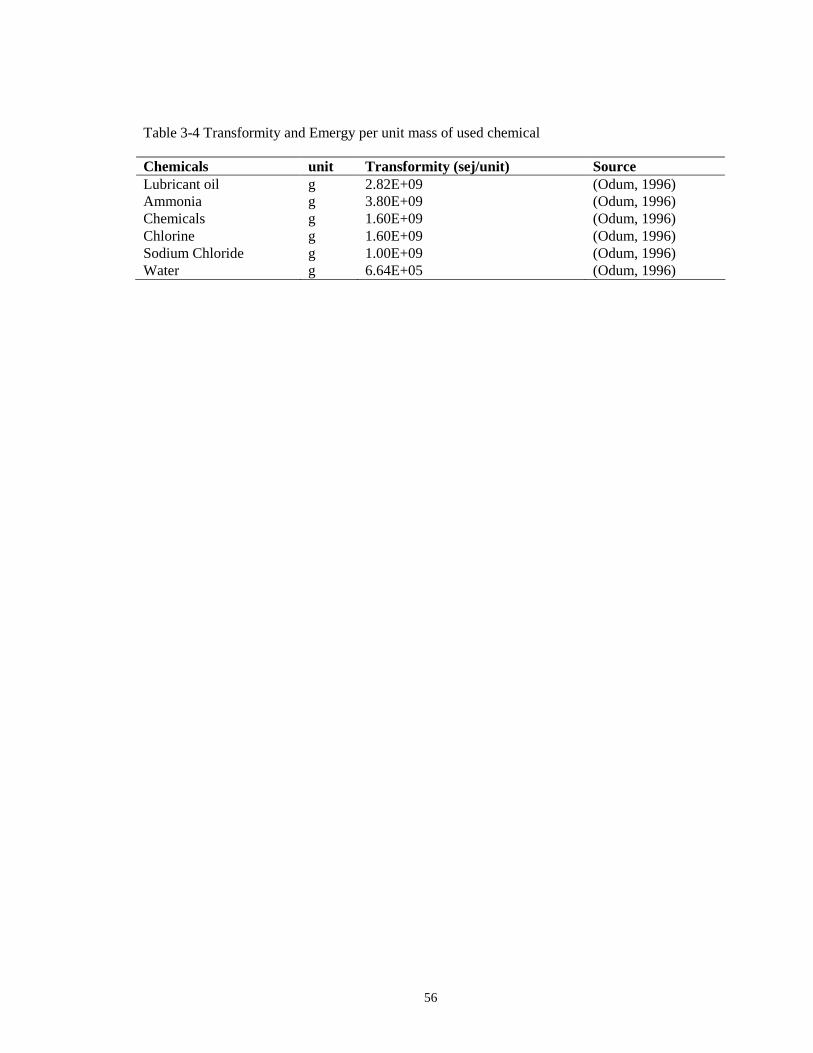
56
Table 3-4 Transformity and Emergy per unit mass of used chemical
Chemicals unit Transformity (sej/unit) Source Lubricant oil g 2.82E+09 (Odum, 1996) Ammonia g 3.80E+09 (Odum, 1996) Chemicals g 1.60E+09 (Odum, 1996) Chlorine g 1.60E+09 (Odum, 1996) Sodium Chloride g 1.00E+09 (Odum, 1996) Water g 6.64E+05 (Odum, 1996)

57
Table 3-5 Disposal cost of waste
Disposal cost Disposal cost ($/ton) Source Mineral oil 75 (SCGOV, 2012) MSW (municipal solid waste) 57 (SCGOV, 2012) Sewage 45 (SCGOV, 2012)

58
Chapter 4: COMPARING UNCERTAINTY AND SENSITVITY OF LCA
AND EMA RESULTS IN A BIOMASS CHP SYSTEM
This paper, co-authored by Li Ma and Charles D. Ray, was written for submission to " Ecological Modeling".

59
Abstract
With the increasing concern over environmental sustainability of different products and
processes, the accuracy of different environmental accounting methods have gained growing
attention. Many of the concerns that have been expressed about the accuracy of environmental
evaluation results are linked to potentially significant sources of uncertainty. Life Cycle
Assessment (LCA) and Emergy Analysis (EMA) are two environmental accounting methods used
to guide bioenergy decision-making. The uncertainty of LCA and EMA results contributes to
complexity of decision-making in regards to improvements. Therefore, uncertainty and sensitivity
analyses are carried out in this study to check if uncertainty of LCA and EMA attribute to the
same factors and how sources linking to uncertainty differ between these two methods.
This study uses a biomass combined heat and power (CHP) production system as an
example to jointly conduct LCA and EMA. To examine the uncertainty and sensitivities of LCA
and EMA results, a Monte Carlo simulation model is developed using four system factors having
inherent uncertainty in the biomass CHP system. The findings suggest that the LCA possesses a
larger degree of uncertainty on all four system factors than EMA, and EMA is subject to
additional uncertainties associated with free environmental service and human labor inputs that
are not accounted in LCA.
Given the large degree of uncertainty of the LCA results, the use of LCA as the sole tool
for decision-making in energy policy might lead to unanticipated environmental damage and
suggest actions that prove economically unsustainable. Therefore, LCA can be a useful tool for an
organization's internal use on a specific project, but is not recommended for a regional public
policy development.
EMA, on the other hand, can quantify the contribution of natural capital for sustaining
economic activity. The results become more theoretically accurate as the studied environmental

60
project scale gets larger, which makes EMA better than LCA for environmentally conscious
public policy development and decision-making.
Key words: LCA, EMA, Uncertainty analysis, Sensitivity analysis, GWP, EMA indicators

61
Introduction
Life Cycle Assessment (LCA) and Emergy Analysis (EMA) are two environmental
accounting methods that are both applied to guide bioenergy decision-making. However, there are
conflicting claims in regard to the validity of one approach versus the other (Sciubba and Ulgiati,
2005). LCA provides a way of quantifying the environmental impacts of products and services
from cradle to grave, or any subset of that process deemed useful for a particular project. The
development and standardization of LCA methodology has led LCA to become one of most used
tool for assessing environmental impacts and system sustainability (Curran, 2006; EC, 2010).
One the other hand, EMA accounts for the amount of solar energy required to support products
and services during an entire production chain. It is suggested that EMA is suitable for accounting
a wide set of natural resources, and can be used to support environmental sustainability
management (Campbell, 1998; Rugani and Benetto, 2012). This conflicting claim increases the
complexity of decision-making on method selection.
Despite that LCA and EMA studies on bioenergy system are quite rich in the extant
literature, no study has been carried out to practically examine the differences and similarities of
these two methods in the bioenergy field. This study is therefore an attempt to address the
difference and similarities of LCA and EMA with respect to results uncertainty. This is because
previous research has claimed that LCA indicators are subjective to many uncertainties, which
could greatly limit applicability of the results, especially when the indicators are presented for
decision-making in bioenergy development. Cherubini and Strømman (2011) suggested that
future research on LCA should be focused on reducing the uncertainties. Moreover, Ross et al.
(2002) noted that some of these uncertainties are common to all environmental accounting
methods, though the problem of uncertainty has not been recognized in the EMA literature. This
further warrants the need to investigate the uncertainties of LCA and EMA results. This study
62
will provide insight on differentiating respective uncertainty sources for designers and system
engineers seeking improvements of system performance.
Literature review
LCA
Life cycle thinking recognizes that all product life cycle stages including extracting and
processing of raw materials, manufacturing, transportation and distribution, use/reuse, recycling,
and/or waste management generate environmental impacts which need to be evaluated and then
reduced (Finnveden et al., 2009; Guinée et al., 2011; Rugani and Benetto, 2012). This perspective
has been the basis for the development and standardization of the Life Cycle Assessment (LCA)
method (ISO, 2006). Providing information about many emissions and consumption of resources,
LCA has become a principle factor in bioenergy development (Andersson, 2000; EPA, 2012), and
one of the best methodologies to evaluate greenhouse gases balance of a bioenergy system
(Cherubini et al., 2009). The bioenergy LCA studies are quite rich in the literature. For example,
LCA has been applied to bioethanol production (Fleming et al., 2006; Felder and Dones, 2007),
biodiesel production (Mortimer et al., 2003; Hossain and Davies, 2010), and biomass heat and
power production (Elsayed et al., 2003; Solli et al., 2009; Uihlein and Schebek, 2009). LCA has
also been used to compare bioenergy systems and fossil fuel-based systems (Eriksson et al., 2007;
Steubing et al., 2012). Among multiple measurements provided by LCA for assessing materials
and energy uses, reduction of Global Warming Potential (GWP) has been shown to be the largest
potential environmental benefit of biomass energy over other fossil fuels, and has been frequently
reported in bioenergy LCA studies (Cherubini et al., 2009; Steubing et al., 2012). Cherubini and
Strømman (2011) reviewed 94 bioenergy LCA studies published in the last fifteen years and
found that about 90% of the reviewed studies included GWP in the findings report. GWP is a
measure of the equivalent carbon dioxide that allows for the relative weightings of damaging

63
greenhouse gasses (Shine, 2009), which is sometimes called Climate Change Impact or its more
recent name - Carbon Footprinting (CFP). GWP has been a widely used metric of climate change
impacts and the main focus of many sustainability policies among companies and authorities
(Laurent et al., 2012).
Although the extant LCA studies claim to look at bioenergy systems from a life cycle
perspective, most are limited in scope. Traditional LCA studies focus only on emissions and their
impacts while ignoring the role of ecosystem goods and human labor services that industrial
processes rely upon (Odum, 1996; Urban and Bakshi, 2009; Zhang et al., 2010). In addition, LCA
results are subject to great uncertainty due to use of different system assumptions, such as
feedstock sources, conversion technologies, system boundaries, and reference systems with which
bioenergy system is compared (Cherubini et al., 2009). These two shortcomings of LCA could
lead to rising concern over the sustainability of bioenergy (Dickie, 2007; Sheehan, 2009; Zhang et
al., 2010).
EMA
Emergy analysis is an energy-based environmental accounting method that expresses all
the process inputs (i.e., energy, raw material, human service, etc.) and output products in solar
energy equivalent joules (Sej). Emergy measures how much energy would be needed to do a
particular task if solar radiation were the only input. The theory is based on the fact that earth has
one principle energy input: solar energy (Odum, 1996). Every product or service is comprised of
some amount of solar energy in term of energy.
With the increasingly important role that bioenergy plays in economic development and
environmental protection, EMA has been increasingly applied to bioenergy systems: Brown and
Ulgiati (2004), Dong et al. (2008) and Pereira and Ortega (2010) used Emergy to evaluate
bioethanol production from different feedstocks; Alonso-pippo et al. (2004) applied it to bio-oil

64
production using sugarcane biomass residues; Cavalett and Ortega (2009) and Sheng et al. (2007)
evaluated biodiesel production from soybean using Emergy; and Sha and Hurme (2011) were the
first to apply EMA in the biomass CHP production system. Despite the increasing interest of
Emergy for bioenergy system evaluation, studies on bioenergy system using forest wood or wood
waste are limited. Furthermore, Ross et al. (2002) noted that all environmental accounting
methods are subject to the uncertainty problem. The majority of previous EMA studies focus on
specific case of biomass CHP systems CHP (Al-Sulaiman et al., 2010; Sha and Hurme, 2011;
Buonocore et al., 2012); no study has been conducted to address the uncertainties of EMA results.
It is suggested that without addressing the uncertainty and sensitivity of results, the robustness
and usefulness of results is unknown and greatly limited.
Biomass CHP factors
Among various bioenergy conversion routes, studies have suggested that biomass is best
used for combined heat and power (CHP) production from environmental and economic
perspective. Steubing et al (2012) suggested that biomass is best used for CHP production from
environmental aspects evaluated by LCA, if heat can be used efficiently and coal, oil or fuel oil
based technologies can be substituted in the process. Kalt and Kranzl (2011) made the similar
recommendation in the context of Austria that the most cost-efficient bioenergy options for
reducing GHG emissions using woody biomass are direct heating and CHP, provided that heat
can be used efficiently.
During the LCA evaluation process, factors assumed to have significant impact on the
final results or where data was considered to be uncertain were altered in order to quantify the
impact (Kimming et al., 2011). A search of literature suggests four primary factors that have
significant impact on LCA results of biomass CHP systems.

65
1) Emission control: McManus (2010) examined the life cycle impacts of the production
and use of three biomass heating systems using waste wood in England and concluded that the
boiler emissions are the most significant impact associated with the life cycle.
2) Moisture content: Pirouti (2010) examined the effect of moisture content in biomass
fuel on system performance, ranging from 15% to 30%, and found that the impact of moisture
content is significant on the operation of the system.
3) Transportation distance: Transport distance occurring between nearly any two process
steps of a product or process system is often of major importance for a product/process life cycle,
and in turn the LCA outcomes (Spielmann and Scholz, 2005). Solli et al. (2009) performed LCA
on wood-based household heating system and found that firewood transportation distances played
an important role in the life cycle.
4) Power-to-heat ratio: PHR indicates the ratio of generated power to the generation of
heat/steam on the basis of the same energy unit. PHR is one important concept related to CHP
efficiency (EPA, 2008). Both EPA report (2008) and Van Loo (2008) indicates overall efficiency
of biomass CHP system might decrease when PHR increases. Several previous studies pointed
out that system overall efficiency can have a strong influence on the LCA results (Cherubini et al.,
2009; Solli et al., 2009; Steubing et al., 2012).
In summary, the impact of emission control, feedstock moisture content, transportation
distance, and power-to-heat ratio on LCA results allow an identification of opportunities for
environmental improvement of a biomass CHP system. But the influence of these factors on
EMA outcomes remains unknown. With ability to determine the environmental sustainability of
systems, knowledge about the influences of these factors on EMA results could help in
developing strategies to improve sustainability performance of a biomass CHP system.

66
Methods
System boundary
The life cycle of biomass CHP system is divided into seven processes listed in Figure 4-1.
These seven processes were defined as the case study system boundary in both LCA and EMA.
The detailed accounting scope of LCA is presented on the left side of Figure 4-1 within dash line;
the EMA scope is detailed on the right side of the figure. Since climate change mitigation and
energy independence are the main driving forces for future bioenergy (Cherubini and Jungmeier,
2010), LCA outcome only focuses on Global Warming Potential (GWP) evaluated using IPCC
2007 on 100 years horizon (IPCC, 2007). Meanwhile, the six indicators commonly used by
previous EMA studies are selected as EMA outcomes in this study, including Percent
Renewability (PR), Emergy Yield Ratio (EYR); Environmental Loading Ratio (ELR); Emergy
Investment Ratio (EIT); Emergy Sustainability Index (ESI); and Transformity (Tr) (Table 4-1).
System functional unit
The main purpose of the functional unit is to provide a reference to which the input and
output process data are normalized and the basis on which the final results are shown (Cherubini
et al., 2009). In this study, the reference functional unit for GWP and Transformity (Tr) is 1
MMBtu thermal energy generation. The allocation criteria for the analysis is that 1 MMBtu of
electricity is equal to 3 MMBtu of heat when electricity is used in heat pump for heat generation
(Van Loo and Koppejan, 2008; Abusoglu and Kanoglu, 2009).
Modeling Procedure
The modeling methodology in LCA and EMA are slightly different. To measure GWP,
emissions from seven processes are accumulated and divided by all heat energy generated in one
year. EMA indicators are calculated through ratios among Renewable inputs (R), Non-renewable

67
inputs (N) and Purchased inputs (F) (Odum, 1996). The modeling uses primary data from a
validated life cycle inventory of 6.4 MWth CHP plant in Europe available in SimaPro 7.3
database.
Life Cycle Processes of biomass CHP system
The entire life cycle of wood biomass CHP system is divided into seven processes. The
shared assumptions for each process in LCA and EMA are summarized in italics in Table 4-2;
assumptions that differ between the methods are detailed in the shaded boxes of the same table.
The assumptions in Table 4-2 are detailed in the following text.
1) Woodchips production: Woodchips production was assumed to be carried out by a
stationary chopper, which has electric input of 25 kw, hourly output of 3.3 m3/h bulked chips, and
a life time output of 100,000 m3 bulked chips. In addition of electric input, the chopper also
consumes lubricant oil and steel during operation. Besides all the material and energy uses as
specified by LCA, human labor input is added in EMA through Emergy-money index. The cost
of wood chipping process in this study consisting of capital cost of chopper, electricity use and
human labor service, is estimated to be $7.58 per cubic meters.
2) Woodchips Transportation: Woodchips were assumed to be transported by Lorry
with average load of 25 tonnes and empty on the returning trip. Besides fuel uses in this process,
the human labor service is also accounted in EMA, which was estimated by the cost of driver’s
hourly payment and transportation distance.
3) Facility Construction: The lifetime of plant facility was assumed to be 20 years in the
analysis of LCA. EMA uses capital cost of plant construction to estimate Emergy input, which
was estimated at $3.8 million US in 2010 (Salomon et al., 2011).
4) Chemical uses: The chemicals needed for plant operation include lubricant oil,
ammonia, organic chemicals, sodium chloride, chlorine and decarbonized water. LCA accounts

68
for emissions of all these chemical production. In contrast, transformities of these chemicals were
used to estimate Emergy input in EMA (Odum, 1996) (Table 4-3).
5) Plant operation: LCA accounts for all the emission from combustion process which is
available in SimaPro 7.3 database. For EMA, human labor cost involved in the plant operation
was used to calculate Emergy input. The labor requirement was estimated as 1 person per shift,
with one additional manager on the day shift. Total 3 shifts per day was assumed. The operation
time was assumed to be 7,654 hours per year (87.4%). The salary and social expenses were
estimated at $64,000 US per worker annually and $90,000 US per manager annually based on the
U.S. Bureau Labor Statistics (BLS, 2011).
6) Waste disposal: Three types of waste were assumed to be generated in the biomass
CHP plant, including mineral oil, municipal solid waste, and sewage. LCA takes into account
from three treatments, which are documented in SimaPro 7.3 database. The cost of these three
waste disposals was used to estimate Emergy inputs in EMA (SCGOV, 2012). The estimated
costs for each treatment are shown in Table 4-4 below.
7) Ash disposal: For LCA, the amount of ash generated is determined by the amount of
wood burned and its ash content. Ash content was assumed to be 1.1% on dry weight basis. In
EMA, the cost of wood ash disposal was estimated as $45 US per ton (Zwahr, 2004).
Biomass CHP system factors
Factors of biomass CHP system having significant impact on LCA results were used to
conduct Monte Carlo Simulation. Monte Carlo Simulation model was developed by substituting a
range of values for biomass CHP system factor that has inherent uncertainty (Mooney, 1997).
Then results are repeatedly calculated with different sets of random values from the probability
functions. Each of the four factors was assumed to have normal probability distribution, with a
mean and standard deviation. Normal distribution was chosen because it is the most likely
69
distribution for independent random factor whose distribution is unknown according to central
limit theorem (Ott et al., 2001). Where data were not readily available, a partial least-squares
(PLS) regression model based on existing data was developed.
This study used four biomass CHP system factors in Monte Carlo Simulation, including
Emission control (EC), feedstock moisture content (MC), transportation distance (TD) and power
to heat ratio (PHR). The detailed description of factors is given below.
1) Emission control factor in this study represents whether urea treatment is implemented
or not for exhaust gases release. It was assumed that two scenarios (with or without urea
treatment) are equally likely to occur.
2) Lower Heating Value of biomass is generally used to calculate the energy input into
the boiler (Van Loo and Koppejan, 2008), which decreases as the increase of moisture content of
biomass fuel (Van Loo and Koppejan, 2008). In this study, the relationship between LHV and
moisture content provided by Van Loo and Koppejan (2008) was used to develop the assumption
for feedstock moisture content, that is, moisture content (wet basis) of woodchips was assumed to
be normally distributed with mean of 25% and standard deviation of 7.5%.
3) Transportation distance was assumed to be normally distributed with mean of 60km
and standard deviation of 15km based on previous studies' assumptions on transportation distance
(Hoogwijk et al., 2009; Timmons and Mejía, 2010; Brechbill et al., 2011).
4) PHR and energy efficiency was assumed to have this linear relationship: with increases
of PHR from 0.1-0.4, the energy efficiency at facility decreases from 85% to 65% (EPA, 2008;
Sha and Hurme, 2011). PHR was assumed having normal distribution with mean of 0.25 and
standard deviation of 0.075 as suggested by Van Loo and Koppejan (2008).

70
Data Analysis
The Monte Carlo method repeatedly sampled one thousand random data points to
generate numerical results for the LCA and EMA models, based on the assumed distribution
probabilities for the four biomass CHP system factors (Appendix E). Uncertainty and sensitivity
analyses were performed based on the simulated data to examine the similarities and differences
between LCA and EMA.
Uncertainty and sensitivity analysis are recommended or even required as a must in LCA
given the concerns over the accuracy of its results (Steen, 1997). Uncertainty analysis examines
reliability and applicability of results, while sensitivity analysis examines the differential effects
that biomass CHP system factors have on results (Guinée et al., 2011). There are basically two
types of uncertainty present in a LCA study: objective uncertainty and subjective uncertainty
(Helton, 1993). This study only focused on selected objective uncertainty (i.e., emission control,
transportation distance, power to heat ratio and moisture content). The subjective uncertainty
were not simulated into the model because there is no consensus regarding selection of CHP
system boundary, functional unit, impact assessment method, allocation methodology and other
assumptions. Due to a lack of literature on EMA uncertainty analysis, this study firstly
investigated the uncertainty of the EMA results due to four system factors, then explored other
potential sources that could be linked to larger uncertainties.
Results
Uncertainty of LCA
Table 4-5 shows the multiple linear regression analysis result between GWP and biomass
CHP system factors. The p-values indicate that all factors have significant impact on the total
GWP of biomass CHP system.

71
Figure 4-2 and Table 4-6 present the contribution and variability of each life cycle
processes to the value of GWP. A coefficient of variation of 43.9% is found in the total GWP
which quantifies the extent of variability in relation to the mean of GWP (7.02 kg CO2/MMbtu).
This suggests that GWP of the biomass CHP system is highly uncertain ranging from 2.34 - 13.20
kg CO2/MMbtu, as shown in the last box/whisker in Figure 4-2. The coefficient variation in
combination with the share of total GWP of each life cycle process are used to compare its
uncertainty contribution to total uncertainty of GWP. Stack emission from the plant operation
process contributes the highest to total GWP uncertainty with highest share of total GWP (51%)
and coefficient variation (cv=82%), followed by feedstock transportation process (Table 4-6). It is
worth noting that the greenhouse gas (GHG) emission from chemicals use process has large
variability (cv = 75%), however, the share of this process only represents 0.9% of total GWP,
therefore it does not play significant role in determining the total GWP. In addition, the GWP
contributions of construction, waste disposal and ash disposal processes are negligible, which
account for less than 3% combined (Table 4-6).
Sensitivity Analysis of LCA
The uncertainties in transportation and stack emission are significantly high, and since
they represent 81% of the total variation in GWP, it is necessary to understand their origin and
significance. Therefore, the regression analysis between factors and these processes is called for
as a sensitivity analysis. To provide a measure of variable importance, the standardized regression
analysis is used since it can eliminate the difference in units in which factors are expressed.
Specifically, the standardized regression coefficient (SRC) refers to how much the standard
deviations of the dependent variable will change when the independent variable changes by one
standard deviation (Helton and Davis, 2002). The sensitivity analysis resulting between processes
and factors is presented and discussed based on Figure 4-3 and Table 4-7:

72
1) TD and MC contribute most of the variation in feedstock transportation process, while
EC (urea application) contributes most of the variation in stack emission.
2) EC has the largest impact on total GWP variation followed by TD, MC and PHR.
Observed from the emission inventory in SimaPro, the GWP increase by using urea for flue gas
treatment is not caused by the production or transportation of urea, but by the newly generated
emission of Dinitrogen Monoxide (N2O) from the process, which is considered to have 298 times
more GWP impact than CO2 (IPCC, 2007). This explains the highest impact of EC has on the
total GWP.
3) PHR is found to have an inverse relationship with the total GWP. As the PHR
increases, the relative proportion of power generation to heat output is increased, and
consequently reduces the GWP of the whole system. In other words, when PHR is higher, more
electricity is generated per unit of wood consumed, since one unit of electricity is assumed to
generate three units of heat when heat pump is applied (Abusoglu and Kanoglu, 2009). In this
case, the overall efficiency of the CHP system is improved, thus decreasing GWP per unit of heat.
4) The impact of TD on GWP is approximately 33% larger than that of MC, when the
distance and moisture content are within the range of (45km, 90km) and (10%, 40%), respectively.
It can be further inferred that 1 km increase in transportation distance would be offset by 0.62%
lower moisture content in term of GWP.
Uncertainty and sensitivity analysis of EMA
EMA indicators
Table 4-8 presents the mean of simulated EMA results of the wood biomass CHP system
in this study. In order to better understand the meaning of EMA indicators, findings from other
EMA studies on other energy systems such as coal-based CHP system and solar PV are used for
comparison.

73
Table 4-8 shows different rankings of biomass CHP systems in terms of different EMA
indicators compared to other two systems:
1) The PR of biomass CHP system is about 6 times higher than that of the coal-based
CHP, suggesting that the biomass CHP system enjoys higher degree of renewability and is more
sustainable in the long run (Brown and Ulgiati, 1997);
2) EYR measures how much a process contributes to the economy and how dependent
the process is on the purchased inputs. It indicates the efficiency of the system using purchased
inputs (Ortega et al., 2005). The comparison suggests that the biomass CHP system has slightly
lower efficient in using purchased inputs than coal-based CHP but much higher than Solar PV
system. These metrics can be explained by comparing the energy density of the three types of
fuels; solar fuel is very diffuse, while coal is more energy-dense per unit of volume than biomass.
3) ELR represents the pressure of a transformation process on the environment and can
be considered as a measure of ecosystem stress due to a production (Ulgiati and Brown, 1998).
The ELR values for biomass CHP and coal-based CHP systems are 0.88 and 10.32, respectively,
suggesting that biomass CHP system using wood as feedstock has much smaller environmental
stress per unit of energy produced from the system. This is related to the fact that biomass
harvesting is essentially a process that results in a renewable resource, whereas coal mining
essentially permanently depletes the resource from the biosphere.
4) EIR evaluates whether a process is an economical user of the Emergy invested in
comparison with alternatives (Brown and Ulgiati, 1997; Zhang and Long, 2010). A high level of
EIR represents a certain fragility of the system due to its dependence on inputs from other
economic systems (Pizzigallo et al., 2008). Both biomass and coal CHP systems have ratio lower
than 1, indicating that the systems do not depend highly on inputs from society. The exceptionally
high value of EIR for Solar PV system demonstrates a high degree of fragility and long
investment payback period (or no payback).

74
5) ESI measures the potential contribution of a resource or process to the economy per
unit of environmental loading (Zhang and Long, 2010) and represents long term sustainability of
the system. Biomass CHP system has a much higher value of ESI than that of coal-based CHP
systems (2.45 versus 0.26), indicating that biomass CHP system has higher sustainability in the
long run.
6) Tr expresses the production efficiency of the system (Peng et al., 2008). The average
Tr of wood biomass CHP system is about 14, 616 sej/J (or 1.54E+13 sej/MMBtu ) compared to
94,900 sej/J from coal-based CHP system. This suggests that the biosphere need work 6.5 times
more to produce a unit of energy by coal CHP than by biomass CHP.
In summary, EMA enables different kinds of energy, materials, environmental and
human service in the energy system to be evaluated on a uniform basis (i.e., sej). The set of EMA
indicators allows assessing different aspects of system functions, such as renewability, benefits to
economy, environmental loading, and investment benefits. Since economic benefit is the
fundamental driving force in global market economy, EYR and EIR are very important indices to
predict economic success, and should be taken into consideration for decision-making.
Uncertainty of EMA
Table 4-9 summarizes the statistics of six EMA indicators with mean, standard deviation
and coefficient of variation. The calculation items for EMA indicators are shown in Appendix F.
Table 4-9 shows that all EMA indicators have a small variability with coefficient of variation
ranging from 0.5% to 2.8%, which is much smaller than the observed variability of LCA-based
GWP (cv =44%).
Given the small uncertainties that four system factors accounted for EMA results, other
potential sources that could lead to uncertainty of EMA are further discussed from two
perspectives: life cycle process and system input category (i.e., R, N and F) (Figure 4-4).

75
1) The life cycle process contributions of Emergy input are shown in upper graph of
Figure 4-4. It clearly shows that growing & chipping and plant operation are the most dominant
processes contributing to total Emergy input. Thus some sources like biomass growing, costs
associated with plant operation, and capital investment could lead to potential uncertainty in
EMA results. Notably, although growing biomass is the most dominant process of Emergy inputs,
it is hard to improve Emergy performance through this process given the difficulties of increasing
the basic efficiency of gross photosynthesis. Perhaps selecting genetically advanced energy crop
and high yield plantation site can serve this purpose.
2) The lower graph in Figure 4-4 shows contributions of different input categories. It
clearly shows that renewable inputs (R) and purchased inputs (F) have much larger proportion of
total Emergy input than do nonrenewable inputs (N). The sum of these inputs (R, F, and N)
results in the transformity of biomass energy as represented in this case study. This transformity
(Tr) is shown in Figure 4-4. This suggests that the improvement of Emergy performance would
be focusing on reducing renewable inputs and purchased inputs. After inspecting the components
of renewable inputs and purchased inputs as listed in Appendix F, the conclusion is the same as
described in life cycle process section: that potential factors influencing EMA include biomass
growing, operation cost, and capital investment, which are mostly associated with free
environmental service and human labor cost. Among operation cost, harvesting and processing
cost are most significant, followed by plant operation cost.
Sensitivity of EMA
Since the uncertainties of EMA indicators due to the four biomass CHP system factors
are very small (Table 4-9), there is little need to further investigate the sensitivities of the EMA
results.

76
Discussions and conclusions
The purpose of this study is to examine the uncertainty and sensitivity of LCA and EMA
results from a wood biomass CHP system. Several conclusions are drawn based on the findings in
this study.
LCA and EMA are characterized by different degrees of uncertainty.
1) The higher degree of uncertainty of LCA confirms the need of reporting uncertainty in
the LCA studies suggested by previous research (Cherubini et al., 2009; ISO, 2010). The
objective and subjective uncertainty are inherent in the current LCA approach, and cannot be
overcome even if the practitioner strictly follows the procedures described in the LCA standards,
which results in the risk of making conclusions that cannot be justified strictly by the results
indicated by the many and various LCA indicators. Therefore, uncertainty and sensitivity analysis
should always be reported in the LCA final results, and should be presented with ranges that take
into account all the different assumptions and variables.
2) EMA results are subject to smaller degree of uncertainty due to different assumptions
of system factors. Free environmental service and human labor cost included in the biomass
growing, operation cost, and capital investment are observed to account for large amount of total
Emergy inputs, and could be the potential sources leading to uncertainty of EMA. However, these
vital inputs are not accounted by LCA, which would limit its usefulness for a larger picture. Thus,
using LCA to evaluate an energy system and improve its performance by lowering its
environmental impact (i.e. GWP) will not necessarily increase sustainability, and in some cases,
the effect could be opposite. In contrast, EMA expands its boundary to account for other flows in
addition to energy and material consumptions, which theoretically provides valuable insight about
environmental sustainability for systems that largely interact with environment and economy,
such as agriculture food systems and bioenergy production system.

77
The contributions of life cycle processes to LCA and EMA uncertainties differ. Stack
emission from the plant operation process and feedstock transportation process in LCA are found
to have the highest contribution to GWP uncertainty, while feedstock growing & chipping, and
plant operation have the most impact on the total Emergy input in EMA. In this case study, at
least, LCA and EMA conclusions have resulted in different focuses and approaches for system
environmental performance improvement.
The results of the case study presented in the study are paradigmatic: they clearly
show that information provided by the two methods is complementary rather than
competing. The two methods display "optimal field of application" (Figure 4-5):
1) LCA is a useful assessment method to evaluate local and global environmental impacts
of a system. Its usefulness is very limited to the assessment of a system itself, but this technique
can allow for immediate comparison of similar processes. Thus LCA is better to serve as a
continuous benchmarking tool to maximize efficiency of resources use through a case-by- case
approach.
2) EMA provides better assessment of interconnection between industrial processes,
environmental dynamics and economy. Its capability to account for externalities expands its
usefulness for a broader picture, but also limits its usefulness for process improvement. The
crucial benefits of EMA is that it provides an approach to take account of local environmental
resources conditions, and aim to maximize efficiency of local environmental resources use to
support industrial process and economy.
Simply speaking, EMA answers the question "What is the most efficient product or
process?", while LCA answers "How can we improve the environmental efficiency of a specified
product or process?".

78
Figure 4-1 Comparison of system boundary and accounting scope between LCA and EMA in analyzing production chain of biomass CHP system
Woodchips production
Woodchips Transport
Waste disposal
Chemical uses
Construction, maintenance of chipper, and energy use
Construction, maintenance of truck, and diesel use
Energy and material consumption for waste and
ash disposal
Plant operation
Construction, maintenance of plant, and combustion
emission from stack
Account for all emissions due to production and use of materials, fuels and energy
Account for all solar energy inputs of materials, fuels, energy and labor
Global Warming Potential (GWP)
Ash disposal
Plant construct
ion
Plant growing, Chipping cost, includes energy use
and labor
Delivery cost, includes diesel use and labor
MSW, mineral oil, and ash disposal cost
Construction cost, chemicals uses and
operation labor
Emergy indicators

79
Figure 4-2 Box plot of GHG emission of life cycle process

80
Figure 4-3 Scatterplots for GWP against biomass CHP system factors

81
Figure 4-4 Emergy inputs by life cycle process and by inputs category

82
Figure 4-5 Environmental decision-making tools on scale of boundary and theoretical accuracy
Small Large System Boundary
Acc
urac
y
High
Low
LCA
EMA

83
Table 4-1 EMA indicators abbreviation and formula
Indicator Abbreviation and formula Unit Percent Renewability PR= R/(R+N+F) ratio Emergy Yield Ratio EYR= Y/F ratio Environmental Loading Ratio ELR=(F+N)/R ratio Emergy Investment Ratio EIR= F/(R+N) ratio Emergy Sustainability Index ESI= EYR/ELR ratio Transformity Tr=R+N+F Sej/MMBtu
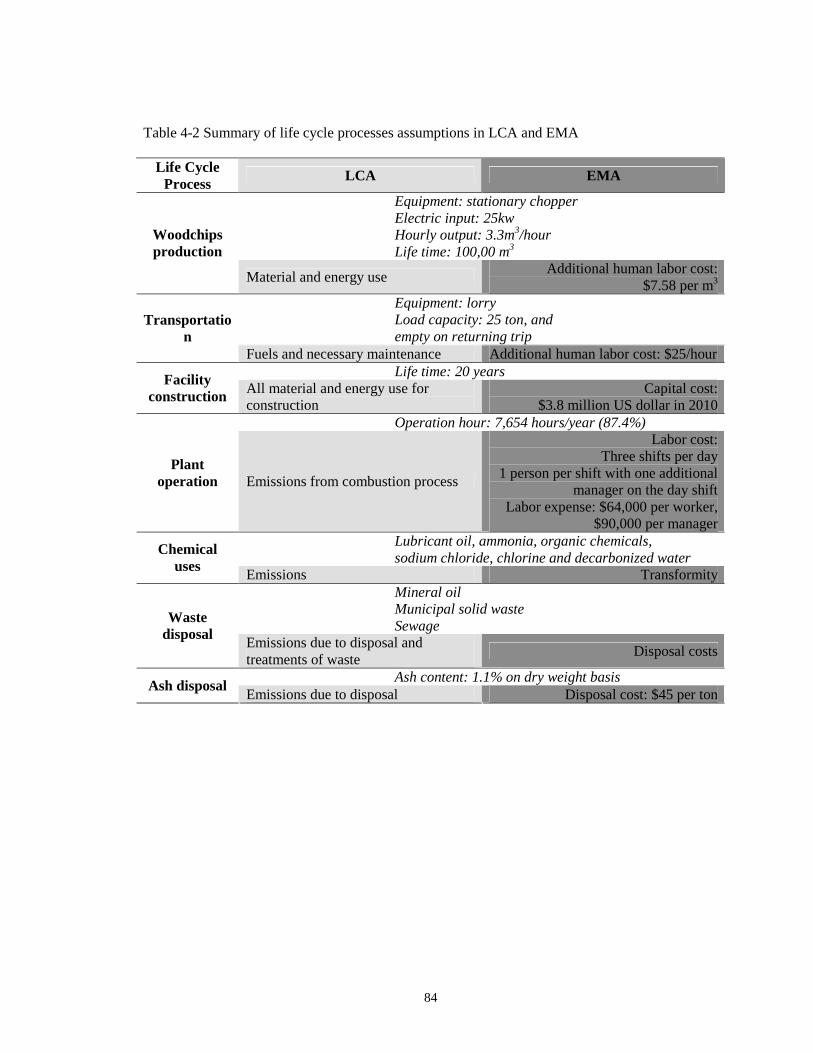
84
Table 4-2 Summary of life cycle processes assumptions in LCA and EMA
Life Cycle Process LCA EMA
Equipment: stationary chopper Electric input: 25kw Hourly output: 3.3m3/hour Life time: 100,00 m3
Woodchips production
Material and energy use Additional human labor cost:
$7.58 per m3 Equipment: lorry Load capacity: 25 ton, and empty on returning trip
Transportation
Fuels and necessary maintenance Additional human labor cost: $25/hour Life time: 20 years Facility
construction All material and energy use for construction
Capital cost: $3.8 million US dollar in 2010
Operation hour: 7,654 hours/year (87.4%)
Plant operation Emissions from combustion process
Labor cost: Three shifts per day
1 person per shift with one additional manager on the day shift
Labor expense: $64,000 per worker, $90,000 per manager
Lubricant oil, ammonia, organic chemicals, sodium chloride, chlorine and decarbonized water
Chemical uses
Emissions Transformity Mineral oil Municipal solid waste Sewage
Waste disposal
Emissions due to disposal and treatments of waste
Disposal costs
Ash content: 1.1% on dry weight basis Ash disposal
Emissions due to disposal Disposal cost: $45 per ton

85
Table 4-3 Transformity and Emergy per unit mass of used chemical
Chemicals unit Transformity (sej/unit) Source Lubricant oil g 2.82E+09 (Odum, 1996) Ammonia g 3.80E+09 (Odum, 1996) Chemicals g 1.60E+09 (Odum, 1996) Chlorine g 1.60E+09 (Odum, 1996) Sodium Chloride g 1.00E+09 (Odum, 1996) Water g 6.64E+05 (Odum, 1996)

86
Table 4-4 Disposal cost of waste
Disposal cost Disposal cost ($/ton) Source Mineral oil 75 (SCGOV, 2012) MSW (municipal solid waste) 57 (SCGOV, 2012) Sewage 45 (SCGOV, 2012)

87
Table 4-5 Regression analysis of total GWP and system factors.
GWP (kg CO2/MMBtu) Independent Variable Regression Coefficients B t value p-value
(Constant) .941 21.632 .000 EC 5.998 418.207 .000 TD .034 70.253 .000
PHR -.257 -2.907 .004 MC 4.550 52.458 .000

88
Table 4-6 Descriptive statistics for GWP of life cycle process
Life cycle process Mean
(kg CO2 eq./MMBtu) Standard deviation
Coefficient of variation
% of GWP
Wood chipping 1.10 0.03 3.0% 15.6%
Transportation 2.08 0.59 28.4% 29.6%
Construction 0.16 0.00 1.3% 2.3%
Stack emission 3.61 2.96 81.8% 51.4%
Chemicals use 0.06 0.04 74.8% 0.9%
Disposal waste 0.01 0.00 1.3% 0.2%
Disposal ash 0.01 0.00 3.1% 0.1% Total GWP 7.02 3.09 43.9% 100%
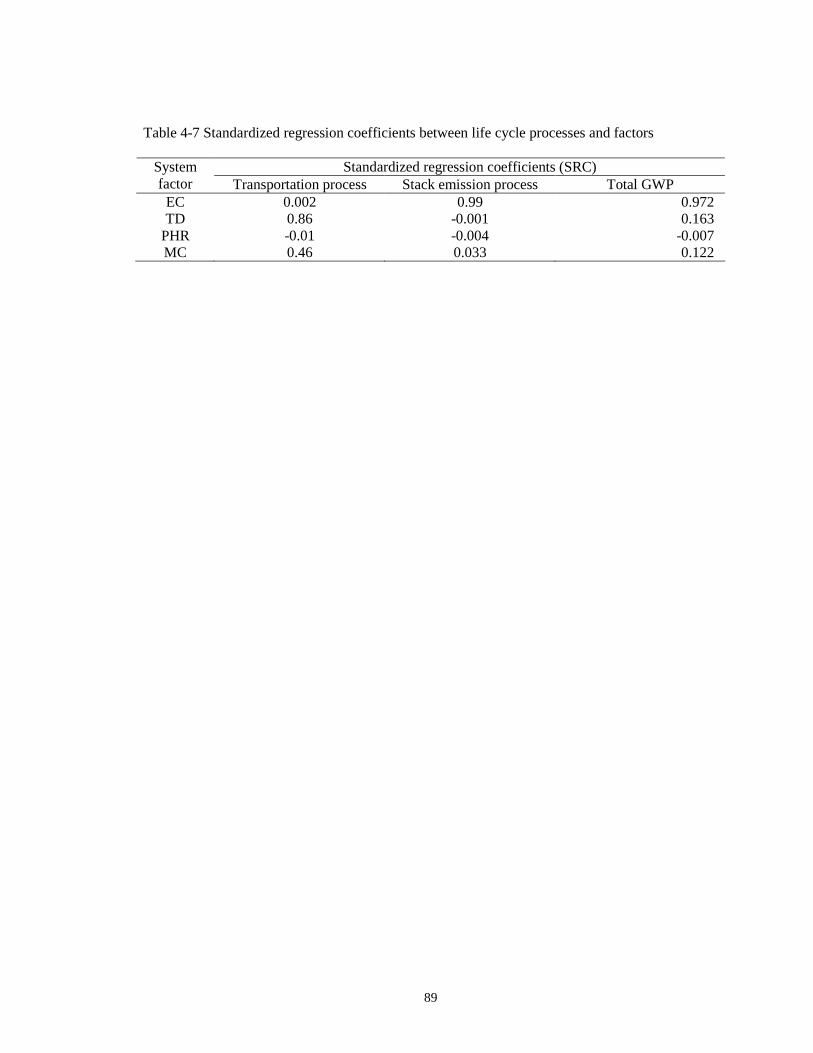
89
Table 4-7 Standardized regression coefficients between life cycle processes and factors
Standardized regression coefficients (SRC) System factor Transportation process Stack emission process Total GWP EC 0.002 0.99 0.972 TD 0.86 -0.001 0.163
PHR -0.01 -0.004 -0.007 MC 0.46 0.033 0.122

90
Table 4-8 Comparative EMA results from different energy systems
Energy production systems EMA indicators Wood biomass
CHP Coal-based
CHPa Solar PVb
Percent of Renewability (PR) 53.2% 9.0% -
Emergy yield ratio (EYR) 2.16 2.67 0.48-1.5
Environmental loading ratio (ELR) 0.88 10.32 -
Emergy investment ratio (EIR) 0.87 0.60 7809
Emergy sustainability index (ESI) 2.45 0.26 -
Transformity (Tr) 14,616 sej/J 94,900 sej/J - a Case study of 71.7 MW coal-based CHP plant (Sha and Hurme, 2011) b Data is obtained from Odum (1996)

91
Table 4-9 Descriptive statistics of Emergy indicators
Emergy indicator
Formula Mean Standard deviation
Coefficient of variation
PR Percent of Renewability = N / Y 0.532 0.003 0.5%
EYR Emergy yield ratio = Y / F 2.155 0.012 0.5%
ELR Environmental loading ratio = ( F + N) / R 0.878 0.009 1.1%
EIR Emergy investment ratio = F / (R + N) 0.866 0.009 1.0%
ESI Emergy sustainability index = EYR/ELR 2.454 0.037 1.5%
Tr Transformity = Y = R + N +F 1.54E+13 4.27E+11 2.8%

92
Chapter 5: CORRELATION ANALYSIS OF CARBON FOOTPRINTING
AND EMERGY INDICATORS FOR BIOMASS CHP SYSTEM
This paper, co-authored by Li Ma and Charles D. Ray, was written for submission to "Environmental Science and Technology"

93
Abstract
Life Cycle Assessment (LCA) and Emergy Analysis (EMA) are two environmental
accounting methods used to guide bioenergy decision making. LCA and EMA are often
conducted independently, and each method generates numerous indicators. Consequently, the
environmental decision-making seems to depend on selections of environmental accounting
methods and indicators. This study therefore aims at analyzing LCA and EMA results to check if
different indexes lead to similar results and if the number of indicators can be further reduced.
A biomass combined heat and power (CHP) production system is used as an example to
jointly conduct LCA and EMA. The correlation among LCA and EMA indicators are examined
based on a Monte Carlo simulation model. In this study, Global Warming Potential (GWP) is
used as LCA indicator given the increasing public concern over climate change and the great
interest of bioenergy development, and six commonly used EMA indicators are included in the
analysis, including Percent Renewability (PR), Emergy Yield Ratio (EYR), Environmental
Loading Ratio (ELR), Emergy Investment Ratio (EIR), Emergy Sustainability Index (ESI), and
Transformity (Tr).
The findings suggest no correlation between LCA and EMA indictors, implying either
method alone is insufficient to measure environmental sustainability of a bioenergy system.
Surprisingly, the biogenic CO2 emission from LCA and Tr in EMA are strongly correlated. This
relationship leads to a possible integration of LCA and EMA. In addition, strong correlations are
found among five EMA indicators, suggesting that the number of EMA indicators can be reduced
as they lead to similar findings.
Key words: LCA, EMA, Correlation, GWP, Emergy indicators

94
Introduction
The sustainable use of natural resources is an important step to build a sustainable society
(Berger and Finkbeiner, 2011). This idea has been extensively accepted by scientific community,
and has gradually been implemented through policy initiative in political panels such as
"International Panel for Sustainable Resources Management"(UNEP, 2009). To put to the idea
into practice, it is important to develop measurements that are able to precisely quantify resource
use, so that system with higher efficiency in resources use will be selected and promoted.
Due to the intensive use of resources during the entire production chain of bioenergy,
Life Cycle Assessment (LCA) and Emergy Analysis (EMA) have been widely applied to assess
the bioenergy system. Since these two methods are often conducted independently, the results for
bioenergy system analysis seems to depend on selections of environmental accounting methods
and indicators (Berger and Finkbeiner, 2011). Researchers have begun to consider potential
integration of LCA and EMA; however, most of those efforts have been done on the theoretical
level (Zhang et al., 2010; Ingwersen, 2011; Rugani and Benetto, 2012). The answer to the
question of "what is the relationship between LCA and EMA outcomes" is less certain.
LCA and EMA both provide multiple indicators, measuring resources use from different
perspectives. The majority of the existing bioenergy LCA studies have viewed Global Warming
Potential (GWP) impact category as the most important indicator for LCA results (Cherubini and
Strømman, 2011), while six Emergy indicators have often been presented in bioenergy EMA
studies to address different aspects of sustainability (Baral and Bakshi, 2010; Zhang and Long,
2010). Given the large amount of work and the complexity of calculation involved in performing
LCA and EMA, studies have been called for investigating the ability of simplified indicators as
proxies for environmental performances of the system. This study is, therefore, an attempt to
examine the correlation, if any, between LCA-based GWP and six EMA indicators as well as

95
among EMA indicators. This will provide insight on whether different indictors lead to similar
results and whether the number of indicators can be reduced for simplification.
Literature review
LCA
Life Cycle Assessment (LCA) is the most accepted and used tool for assessing
environmental impacts of products and services (Curran, 2006; EC, 2010), and has become a vital
decision-support tool in environmental policy or voluntary actions in many fields, especially
biofuel and bioenergy (Cherubini et al., 2009). Despite the renewability and low-carbon intensity
of bioenergy, questions about the sustainability of bioenergy systems have been often raised
(Petrou and Pappis, 2009; Sheehan, 2009). When addressing the sustainability of a bioenergy
system, one must evaluate potential benefits and disadvantages from economic and environmental
perspectives (Zhang and Long, 2010). However, LCA bears some limitations in that: 1) it largely
ignores the ecosystem services and human labor service which are of significance to the
bioenergy development, and 2) it is unable to integrate environmental and economic costs (Hau
and Bakshi, 2004; Zhang et al., 2010).
Previous research has pointed out that the results of LCA studies seem to depend on the
selection of impact categories (Berger and Finkbeiner, 2011). Among multiple measurements
provided by LCA for assessing materials and energy uses, Global Warming Potential (GWP) is
the most often reported impact category in the bioenergy literature (Cherubini and Strømman,
2011). GWP is a measure of the equivalent carbon dioxide that allows for the relative weightings
of damaging greenhouse gasses (Shine, 2009), which is sometimes called Climate Change Impact
or a more recent name - Carbon Footprinting (CFP). Resting on the work of the
Intergovernmental Panel on Climate Change (IPCC), consideration and action on climate change
issues have been steered by political agendas, sometimes driven by the exclusive use of

96
stand-alone GWP evaluation (ISO, 2006). GWP has been a widely used metric of climate change
impacts and the main focus of many sustainability policies among companies and authorities
(Laurent et al., 2012). However, sustainability concerns not just climate change but also other
environmental problems and economic concerns (Laurent et al., 2012). Yossapoll et al. (2002)
noted that economic value and environmental performance should be linked in order to provide
"true" criteria for sustainability. Laurent et al. (2012) suggest that more broadly encompassing
tools are needed to assess and manage environmental sustainability.
EMA
Emergy analysis (EMA) and its applications are first introduced in Howard Odum' Book
"Environmental Accounting: Emergy and the environmental decision-making" (Odum, 1996).
The concept of Emergy as put forward by Odum has been considered as one of the few
approaches that can link economy and environment, and quantify both economic and
environmental inputs (Vassallo et al., 2007; Zhang and Long, 2010). As the concept slowly
comes into broader acceptance, EMA has been increasingly applied to evaluate bioenergy
systems (Ortega et al., 2005; Zhang and Long, 2010; Sha and Hurme, 2011).
Emergy is defined as the solar energy used directly or indirectly to generate a service or a
product (Odum, 1996). It is the only methodology yet developed that enables the analyst to
express all biospheric system inputs (e.g. energy, natural resources, human labor) in single unit -
solar energy equivalents - and thereby enabling the assessment of system performance on the
larger time and space scale (Hau and Bakshi, 2004). A number of indicators for the assessment of
the environmental sustainability are deducible from the described EMA (Odum, 1996):
1) Percent Renewability (PR): PR gives the degree of renewability. The higher PR value
indicates a more renewable process. Among the existing Emergy-based indicators, PR represents
the first measure of system sustainability: the lower the fraction of renewable Emergy used, the

97
higher the pressure on the environment (Zhang and Long, 2010). Brown and Ulgiati (Brown and
Ulgiati, 1997) suggested that only processes with high values of this index are sustainable in the
long run.
2) Emergy Yield Ratio (EYR): EYR measures how much a process will contribute to the
economy, also indicates how dependent the process is on the purchased inputs. The higher EYR
value indicates large amount of products is obtained per unit of money spent. This index indicates
the efficiency of the system using purchased inputs (Ortega et al., 2005).
3) Environmental Loading Ratio (ELR): ELR is the ratio between non-renewable and
imported Emergy used to renewable Emergy used. ELR represents the pressure of a
transformation process on the environment and can be considered as a measure of ecosystem
stress due to production (Ulgiati and Brown, 1998). A higher value of ELR indicates that
environmental cycles are overloaded (Pizzigallo et al., 2008).
4) Emergy Investment Ratio (EIR): EIR is the ratio of Emergy of purchased inputs to the
indigenous Emergy input (both renewable and non-renewable), and evaluates whether a process is
an economical user of the Emergy invested in comparison with alternatives (Brown and Ulgiati,
1997; Zhang and Long, 2010). A high level of EIR represents a certain fragility of the system due
to its dependence on inputs from other economic systems (Pizzigallo et al., 2008).
5) Emergy Sustainability Index (ESI): ESI is the ratio of the EYR to the ELR, which
measures the potential contribution of a resource or process to the economy per unit of
environmental loading (Zhang and Long, 2010). ESI is an aggregate measure of economic
performance and sustainability of the system considering both the contribution of renewable vs.
non-renewable resources and the need of purchased inputs to drive the process (Mirandola et al.,
2010). To be sustainable in the long run, a system should have a high EYR and low ELR, thus
resulting in a high ESI value (Sha and Hurme, 2011).

98
6) Transformity (Tr): Tr is defined as Emergy input per unit of available energy output
(Brown and Ulgiati, 2004). For example, assuming 4000 solar equivalent joules from the sun are
required to generate 1 joule of wood from the forest, then the solar transformity of the wood is
4000 solar emjoules per joule (abbreviated seJ/J). When comparing two or more processes with
the same output, transformity is a measure of efficiency representing more product obtained with
a given quantity of Emergy, or less Emergy needed to produce a given amount of product (Odum,
1996).
Relation of LCA and EMA indictors
It is recognized that different methods provide different perspectives and sometimes
hardly comparable results (Hau and Bakshi, 2004; Sciubba and Ulgiati, 2005). Since LCA and
EMA differ on definition, accounting scope, system boundary, measurement unit and conversion
factor (Odum, 1996; Norris, 2001; Brown and Buranakarn, 2003; ISO, 2010; Zhang et al., 2010),
researchers have begun to seek means of potential integration of LCA and EMA in order to
provide a broadly encompassing tool to assess and manage environmental sustainability.
However, most of those efforts have been done on the theoretical level (Zhang et al., 2010;
Ingwersen, 2011; Rugani and Benetto, 2012). The relationship between LCA and EMA results
remains unknown.
Given the large number of indicators provided by different environmental accounting
methods, researchers have started to simplify indictors that could serve as proxies for
environmental performance of a system (Laurent et al., 2012). A search of LCA and EMA
literature suggests a few studies have been done on LCA, but none on EMA indicators. In the
correlation studies of LCA indicators, for instance, the ecological footprint and the cumulative
energy demand from LCA were found to show significant correlation with other environmental
impact indicators (Huijbregts et al., 2006; Huijbregts et al., 2012). Another study by Berger and

99
Finkbeiner (2011) observed that Primary Energy Demand (PED) and Abiotic Depletion Potential
(ADP) are strongly correlated, and moderate correlations were found between GWP and PED as
well as ADP. Taking into account the significant correlations between some LCA indicators, it is
suggested that the number of indicators can be reduced as they lead to similar findings (Berger
and Finkbeiner, 2011). Therefore, the correlation between LCA and EMA indicators could help to
simplify indicators for assessing environmental sustainability of the system, and develop a better
integration solution to improve the quality of the ultimate environmental evaluation.
Methods
System boundary
The life cycle of biomass CHP system is divided into seven processes listed in Figure 5-1.
These seven processes were defined as the case study system boundary in both LCA and EMA.
The detailed accounting scope of LCA is presented on the left side of Figure 5-1 within dash line;
the EMA scope is detailed on the right side of the figure. Since climate change mitigation and
energy independence are the main driving forces for future bioenergy (Cherubini and Jungmeier,
2010), LCA outcome only focuses on Global Warming Potential (GWP) evaluated using IPCC
2007 on 100 years horizon (IPCC, 2007). Meanwhile, the six indicators commonly used by
previous EMA studies are selected as EMA outcomes in this study, including Percent
Renewability (PR), Emergy Yield Ratio (EYR); Environmental Loading Ratio (ELR); Emergy
Investment Ratio (EIT); Emergy Sustainability Index (ESI); and Transformity (Tr) (Table 5-1).
System functional unit
The main purpose of the functional unit is to provide a reference to which the input and
output process data are normalized and the basis on which the final results are shown (Cherubini
et al., 2009). In this study, the reference functional unit for GWP and Transformity (Tr) is 1

100
MMBtu thermal energy generation. The allocation criteria for the analysis is that 1 MMBtu of
electricity is equal to 3 MMBtu of heat when electricity is used in heat pump for heat generation
(Van Loo and Koppejan, 2008; Abusoglu and Kanoglu, 2009).
Modeling Procedure
The modeling methodology in LCA and EMA are slightly different. To measure GWP,
emissions from seven processes are accumulated and divided by all heat energy generated in one
year. EMA indicators are calculated through ratios among Renewable inputs (R), Non-renewable
inputs (N) and Purchased inputs (F) (Odum, 1996). The modeling uses primary data from a
validated life cycle inventory of 6.4 MWth CHP plant in Europe available in SimaPro 7.3
database.
Life Cycle Processes of biomass CHP system
The entire life cycle of wood biomass CHP system is divided into seven processes. The
shared assumptions for each process in LCA and EMA are summarized in italics in Table 5-2;
assumptions that differ between the methods are detailed in the shaded boxes of the same table.
The assumptions in Table 5-2 are detailed in the following text.
1) Woodchips production: Woodchips production was assumed to be carried out by a
stationary chopper, which has electric input of 25 kw, hourly output of 3.3 m3/h bulked chips, and
a life time output of 100,000 m3 bulked chips. In addition of electric input, the chopper also
consumes lubricant oil and steel during operation. Besides all the material and energy uses as
specified by LCA, human labor input is added in EMA through Emergy-money index. The cost
of wood chipping process in this study consisting of capital cost of chopper, electricity use and
human labor service, is estimated to be $7.58 per cubic meters.
2) Woodchips Transportation: Woodchips were assumed to be transported by Lorry
with average load of 25 tonnes and empty on the returning trip. Besides fuel uses in this process,

101
the human labor service is also accounted in EMA, which was estimated by the cost of driver’s
hourly payment and transportation distance.
3) Facility Construction: The lifetime of plant facility was assumed to be 20 years in the
analysis of LCA. EMA uses capital cost of plant construction to estimate Emergy input, which
was estimated at $3.8 million US in 2010 (Salomon et al., 2011).
4) Chemical uses: The chemicals needed for plant operation include lubricant oil,
ammonia, organic chemicals, sodium chloride, chlorine and decarbonized water. LCA accounts
for emissions of all these chemical production. In contrast, transformities of these chemicals were
used to estimate Emergy input in EMA (Odum, 1996) (Table 5-3).
5) Plant operation: LCA accounts for all the emission from combustion process which is
available in SimaPro 7.3 database. For EMA, human labor cost involved in the plant operation
was used to calculate Emergy input. The labor requirement was estimated as 1 person per shift,
with one additional manager on the day shift. Total 3 shifts per day was assumed. The operation
time was assumed to be 7,654 hours per year (87.4%). The salary and social expenses were
estimated at $64,000 US per worker annually and $90,000 US per manager annually based on the
U.S. Bureau Labor Statistics (BLS, 2011).
6) Waste disposal: Three types of waste were assumed to be generated in the biomass
CHP plant, including mineral oil, municipal solid waste, and sewage. LCA takes into account
from three treatments, which are documented in SimaPro 7.3 database. The cost of these three
waste disposals was used to estimate Emergy inputs in EMA (SCGOV, 2012). The estimated
costs for each treatment are shown in Table 5-4 below.
7) Ash disposal: For LCA, the amount of ash generated is determined by the amount of
wood burned and its ash content. Ash content was assumed to be 1.1% on dry weight basis. In
EMA, the cost of wood ash disposal was estimated as $45 US per ton (Zwahr, 2004).

102
Biomass CHP system factors
Factors of biomass CHP system having significant impact on LCA results were used to
conduct Monte Carlo Simulation. Monte Carlo Simulation model was developed by substituting a
range of values for biomass CHP system factor that has inherent uncertainty (Mooney, 1997).
Then results are repeatedly calculated with different sets of random values from the probability
functions. Each of the four factors are assumed to have normal probability distribution, with a
mean and standard deviation. Normal distribution was chosen because it is the most likely
distribution for independent random factor whose distribution is unknown according to central
limit theorem (Ott et al., 2001). Where data were not readily available, a partial least-squares
(PLS) regression model based on existing data was developed.
This study used four biomass CHP system factors in Monte Carlo Simulation, including
Emission control (EC), feedstock moisture content (MC), transportation distance (TD) and power
to heat ratio (PHR). The detailed description of factors is given below.
1) Emission control factor in this study represents whether urea treatment is implemented
or not for exhaust gases release. It was assumed that two scenarios (with or without urea
treatment) are equally likely to occur.
2) Lower Heating Value of biomass is generally used to calculate the energy input into
the boiler (Van Loo and Koppejan, 2008), which decreases as the increase of moisture content of
biomass fuel (Van Loo and Koppejan, 2008). In this study, the relationship between LHV and
moisture content provided by Van Loo and Koppejan (2008) was used to develop the assumption
for feedstock moisture content, that is, moisture content (wet basis) of woodchips was assumed to
be normally distributed with mean of 25% and standard deviation of 7.5%.
3) Transportation distance was assumed to be normally distributed with mean of 60km
and standard deviation of 15km based on previous studies' assumptions on transportation distance
(Hoogwijk et al., 2009; Timmons and Mejía, 2010; Brechbill et al., 2011).

103
4) PHR and energy efficiency was assumed to have this linear relationship: with increases
of PHR from 0.1-0.4, the energy efficiency at facility decreases from 85% to 65% (EPA, 2008;
Sha and Hurme, 2011). PHR was assumed having normal distribution with mean of 0.25 and
standard deviation of 0.075 as suggested by Van Loo and Koppejan (2008).
Statistical analysis
The Monte Carlo method repeatedly sampled one thousand random data points to
generate numerical results for the LCA and EMA models, based on the assumed distribution
probabilities for the four biomass CHP system factors (Appendix E). Correlation between LCA
and EMA indicator results were analyzed using the Pearson's correlation using statistical software
of Minitab 16. The correlation analysis was used to determine potential dependencies between
indicators and if the number of indicators can be reduced.
Results
Correlation analysis of LCA and EMA results
The results of the correlation analysis of GWP and Emergy indicators assessing biomass
CHP system are shown in Table 5-5 and Figure 5-2. The strong correlation coefficients are
highlighted in bold in Table 5-5.
Correlation between GWP and EMA indicators
Results from the Pearson's correlation tests show that correlation of determination range
between 0.03 and 0.15 for GWP and six EMA indicators, suggesting very poor correlation (Table
5-5). This weak correlation reveals that LCA and EMA present different aspects of environmental
performance of the system, and in order to provide more comprehensive environmental
sustainability evaluation, joint use of these two methods are needed. In addition, with regard to
the measurement of environmental consequence, the selection of indicators has a high impact on

104
the results (Laurent et al., 2012). This poor correlation between LCA and EMA indicators reveals
the fundamental challenge in using single indicator to reflect the complex environmental
consequence of a product system.
Correlation among EMA indicators
Strong correlations are found between PR, ELR and ESI (R2 = 0.98, and 0.94,
respectively) (Table 5-5), suggesting that these three indicators lead to similar results. It is worth
noting that the a higher value of EIR indicates that environmental cycles are overloaded
(Pizzigallo et al., 2008). The negative correlation coefficients of ELR and PR as well as ESI
suggest that the system having high PR also rates high on ELR and low on ELR, presenting better
environmental performance from these three aspects. Therefore, the number of indicators can be
reduced to one to sufficiently represent the three aspects of sustainability of the system. For
example, the EMA practitioner could choose to use PR, which is relatively easy to understand,
as a proxy for the other two indicators, ELR and ESI.
In addition, a strong correlation (R2 =0.96) is observed between the remaining two EMA
indicators of EYR and EIR (Table 5-5), which leads to conclusion that it is sufficient to choose
either one to evaluate the system. EIR measures the fragility of the system due to its dependence
on inputs from other economy system thus a low value of EIR is favorable to the system in terms
of its sustainability. The negative correlation between EIR and EYR indicates that a system with
high score of EYR rates low on the fragility of the system relative to other systems, representing
the better sustainability of the system.
Correlation between GWP/Biogenic Carbon Emission and Tr
Figure 5-3 shows the relation between Tr and GWP for two types of emission control:
with and without urea treatment. The Pearson's correlation coefficients (R) of Tr and GWP for
two scenarios (with and without urea treatment) are 0.749 and 0.611, respectively. This suggests

105
that as the system GWP emission increases, the solar energy inputs of the system also increases in
both scenarios in terms of emission control. Another observation is that the system with urea
treatment as emission control has higher GWP rating than the one without urea treatment. It is
found that the GWP increase by using urea for flue gas treatment in biomass CHP plant is not
caused by production or transportation of urea, but by the resulting emission of Dinitrogen
Monoxide (N2O), which is considered to have 298 times more GWP impact than CO2 (IPCC,
2007). This explains the large impact EC has on the total GWP, and is also a good example of
LCA indicator assessment presenting results that are in conflict with each other. The urea
treatment of emission, when performed, is done so for the human health benefits of reducing
nitrous oxide (NOx) emission, but doing so increases the GWP of the emission of the operation.
Considering that there are different emission control options available depending on emission
regulation and technologies from different regions, it is difficult to use GWP to predict
transformity for biomass CHP systems in different regions.
Surprisingly, a nearly perfect positive correlation (R2=0.98) is found between LCA-based
biogenic CO2 emission and EMA-based Tr (Figure 5-4). This relationship is the same: whether
urea treatment is used with the emission control, or not. Thus biogenic CO2 emission from LCA
could be used to predict Tr of energy of a biomass CHP system for EMA.
Discussion and conclusions
Decisions concerning energy use and investments in bioenergy development require that
decision-makers have the ability to compare holistic analyses of net yields, environmental impact,
and sustainability (Zhang and Long, 2010). A discussion of correlation analysis among LCA
indicators can be found in previous work (Berger and Finkbeiner, 2011), while this study
examines the correlation between the most important LCA indicator (GWP) and six EMA
indicators for bioenergy system.

106
The findings of this study suggest no significant correlation between GWP and multiple
EMA indicators (R2=0.03~0.15). Possible explanation might be the methodological differences.
Firstly, the system inputs accounted for the indicators differ. EMA indicators represent all inputs
required to sustain the system including fossil fuel, human service, and ecosystem service, while
GWP result from LCA only takes fossil fuels consumption into account. Secondly, the expression
of the results is different. EMA indicators are expressed with respect to the system itself rather
than a chosen functional unit like GWP, which is presented as greenhouse gas per unit of product.
This advances the idea that GWP from LCA is insufficient to measure the environmental
sustainability of a bioenergy system. And the poor correlation between GWP and EMA indicators
implies that in order to provide more comprehensive environmental sustainability evaluation,
joint use of these two methods are needed.
Among EMA indicators, strong correlations are found between PR, ELR and ESI (R2 =
0.98, and 0.94, respectively), and between EYR and EIR (R2 = 0.96). These strong correlations
might also be explained in a similar way. PR, ELR and ESI are assessing environmental burden
of the system, while EYR and EIR are both representing how the system interacts with economy.
The strong correlations suggest that the number of Emergy indicators can be reduced as they lead
to similar findings.
The relationship between Tr and GWP is found to be different depending on the emission
control options. Moderate correlations are observed for two emission control scenarios: with and
without urea treatment (R2=0.56 and 0.37, respectively). Since there are many emission control
technologies available depending on emission regulation from different regions, it is difficult to
use LCA-based GWP to predict the Tr of energy from a particular biomass CHP system.
However, a nearly perfect correlation is found between biogenic CO2 emission and Tr (R2 =0.98).
This strong relationship contributes an easy and straightforward way to calculate the transformity
for biomass CHP system by using LCA-based biogenic CO2 emission. The findings provide a

107
way of using standardized LCA databases and LCA framework to increase the application of
EMA concept in environmental decision-making when analyzing renewable energy systems.
Although the full integration of EMA in LCA might need more research efforts to overcome the
challenges, for example, calculating transformity for elementary resources, implementation of
EMA algebra in to LCA, and expansion of the scope of LCA, the joint use of LCA and EMA on
the biomass CHP of this study offers evidence that complementary use of the techniques may
provide better assessment perspectives towards a nature-oriented evaluation of natural resources.

108
Figure 5-1 Comparison of system boundary and accounting scope between LCA and EMA in analyzing production chain of biomass CHP system
Woodchips production
Woodchips Transport
Waste disposal
Chemical uses
Construction, maintenance of chipper, and energy use
Construction, maintenance of truck, and diesel use
Energy and material consumption for waste and
ash disposal
Plant operation
Construction, maintenance of plant, and combustion
emission from stack
Account for all emissions due to production and use of materials, fuels and energy
Account for all solar energy inputs of materials, fuels, energy and labor
Global Warming Potential (GWP)
Ash disposal
Plant construct
ion
Plant growing, Chipping cost, includes energy use
and labor
Delivery cost, includes diesel use and labor
MSW, mineral oil, and ash disposal cost
Construction cost, chemicals uses and
operation labor
Emergy indicators

109
Figure 5-2 Correlation between GWP and EMA indicators

110
Figure 5-3 Scatterplots of transformity against LCA-based GWP

111
Figure 5-4 Scatterplots of Tr against Biogenic CO2 emission

112
Table 5-1 EMA indicators abbreviation and formula
Indicator Abbreviation and formula Unit Percent Renewability PR= R/(R+N+F) ratio Emergy Yield Ratio EYR= Y/F ratio Environmental Loading Ratio ELR=(F+N)/R ratio Emergy Investment Ratio EIR= F/(R+N) ratio Emergy Sustainability Index ESI= EYR/ELR ratio Transformity Tr=R+N+F Sej/MMBtu

113
Table 5-2 Summary of life cycle processes assumptions in LCA and EMA
Life Cycle Process LCA EMA
Equipment: stationary chopper Electric input: 25kw Hourly output: 3.3m3/hour Life time: 100,00 m3
Woodchips production
Material and energy use Additional human labor cost:
$7.58 per m3 Equipment: lorry Load capacity: 25 ton, and empty on returning trip
Transportation
Fuels and necessary maintenance Additional human labor cost: $25/hour Life time: 20 years Facility
construction All material and energy use for construction
Capital cost: $3.8 million US dollar in 2010
Operation hour: 7,654 hours/year (87.4%)
Plant operation Emissions from combustion process
Labor cost: Three shifts per day
1 person per shift with one additional manager on the day shift
Labor expense: $64,000 per worker, $90,000 per manager
Lubricant oil, ammonia, organic chemicals, sodium chloride, chlorine and decarbonized water Chemical uses
Emissions Transformity Mineral oil Municipal solid waste Sewage Waste disposal
Emissions due to disposal and treatments of waste
Disposal costs
Ash content: 1.1% on dry weight basis Ash disposal
Emissions due to disposal Disposal cost: $45 per ton

114
Table 5-3 Transformity and Emergy per unit mass of used chemical
Chemicals unit Transformity (sej/unit) Source Lubricant oil g 2.82E+09 (Odum, 1996) Ammonia g 3.80E+09 (Odum, 1996) Chemicals g 1.60E+09 (Odum, 1996) Chlorine g 1.60E+09 (Odum, 1996) Sodium Chloride g 1.00E+09 (Odum, 1996) Water g 6.64E+05 (Odum, 1996)

115
Table 5-4 Disposal cost of waste
Disposal cost Disposal cost ($/ton) Source Mineral oil 75 (SCGOV, 2012) MSW (municipal solid waste) 57 (SCGOV, 2012) Sewage 45 (SCGOV, 2012)

116
Table 5-5 Correlation of determination (R2) between GWP and EMA indicators
GWP PR EYR ELR EIR ESI
GWP 1
PR 0.15* 1
EYR 0.10 0.53 1
ELR 0.15 0.98* 0.53* 1
EIR 0.10* 0.50* 0.96* 0.52 1
ESI 0.03* 0.94 0.76 0.94* 0.76* 1
* The sign of correlation coefficient is negative.

117
Chapter 6: CONCLUSIONS AND RECOMMENDATIONS
This chapter summarizes the conclusions based on the research objectives proposed for
the dissertation, which are restated as following:
1) The first objective is to investigate the similarities and incompatibilities between Life
Cycle Assessment (LCA) and Emergy analysis (EMA) by using a significant case study -
a wood biomass CHP system, and to discover the "optimal field of application" for each
method;
2) The second objective is to examine the uncertainties and sensitivities of LCA-based
Global Warming Potential (GWP) and EMA outcomes due to different CHP system
factors, including emission control (EC); feedstock moisture content (MC);
transportation distance (TD); and power to heat ratio (PHR);
3) The third objective is to investigate the relationship between LCA-based GWP and EMA
indicators to check if there is correlation between LCA and EMA results, and if the
number of EMA indicators can be reduced.
4) The fourth objective is to explore the relationship between LCA-based GWP and
EMA-based transformity to see if LCA database and framework can be used in EMA for
further integration.
Objective 1: to investigate the similarities, differences and incompatibilities between LCA
and EMA, and identify "optimal field of application" for each method.
The results of case study presented in the study are paradigmatic: they clearly show that
information provided by the two environmental accounting methods (i.e., LCA and EMA) is
complementary rather than competing. The two methods display "optimal field of application":

118
1) LCA is a useful assessment method to evaluate local and global environmental impacts
of the system. Its usefulness is very limited to the assessment of a specific system. However,
LCA may be and is commonly used within clearly-stated assumptions, to compare two similar
processes and thereby provides environmental sciences a continuous benchmarking tool.
2) EMA provides a more robust assessment of interconnection between an industrial
process, its recognized environmental dynamics and its economic potential. Its capability to
account for externalities expands its usefulness over a broader spectrum of cases, but also limits
its use for improvement of a specific process. The crucial benefit of EMA is that it provides an
approach aimed for maximizing utilization efficiency of local environmental resources in support
of industrial process and economy. Simply speaking, EMA answers the question "What is the
most efficient product or process?" while LCA answers "How can we improve environmental
efficiency of a specific product or process?".
Objective 2: to compare the uncertainties and sensitivities of LCA-based GWP and EMA
indicators due to uncertain CHP system factors.
1) The higher degree of uncertainty of LCA confirms the need of reporting uncertainty in
the LCA studies suggested by previous research (Cherubini et al., 2009; ISO, 2010). The
objective and subjective uncertainty are inherent in the current LCA approach, and cannot be
overcome even if the practitioner strictly follows the procedures described in the LCA standards,
which results in the risk of making conclusions that cannot be justified strictly by the results
indicated by the many and various LCA indicators. Therefore, uncertainty and sensitivity analysis
should always be reported in the LCA final results, and should be presented with ranges that take
into account all the different assumptions and variables.
2) EMA results are subject to smaller degree of uncertainty due to different assumptions
of system factors. Free environmental service and human labor cost included in the biomass

119
growing, operation cost, and capital investment are observed to account for large amount of total
Emergy inputs, and could be the potential sources leading to uncertainty of EMA. However, these
vital inputs are not accounted by LCA, which would limit its usefulness for a larger picture. Thus,
using LCA to evaluate an energy system and improve its performance by lowering its
environmental impact (i.e. GWP) will not necessarily increase sustainability, and in some cases,
the effect could be opposite. In contrast, EMA expands its boundary to account for other flows in
addition to energy and material consumptions, which theoretically provides valuable insight about
environmental sustainability for systems that largely interact with environment and economy,
such as agriculture food systems and energy production systems.
The contributions of life cycle processes to LCA and EMA uncertainties differ. Stack
emission from the plant operation process and feedstock transportation process in LCA are found
to have the highest contribution to GWP uncertainty, while feedstock growing & chipping, and
plant operation have the most impact on total Emergy input in EMA. In this case study, at least,
LCA and EMA conclusions have resulted in different focuses and approaches for system
environmental performance improvement.
Objective 3: to investigate the relationship between LCA-based GWP and EMA indicators
to check if there is correlation between LCA and EMA results, and if the number of EMA
indicators can be reduced.
The findings of this study suggest no significant correlation between GWP and multiple
EMA indicators (R2=0.03~0.15). Possible explanation might be the methodological differences.
Firstly, the system inputs accounted for the indicators differ. EMA indicators represent all inputs
required to sustain the system including fossil fuel, human service, and ecosystem service, while
GWP result from LCA only takes fossil fuels consumption into account. Secondly, the expression
of the results is different. EMA indicators are expressed with respect to the system itself rather

120
than a chosen functional unit like GWP, which is presented as greenhouse gas per unit of product.
This advances the idea that GWP from LCA is insufficient to measure the environmental
sustainability of a bioenergy system. And the poor correlation between GWP and EMA indicators
implies that in order to provide more comprehensive environmental sustainability evaluation,
joint use of these two methods are needed.
Among EMA indicators, strong correlations are found between PR, ELR and ESI (R2 =
0.98, and 0.94, respectively), and between EYR and EIR (R2 = 0.96). These strong correlations
might also be explained in a similar way. PR, ELR and ESI are assessing environmental burden
of the system, while EYR and EIR are both representing how the system interacts with economy.
The strong correlations suggest that the number of Emergy indicators can be reduced as they lead
to similar findings.
Objective 4: to explore the relationship between LCA-based GWP and EMA-based
transformity to see if LCA database and framework can be used in EMA for further
integration.
The relationship between Tr and GWP is found differ depending on the emission control
options. Moderate correlations are observed for two emission control scenarios: with and without
urea treatment (R2=0.56 and 0.37, respectively). Since there are many emission control
technologies available depending on emission regulation from different regions (Van Loo and
Koppejan, 2008), it is difficult to use LCA-based GWP to predict the Tr of energy from a
particular biomass CHP system. However, a nearly perfect correlation is found between biogenic
CO2 emission and Tr (R2 =0.98). This strong relationship contributes an easy and straightforward
way to calculate the transformity for biomass CHP system by using LCA-based biogenic CO2
emission. The findings provide a way of using standardized LCA databases and LCA framework
to increase the application of EMA concept in environmental decision-making when analyzing

121
renewable energy systems. Although the full integration of EMA in LCA might need more
research efforts to overcome the challenges, for example, calculating transformity for elementary
resources, implementation of EMA algebra in to LCA, and expansion of the scope of LCA, the
joint use of LCA and EMA on the biomass CHP system of this study offers evidence that
complementary use of the techniques may provide better assessment perspectives towards a
nature-oriented evaluation of natural resources.
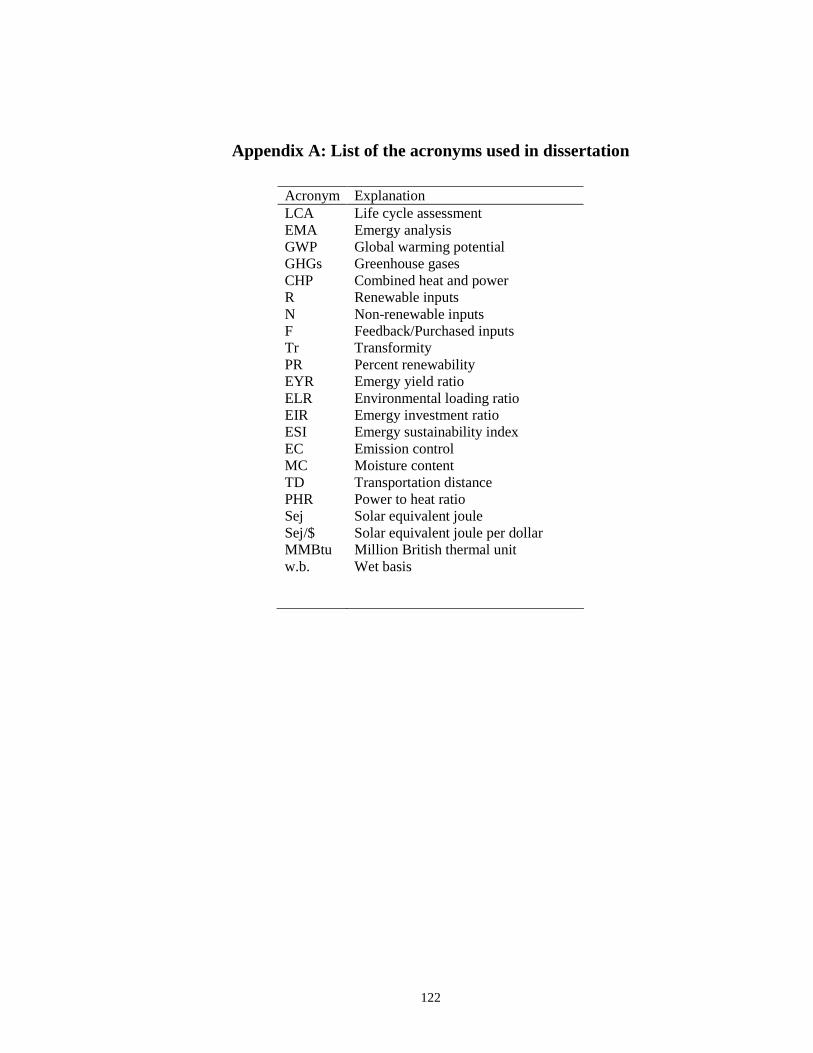
122
Appendix A: List of the acronyms used in dissertation
Acronym Explanation LCA Life cycle assessment EMA Emergy analysis GWP Global warming potential GHGs Greenhouse gases CHP Combined heat and power R Renewable inputs N Non-renewable inputs F Feedback/Purchased inputs Tr Transformity PR Percent renewability EYR Emergy yield ratio ELR Environmental loading ratio EIR Emergy investment ratio ESI Emergy sustainability index EC Emission control MC Moisture content TD Transportation distance PHR Power to heat ratio Sej Solar equivalent joule Sej/$ Solar equivalent joule per dollar MMBtu Million British thermal unit w.b. Wet basis

123
Appendix B: Global Warming Potentials of substances relative to CO2
IPCC 2007 is the successor of the IPCC 2001 method, which was developed by the Intergovernmental Panel on Climate Change. IPCC 2007 contains the climate change factors of air emissions with a timeframe of 20, 100 , 500 years. IPCC characterization factors for the direct global warming potential of air emissions within 100 years timeframe are listed in the following table extracted from SimaPro 7.3 software. Global Warming Potentials of substances relative to CO2 for 100 years timeframe
Substance CAS number Factor Unit
1-Propanol, 3,3,3-trifluoro-2,2-bis(trifluoromethyl)-, HFE-7100
014117-17-0 297 kg CO2 eq / kg
Butane, 1,1,1,3,3-pentafluoro-, HFC-365mfc 000406-58-6 794 kg CO2 eq / kg Butane, perfluoro- 000355-25-9 8860 kg CO2 eq / kg Butane, perfluorocyclo-, PFC-318 000115-25-3 10300 kg CO2 eq / kg Carbon dioxide 000124-38-9 1 kg CO2 eq / kg Carbon dioxide, fossil 000124-38-9 1 kg CO2 eq / kg Carbon dioxide, land transformation 000124-38-9 1 kg CO2 eq / kg Chloroform 000067-66-3 31 kg CO2 eq / kg Dimethyl ether 000115-10-6 1 kg CO2 eq / kg Dinitrogen monoxide 010024-97-2 298 kg CO2 eq / kg Ethane, 1-chloro-1,1-difluoro-, HCFC-142b 000075-68-3 2310 kg CO2 eq / kg Ethane, 1-chloro-2,2,2-trifluoro-(difluoromethoxy)-, HCFE-235da2
026675-46-7 350 kg CO2 eq / kg
Ethane, 1,1-dichloro-1-fluoro-, HCFC-141b 001717-00-6 725 kg CO2 eq / kg Ethane, 1,1-difluoro-, HFC-152a 000075-37-6 124 kg CO2 eq / kg Ethane, 1,1,1-trichloro-, HCFC-140 000071-55-6 146 kg CO2 eq / kg Ethane, 1,1,1-trifluoro-, HFC-143a 000420-46-2 4470 kg CO2 eq / kg Ethane, 1,1,1,2-tetrafluoro-, HFC-134a 000811-97-2 1430 kg CO2 eq / kg Ethane, 1,1,2-trichloro-1,2,2-trifluoro-, CFC-113 000076-13-1 6130 kg CO2 eq / kg Ethane, 1,1,2-trifluoro-, HFC-143 000430-66-0 353 kg CO2 eq / kg Ethane, 1,1,2,2-tetrafluoro-, HFC-134 000359-35-3 1100 kg CO2 eq / kg Ethane, 1,2-dibromotetrafluoro-, Halon 2402 000124-73-2 1640 kg CO2 eq / kg Ethane, 1,2-dichloro-1,1,2,2-tetrafluoro-, CFC-114 000076-14-2 10000 kg CO2 eq / kg Ethane, 1,2-difluoro-, HFC-152 000624-72-6 53 kg CO2 eq / kg Ethane, 2-chloro-1,1,1,2-tetrafluoro-, HCFC-124 002837-89-0 609 kg CO2 eq / kg Ethane, 2,2-dichloro-1,1,1-trifluoro-, HCFC-123 000306-83-2 77 kg CO2 eq / kg Ethane, chloropentafluoro-, CFC-115 000076-15-3 7370 kg CO2 eq / kg Ethane, fluoro-, HFC-161 000353-36-6 12 kg CO2 eq / kg Ethane, hexafluoro-, HFC-116 000076-16-4 12200 kg CO2 eq / kg Ethane, pentafluoro-, HFC-125 000354-33-6 3500 kg CO2 eq / kg Ether, 1,1,1-trifluoromethyl methyl-, HFE-143a 000421-14-7 756 kg CO2 eq / kg Ether, 1,1,2,2-Tetrafluoroethyl 2,2,2-trifluoroethyl-, HFE-347mcc3
000406-78-0 575 kg CO2 eq / kg
Ether, 1,1,2,2-Tetrafluoroethyl 2,2,2-trifluoroethyl-, HFE-347mcf2
000406-78-0 374 kg CO2 eq / kg

124
Substance CAS number Factor Unit
Ether, 1,1,2,2-Tetrafluoroethyl methyl-, HFE-254cb2 000425-88-7 359 kg CO2 eq / kg Ether, 1,1,2,3,3,3-Hexafluoropropyl methyl-, HFE-356mec3 000382-34-3 101 kg CO2 eq / kg Ether, 1,1,2,3,3,3-Hexafluoropropyl methyl-, HFE-356pcc3 000382-34-3 110 kg CO2 eq / kg Ether, 1,1,2,3,3,3-Hexafluoropropyl methyl-, HFE-356pcf2 000382-34-3 265 kg CO2 eq / kg Ether, 1,1,2,3,3,3-Hexafluoropropyl methyl-, HFE-356pcf3 000382-34-3 502 kg CO2 eq / kg Ether, 1,2,2-trifluoroethyl trifluoromethyl-, HFE-236ea2 084011-06-3 989 kg CO2 eq / kg Ether, 1,2,2-trifluoroethyl trifluoromethyl-, HFE-236fa 084011-06-3 487 kg CO2 eq / kg Ether, 2,2,3,3,3-Pentafluoropropyl methyl-, HFE-365mcf3 000378-16-5 11 kg CO2 eq / kg Ether, di(difluoromethyl), HFE-134 001691-17-4 6320 kg CO2 eq / kg Ether, difluoromethyl 2,2,2-trifluoroethyl-, HFE-245cb2 001885-48-9 708 kg CO2 eq / kg Ether, difluoromethyl 2,2,2-trifluoroethyl-, HFE-245fa1 001885-48-9 286 kg CO2 eq / kg Ether, difluoromethyl 2,2,2-trifluoroethyl-, HFE-245fa2 001885-48-9 659 kg CO2 eq / kg Ether, ethyl 1,1,2,2-tetrafluoroethyl-, HFE-374pc2 000512-51-6 557 kg CO2 eq / kg Ether, pentafluoromethyl-, HFE-125 003822-68-2 14900 kg CO2 eq / kg Hexane, perfluoro- 000355-42-0 9300 kg CO2 eq / kg HFE-227EA 1540 kg CO2 eq / kg HFE-236ca12 (HG-10) 2800 kg CO2 eq / kg HFE-263fb2 11 kg CO2 eq / kg HFE-329mcc2 919 kg CO2 eq / kg HFE-338mcf2 552 kg CO2 eq / kg HFE-338pcc13 (HG-01) 1500 kg CO2 eq / kg HFE-347pcf2 580 kg CO2 eq / kg HFE-43-10pccc124 (H-Galden1040x) 1870 kg CO2 eq / kg Methane 000074-82-8 25 kg CO2 eq / kg Methane, biogenic 000074-82-8 22 kg CO2 eq / kg Methane, bromo-, Halon 1001 000074-83-9 5 kg CO2 eq / kg Methane, bromochlorodifluoro-, Halon 1211 000353-59-3 1890 kg CO2 eq / kg Methane, bromodifluoro-, Halon 1201 001511-62-2 404 kg CO2 eq / kg Methane, bromotrifluoro-, Halon 1301 000075-63-8 7140 kg CO2 eq / kg Methane, chlorodifluoro-, HCFC-22 000075-45-6 1810 kg CO2 eq / kg Methane, chlorotrifluoro-, CFC-13 000075-72-9 14400 kg CO2 eq / kg Methane, dibromo- 000074-95-3 1.54 kg CO2 eq / kg Methane, dichloro-, HCC-30 000075-09-2 8.7 kg CO2 eq / kg Methane, dichlorodifluoro-, CFC-12 000075-71-8 10900 kg CO2 eq / kg Methane, dichlorofluoro-, HCFC-21 000075-43-4 151 kg CO2 eq / kg Methane, difluoro-, HFC-32 000075-10-5 675 kg CO2 eq / kg Methane, fluoro-, HFC-41 000593-53-3 92 kg CO2 eq / kg Methane, fossil 000074-82-8 25 kg CO2 eq / kg Methane, iodotrifluoro- 002314-97-8 0.4 kg CO2 eq / kg Methane, monochloro-, R-40 000074-87-3 13 kg CO2 eq / kg Methane, tetrachloro-, CFC-10 000056-23-5 1400 kg CO2 eq / kg Methane, tetrafluoro-, CFC-14 000075-73-0 7390 kg CO2 eq / kg Methane, trichlorofluoro-, CFC-11 000075-69-4 4750 kg CO2 eq / kg Methane, trifluoro-, HFC-23 000075-46-7 14800 kg CO2 eq / kg Nitrogen fluoride 007783-54-2 17200 kg CO2 eq / kg

125
Substance CAS number Factor Unit
Pentane, 2,3-dihydroperfluoro-, HFC-4310mee 138495-42-8 1640 kg CO2 eq / kg Pentane, perfluoro- 000678-26-2 9160 kg CO2 eq / kg PFC-9-1-18 7500 kg CO2 eq / kg PFPMIE 10300 kg CO2 eq / kg Propane, 1,1,1,2,2,3-hexafluoro-, HFC-236cb 000677-56-5 1340 kg CO2 eq / kg Propane, 1,1,1,2,3,3-hexafluoro-, HFC-236ea 000431-63-0 1370 kg CO2 eq / kg Propane, 1,1,1,2,3,3,3-heptafluoro-, HFC-227ea 000431-89-0 3220 kg CO2 eq / kg Propane, 1,1,1,3,3,3-hexafluoro-, HCFC-236fa 000690-39-1 9810 kg CO2 eq / kg Propane, 1,1,2,2,3-pentafluoro-, HFC-245ca 000679-86-7 693 kg CO2 eq / kg Propane, 1,1,3,3-tetrafluoro-, HFC-245fa 004556-24-5 1030 kg CO2 eq / kg Propane, 1,3-dichloro-1,1,2,2,3-pentafluoro-, HCFC-225cb 000507-55-1 595 kg CO2 eq / kg Propane, 3,3-dichloro-1,1,1,2,2-pentafluoro-, HCFC-225ca 000422-56-0 122 kg CO2 eq / kg Propane, perfluoro- 000076-19-7 8830 kg CO2 eq / kg Propane, perfluorocyclo- 17340 kg CO2 eq / kg Sulfur hexafluoride 002551-62-4 22800 kg CO2 eq / kg Trifluoromethylsulfur pentafluoride 000373-80-8 17700 kg CO2 eq / kg

126
Appendix C: LCA calculation worksheet for biomass CHP system
System components Unit Amount required to
generate 1 functional unit of product
Associated GWP emissions
Chemical and material use in plant
Lubricant oil kg
Ammonia kg
Chemicals kg
Chlorine kg
Sodium Chloride kg
Water kg
Construction
Construction of common component for cogeneration unit
piece
Construction of building piece
Emission control: Urea kg
Woodchips use m3
Transportation distance km
Moisture content %
Power-to-heat ratio -
Electricity output kwh
Heat output MMBtu
Total energy per year MMBtu/year
Operation factor %
Functional unit 1 MMBtu
Total function unit per year

127
Appendix D: EMA calculation worksheet for biomass CHP system
System components unit Transformity
(sej/unit)
Amount per year
(units/year)
Emergy input
(sej/year)
Input category
Chemical and material use in plant
Lubricant oil g 2.82E+09 N
Ammonia g 3.80E+09 N
Chemicals g 1.60E+09 N
Chlorine g 1.60E+09 N
Sodium Chloride g 1.00E+09 N
Water g 6.64E+05 R
Construction
Capital cost $ 1.37E+12 F
Urea g 2.15E+09 N
Oxygen in air g 5.16E+07 R
Forest wood g 2.57E+07 R
Harvesting labor $ 1.37E+12 F
Transporting labor $ 1.37E+12 F
Plant labor $ 1.37E+12 F
Ash disposal cost $ 1.37E+12 F
Ash disposal cost $ 1.37E+12 F
Waste disposal cost $ 1.37E+12 F
Transportation distance km
Moisture content %
Power-to-heat ratio -
Electricity output kwh
Heat output MMBtu
Total energy per year MMBtu/year
Operation factor %
Functional unit 1 MMBtu
Total function unit per year

128
Appendix E: Histogram of uncertain biomass CHP system factors in Monte
Carlo simulation

129
Appendix F: Classification of Emergy flows for biomass CHP system
Emergy flows Unit Units/MMBtu Transformity
(sej/unit) Solar energy (sej/MMBtu)
cv % of
Emergy
Renewable inputs (R) Water g 7.97E+02 6.64E+05 5.29E+08 < 2% 0.01%
Oxygen from air g 9.28E+04 5.16E+07 4.79E+12 3.05% 31.09% Wood in forest g 1.33E+05 2.57E+07 3.41E+12 3.05% 22.14%
Nonrenewable inputs (N)
Lubricant oil g 3.32E+00 2.82E+09 9.36E+09 < 2% 0.06% Ammonia g 8.30E-03 3.80E+09 3.15E+07 < 2% 0.00% Chemicals g 5.81E+00 1.60E+09 9.30E+09 < 2% 0.06%
Chlorine g 3.32E-01 1.60E+09 5.31E+08 < 2% 0.00% Sodium Chloride g 4.15E+00 1.00E+09 4.15E+09 < 2% 0.03%
Urea g 1.37E+01 2.15E+09 2.94E+10 94.24% 0.19%
Purchased inputs (F) Capital cost $ 0.92 1.37E+12 1.26E+12 < 2% 8.18%
Harvesting and processing cost
$ 2.67 1.37E+12 3.66E+12 3.05% 23.75%
Transporting cost $ 0.23 1.37E+12 3.09E+11 19.96% 2.01% Plant operation cost $ 1.37 1.37E+12 1.88E+12 < 2% 12.17%
Ash disposal cost $ 0.03 1.37E+12 4.63E+10 3.05% 0.30% Waste disposal cost $ 0.00 1.37E+12 6.49E+08 < 2% 0.00%

130
Appendix G: A timeline of major research events
Date Event Status April 22, 2010 • Candidacy exam Completed June, 2012 • Committee approval of dissertation proposal Completed
October, 2012 • Complete the preliminary data analysis of LCA and EMA results
Completed
November 13, 2012 • Comprehensive exam Completed
December, 2013
• Change mathematical model to Monte Carlo model by replacing fixed values of CHP system factors with random values
• Complete preliminary data analysis of LCA and EMA results from newly developed model
Completed
January, 2013 • Revise research methodology • Dissertation layout
Completed
February, 2013
• Draft the Chapter 4: the uncertainty and sensitivity analysis of LCA and EMA results
• Article is targeting at "Ecological Modeling" journal
Completed
March, 2013
• Draft the Chapter 5: the correlation analysis of LCA and EMA results
• Article is targeting at "Environmental Science and Technology" journal
Completed
April, 2013 • Full review the first draft of dissertation Completed
May, 2013
• Co-review with dissertation advisor • Summarize research findings for presenting at
Forest Products Society International Convention in June, 2013
Completed
June, 2013 • Defend dissertation To be completed

131
Literature Cited
Abusoglu, A., Kanoglu, M., 2009. Allocation of Emissions for Power and Steam Production Based on Energy and Exergy in Diesel Engine Powered Cogeneration. Energy & Fuels, 23, 1526-1533.
Al-Sulaiman, F.A., Dincer, I., Hamdullahpur, F., 2010. Exergy analysis of an integrated solid oxide fuel cell and organic Rankine cycle for cooling, heating and power production. Journal of power sources, 195, 2346-2354.
Al-Sulaiman, F.A., Hamdullahpur, F., Dincer, I., 2011. Greenhouse gas emission and exergy assessments of an integrated organic Rankine cycle with a biomass combustor for combined cooling, heating and power production. Applied Thermal Engineering, 31, 439-446.
Alonso-pippo, W., Rocha, J.D., Mesa-Perez, J.M., 2004. Emergy evaluation of bio-oil production using sugarcane biomass residues at fast pyrolysis pilot in Brazil Proceedings of IV Biennial International Workshop "Advances in Energy Studies", pp. 401-408.
Andersson, K., 2000. LCA of food products and production systems. The international journal of life cycle assessment, 5, 239-248.
Bakshi, B.R., 2002. A thermodynamic framework for ecologically conscious process systems engineering. Computers & chemical engineering, 26, 269-282.
Baral, A., Bakshi, B.R., 2010. Emergy analysis using US economic input-output models with applications to life cycles of gasoline and corn ethanol. Ecological Modelling, 221, 1807-1818.
Bargigli, S., Cigolotti, V., Pierini, D., Moreno, A., LACOBONE, F., Ulgiati, S., 2010. Cogeneration of Heat and Electricity: A Comparison of Gas Turbine, Internal Combustion Engine, and MCFC/GT Hybrid System Alternatives. Journal of fuel cell science and technology, 7.
Bastianoni, S., Marchettini, N., 2000. The problem of co-production in environmental accounting by emergy analysis. Ecological Modelling, 129, 187-193.
Baumann, H., Tillman, A.M., 2004. The hitch hiker's guide to LCA. Studentlitteratur Lund, Sweden.
132
Berger, M., Finkbeiner, M., 2011. Correlation analysis of life cycle impact assessment indicators measuring resource use. The international journal of life cycle assessment, 16, 74-81.
BLS, 2011. National Industry-Specific Occupational Employment and Wage Estimates. Bureau of Labor Statistics.
Brambilla Pisoni, E., Raccanelli, R., Dotelli, G., Botta, D., Melià, P., 2009. Accounting for transportation impacts in the environmental assessment of waste management plans. The international journal of life cycle assessment, 14, 248-256.
Brechbill, S.C., Tyner, W.E., Ileleji, K.E., 2011. The economics of biomass collection and transportation and its supply to Indiana cellulosic and electric utility facilities. BioEnergy Research, 4, 141-152.
Brown, M., Buranakarn, V., 2003. Emergy indices and ratios for sustainable material cycles and recycle options. Resources, conservation and recycling, 38, 1-22.
Brown, M., Ulgiati, S., 1997. Emergy-based indices and ratios to evaluate sustainability: monitoring economies and technology toward environmentally sound innovation. Ecological engineering, 9, 51-69.
Brown, M., Ulgiati, S., 2002. Emergy evaluations and environmental loading of electricity production systems. Journal of Cleaner Production, 10, 321-334.
Brown, M.T., Protano, G., Ulgiati, S., 2011. Assessing geobiosphere work of generating global reserves of coal, crude oil, and natural gas. Ecological Modelling, 222, 879-887.
Brown, M.T., Ulgiati, S., 2004. Emergy analysis and environmental accounting. Encyclopedia of energy, 2, 329-354.
Brown, M.T., Ulgiati, S., 2004. Energy quality, emergy, and transformity: HT Odum's contributions to quantifying and understanding systems. Ecological Modelling, 178, 201-213.
Brown, M.T., Ulgiati, S., 2010. Updated evaluation of exergy and emergy driving the geobiosphere: a review and refinement of the emergy baseline. Ecological Modelling, 221, 2501-2508.
Brown, R.C., 2003. Biorenewable resources: engineering new products from agriculture. Blackwell, Ames.
Brunn, H., 1995. Puttting LCA back in its track! LCA News, 5, 2-4.
133
Buonocore, E., Franzese, P.P., Ulgiati, S., 2012. Assessing the environmental performance and sustainability of bioenergy production in Sweden: A life cycle assessment perspective. Energy, 37, 69-78.
Campbell, D., 2000. A revised solar transformity for tidal energy received by the earth and dissipated globally: implications for emergy analysis. Emergy synthesis, 1, 255-264.
Campbell, D.E., 1998. Emergy analysis of human carrying capacity and regional sustainability: an example using the state of Maine. Environmental Monitoring and Assessment, 51, 531-569.
Campbell, N.A., Williamson, B., Heyden, R.J., 2006. Biology: Exploring Life. Pearson Prentice Hall, Boston, Massachusetts.
Cao, K., Feng, X., 2007. The emergy analysis of multi-product systems. Process Safety and Environmental Protection, 85, 494-500.
Cavalett, O., Ortega, E., 2009. Integrated environmental assessment of biodiesel production from soybean in Brazil. Journal of Cleaner Production, 18, 55-70.
Cavalett, O., Ortega, E., 2010. Integrated environmental assessment of biodiesel production from soybean in Brazil. Journal of Cleaner Production, 18, 55-70.
Cherubini, F., Bird, N.D., Cowie, A., Jungmeier, G., Schlamadinger, B., Woess-Gallasch, S., 2009. Energy- and greenhouse gas-based LCA of biofuel and bioenergy systems: Key issues, ranges and recommendations. Resources, conservation and recycling, 53, 434-447.
Cherubini, F., Jungmeier, G., 2010. LCA of a biorefinery concept producing bioethanol, bioenergy, and chemicals from switchgrass. The international journal of life cycle assessment, 15, 53-66.
Cherubini, F., Strømman, A.H., 2011. Life cycle assessment of bioenergy systems: State of the art and future challenges. Bioresource Technology, 102, 437-451.
Ciotola, R.J., Lansing, S., Martin, J.F., 2011. Emergy analysis of biogas production and electricity generation from small-scale agricultural digesters. Ecological engineering, 37, 1681-1691.
Consoli, F., Allen, D., Boustead, I., Fava, J., Franklin, W., Jensen, A., De Oude, N., Parrish, R., Perriman, R., Postelthwaite, D., 1993. Guidelines for life-cycle assessment: a'Code of Practice'. Society of Environmental Toxicology and Chemistry (SETAC), pp. 55-55.
134
Costanza, R., d'Arge, R., De Groot, R., Farber, S., Grasso, M., Hannon, B., Limburg, K., Naeem, S., O'Neill, R.V., Paruelo, J., 1997. The value of the world's ecosystem services and natural capital. Nature, 387, 253-260.
CPA, 2010. Corrugated Industry Delivers Life-Cycle Assessment Results. Corrugated Packaging Alliance (CPA), Elk Grove Village, pp. 112.
Cuadra, M., Björklund, J., 2007. Assessment of economic and ecological carrying capacity of agricultural crops in Nicaragua. Ecological indicators, 7, 133-149.
CUP, 2008. The Columbia Encyclopedia. 6th ed. Gale Group.
Curran, M.A., 2006. Life Cycle Assessment: Principles and Practice. U.S. Environmental Protection Agency, National Risk Management Research Laboratory, Cincinnati, OH.
Dickie, A., 2007. Biofuels sustainability: a UK perspective. Renewable Energy Focus, 8, 59-61.
Dong, L., Liu, H., Riffat, S., 2009. Development of small-scale and micro-scale biomass-fuelled CHP systems-A literature review. Applied Thermal Engineering, 29, 2119-2126.
Dong, X., Ulgiati, S., Yan, M., Zhang, X., Gao, W., 2008. Energy and Emergy evaluation of bioethanol production from wheat in Henan Province, China. Energy Policy, 36, 3882-3892.
Duan, N., Liu, X., Dai, J., Lin, C., Xia, X., Gao, R., Wang, Y., Chen, S., Yang, J., Qi, J., 2011. Evaluating the environmental impacts of an urban wetland park based on emergy accounting and life cycle assessment: A case study in Beijing. Ecological Modelling, 222, 351-359.
EC, 2010. International Reference Life Cycle Data System (ILCD) Handbook-general guide for life cycle assessment-detailed guidance. 1st ed. European Commission, Publications Office of the European Union, Luxembourg.
Elsayed, M., Matthews, R., Mortimer, N., 2003. Carbon and energy balances for a range of biofuels options. Resources Research Unit, Sheffield Hallam Univ.
EPA, 2008. Catalog of CHP Technologies. U.S. Environmental Protection Agency.
EPA, 2012. Life Cycle Perspective. U.S. Environmental Protection Agency.
Eriksson, O., Finnveden, G., Ekvall, T., Björklund, A., 2007. Life cycle assessment of fuels for district heating: A comparison of waste incineration, biomass-and natural gas combustion. Energy Policy, 35, 1346-1362.

135
Federici, M., Ulgiati, S., Basosi, R., 2008. A thermodynamic, environmental and material flow analysis of the Italian highway and railway transport systems. Energy, 33, 760-775.
Felder, R., Dones, R., 2007. Evaluation of ecological impacts of synthetic natural gas from wood used in current heating and car systems. Biomass and Bioenergy, 31, 403-415.
Feng, X., Min, S., Dai, Y., Liu, Y., 2005. Emergy analysis of industrial multi-product systems. The Chinese Journal of Process Engineering, 5, 317-321 (in Chinese).
Finnveden, G., Hauschild, M.Z., Ekvall, T., Guinee, J., Heijungs, R., Hellweg, S., Koehler, A., Pennington, D., Suh, S., 2009. Recent developments in life cycle assessment. Journal of Environmental Management, 91, 1-21.
Fleming, J.S., Habibi, S., MacLean, H.L., 2006. Investigating the sustainability of lignocellulose-derived fuels for light-duty vehicles. Transportation Research Part D: Transport and Environment, 11, 146-159.
Gabrielle, B., Gagnaire, N., 2008. Life-cycle assessment of straw use in bio-ethanol production: a case study based on biophysical modelling. Biomass and Bioenergy, 32, 431-441.
González-García, S., Gasol, C.M., Gabarrell, X., Rieradevall, J., Moreira, M.T., Feijoo, G., 2010. Environmental profile of ethanol from poplar biomass as transport fuel in Southern Europe. Renewable energy, 35, 1014-1023.
Guinée, J.B., Heijungs, R., Huppes, G., Zamagni, A., Masoni, P., Buonamici, R., Ekvall, T., Rydberg, T., 2011. Life Cycle Assessment: Past, Present, and Future. Environmental science & technology, 45, 90-96.
Hau, J.L., Bakshi, B.R., 2004. Promise and problems of emergy analysis. Ecological Modelling, 178, 215-225.
Hazell, P., Pachauri, R., Institute, I.F.P.R., 2020 Vision for Food, A., Environment, t., Energy, Institute, R., 2006. Bioenergy and agriculture: promises and challenges. IFPRI Washington, DC.
Helton, J.C., 1993. Uncertainty and sensitivity analysis techniques for use in performance assessment for radioactive waste disposal. Reliability Engineering & System Safety, 42, 327-367.
Helton, J.C., Davis, F., 2002. Illustration of Sampling-based Methods for Uncertainty and Sensitivity Analysis. Risk Analysis, 22, 591-622.
Hermann, W.A., 2006. Quantifying global exergy resources. Energy, 31, 1685-1702.

136
Hoogwijk, M., Faaij, A., de Vries, B., Turkenburg, W., 2009. Exploration of regional and global cost-supply curves of biomass energy from short-rotation crops at abandoned cropland and rest land under four IPCC SRES land-use scenarios. Biomass and Bioenergy, 33, 26-43.
Hossain, A.K., Davies, P.A., 2010. Plant oils as fuels for compression ignition engines: A technical review and life-cycle analysis. Renewable energy, 35, 1-13.
Huijbregts, M.A., Hellweg, S., Frischknecht, R., Hendriks, H.W., Hungerbuhler, K., Hendriks, A.J., 2012. Cumulative energy demand as predictor for the environmental burden of commodity production. Environmental science & technology, 44, 2189-2196.
Huijbregts, M.A., Rombouts, L.J., Hellweg, S., Frischknecht, R., Hendriks, A.J., van de Meent, D., Ragas, A.M., Reijnders, L., Struijs, J., 2006. Is cumulative fossil energy demand a useful indicator for the environmental performance of products? Environmental science & technology, 40, 641-648.
Huijbregts, M.J., 1998. Application of uncertainty and variability in LCA. The international journal of life cycle assessment, 3, 273-280.
Hung, M.-L., Ma, H.-w., 2009. Quantifying system uncertainty of life cycle assessment based on Monte Carlo simulation. The international journal of life cycle assessment, 14, 19-27.
Huo, H., Wang, M., Bloyd, C., Putsche, V., 2008. Life-Cycle Assessment of Energy Use and Greenhouse Gas Emissions of Soybean-Derived Biodiesel and Renewable Fuels. Environmental science & technology, 43, 750-756.
Ingwersen, W.W., 2011. Emergy as a Life Cycle Impact Assessment Indicator. Journal of Industrial Ecology, 15, 550-567.
IPCC, 2007. Direct Global Warming Potentials. IPCC.
IPCC, 2011. IPCC Fourth Assessment Report, The Physical Science Basis.
ISO, 2006. Greenhouse gases ISO 14064:2006. International Organization for Standardization, Geneva, Switzerland.
ISO, 2010. Draft: Life Cycle Assessment - Principles and Guidelines. International Organization for Standardization.
ISO, B., 2006. Environmental management - life cycle assessment - principles and framework. Environmental Management, 3.

137
Ju, L., Chen, B., 2011. Embodied energy and emergy evaluation of a typical biodiesel production chain in China. Ecological Modelling, 222, 2385-2392.
Kalt, G., Kranzl, L., 2011. Assessing the economic efficiency of bioenergy technologies in climate mitigation and fossil fuel replacement in Austria using a techno-economic approach. Applied Energy.
Kimming, M., Sundberg, C., Nordberg, A., Baky, A., Bernesson, S., Norén, O., Hansson, P.A., 2011. Biomass from agriculture in small-scale combined heat and power plants-A comparative life cycle assessment. Biomass and Bioenergy.
La Rosa, A., Siracusa, G., Cavallaro, R., 2008. Emergy evaluation of Sicilian red orange production. A comparison between organic and conventional farming. Journal of Cleaner Production, 16, 1907-1914.
Lardon, L., Hélias, A., Sialve, B., Steyer, J.P., Bernard, O., 2009. Life-cycle assessment of biodiesel production from microalgae. Environmental science & technology, 43, 6475-6481.
Laurent, A., Olsen, S.I., Hauschild, M.Z., 2012. Limitations of carbon footprint as indicator of environmental sustainability. Environmental science & technology, 46, 4100-4108.
Maurice, B., Frischknecht, R., Coelho-Schwirtz, V., Hungerbühler, K., 2000. Uncertainty analysis in life cycle inventory. Application to the production of electricity with French coal power plants. Journal of Cleaner Production, 8, 95-108.
McElroy, M., 2011. Do LCAs Measure Up To Sustainability? Sustainable Brands.
McKendry, P., 2002. Energy production from biomass (part 1): overview of biomass. Bioresource Technology, 83, 37-46.
McManus, M.C., 2010. Life cycle impacts of waste wood biomass heating systems: A case study of three UK based systems. Energy, 35, 4064-4070.
Mirandola, A., Stoppato, A., Tonon, S., 2010. An integrated approach to the assessment of energy conversion plants. International Journal of Thermodynamics, 3, 111-119.
Mooney, C.Z., 1997. Monte carlo simulation. SAGE Publications, Incorporated.
Mortimer, N., Cormack, P., Elsayed, M., Horne, R., 2003. Evaluation of the comparative energy, global warming and socio-economic costs and benefits of biodiesel. Report to the Department for Environment, Food and Rural Affairs Contract Reference No. CSA, 5982.

138
Mullins, K.A., Griffin, W.M., Matthews, H.S., 2010. Policy Implications of Uncertainty in Modeled Life-Cycle Greenhouse Gas Emissions of Biofuels. Environmental science & technology, 45, 132-138.
Norris, G.A., 2001. Integrating life cycle cost analysis and LCA. The international journal of life cycle assessment, 6, 118-120.
Odum, H.T., 1988. Self-organization, transformity, and information. Energy, 1, 30.
Odum, H.T., 1996. Environmental accounting: emergy and environmental decision making. John Wiley & Sons Inc.
Odum, H.T., Brown, M., Williams, S., 2000. Handbook of emergy evaluation. Center for Environmental Policy.
Odum, H.T., Odum, E.P., 2000. The energetic basis for valuation of ecosystem services. Ecosystems, 3, 21-23.
Ortega, E., Cavalett, O., Bonifácio, R., Watanabe, M., 2005. Brazilian soybean production: emergy analysis with an expanded scope. Bulletin of Science, Technology & Society, 25, 323-334.
Ott, L., Longnecker, M., Ott, R.L., 2001. An introduction to statistical methods and data analysis. Duxbury Pacific Grove, CA.
Owens, J.W., 1996. LCA impact assessment categories. The international journal of life cycle assessment, 1, 151-158.
Peng, T., Lu, H., Wu, W., Campbell, D., Zhao, G., Zou, J., Chen, J., 2008. Should a small combined heat and power plant (CHP) open to its regional power and heat networks? Integrated economic, energy, and emergy evaluation of optimization plans for Jiufa CHP. Energy, 33, 437-445.
Peng, T., Lu, H.F., Wu, W.L., Campbell, D.E., Zhao, G.S., Zou, J.H., Chen, J., 2008. Should a small combined heat and power plant (CHP) open to its regional power and heat networks? Integrated economic, energy, and emergy evaluation of optimization plans for Jiufa CHP. Energy, 33, 437-445.
Pereira, C.L.F., Ortega, E., 2010. Sustainability assessment of large-scale ethanol production from sugarcane. Journal of Cleaner Production, 18, 77-82.
Petrou, E.C., Pappis, C.P., 2009. Biofuels: a survey on pros and cons. Energy & Fuels, 23, 1055-1066.

139
Pirouti, M., Wu, J., Ekanayake, J., Jenkins, N., 2010. Dynamic modelling and control of a direct-combustion biomass CHP unit. IEEE, pp. 1-6.
Pizzigallo, A., Granai, C., Borsa, S., 2008. The joint use of LCA and emergy evaluation for the analysis of two Italian wine farms. Journal of Environmental Management, 86, 396-406.
Raugei, M., Bargigli, S., Ulgiati, S., 2006. Nested Emergy Analyses: Moving ahead from the spreadsheet platform. Emergy synthesis, 4.
Ross, S., Evans, D., Webber, M., 2002. How LCA studies deal with uncertainty. The international journal of life cycle assessment, 7, 47-52.
Rugani, B., Benetto, E., 2012. Improvements to Emergy Evaluations by Using Life Cycle Assessment. Environmental science & technology, 46, 4701-4712.
Rugani, B., Huijbregts, M.A., Mutel, C., Bastianoni, S., Hellweg, S., 2011. Solar energy demand (SED) of commodity life cycles. Environmental science & technology, 45, 5426-5433.
Salomon, M., Savola, T., Martin, A., Fogelholm, C.-J., Fransson, T., 2011. Small-scale biomass CHP plants in Sweden and Finland. Renewable and Sustainable Energy Reviews, 15, 4451-4465.
SCGOV, 2012. Disposal Costs (Tipping Fees).
Sciubba, E., 2010. On the second-law inconsistency of emergy analysis. Energy, 35, 3696-3706.
Sciubba, E., Ulgiati, S., 2005. Emergy and exergy analyses: Complementary methods or irreducible ideological options? Energy, 30, 1953-1988.
Sha, S., Hurme, M., 2011. Emergy evaluation of combined heat and power plant processes. Applied Thermal Engineering.
Sheehan, J.J., 2009. Biofuels and the conundrum of sustainability. Current opinion in biotechnology, 20, 318-324.
Sheng, L., Dong-Lin, S., Shu-Wen, W., Gong-Hui, D., Pei, Q., 2007. Emergy Evaluation of a Kind of Biodiesel Production System and Construction of New Emergy Indices [J]. Journal of Nanjing University (Natural Sciences), 2.
Shine, K.P., 2009. The global warming potential - the need for an interdisciplinary retrial. Climatic Change, 96, 467-472.
140
Simpson, A.P., Edwards, C.F., 2013. The utility of environmental exergy analysis for decision making in energy. Energy.
Solli, C., Reenaas, M., Strømman, A., Hertwich, E., 2009. Life cycle assessment of wood-based heating in Norway. The international journal of life cycle assessment, 14, 517-528.
Spielmann, M., Scholz, R., 2005. Life Cycle Inventories of Transport Services: Background Data for Freight Transport (10 pp). The international journal of life cycle assessment, 10, 85-94.
Steen, B., 1997. On uncertainty and sensitivity of LCA-based priority setting. Journal of Cleaner Production, 5, 255-262.
Steubing, B., Zah, R., Ludwig, C., 2011. Life cycle assessment of SNG from wood for heating, electricity, and transportation. Biomass and Bioenergy, 35, 2950-2960.
Steubing, B., Zah, R., Ludwig, C., 2012. Heat, Electricity, or Transportation? The Optimal Use of Residual and Waste Biomass in Europe from an Environmental Perspective. Environmental science & technology, 46, 164-171.
Sweeney, S., Cohen, M., King, D., Brown, M., 2007. Creation of a global emergy database for standardized national emergy synthesis pp. 483鈥?97 Emergy Synthesis 4: Proceedings of the 4th Biennial Emergy Research Conference. The Centre for Environmental Policy, University of Florida, Gainesville, FL.
Tilley, D.R., 2003. Industrial Ecology and Ecological Engineering. Journal of Industrial Ecology, 7, 13-32.
Timmons, D., Mejía, C.V., 2010. Biomass energy from wood chips: Diesel fuel dependence? Biomass and Bioenergy, 34, 1419-1425.
Tonon, S., Brown, M., Luchi, F., Mirandola, A., Stoppato, A., Ulgiati, S., 2006. An integrated assessment of energy conversion processes by means of thermodynamic, economic and environmental parameters. Energy, 31, 149-163.
Trautwein, W.P., 2003. AdBlue as a reducing agent for the decrease of NOx emissions from diesel engines of commercial vehicles. DGMK.
Uihlein, A., Schebek, L., 2009. Environmental impacts of a lignocellulose feedstock biorefinery system: An assessment. Biomass and Bioenergy, 33, 793-802.
Ulgiati, S., Brown, M., Bastianoni, S., Marchettini, N., 1995. Emergy-based indices and ratios to evaluate the sustainable use of resources. Ecological engineering, 5, 519-531.

141
Ulgiati, S., Brown, M.T., 1998. Monitoring patterns of sustainability in natural and man-made ecosystems. Ecological Modelling, 108, 23-36.
Ulgiati, S., Raugei, M., Bargigli, S., 2006. Overcoming the inadequacy of single-criterion approaches to Life Cycle Assessment. Ecological Modelling, 190, 432-442.
UNEP, 2009. Towards sustainable production and use of resources: Assessing biofuels. United Nations Environment Programme. Biofuels Working Group; International Panel for Sustainable Resource Management. United Nations Envir Programme.
Urban, R.A., Bakshi, B.R., 2009. 1,3-Propanediol from Fossils versus Biomass: A Life Cycle Evaluation of Emissions and Ecological Resources. Industrial & Engineering Chemistry Research, 48, 8068-8082.
Van Loo, S., Koppejan, J., 2008. The handbook of biomass combustion and co-firing. Earthscan/James & James.
Vassallo, P., Bastianoni, S., Beiso, I., Ridolfi, R., Fabiano, M., 2007. Emergy analysis for the environmental sustainability of an inshore fish farming system. Ecological indicators, 7, 290-298.
Venkatesh, A., Jaramillo, P., Griffin, W.M., Matthews, H.S., 2010. Uncertainty analysis of life cycle greenhouse gas emissions from petroleum-based fuels and impacts on low carbon fuel policies. Environmental science & technology, 45, 125-131.
Wang, L., Ni, W., Li, Z., 2006. Emergy evaluation of combined heat and power plant eco-industrial park (CHP plant EIP). Resources, conservation and recycling, 48, 56-70.
Wang, L., Zhang, J., Ni, W., 2005. Emergy evaluation of Eco-Industrial Park with Power Plant. Ecological Modelling, 189, 233-240.
WE, 2002. The Relative Size of Labor Costa at UPS, Fedex and USPS. Workplace Economics Prepared for American Postal Workers Union, Washington D.C. .
Yang, Z., Jiang, M., Chen, B., Zhou, J., Chen, G., Li, S., 2010. Solar emergy evaluation for Chinese economy. Energy Policy, 38, 875-886.
Yossapoll, C., Caudill, R., Axe, L., Dickinson, D., Watts, D., Mosovsky, J., 2002. Carrying capacity estimates for assessing environmental performance and sustainability Electronics and the Environment, 2002 IEEE International Symposium on, pp. 32-37.
Zhang, G., Long, W., 2010. A key review on emergy analysis and assessment of biomass resources for a sustainable future. Energy Policy, 38, 2948-2955.

142
Zhang, Y., Baral, A., Bakshi, B.R., 2010. Accounting for ecosystem services in life cycle assessment, Part II: Toward an ecologically based LCA. Environmental science & technology, 44, 2624-2631.
Zhang, Y., Singh, S., Bakshi, B.R., 2010. Accounting for ecosystem services in life cycle assessment, Part I: A critical review. Environmental science & technology, 44, 2232-2242.
Zwahr, H., 2004. Ash recycling: Just a dream. Waste-To-Energy Research and Technology Council WTERT, Waste Recovery Seattle International. Technical sessions, 118.

Vita
Li Ma
Li was born in Wenzhou, China in 1983. He earned a Bachelor of Engineering degree in
Wood Science and Technology in 2005 and a Master of Engineering degree in Automation in
Wood Products Processing in 2008 from Beijing Forestry University. During his time in school,
Li also gained working experience through internships in wood products manufacturing industry
and wood products consulting firm in China. Upon completion of his Master degree, Li decided
to pursue a doctoral degree in Wood Products program supervised by Dr. Charles D. Ray at the
Pennsylvania State University. During the first three years of study, he primarily focused on
developing a national wood-for-energy utilization database in the United States, and optimizing
feedstock supply and demand through analysis of developed database. His dissertation focused on
comparing two important environmental accounting methods for assessing wood biomass energy
system: Life Cycle Assessment and Emergy Analysis. His work provided insight on what is the
best use of each method, and how to integrate these two methods for ultimate environmentally
conscious decision-making.