Embed Size (px)
Citation preview
THE PERSONALITY ASSESSMENT INVENTORY-ADOLESCENT:
DETECTION OF ADHD FEIGNING FACILITATED BY
COACHING AND NON-COACHING INSTRUCTIONS
Major: Psychology
May 2012
Submitted to Honors and Undergraduate Research Texas A&M University
in partial fulfillment of the requirements for the designation as
HONORS UNDERGRADUATE RESEARCH FELLOW
An Honors Fellow Thesis
by
JESSICA DIAZ DE TUESTA
ii
THE PERSONALITY ASSESSMENT INVENTORY-ADOLESCENT:
DETECTION OF ADHD FEIGNING FACILITATED BY
COACHING AND NON-COACHING INSTRUCTIONS
IS CENTERED, ALL CAPS, BOLD, SIZE 14 TIMES NEW ROMAN
AND DOUBLE SPACED WITHOUT PERIOD AT END
Approved by: Research Advisor: Leslie C. Morey Associate Director for Honors and Undergraduate Research: Duncan MacKenzie
An Honors Fellow Thesis
by
JESSICA DIAZ DE TUESTA
Major: Psychology
May 2012
Submitted to Honors and Undergraduate Research Texas A&M University
in partial fulfillment of the requirements for the designation as
HONORS UNDERGRADUATE RESEARCH FELLOW
iii
ABSTRACT
The Personality Assessment Inventory-Adolescent: Detection of ADHD Feigning Facilitated by Coaching and Non-Coaching Instructions. (May 2012)
Jessica Diaz de Tuesta Department of Psychology
Texas A&M University
Research Advisor: Dr. Leslie C. Morey Department of Psychology
The effectiveness and validity of three indicators of response distortion on the
Personality Assessment Inventory-Adolescent (PAI-A; Morey, 2007), potentially useful
to detect malingering, were evaluated by having college students complete the PAI-A
under coached or non-coached conditions of faking Attention-Deficit/Hyperactivity
Disorder (ADHD). The three indicators were the Negative Impression (NIM) scale, the
Malingering (MAL) Index, and the Rogers discriminant function (RDF). To validate the
effectiveness of the indicators, the college students’ responses on the Conner’s Adult
ADHD Rating Scale (CAARS) was also evaluated; to determine who successfully
simulated having ADHD. The effectiveness of providing information through visual and
written means when coaching the participants in how to most accurately feign ADHD
was also evaluated. The participants’ responses from both the coached and non-coached
conditions were compared with the responses of clinically diagnosed ADHD patients.
The results showed that all three indicators demonstrated the ability to distinguish
between actual and feigned responses. The NIM scale was more effective in identifying
iv
malingering responses in the coached condition, and the Malingering Index was more
effective in identifying malingering responses in the non-coached condition. The RDF
was effective in identifying malingering responses in both the coached and non-coached
conditions fairly the same.
v
DEDICATION
This thesis is in dedication to all young; Hispanic/Latino women who desire to pursue a
higher education in any field, as well as wish to leave a legacy in their community. I
offer this thesis as support and encouragement and as a reminder that age, gender,
socioeconomic status, or race should ever impede anyone to follow their dreams and to
make a difference in their community and the world.
vi
ACKNOWLEDGMENTS
First and foremost, I would like to acknowledge and thank my God for blessing me with
the wonderful opportunity to write and publish this thesis, as well as contribute to the
science of psychology, in particular, personality, at the young age of 20-years-old. I
would also like to recognize and thank my mother, grandparents, and fiancé for over
abundantly encouraging me to take on the research opportunity, as well as supporting me
through every challenge and victory. Thanks must also be given to my research advisor
Dr. Leslie C. Morey and his graduate student, Sara Lowmaster, for further stimulating
my interest in the field of psychology, in particular the field of personality, and
providing me this wonderful learning opportunity. I would also like to thank Texas
A&M University and the Honors Fellows Program for providing this enriching academic
experience in research, and guiding me every step of way in producing this thesis.
Finally, I would like to thank all the subjects that participated in my study for providing
me with great data and for contributing to research in the field of psychology.
vii
NOMENCLATURE
ADHD Attention-Deficit/Hyperactivity Disorder
ANT Antisocial Scale
ANX Anxiety Scale
APS Adolescent Psychopathology Scales
ARD Anxiety-Related Disorders Scale
CAARS Conners’ ADHD Rating Scale
CAARS-S:S Conners’ ADHD Rating Scale, Self Report-Short Version
DRG Drug Problems Scale
DSM-IV-TR Diagnostic Statistical Manual of Mental Disorders (Fourth
Edition, Text Revision)
INC Inconsistency Scale
INF Infrequency Scale
MAL Malingering Index
MAN Mania Scale
MAN-A Mania-Activity Level Subscale
NIM Negative Impression Management Scale
PAI Personality Assessment Inventory
PAI-A Personality Assessment Inventory-Adolescent
RDF Rogers Discriminant Function
SCZ Schizophrenia Scale

viii
SCZ-T Schizophrenia-Thought Disorder Subscale
SOM Somatic Complaints Scale
ix
TABLE OF CONTENTS
Page
ABSTRACT ....................................................................................................................... iii
DEDICATION .................................................................................................................... v
ACKNOWLEDGMENTS .................................................................................................. vi
NOMENCLATURE .......................................................................................................... vii
TABLE OF CONTENTS ................................................................................................... ix
LIST OF TABLES .............................................................................................................. x
CHAPTER
I INTRODUCTION ....................................................................................... 1 PAI-A .............................................................................................. 1 CAARS ............................................................................................ 4 ADHD malingering ......................................................................... 5 Instructions ...................................................................................... 7 Specific aims .................................................................................. 9 II METHODS ................................................................................................ 11 Participants .................................................................................... 11 Measures ........................................................................................ 11 Procedures and design ................................................................... 12 III RESULTS .................................................................................................. 14
IV SUMMARY AND CONCLUSIONS ........................................................ 23
REFERENCES .................................................................................................................. 28 APPENDIX A ................................................................................................................... 30
APPENDIX B ................................................................................................................... 33
CONTACT INFORMATION ........................................................................................... 34
x
LIST OF TABLES
TABLE Page
1 ADHD simulating success ................................................................................... 14
2 ADHD simulating success between conditions ................................................... 15
3 Independent t-test of ADHD simulating success between conditions ................. 15
4 Comparison of groups on Personality Assessment Inventory (PAI-A) measures of malingering ...................................................................................... 16 5 Comparison of successful ADHD simulators within conditions on Personality Assessment Inventory (PAI-A) measures of malingering ................. 17 6 Comparison of unsuccessful ADHD simulators with ADHD clinical sample on Personality Assessment Inventory (PAI-A) measures of malingering ............ 18 7 Comparison of groups on Personality Assessment Inventory (PAI-A) clinical scales ........................................................................................................ 19 8 Comparison of coached condition on Personality Assessment Inventory (PAI-A) clinical subscales .................................................................................... 21 9 Detection of inattention and hyperactivity within coached condition .................. 22
10 Comparison of INC and INF scales among unsuccessful and successful ADHD simulators ................................................................................................. 22
1
CHAPTER I
INTRODUCTION
PAI-A
A personality assessment can be used to accurately measure personality characteristics in
an individual. A problem with accurately assessing an individual, however, is making
sure the individual responds as honestly as possible. The distortion of a response may
lead to misinformation and inaccurate results. The Personality Assessment Inventory-
Adolescent (PAI-A; Morey, 2007) contains validity scales used to detect and measure
the amount of response distortion presented by each individual taking the assessment.
This personality assessment was designed to assess the adolescent population, ages 12 to
18 years, in the same way its parent instrument, the Personality Assessment Inventory
(PAI; Morey, 1991), assesses the adult population in the clinical setting. The three
response distortion indicators on the PAI-A used to detect malingering are the Negative
Impression (NIM) scale (Morey, 1991), the Malingering (MAL) Index (Morey, 1993,
1996), and a discriminant function (RDF) developed by Rogers, Sewell, Morey, and
Ustad (1996). This study evaluated these indices’ ability to detect participants’ feigning
ADHD. ADHD was selected as the disorder participants were asked to fake because it is
an important disorder to evaluate considering the fact that it is a persistent and growing
_______________
This thesis follows the style of Journal of Personality Assessment.
2
disorder in the adolescent population.
Currently there are no published studies that have examined the validity of any of the
PAI-A’s three response distortion indicators. Therefore, the following literature review
analyzes studies that were conducted on the PAI’s response distortion indicators’
validity.
The Negative Impression (NIM) scale on the PAI was not designed to detect malingering
responses, but to detect exaggerated, negative impression responses. In analyzing the
responses of patients with mental disorders and research participants, it was noted that
the majority of the research participants scored considerably higher on NIM than the
patients, suggesting that NIM was a valid tool to detect simulated responses. Rogers,
Ornduff, and Sewell (1993) conducted a study that examined the NIM scale’s ability to
distinguish between naïve and sophisticated simulators who attempted to feign specific
disorders. The results showed that the NIM scale was able to successfully detect and
identify the feigned disorders. Similarly, Morey and Lanier (1998) found that the NIM
scale was most successful in detecting more severely simulated mental disorders, yet
equally useful in detecting malingering from naïve and sophisticated simulators alike.
Although malingering responses are evidently shown on the NIM scale as highly
elevated responses, in particular for disorders such as depression, NIM was not intended
to function alone when attempting to detect malingering. The Malingering (MAL) Index
was designed specifically to, as its name suggests, detect exaggerated malingering
3
responses (Morey, 1991; Morey, 2007). Very few studies have examined the MAL
index’s usefulness in detail; yet, some studies have found the MAL index as a useful tool
in detecting malingering responses (More & Lanier, 1998; Wang, Rogers, Giles,
Diamon, Herrington-Wang, & Taylor, 1997). A more widely studied index, however, is
the Rogers Discriminant Function (RDF) index. Bagby and colleagues (2002) found the
RDF index more effective in detecting malingering responses compared to NIM and
MAL. Likewise, Morey and Lanier (1998) found the RDF to outperform the other PAI
faking-bad indicators in effectiveness.
It is important to keep in mind that these response distortion indicators work best in
conjunction with one another. For example, in Morey and Lanier’s (1998) study the
results of the multiple regression indicated that NIM explained some information that
RDF did not. Thus, a great benefit was found in using the multiple tools together, to
account for as much variance as possible in predicting which responses were malingered.
Although NIM, MAL, and RDF appear to be valid and useful in detecting malingering
responses, they do not possess the ability to identify how well the participants actually
simulated a particular disorder. These indicators can only assess how much individuals
are faking. That is why it is necessary to use other measures (e.g., CAARS) that do
assess accuracy of simulation (e.g., faking ADHD).
The PAI-A includes other validity scales, such as the Inconsistency (INC) and
Infrequency (INF) scales, which assess deviation from conscientious responding, along
4
with 11 basic clinical scales that assess specific clinical disorders, some of which
are Somatic Complaints (SOM), Anxiety (ANX), Anxiety-Related Disorders (ARD),
Mania (MAN), Schizophrenia (SCZ), and Drug Problems (DRG) (Morey, 2007).
Interestingly enough, although the PAI-A was not built with a scale to detect ADHD,
research has shown certain patterns across other clinical scales that help identify an
adolescent as exhibiting ADHD-like symptoms. For example, the MAN scale is a
moderately, positively correlation (r = .44) with the Adolescent Psychopathology Scales’
(APS) ADHD scale (Reynolds, 1998). More specifically, the MAN-A subscale, which
measures the activity level component of Mania, also reflects a moderately, positive
correlation with the hyperactivity indicators of ADHD (Morey, 2007). Another clinical
scale that is correlated with ADHD-related indicators is SCZ, more specifically the
subscale SCZ-T. The SCZ scale on the PAI-A is highly, positively correlated with the
ADHD scale on the APS (r = .63), as well as with the ADHD Index on the CAARS (r =
.59). With regards to its subscales, SCZ-T is more highly, positively correlated with the
ADHD scale on the APS (r = .69), as well as with the ADHD Index on the CAARS (r =
.67). Billingsley-Jackson (2008) examined the clinical scales on PAI and found that
along with the MAN scale, the ANT scale also reflected significantly elevated scores
among adults with ADHD. Moreover, he concluded that the combination of scores on
several scales on the PAI were useful in identifying adults with ADHD.
CAARS
The Conners Adult Attention Rating Scale (CAARS; Conners, Erhardt, & Sparrow,
5
1999) is a self-report instrument that is used to identify ADHD symptoms of attention
deficit, hyperactivity, and impulsivity in adults, 18-years-old or older, on all the 12
DSM-IV-TR ADHD criteria. No research exists examining the validity of the CAARS’
and PAI-A’s validity indicators simultaneously.
ADHD malingering
Several studies conducted on ADHD have found that among the college population, in
particular, adolescents feign ADHD-like symptoms quite easily and frequently,
considering there are more incentives for them to do so (Alfano & Boone, 2007; Frazier,
Frazier, Busch, Kerwood, & Demareed, 2008; Sollman, Ranseen, & Berry, 2010).
Research indicates that college students feign ADHD in order to receive additional time
on exams and assignments, tape recordings of lectures, less homework, professor’s
notes, stimulant medications, and/or other special accommodations as mandated by the
Americans with Disabilities Act (Sollman et al., 2010). Moreover, Sollman and
colleagues (2010) found that a contributing factor to the frequency of ADHD feigning
among college students is the readily available information of ADHD-related symptoms
on the internet. Likewise, Alfano and Boone (2007) pointed out that students have
resources readily available that enable them to fabricate ADHD-related symptoms. For
example, by merely directly observing peers who actually have ADHD, college students
can acquire the necessary information to accurately feign ADHD. There are several
consequences to feigning ADHD, besides the obvious lack of honesty it reveals about
the student’s character. By doing this, students selfishly hinder their peers who are
6
clinically diagnosed with ADHD, by taking away resources that are intended to benefit
them. Taking medication that is designated to correct certain chemical imbalances when
no chemical imbalances are present is wrong and can potentially cause problems such as
dependency and other side effects that, due to ethical principles and limited research,
have not yet been thoroughly investigated. Consequently, it is critical to accurately
assess students that claim to possess true ADHD-related deficits.
Despite the prevalent rate of college students feigning ADHD, there are a limited
amount of studies that have examined college students’ ability to accurately feign
ADHD. Sollman and colleagues (2010) used several tests, such as neurocognitive tests
and symptom validity tests, to detect ADHD malingering. After analyzing their results,
they pointed out that the symptom validity tests showed high specificity for the ADHD
condition, but only showed a moderate sensitivity to feigning. The results also showed
that the CAARS’ Inconsistency index did not accurately discriminate between the true
ADHD and ADHD feigning group. This suggests that not only were the students able to
effectively feign ADHD, but also that the CAARS was not a useful tool in detecting
malingered responses; it is simply a measure to detect ADHD simulation. Frazier and
colleagues (2008) also examined the ability of certain symptom validity measures to
accurately detect ADHD malingering. Their results showed large differences among the
ADHD and non-ADHD control groups and the feigning ADHD group. They concluded
that these large differences greatly limited the effectiveness of their measures in
accurately detecting faking ADHD. They also asked participants several questions on the
7
strategies used to simulate ADHD. Based on the results of these self-reports, 87% of the
participants said they did respond inconsistently, 90% reported they attempted to appear
less intelligent, 87% reported they attempted to miss difficult items, 90% reported they
attempted to show difficulty paying attention, and 74% reported they pretended having
difficulty remembering things. Responding inconsistently might suggest a characteristic
of inattention, which is a component of ADHD. However, certain measures might
identify these responses as simply random responding, instead of associating random
responding to ADHD-related symptoms. The results of both Sollman’s and colleagues’
(2010) and Frazier’s and colleagues’ (2008) studies emphasize the need for both
simulation measures (e.g., CAARS) and malingering measures (e.g., NIM, MAL, RDF)
to more accurately distinguish between an individual who is diagnosed with ADHD and
an individual who is feigning ADHD.
Instructions
When participants are asked to feign a particular disorder, it is important to know
beforehand the extent or degree of information the participants have regarding the
disorder. A few studies have investigated the effects of “coaching” participants on the
disorders they are asked to simulate (e.g., Alfano & Boone, 2007; Sollman, Ranseen, &
Berry, 2010). Research suggests that coaching participants on the disorder can reduce
the effectiveness of response distortion indicators (e.g., Bagby, Nicholson, Bacchiochi,
Ryder, & Bury, 2002; Cashel, Rogers, Sewell, & Marin-Cannici, 1995). Morey and
Lanier (1998) suggested that there are many factors that can influence a simulator’s
8
effectiveness, such as being coached on specific disorders or on the validity scales’
detectability. Both Rose and colleagues (1998) and Suhr and Gunstad (2000) examined
how well participants, asked to simulate head injury-related symptoms, were able to
effectively escape the detection of certain response distortion measures. The simulators
in both studies were not provided with any instructions regarding how to avoid
detection. Instead, they were only provided basic information regarding the effects of
head injury. The results of both studies showed that coached subjects were better able to
avoid detection on all measures than non-coached subjects. On the other hand, Bagby
and colleagues (2002) conducted a study examining the effects of coaching simulators
on the presence and detectability of validity scales. Their results showed that subjects
who were coached on the presence and detectability of validity scales did not feign more
successfully than subjects that did not receive instructions. These studies suggest that
coaching participants on the disorder they are asked to simulate has the potential to
produce more effective simulators.
This study examined whether providing a video clip of what an adolescent with ADHD
experiences, along with a written detailed description of ADHD symptoms, leads to an
increased ability to successfully feign ADHD as well as increased success in avoiding
detection by various response distortion indicators. More specifically, no studies were
found on the effects of coached “video” instructions on feigning effectiveness of any
disorder. A unique aspect of this study is that the participants learned directly about the
experience of having the disorder, rather than simply reading “about” it.
9
Specific aims
After conducting an extensive literature review, I found little to no previous research
evaluating the following areas: the accuracy of the validity scales and indices of the PAI-
A, the detection of feigning ADHD on PAI-A, and the use of video coached feigning.
This is a pioneering study that has conducted an evaluation of the PAI-A’s malingering
indicators’ ability to detect ADHD feigning; as well as examined the differences
between video coached feigning instructions accompanied by written coached feigning
instructions versus non-coaching feigning instructions (i.e. asking the participants to
respond to this personality test as if they a person who had, without providing additional
information of the mental disorder). Specific aims of the project include:
Aim 1: To evaluate the PAI-A’s malingering indicators accuracy in detecting ADHD
feigning
As seen in previous research conducted on the PAI, it can be expected that the three
indicators of response distortion on the PAI-A used to detect malingering will
demonstrate a significant ability to differentiate between actual and feigned responses.
More specifically, a pattern of cutoff scores on the INC and INF scales, as well the SCZ,
SCZ-T, MAN, and MAN-A clinical scales can be determined in order to create an
ADHD indicator for the PAI-A. The INC scale was created to measure careless or
random responding (Morey, 2007). However, as seen in Billingsley-Jackson’s (2008)
study, the majority of participants reported purposefully responding in an inconsistent
manner, which is related to the inattention symptoms of ADHD. The SCZ-T clinical
10
subscale was created to measure thought-related symptoms of schizophrenia. However,
research shows that the SCZ-T clinical subscale is one of the PAI-A’s subscales that is
most highly, positively correlated to inattention-related symptoms of ADHD. Thus, a
combination of scores on several scales on the PAI-A would serve as a useful tool in
identifying adolescents with ADHD. Moreover, if a pattern of scores could be
established among the sample size of this study, coupled with the results of future
studies, it would help clinicians better diagnose college students that claim having
ADHD. Thus, using these measures, fewer students who do not have ADHD will be
given special accommodations and prescription drugs, and there will be more resources
available for the students who truly have a disability.
Aim 2: To compare between the effectiveness of coached ADHD feigning instructions
and non-coached ADHD feigning instructions
Since previous research suggests that coaching participants on specific disorders helps
the participants better simulate, it can be expected that the video coaching information
accompanied by written information will be more effective than the non-coached
feigning instructions. As previously mentioned, by simply observing individuals who
actually have ADHD, many students can acquire the necessary information to accurately
feign ADHD. Therefore, providing subjects with video instructions of what an
adolescent with ADHD looks, acts, and talks like, then subjects will be able to accurately
feign ADHD as if they truly have the disorder.
11
CHAPTER II
METHODS
Participants
The participants were undergraduate students at Texas A&M University fulfilling an
introduction to psychology course requirement (n=100), and a clinical sample of ADHD
adolescents (n = 37) gathered during the standardization of the PAI-A (Morey, 2007).
Upon completing the experiment, each undergraduate student participant at Texas A&M
University received research credit. The mean age of the undergraduate students at
Texas A&M University was 17.9 years (SD = 0.1 years). The majority of the
undergraduates in the study were Caucasian (78%) and slightly more than half were
male (52%). The mean age of the clinical sample of ADHD adolescents was 17.1 years
(SD = 0.3 years). The majority of the adolescents with ADHD were Caucasian (81%)
and male (83.8%).
Measures
PAI-A
Each participant was first given the PAI-A, and each of their responses were recorded,
analyzed, and compared to the responses of the patients in the clinical sample of ADHD
adolescents. The data was then analyzed through several statistical tests.
12
CAARS
This study used the short version (CAARS-S:S) of the CAARS. The students were
instructed to complete the CAARS immediately after completing the PAI-A. The short
version consists of 26 items. The purpose of using the CAARS was to check how well
the students actually simulated ADHD. Each participant’s CAARS responses were
recorded, analyzed, and compared between the coached and non-coached condition. The
data was then analyzed through several statistical tests.
Procedures and design
The experiment was conducted in a vacant classroom in the psychology building on
campus. All participants came in the classroom at the designated research study time
they signed up for. The undergraduate students were randomly assigned to 1 of 2
conditions: a “coached” condition (n = 48) or a “non-coached” condition (n = 52). All
participants completed the self-administered version of the PAI-A and the short self-
report version of the CAARS. Upon completing the assessments, each participant was
given a debriefing form.
Coached condition
Participants in the coached condition were presented a 7 minute video clip of an
interview displaying an adolescent with ADHD answering questions with regards to how
the adolescent lives with their disorder. After the video, the experimenter instructed the
13
participants to respond to every question on the personality test as would a person with
ADHD (i.e. “Imagine you [the participant] needed to convince a psychiatrist that you
had ADHD. Your task is to simulate someone with ADHD in order to make sure the
psychiatrist diagnoses you correctly.”). The experimenter also provided the participants
a written detailed description of symptoms and experiences an adolescent with ADHD
would come across during their lifetime. These symptoms are the exact symptoms used
to describe a person with ADHD in the DSM-IV-TR. To access the video and view the
complete set of instructions provided to the participants in the coached condition, please
see the APPENDIX A.
Non-coached condition
Participants in the non-coached condition were asked to respond to every question on the
personality test as would a person with ADHD. No other additional information on
ADHD was provided. The participants in the non-coached condition were simply
instructed to answer in a way that would look “believable.” To view the complete set of
instructions provided to the participants in the non-coached condition, please see the
APPENDIX B.
14
CHAPTER III
RESULTS
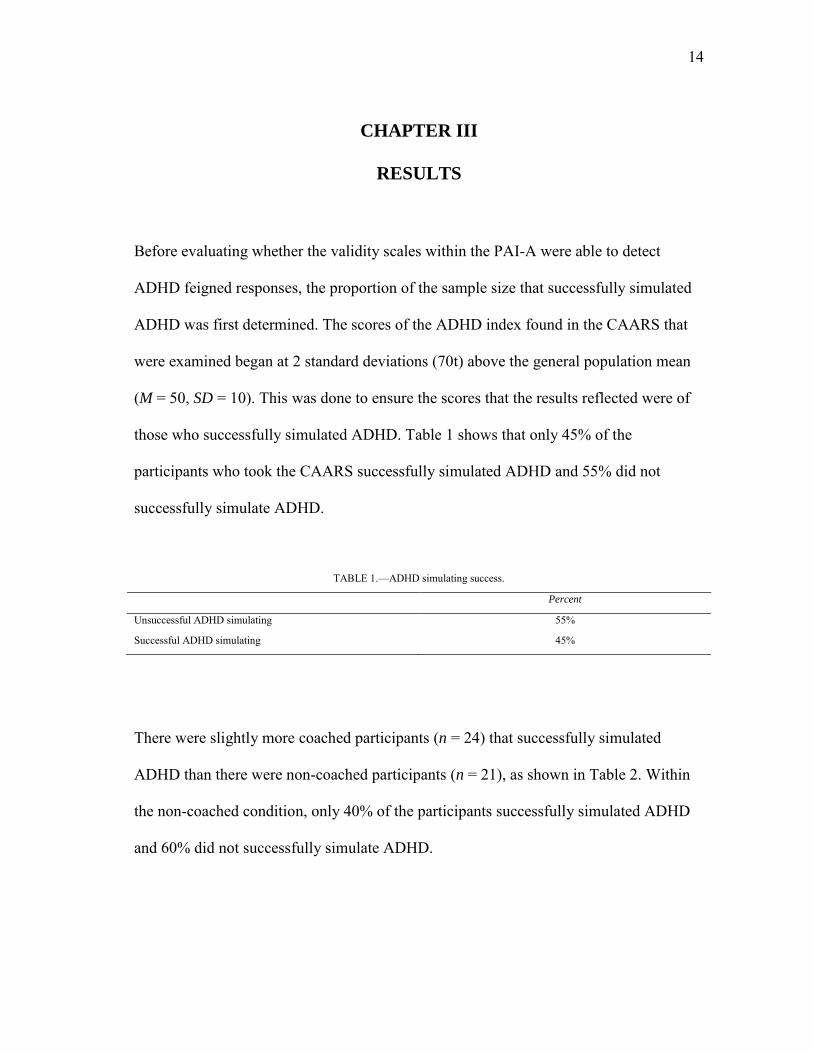
Before evaluating whether the validity scales within the PAI-A were able to detect
ADHD feigned responses, the proportion of the sample size that successfully simulated
ADHD was first determined. The scores of the ADHD index found in the CAARS that
were examined began at 2 standard deviations (70t) above the general population mean
(M = 50, SD = 10). This was done to ensure the scores that the results reflected were of
those who successfully simulated ADHD. Table 1 shows that only 45% of the
participants who took the CAARS successfully simulated ADHD and 55% did not
successfully simulate ADHD.
TABLE 1.—ADHD simulating success.
Percent
Unsuccessful ADHD simulating 55%
Successful ADHD simulating 45%
There were slightly more coached participants (n = 24) that successfully simulated
ADHD than there were non-coached participants (n = 21), as shown in Table 2. Within
the non-coached condition, only 40% of the participants successfully simulated ADHD
and 60% did not successfully simulate ADHD.
15
TABLE 2.—ADHD simulating success between conditions.
Unsuccessful ADHD
simulators
Successful ADHD
simulators
Total
Non-coached condition 31 (60%) 21 (40%) 52
Coached condition 24 (50%) 24 (50%) 48
Total 55 45 100
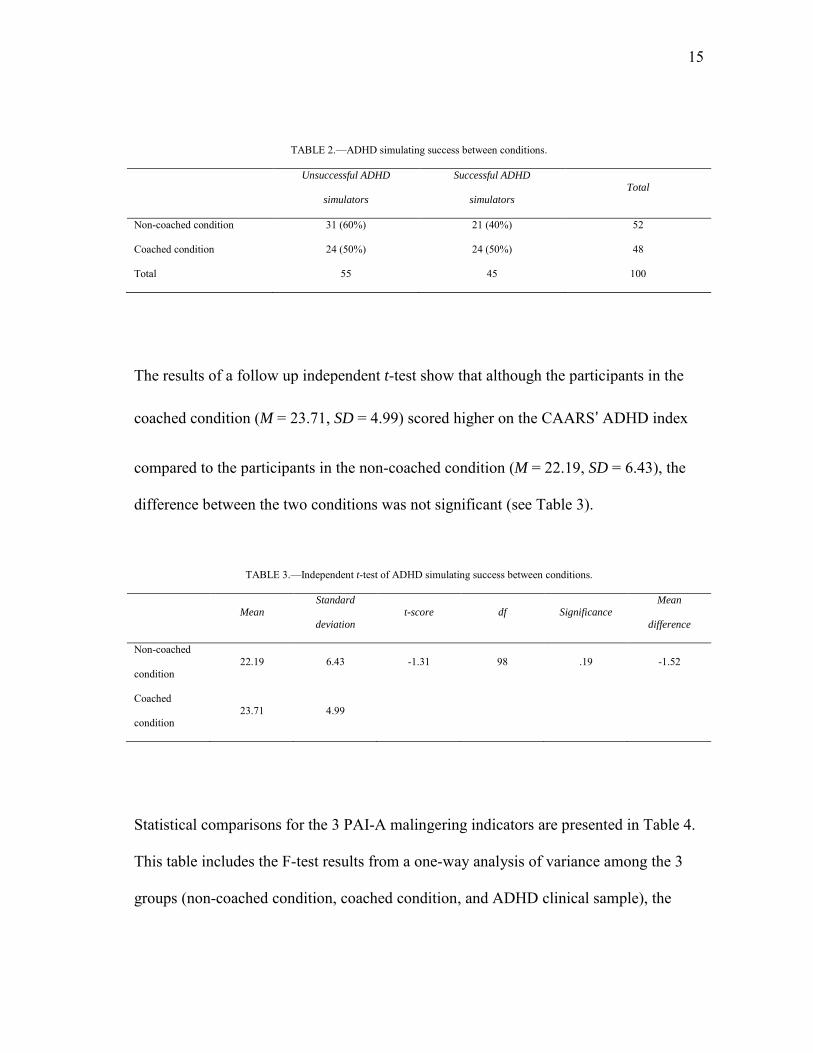
The results of a follow up independent t-test show that although the participants in the
coached condition (M = 23.71, SD = 4.99) scored higher on the CAARS’ ADHD index
compared to the participants in the non-coached condition (M = 22.19, SD = 6.43), the
difference between the two conditions was not significant (see Table 3).
TABLE 3.—Independent t-test of ADHD simulating success between conditions.
Mean Standard
deviation
t-score df Significance Mean
difference
Non-coached
condition 22.19 6.43 -1.31 98 .19 -1.52
Coached
condition 23.71 4.99
Statistical comparisons for the 3 PAI-A malingering indicators are presented in Table 4.
This table includes the F-test results from a one-way analysis of variance among the 3
groups (non-coached condition, coached condition, and ADHD clinical sample), the
16
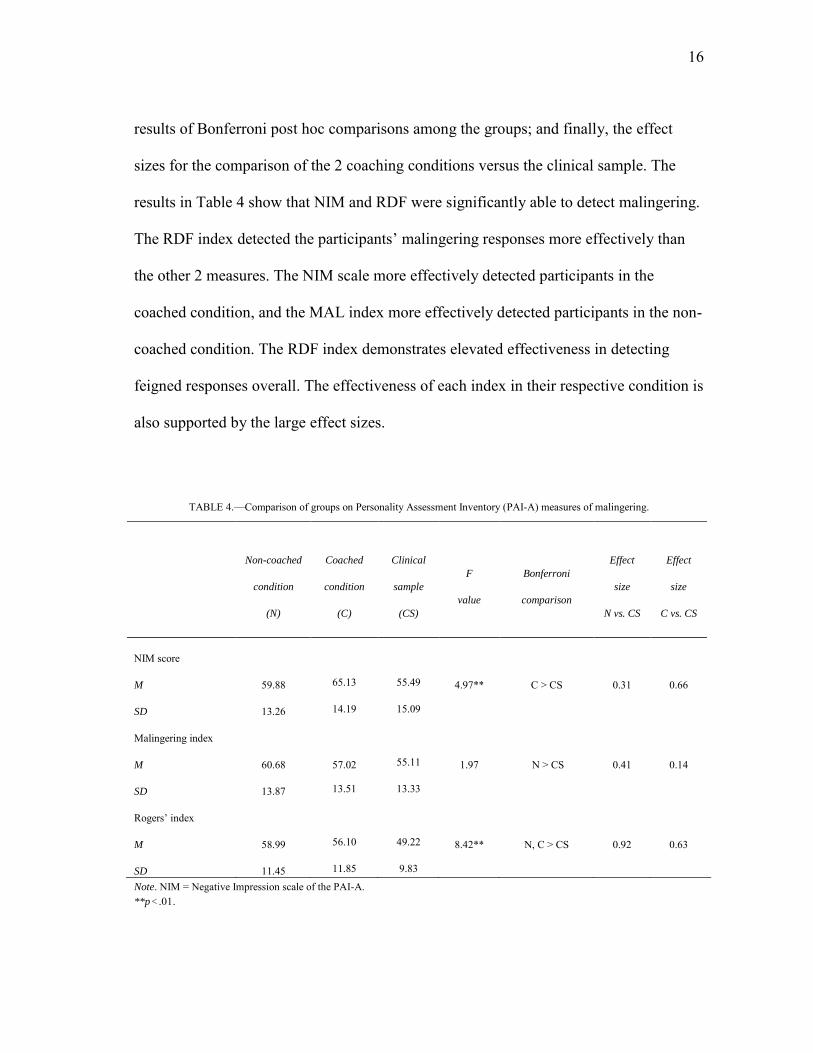
results of Bonferroni post hoc comparisons among the groups; and finally, the effect
sizes for the comparison of the 2 coaching conditions versus the clinical sample. The
results in Table 4 show that NIM and RDF were significantly able to detect malingering.
The RDF index detected the participants’ malingering responses more effectively than
the other 2 measures. The NIM scale more effectively detected participants in the
coached condition, and the MAL index more effectively detected participants in the non-
coached condition. The RDF index demonstrates elevated effectiveness in detecting
feigned responses overall. The effectiveness of each index in their respective condition is
also supported by the large effect sizes.
TABLE 4.—Comparison of groups on Personality Assessment Inventory (PAI-A) measures of malingering.
Non-coached
condition
(N)
Coached
condition
(C)
Clinical
sample
(CS)
F
value
Bonferroni
comparison
Effect
size
N vs. CS
Effect
size
C vs. CS
NIM score
M 59.88 65.13 55.49 4.97** C > CS 0.31 0.66
SD 13.26 14.19 15.09
Malingering index
M 60.68 57.02 55.11 1.97 N > CS 0.41 0.14
SD 13.87 13.51 13.33
Rogers’ index
M 58.99 56.10 49.22 8.42** N, C > CS 0.92 0.63
SD 11.45 11.85 9.83 Note. NIM = Negative Impression scale of the PAI-A. **p < .01.
17
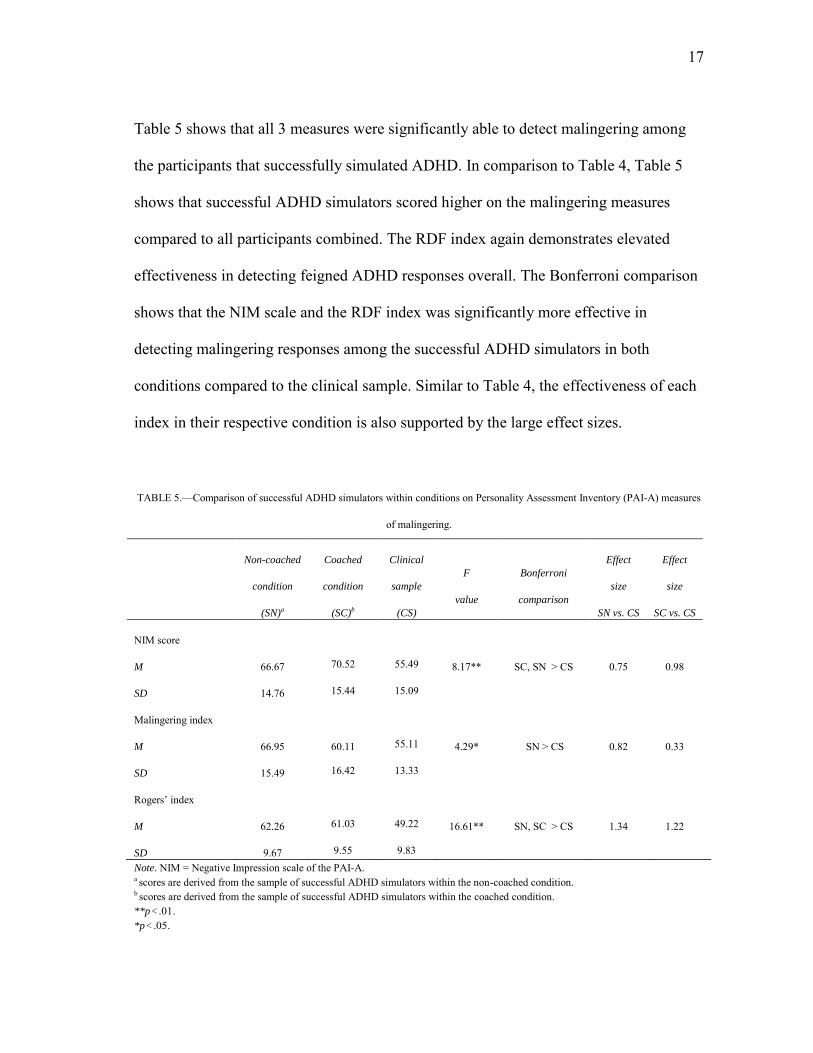
Table 5 shows that all 3 measures were significantly able to detect malingering among
the participants that successfully simulated ADHD. In comparison to Table 4, Table 5
shows that successful ADHD simulators scored higher on the malingering measures
compared to all participants combined. The RDF index again demonstrates elevated
effectiveness in detecting feigned ADHD responses overall. The Bonferroni comparison
shows that the NIM scale and the RDF index was significantly more effective in
detecting malingering responses among the successful ADHD simulators in both
conditions compared to the clinical sample. Similar to Table 4, the effectiveness of each
index in their respective condition is also supported by the large effect sizes.
TABLE 5.—Comparison of successful ADHD simulators within conditions on Personality Assessment Inventory (PAI-A) measures
of malingering.
Non-coached
condition
(SN)a
Coached
condition
(SC)b
Clinical
sample
(CS)
F
value
Bonferroni
comparison
Effect
size
SN vs. CS
Effect
size
SC vs. CS
NIM score
M 66.67 70.52 55.49 8.17** SC, SN > CS 0.75 0.98
SD 14.76 15.44 15.09
Malingering index
M 66.95 60.11 55.11 4.29* SN > CS 0.82 0.33
SD 15.49 16.42 13.33
Rogers’ index
M 62.26 61.03 49.22 16.61** SN, SC > CS 1.34 1.22
SD 9.67 9.55 9.83 Note. NIM = Negative Impression scale of the PAI-A. a scores are derived from the sample of successful ADHD simulators within the non-coached condition. b scores are derived from the sample of successful ADHD simulators within the coached condition. **p < .01. *p < .05.
18
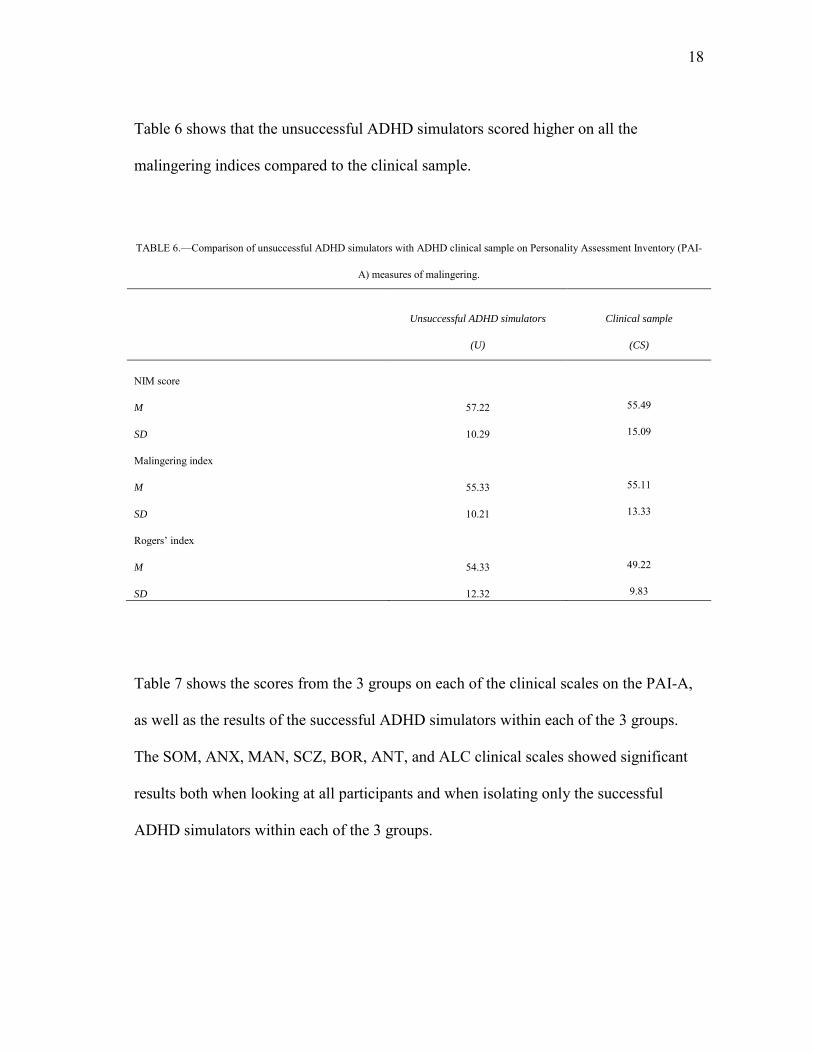
Table 6 shows that the unsuccessful ADHD simulators scored higher on all the
malingering indices compared to the clinical sample.
TABLE 6.—Comparison of unsuccessful ADHD simulators with ADHD clinical sample on Personality Assessment Inventory (PAI-
A) measures of malingering.
Unsuccessful ADHD simulators
(U)
Clinical sample
(CS)
NIM score
M 57.22 55.49
SD 10.29 15.09
Malingering index
M 55.33 55.11
SD 10.21 13.33
Rogers’ index
M 54.33 49.22
SD 12.32 9.83
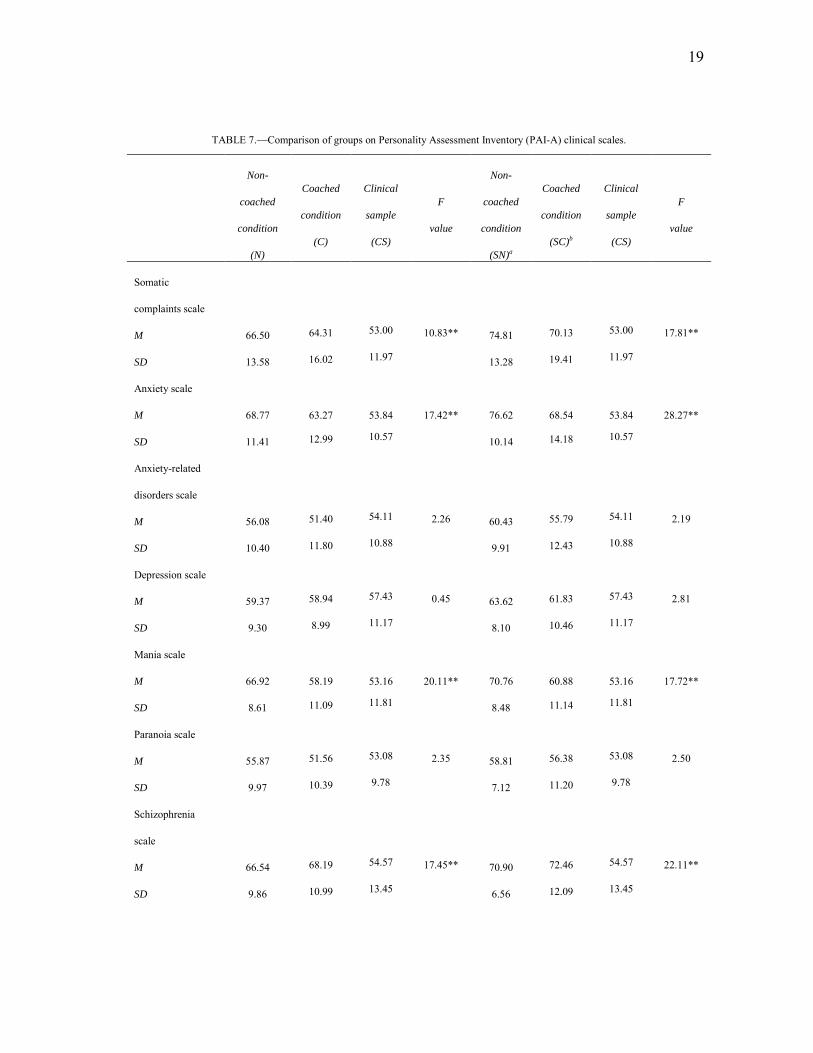
Table 7 shows the scores from the 3 groups on each of the clinical scales on the PAI-A,
as well as the results of the successful ADHD simulators within each of the 3 groups.
The SOM, ANX, MAN, SCZ, BOR, ANT, and ALC clinical scales showed significant
results both when looking at all participants and when isolating only the successful
ADHD simulators within each of the 3 groups.
19
TABLE 7.—Comparison of groups on Personality Assessment Inventory (PAI-A) clinical scales.
Non-
coached
condition
(N)
Coached
condition
(C)
Clinical
sample
(CS)
F
value
Non-
coached
condition
(SN)a
Coached
condition
(SC)b
Clinical
sample
(CS)
F
value
Somatic
complaints scale
M 66.50 64.31 53.00 10.83** 74.81 70.13 53.00 17.81**
SD 13.58 16.02 11.97 13.28 19.41 11.97
Anxiety scale
M 68.77 63.27 53.84 17.42** 76.62 68.54 53.84 28.27**
SD 11.41 12.99 10.57 10.14 14.18 10.57
Anxiety-related
disorders scale
M 56.08 51.40 54.11 2.26 60.43 55.79 54.11 2.19
SD 10.40 11.80 10.88 9.91 12.43 10.88
Depression scale
M 59.37 58.94 57.43 0.45 63.62 61.83 57.43 2.81
SD 9.30 8.99 11.17 8.10 10.46 11.17
Mania scale
M 66.92 58.19 53.16 20.11** 70.76 60.88 53.16 17.72**
SD 8.61 11.09 11.81 8.48 11.14 11.81
Paranoia scale
M 55.87 51.56 53.08 2.35 58.81 56.38 53.08 2.50
SD 9.97 10.39 9.78 7.12 11.20 9.78
Schizophrenia
scale
M 66.54 68.19 54.57 17.45** 70.90 72.46 54.57 22.11**
SD 9.86 10.99 13.45 6.56 12.09 13.45
20
TABLE 7.—Continued.
Non-
coached
condition
(N)
Coached
condition
(C)
Clinical
sample
(CS)
F
value
Non-
coached
condition
(SN)a
Coached
condition
(SC)b
Clinical
sample
(CS)
F
value
Borderline features
scale
M 62.13 57.88 56.62 3.53* 68.24 62.38 56.62 9.57**
SD 10.51 10.10 10.99 7.50 9.67 10.99
Antisocial features
scale scale
M 64.48 57.90 53.24 14.50** 69.62 63.50 53.24 25.26**
SD 10.77 10.51 7.53 10.78 8.72 7.53
Alcohol problems
scale
M 60.87 56.92 53.35 3.39* 66.10 63.46 53.35 6.76**
SD 14.77 13.53 11.54 15.81 16.05 11.54
Drug problems
scale
M 58.06 60.00 58.65 0.23 59.24 65.08 58.65 1.38
SD 14.56 12.96 16.53 13.85 15.09 16.53 a scores are derived from the sample of successful ADHD simulators within the non-coached condition. b scores are derived from the sample of successful ADHD simulators within the coached condition. **p < .01. *p < .05.
Table 8 shows the scores from the participants in the coached condition and the
successful ADHD simulators within the coached condition on 2 of the clinical subscales
(MAN-A and SCZ-T) on the PAI-A. Participants in the coached condition scored higher
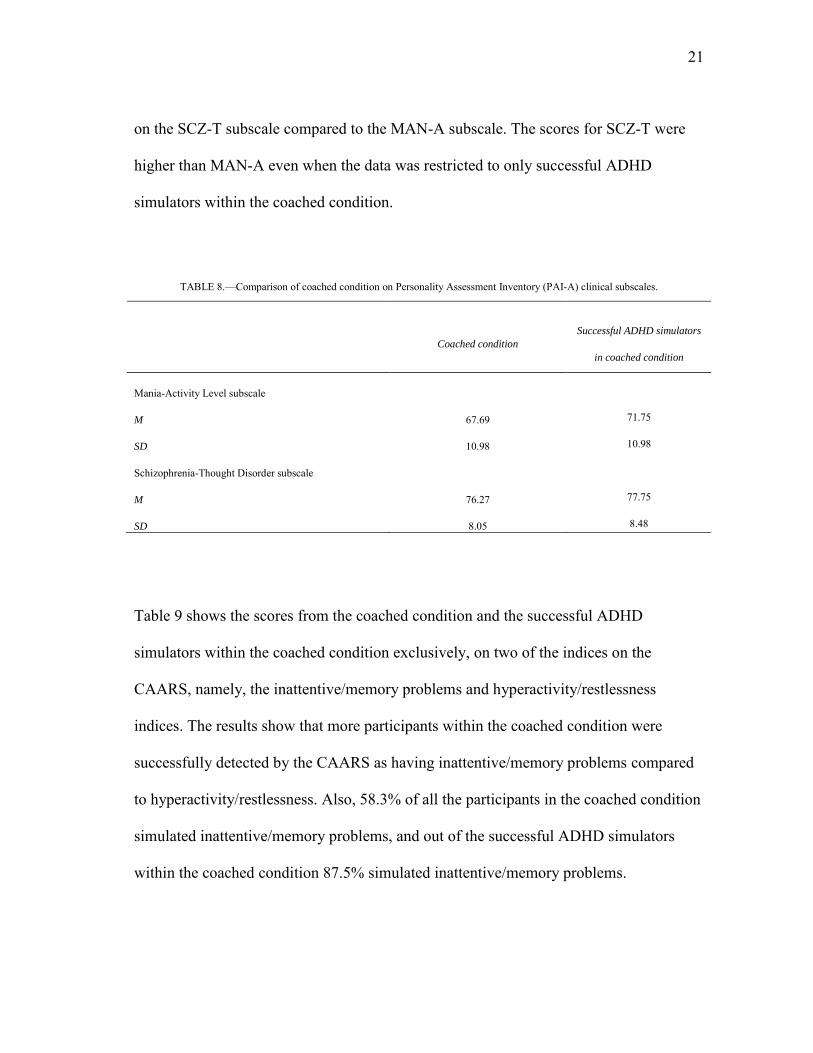
21
on the SCZ-T subscale compared to the MAN-A subscale. The scores for SCZ-T were
higher than MAN-A even when the data was restricted to only successful ADHD
simulators within the coached condition.
TABLE 8.—Comparison of coached condition on Personality Assessment Inventory (PAI-A) clinical subscales.
Coached condition
Successful ADHD simulators
in coached condition
Mania-Activity Level subscale
M 67.69 71.75
SD 10.98 10.98
Schizophrenia-Thought Disorder subscale
M 76.27 77.75
SD 8.05 8.48
Table 9 shows the scores from the coached condition and the successful ADHD
simulators within the coached condition exclusively, on two of the indices on the
CAARS, namely, the inattentive/memory problems and hyperactivity/restlessness
indices. The results show that more participants within the coached condition were
successfully detected by the CAARS as having inattentive/memory problems compared
to hyperactivity/restlessness. Also, 58.3% of all the participants in the coached condition
simulated inattentive/memory problems, and out of the successful ADHD simulators
within the coached condition 87.5% simulated inattentive/memory problems.
22
TABLE 9.—Detection of inattention and hyperactivity within coached conditi\on.
Coached condition a
Successful ADHD simulators
in coached condition b
Inattentive/memory problems 58.3% 87.5%
Hyperactivity/restlessness 50.0% 70.8% an = 48. bn = 24.
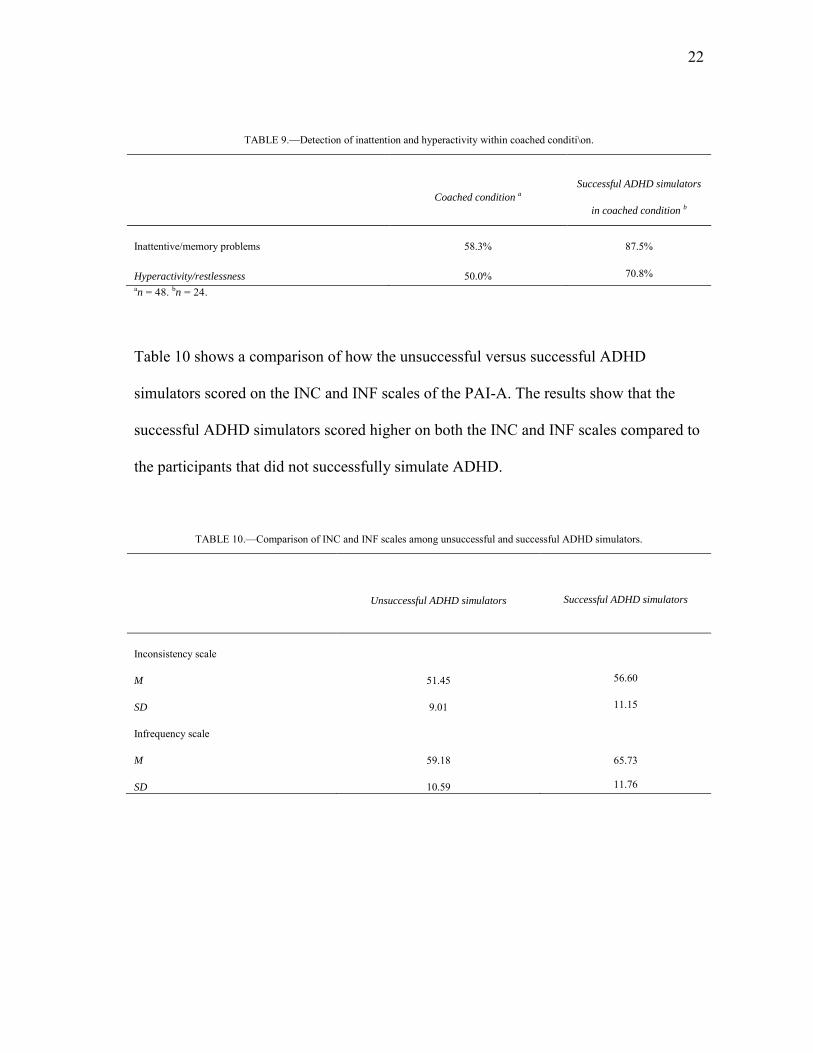
Table 10 shows a comparison of how the unsuccessful versus successful ADHD
simulators scored on the INC and INF scales of the PAI-A. The results show that the
successful ADHD simulators scored higher on both the INC and INF scales compared to
the participants that did not successfully simulate ADHD.
TABLE 10.—Comparison of INC and INF scales among unsuccessful and successful ADHD simulators.
Unsuccessful ADHD simulators
Successful ADHD simulators
Inconsistency scale
M 51.45 56.60
SD 9.01 11.15
Infrequency scale
M 59.18 65.73
SD 10.59 11.76
23
CHAPTER IV
SUMMARY AND CONCLUSIONS
This study examined adolescents’ ability to simulate ADHD on a test that does not have
built-in ADHD clinical scales, and whether the participants were influenced by the
coaching instructions. In studying simulation, researchers do not take the time to
carefully evaluate whether their participants actually resemble clinical patients. This
study underscores the importance of checking simulation accuracy, since the results
indicated that only half of all participants managed to resemble the clinical patients.
Similar to Morey’s and Lanier’s (1998) study, the results in this study showed that the 3
indicators of response distortion (NIM, MAL index, and RDF index) worked with
greater effectiveness among the 45% that accurately simulated ADHD. Validity scales
measuring response distortion will not report participants as malingering if the
participants are not faking a specific disorder.
The CAARS’ ADHD index showed that only about half reported clinical significant
levels of ADHD. There was a small tendency for participants in the coached condition to
more successfully simulate having ADHD, compared to the participants in the non-
coached condition. Coaching participants on ADHD symptoms appeared to slightly
improve their ability to simulate ADHD, but the results were not significant. Neither
condition yielded a 100% success rate of participants simulating ADHD symptoms.
Success rates in accurately simulating ADHD were not very high. However, it is
24
interesting to note that without instructions, less than half of the participants were able to
successfully simulate ADHD. This might suggest that when instructions are provided, a
trend will show that participants will more successfully feign ADHD. The trend might
lead to significance, but in the case of this study the trend was not significant. Likewise,
this does not mean that providing extra material might not work for other disorders, but
for the purpose of this study, it cannot be concluded that providing extra material on
ADHD significantly increases the ability to accurately simulate ADHD.
Upon taking a closer look at the individual malingering indicators, the results showed a
difference in effectiveness of detecting malingering responses between NIM, MAL
index, and the RDF index. Similar to Morey’s and Lanier’s (1998) study, NIM was more
elevated in the malingering groups than in the clinical sample. More specifically, NIM
appeared to work more effectively in the coached condition compared to the non-
coached condition and the clinical sample when all the participants were examined
collectively. However, when restricting the results to only successful ADHD simulators,
NIM worked more effectively in both the coached and non-coached conditions than it
did in the clinical sample. The MAL index appeared to only work well in detecting
malingering responses in the non-coached condition in both instances where the results
were restricted to only successful ADHD simulators and when they were not restricted.
Likewise, the RDF index appeared to work more effectively in both the coached and
non-coached conditions compared to the clinical sample when the results were both
restricted and not restricted to only successful ADHD simulators. This might suggest
25
that some indicators (i.e., MAL and RDF) are more effective in detecting more naïve
simulators (i.e., non-coached participants) and other indicators (i.e., NIM and RDF) are
more effective in detecting more sophisticated simulators (i.e., coached participants).
The results demonstrate that if participants appear to successfully simulate ADHD on the
CAARS, then the probability of the PAI-A validity indicators detecting response
distortion will increase. This is crucial considering the PAI-A does not have built-in
ADHD scales. Therefore, without possessing any validity scales to detect ADHD, the
PAI-A can detect 45% of malingered responses. The results in Table 7 and 10 suggest
that certain response trends can be found in a number of PAI-A scales which indicate
ADHD simulating. More specifically, the results in Table 10 that participants that
successfully simulated ADHD responded higher on the INC and INF scales compared to
unsuccessful ADHD simulators. These scales might be useful in detecting ADHD-
related symptoms, as suggested by the results found in Frazier’s and colleagues’ (2008)
study. Furthermore, upon creating and incorporating ADHD validity scales into the PAI-
A, it could be hypothesized that the percentage of successfully detecting malingering
responses will increase. Based on this study alone, however, cut-off scores of several
PAI-A validity indicators cannot be determined. The participants identified as successful
ADHD simulators are not actually diagnosed as having ADHD. Also, in order to
determine cut off scores or a scale for ADHD on the PAI-A, it would be required to
examine the CAARS and PAI-A scores of several adolescents that have been accurately
diagnosed by trustworthy clinicians as having ADHD.
26
This last point brings up a crucial aspect of research dealing with diagnoses. It is
extremely important to not only have trustworthy clinicians, but also accurate diagnoses
so that groups may be compared as accurately as possible. A possible limitation to this
study is the accuracy of ADHD diagnoses. The results showed that the unsuccessful
ADHD simulators scored higher on all the malingering indexes compared to the clinical
sample (see Table 6). It can be speculated that if the patients in the clinical sample would
have taken the CAARS, they would not have been detected as successfully simulating
ADHD. Yet, each patient in the clinical sample was diagnosed as having ADHD. This
might suggest that the patients were not accurately diagnosed. Further research is needed
to determine specific items on the PAI-A which will assist in differentiating between
true and feigned ADHD responses.
Out of all the PAI-A clinical scales that showed significance, as depicted by Table 7, the
ANX, MAN, SCZ, and ANT scales had the most elevated scores. This might suggest
that these clinical scales reflect certain symptoms that are related to ADHD. More
specifically, some of the subscales found in the PAI-A (i.e., MAN-A and SCZ-T) reflect
the ADHD symptoms of inattention and hyperactivity described in the DSM-IV-TR. The
results in Table 8 show that all participants in the coached condition and the participants
that were successful ADHD simulators, within the coached condition, scored higher on
the SCZ-T subscale, which represents thought disorders, subscale compared to the
MAN-A subscale, which represents hyperactivity symptoms. Likewise, more
27
participants simulated problems with inattention than with hyperactivity, as seen in
Table 9. Interestingly enough, upon further examining the adolescent in the video clip
that was presented, it is clear that more symptoms of inattention were shown compared
to symptoms related to hyperactivity. The participants in the coached condition appeared
to simulate ADHD related symptoms of inattention and memory problems more clearly
than symptoms of hyperactivity. This might suggest that coaching students with visual
material might be effective, although not significantly different than not coaching the
participants.
28
REFERENCES
Alfano K., & Boone, B. K. (2007). The use of effort tests in the context of actual versus feigned attention-deficit/hyperactivity disorder and learning disability. Assessment of feigned cognitive impairment: A neuropsychological perspective (pp. 366-383). New York, NY: Guilford Press.
Bagby, R. M., Nicholson, R. A., Bacchiochi, J. R., Ryder A. G., & Bury, A. S. (2002).
The predictive capacity of the MMPI-2 and PAI validity scales and indexes to detect coached and uncoached. Journal of Personality Assessment, 78, 69-86.
Cashel, M. L., Rogers, R. M., Sewell, K., & Marin-Cannici, C. (1995). The Personality
Assessment Inventory (PAI) and the detection of defensiveness. Assessment, 2, 333-342.
Conners, C. K., Erhardt, D., & Sparrow, M. A. (1999). Conners Adult ADHD Rating
Scales (CAARS). New York: Multihealth Systems, Inc. Frazier, T. W., Frazier, A. R., Busch, R. M., Kerwood, M. A., Demaree, H. A. (2008).
Detection of simulated ADHD and reading disorders using symptoms validity measures. Archives of Clinical Neuropsychology, 23, 501-509.
Morey, L. C. (1991). The Personality Assessment Inventory professional manual.
Odessa, FL: Psychological Assessment Resources. Morey, L. C. (1993). Defensiveness and malingering indices for the PAI. Paper
presented at the meeting of the American Psychological Association, Toronto, Canada.
Morey, L. C. (1996). An interpretive guide to the Personality Assessment Inventory.
Odessa, FL: Psychological Assessment Resources. Morey, L. C., & Lanier, V. W. (1998). Operating characteristics of six response
distortion indicators for the Personality Assessment Inventory. Assessment, 5, 203-214.
Morey, L. C., (2007). Personality Assessment Inventory-Adolescent professional
manual. Lutz, FL: Psychological Assessment Resources. Reynolds, W. M., (1998) Adolescent Psychopathology Scale. Odessa, FL: Psychological
Assessment Resources.
29
Rogers, R., Sewell, K. W., Morey, L. C., & Ustad, K. L. (1996). Detection of feigned mental disorders on the Personality Assessment Inventory: A discriminant analysis. Journal of Personality Assessment, 67, 629-640.
Sollman, M. J., Ranseen, J. D., & Berry, D. T. R. (2010). Detection of feigned ADHD in
college students. Psychological Assessment, 22, 325-335. Wang, E. W., Rogers, R., Giles, C. L., Diamond, P. M., Herrington-Wang, L. E., &
Taylor E. R. (1997). A pilot study of the Personality Assessment Inventory (PAI) in corrections: Assessment of malingering, suicide risk, and aggression in male inmates. Behavior Sciences and the Law, 15, 469-482.
30
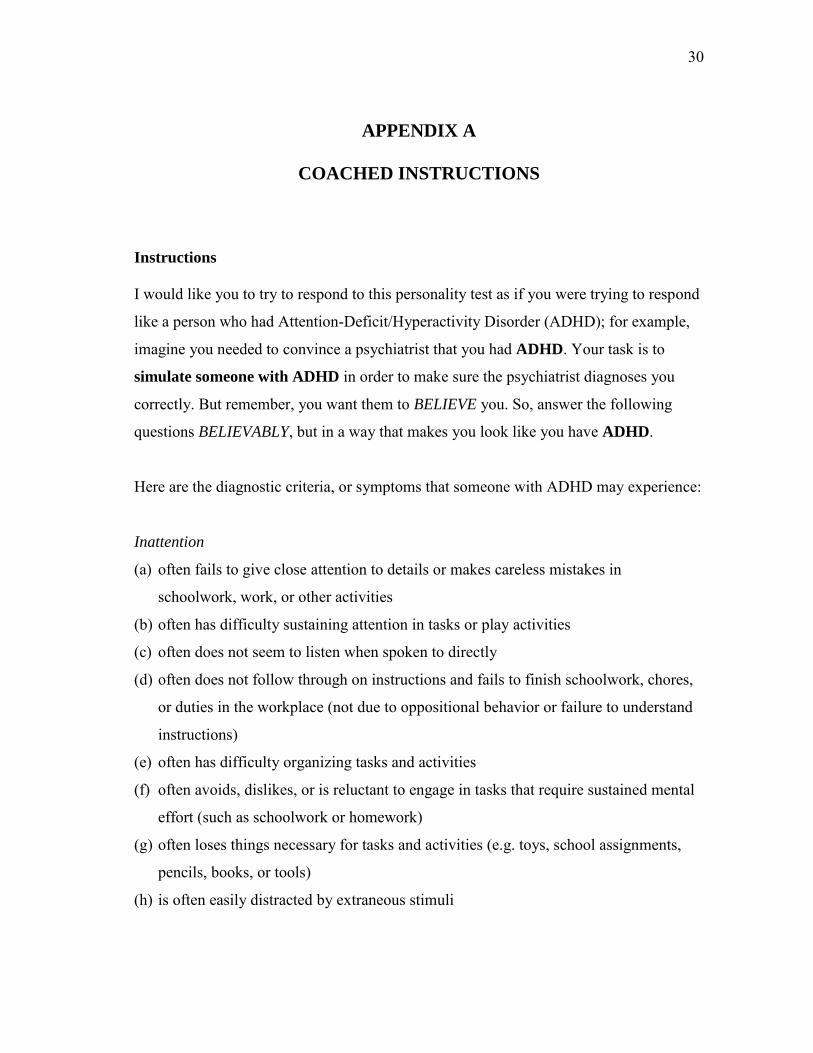
APPENDIX A
COACHED INSTRUCTIONS
Instructions
I would like you to try to respond to this personality test as if you were trying to respond
like a person who had Attention-Deficit/Hyperactivity Disorder (ADHD); for example,
imagine you needed to convince a psychiatrist that you had ADHD. Your task is to
simulate someone with ADHD in order to make sure the psychiatrist diagnoses you
correctly. But remember, you want them to BELIEVE you. So, answer the following
questions BELIEVABLY, but in a way that makes you look like you have ADHD.
Here are the diagnostic criteria, or symptoms that someone with ADHD may experience:
Inattention
(a) often fails to give close attention to details or makes careless mistakes in
schoolwork, work, or other activities
(b) often has difficulty sustaining attention in tasks or play activities
(c) often does not seem to listen when spoken to directly
(d) often does not follow through on instructions and fails to finish schoolwork, chores,
or duties in the workplace (not due to oppositional behavior or failure to understand
instructions)
(e) often has difficulty organizing tasks and activities
(f) often avoids, dislikes, or is reluctant to engage in tasks that require sustained mental
effort (such as schoolwork or homework)
(g) often loses things necessary for tasks and activities (e.g. toys, school assignments,
pencils, books, or tools)
(h) is often easily distracted by extraneous stimuli
31
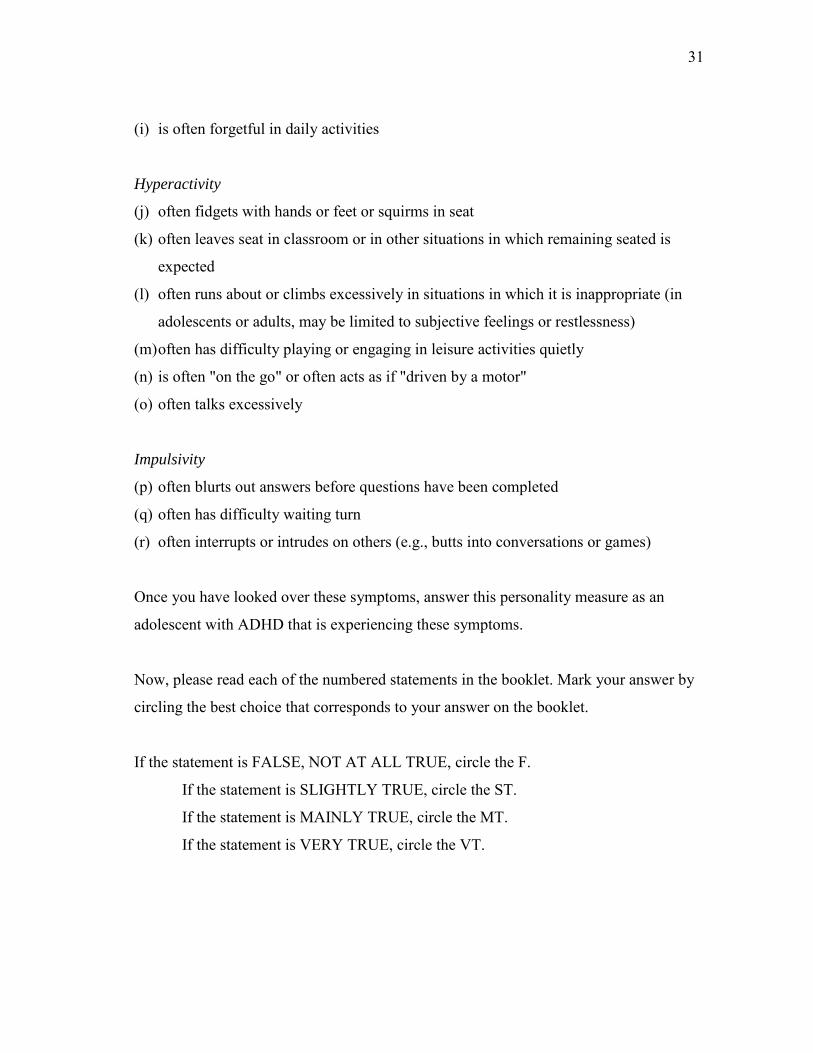
(i) is often forgetful in daily activities
Hyperactivity
(j) often fidgets with hands or feet or squirms in seat
(k) often leaves seat in classroom or in other situations in which remaining seated is
expected
(l) often runs about or climbs excessively in situations in which it is inappropriate (in
adolescents or adults, may be limited to subjective feelings or restlessness)
(m) often has difficulty playing or engaging in leisure activities quietly
(n) is often "on the go" or often acts as if "driven by a motor"
(o) often talks excessively
Impulsivity
(p) often blurts out answers before questions have been completed
(q) often has difficulty waiting turn
(r) often interrupts or intrudes on others (e.g., butts into conversations or games)
Once you have looked over these symptoms, answer this personality measure as an
adolescent with ADHD that is experiencing these symptoms.
Now, please read each of the numbered statements in the booklet. Mark your answer by
circling the best choice that corresponds to your answer on the booklet.
If the statement is FALSE, NOT AT ALL TRUE, circle the F.
If the statement is SLIGHTLY TRUE, circle the ST.
If the statement is MAINLY TRUE, circle the MT.
If the statement is VERY TRUE, circle the VT.
32
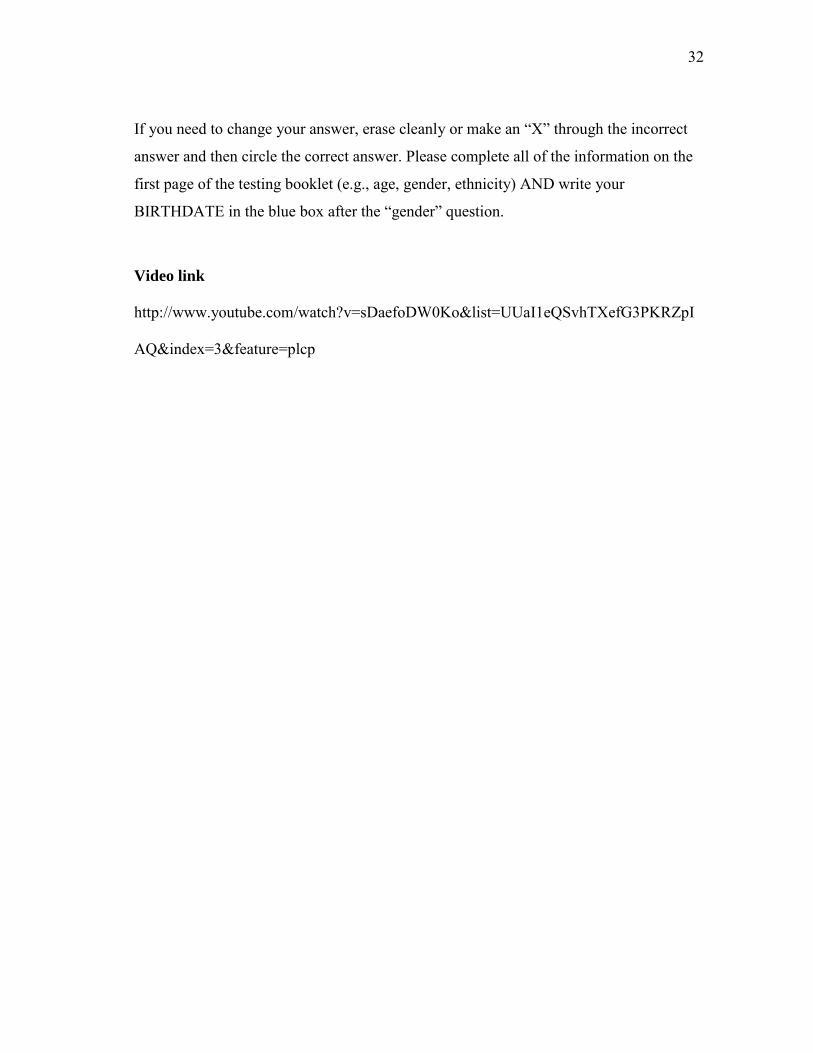
If you need to change your answer, erase cleanly or make an “X” through the incorrect
answer and then circle the correct answer. Please complete all of the information on the
first page of the testing booklet (e.g., age, gender, ethnicity) AND write your
BIRTHDATE in the blue box after the “gender” question.
Video link
http://www.youtube.com/watch?v=sDaefoDW0Ko&list=UUaI1eQSvhTXefG3PKRZpI
AQ&index=3&feature=plcp
33
APPENDIX B
NON-COACHED INSTRUCTIONS
I would like you to try to respond to this personality test as if you were trying to respond
like a person who had Attention-Deficit/Hyperactivity Disorder (ADHD); for example,
imagine you needed to convince a psychiatrist that you had ADHD. Your task is to
simulate someone with ADHD in order to make sure the psychiatrist diagnoses you
correctly. But remember, you want them to BELIEVE you. So, answer the following
questions BELIEVABLY, but in a way that makes you look like you have ADHD.
Now, please read each of the numbered statements in the booklet. Mark your answer by
circling the best choice that corresponds to your answer on the booklet.
If the statement is FALSE, NOT AT ALL TRUE, circle the F.
If the statement is SLIGHTLY TRUE, circle the ST.
If the statement is MAINLY TRUE, circle the MT.
If the statement is VERY TRUE, circle the VT.
If you need to change your answer, erase cleanly or make an “X” through the incorrect
answer and then circle the correct answer. Please complete all of the information on the
first page of the testing booklet (e.g., age, gender, ethnicity) AND write your
BIRTHDATE in the blue box after the “gender” question.
34
CONTACT INFORMATION
Name: Jessica Diaz de Tuesta
Professional Address: c/o Dr. Leslie C. Morey Department of Psychology MS 4235 Texas A&M University College Station, TX 77843
Email Address: [email protected]
Education: B.A., Psychology, Texas A&M University, May 2012 Summa Cum Laude Honors Undergraduate Research Fellow University Honors Foundation Honors College of Liberal Arts Honors Department of Psychology Honors
![Psychological test descriptions revised 6 - ntschools.org · Web view3.7] (MMPI-A) Minnesota Multiphasic Personality Inventory-Adolescent: An empirically based measure of adolescent](https://img.pdfslide.net/doc/110x75/5ca1a42a88c993eb5d8cb1b4/psychological-test-descriptions-revised-6-web-view37-mmpi-a-minnesota-multiphasic.jpg)