Embed Size (px)
Citation preview
The Picard Pipeline Sequencing Pipeline Informatics at Broad
• What is Picard?
• Picard in context
• What Picard produces and how to access it
• Metrics, Metrics, Metrics
• A set of tools for processing and analyzing next generation sequencing data
– Many of which are released publicly
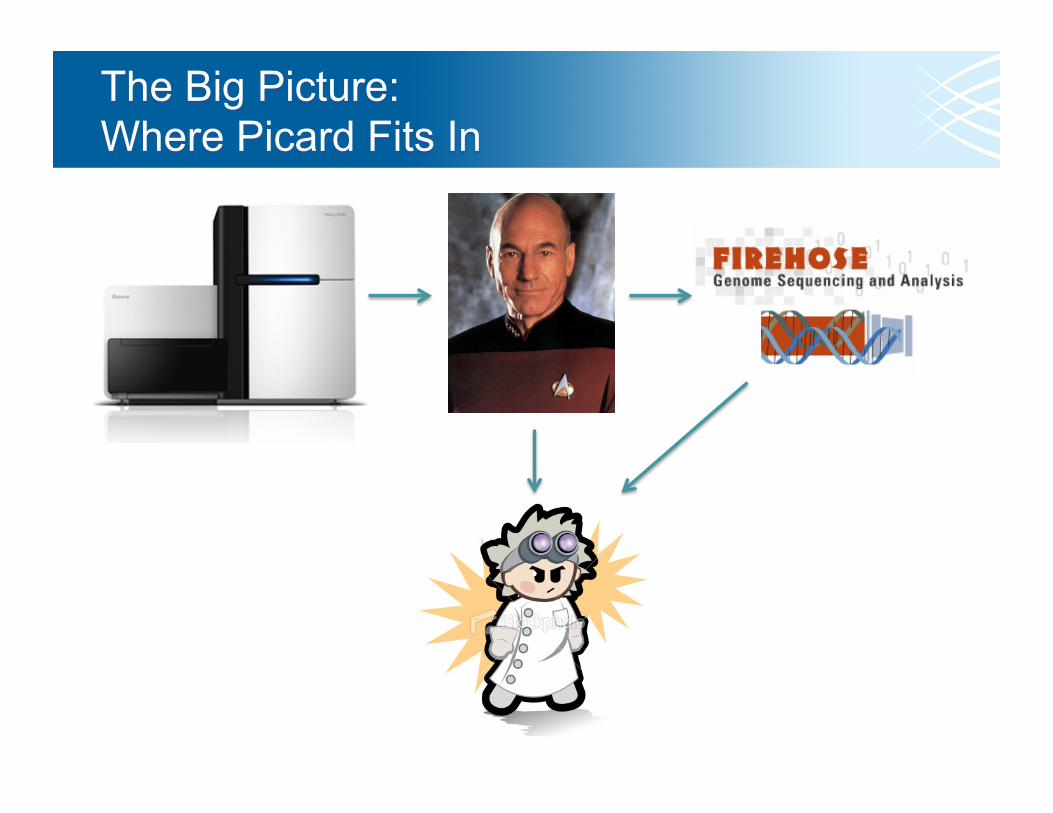
• A set of pipelines that process all Illumina sequence data generated at Broad
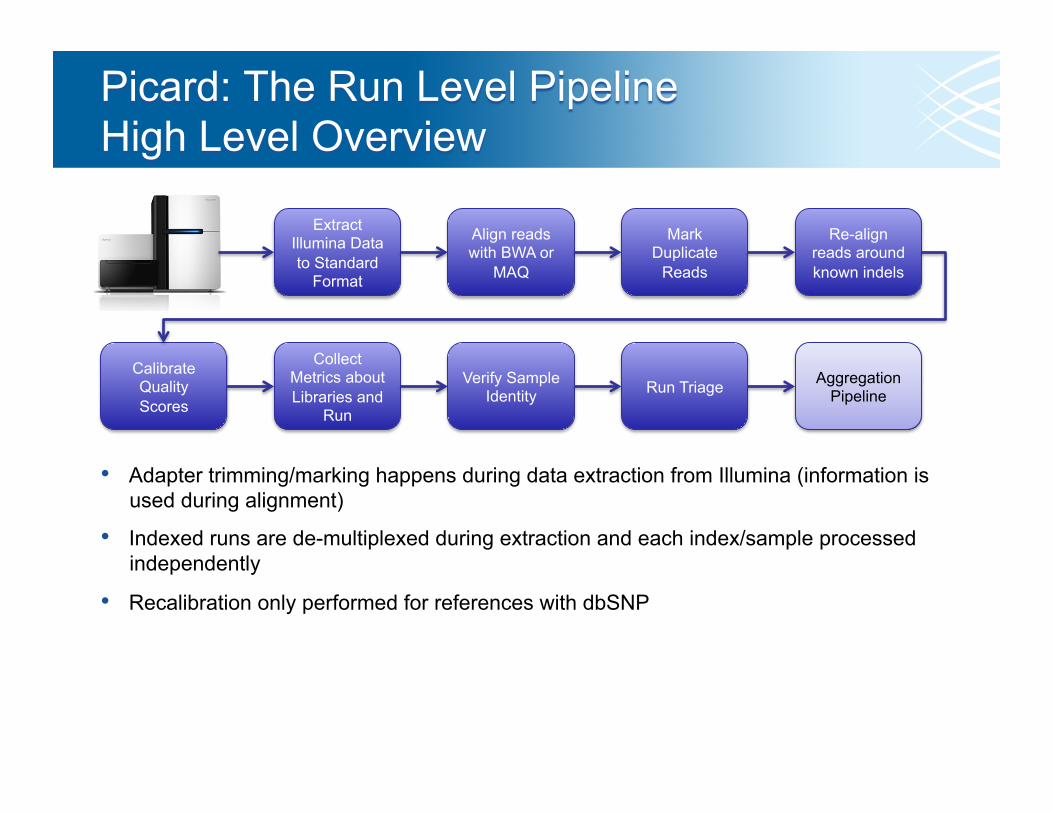
Extract Illumina Data to Standard
Format
Align reads with BWA or
MAQ
Mark Duplicate
Reads
Re-align reads around known indels
Calibrate Quality Scores
Collect Metrics about Libraries and
Run
Verify Sample Identity Run Triage
• Adapter trimming/marking happens during data extraction from Illumina (information is used during alignment)
• Indexed runs are de-multiplexed during extraction and each index/sample processed independently
• Recalibration only performed for references with dbSNP
Aggregation Pipeline
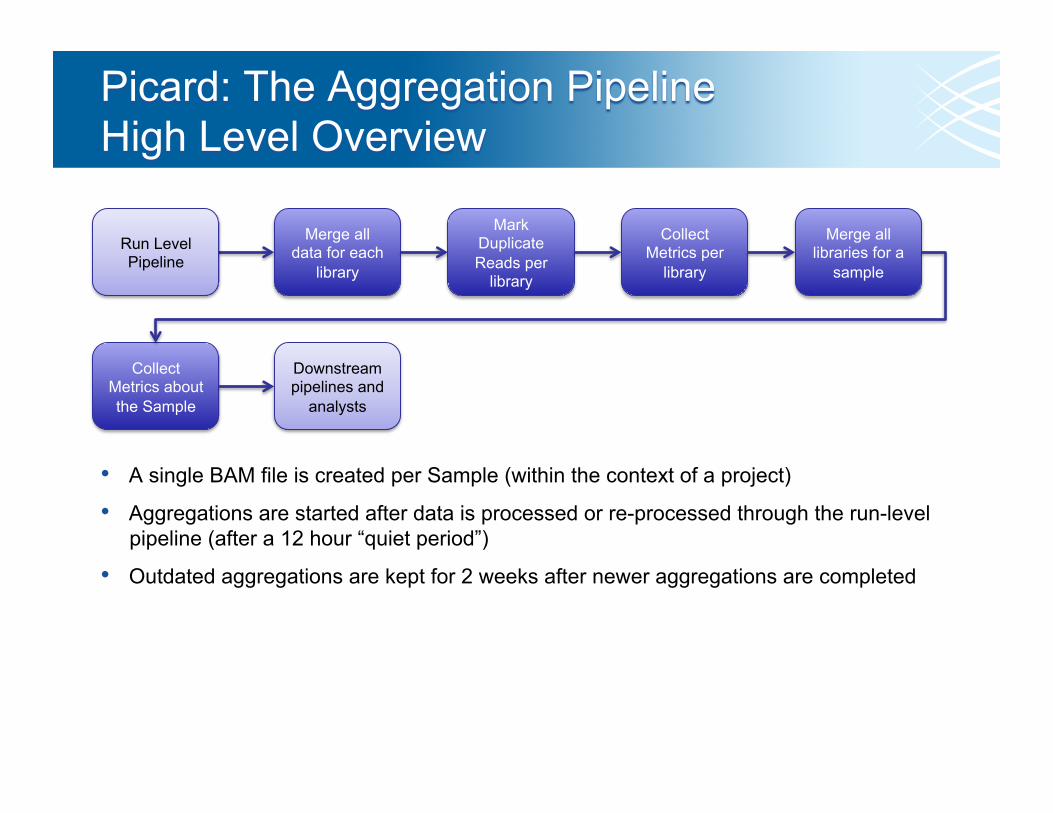
Merge all data for each
library
Mark Duplicate Reads per
library
Collect Metrics per
library
Merge all libraries for a
sample
Collect Metrics about the Sample
• A single BAM file is created per Sample (within the context of a project)
• Aggregations are started after data is processed or re-processed through the run-level pipeline (after a 12 hour “quiet period”)
• Outdated aggregations are kept for 2 weeks after newer aggregations are completed
Downstream pipelines and
analysts
Run Level Pipeline
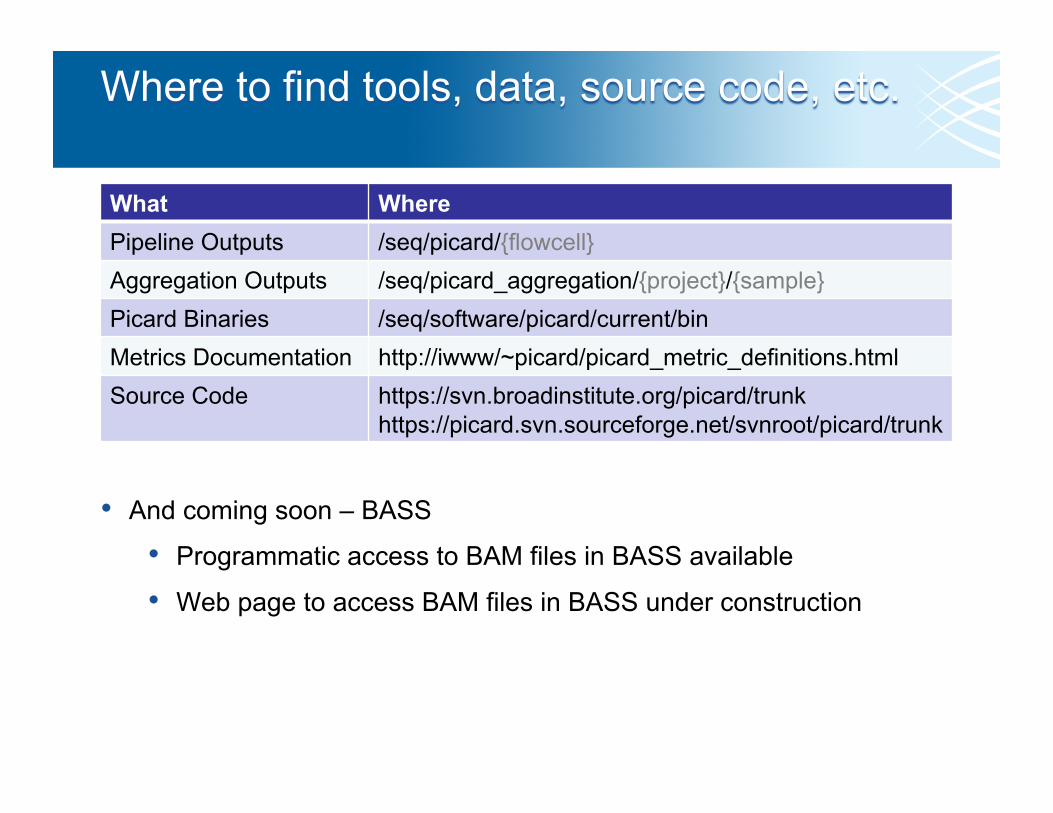
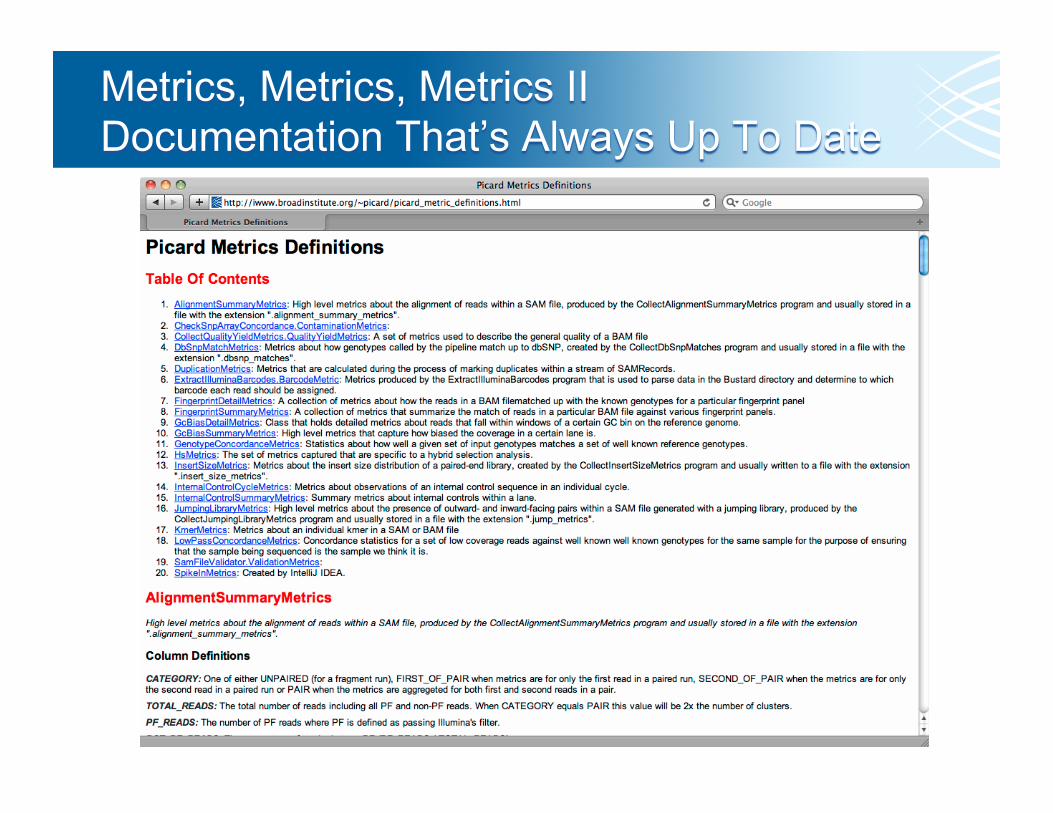
What Where Pipeline Outputs /seq/picard/{flowcell} Aggregation Outputs /seq/picard_aggregation/{project}/{sample} Picard Binaries /seq/software/picard/current/bin Metrics Documentation http://iwww/~picard/picard_metric_definitions.html Source Code https://svn.broadinstitute.org/picard/trunk
https://picard.svn.sourceforge.net/svnroot/picard/trunk
• And coming soon – BASS
• Programmatic access to BAM files in BASS available
• Web page to access BAM files in BASS under construction

• All primary data is delivered in BAM format, which includes basecalls (the reads), quality scores, alignment data, etc.
• BAM files processed through Picard always contain all reads, including:
– All unaligned reads (marked as unmapped)
– All duplicate reads (marked as duplicates)
– All “non-PF” reads (marked as failing vendor quality)
• The pipeline generates tons of metrics!
• And we have tools to generate even more than run in the pipeline
• Please check before re-inventing the wheel
Internal Control Metrics Quality Calibration Data Alignment Summary Metrics
GC Bias Metrics Quality By Cycle Quality Distribution
Duplication Metrics Insert Size Metrics Low Pass Concordance
Hybrid Selection Metrics SNP Fingerprint Jumping Library Metrics
dbSNP Concordance Quality/Yield Metrics Barcode Metrics
!!!!!!!
!!!
!
!
!
!
!
!
!
!
!!!!!!!!!!!!!!!!!!!!!!!!!
!!!!!!!!!!!!!!!!!
!!!!!!!!!!!!!!!!!!!!!!
!!!!!!!!!!!
!
!
!
!
!
!
0 20 40 60 80 100
0.0
0.5
1.0
1.5
2.0
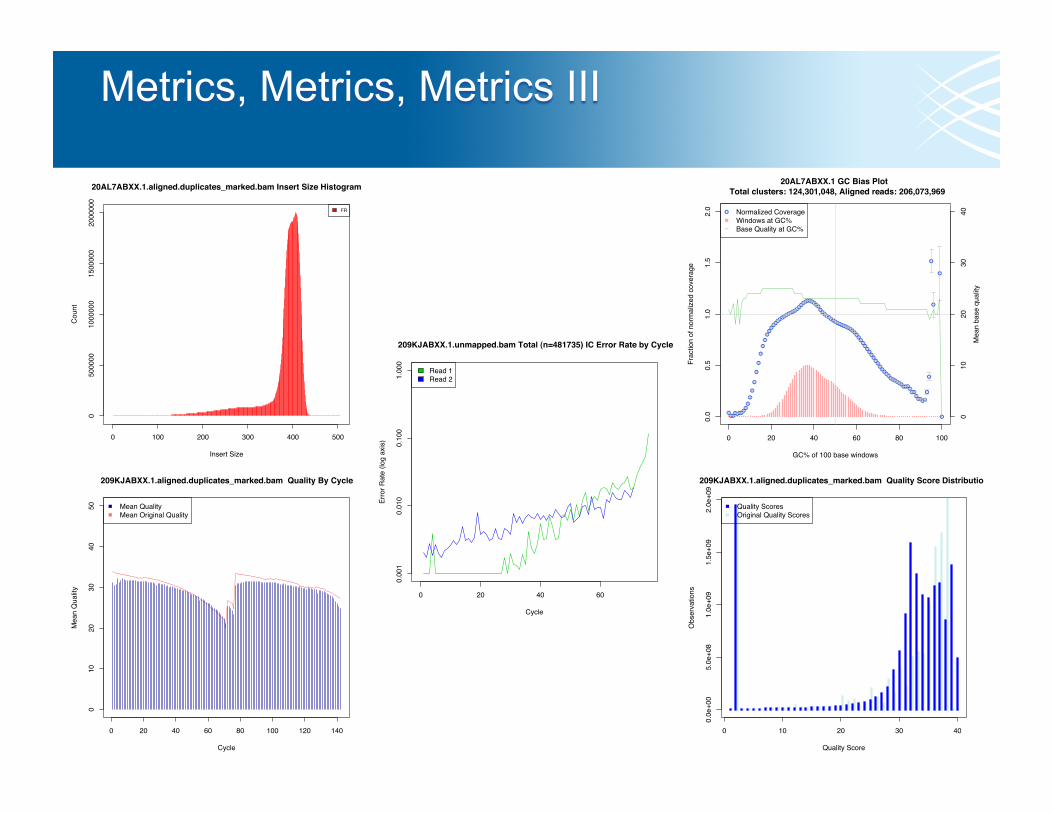
20AL7ABXX.1 GC Bias Plot Total clusters: 124,301,048, Aligned reads: 206,073,969
GC% of 100 base windows
Frac
tion
of n
orm
aliz
ed c
over
age
010
2030
40
Mea
n ba
se q
ualit
y
!
−
Normalized CoverageWindows at GC%Base Quality at GC%
0 100 200 300 400 500
050
0000
1000
000
1500
000
2000
000
20AL7ABXX.1.aligned.duplicates_marked.bam Insert Size Histogram
Insert Size
Cou
nt
FR
0 20 40 60 80 100 120 140
010
2030
4050
209KJABXX.1.aligned.duplicates_marked.bam Quality By Cycle
Cycle
Mea
n Q
uality
Mean QualityMean Original Quality
0 10 20 30 40
0.0e
+00
5.0e
+08
1.0e
+09
1.5e
+09
2.0e
+09
209KJABXX.1.aligned.duplicates_marked.bam Quality Score Distribution
Quality Score
Obs
erva
tions
Quality ScoresOriginal Quality Scores
0 20 40 60
209KJABXX.1.unmapped.bam Total (n=481735) IC Error Rate by Cycle
Cycle
Erro
r Rat
e (lo
g ax
is)
0.00
10.
010
0.10
01.
000
Read 1Read 2
• Integrate GATK Unified Genotyper in single-sample mode
• Customized pipeline for cDNA/RNA sequencing
• Yet more sample identity/validity checking