Embed Size (px)
Citation preview
Beacon EconomicsBeacon Economics | beaconecon.com
Christopher Thornberg, PhDFounding Partner, Beacon EconomicsDirector, UCR SoBA Center for Economic Forecasting and Development
October 2021
The Post-Covid World
The Future of Downtown
Beacon EconomicsBeacon Economics
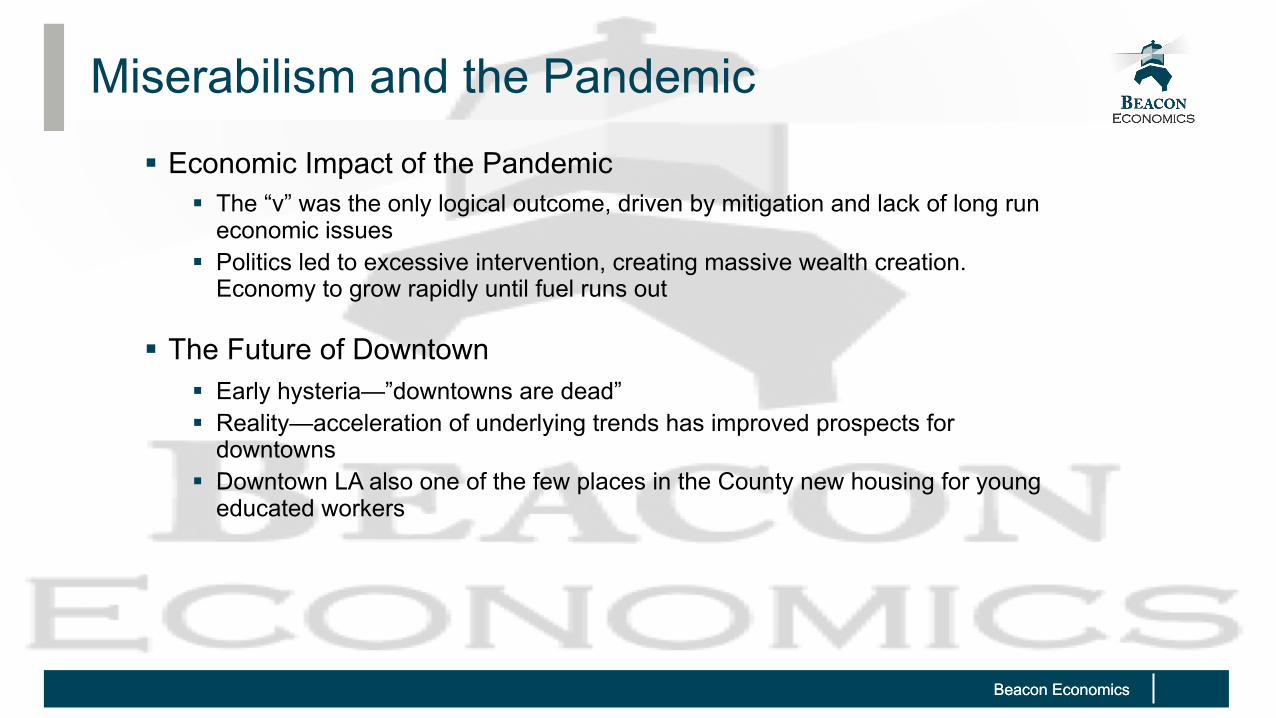
Miserabilism and the Pandemic
§ Economic Impact of the Pandemic§ The “v” was the only logical outcome, driven by mitigation and lack of long run
economic issues§ Politics led to excessive intervention, creating massive wealth creation.
Economy to grow rapidly until fuel runs out
§ The Future of Downtown§ Early hysteria—”downtowns are dead”§ Reality—acceleration of underlying trends has improved prospects for
downtowns§ Downtown LA also one of the few places in the County new housing for young
educated workers
Beacon EconomicsBeacon Economics
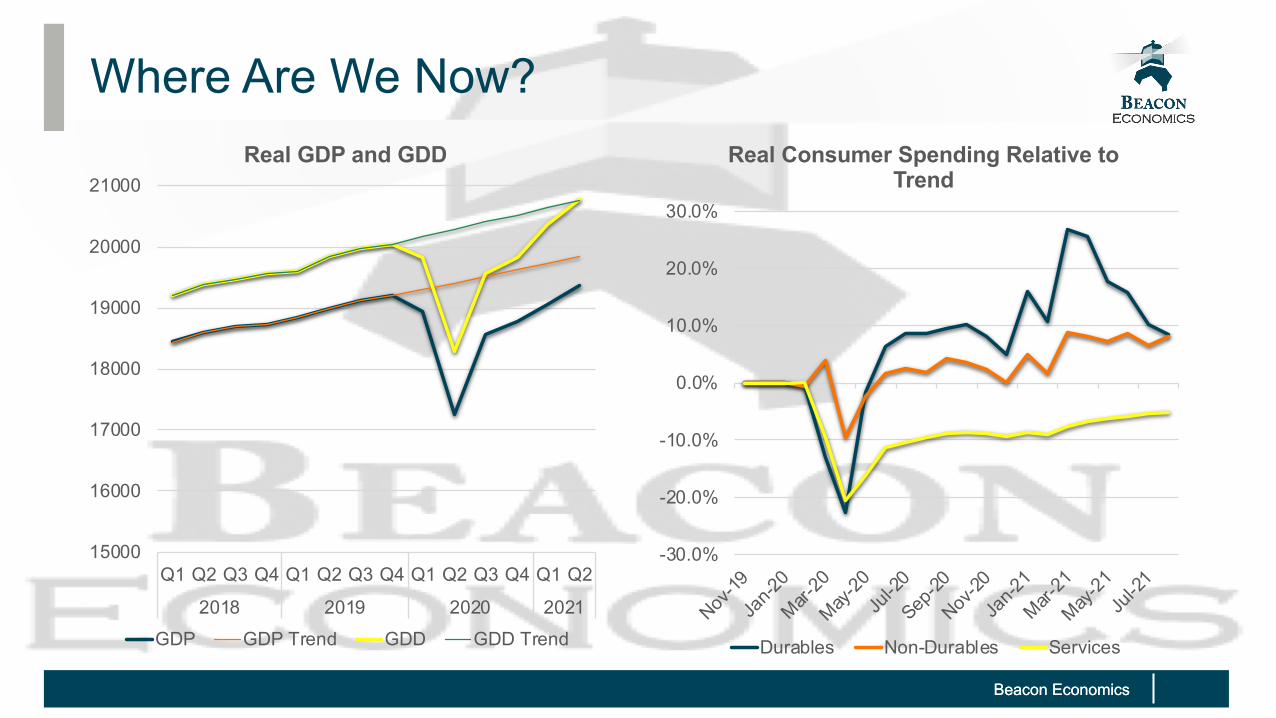
Where Are We Now?
15000
16000
17000
18000
19000
20000
21000
Q1 Q2 Q3 Q4 Q1 Q2 Q3 Q4 Q1 Q2 Q3 Q4 Q1 Q2
2018 2019 2020 2021
Real GDP and GDD
GDP GDP Trend GDD GDD Trend
-30.0%
-20.0%
-10.0%
0.0%
10.0%
20.0%
30.0%
Nov-19
Jan-2
0
Mar-20
May-20
Jul-2
0
Sep-20
Nov-20
Jan-2
1
Mar-21
May-21
Jul-2
1
Real Consumer Spending Relative to Trend
Durables Non-Durables Services
Beacon EconomicsBeacon Economics
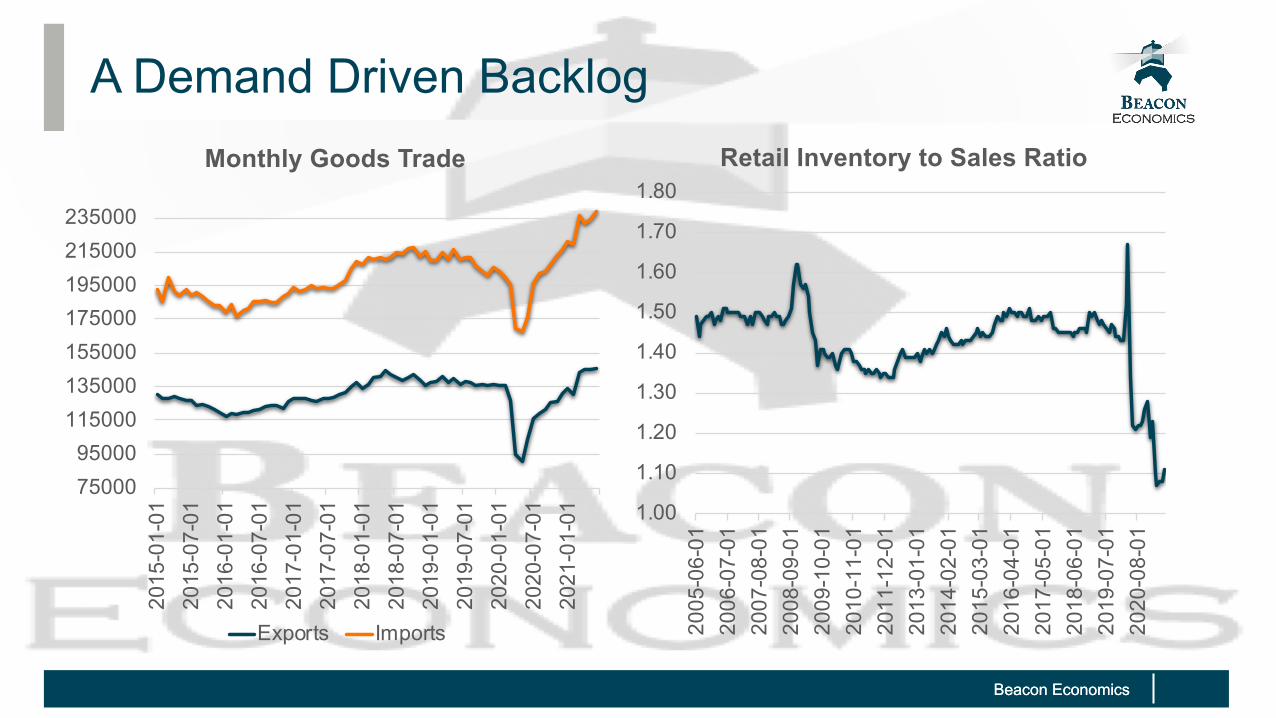
A Demand Driven Backlog
1.00
1.10
1.20
1.30
1.40
1.50
1.60
1.70
1.80
2005
-06-
0120
06-0
7-01
2007
-08-
0120
08-0
9-01
2009
-10-
0120
10-1
1-01
2011
-12-
0120
13-0
1-01
2014
-02-
0120
15-0
3-01
2016
-04-
0120
17-0
5-01
2018
-06-
0120
19-0
7-01
2020
-08-
01
Retail Inventory to Sales Ratio
7500095000
115000135000155000175000195000215000235000
2015
-01-
0120
15-0
7-01
2016
-01-
0120
16-0
7-01
2017
-01-
0120
17-0
7-01
2018
-01-
0120
18-0
7-01
2019
-01-
0120
19-0
7-01
2020
-01-
0120
20-0
7-01
2021
-01-
01
Monthly Goods Trade
Exports Imports
Beacon EconomicsBeacon Economics
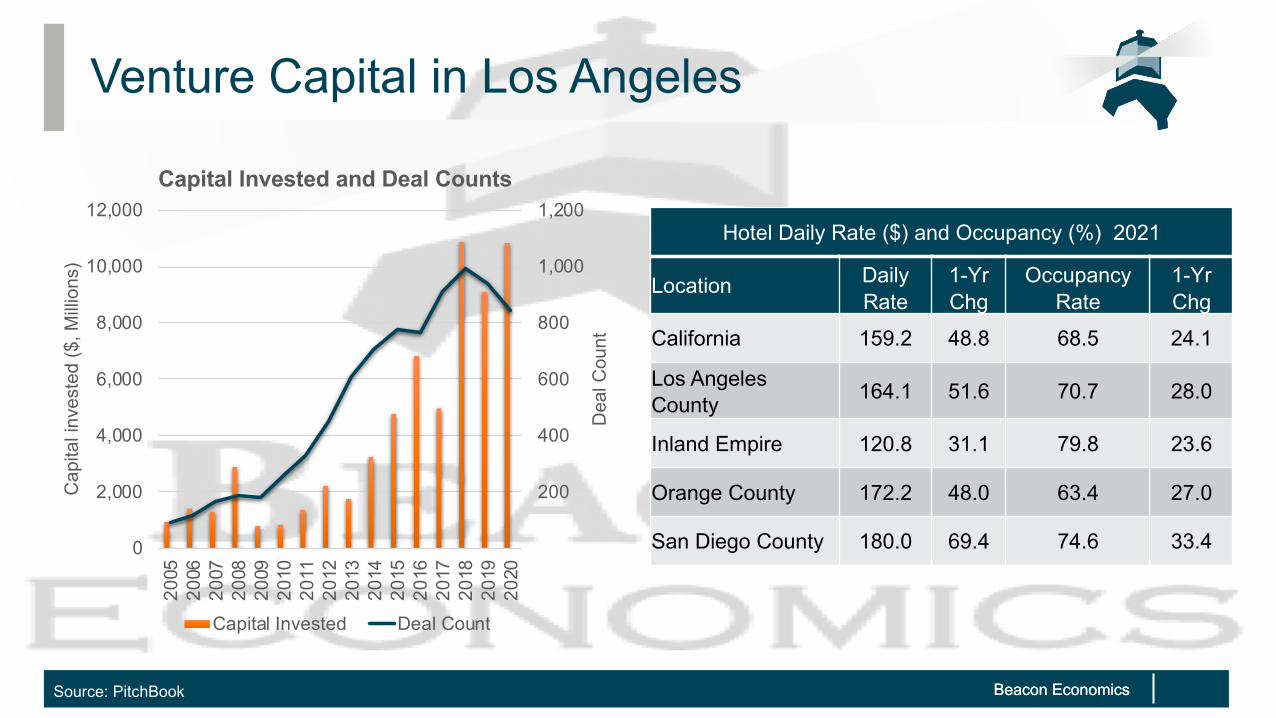
Venture Capital in Los Angeles
Source: PitchBook
200
400
600
800
1,000
1,200
0
2,000
4,000
6,000
8,000
10,000
12,000
2005
2006
2007
2008
2009
2010
2011
2012
2013
2014
2015
2016
2017
2018
2019
2020
Dea
l Cou
nt
Cap
ital i
nves
ted
($, M
illio
ns)
Capital Invested and Deal Counts
Capital Invested Deal Count
Hotel Daily Rate ($) and Occupancy (%) 2021
Location Daily Rate
1-Yr Chg
Occupancy Rate
1-Yr Chg
California 159.2 48.8 68.5 24.1
Los Angeles County
164.1 51.6 70.7 28.0
Inland Empire 120.8 31.1 79.8 23.6
Orange County 172.2 48.0 63.4 27.0
San Diego County 180.0 69.4 74.6 33.4
Beacon EconomicsBeacon Economics
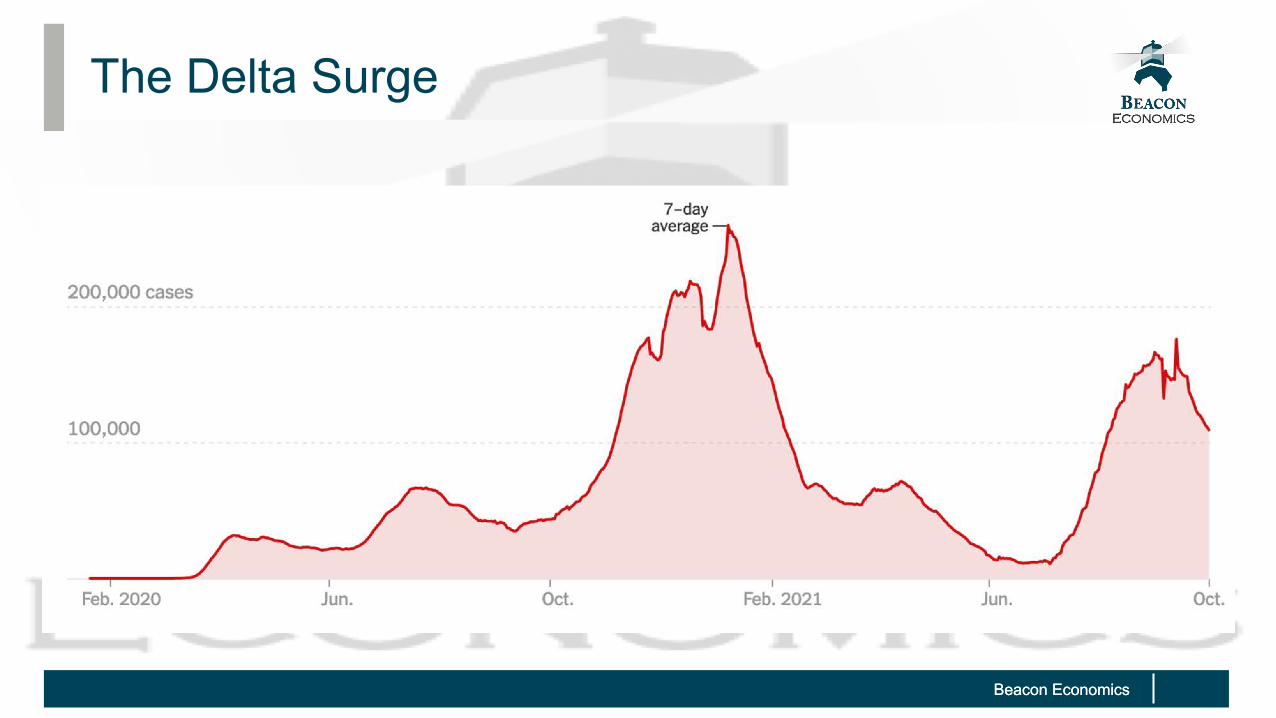
The Delta Surge
Beacon EconomicsBeacon Economics
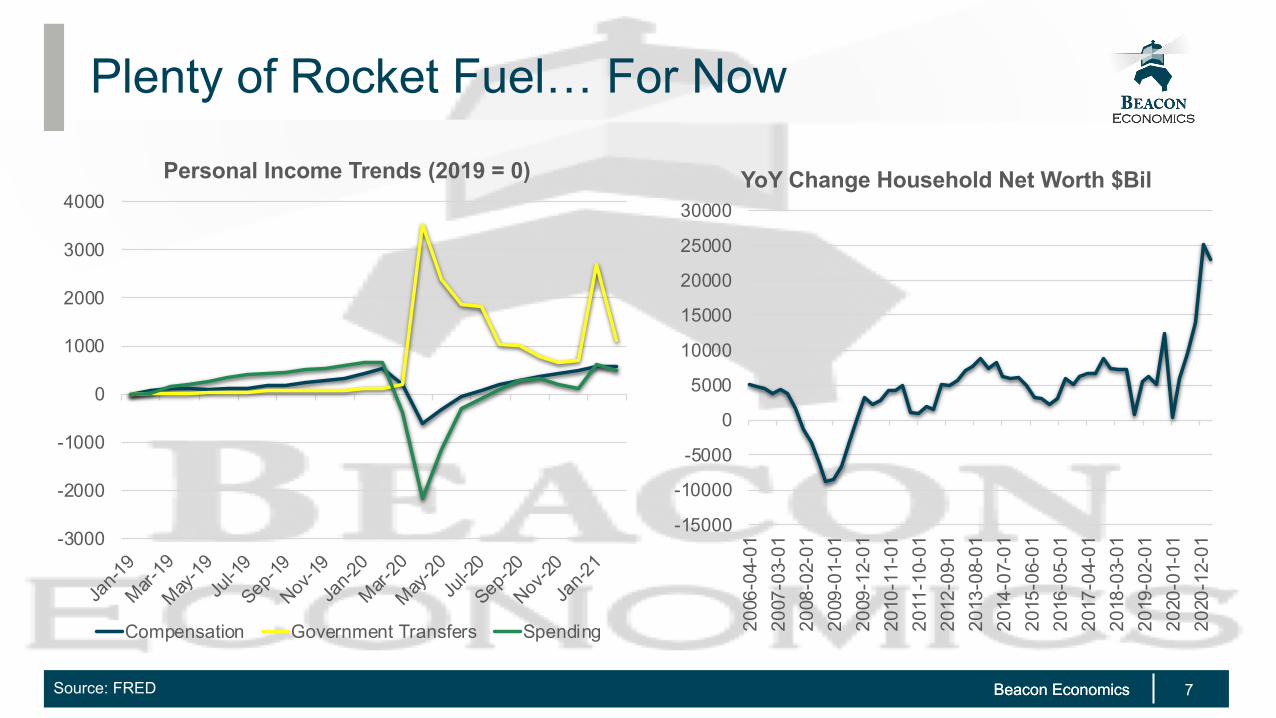
Plenty of Rocket Fuel… For Now
Source: FRED 7
-15000
-10000
-5000
0
5000
10000
15000
20000
25000
30000
2006
-04-
0120
07-0
3-01
2008
-02-
0120
09-0
1-01
2009
-12-
0120
10-1
1-01
2011
-10-
0120
12-0
9-01
2013
-08-
0120
14-0
7-01
2015
-06-
0120
16-0
5-01
2017
-04-
0120
18-0
3-01
2019
-02-
0120
20-0
1-01
2020
-12-
01
YoY Change Household Net Worth $Bil
-3000
-2000
-1000
0
1000
2000
3000
4000
Jan-1
9
Mar-19
May-1
9Ju
l-19
Sep-19
Nov-19
Jan-2
0
Mar-20
May-2
0Ju
l-20
Sep-20
Nov-20
Jan-2
1
Personal Income Trends (2019 = 0)
Compensation Government Transfers Spending

Beacon EconomicsBeacon Economics
Housing – U.S.
Source: National Association of Realtors, S&P Global
2000.0
3000.0
4000.0
5000.0
6000.0
7000.0
8000.0
Jan-
01M
ar-0
2M
ay-0
3Ju
l-04
Sep-
05N
ov-0
6Ja
n-08
Mar
-09
May
-10
Jul-1
1Se
p-12
Nov
-13
Jan-
15M
ar-1
6M
ay-1
7Ju
l-18
Sep-
19N
ov-2
0
Existing Home Sales18-19 19-20 20-21
Phoenix 5.8% 9.2% 28.3%San Diego 2.0% 5.5% 26.0%Seattle -0.6% 7.0% 24.1%Dallas 2.8% 3.3% 20.7%Tampa 4.6% 5.9% 20.7%San Francisco 0.2% 2.8% 20.4%Miami 2.7% 4.1% 19.4%Las Vegas 4.7% 3.4% 19.3%Denver 3.1% 4.4% 18.9%Charlotte 4.6% 6.0% 18.0%Portland 2.5% 5.1% 18.0%Los Angeles 1.2% 5.4% 17.2%New York 1.2% 2.3% 16.7%Atlanta 4.2% 4.9% 15.8%Cleveland 3.2% 5.4% 15.1%DC 2.7% 4.4% 15.0%Chicago 1.8% 1.3% 12.5%
Case Shiller HPI

Beacon EconomicsBeacon Economics
A Labor Market Paradox?
90000
95000
100000
105000
110000
115000
120000
125000
130000
135000
Jan-
05D
ec-0
5N
ov-0
6O
ct-0
7S
ep-0
8A
ug-0
9Ju
l-10
Jun-
11M
ay-1
2A
pr-1
3M
ar-1
4F
eb-1
5Ja
n-16
Dec
-16
Nov
-17
Oct
-18
Sep
-19
Aug
-20
Jul-2
1
US Payroll Employment
Aug 2021: -5%, 6.3m jobs
0
2000
4000
6000
8000
10000
12000
Dec
-00
Feb
-02
Apr
-03
Jun-
04A
ug-0
5O
ct-0
6D
ec-0
7F
eb-0
9A
pr-1
0Ju
n-11
Aug
-12
Oct
-13
Dec
-14
Feb
-16
Apr
-17
Jun-
18A
ug-1
9O
ct-2
0
Job Openings and Quits
Openings Quits
Beacon EconomicsBeacon Economics
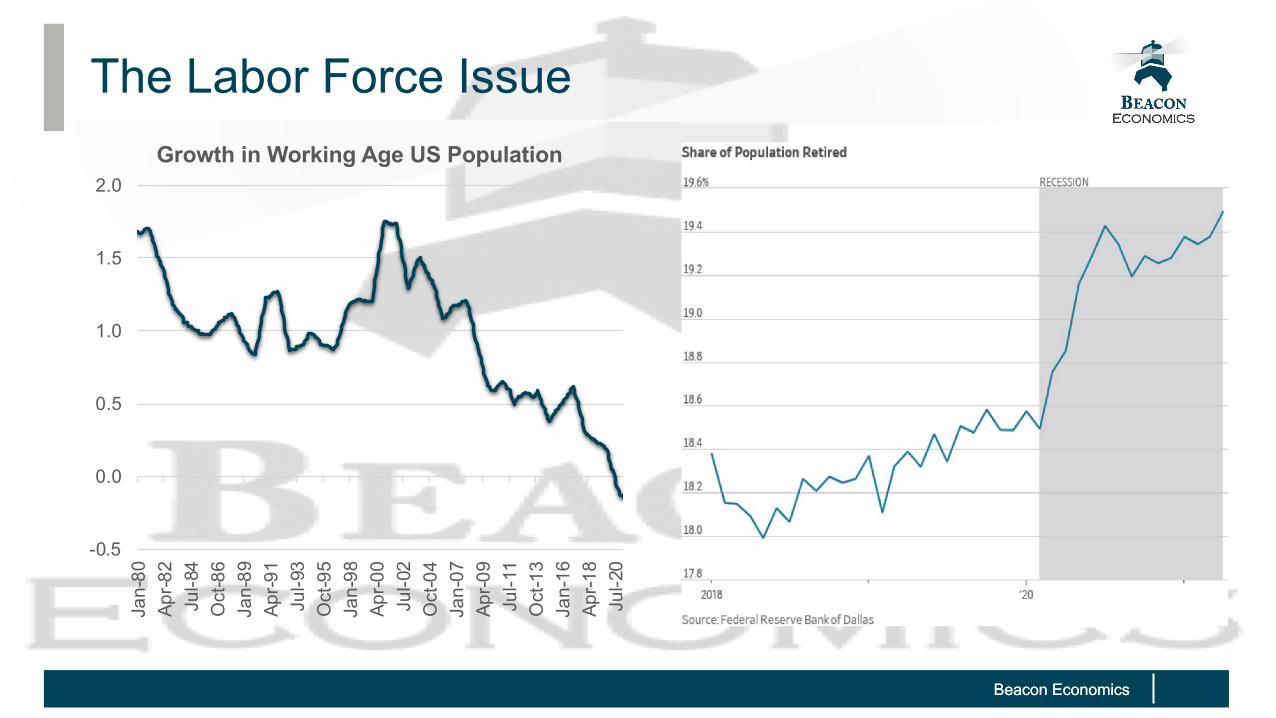
The Labor Force Issue
-0.5
0.0
0.5
1.0
1.5
2.0
Jan-
80Ap
r-82
Jul-8
4O
ct-8
6Ja
n-89
Apr-9
1Ju
l-93
Oct
-95
Jan-
98Ap
r-00
Jul-0
2O
ct-0
4Ja
n-07
Apr-0
9Ju
l-11
Oct
-13
Jan-
16Ap
r-18
Jul-2
0
Growth in Working Age US Population
Beacon EconomicsBeacon Economics
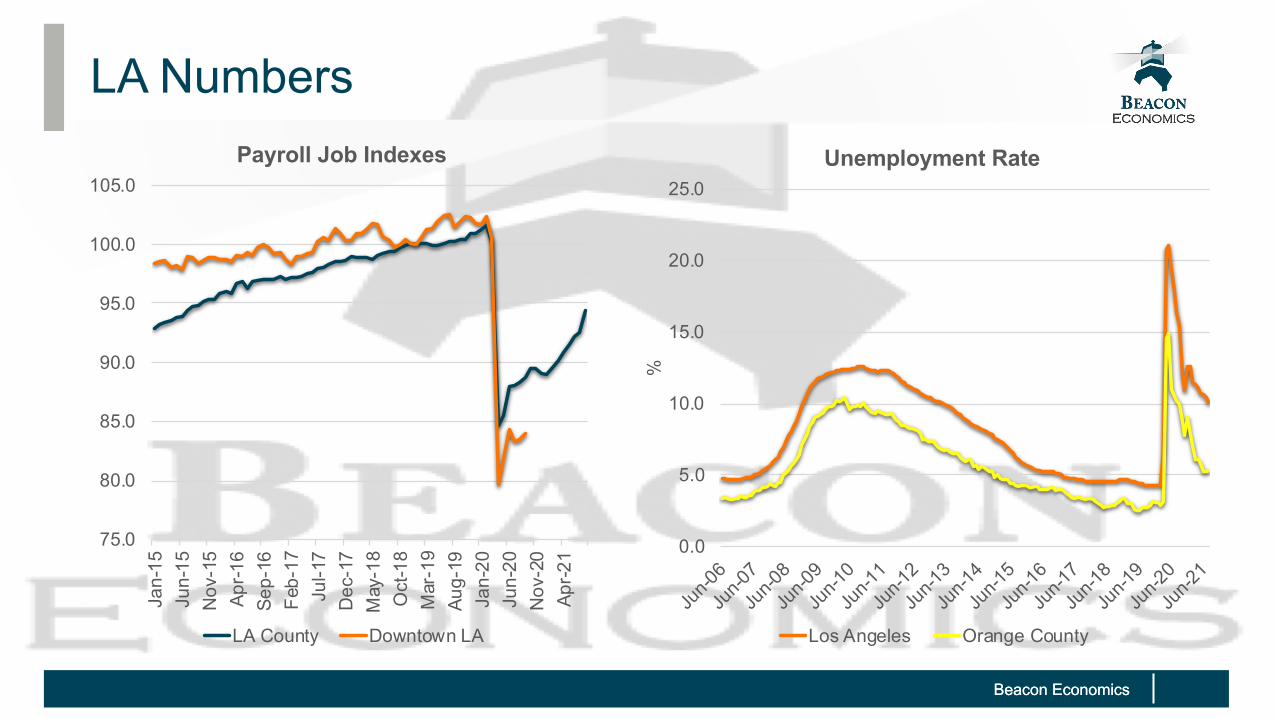
LA Numbers
75.0
80.0
85.0
90.0
95.0
100.0
105.0Ja
n-15
Jun-
15N
ov-1
5Ap
r-16
Sep-
16Fe
b-17
Jul-1
7D
ec-1
7M
ay-1
8O
ct-1
8M
ar-1
9Au
g-19
Jan-
20Ju
n-20
Nov
-20
Apr-2
1
Payroll Job Indexes
LA County Downtown LA
0.0
5.0
10.0
15.0
20.0
25.0
Jun-0
6
Jun-0
7
Jun-0
8
Jun-0
9
Jun-1
0
Jun-1
1
Jun-1
2
Jun-1
3
Jun-1
4
Jun-1
5
Jun-1
6
Jun-1
7
Jun-1
8
Jun-1
9
Jun-2
0
Jun-2
1
%
Unemployment Rate
Los Angeles Orange County
Beacon EconomicsBeacon Economics
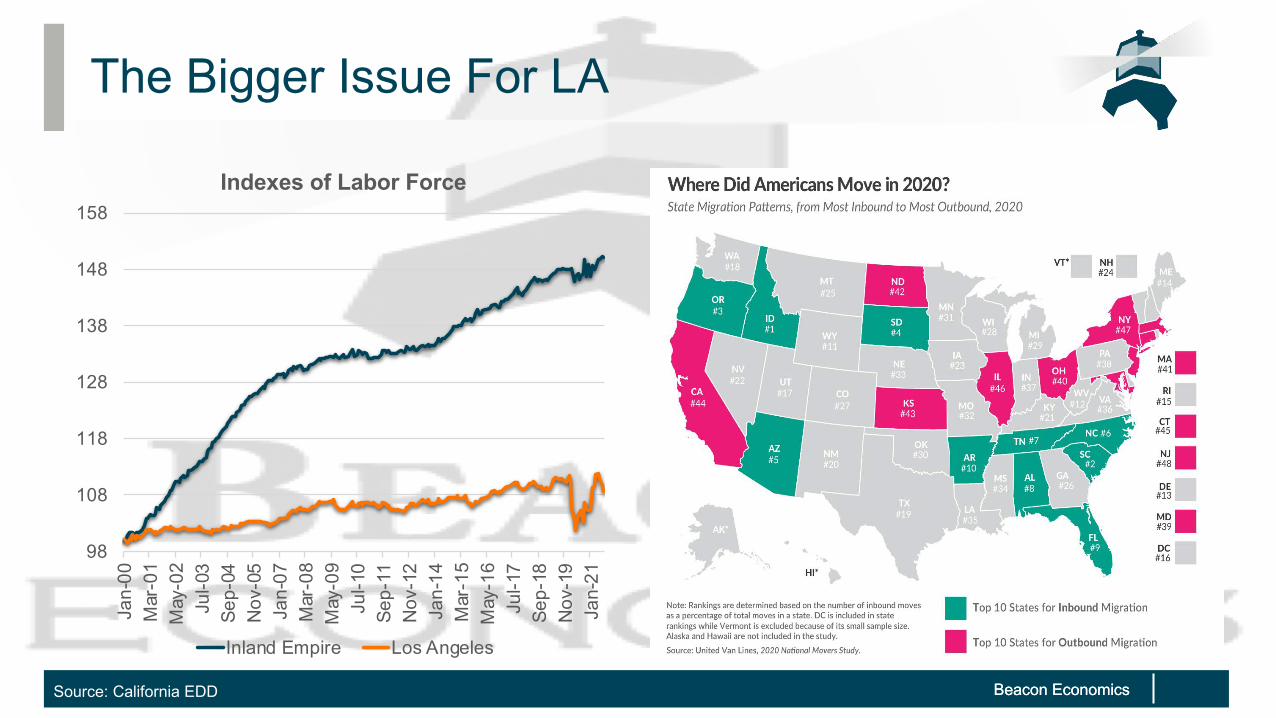
The Bigger Issue For LA
Source: California EDD
98
108
118
128
138
148
158
Jan-
00M
ar-0
1M
ay-0
2Ju
l-03
Sep-
04N
ov-0
5Ja
n-07
Mar
-08
May
-09
Jul-1
0Se
p-11
Nov
-12
Jan-
14M
ar-1
5M
ay-1
6Ju
l-17
Sep-
18N
ov-1
9Ja
n-21
Indexes of Labor Force
Inland Empire Los Angeles
Beacon EconomicsBeacon Economics
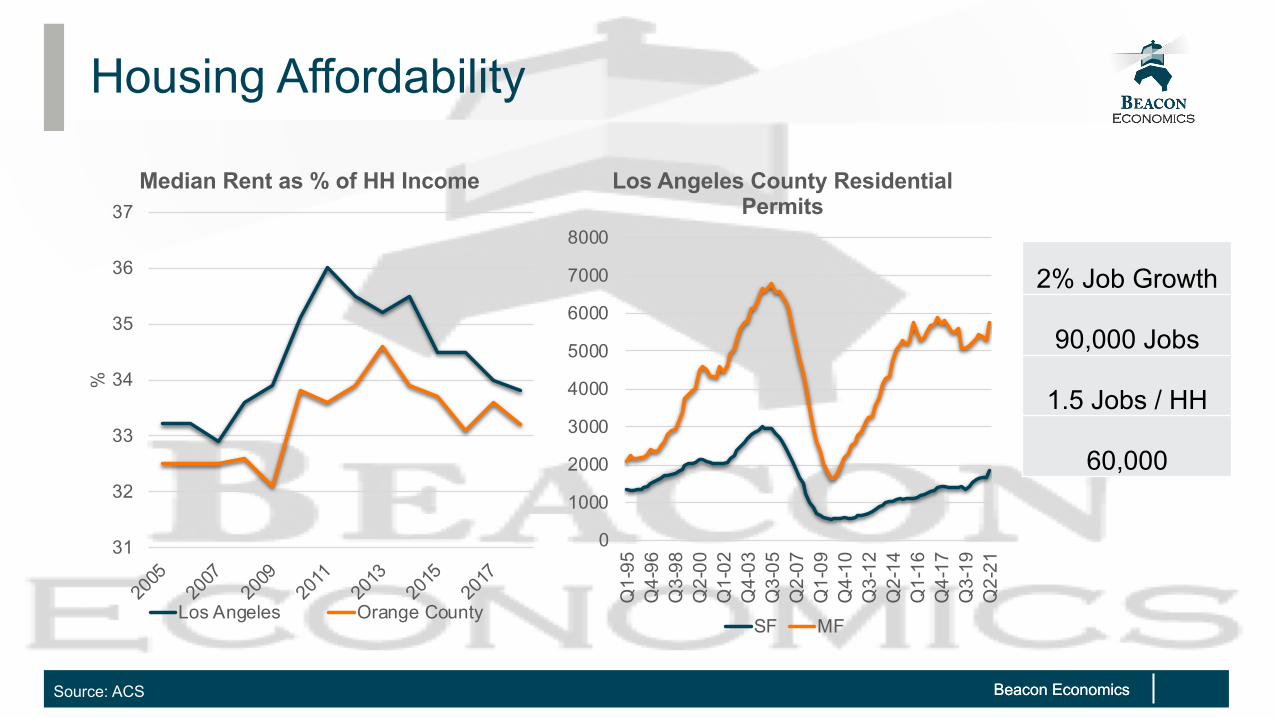
Housing Affordability
Source: ACS
31
32
33
34
35
36
37
2005
2007
2009
2011
2013
2015
2017
%
Median Rent as % of HH Income
Los Angeles Orange County
0
1000
2000
3000
4000
5000
6000
7000
8000
Q1
-9
5
Q4
-9
6
Q3
-9
8
Q2
-0
0
Q1
-0
2
Q4
-0
3
Q3
-0
5
Q2
-0
7
Q1
-0
9
Q4
-1
0
Q3
-1
2
Q2
-1
4
Q1
-1
6
Q4
-1
7
Q3
-1
9
Q2
-2
1
Los Angeles County Residential Permits
SF MF
2% Job Growth
90,000 Jobs
1.5 Jobs / HH
60,000
Beacon EconomicsBeacon Economics
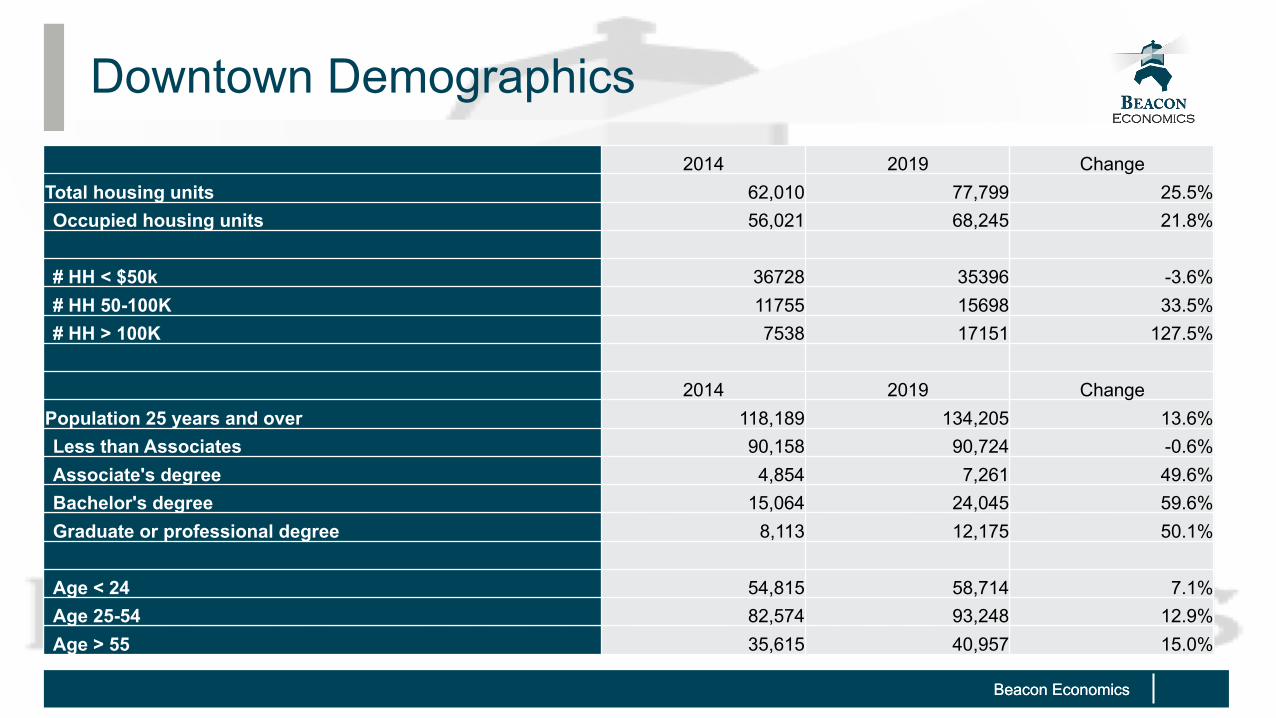
Downtown Demographics2014 2019 Change
Total housing units 62,010 77,799 25.5%Occupied housing units 56,021 68,245 21.8%
# HH < $50k 36728 35396 -3.6%# HH 50-100K 11755 15698 33.5%# HH > 100K 7538 17151 127.5%
2014 2019 ChangePopulation 25 years and over 118,189 134,205 13.6%Less than Associates 90,158 90,724 -0.6%Associate's degree 4,854 7,261 49.6%Bachelor's degree 15,064 24,045 59.6%Graduate or professional degree 8,113 12,175 50.1%
Age < 24 54,815 58,714 7.1%Age 25-54 82,574 93,248 12.9%Age > 55 35,615 40,957 15.0%
Beacon EconomicsBeacon Economics
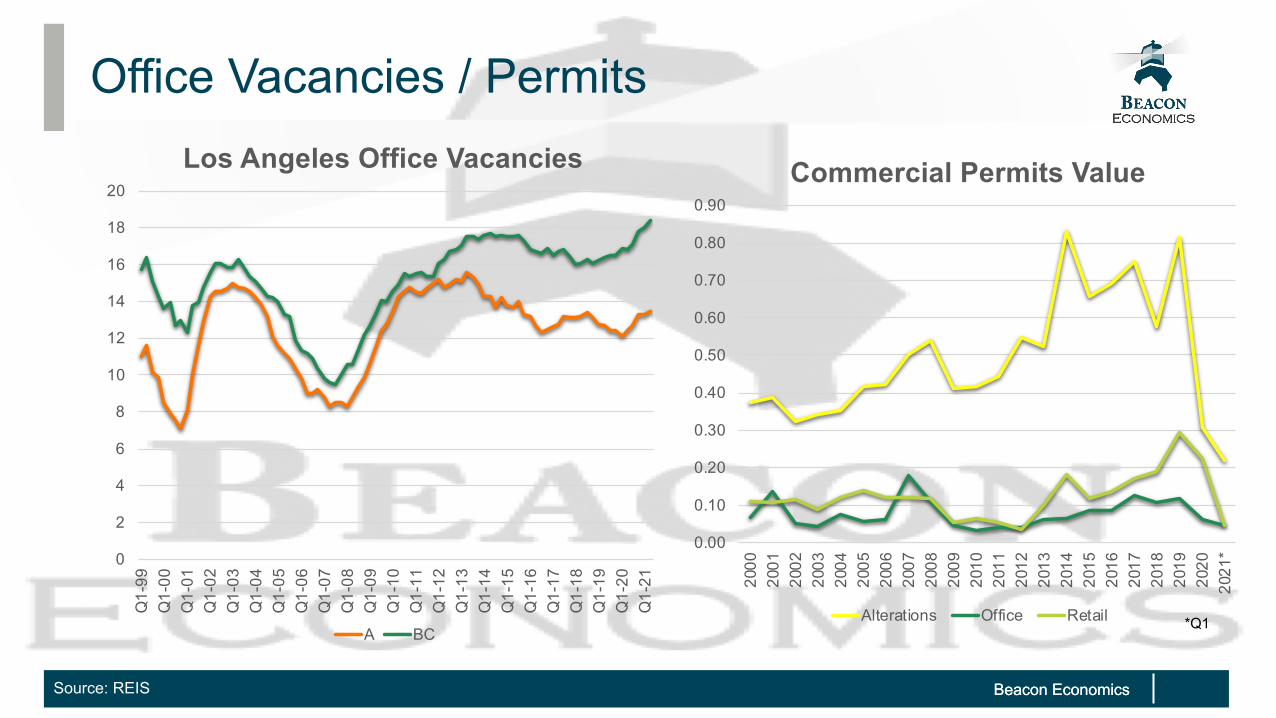
Office Vacancies / Permits
Source: REIS
0
2
4
6
8
10
12
14
16
18
20
Q1-
99Q
1-00
Q1-
01Q
1-02
Q1-
03Q
1-04
Q1-
05Q
1-06
Q1-
07Q
1-08
Q1-
09Q
1-10
Q1-
11Q
1-12
Q1-
13Q
1-14
Q1-
15Q
1-16
Q1-
17Q
1-18
Q1-
19Q
1-20
Q1-
21
Los Angeles Office Vacancies
A BC
0.00
0.10
0.20
0.30
0.40
0.50
0.60
0.70
0.80
0.90
2000
2001
2002
2003
2004
2005
2006
2007
2008
2009
2010
2011
2012
2013
2014
2015
2016
2017
2018
2019
2020
2021
*
Commercial Permits Value
Alterations Office Retail *Q1
Beacon EconomicsBeacon Economics
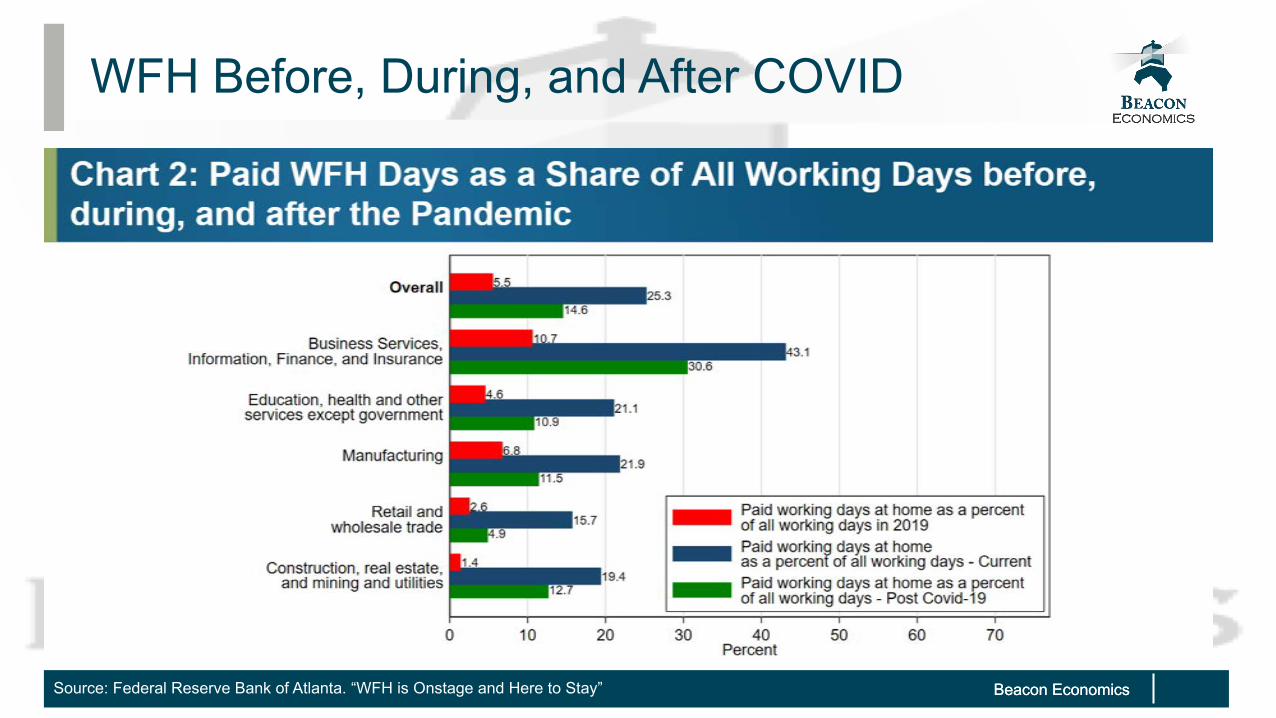
WFH Before, During, and After COVID
Source: Federal Reserve Bank of Atlanta. “WFH is Onstage and Here to Stay”
Beacon EconomicsBeacon Economics
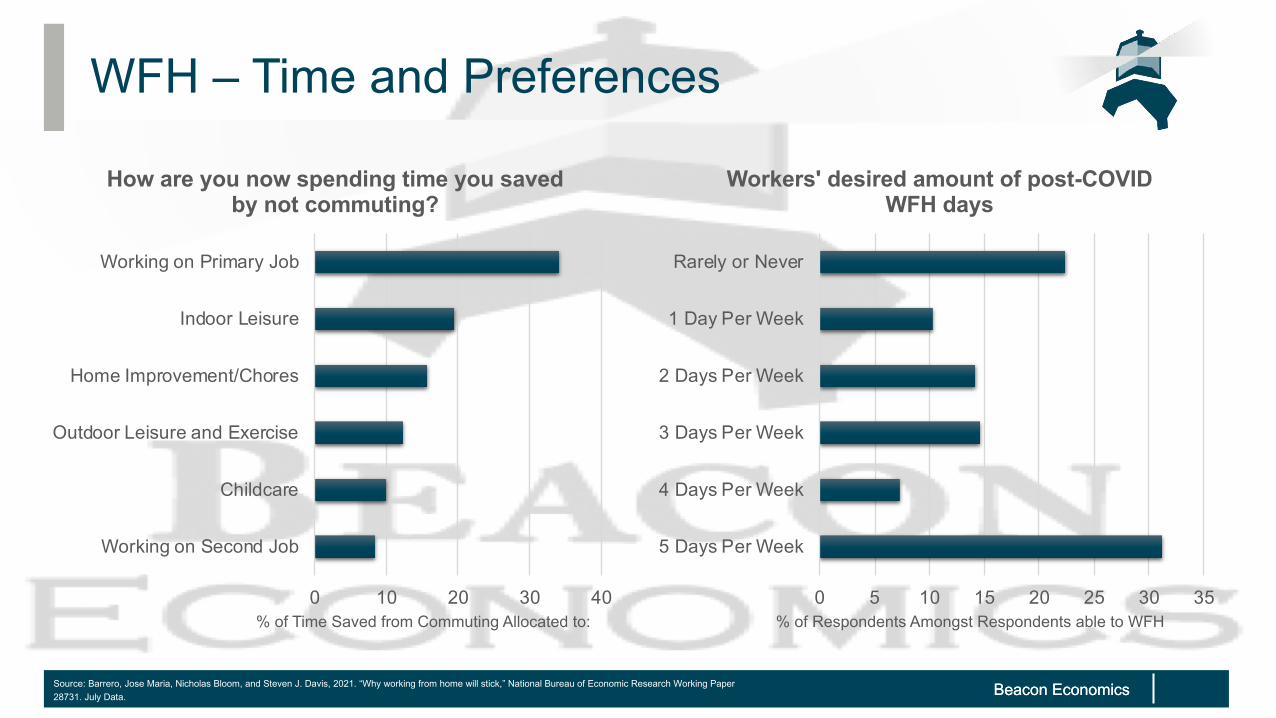
WFH – Time and Preferences
Source: Barrero, Jose Maria, Nicholas Bloom, and Steven J. Davis, 2021. “Why working from home will stick,” National Bureau of Economic Research Working Paper 28731. July Data.
0 10 20 30 40
Working on Second Job
Childcare
Outdoor Leisure and Exercise
Home Improvement/Chores
Indoor Leisure
Working on Primary Job
% of Time Saved from Commuting Allocated to:
How are you now spending time you saved by not commuting?
0 5 10 15 20 25 30 35
5 Days Per Week
4 Days Per Week
3 Days Per Week
2 Days Per Week
1 Day Per Week
Rarely or Never
% of Respondents Amongst Respondents able to WFH
Workers' desired amount of post-COVID WFH days
Beacon EconomicsBeacon Economics
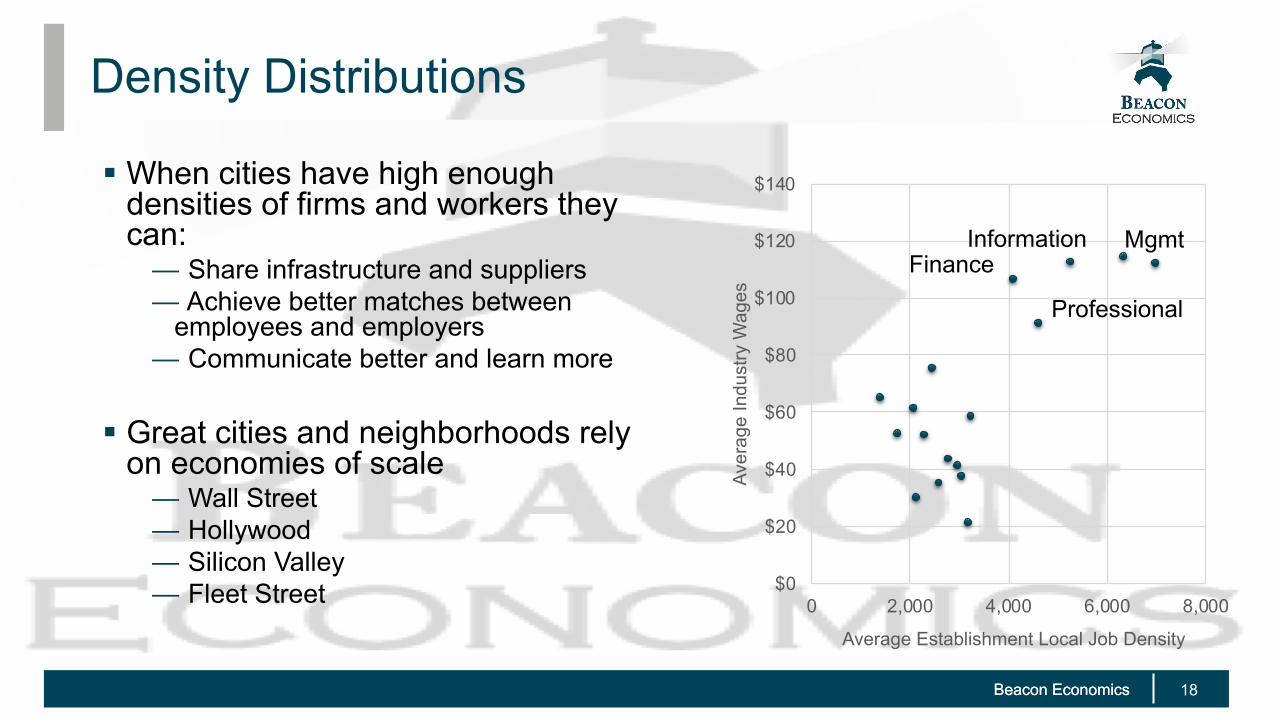
Density Distributions
18
$0
$20
$40
$60
$80
$100
$120
$140
0 2,000 4,000 6,000 8,000
Ave
rage
Indu
stry
Wag
es
Average Establishment Local Job Density
InformationFinance
Professional
Mgmt
§ When cities have high enough densities of firms and workers they can:
⏤ Share infrastructure and suppliers⏤ Achieve better matches between
employees and employers⏤ Communicate better and learn more
§ Great cities and neighborhoods rely on economies of scale
⏤ Wall Street⏤ Hollywood⏤ Silicon Valley⏤ Fleet Street
Beacon EconomicsBeacon Economics
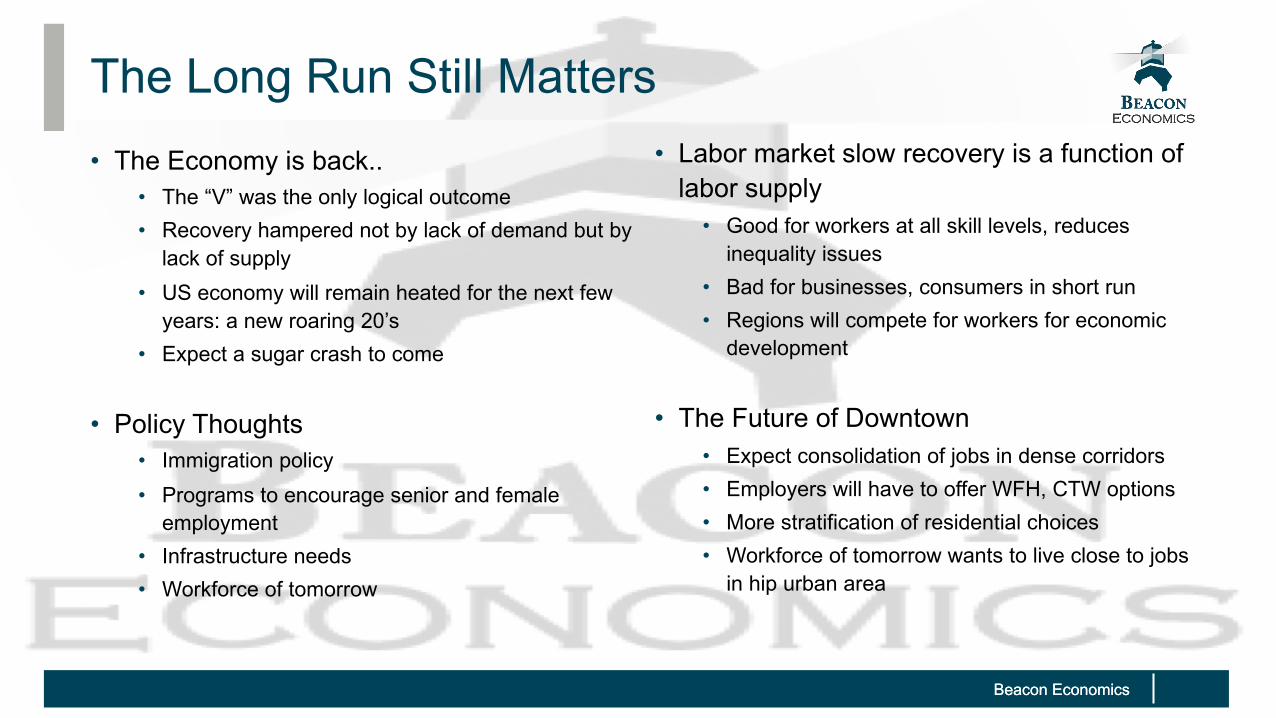
The Long Run Still Matters
• The Economy is back..• The “V” was the only logical outcome• Recovery hampered not by lack of demand but by
lack of supply
• US economy will remain heated for the next few years: a new roaring 20’s
• Expect a sugar crash to come
• Policy Thoughts• Immigration policy
• Programs to encourage senior and female employment
• Infrastructure needs• Workforce of tomorrow
• Labor market slow recovery is a function of labor supply
• Good for workers at all skill levels, reduces inequality issues
• Bad for businesses, consumers in short run• Regions will compete for workers for economic
development
• The Future of Downtown• Expect consolidation of jobs in dense corridors • Employers will have to offer WFH, CTW options• More stratification of residential choices• Workforce of tomorrow wants to live close to jobs
in hip urban area
Beacon EconomicsBeacon Economics
What can Beacon do for you?
20
Housing, Land Use, & Real Estate
Advisory
Sustainable Growth and
Development
Economic & Revenue
Forecasting
Economic, Fiscal and Social Impact
Analysis
Regional and Sub-Regional Analysis
Litigation and Testimony
For more information, see Slide 2.
Continue the conversation.
Contact Dr. Chris Thornberg directly at [email protected] or 310.571.3399
Let’s discuss your goals and needs.
Beacon has 6 Practice Areas covering a range of services and products.
To view again or download this presentation and for further information, go to: www.BeaconEcon.com
Connect with us.
Our 6 Practice Areas
Beacon EconomicsBeacon Economics
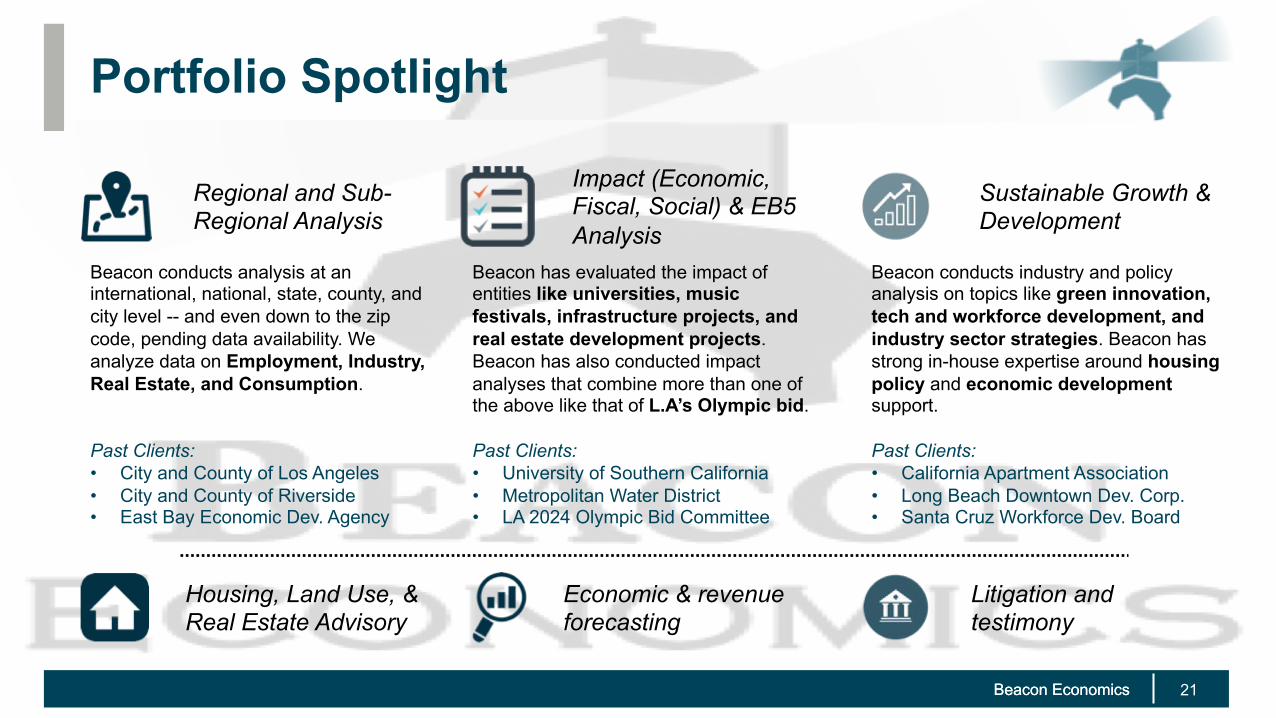
Portfolio Spotlight
21
Housing, Land Use, &
Real Estate Advisory
Economic & revenue
forecasting
Litigation and
testimony
Sustainable Growth &
Development
Impact (Economic,
Fiscal, Social) & EB5
Analysis
Regional and Sub-
Regional Analysis
Beacon conducts analysis at an international, national, state, county, and city level -- and even down to the zip code, pending data availability. We analyze data on Employment, Industry, Real Estate, and Consumption.
Past Clients:
• City and County of Los Angeles• City and County of Riverside • East Bay Economic Dev. Agency
Beacon has evaluated the impact of entities like universities, music festivals, infrastructure projects, and real estate development projects. Beacon has also conducted impact analyses that combine more than one of the above like that of L.A’s Olympic bid.
Past Clients:
• University of Southern California• Metropolitan Water District• LA 2024 Olympic Bid Committee
Beacon conducts industry and policy analysis on topics like green innovation, tech and workforce development, and industry sector strategies. Beacon has strong in-house expertise around housing policy and economic development support.
Past Clients:
• California Apartment Association• Long Beach Downtown Dev. Corp.• Santa Cruz Workforce Dev. Board