Embed Size (px)
Citation preview
DIRECTORATE GENERAL FOR INTERNAL POLICIES
POLICY DEPARTMENT B: STRUCTURAL AND COHESION POLICIES
AGRICULTURE AND RURAL DEVELOPMENT
THE POULTRY AND EGG SECTORS:EVALUATION OF THE
CURRENT MARKETSITUATION AND
FUTURE PROSPECTS
STUDY

This document was requested by the European Parliament's Committee on [Regional Development].
AUTHOR(S)
Mr Conrad CaspariDr Edward OliverMr John NgangaMs Mariana Ricci
RESPONSIBLE ADMINISTRATOR
Mr Albeert MASSOTPolicy Department Structural and Cohesion PoliciesEuropean ParliamentB-1047 BrusselsE-mail: [email protected]
LINGUISTIC VERSIONS
Original: [EN]
ABOUT THE EDITOR
To contact the Policy Department or to subscribe to its monthly newsletter please write to:[email protected]
Manuscript completed in April 2010Brussels, © European Parliament, 2010
This document is available on the Internet at:http://www.europarl.europa.eu/studies
DISCLAIMER
The opinions expressed in this document are the sole responsibility of the author and do not necessarily represent the official position of the European Parliament.
Reproduction and translation for non-commercial purposes are authorized, provided the source is acknowledged and the publisher is given prior notice and sent a copy.

DIRECTORATE GENERAL FOR INTERNAL POLICIES
POLICY DEPARTMENT B: STRUCTURAL AND COHESION POLICIES
AGRICULTURE AND RURAL DEVELOPMENT
THE POULTRY AND EGG SECTORS:EVALUATION OF THE
CURRENT MARKETSITUATION AND
FUTURE PROSPECTS
STUDY
AbstractFont: Verdana 11, Dark Blue Max 80 wordsText should be between 30 and 80 words.
[IP/B/AGRI/IC2009-045 April 2010
PE XXX.YYY EN

THE POULTRY AND EGG SECTORS: EVALUATION OF THE CURRENT MARKET SITUATION AND FUTURE PROSPECTS____________________________________________________________________________________________
3
Contents
LIST OF ABBREVIATIONS ...................................................................................................................3
LIST OF TABLES.....................................................................................................................................3
LIST OF FIGURES ...................................................................................................................................3
1. INTRODUCTION .....................................................................................................................3
1.1. Background...................................................................................................................................... 3
1.2. Objective of the report............................................................................................................... 4
1.3. Structure of the report............................................................................................................... 4
2. THE CURRENT SITUATION OF THE EU POULTRY MEAT AND EGG SECTOR..................................................................................................................................................3
2.1. Poultry meat.................................................................................................................................... 32.1.1. Production.................................................................................................................................................32.1.2. Consumption.............................................................................................................................................32.1.3. Trade .........................................................................................................................................................42.1.4. Employment..............................................................................................................................................62.1.5. Key driving factors.....................................................................................................................................8
2.2. Egg sector......................................................................................................................................... 82.2.1. Production.................................................................................................................................................82.2.2. Consumption.............................................................................................................................................92.2.3. Trade .......................................................................................................................................................112.2.4. Employment............................................................................................................................................15
2.3. The commercial structures used in the poultry meat and egg sectors.............. 32.3.1. Structure of the poultry meat production sector .....................................................................................32.3.2. Structure of the egg production sector.....................................................................................................62.3.3. Organisational structure ...........................................................................................................................8
2.4. Assessment of the common organisation for the poultry and egg markets ... 32.4.1. Background ...............................................................................................................................................32.4.2. Common organisation of the poultry meat market..................................................................................32.4.3. Common organisation of the egg market .................................................................................................5
3. CURRENT PROBLEMS IN THE EU POULTRY AND EGG SECTORS.......3
3.1. Economic consequences of the 2006 Avian Influenza outbreak in the EU-2533.1.1. Background ...............................................................................................................................................33.1.2. Control and preventative measures .........................................................................................................33.1.3. Economic impact.......................................................................................................................................43.1.4. EU financial measures to support the poultry meat and egg sectors .......................................................4
Policy Department B: Structural and Cohesion Policies____________________________________________________________________________________________
4
3.2. Evaluation of the effect of increasing input prices ...................................................... 43.2.1. General analysis of broiler production costs ............................................................................................43.2.2. General analysis of egg production costs .................................................................................................53.2.3. Comparison of broiler and egg production costs......................................................................................63.2.4. Analysis of feed costs ................................................................................................................................ 33.2.5. Analysis of energy costs ............................................................................................................................53.2.6. Outlook for production costs ....................................................................................................................6
4. IMPACT OF ANIMAL WELFARE LEGISLATION IN THE POULTRY AND EGG SECTORS.......................................................................................................................3
4.1. Background...................................................................................................................................... 3
4.2. Legislation........................................................................................................................................ 34.2.1. Chickens kept for meat production ..........................................................................................................44.2.2. Laying hens................................................................................................................................................44.2.3. EU welfare legislation and third country imports .....................................................................................5
4.3. Animal welfare legislation in third countries ................................................................. 6
4.4. Advantages and disadvantages of EU animal welfare legislation ........................ 64.4.1. Advantages................................................................................................................................................64.4.2. Disadvantages ...........................................................................................................................................7
4.5. Impact of EU animal welfare legislation vis-à-vis third country production .. 74.5.1. Potential impact on egg production costs of EU Directive 99/74/EC .......................................................74.5.2. Impact on broiler production costs after implementation of EU Directive 2007/43/EC ..........................94.5.3. EU’s competitive position on the world egg market...............................................................................114.5.4. EU’s competitive position on the world poultry meat market ...............................................................19
4.6. EU support for compliance with animal welfare legislation.................................. 21
4.7. The outlook for animal welfare legislation in the EU................................................ 21
5. CONCLUSIONS AND RECOMMENDATIONS........................................................3
6. REFERENCES.............................................................................................................................3
7. ANNEX 1: LAYER INDUSTRY IN THE USA, BRAZIL, ARGENTINA AND INDIA .........................................................................................................................................3
7.1. USA ...................................................................................................................................................... 3
7.2. Brazil ................................................................................................................................................... 3
7.3. India.................................................................................................................................................... 3
7.4. Argentina .......................................................................................................................................... 4
THE POULTRY AND EGG SECTORS: EVALUATION OF THE CURRENT MARKET SITUATION AND FUTURE PROSPECTS____________________________________________________________________________________________
3
LIST OF ABBREVIATIONS
AGRI Agriculture and Rural Development Committee
ALDE Group of the Alliance of Liberals and Democrats for Europe
BAS Brake-assist systems
CAP Common Agricultural Policy
CFP Common Fisheries Policy
CMO Common market organisation
CoR Committee of the Regions
CULT Culture and Education Committee
ECOSOC Economic and Social Committee
ECTS European Credit Transfer System
EPP-ED Group of the European People's Party and European Democrats
FAO Food and Agriculture Organisation of the United Nations
FPS Frontal protection systems
GDP Gross Domestic Product
GM Genetically-modified
Greens/EFA Greens/European Free Alliance
GUE/NGL Confederal Group of the European United Left - Nordic Green Left
IFI International Fund for Ireland
IND/DEM Independence/Democracy Group

THE POULTRY AND EGG SECTORS: EVALUATION OF THE CURRENT MARKET SITUATION AND FUTURE PROSPECTS____________________________________________________________________________________________
3
LIST OF TABLES
Table 2 1: Self-sufficiency rate in selected EU Member States, 2009 ............................... 3Table 2 2: Poultry meat production and processing sector employment, number of
enterprises and turnover by EU Member State in 2007 ........................................... 7Table 2 3: Self sufficiency in egg production in selected EU Member States, 2008 ...........12Table 2 4: Major EU egg importers, 2008 (tonnes).......................................................12Table 2 5: EU-27 countries with high egg self sufficiency levels, 2008............................14Table 2 6: Major egg exporters in the EU, 2008 (tonnes)..............................................14Table 2.7: Strengths and weaknesses of integrated production ...................................... 5Table 2.8: Strengths and weaknesses of non-integrated production ................................ 6Table 3.1: EU-25 avian influenza outbreaks, 2006 3Table 3.2: Sensitivity analysis of the impact of a change in poultry feed and feed ingredient
prices on total poultry production costs in France................................................... 4Table 3.3: Sensitivity analysis of the impact of a change in energy prices on total poultry
production costs ................................................................................................ 6Table 4.1: Current European legislation on animal welfare relevant for egg and poultry sectors
3Table 4.2: Maximum stocking densities for broilers in selected EU Member States, 2006 ..10Table 4.3: Production costs at different stocking densities ............................................11
LIST OF FIGURESFigure 2.1: Major EU poultry producers, 2008 .............................................................. 3Figure 2.2: Evolution of poultry production in the EU-15 and EU-27, 1996 – 2009 (‘000
tonnes) ............................................................................................................ 42.3: Production (‘000 tonnes) and self-sufficiency levels (%) in the European Union, 1995 –
2009 ................................................................................................................ 3Figure 2.4: Total (‘000 tonnes) and per capita (kg/head) poultrymeat consumption in the
EU, 1995 – 2009................................................................................................ 4Figure 2.5: EU poultry imports from third countries, 2005 – 2009 (tonnes)...................... 3Figure 2.6: Main third countries exporters of poultrymeat to the EU, 2009 (%) ................ 4Figure 2.7: Main destinations for extra-EU exports of poultrymeat, 2008 (%) .................. 5Figure 2.8: Extra-EU 27 exports of poultrymeat, 2000 – 2009 (‘000 tonnes).................... 6Figure 2.9: EU-27 egg production share by country, 2009 ............................................. 8Figure 2.10: Egg production (‘000 tonnes) and self-sufficiency levels (%) in the EU, 1998 –
2009 ................................................................................................................ 9Figure 2.11: Egg consumption per capita in the EU, 1998 – 2009 (kg/head) ...................10Figure 2.12: EU egg consumption, 1998 – 2009 (‘000 tonnes) ......................................11Figure 2.13: Imports of egg to the EU-27 (Intra and Extra), 1999 – 2009 ......................13Figure 2.14: Volume and value of EU -27 egg exports (intra- and extra-EU), 1999 – 200915Figure 2.15: Family farm income development in the Netherlands on broiler farms,
1992/1993-2009, (Euro/ farm)............................................................................ 4Figure 2.16: Farm income of broiler farms (in Euros per year) in the Netherlands (free
market) and France (integrated) in the period 2001 to 2008 ................................... 5Figure 2.17: EU laying hens by system of production, 2009 (%)..................................... 7Figure 2.18: Percentage of layers kept in different housing systems in 17 EU Member
States, 2008 ..................................................................................................... 8Figure 2.19: Intervention logic: Poultry meat CMO ....................................................... 4Figure 2.20: Intervention logic: Eggs CMO................................................................... 6
Figure 3.1: Immediate impact of avian influenza on EU poultry meat and egg consumption3Figure 3.2: Production costs of broilers in selected EU Member States, 2007.................... 5
Policy Department B: Structural and Cohesion Policies____________________________________________________________________________________________
4
Figure 3.3: Production cost of eggs in 2007 in selected EU Member States, 2008 (Eurocent per kg) ............................................................................................................. 6
Figure 3.4: Cost components as a percentage of the total production cost of broiler1 and egg2 production at farm level.............................................................................. 3
Figure 3.5: Price of poultry feed for broilers and layers in the Netherlands, 1995 to 2009.. 4Figure 3.6: Price of poultry broiler and layer feed in selected Member States (2005=100) . 3Figure 3.7: EU maize, wheat and soybean meal wholesale prices (Rotterdam), 2002-2009 4Figure 3.8: World crude oil price evolution................................................................... 6
Figure 4.1: Breakdown of production costs for various housing systems for laying hens (in Eurocents per hen housed) ................................................................................. 9
Figure 4.2: Production costs for eggs in the EU and selected third countries, 2008 (Eurocent per kg) ............................................................................................................12
Figure 4.3: Offer price of shell eggs in Germany from EU and non-EU countries 2008, (Eurocents per kg shell eggs) .............................................................................13
Figure 4.4: Offer price of whole egg powder in Germany from EU and non EU countries, 2008 (in Eurocents per kg), ...............................................................................14
Figure 4.5: Estimated offer price of shell eggs in Germany from EU and non EU countries, 2012 (Eurocents per kg shell eggs) .....................................................................15
Figure 4.6: Estimated offer price of whole egg powder in EU (average of selected countries) and selected third countries, 2012, (in Eurocents per kilogram)..............................16
Figure 4.7: Estimated offer price of whole egg powder in EU (average represented by horizontal line) and non-EU countries assuming a 50% reduction in import tariffs, 2012 (Eurocents per kilogram) ...................................................................................17
Figure 4.8: Offer price of whole egg powder in EU average (average represented by horizontal line) and non-EU countries assuming 10% appreciation of the Euro, 2012 (Eurocents per kilogram) ...................................................................................18
Figure 4.9: Relationship between costs for animal welfare (wide bar; cost index on left-hand axis) and the area per laying hen (small bar; space allowance per hen in cm2 on right-hand axis)................................................................................................19
Figure 4.10: EU and third country broiler production and slaughter costs, 2007...............20
THE POULTRY AND EGG SECTORS: EVALUATION OF THE CURRENT MARKET SITUATION AND FUTURE PROSPECTS____________________________________________________________________________________________
3
1. INTRODUCTION
1.1. Background
The terms of reference make clear that not only is the poultry meat sector the fastest growing meat production sector globally, this sector is also most likely to provide low price animal protein, especially in middle and low-income countries.
Poultry sectors in the developed world are highly integrated and benefit from considerable economies of scale and advanced technology. Pressure for further consolidation strengthens the trend toward intensification both here and in developing countries.
The EU egg and poultry sector is an important contributor to overall EU agricultural output accounting for 6.3 % of EU agricultural output (2006) with a value of some Euro 23.3 billion in 2007 and is one of the most intensive farming systems in the EU. However, the EU is losing international market share to Brazil as a result of currency movements and high domestic production costs and became a net importer of poultry meat for the first time in 20071 as domestic consumption continued to increase. In addition, and as noted in the terms of reference, Brazilian poultry exporters have recently purchased several European poultry processors guaranteeing commercial outlets for Brazilian products in the EU2.
Whilst global egg production has increased dramatically over the 25 years, the EU share of total production has decreased. The terms of reference note that China has increased its share of world production substantially while production in the USA and the Russian Federation has declined. The increase in production and share of world production in Mexico, India and Brazil was also noted. Whilst a proportion of the growth in egg production in these countries is likely to have met increasing domestic demand, increases in the production of, and trade in, egg products have taken place. Egg production in the EU has risen since the mid 1990s but has not matched rising demand and there has therefore been a decline in self sufficiency levels.
The EU poultry and egg regimes are “light” with export refunds and import tariffs being the only forms of support under Council Regulation (EC) No 1234/2007 and Commission Regulation 589/2008. Public support can be provided to assist the modernisation of egg packing stations and slaughtering plants, but not to increase production capacity. The sectors are also affected by a number of pieces of EU legislation with relevance to food safety, public and animal health, trade and marketing standards for poultry meat and eggs.
Animal welfare legislation in the poultry sector covers production, transport and slaughter. Additionally, Directive 2007/43/EC sets out, with effect from July 2010, minimum standards for the welfare of broiler chickens on farm. The main provision of the Directive is to reduce the stocking density of broiler chickens by setting a maximum stocking density.
Animal welfare legislation regarding laying hens will lead to a ban on traditional battery cages by 20123, although production in enriched cages will still be allowed.
1 European Commission DG AGRI Agricultural Situation Report 2008, Brussels 20092 USDA, Foreign Agricultural Service 3/08.3 Council Directive 1999/74/EC.
Policy Department B: Structural and Cohesion Policies____________________________________________________________________________________________
4
The EU poultry and egg sectors have also been affected by Avian Influenza outbreaks, most notably in 2006, and large increases in input prices from 2007 which reversed a long-termdownward trend. These increases resulted from a mixture of structural and temporary factors ranging from general global population growth to adverse weather conditions and exchange rate movements. Increasing demand from the ethanol industry in the US, Europe and China for in corn and other cereal grains has also had an impact. Although prices fell back from April 2008, the underlying structural pressures remain.
EU poultry production is also affected by animal welfare legislation and the terms of reference notes that several calculations show that the implementation of these Directives would lead to dramatic reductions in terms of farm income. Such a reduction could have further consequences for both employers and employees in the poultry chain.
1.2. Objective of the report
Against this background, the European Parliament’s Committee on Agriculture and Rural Development appointed Agra CEAS Consulting, in conjunction with LEI - Wageningen University and Research Centre in the Netherlands and the Institut Technique de l'Aviculture (ITAVI) in France to carry out an evaluation of the current market situation and future prospects in the poultry and egg sectors. The specific objectives of this research are thus to carry out:
an analysis of the current situation of the European Poultry meat and egg sectors and comparison with the world situation;
an analysis of the consequences of avian influenza three years after the epidemic outbreak;
evaluation of the effect of the increase in input prices; and, impact of the European legislation on the poultry welfare to the increase of the
cost of production and the consequent weakening of the competitiveness of the European poultry meat and egg sectors.
1.3. Structure of the report
Chapter 2 sets out the current situation in the EU poultry meat and egg sectors. This includes a review of the current situation in the EU-27, an analysis of the commercial structures used in the two sectors and an assessment of the common organisation for the poultry and egg markets.
Chapter 3 sets out the current problems in the EU poultry and egg sectors including an analysis of the economic consequences of the 2006 Avian Influenza outbreak, as assessment of the impact of increasing input prices and a review of EU financial measures to support the poultry meat and egg sectors.
Chapter 4 focuses on the impact of animal welfare legislation in the poultry and egg sectors through a discussion on the advantages and disadvantages of EU animal welfare legislation and the impact of this legislation vis-à-vis Third Country production.
Chapter 5 presents our conclusions and recommendations in terms of the drivers of future policy, concrete policy proposals and recommendations to mitigate the cost impact of animal welfare measures.

THE POULTRY AND EGG SECTORS: EVALUATION OF THE CURRENT MARKET SITUATION AND FUTURE PROSPECTS____________________________________________________________________________________________
3
2. THE CURRENT SITUATION OF THE EU POULTRY MEAT AND EGG SECTOR
2.1. Poultry meat
2.1.1. Production
Total EU poultrymeat production is currently 8.5 million tonn4es mostly coming from France, the UK, Germany, Spain and Italy. France is responsible for most of EU’s total production, accounting for 1.7 million tonnes (15.8%), followed by the UK (1.4 million tonnes, 13.2%) and Germany (1.3 million tonnes, 12%). It is important to note that 78% of total EU poultry production comes from EU-15.
Belgium/Luxembourg2.3%
Germany12%
Spain10%
France15.8%
Italy9.4%
Hungary3.7%
Netherlands6.2%
Poland9.5%
Portugal2.7%
Romania2.9%
UK13.2%
Others12.1%
Figure 2.1: Major EU poultry producers, 2008
In terms of the evolution of total EU 15 poultrymeat production between 1996 and 1999 there was a slow (but continuous) growth in output as poultry market demand rose with per capita consumption rising on average 1kg per year (average EU-15). In 1999 due to problems with food scares, cutbacks in production in France, and avian influenza in Italy production decreased by 2%. In 2001 and 2002, production again rose by 3.2% reaching a total of over 9 million tonnes in the EU-15 partly as a as a result of the foot and mouth crisis during which consumers switched from beef to poultry. In 2003 the EU poultry market faced its first major avian influenza impacts with production cuts in France, Italy and Sweden. Mild outbreaks in Belgium and the Netherlands also contributed to a decrease in production of 3.3% in the EU-25 and 4.5% in the EU-15. In some countries including France, Netherlands and Belgium, production has still not returned to pre-2003 levels.
4 According to 2009 AVEC report

Policy Department B: Structural and Cohesion Policies____________________________________________________________________________________________
4
8,000
8,500
9,000
9,500
10,000
10,500
11,000
11,500
12,000
1996 1997 1998 1999 2000 2001 2002 2003 2004 2005 2006 2007 2008 2009
Poultryproduction('000tonnes)
EU-27 EU-15
Figure 2.2: Evolution of poultry production in the EU-15 and EU-27, 1996 – 2009 (‘000 tonnes)Source: European Commission
The accession of 10 new Member States to the EU increased total production by 19% to a total of 10.7 million tonnes. In 2005 a sharp reported increase in production in Poland, was the main reason a sharp rise in overall EU-27 production.
In 2006, avian influenza occurred was found in wild birds and there were a limited number of outbreaks in domestic flocks and while these did not substantially disrupt production –production fell by 2.5% mostly in the EU-15 –the outbreak led to a loss of confidence amongst producers (see Section 3). Production recovered to reach 11.5 million tonnes in EU-27 in 2007 with poultry prices increasing 9.9% due to short supply. The accession of Bulgaria and Romania in this year added an extra 400,000 tonnes to total EU output. Since 2007 production has remained more or less stable at this level.
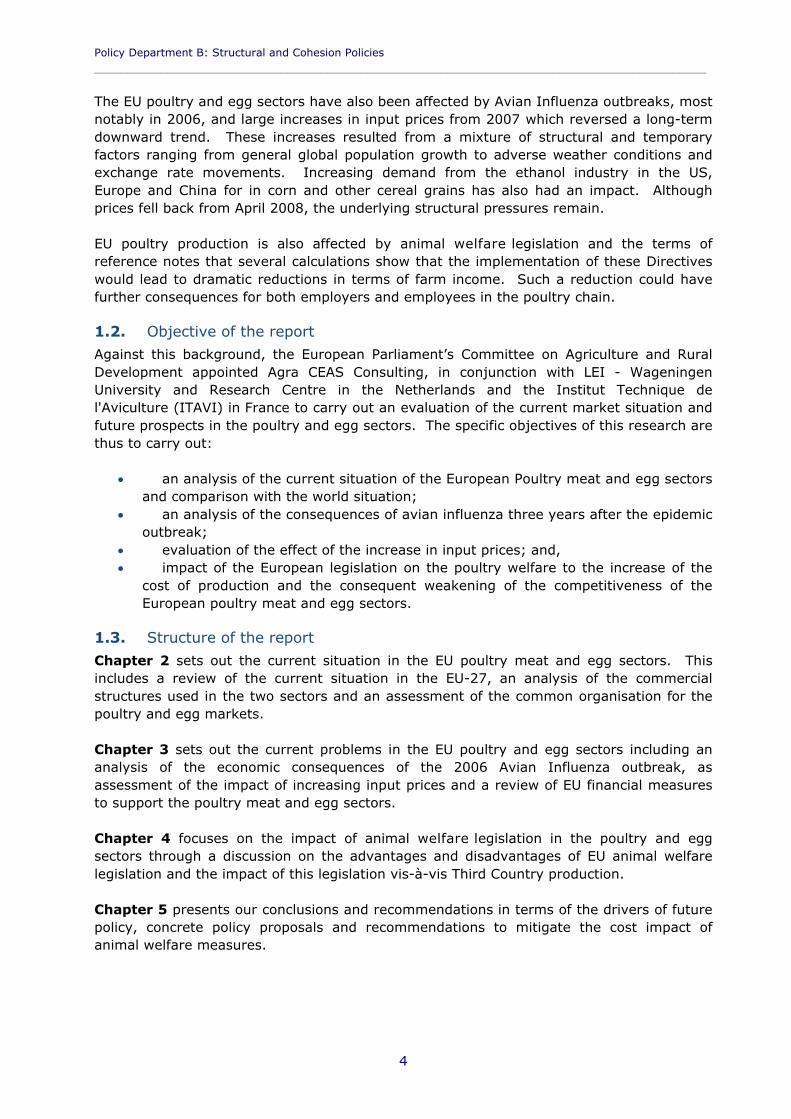
While overall EU production levels have on average been rising since the mid- 1990s, self-sufficiency levels have fallen particularly following the recent enlargements of the EU. As Figure 2.3 shows, the level of self-sufficiency in the EU has steadily decreased from 108.5% in 1995 to 100.9% in 2009
THE POULTRY AND EGG SECTORS: EVALUATION OF THE CURRENT MARKET SITUATION AND FUTURE PROSPECTS____________________________________________________________________________________________
3
Within this total there are significant country variations with the Benelux countries in particular being significant net exporters and Denmark, France, Poland, Hungary, Finland and Italy also above the EU average in terms of self sufficiency (Table 2 1).
94.0%
96.0%
98.0%
100.0%
102.0%
104.0%
106.0%
108.0%
110.0%
0
2,000
4,000
6,000
8,000
10,000
12,000
14,000
1995 1996 1997 1998 1999 2000 2001 2002 2003 2004 2005 2006 2007 2008 2009
Self-sufficiency(%)
Production('000tonnes)
Production Self-sufficiency
EU 15 EU 25 EU 27
2.3: Production (‘000 tonnes) and self-sufficiency levels (%) in the European Union, 1995 – 2009Source: European Commission

THE POULTRY AND EGG SECTORS: EVALUATION OF THE CURRENT MARKET SITUATION AND FUTURE PROSPECTS____________________________________________________________________________________________
3
Table 2 1: Self-sufficiency rate in selected EU Member States, 2009Member State Self-sufficiency rate
Austria 80%Belgium / Luxembourg 165%Denmark 145%Finland 105%France 120%Germany 87%Greece 79%Ireland 85%Italy 106%Netherlands 188%Portugal 93%Spain 96%Sweden 85%United Kingdom 98%Czech Republic 84%Hungary 124%Latvia 49%Lithuania 80%Poland 118%Slovak Republic 83%
Source: AVEC Annual Report, 2009.Note: Data not available for all Member States
According to one interviewee, the ability to sell all cuts (including lower value ones) and the ability to obtain higher margins on premium products have a significant effect on production in the EU. Currently it is possible for producers to sell all poultry cuts including the low value products. However, if production were to increase to a level that the EU obtained self-sufficiency in poultry breast meat, it is possible that there would be a surplus of low value products, and that it would not be possible to sell all cuts. With respect to premia, there are some premium poultry products such as Label Rouge in France, however quality labels do not play as great a role as in some other livestock industries.
2.1.2. Consumption
Versatile and cheaper than other popular animal proteins (beef and lamb), poultry has a stable market. Poultrymeat is produced more rapidly and uses less space and natural resources than other livestock and from the early 1990s the market share of poultrymeat benefited from the growing view of ‘white meat’ as healthier than red meats and increased use of poultry in frozen processed products and ready-meals. An additional factor in the 1990s was the shift away from beef due to concerns related to BSE.
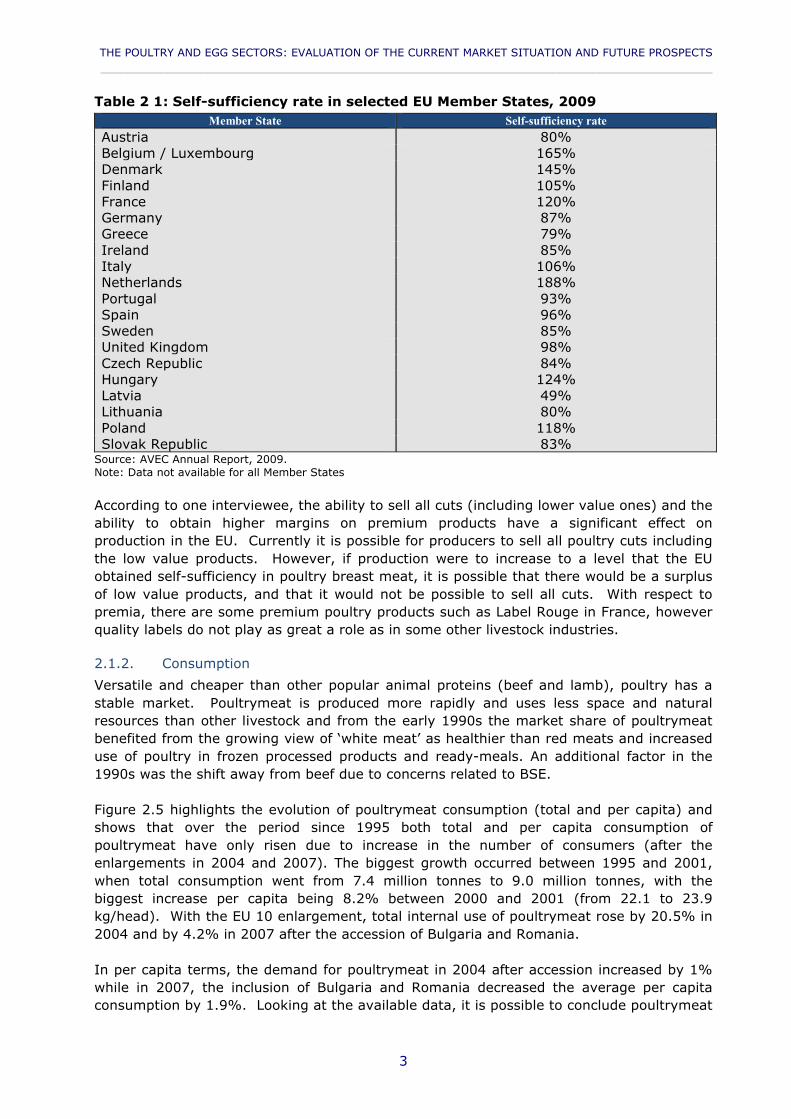
Figure 2.5 highlights the evolution of poultrymeat consumption (total and per capita) and shows that over the period since 1995 both total and per capita consumption of poultrymeat have only risen due to increase in the number of consumers (after the enlargements in 2004 and 2007). The biggest growth occurred between 1995 and 2001, when total consumption went from 7.4 million tonnes to 9.0 million tonnes, with the biggest increase per capita being 8.2% between 2000 and 2001 (from 22.1 to 23.9 kg/head). With the EU 10 enlargement, total internal use of poultrymeat rose by 20.5% in 2004 and by 4.2% in 2007 after the accession of Bulgaria and Romania.
In per capita terms, the demand for poultrymeat in 2004 after accession increased by 1% while in 2007, the inclusion of Bulgaria and Romania decreased the average per capita consumption by 1.9%. Looking at the available data, it is possible to conclude poultrymeat
Policy Department B: Structural and Cohesion Policies____________________________________________________________________________________________
4
consumption in the EU 15 grew sharply until 2001 but then fell to 2004 and has remained relatively stable since then at around 23 kg/head.
17.0
18.0
19.0
20.0
21.0
22.0
23.0
24.0
25.0
0
2,000
4,000
6,000
8,000
10,000
12,000
14,000
1995 1996 1997 1998 1999 2000 2001 2002 2003 2004 2005 2006 2007 2008 2009
Consumption(kg/head)C
onsumption('000tonnes)
Total Per capita
EU 15 EU 27EU 25
Figure 2.4: Total (‘000 tonnes) and per capita (kg/head) poultrymeat consumption in the EU, 1995 – 2009Source: European Commission
One interviewee provided comments on the trends within different markets. In the retail market, there has been a general trend away from whole birds towards more cuts and boneless meat. Consumers are looking for more convenience meals, and as a result poultry is also increasingly used in prepared meals. Special products such as organic and Label Rouge have also increased in popularity, although these products are generally sold as whole chickens
2.1.3. Trade
2.1.3.1. Imports
Most imports of poultrymeat (92.7% in 2009) by EU Member States are from within the EU, however, the proportion of imports taken from third countries has varied between a low of 7.8% of total trade (in 2000 and 2009) to a high of 16.9% (in 2005). The main exporters from within the EU are the Netherlands and Germany. Other important intra EU players are Belgium, Czech Republic, France, Poland, and the UK.
That said, it should be noted that industry sources suggest that an unknown quantity of third country chicken is imported into the EU via the Netherlands and subsequently re-exported to other Member States where it appears as intra-EU trade. The data presented in this section may therefore downplay the importance of third country imports.

THE POULTRY AND EGG SECTORS: EVALUATION OF THE CURRENT MARKET SITUATION AND FUTURE PROSPECTS____________________________________________________________________________________________
3
0
100,000
200,000
300,000
400,000
500,000
600,000
700,000
800,000
900,000
1,000,000
2005 2006 2007 2008 2009
Imports(tonnes)
Imports of ooultry from third countries
EU 25 EU 27
Figure 2.5: EU poultry imports from third countries, 2005 – 2009 (tonnes)Source: European Commission, Management Committee
Figure 2.6 shows the evolution of imports in poultry meat since 2005. According to one interviewee, the increase in imports is mainly accounted for by boneless breast meat
Several interviewees commented that the nature of poultrymeat imports had changed over the last decade. Thus during the 1990s and up to 2002 there was a sharp increase in exports of cooked and
salted poultrymeat notably from Thailand and Brazil as the addition of salt enabled the product to enter the EU attracting a lower tariff than the equivalent fresh product. In 2002 the EU decided to change the classification (and duty rate) of the imported product. This led Brazil and Thailand to open a case in the WTO against the EU. Ultimately, as a result of this panel, the EU applied Article XXVIII of GATT; this allowed the EU to align tariffs for different poultrymeat lines, but in 2006 tariff rate quotas (TRQs) were agreed with the main affected parties. According to one interviewee, the tariff lines for turkey preparation and cooked poultrymeat were harmonised at the same time as that for salted poultrymeat as some substitution of products by tariff line was taking place. The same interviewee commented that the EU is applying Article XXVIII of GATT to eight more tariff lines in order to avoid substitution effects with these tariff lines.
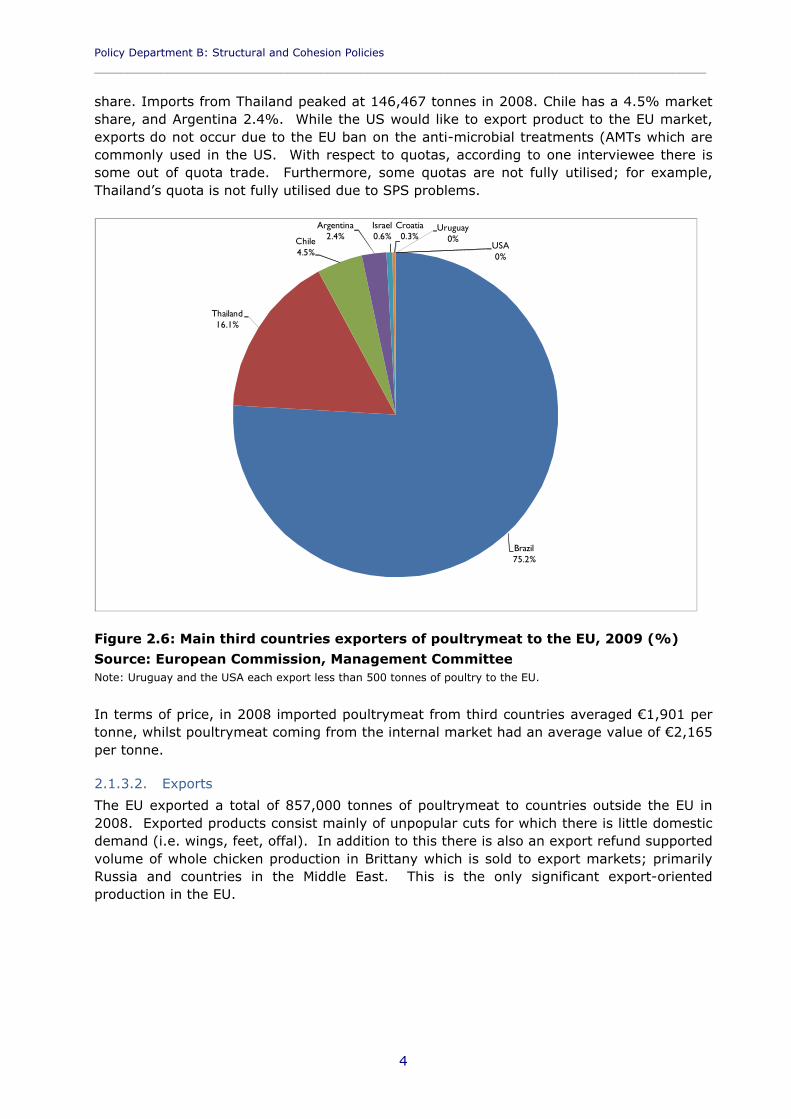
Figure 2.6 and Figure 2.7 present a breakdown of EU poultrymeat imports5 from third countries in 2009. The main origin of third country poultry is Brazil, which accounts for more than 75% of the total. During the period reviewed here, imports from Brazil peaked in 2008 at 679,358 tonnes. The second largest exporter is Thailand, with a 16.1% market
5 Figure based on product code 0207 (meat and edible offal of fowls of the species gallus domesticus, ducks, geese, turkeys and guinea fowls, fresh, chilled or frozen).
Policy Department B: Structural and Cohesion Policies____________________________________________________________________________________________
4
share. Imports from Thailand peaked at 146,467 tonnes in 2008. Chile has a 4.5% market share, and Argentina 2.4%. While the US would like to export product to the EU market, exports do not occur due to the EU ban on the anti-microbial treatments (AMTs which are commonly used in the US. With respect to quotas, according to one interviewee there is some out of quota trade. Furthermore, some quotas are not fully utilised; for example, Thailand’s quota is not fully utilised due to SPS problems.
Brazil75.2%
Thailand16.1%
Chile4.5%
Argentina2.4%
Israel0.6%
Croatia0.3%
USA0%
Uruguay0%
Figure 2.6: Main third countries exporters of poultrymeat to the EU, 2009 (%)
Source: European Commission, Management CommitteeNote: Uruguay and the USA each export less than 500 tonnes of poultry to the EU.
In terms of price, in 2008 imported poultrymeat from third countries averaged €1,901 per tonne, whilst poultrymeat coming from the internal market had an average value of €2,165 per tonne.
2.1.3.2. Exports
The EU exported a total of 857,000 tonnes of poultrymeat to countries outside the EU in 2008. Exported products consist mainly of unpopular cuts for which there is little domestic demand (i.e. wings, feet, offal). In addition to this there is also an export refund supported volume of whole chicken production in Brittany which is sold to export markets; primarily Russia and countries in the Middle East. This is the only significant export-oriented production in the EU.
THE POULTRY AND EGG SECTORS: EVALUATION OF THE CURRENT MARKET SITUATION AND FUTURE PROSPECTS____________________________________________________________________________________________
5
Others32.7%
Vietnam4.6%
Ukraine10.5%Saudi Arabia
11%
Russia21.3%
Hong Kong6.8%
Ghana3.6%
Benin9.6%
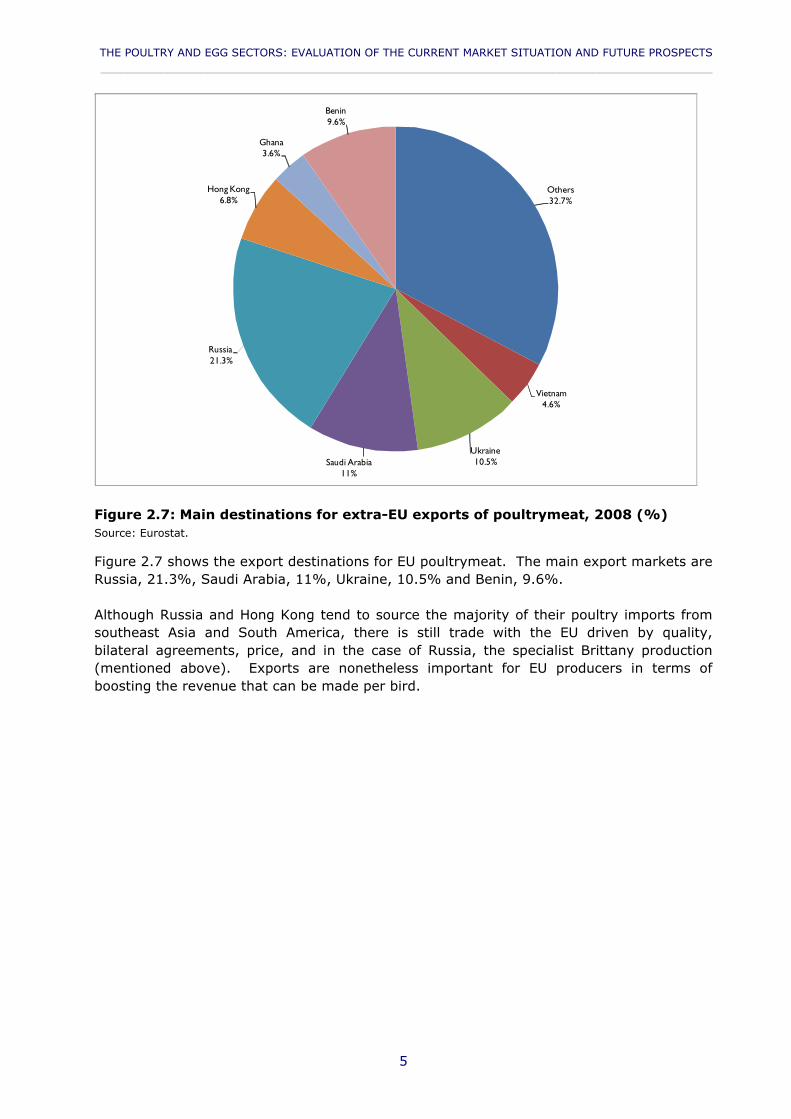
Figure 2.7: Main destinations for extra-EU exports of poultrymeat, 2008 (%)Source: Eurostat.
Figure 2.7 shows the export destinations for EU poultrymeat. The main export markets are Russia, 21.3%, Saudi Arabia, 11%, Ukraine, 10.5% and Benin, 9.6%.
Although Russia and Hong Kong tend to source the majority of their poultry imports from southeast Asia and South America, there is still trade with the EU driven by quality, bilateral agreements, price, and in the case of Russia, the specialist Brittany production (mentioned above). Exports are nonetheless important for EU producers in terms of boosting the revenue that can be made per bird.

Policy Department B: Structural and Cohesion Policies____________________________________________________________________________________________
6
0
100
200
300
400
500
600
700
800
900
1,000
0
200
400
600
800
1,000
1,200
1999 2000 2001 2002 2003 2004 2005 2006 2007 2008 2009
Value(€million)
Volume('000tonnes)
Volume Value
Figure 2.8: Extra-EU 27 exports of poultrymeat, 2000 – 2009 (‘000 tonnes)Source: Eurostat
Figure 2.8 presents the evolution of EU poultrymeat exports since 1999. Between 2002 and 2007 both the volume and value of exports steadily decreased. After the avian influenza crisis in 2003, several third countries banned imports of poultrymeat from the EU. This situation did not change until 2007 and a fall of 24.5% in volume was registered. In the following years, more markets for EU poultrymeat re-opened but overall exports still did not reach pre-avian influenza levels in value terms.
2.1.4. Employment
The EU poultry meat sector employs an estimated 147,000 persons in production and processing of poultrymeat. Approximately half the numbers employed in the sector are found in three Member States: France, Poland and the United Kingdom which employed approximately 30,000 persons and 22,000 each respectively in 2007.
Eurostat data for employment is incomplete but the available evidence from those Member States reporting shows a variable picture with numbers employed declining since 2000 in Belgium, Ireland, Italy, Hungary, Netherlands, Portugal and Slovakia but rising in Germany, Spain, France, Austria, Finland, Sweden and the United Kingdom (Table 2 1). Within thisoverall picture, it is understood that in slaughterhouses and further processing plants employment has remained relatively stable but
where there has been a decline in employment this has been largely a result of consolidation within the sector6
6 Interview with AVEC

THE POULTRY AND EGG SECTORS: EVALUATION OF THE CURRENT MARKET SITUATION AND FUTURE PROSPECTS____________________________________________________________________________________________
7
Table 2 2: Poultry meat production and processing sector employment, number of enterprises and turnover by EU Member State in 2007
Employment
Employment
Number of enterprises
Number of enterprises
Turnover (Euro million)
Turnover (Euro million)
2000 2007 2000 2007 2000 2007EU-27 147,049 1,970Belgium 2,991 2,637 137 103 823.1 1,204.8Bulgaria 4,162 70 219.0Czech Republic
3,715 35 332.5
Denmark 10 7Germany (including ex-GDR from 1991)
8,698 10,153 74 93 1,968.8 3,497.2
Estonia 0 0 1 0.0Ireland 2,558 1,552 16 405.3Greece 1,540 38 246.5Spain 9,312 10,527 447 220 1,716.4 2,277.0France 29,627 29,898 480 425 5,756.7 6,285.7Italy 14,087 9,878 239 185 2,856.7 2,406.0Cyprus 261 391 15 15 28.0 51.8Latvia 1,115 3 4Lithuania 40 2 5 1.7Luxembourg (Grand-Duché)
0 0 0 0 0.0 0.0
Hungary 15,465 9,808 74 110 687.2 806.7Malta 24 7 1.9Netherlands 4,888 2,637 70 55 1,716.5 1,754.5Austria 730 780 5 12 102.5 148.5Poland 22,467 333 318 866.7 2,447.6Portugal 3,685 3,397 71 54 464.9Romania 5,145 50 190.3Slovenia 1,457 5 4 108.1 158.9Slovakia 2,764 1,685 13 8 119.5 113.9Finland 22 99 3 4 1.8 23.5Sweden 1,436 1,511 19 29 252.3 335.5United Kingdom
21,305 22,455 120 119 3,905.4
Notes: Processing includes slaughtering; for Ireland and Portugal, 2006 data for employment and turnoverSource: Eurostat
According to one interviewee, there has been some consolidation in the broiler sector; the number of poultry farms is decreasing year on year, but the size of the farms is increasing at the same time. The interviewee believed that consolidation in the sector was more common than companies leaving the sector. Data from Eurostat corroborates this;
Policy Department B: Structural and Cohesion Policies____________________________________________________________________________________________
8
between 2000 and 2005, the number of enterprises involved in the production and processing of poultrymeat in the EU-157 fell from 1,691 to 1,279.
2.1.5. Key driving factors
The key factors driving market evolution in the poultry and egg production sectors are discussed in Section 3.2.4 in the context of the analysis of feed costs as well as in Sections 2.1.1.1 and 2.1.2.1 on consumption trends.
2.2. Egg sector
2.2.1. Production
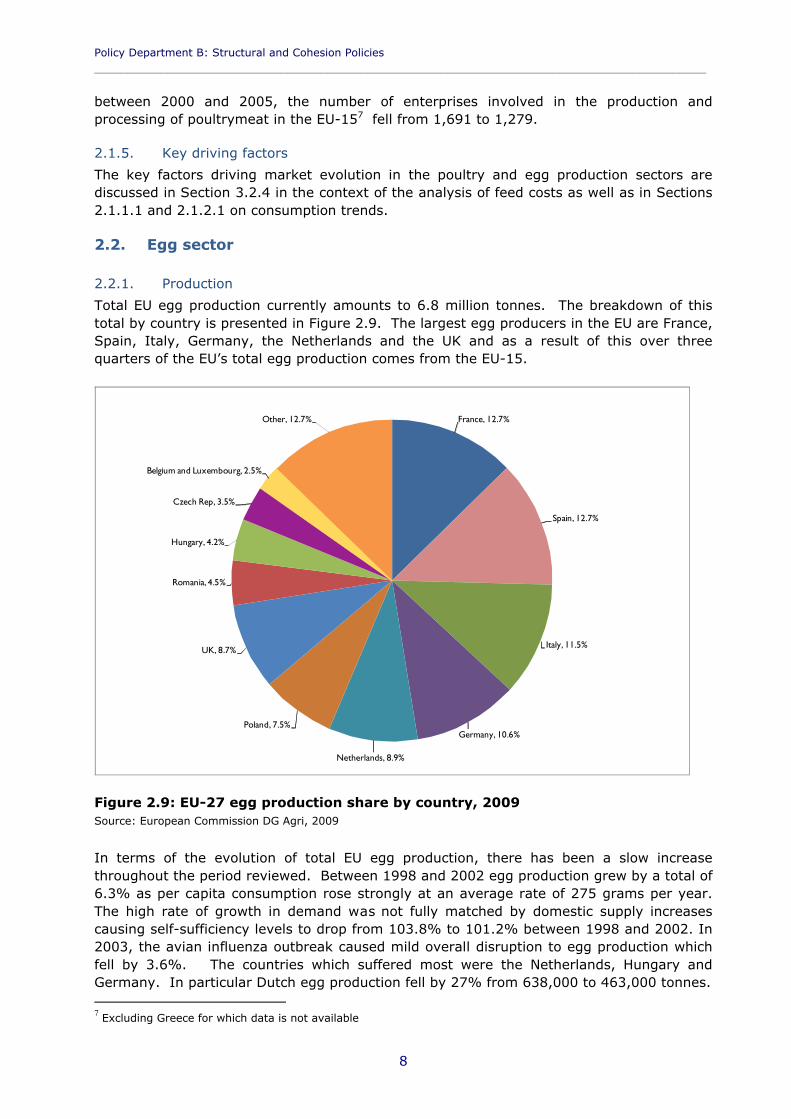
Total EU egg production currently amounts to 6.8 million tonnes. The breakdown of this total by country is presented in Figure 2.9. The largest egg producers in the EU are France, Spain, Italy, Germany, the Netherlands and the UK and as a result of this over three quarters of the EU’s total egg production comes from the EU-15.
France, 12.7%
Spain, 12.7%
Italy, 11.5%
Germany, 10.6%
Netherlands, 8.9%
Poland, 7.5%
UK, 8.7%
Romania, 4.5%
Hungary, 4.2%
Czech Rep, 3.5%
Belgium and Luxembourg, 2.5%
Other, 12.7%
Figure 2.9: EU-27 egg production share by country, 2009Source: European Commission DG Agri, 2009
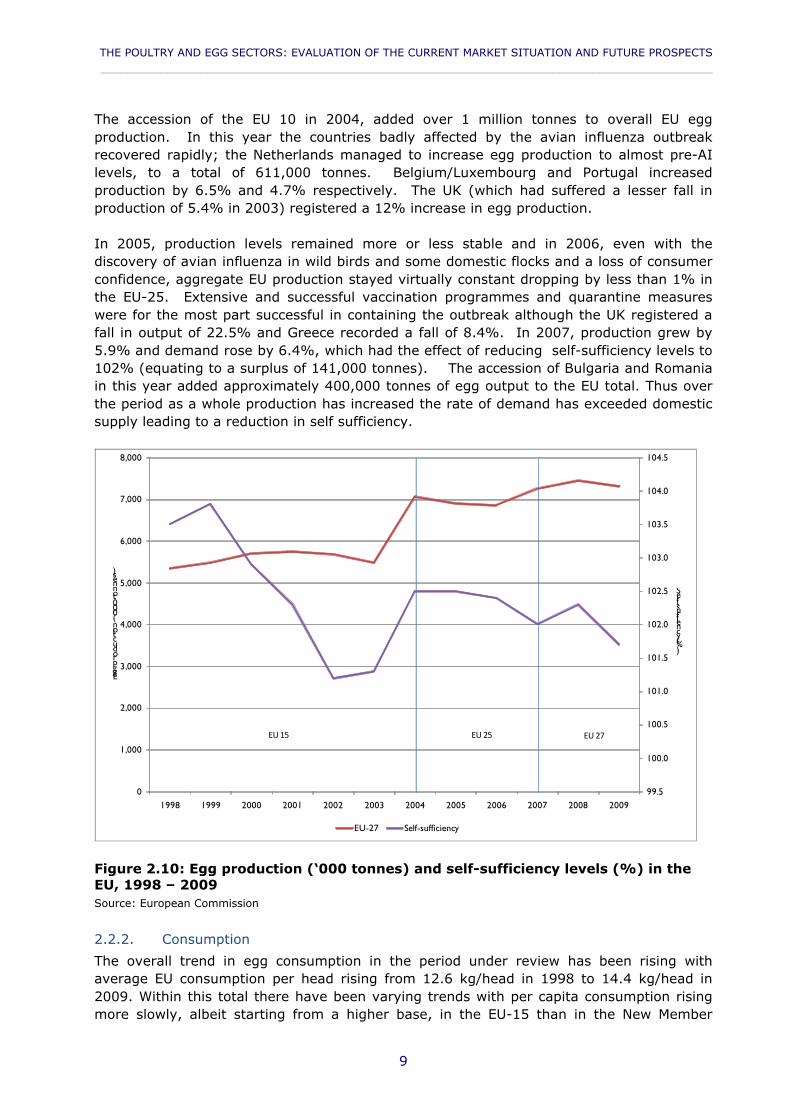
In terms of the evolution of total EU egg production, there has been a slow increase throughout the period reviewed. Between 1998 and 2002 egg production grew by a total of 6.3% as per capita consumption rose strongly at an average rate of 275 grams per year. The high rate of growth in demand was not fully matched by domestic supply increases causing self-sufficiency levels to drop from 103.8% to 101.2% between 1998 and 2002. In 2003, the avian influenza outbreak caused mild overall disruption to egg production which fell by 3.6%. The countries which suffered most were the Netherlands, Hungary and Germany. In particular Dutch egg production fell by 27% from 638,000 to 463,000 tonnes. 7 Excluding Greece for which data is not available
THE POULTRY AND EGG SECTORS: EVALUATION OF THE CURRENT MARKET SITUATION AND FUTURE PROSPECTS____________________________________________________________________________________________
9
The accession of the EU 10 in 2004, added over 1 million tonnes to overall EU egg production. In this year the countries badly affected by the avian influenza outbreak recovered rapidly; the Netherlands managed to increase egg production to almost pre-AI levels, to a total of 611,000 tonnes. Belgium/Luxembourg and Portugal increased production by 6.5% and 4.7% respectively. The UK (which had suffered a lesser fall in production of 5.4% in 2003) registered a 12% increase in egg production.
In 2005, production levels remained more or less stable and in 2006, even with the discovery of avian influenza in wild birds and some domestic flocks and a loss of consumer confidence, aggregate EU production stayed virtually constant dropping by less than 1% in the EU-25. Extensive and successful vaccination programmes and quarantine measures were for the most part successful in containing the outbreak although the UK registered a fall in output of 22.5% and Greece recorded a fall of 8.4%. In 2007, production grew by 5.9% and demand rose by 6.4%, which had the effect of reducing self-sufficiency levels to 102% (equating to a surplus of 141,000 tonnes). The accession of Bulgaria and Romania in this year added approximately 400,000 tonnes of egg output to the EU total. Thus over the period as a whole production has increased the rate of demand has exceeded domestic supply leading to a reduction in self sufficiency.
99.5
100.0
100.5
101.0
101.5
102.0
102.5
103.0
103.5
104.0
104.5
0
1,000
2,000
3,000
4,000
5,000
6,000
7,000
8,000
1998 1999 2000 2001 2002 2003 2004 2005 2006 2007 2008 2009
Self-suffiency(%)
Eggproduction('000tonnes)
EU-27 Self-sufficiency
EU 15 EU 25 EU 27
Figure 2.10: Egg production (‘000 tonnes) and self-sufficiency levels (%) in the EU, 1998 – 2009Source: European Commission
2.2.2. Consumption
The overall trend in egg consumption in the period under review has been rising with average EU consumption per head rising from 12.6 kg/head in 1998 to 14.4 kg/head in 2009. Within this total there have been varying trends with per capita consumption rising more slowly, albeit starting from a higher base, in the EU-15 than in the New Member

Policy Department B: Structural and Cohesion Policies____________________________________________________________________________________________
10
States. Thus per capita consumption in the EU 15 rose from 12.6 kg in 1998 to 13.7 kg per head in 2009; while in the EU 10/12 consumption per head rose from 12.6 kg in 2004 to 12.8 kg per head in 2009. From 2004 to 2009 consumption per head in the EU 10/12 increased by 3.2% while in the EU 15 per capita consumption increased only 0.7%.
Figure 2.11, provides data on egg consumption per capita and indicates a stable level of egg consumption in the EU 15, with the peak in 2004 being the result of accession of New Member States to the EU. Aggregate consumption then levelled off in the following years, due to the lower level of per capita consumption in the EU 12.
11.0
11.5
12.0
12.5
13.0
13.5
14.0
14.5
15.0
15.5
1998 1999 2000 2001 2002 2003 2004 2005 2006 2007 2008 2009
Consumptionpercapita(kg/head)
Consumption (per capita)
EU 15 EU 25 EU 27
Figure 2.11: Egg consumption per capita in the EU, 1998 – 2009 (kg/head)Source: European Commission
Several interviewees commented that demand for eggs does not suffer during economic downturns, indeed demand may increase as it is the cheapest protein source. Furthermore, one interviewee believed that peer-reviewed scientific evidence negating the link between egg consumption and raised
cholesterol may have contributed to a generally more positive perception of eggs8 and an increase in egg consumption.
Total EU consumption of eggs has risen in line with increased per capita demand rising from 5.8 million tonnes in 1998 to 7.1 million tonnes in 2009. In 2004, the addition of 10 new Member States to the EU increased aggregate EU consumption levels by 1.4 million tonnes
8 Thus for example the British Heart Foundation changed its guidance on egg consumption
THE POULTRY AND EGG SECTORS: EVALUATION OF THE CURRENT MARKET SITUATION AND FUTURE PROSPECTS____________________________________________________________________________________________
11
0
1,000
2,000
3,000
4,000
5,000
6,000
7,000
8,000
1998 1999 2000 2001 2002 2003 2004 2005 2006 2007 2008 2009
Consumption('000tonnes)
Internal use
EU 15 EU 25 EU 27
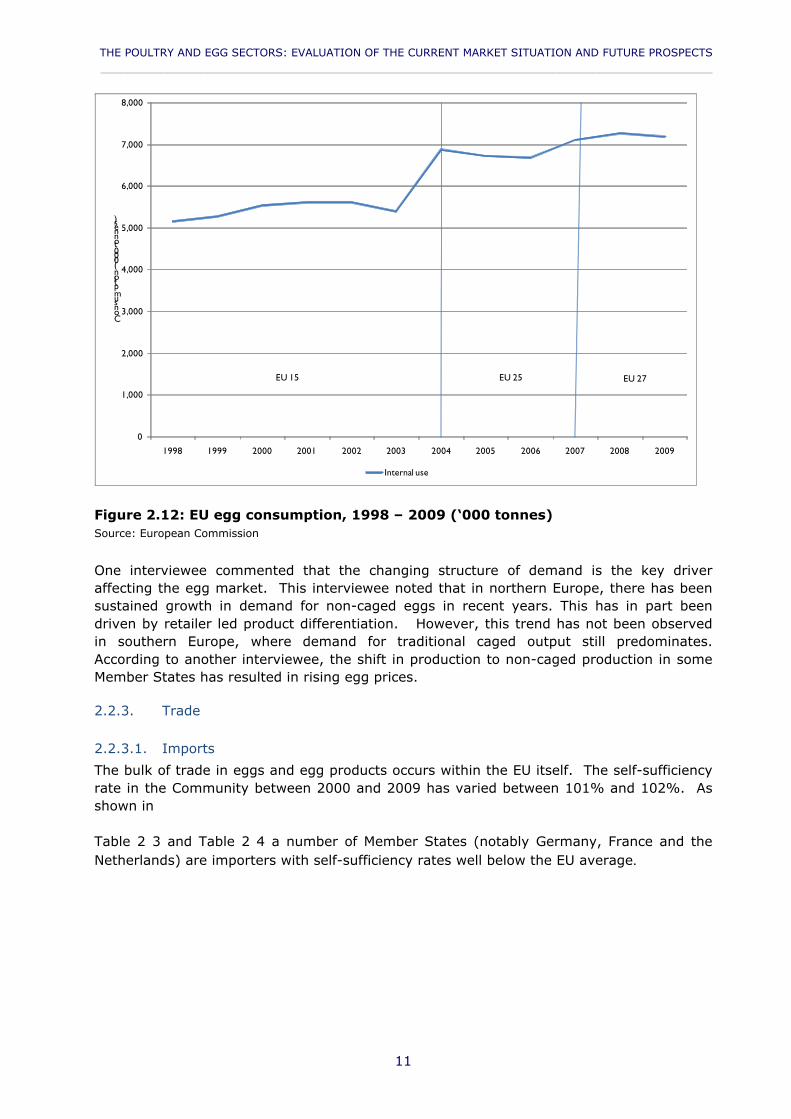
Figure 2.12: EU egg consumption, 1998 – 2009 (‘000 tonnes)Source: European Commission
One interviewee commented that the changing structure of demand is the key driver affecting the egg market. This interviewee noted that in northern Europe, there has been sustained growth in demand for non-caged eggs in recent years. This has in part been driven by retailer led product differentiation. However, this trend has not been observed in southern Europe, where demand for traditional caged output still predominates. According to another interviewee, the shift in production to non-caged production in some Member States has resulted in rising egg prices.
2.2.3. Trade
2.2.3.1. Imports
The bulk of trade in eggs and egg products occurs within the EU itself. The self-sufficiency rate in the Community between 2000 and 2009 has varied between 101% and 102%. As shown in
Table 2 3 and Table 2 4 a number of Member States (notably Germany, France and the Netherlands) are importers with self-sufficiency rates well below the EU average.
Policy Department B: Structural and Cohesion Policies____________________________________________________________________________________________
12
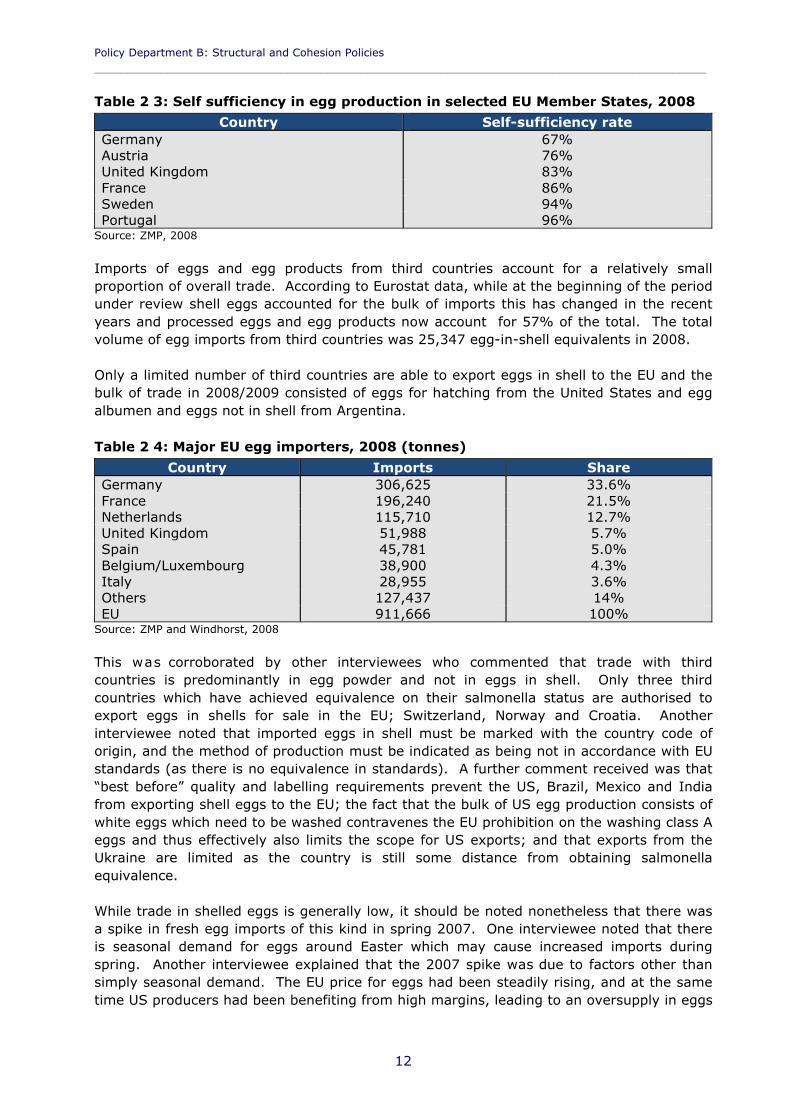
Table 2 3: Self sufficiency in egg production in selected EU Member States, 2008
Country Self-sufficiency rateGermany 67%Austria 76%United Kingdom 83%France 86%Sweden 94%Portugal 96%
Source: ZMP, 2008
Imports of eggs and egg products from third countries account for a relatively small proportion of overall trade. According to Eurostat data, while at the beginning of the period under review shell eggs accounted for the bulk of imports this has changed in the recent years and processed eggs and egg products now account for 57% of the total. The total volume of egg imports from third countries was 25,347 egg-in-shell equivalents in 2008.
Only a limited number of third countries are able to export eggs in shell to the EU and the bulk of trade in 2008/2009 consisted of eggs for hatching from the United States and egg albumen and eggs not in shell from Argentina.
Table 2 4: Major EU egg importers, 2008 (tonnes)
Country Imports ShareGermany 306,625 33.6%France 196,240 21.5%Netherlands 115,710 12.7%United Kingdom 51,988 5.7%Spain 45,781 5.0%Belgium/Luxembourg 38,900 4.3%Italy 28,955 3.6%Others 127,437 14%EU 911,666 100%
Source: ZMP and Windhorst, 2008
This was corroborated by other interviewees who commented that trade with third countries is predominantly in egg powder and not in eggs in shell. Only three third countries which have achieved equivalence on their salmonella status are authorised to export eggs in shells for sale in the EU; Switzerland, Norway and Croatia. Another interviewee noted that imported eggs in shell must be marked with the country code of origin, and the method of production must be indicated as being not in accordance with EU standards (as there is no equivalence in standards). A further comment received was that “best before” quality and labelling requirements prevent the US, Brazil, Mexico and India from exporting shell eggs to the EU; the fact that the bulk of US egg production consists of white eggs which need to be washed contravenes the EU prohibition on the washing class A eggs and thus effectively also limits the scope for US exports; and that exports from the Ukraine are limited as the country is still some distance from obtaining salmonella equivalence.
While trade in shelled eggs is generally low, it should be noted nonetheless that there was a spike in fresh egg imports of this kind in spring 2007. One interviewee noted that there is seasonal demand for eggs around Easter which may cause increased imports during spring. Another interviewee explained that the 2007 spike was due to factors other than simply seasonal demand. The EU price for eggs had been steadily rising, and at the same time US producers had been benefiting from high margins, leading to an oversupply in eggs
THE POULTRY AND EGG SECTORS: EVALUATION OF THE CURRENT MARKET SITUATION AND FUTURE PROSPECTS____________________________________________________________________________________________
13
in the US and ultimately a fall in the price of US eggs. With a favourable exchange rate, US producers exported a large quantity of shelled eggs to the EU for short period.
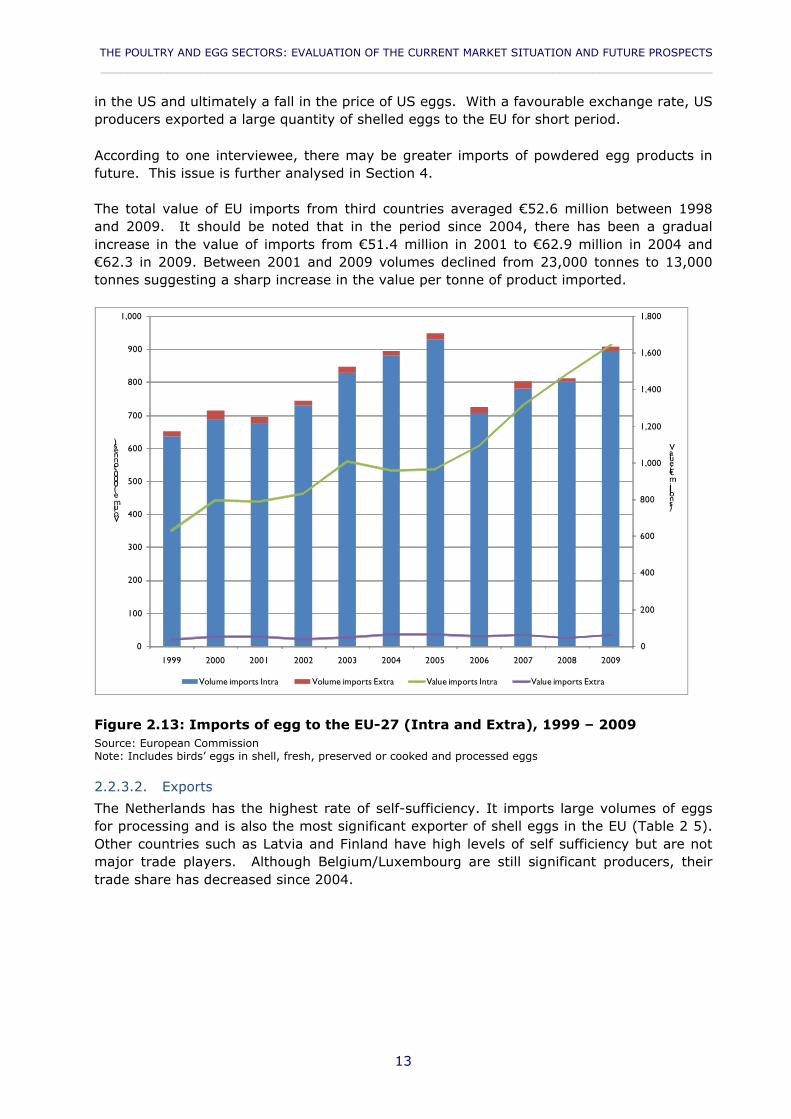
According to one interviewee, there may be greater imports of powdered egg products in future. This issue is further analysed in Section 4.
The total value of EU imports from third countries averaged €52.6 million between 1998 and 2009. It should be noted that in the period since 2004, there has been a gradual increase in the value of imports from €51.4 million in 2001 to €62.9 million in 2004 and €62.3 in 2009. Between 2001 and 2009 volumes declined from 23,000 tonnes to 13,000 tonnes suggesting a sharp increase in the value per tonne of product imported.
0
200
400
600
800
1,000
1,200
1,400
1,600
1,800
0
100
200
300
400
500
600
700
800
900
1,000
1999 2000 2001 2002 2003 2004 2005 2006 2007 2008 2009
Value(€millions)
Volume('000tonnes)
Volume imports Intra Volume imports Extra Value imports Intra Value imports Extra
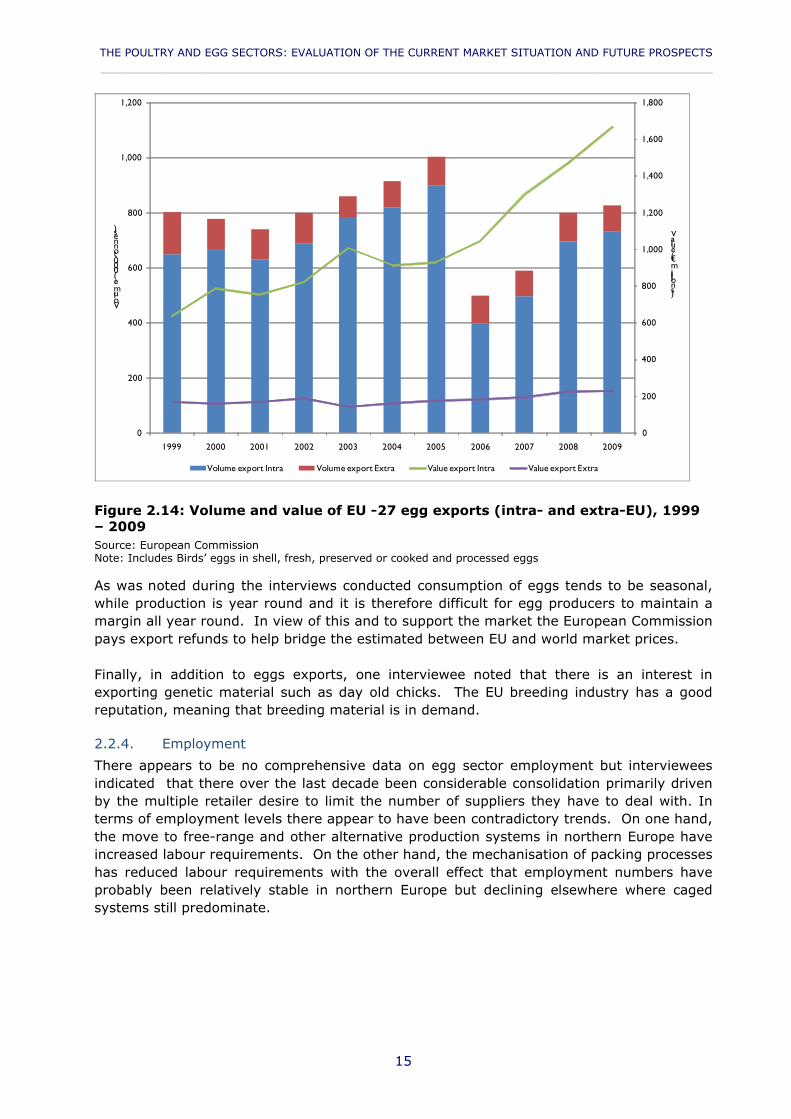
Figure 2.13: Imports of egg to the EU-27 (Intra and Extra), 1999 – 2009Source: European CommissionNote: Includes birds’ eggs in shell, fresh, preserved or cooked and processed eggs
2.2.3.2. Exports
The Netherlands has the highest rate of self-sufficiency. It imports large volumes of eggs for processing and is also the most significant exporter of shell eggs in the EU (Table 2 5). Other countries such as Latvia and Finland have high levels of self sufficiency but are not major trade players. Although Belgium/Luxembourg are still significant producers, their trade share has decreased since 2004.
Policy Department B: Structural and Cohesion Policies____________________________________________________________________________________________
14
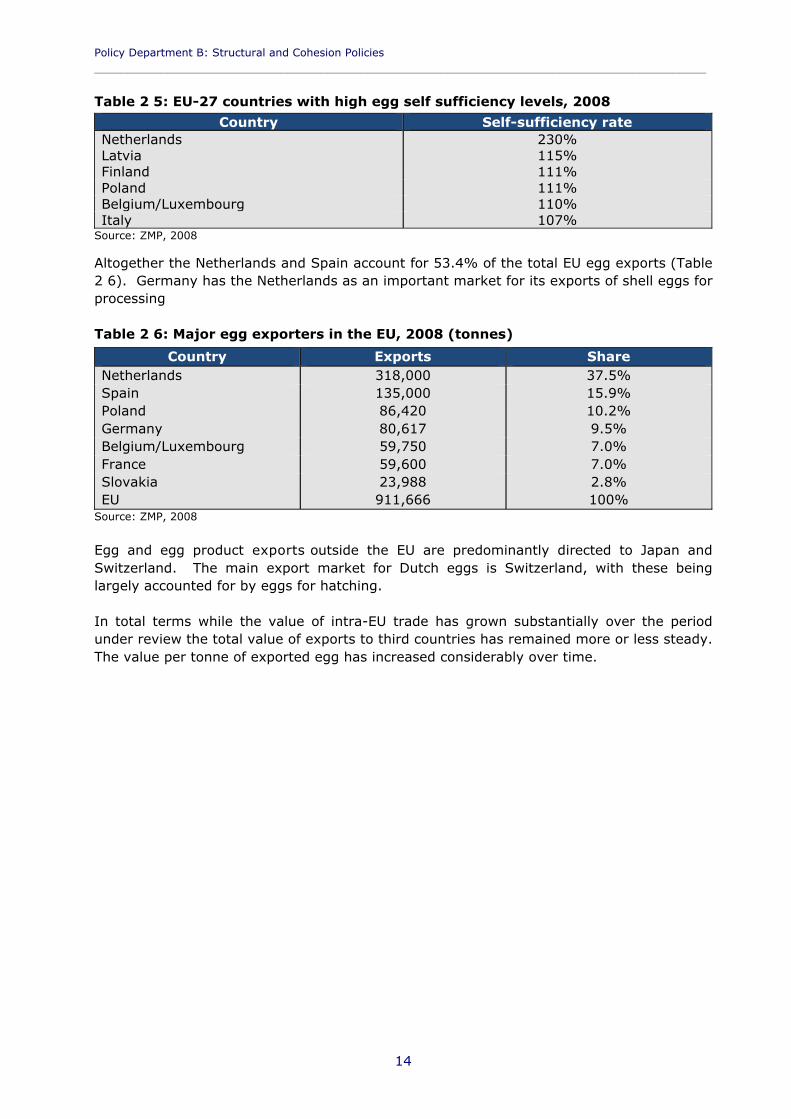
Table 2 5: EU-27 countries with high egg self sufficiency levels, 2008
Country Self-sufficiency rateNetherlands 230%Latvia 115%Finland 111%Poland 111%Belgium/Luxembourg 110%Italy 107%
Source: ZMP, 2008
Altogether the Netherlands and Spain account for 53.4% of the total EU egg exports (Table 2 6). Germany has the Netherlands as an important market for its exports of shell eggs for processing
Table 2 6: Major egg exporters in the EU, 2008 (tonnes)
Country Exports ShareNetherlands 318,000 37.5%Spain 135,000 15.9%Poland 86,420 10.2%Germany 80,617 9.5%Belgium/Luxembourg 59,750 7.0%France 59,600 7.0%Slovakia 23,988 2.8%EU 911,666 100%
Source: ZMP, 2008
Egg and egg product exports outside the EU are predominantly directed to Japan and Switzerland. The main export market for Dutch eggs is Switzerland, with these being largely accounted for by eggs for hatching.
In total terms while the value of intra-EU trade has grown substantially over the period under review the total value of exports to third countries has remained more or less steady. The value per tonne of exported egg has increased considerably over time.
THE POULTRY AND EGG SECTORS: EVALUATION OF THE CURRENT MARKET SITUATION AND FUTURE PROSPECTS____________________________________________________________________________________________
15
0
200
400
600
800
1,000
1,200
1,400
1,600
1,800
0
200
400
600
800
1,000
1,200
1999 2000 2001 2002 2003 2004 2005 2006 2007 2008 2009
Value(€millions)
Volume('000tonnes)
Volume export Intra Volume export Extra Value export Intra Value export Extra
Figure 2.14: Volume and value of EU -27 egg exports (intra- and extra-EU), 1999 – 2009Source: European CommissionNote: Includes Birds’ eggs in shell, fresh, preserved or cooked and processed eggs
As was noted during the interviews conducted consumption of eggs tends to be seasonal, while production is year round and it is therefore difficult for egg producers to maintain a margin all year round. In view of this and to support the market the European Commission pays export refunds to help bridge the estimated between EU and world market prices.
Finally, in addition to eggs exports, one interviewee noted that there is an interest in exporting genetic material such as day old chicks. The EU breeding industry has a good reputation, meaning that breeding material is in demand.
2.2.4. Employment
There appears to be no comprehensive data on egg sector employment but interviewees indicated that there over the last decade been considerable consolidation primarily driven by the multiple retailer desire to limit the number of suppliers they have to deal with. In terms of employment levels there appear to have been contradictory trends. On one hand, the move to free-range and other alternative production systems in northern Europe have increased labour requirements. On the other hand, the mechanisation of packing processes has reduced labour requirements with the overall effect that employment numbers have probably been relatively stable in northern Europe but declining elsewhere where caged systems still predominate.

THE POULTRY AND EGG SECTORS: EVALUATION OF THE CURRENT MARKET SITUATION AND FUTURE PROSPECTS____________________________________________________________________________________________
3
2.3. The commercial structures used in the poultry meat and egg sectors
2.3.1. Structure of the poultry meat production sector
Broiler production can be considered to be either integrated or non-integrated. These approaches are set out below and are followed by a concise comparison:
Integrated production. In France, Germany, Italy and Spain standard poultry meat production is mainly organised through integrators. This process was started in the 1970s in Brittany as part of a push from feed compounders to integrate forwards whereas in the 1980s and 1990s integration reflected more of a backward push from slaughterhouses so that by the year 2000 the share of the four largest companies in the output of the sector had reached 57%. Integrators own the processing plant and often also the hatchery and the feed mill. Towards the broiler farmers integrators use contracts to vertically coordinate poultry production. Broiler farmers remain the owners of production buildings, but most technical choices (from one day chicks to feed suppliers, or even the type of buildings) are made by the integrator, who also plan chick placements in coordination with the slaughterhouses and market needs. Producers are often organised in production organisations (producers groups, mainly cooperatives), which negotiate the terms of the contracts with the industry. This is the situation in, for example, France and Germany. In France, most contracts afford some guaranteed margins for producers.
Non-integrated production. In some EU countries, for example, the Netherlands, Belgium and Poland, the production of poultry meat is not integrated. This means that each link of the production chain is independent of the others. Slaughterhouses, hatcheries and feed mills are separate independent companies and broiler farmers operate independently. Farmers buy the day old chicks from a hatchery and the feed from a feed mill. The birds are grown and sold to a slaughterhouse. This is done based on a long-term agreement for the supply of chickens. In the integrated system the broiler farmer has a contract with an integrator who delivers the day old chicks and feed and collects the grown birds for slaughter. The consequence of the non integrated system is that farmers are more directly confronted with the fluctuations in the markets for feed and broilers.
As a foreword, according to one interviewee, it is not easy to differentiate between integrated and non-integrated production. The interviewee believed that integration existed in most chains, but the degree of integration varied; while some companies control the whole operation, others have contracts with other operators in the chain; ultimately there are very few farms which sell chickens independently of the purchase of feed and day-old chicks. The same interviewee commented that poultry production requires considerable advanced planning (e.g. parent and grandparent stock), and cannot be adjusted rapidly.
The Farm Accountancy Data Network (FADN) gives insights into the financial performance of broiler farms (see paragraph 3.2). In December 2009 LEI published the results for 2008 and provided an estimate for the year 2009 (LEI, 2009).
Figure 2.15 shows that family farm income in the sector fluctuates significantly between years. These fluctuations are mainly caused by changes in input prices (for example, feed prices) and market prices for broilers. In 2006 income was low as a result of low market prices: demand for poultry meat was reduced because of the extensive media attention

Policy Department B: Structural and Cohesion Policies____________________________________________________________________________________________
4
given to avian influenza in wild birds in some European countries. In 2008 average family farm income was approximately zero. Despite higher market prices for broilers, the very significant increase in input costs (especially feed) in that year was too high to generate an income for the farmer. The estimate for the average family farm income in 2009 is €35,000.
-40
-20
0
20
40
60
80
100
120
Income(€'000)
Figure 2.15: Family farm income development in the Netherlands on broiler farms, 1992/1993-2009, (Euro/ farm).Source: LEI (2009).Note: From 2001 the registration period changed from a marketing (May to April) to a calendar year basis.
As is indicated above, income in poultry production is mainly influenced by the level and variability of poultry and feed prices. Poultry meat prices inevitably fluctuate from year to year in line with the variations in supply and demand on the European market. Farmers in countries like the Netherlands and Poland accept and respond to these price fluctuations by changing their production pattern mainly through changes in the density (number of broilers per square meter in a poultry house) and increasing or decreasing the empty period between flocks. These changes are made in cooperation with the poultry slaughterhouses as they are in direct contact with the market.
In Member States with integrated production the farmers receive a contract payment. The risk arising from high feed prices or low poultry meat prices are mainly carried by the integrator. Working with integrators the broiler farmer tends to have a more stable income over time with just minor fluctuations between years. The broiler famer is directly linked to the industry through a contract. This integration contract almost completely disconnects the farmers from the market and the main market risks are transferred to the industry. However, the market nevertheless affects revenues by influencing the farms’ level of activity. In France, data from the Chambres d’Agriculture indicates that productivity differences (kg of live weight produced/m²/year) explain 58 % of the gap between lower
THE POULTRY AND EGG SECTORS: EVALUATION OF THE CURRENT MARKET SITUATION AND FUTURE PROSPECTS____________________________________________________________________________________________
5
quartile in terms of margins and the highest. This is in large part due to the number of rotations which are laid down by the integrators.
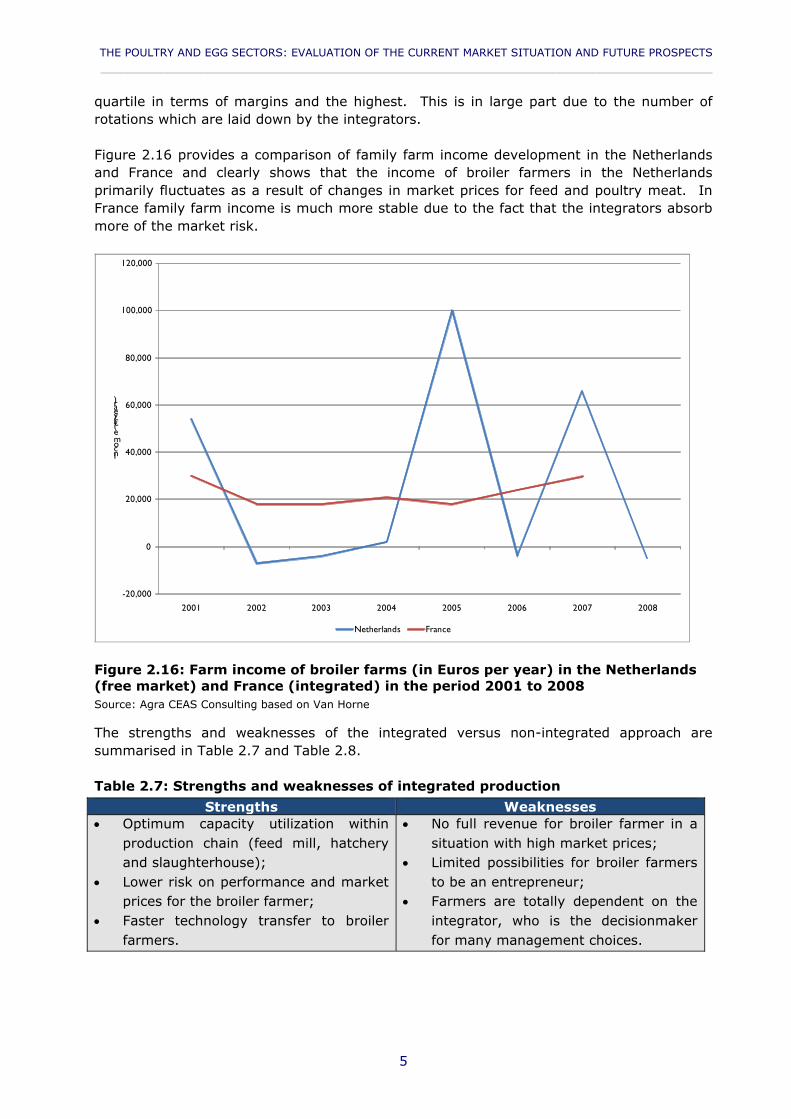
Figure 2.16 provides a comparison of family farm income development in the Netherlands and France and clearly shows that the income of broiler farmers in the Netherlands primarily fluctuates as a result of changes in market prices for feed and poultry meat. In France family farm income is much more stable due to the fact that the integrators absorb more of the market risk.
-20,000
0
20,000
40,000
60,000
80,000
100,000
120,000
2001 2002 2003 2004 2005 2006 2007 2008
Income(€/year)
Netherlands France
Figure 2.16: Farm income of broiler farms (in Euros per year) in the Netherlands (free market) and France (integrated) in the period 2001 to 2008Source: Agra CEAS Consulting based on Van Horne
The strengths and weaknesses of the integrated versus non-integrated approach are summarised in Table 2.7 and Table 2.8.
Table 2.7: Strengths and weaknesses of integrated production
Strengths Weaknesses Optimum capacity utilization within
production chain (feed mill, hatchery and slaughterhouse);
Lower risk on performance and market prices for the broiler farmer;
Faster technology transfer to broiler farmers.
No full revenue for broiler farmer in a situation with high market prices;
Limited possibilities for broiler farmers to be an entrepreneur;
Farmers are totally dependent on the integrator, who is the decisionmaker for many management choices.
Policy Department B: Structural and Cohesion Policies____________________________________________________________________________________________
6
Table 2.8: Strengths and weaknesses of non-integrated productionStrengths Weaknesses
High motivation for farmers to have good production performance ;
Competition between hatcheries, feed mills and slaughterhouses to do business with broiler farmers.
Potentially large fluctuations in income for broiler farmers due to changes in input and output prices;
Large cash requirements, tending to create dependence on loans and vulnerability to changes in interest rates for broiler farmers;
No strong incentive for maximising efficiency within production chain.
2.3.2. Structure of the egg production sector
2.3.2.1. Egg production systems
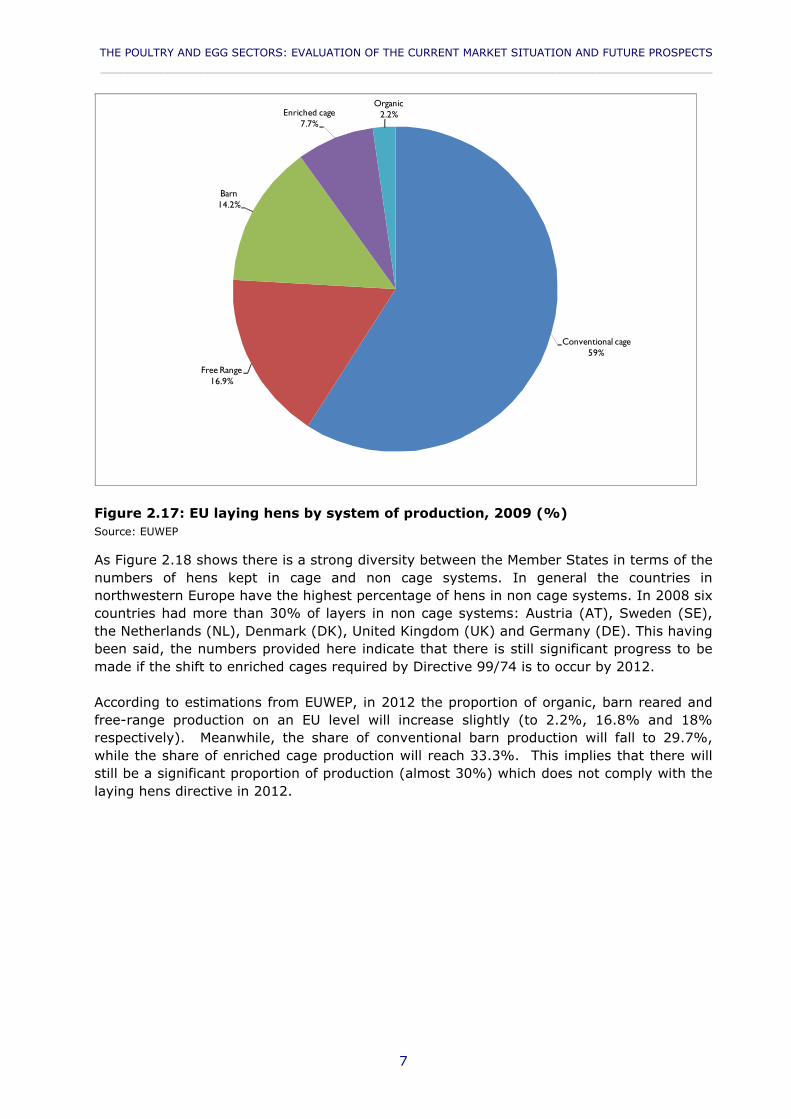
Figure 2.17 presents a breakdown of layers in different egg production systems in the EU-27 as estimated by the EU egg industry representative organisation EUWEP based on European Commission DG Agri data in 2009. It should be noted that these figures are provisional and assume: a) that use of enriched cages will have grown from 19.2 million (5% of total units) in 2008 to 30 million units in 2009; b) that the number of layers in barn systems will have risen from 50.4 million to 55 million and c) that some Member State data has not changed year on year. Using these assumptions and noting also that the ‘free range’ category includes an estimated 34.2 million backyard hens in Romania it is evident that the traditional caged system still accounts for some 59% of layers or 228.4 out of a total of 387.7 million layers in the EU.
In the predominant caged or confined housing system almost all management activities are automated: mechanical feeding, ventilation and egg collection. As a result of the high level of automation and mechanisation and labour requirements are relatively low.
Non cage or alternative systems have the common feature that the layers are kept in large barns with litter on the floor and freedom of movement for the birds within the poultry house. Although also in these housing systems automation levels are high some management activities cannot be automated. The farmer needs to regularly monitor the birds visually by going into the barn. There is also a large labour input in terms of collecting those eggs in the barn which are laid outside the laying nest. Alternative housing systems therefore have a significantly higher labour input per 1,000 hens than cage systems. At the same time a high level of stockmanship is needed in order to obtain satisfactory production results. For this reason farms with alternative housing systems are frequently relatively small and run by a family (family farms). In the Netherlands, Germany and the UK barn eggs and free range eggs are mainly produced on small and medium size farms with less than 100,000 layers. In France, the main share of alternative output is produced in farms with less than 20,000 hens (some 8,000 hens on average), compared to cage egg production where the average size of unit is approximately 55,000 hens.
THE POULTRY AND EGG SECTORS: EVALUATION OF THE CURRENT MARKET SITUATION AND FUTURE PROSPECTS____________________________________________________________________________________________
7
Conventional cage59%
Free Range16.9%
Barn14.2%
Enriched cage7.7%
Organic2.2%
Figure 2.17: EU laying hens by system of production, 2009 (%)Source: EUWEP
As Figure 2.18 shows there is a strong diversity between the Member States in terms of the numbers of hens kept in cage and non cage systems. In general the countries in northwestern Europe have the highest percentage of hens in non cage systems. In 2008 six countries had more than 30% of layers in non cage systems: Austria (AT), Sweden (SE), the Netherlands (NL), Denmark (DK), United Kingdom (UK) and Germany (DE). This having been said, the numbers provided here indicate that there is still significant progress to be made if the shift to enriched cages required by Directive 99/74 is to occur by 2012.
According to estimations from EUWEP, in 2012 the proportion of organic, barn reared and free-range production on an EU level will increase slightly (to 2.2%, 16.8% and 18% respectively). Meanwhile, the share of conventional barn production will fall to 29.7%, while the share of enriched cage production will reach 33.3%. This implies that there will still be a significant proportion of production (almost 30%) which does not comply with the laying hens directive in 2012.

Policy Department B: Structural and Cohesion Policies____________________________________________________________________________________________
8
0%
10%
20%
30%
40%
50%
60%
70%
80%
90%
100%
AT SE NL DK UK DE IT FI FR BE HU SK PL EL CZ ES LT
Proportionoflayersbysystem
Cage Free range Barn Organic
Figure 2.18: Percentage of layers kept in different housing systems in 17 EU Member States, 2008Source: Agra CEAS based on ITAVI from euro com
2.3.3. Organisational structure
The organisational structure in the egg sector is very different from the poultry meat sector. As is indicated above, in the poultry meat sector production in many EU countries is organized by integrators who own the processing plant, the hatchery and a feed mill. Farmers own the poultry houses and produce broilers on contract. As the birds have to be slaughtered at specific weights contract production is important to vertically coordinate the production. This is called fully integrated production where farmers produce broilers under production contracts. Egg production is either organized in a (semi-) integrated way or without any coordination. The situation varies greatly between Member States. The particular organisational structure which prevails is also related to the housing systems (cage versus alternative production):
Integrated production. In many EU countries there are large companies holding more than 1 million layers in cage systems. This is clearly the situation in the UK, Germany, Spain, Italy and Poland. In these countries substantial portions of the chain are integrated in that pullet rearing, layers, feed supply, packing, processing and marketing to the retailer are all in the hands of a single company or co-operative (Agra CEAS, 2004). These integrated companies own and pack a significant proportion of national production. In France, production is often organized by the feed mills (often cooperative groups), who provide feed and pullets to the producers. In the Netherlands feed mills also play an important role in supplying feed and advice to farms. Layer farmers are independent entrepreneurs taking full risk for changes in input (feed and pullet) and output (eggs) prices. At the other end of the scale are other countries where a relatively fragmented production structure is accompanied by a marked lack of concentration at both the production and egg packer level. This is the situation in countries such as Portugal,
THE POULTRY AND EGG SECTORS: EVALUATION OF THE CURRENT MARKET SITUATION AND FUTURE PROSPECTS____________________________________________________________________________________________
9
Greece, Romania and also (partly in) Poland. In other countries such as Austria, producer groups play a significant role in the marketing of the eggs. In most countries, however, packer concentration is relatively low and producers will either own their own packing station, or have arrangements to sell to independent packers who will bundle supplies on short-term supply or price contracts from a relatively limited number of producers.
The processing sector is much more concentrated than the packing sector with many Member States (Sweden, Finland, Denmark, Portugal, Greece, Austria, Belgium and Ireland) having fewer than four processors.
All EU-15 Member States do, however, have at least one processing facility. Where processors are limited in number they tend to focus on breaking second quality eggs, mainly for the domestic market, and usually liquid products only. Often these liquid products include blends and mixes in order to capture greater added value. The drying sector is being increasingly concentrated and many smaller scale processors have stopped this activity in the face of competition.
As is indicated above there is a relation between housing system, farm size and integrated production. Large integrators tend to keep hens in cages on large farms. In countries with a high percentage of hens kept in alternative housing systems the average farm size is smaller and a larger proportion of production in non-integrated. However, large groups or producers of cage eggs may often also integrate some alternative egg producers, to complete the range of products they can offer to distributors.
Where eggs are produced by independent producers these eggs are sold to a packing stations or (semi-) integrated companies. In general the farmer will have a contract to deliver the eggs produced by 1 or 2 flocks (marketing contract). Apart from conditions relating to the logistics and quality of the eggs the contract may also include arrangements on price. This can be a price based on the market (which can change on a weekly basis) or this can be a fixed price for a certain period. In between these two options there is a large range of possibilities with e.g. an option of relating the egg prices to feed prices or to adjust prices up to to three or four times a year. In general, it can be said that in alternative egg production there is more contract production with arrangements relating to price compared to cage production. This is clearly the situation in the UK, France and the Netherlands. Under such arrangements the market risk of changes in egg prices paid by the wholesaler or retailer partly lie with the packing station or integrated company.


THE POULTRY AND EGG SECTORS: EVALUATION OF THE CURRENT MARKET SITUATION AND FUTURE PROSPECTS____________________________________________________________________________________________
3
2.4. Assessment of the common organisation for the poultry and egg markets
2.4.1. Background
The overarching objectives of the Common Agricultural Policy and the Common Market Organisation for poultry meat and eggs reflect those in Article 39 of the consolidated Treaty of Rome, namely:
to increase agricultural productivity by promoting technical progress and by ensuring the rational development of agricultural production and the optimum utilisation of the factors of production, in particular labour;
thus to ensure a fair standard of living for the agricultural community, in particular by increasing the individual earnings of persons engaged in agriculture;
to stabilise markets; to assure the availability of supplies; to ensure that supplies reach consumers at reasonable prices.
An EC eggs and poultry regime first came into operation in July 1967. The present regime is laid down in Council Regulations 2771/75 and 2777/75 for the Common Organisation of the Market in Eggs and Poultry meat respectively. These incorporate all the changes made to the principal regulations between 1967 and 1975, creating a single trading system at the external frontiers of the Community.
This system includes import tariffs, additional (safeguard) duties and export refunds, to facilitate the adjustment of supplies to market requirements. The Regulations also provide for the establishment of marketing standards for intra-Community trade in eggs and poultry products. Marketing standards Regulations were adopted in 1990 and 1991, and have been amended periodically since then.
Decisions concerning the implementation of policy are taken - by weighted voting procedure - at the Eggs and Poultry Management Committee meetings, held once a month in Brussels.
2.4.2. Common organisation of the poultry meat market
Figure 2.19 summarises the intervention logic of the CMO. As shown in this diagram, the various measures under the CMO for poultry meat (namely import tariffs, export refunds and marketing standards) aim to meet the first three objectives of the Common Agricultural Policy listed above.
The common agreements for eggs and poultry meat were introduced in July 1967 via EC Regulations 122/67 and 132/67 and later replaced by the introduction of 2771/75 and 2777/75 in November 1975. Since July 2008, the poultry CMO agreement has been included in Single CMO regulation (Council Regulation (EC) No 1234/2007).
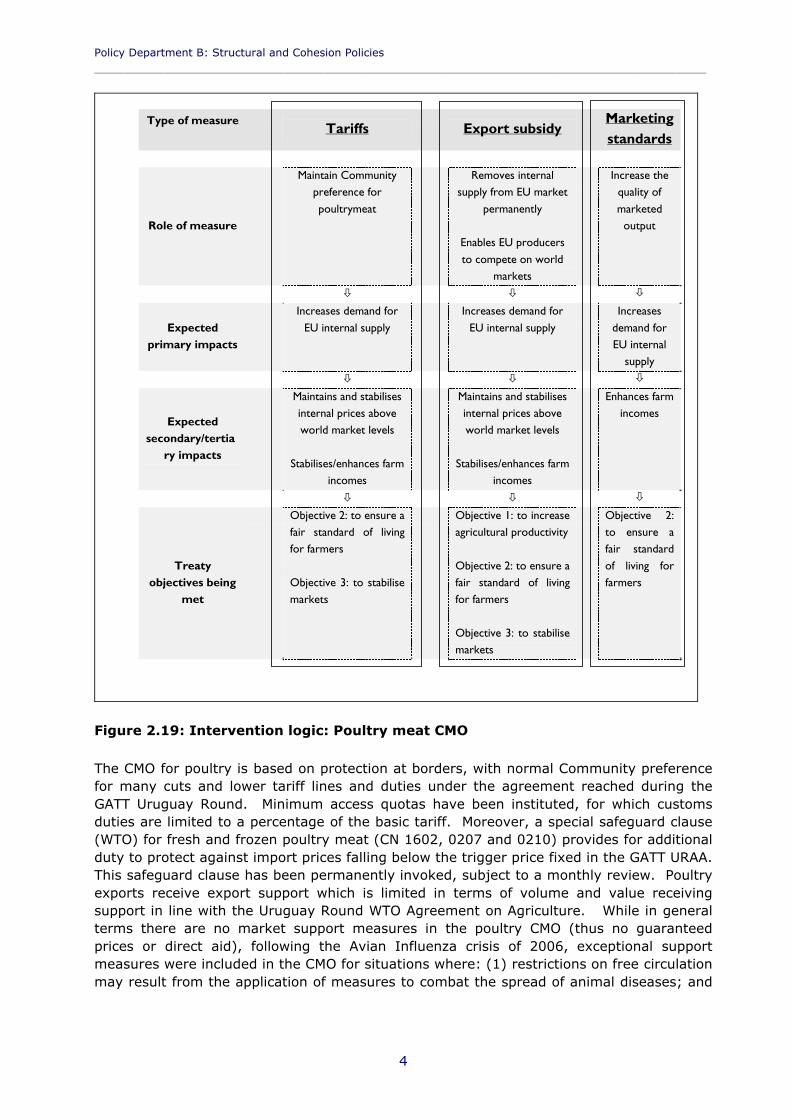
Policy Department B: Structural and Cohesion Policies____________________________________________________________________________________________
4
Type of measureTariffs Export subsidy
Marketingstandards
Role of measure
Maintain Communitypreference forpoultrymeat
Removes internalsupply from EU market
permanently
Enables EU producersto compete on world
markets
Increase thequality ofmarketed
output
Expectedprimary impacts
Increases demand forEU internal supply
Increases demand forEU internal supply
Increasesdemand forEU internal
supply
Expectedsecondary/tertia
ry impacts
Maintains and stabilisesinternal prices aboveworld market levels
Stabilises/enhances farmincomes
Maintains and stabilisesinternal prices aboveworld market levels
Stabilises/enhances farmincomes
Enhances farmincomes
Treatyobjectives being
met
Objective 2: to ensure afair standard of livingfor farmers
Objective 3: to stabilisemarkets
Objective 1: to increaseagricultural productivity
Objective 2: to ensure afair standard of livingfor farmers
Objective 3: to stabilisemarkets
Objective 2:to ensure afair standardof living forfarmers
Figure 2.19: Intervention logic: Poultry meat CMO
The CMO for poultry is based on protection at borders, with normal Community preference for many cuts and lower tariff lines and duties under the agreement reached during the GATT Uruguay Round. Minimum access quotas have been instituted, for which customs duties are limited to a percentage of the basic tariff. Moreover, a special safeguard clause (WTO) for fresh and frozen poultry meat (CN 1602, 0207 and 0210) provides for additional duty to protect against import prices falling below the trigger price fixed in the GATT URAA. This safeguard clause has been permanently invoked, subject to a monthly review. Poultry exports receive export support which is limited in terms of volume and value receiving support in line with the Uruguay Round WTO Agreement on Agriculture. While in general terms there are no market support measures in the poultry CMO (thus no guaranteed prices or direct aid), following the Avian Influenza crisis of 2006, exceptional support measures were included in the CMO for situations where: (1) restrictions on free circulation may result from the application of measures to combat the spread of animal diseases; and
THE POULTRY AND EGG SECTORS: EVALUATION OF THE CURRENT MARKET SITUATION AND FUTURE PROSPECTS____________________________________________________________________________________________
5
(2) serious market disturbances can be directly attributed to a loss in consumer confidence due to public health, or animal health risks.Council Regulation (EC) No 1234/2007 covers:
live poultry, fowls, duck, geese, turkeys and guinea fowl; dead poultry of the aforementioned stock and edible offals thereof, fresh, chilled or
frozen; poultry liver, fresh, chilled, frozen, salted, in brine, dried or smoked; poultry fat (not rendered or otherwise extracted), fresh, chilled, frozen, salted, in
brine, dried or smoked; poultry fat; other prepared or preserved goose or duck lives; and, other prepared or preserved poultry meat or poultry offal
The EU has never operated a domestic support ‘regime’ for poultry meat producers. It has relied in the past on tariffs to help stabilise the EU market and keep market prices in proportion to prices for cereals, and other costs, thus allowing EU producers to achieve sustainable profit margins. It also provides for limited export refunds on certain categories of poultry export notably frozen whole chickens which are primarily exported from France.
EU protection remains high for fresh poultry meat products, but is low for processed products. An increasing proportion of the EU poultry sector is thus operating in a global market. As is discussed in Sections 3 and 4 of this report in particular this is challenging for the EU poultry meat sector not least because it is being required to meet health, environmental and welfare standards (and costs) not necessarily faced by its overseas competitors. At the same time access for EU poultry meat to third country markets is not always open, e.g. where Special Safeguard Clauses have been invoked for SPS reasons.
2.4.3. Common organisation of the egg market
Figure 2.20 summarises the intervention logic of the CMO. As shown in this diagram, the various measures under the CMO for eggs (namely import tariffs, export refunds and marketing standards) aim to meet the first three objectives of the Common Agricultural Policy listed above.

Policy Department B: Structural and Cohesion Policies____________________________________________________________________________________________
6
Type of measureTariffs Export subsidy
Marketingstandards
Role of measure
Maintain Communitypreference for eggs
Removes internalsupply from EU market
permanently
Enables EU producersto compete on world
markets
Increase thequality ofmarketed
output
Expectedprimary impacts
Increases demand forEU internal supply
Increases demand forEU internal supply
Increasesdemand forEU internal
supply
Expectedsecondary/tertia
ry impacts
Maintains and stabilisesinternal prices aboveworld market levels
Stabilises/enhances farmincomes
Maintains and stabilisesinternal prices aboveworld market levels
Stabilises/enhances farmincomes
Enhances farmincomes
Treatyobjectives being
met
Objective 2: to ensure afair standard of livingfor farmers
Objective 3: to stabilisemarkets
Objective 1: to increaseagricultural productivity
Objective 2: to ensure afair standard of livingfor farmers
Objective 3: to stabilisemarkets
Objective 2:to ensure afair standardof living forfarmers
Figure 2.20: Intervention logic: Eggs CMO
The common agreements for eggs and poultry meat were introduced in July 1967 via EC Regulations 122/67 and 132/67 and later replaced by the introduction of 2771/75 and 2777/75 in November 1975. Since July 2008, the poultry CMO agreement has been included in Single CMO regulation (Council Regulation (EC) No 1234/2007).
The CMO for eggs does not include any guaranteed prices or direct aid, only protection at borders with a very low customs duty in accordance with the agreement reached during the GATT Uruguay Round as well as limited export restitutions. Minimum access quotas have been instituted, for which customs duties are limited to a percentage of the basic tariff. Moreover, a special safeguard clause
provides for additional duties where the volume of imports rises too sharply or the price of imports falls too low. This safeguard clause has, however, not been invoked since 23 May 1996.

THE POULTRY AND EGG SECTORS: EVALUATION OF THE CURRENT MARKET SITUATION AND FUTURE PROSPECTS____________________________________________________________________________________________
7
Council Regulation (EC) No 1234/2007 covers the following categories of products:
poultry eggs in shell, fresh, preserved or cooked; and, bird's eggs, not in shell, and egg yolks, fresh, dried, cooked by steaming or by
boiling in water, moulded, frozen or otherwise preserved, whether or not containing added sugar or other sweetening matter, other than unfit for human consumption
The EU has never operated a domestic support ‘regime’ for egg producers. It has relied in the past on tariffs to help stabilise the EU market and keep market prices in proportion to prices for cereals, and other costs, thus allowing EU producers sustainable profit margins. However, following the World Trade Organisation (WTO) Uruguay Round agreement, these tariff barriers have been gradually eroded.

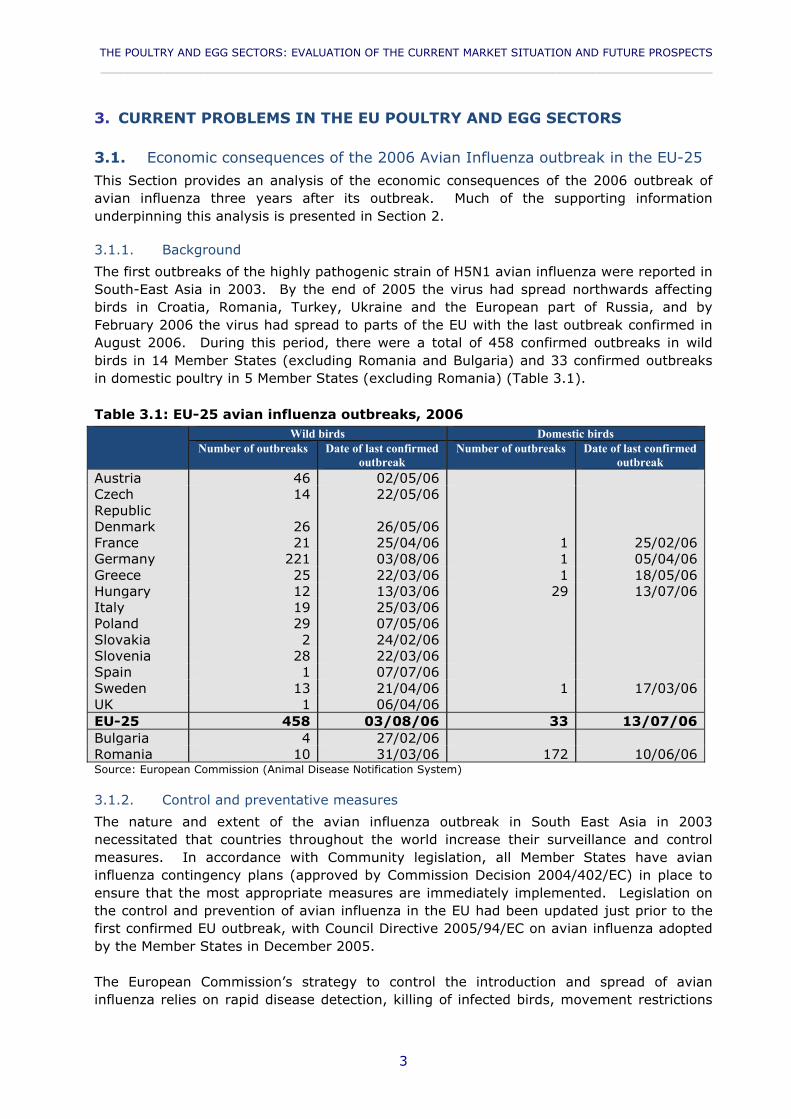
THE POULTRY AND EGG SECTORS: EVALUATION OF THE CURRENT MARKET SITUATION AND FUTURE PROSPECTS____________________________________________________________________________________________
3
3. CURRENT PROBLEMS IN THE EU POULTRY AND EGG SECTORS
3.1. Economic consequences of the 2006 Avian Influenza outbreak in the EU-25
This Section provides an analysis of the economic consequences of the 2006 outbreak of avian influenza three years after its outbreak. Much of the supporting information underpinning this analysis is presented in Section 2.
3.1.1. Background
The first outbreaks of the highly pathogenic strain of H5N1 avian influenza were reported in South-East Asia in 2003. By the end of 2005 the virus had spread northwards affecting birds in Croatia, Romania, Turkey, Ukraine and the European part of Russia, and by February 2006 the virus had spread to parts of the EU with the last outbreak confirmed in August 2006. During this period, there were a total of 458 confirmed outbreaks in wild birds in 14 Member States (excluding Romania and Bulgaria) and 33 confirmed outbreaks in domestic poultry in 5 Member States (excluding Romania) (Table 3.1).
Table 3.1: EU-25 avian influenza outbreaks, 2006Wild birds Domestic birds
Number of outbreaks Date of last confirmed outbreak
Number of outbreaks Date of last confirmed outbreak
Austria 46 02/05/06Czech Republic
14 22/05/06
Denmark 26 26/05/06France 21 25/04/06 1 25/02/06Germany 221 03/08/06 1 05/04/06Greece 25 22/03/06 1 18/05/06Hungary 12 13/03/06 29 13/07/06Italy 19 25/03/06Poland 29 07/05/06Slovakia 2 24/02/06Slovenia 28 22/03/06Spain 1 07/07/06Sweden 13 21/04/06 1 17/03/06UK 1 06/04/06EU-25 458 03/08/06 33 13/07/06Bulgaria 4 27/02/06Romania 10 31/03/06 172 10/06/06Source: European Commission (Animal Disease Notification System)
3.1.2. Control and preventative measures
The nature and extent of the avian influenza outbreak in South East Asia in 2003 necessitated that countries throughout the world increase their surveillance and control measures. In accordance with Community legislation, all Member States have avian influenza contingency plans (approved by Commission Decision 2004/402/EC) in place to ensure that the most appropriate measures are immediately implemented. Legislation on the control and prevention of avian influenza in the EU had been updated just prior to thefirst confirmed EU outbreak, with Council Directive 2005/94/EC on avian influenza adopted by the Member States in December 2005.
The European Commission’s strategy to control the introduction and spread of avian influenza relies on rapid disease detection, killing of infected birds, movement restrictions
Policy Department B: Structural and Cohesion Policies____________________________________________________________________________________________
4
for live birds and their products, cleaning and disinfection and vaccination. Enhanced surveillance in poultry holdings and wild birds, as well as preventive vaccination, was also introduced.
Given the nature of the H5N1 strain of avian influenza and its spread by wild migratory birds, additional control measures were implemented, including: reporting of increased abnormal morbidity and mortality in wild birds to the national veterinary authorities by bird watchers, hunters and other relevant organisations.
According to Pittman and Laddomada (2008), EU legislation and its implementation in Member States in 2006 successfully limited the impact of the disease on animal and human health.
3.1.3. Economic impact
In Europe, avian influenza outbreaks were confirmed in 14 Member States, with trade bans put in place for those 5 Member States where avian influenza was identified in domestic poultry operations. Approximately 69 third countries put bans on poultry products from the various affected Member States within the EU-25, of which eleven did not adopt a regional approach and imposed bans on all EU products (FAO, 2006). Consequently, EU exports of both poultrymeat and eggs were affected, with depressed exports levels in 2006 recorded (see Figure 2.8 and Figure 2.14 in Section 2).
Looking at the impact on demand, research has identified that consumer attitudes towards poultry meat and eggs were closely related to the development of the avian influenza epidemic (see for example: FAO, 2006; European Commission, 2006; and Magdelaine et al., 2008). A survey commissioned by the European Commission established the extent of the consumption shocks during the outbreak (European Commission, 2006). Although the majority of consumers had not changed their consumption habits, the survey found that demand for poultry meat was more affected than the demand for eggs. Specifically, 18% of respondents had reduced consumption of poultry meat, compared to 13% of respondents having reduced their egg consumption (Table 3.1).
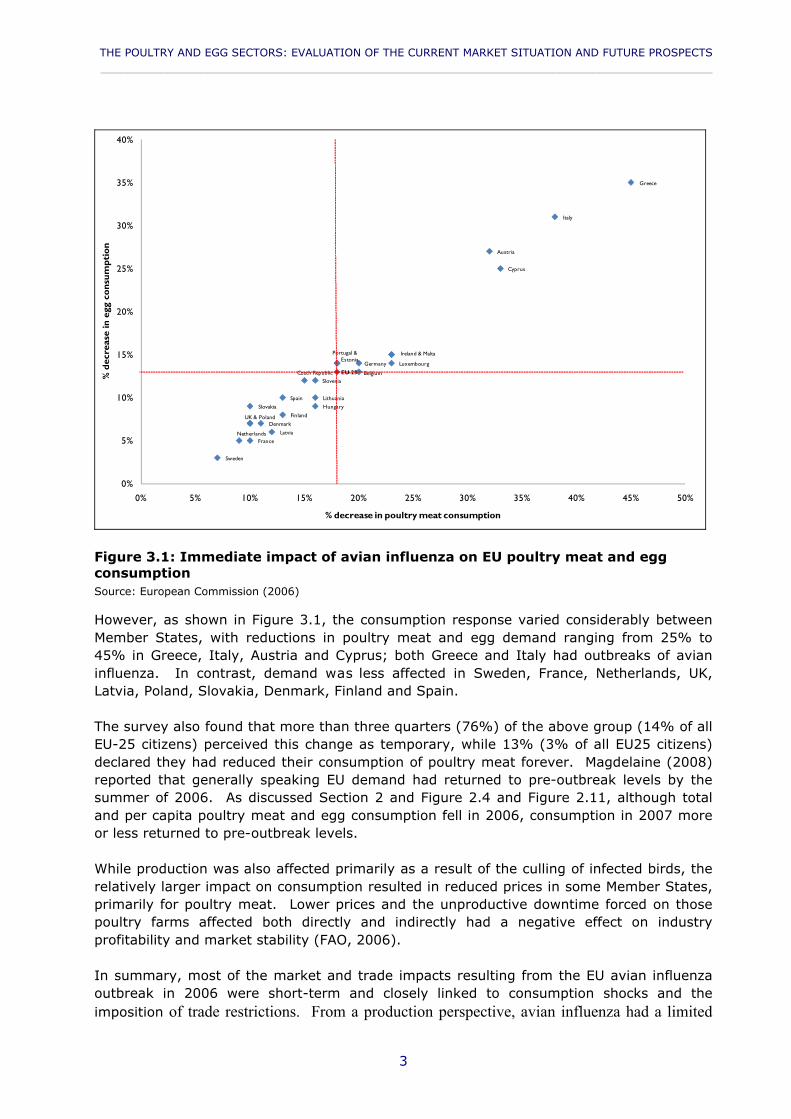
THE POULTRY AND EGG SECTORS: EVALUATION OF THE CURRENT MARKET SITUATION AND FUTURE PROSPECTS____________________________________________________________________________________________
3
BelgiumCzech Republic
Denmark
Germany
Greece
Spain
France
Italy
Cyprus
Latvia
Lithuania
Luxembourg
Hungary
Ireland & Malta
Netherlands
Austria
Portugal & Estonia
Slovenia
Slovakia
Finland
Sweden
UK & Poland
EU-25
0%
5%
10%
15%
20%
25%
30%
35%
40%
0% 5% 10% 15% 20% 25% 30% 35% 40% 45% 50%
% d
ecre
ase
in e
gg c
onsu
mpt
ion
% decrease in poultry meat consumption
Figure 3.1: Immediate impact of avian influenza on EU poultry meat and egg consumptionSource: European Commission (2006)
However, as shown in Figure 3.1, the consumption response varied considerably between Member States, with reductions in poultry meat and egg demand ranging from 25% to 45% in Greece, Italy, Austria and Cyprus; both Greece and Italy had outbreaks of avian influenza. In contrast, demand was less affected in Sweden, France, Netherlands, UK, Latvia, Poland, Slovakia, Denmark, Finland and Spain.
The survey also found that more than three quarters (76%) of the above group (14% of all EU-25 citizens) perceived this change as temporary, while 13% (3% of all EU25 citizens) declared they had reduced their consumption of poultry meat forever. Magdelaine (2008) reported that generally speaking EU demand had returned to pre-outbreak levels by the summer of 2006. As discussed Section 2 and Figure 2.4 and Figure 2.11, although total and per capita poultry meat and egg consumption fell in 2006, consumption in 2007 more or less returned to pre-outbreak levels.
While production was also affected primarily as a result of the culling of infected birds, the relatively larger impact on consumption resulted in reduced prices in some Member States, primarily for poultry meat. Lower prices and the unproductive downtime forced on those poultry farms affected both directly and indirectly had a negative effect on industry profitability and market stability (FAO, 2006).
In summary, most of the market and trade impacts resulting from the EU avian influenza outbreak in 2006 were short-term and closely linked to consumption shocks and the imposition of trade restrictions. From a production perspective, avian influenza had a limited
Policy Department B: Structural and Cohesion Policies____________________________________________________________________________________________
4
impact on market supply given the rapid supply response (i.e. production cycle) of poultry production.
3.1.4. EU financial measures to support the poultry meat and egg sectors
In the case of outbreaks of avian influenza, the European Commission provides support to the poultry sector. This includes:
Market support measures. The EU will pay up to 50% of the cost of market support measures in the eggs and poultry sector, mitigating the effects of a drop in demand resulting from avian influenza outbreaks.
Compensation. The budget also covers 50% of the costs of compensating for the financial losses that farmers incur as a result of eradication measures. This support includes compensation for the loss of livestock and the costs of cleaning and disinfection.
Vaccination costs. The EU can fund up to 100% of the cost of supplying emergency vaccines and 50% of the costs of carrying out emergency vaccination.
In response to the 2006 outbreak of avian influenza, compensation was provided by the European Commission under Council Regulation (EC) No 101/2006. Maximum support of €81.6 million was envisaged, most of which was to be used for the destruction of hatching eggs and breeding birds. However, it was only deemed necessary to make available 52% of the total €81.6 million support foreseen under Regulation (EC) 1010/2006, with only one Member State (Spain) using 100% of its allocation.
3.2. Evaluation of the effect of increasing input prices
3.2.1. General analysis of broiler production costs
Figure 3.2 provides a comparison of the cost of broiler production in selected EU Member States, based on cost data for the year 2007. Although overall production costs are fairly similar between Member States, the cost of broiler production was at its lowest in Poland and the Netherlands and at its highest in the UK. There are however clear differences with regard to some of the individual cost items. For example, compared to Poland, broiler production in the Netherlands and Poland, despite lower feed prices in the Netherlands, Dutch broiler production generally has higher manure-disposal costs, more expensive poultry housing, and higher energy costs. In contrast, while the cost of feed is higher in Poland, Polish broiler production has the advantage of lower labour costs and no manure disposal costs.
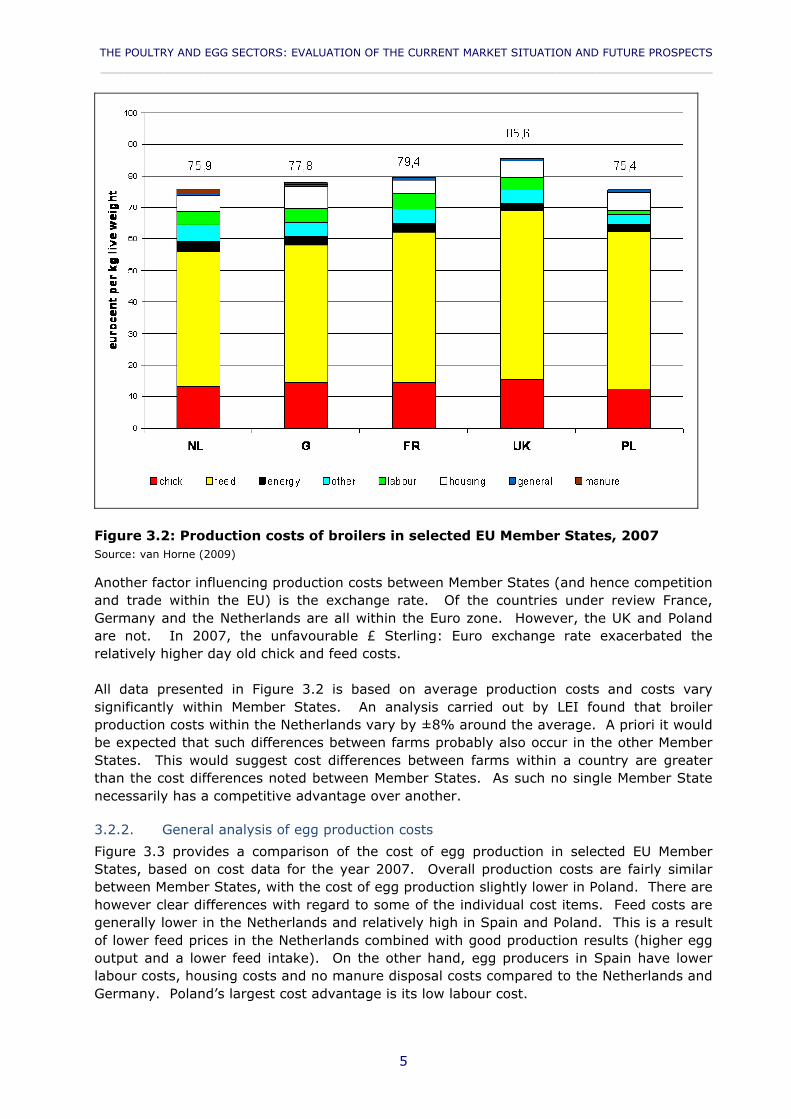
THE POULTRY AND EGG SECTORS: EVALUATION OF THE CURRENT MARKET SITUATION AND FUTURE PROSPECTS____________________________________________________________________________________________
5
Figure 3.2: Production costs of broilers in selected EU Member States, 2007Source: van Horne (2009)
Another factor influencing production costs between Member States (and hence competition and trade within the EU) is the exchange rate. Of the countries under review France, Germany and the Netherlands are all within the Euro zone. However, the UK and Poland are not. In 2007, the unfavourable £ Sterling: Euro exchange rate exacerbated the relatively higher day old chick and feed costs.
All data presented in Figure 3.2 is based on average production costs and costs vary significantly within Member States. An analysis carried out by LEI found that broiler production costs within the Netherlands vary by ±8% around the average. A priori it would be expected that such differences between farms probably also occur in the other Member States. This would suggest cost differences between farms within a country are greater than the cost differences noted between Member States. As such no single Member State necessarily has a competitive advantage over another.
3.2.2. General analysis of egg production costs
Figure 3.3 provides a comparison of the cost of egg production in selected EU Member States, based on cost data for the year 2007. Overall production costs are fairly similar between Member States, with the cost of egg production slightly lower in Poland. There are however clear differences with regard to some of the individual cost items. Feed costs are generally lower in the Netherlands and relatively high in Spain and Poland. This is a result of lower feed prices in the Netherlands combined with good production results (higher egg output and a lower feed intake). On the other hand, egg producers in Spain have lower labour costs, housing costs and no manure disposal costs compared to the Netherlands and Germany. Poland’s largest cost advantage is its low labour cost.
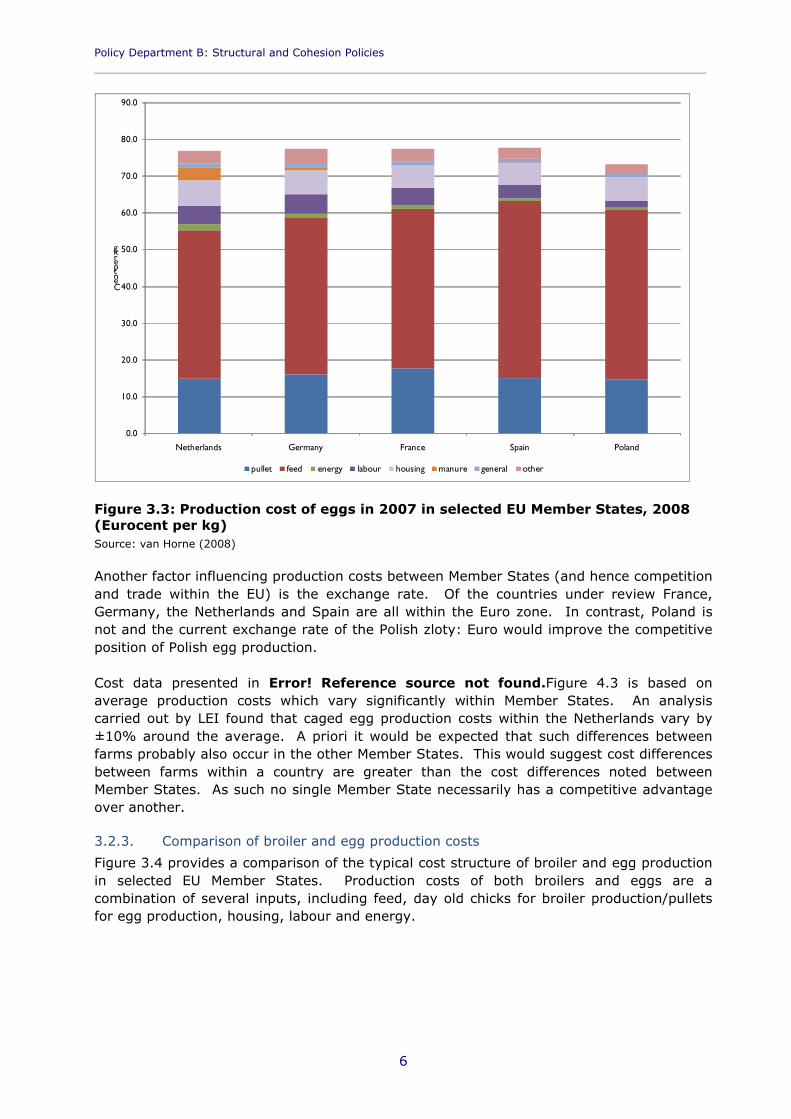
Policy Department B: Structural and Cohesion Policies____________________________________________________________________________________________
6
0.0
10.0
20.0
30.0
40.0
50.0
60.0
70.0
80.0
90.0
Netherlands Germany France Spain Poland
Centperkg
pullet feed energy labour housing manure general other
Figure 3.3: Production cost of eggs in 2007 in selected EU Member States, 2008 (Eurocent per kg)Source: van Horne (2008)
Another factor influencing production costs between Member States (and hence competition and trade within the EU) is the exchange rate. Of the countries under review France, Germany, the Netherlands and Spain are all within the Euro zone. In contrast, Poland is not and the current exchange rate of the Polish zloty: Euro would improve the competitive position of Polish egg production.
Cost data presented in Error! Reference source not found.Figure 4.3 is based on average production costs which vary significantly within Member States. An analysis carried out by LEI found that caged egg production costs within the Netherlands vary by ±10% around the average. A priori it would be expected that such differences between farms probably also occur in the other Member States. This would suggest cost differences between farms within a country are greater than the cost differences noted between Member States. As such no single Member State necessarily has a competitive advantage over another.
3.2.3. Comparison of broiler and egg production costs
Figure 3.4 provides a comparison of the typical cost structure of broiler and egg production in selected EU Member States. Production costs of both broilers and eggs are a combination of several inputs, including feed, day old chicks for broiler production/pullets for egg production, housing, labour and energy.
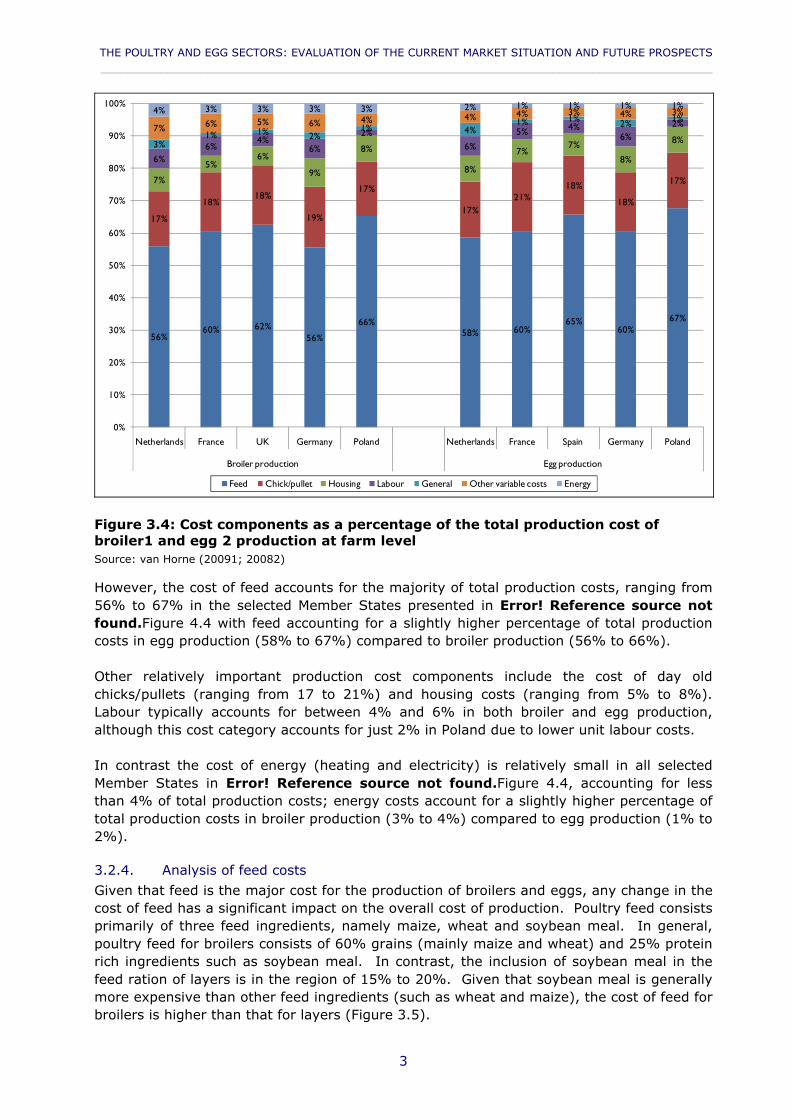
THE POULTRY AND EGG SECTORS: EVALUATION OF THE CURRENT MARKET SITUATION AND FUTURE PROSPECTS____________________________________________________________________________________________
3
56%60% 62%
56%
66%58% 60%
65%60%
67%
17%
18%18%
19%
17%
17%21%
18%
18%
17%7%
5%6%
9%
8%
8%
7%7%
8%
8%
6%6%
4%6%
2%6%
5% 4%6%
2%
3%1% 1% 2%
1% 4%1% 1% 2% 1%
7% 6% 5% 6% 4% 4% 4% 3% 4% 3%4% 3% 3% 3% 3% 2% 1% 1% 1% 1%
0%
10%
20%
30%
40%
50%
60%
70%
80%
90%
100%
Netherlands France UK Germany Poland Netherlands France Spain Germany Poland
Broiler production Egg production
Feed Chick/pullet Housing Labour General Other variable costs Energy
Figure 3.4: Cost components as a percentage of the total production cost of broiler1 and egg 2 production at farm levelSource: van Horne (20091; 20082)
However, the cost of feed accounts for the majority of total production costs, ranging from 56% to 67% in the selected Member States presented in Error! Reference source not found.Figure 4.4 with feed accounting for a slightly higher percentage of total production costs in egg production (58% to 67%) compared to broiler production (56% to 66%).
Other relatively important production cost components include the cost of day old chicks/pullets (ranging from 17 to 21%) and housing costs (ranging from 5% to 8%). Labour typically accounts for between 4% and 6% in both broiler and egg production, although this cost category accounts for just 2% in Poland due to lower unit labour costs.
In contrast the cost of energy (heating and electricity) is relatively small in all selected Member States in Error! Reference source not found.Figure 4.4, accounting for less than 4% of total production costs; energy costs account for a slightly higher percentage of total production costs in broiler production (3% to 4%) compared to egg production (1% to 2%).
3.2.4. Analysis of feed costs
Given that feed is the major cost for the production of broilers and eggs, any change in the cost of feed has a significant impact on the overall cost of production. Poultry feed consists primarily of three feed ingredients, namely maize, wheat and soybean meal. In general, poultry feed for broilers consists of 60% grains (mainly maize and wheat) and 25% protein rich ingredients such as soybean meal. In contrast, the inclusion of soybean meal in the feed ration of layers is in the region of 15% to 20%. Given that soybean meal is generally more expensive than other feed ingredients (such as wheat and maize), the cost of feed for broilers is higher than that for layers (Figure 3.5).
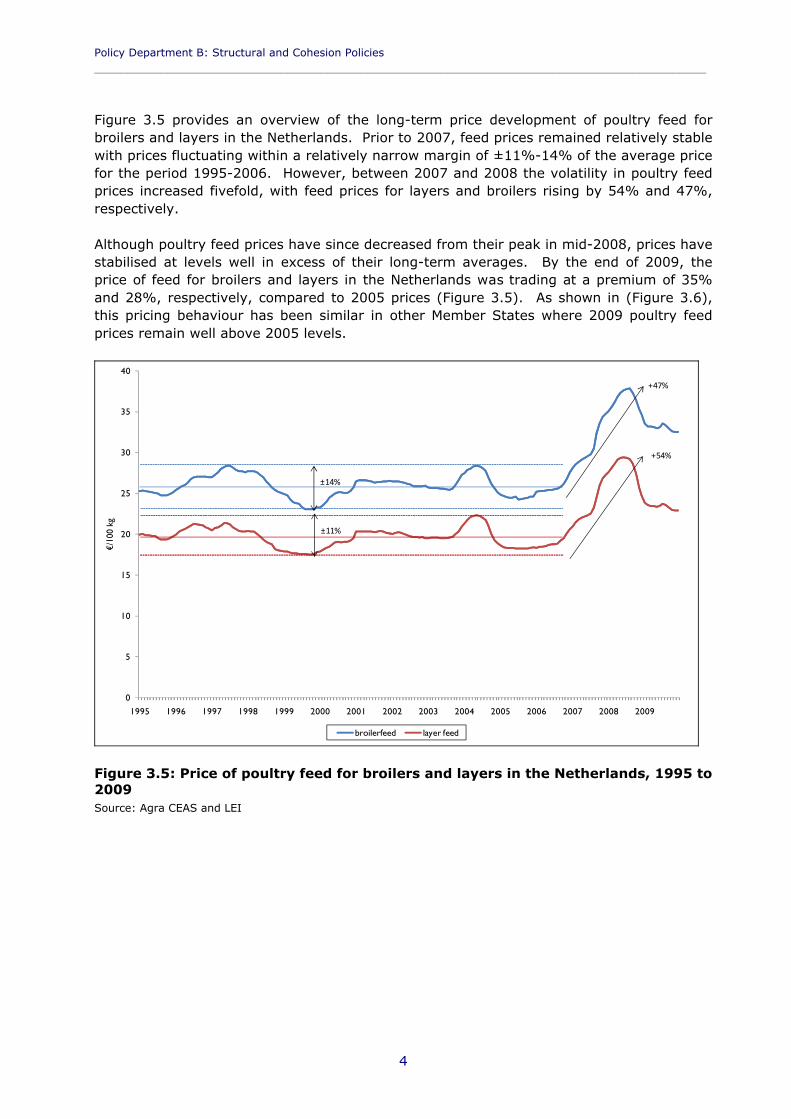
Policy Department B: Structural and Cohesion Policies____________________________________________________________________________________________
4
Figure 3.5 provides an overview of the long-term price development of poultry feed for broilers and layers in the Netherlands. Prior to 2007, feed prices remained relatively stable with prices fluctuating within a relatively narrow margin of ±11%-14% of the average price for the period 1995-2006. However, between 2007 and 2008 the volatility in poultry feed prices increased fivefold, with feed prices for layers and broilers rising by 54% and 47%, respectively.
Although poultry feed prices have since decreased from their peak in mid-2008, prices have stabilised at levels well in excess of their long-term averages. By the end of 2009, the price of feed for broilers and layers in the Netherlands was trading at a premium of 35% and 28%, respectively, compared to 2005 prices (Figure 3.5). As shown in (Figure 3.6), this pricing behaviour has been similar in other Member States where 2009 poultry feed prices remain well above 2005 levels.
0
5
10
15
20
25
30
35
40
1995 1996 1997 1998 1999 2000 2001 2002 2003 2004 2005 2006 2007 2008 2009
€/10
0 kg
broilerfeed layer feed
±14%
±11%
+47%
+54%
Figure 3.5: Price of poultry feed for broilers and layers in the Netherlands, 1995 to 2009Source: Agra CEAS and LEI
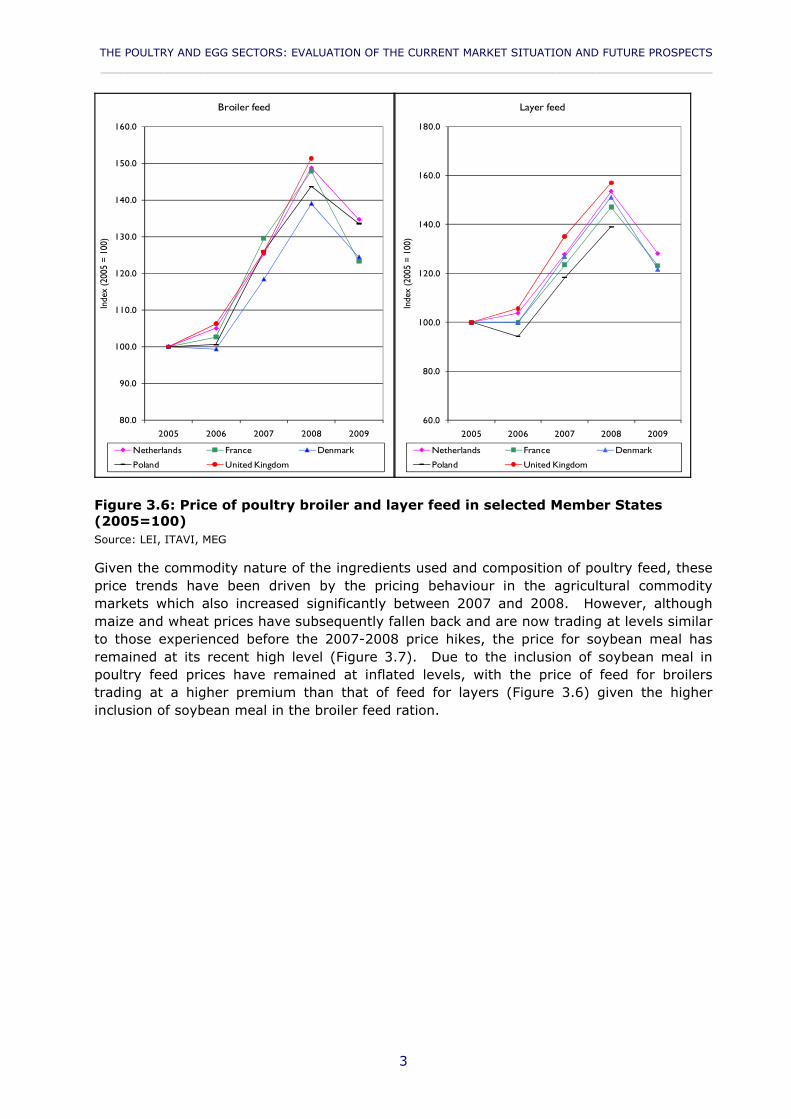
THE POULTRY AND EGG SECTORS: EVALUATION OF THE CURRENT MARKET SITUATION AND FUTURE PROSPECTS____________________________________________________________________________________________
3
80.0
90.0
100.0
110.0
120.0
130.0
140.0
150.0
160.0
2005 2006 2007 2008 2009
Inde
x (2
005
= 10
0)Broiler feed
Netherlands France Denmark
Poland United Kingdom
60.0
80.0
100.0
120.0
140.0
160.0
180.0
2005 2006 2007 2008 2009
Inde
x (2
005
= 10
0)
Layer feed
Netherlands France Denmark
Poland United Kingdom
Figure 3.6: Price of poultry broiler and layer feed in selected Member States (2005=100)Source: LEI, ITAVI, MEG
Given the commodity nature of the ingredients used and composition of poultry feed, these price trends have been driven by the pricing behaviour in the agricultural commodity markets which also increased significantly between 2007 and 2008. However, although maize and wheat prices have subsequently fallen back and are now trading at levels similar to those experienced before the 2007-2008 price hikes, the price for soybean meal has remained at its recent high level (Figure 3.7). Due to the inclusion of soybean meal in poultry feed prices have remained at inflated levels, with the price of feed for broilers trading at a higher premium than that of feed for layers (Figure 3.6) given the higher inclusion of soybean meal in the broiler feed ration.
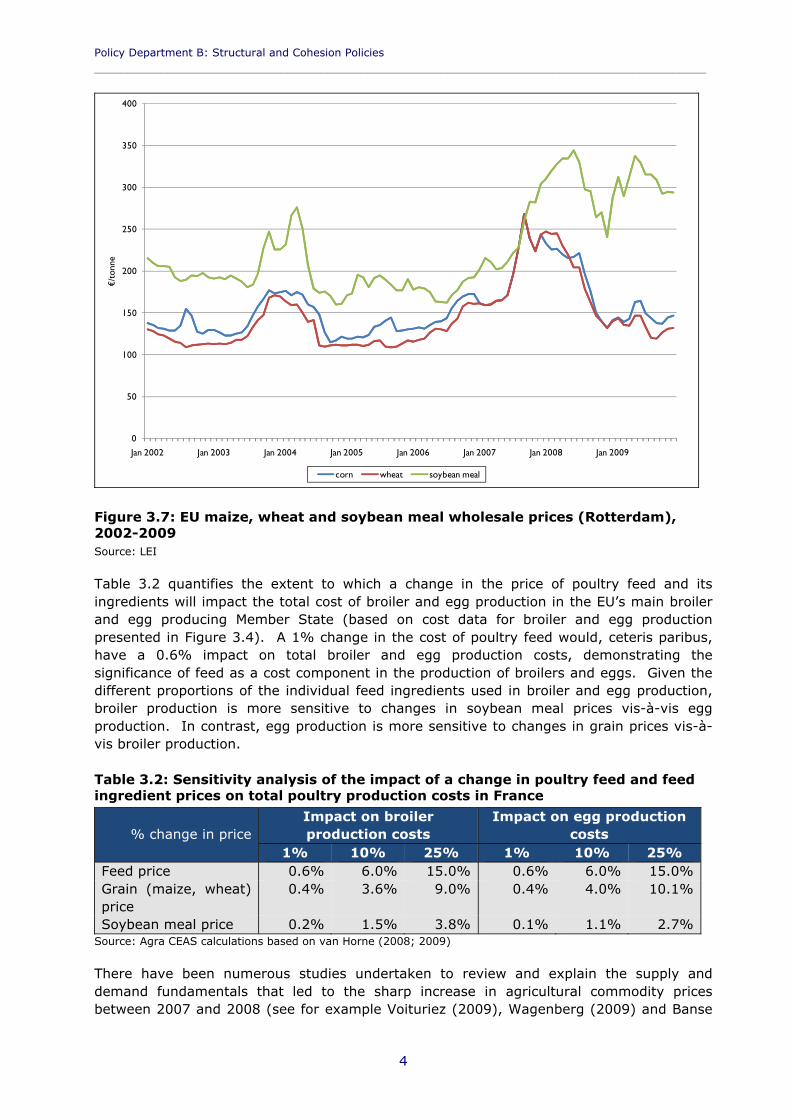
Policy Department B: Structural and Cohesion Policies____________________________________________________________________________________________
4
0
50
100
150
200
250
300
350
400
Jan 2002 Jan 2003 Jan 2004 Jan 2005 Jan 2006 Jan 2007 Jan 2008 Jan 2009
€/to
nne
corn wheat soybean meal
Figure 3.7: EU maize, wheat and soybean meal wholesale prices (Rotterdam), 2002-2009Source: LEI
Table 3.2 quantifies the extent to which a change in the price of poultry feed and its ingredients will impact the total cost of broiler and egg production in the EU’s main broiler and egg producing Member State (based on cost data for broiler and egg production presented in Figure 3.4). A 1% change in the cost of poultry feed would, ceteris paribus, have a 0.6% impact on total broiler and egg production costs, demonstrating the significance of feed as a cost component in the production of broilers and eggs. Given the different proportions of the individual feed ingredients used in broiler and egg production, broiler production is more sensitive to changes in soybean meal prices vis-à-vis egg production. In contrast, egg production is more sensitive to changes in grain prices vis-à-vis broiler production.
Table 3.2: Sensitivity analysis of the impact of a change in poultry feed and feed ingredient prices on total poultry production costs in France
% change in priceImpact on broiler production costs
Impact on egg production costs
1% 10% 25% 1% 10% 25%Feed price 0.6% 6.0% 15.0% 0.6% 6.0% 15.0%Grain (maize, wheat) price
0.4% 3.6% 9.0% 0.4% 4.0% 10.1%
Soybean meal price 0.2% 1.5% 3.8% 0.1% 1.1% 2.7%Source: Agra CEAS calculations based on van Horne (2008; 2009)
There have been numerous studies undertaken to review and explain the supply and demand fundamentals that led to the sharp increase in agricultural commodity prices between 2007 and 2008 (see for example Voituriez (2009), Wagenberg (2009) and Banse
THE POULTRY AND EGG SECTORS: EVALUATION OF THE CURRENT MARKET SITUATION AND FUTURE PROSPECTS____________________________________________________________________________________________
5
et al (2008)). In general, the increase in agricultural commodity prices were caused by acombination of record low global inventory levels, weather induced lower supply, surging outside investor influence, record oil prices and structural changes in demand for grains and oilseeds due to changes in population dynamics and the development of the biofuels sector (Banse et al, 2008):
Effect on demand. On the demand side, urbanisation, economic growth, changing diets and expanding populations are driving increases in food and feed demand, particularly in developing countries. In Europe and Northern America demand for grains, for example, was constant with an increase in demand in Asia. Globally, and in absolute terms, food and feed remain the largest sources of demand growth in agriculture, although demand for agricultural commodities for use asfeedstocks by the biofuel sector (e.g. wheat and maize for bioethanol production and soybean oil for biodiesel production) represents the largest source of new demand to underpin prices (OECD and FAO, 2008).
Effect on supply. On the supply side, the increase in agricultural commodity prices were caused in part by weather induced lower supply and record low global agricultural inventory levels, which meant that the shortfall in demand could not be met thereby driving up prices. This also resulted in a certain degree of market speculation, with some countries taking protective policy measures designed to keep supply within domestic markets and discouraging exports. In addition, higher oil prices were transmitted along the supply chain to higher grain prices as production costs (e.g. fertiliser and transport) increased accordingly.
3.2.5. Analysis of energy costs
Figure 3.8 provides an overview of the long-term price development of crude oil, which is highly correlated to energy prices in general. Between 2007 and 2008, the price of crude oil (US$ per barrel) increased threefold.
Although the cost of energy accounts for a relatively small proportion of total production costs (less than 4%), the extent of the recent volatility in energy markets has had a proportional impact on the overall cost of broiler and egg production. Energy is used to heat poultry houses and electricity is mainly used for the running of feeding equipment and ventilation fans. As discussed and presented previously in Figure 3.4 above, more energy is used in broiler production than egg production, with the total energy input (heating plus electricity) accounting for 3% to 4% of the total production cost for broiler production and 1% to 2% for egg production. Hence, broiler production is more sensitive to changes in energy prices vis-à-vis egg production.
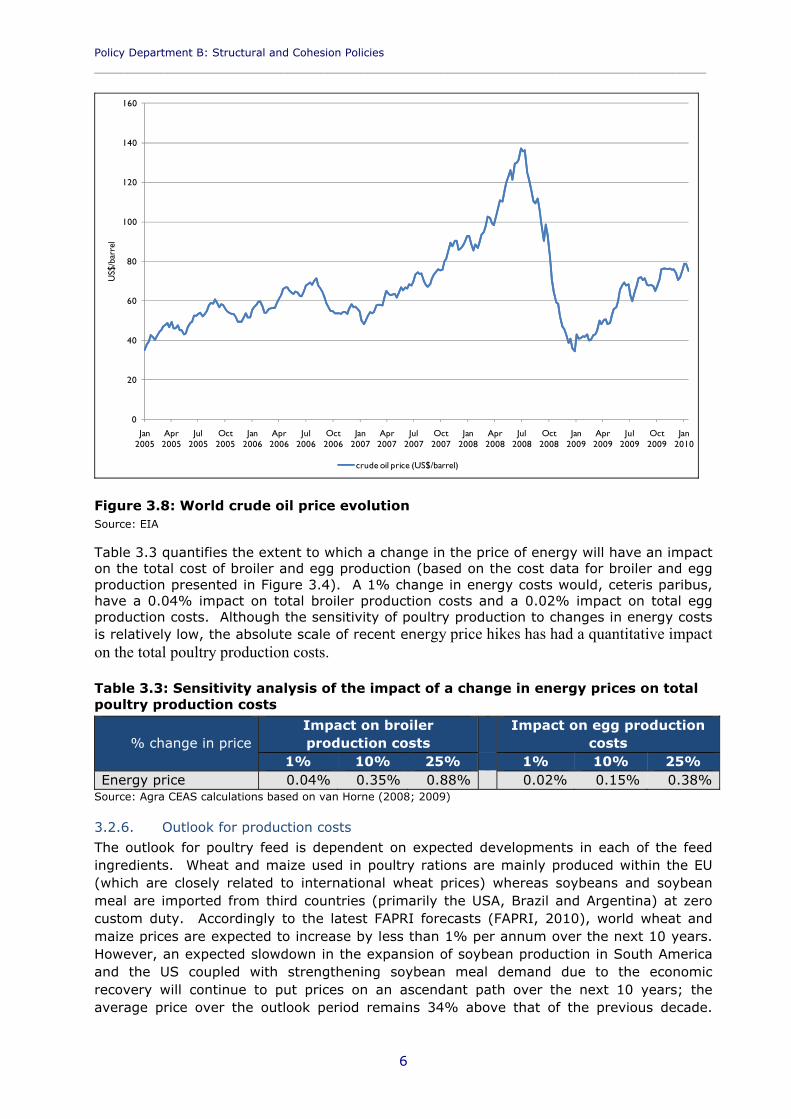
Policy Department B: Structural and Cohesion Policies____________________________________________________________________________________________
6
0
20
40
60
80
100
120
140
160
Jan 2005
Apr 2005
Jul 2005
Oct 2005
Jan 2006
Apr 2006
Jul 2006
Oct 2006
Jan 2007
Apr 2007
Jul 2007
Oct 2007
Jan 2008
Apr 2008
Jul 2008
Oct 2008
Jan 2009
Apr 2009
Jul 2009
Oct 2009
Jan 2010
US$
/bar
rel
crude oil price (US$/barrel)
Figure 3.8: World crude oil price evolutionSource: EIA
Table 3.3 quantifies the extent to which a change in the price of energy will have an impact on the total cost of broiler and egg production (based on the cost data for broiler and egg production presented in Figure 3.4). A 1% change in energy costs would, ceteris paribus, have a 0.04% impact on total broiler production costs and a 0.02% impact on total egg production costs. Although the sensitivity of poultry production to changes in energy costs is relatively low, the absolute scale of recent energy price hikes has had a quantitative impact on the total poultry production costs.
Table 3.3: Sensitivity analysis of the impact of a change in energy prices on total poultry production costs
% change in priceImpact on broiler production costs
Impact on egg production costs
1% 10% 25% 1% 10% 25%Energy price 0.04% 0.35% 0.88% 0.02% 0.15% 0.38%
Source: Agra CEAS calculations based on van Horne (2008; 2009)
3.2.6. Outlook for production costs
The outlook for poultry feed is dependent on expected developments in each of the feed ingredients. Wheat and maize used in poultry rations are mainly produced within the EU (which are closely related to international wheat prices) whereas soybeans and soybean meal are imported from third countries (primarily the USA, Brazil and Argentina) at zero custom duty. Accordingly to the latest FAPRI forecasts (FAPRI, 2010), world wheat and maize prices are expected to increase by less than 1% per annum over the next 10 years. However, an expected slowdown in the expansion of soybean production in South America and the US coupled with strengthening soybean meal demand due to the economic recovery will continue to put prices on an ascendant path over the next 10 years; the average price over the outlook period remains 34% above that of the previous decade.
THE POULTRY AND EGG SECTORS: EVALUATION OF THE CURRENT MARKET SITUATION AND FUTURE PROSPECTS____________________________________________________________________________________________
7
These projections are of course highly dependent future exchange rate evolution as well as the economic and political assumptions used to generate the forecasts.
In general, it is expected that commodity prices will be more volatile than they have been historically. With increased use of agricultural commodities as feedstocks for biofuel production, commodity prices are increasingly expected to track prices in the more volatile energy markets, which according to the latest EIA projections are themselves expected to rise to in excess of US$100 per barrel by 2020.
However, there is still a large differential between the cost of poultry feed in the EU and in key world poultry meat and egg producing countries. This cost differential is mainly the result of increased EU regulations and legislation primarily concerned with increasing food safety (e.g. prohibition of the use of antimicrobial growth stimulators and meat-and-bone meal in poultry feed and the increased use of GM feed ingredients in such third countries that are not authorised for use in the EU). This puts EU poultry meat and egg production at a significant cost disadvantage to key non-EU poultry meat and egg producing countries. Thus, the extent to which EU broiler and egg feed costs will remain higher than key third country producers going forward will depend on the continuation of such EU regulations and legislation, which will be further impacted by the evolution of exchange rates.


THE POULTRY AND EGG SECTORS: EVALUATION OF THE CURRENT MARKET SITUATION AND FUTURE PROSPECTS____________________________________________________________________________________________
3
4. IMPACT OF ANIMAL WELFARE LEGISLATION IN THE POULTRY AND EGG SECTORS
4.1. Background
According to interviewees, the EU was and remains a leader in animal welfare, having adopted the first piece of legislation over 30 years ago. Competence for animal welfare was previously derived from Article 37 of the amended Treaty of Rome, and animals were recognised as sentient beings in a protocol in an annex to the Treaty of Amsterdam. Following the Treaty of Lisbon, Article 13 of the Treaty on the Functioning of the European Union recognises animals as sentient beings, and states that agricultural legislation must take this into account.
Evidence from Eurobarometer (2007a) implies that animal welfare is an important topic for EU citizens. On average, EU-25 citizens rated the importance of animal welfare as 7.8 out of 10. Various other Eurobarometer findings corroborate the fact that animal welfare is considered important by citizens and consumers.
According to one interviewee, animal welfare is an integrated part of the food chain. Animal welfare is a scientific issue, and policy actions are based on both scientific evidence and an impact assessment analysing the socio-economic implications; EFSA is now responsible for the scientific side (previously there was a scientific committee). If the welfare of animals is improved, there is an improvement in productivity and the quality of meat (though the magnitude of the improvement depends on the starting point).
4.2. Legislation
Table 4.1 outlines animal welfare legislation relevant to broilers and/or laying hens. The most important horizontal pieces of legislation as:
Council Directive 98/58/EC of 20 July 1998 concerning the protection of animals kept for farming purposes
Council Regulation (EC) No 1/2005 of 22 December 2004, on the protection of animals during transport and related operations
Council Directive 93/119/EC of 22 December 1993 on the protection of animals at the time of slaughter or killing (which will be replaced with Council Regulation (EC) No 1099/2009 from 2013)
An additional relevant piece of legislation (not listed in the table) is Regulation (EC) no 882/2004 on official controls performed to ensure the verification of compliance with feed and food law, animal health and animal welfare rules.


THE POULTRY AND EGG SECTORS: EVALUATION OF THE CURRENT MARKET SITUATION AND FUTURE PROSPECTS____________________________________________________________________________________________
3
Table 4.1: Current European legislation on animal welfare relevant for egg and poultry sectors
Legislation TopicAll farm species
Council decision 78/923/EEC European Convention for the protection of animals kept for farming purposes
Council Directive 98/58/EC The protection of animals kept for farming purposes
Commission Decision 2006/778/EC
Amending Decision 2000/50/EC concerning minimum requirements for the collection of information during the inspections of production sites on which certain animals are kept for farming purposes
General overview
Commission working document of 23January 2006
Community action plan for protection and welfare of animals 2006-2010
Broilers Council Directive 2007/43 Minimum rules for the protection of chickens kept for meat production
Laying hens Council Regulation (EC) no 1028/2006
Marketing standards for eggs
Commission Regulation (EC) no 557/2007
Laying down detailed rules for implementing Council Regulation (EC) no 1028/2006 23 May 2007 on marketing standards for eggs
Commission Directive 2002/4/EC Registration of establishments keeping laying hens
Protection during transport
Council Regulation (EC) 1255/97 Community criteria for staging points and amending the route plan referred to in Annex to Directive 91/628/EEC
Council Decision 2004/544/EC European Convention for the protection of animals during International Transport
Council Regulation (EC) 1/2005 Protection of animals during transport and related operations (amending Directives 64/432/EEC and 93/119/EC and Regulation (EC) No 1255/97)
Protection at the time of slaughter and killing
Council Decision 88/306/EEC European Convention for the protection of animals for slaughter
Council Directive 93/119/EC Protection of animals at the time of slaughter or killing
Council Regulation (EC) No 1099/2009
Protection of animals at the time of slaughter or killing (applicable from 2013)
Source: DG SANCO website9
9 http://ec.europa.eu/food/animal/welfare/references_en.htm
Policy Department B: Structural and Cohesion Policies____________________________________________________________________________________________
4
For both poultry production and laying hens since the 1990s the EU has developed a more detailed legislative framework on animal welfare (as indicated in Error! Reference source not found.Table 5.1 above). This is briefly described in the following sub-sections.
4.2.1. Chickens kept for meat production
For chickens kept for meat production the main animal welfare legislation is contained in Council Directive 2007/43 of 28 June 2007 laying down minimum rules for the protection of chickens kept for meat production (OJ L 182, 12.7.2007 p. 0019-0028). This sets out chicken production standards although it should be noted that Member States do not have to implement the Directive until July 2010. The Directive applies to holdings with more than 500 chickens for meat production, but does not apply to extensive indoor, free-range or organic production. The main standards which must be met are:
Stocking density: this is set to a maximum of 33kg per square metre. If certain criteria relating to environmental control are met, and the authorities are informed in advance, the stocking density can reach 39kg per square metre. With the fulfilment of further criteria, chiefly connected to the historical performance of the holding, stocking density can reach 42kg per square metre.
Lighting: a minimum intensity of 20 lux during the lighting periods, illuminating at least 80% of the useable area. A temporary reduction in the lighting level may be allowed when necessary following veterinary advice.
There are also further requirements relating to factors such as heating, and feed and water availability.
However, due to the July 2010 implementation deadline, it should be noted that Member States may currently have production standards below those outlined above.
The objective of the directive is to avoid competition distorting differences in production standards and assure a smooth running of the organization of the common market in chicken meat. As the Directive has not yet been implemented there have as yet been no impacts on production and it should be noted that the sector concerned has not expressed concerns about the impact of the Directive.
4.2.2. Laying hens
In respect of laying hens the main legislation relating to animal welfare is Council Directive 1999/74/EC of 19 July 1999 laying down minimum standards for the protection of laying hens (Official Journal L 203, 03/08/1999 p. 0053 – 0057 and outlines in particular provisions applicable to unenriched and enriched cage systems and alternative (non-cage) systems. The Directive provides that the rearing of laying hens in unenriched cage systems will be prohibited with effect from 1 January 2012. The Directive mandated the Commission to submit to the Council a report based on a scientific opinion on the various systems of rearing laying hens taking into account pathological, zootechnical, physiological and ethological aspects as well as environmental and health impacts. The report was also to be based on a study of the socio-economic implications of the various systems and their effects on the Community’s economic partners. The Directive is complemented by
THE POULTRY AND EGG SECTORS: EVALUATION OF THE CURRENT MARKET SITUATION AND FUTURE PROSPECTS____________________________________________________________________________________________
5
legislation on the registration of establishments keeping laying hens10 and on the labelling of eggs11 as well as on food safety aspects12.The Commission duly produced its report on the impact of these aspects in January 200813 and in particular concluded that there was no reason to consider amending the Directive and thereby delaying the implementation of the Directive beyond the date foreseen.
4.2.3. EU welfare legislation and third country imports
One interviewee stated that EU animal welfare legislation applies only to production in the EU, with the exception of slaughtering. In the case of slaughtering, meat imported into the EU must be accompanied by a health certificate which certifies equivalency.
One interviewee noted that there were two reasons why animal welfare legislation is not imposed on third country imports: (1) animal welfare is not in SPS; (2) there is a wish to engage with third countries on the subject rather than to impose. The second issue originates from the 2006-2010 Community Action Plan for Animal Welfare. One of the stated aims of this Plan is to promote and share understanding on animal welfare issues globally, and the Commission is working to promote better understanding of animal welfare, and the link between animal welfare and other key values such as animal health, food safety, food quality and food security.
According to the same interviewee, Chile is an example of successful engagement with third countries on this issue. Animal welfare was included in the SPS agreement with Chile in 2004, and at the end of 2009 the country adopted its first animal welfare law. Animal welfare was also included in the bilateral agreements with Canada and South Korea; the EU has a co-operation forum on animal welfare with New Zealand and Australia; and there is technical co-operation and information exchange with some countries in Asia, Africa and Latin America. There is also some work being undertaken on animal welfare through the Better Training for Safer Food programme; for example, Thailand has requested a specific expert meeting on the welfare of poultry.
On an international level, there is a lack of clarity as to whether animal welfare is within the scope of the WTO. As noted above, it is not within SPS. According to one interviewee, in the case of the EU it may be possible to introduce the animal welfare requirement under Article 20 of GATT (as “public morals” within technical barriers to trade); however this would go against the EU desire to engage with third countries rather than impose.
As a final note, evidence from Eurobarometer (2007a) suggests that citizens want third country production to respect EU animal welfare standards. When asked if imported foods should respect.the same conditions/standards of animal welfare and protection as food produced inside the EU, 66% replied “Yes, certainly” and 23% replied “Yes, probably”.
10 Commission Directive 2002/4/EC of 30 January 2002 on the registration of establishments keeping laying hens, covered by Council Directive 1999/74/EC Official Journal L 30 , 31/01/2002 p. 0044 – 004611 Council Regulation (EC) no 1028/2006 of 19 June 2006 on marketing standards for eggs (OJ L 186, 7.7.2006 p. 0001-0005) and Commission Regulation (EC) no 557/2007 laying down detailed rules for implementing Council Regulation (EC) no 1028/2006 23 May 2007 on marketing standards for eggs (OJ L 132 24.5.2007 p. 0005-0020)12 Regulation (EC) No 852/2004 of the European Parliament and of the Council on the hygiene of foodstuffs (OJ L 139, 30.4.2004, p. 1) and Regulation (EC) No 853/2004 of the European Parliament and of the Council laying down specific hygiene rules for food of animal origin (OJ L 139, 30.4.2004,p. 55)13 Communication from the Commission to the European Parliament and the Council on the various systems of rearing laying hens in particular those covered by Directive 1999/74/EC Brussels, 8.01.2008, COM(2007) 865 final
Policy Department B: Structural and Cohesion Policies____________________________________________________________________________________________
6
4.3. Animal welfare legislation in third countries
In third countries there is currently no welfare legislation on laying hens and chicken meat production in place at all except in Norway and Switzerland and more recently Chile. While the US Animal Care Certified Programme does propose space requirements of 750 cm3 in enriched cages and 489 cm3 in battery cages these limits are voluntary and the scheme does not cover whole industry. California has proposed to ban cages by 2015. One interviewee believed that Chile had passed an animal welfare law in 2009, and that Brazil had started working on animal welfare issues (motivated by the productivity benefits and by business opportunities) through the establishment of a committee in the Ministry of Agriculture.
According to one interviewee, there is some work on animal welfare being done at an international level. The OIE is working on international standards to be democratically adopted by the 175 member countries. There is an internationally recognised methodology for risk assessment in the fields of animal health (developed by the OIE) and food safety (developed by Codex Alimentarius), though no such methodology has yet been developed for animal welfare. The FAO has also started work on capacity building for the implementation of good animal welfare practices against the background of increased productivity, and hence food security, in developing countries.
In Brazil, layers are kept in conventional cages with a space allowance of 300 to 400 cm2
per hen. Similarly for Argentina a survey in 2009 showed that the average space allowance was 372 cm2 per hen. Global information on India indicates a similar space allowance for this country. Between countries, regions and farms the density can change due to expected market prices (high density when high egg prices are expected), climate (lower density in hot areas) and housing systems (open or climate controlled houses). American literature shows that purely from an economic point of view 300 to 400 cm2 per hen gives the highest income for the poultry farmer (Bell, 2000). In Appendix 1 some additional information is given on the egg industry and the situation on animal welfare in the USA, Brazil, Argentina and India.
4.4. Advantages and disadvantages of EU animal welfare legislation
Interviewees identified a number of advantages and disadvantages of animal welfare legislation. These are outlined below.
4.4.1. Advantages
Advantages were generally perceived to be linked to the issue of meeting consumer expectations and confidence. As noted in section REF, animal welfare is considered an important topic by EU-25 citizens according to Eurobarometer (2007a). Evidence from Eurobarometer (2007a and 2007b) also suggests that EU consumers are willing to pay more for products produced with higher animal welfare standards. For example, 25% of respondents indicated they were willing to pay a 5% premium for eggs from an animal welfare friendly system, and a further 32% were willing to pay a premium of 10% of more although in practice those willing to actually do so may be lower as is evidenced by the market share of such products.
However, one interviewee believed that producers can only obtain premia from voluntary schemes which have higher standards than the minimum. Two pieces of evidence corroborate this. Firstly, according to Eurobarometer (2007a), 56% of respondents believed that current labelling did not allow consumers to find products sourced from animal welfare friendly production systems (34% believed it did, and the remainder

THE POULTRY AND EGG SECTORS: EVALUATION OF THE CURRENT MARKET SITUATION AND FUTURE PROSPECTS____________________________________________________________________________________________
7
answered they did not know). Secondly, the Commission has recently completed a report exploring options for animal welfare labelling. The background to the report is that animal welfare labelling may make it easier for consumers to identify animal welfare friendly products, and for producers to have an economic incentive to improve animal welfare.
Finally, one interviewee identified a benefit outside the area of consumer expectations and confidence. The interviewee believed that better animal welfare leads to higher productivity.
4.4.2. Disadvantages
The disadvantage of animal welfare was considered to be its impact on EU producers vis-à-vis third country producers. This is explored in detail in Section 4.5.
4.5. Impact of EU animal welfare legislation vis-à-vis third country production
The cost of compliance with animal welfare measures will depend on the type of production system being used prior to any change. Changes will occur in production in order to implement the standards: change production facilities and/or practices (e.g. provide more room and/or freedom of movement); measures to protect animal health; increase labour inputs; training of staff.
The level of these costs will also depend on several factors: existing production methods; required animal welfare standards; nature of supply chain; compliance period; access to and cost of compliance resources; and access to and cost of certification.
These changes may reduce production costs (e.g. by reducing rates of death and disease, reducing input requirements or alternatively increase costs (by increasing space and care requirements) or they may be cost-neutral.
As has been highlighted above, the particular welfare legislation relating to production of chicken meat has not as yet been implemented and has therefore had no impact to date. It is also not expected to have a significant impact in future as other factors weigh more significantly in this regard. This section therefore focuses on the impact of EU welfare legislation on egg production costs and the competitive position in the EU compared to third countries.
4.5.1. Potential impact on egg production costs of EU Directive 99/74/EC
In June 1999 the European Agricultural Council decided that, after a transition period, laying hens would be housed exclusively in so-called enriched cages or in alternative (non-cage) systems. The enriched cage gives each hen 750 cm2 surface area, increased height, a perch, a nest box and litter. The alternative system described in the EU Directive most resembles the aviary system. Each hen has 1,100 cm2 living space, (part of) the surface area of the pen is covered with litter and in the pen there are enough nest boxes and perches for the animals. In 2012 two different housing systems can be distinguished:
Enriched cages. In comparison to conventional battery cages the group size is enlarged. The cage is complete with a nest box, perch and litter according to EU standards.
Aviary systems. This system is based on floor accommodation (comparable to barn housing) whereby via levels the hens can also use the vertical space in the house. An amendment to the EU egg marketing regulations allows eggs from an aviary system to be marketed as barn eggs.
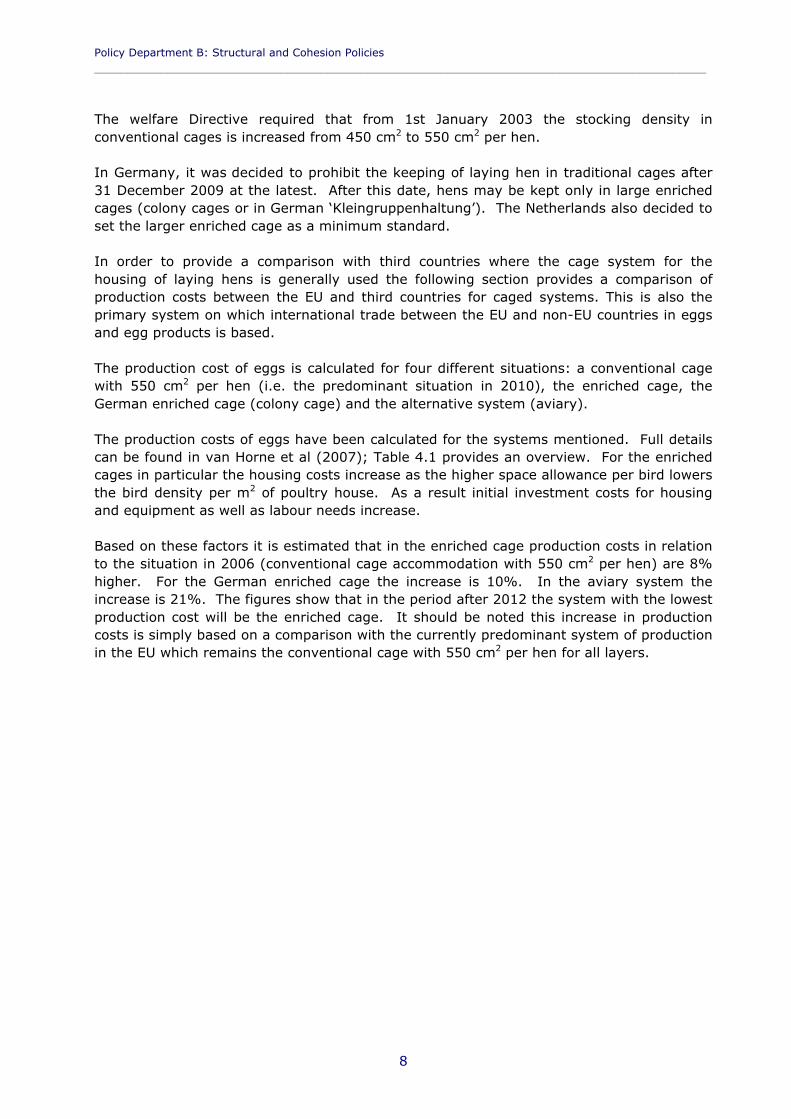
Policy Department B: Structural and Cohesion Policies____________________________________________________________________________________________
8
The welfare Directive required that from 1st January 2003 the stocking density in conventional cages is increased from 450 cm2 to 550 cm2 per hen.
In Germany, it was decided to prohibit the keeping of laying hen in traditional cages after 31 December 2009 at the latest. After this date, hens may be kept only in large enriched cages (colony cages or in German ‘Kleingruppenhaltung’). The Netherlands also decided to set the larger enriched cage as a minimum standard.
In order to provide a comparison with third countries where the cage system for the housing of laying hens is generally used the following section provides a comparison of production costs between the EU and third countries for caged systems. This is also the primary system on which international trade between the EU and non-EU countries in eggs and egg products is based.
The production cost of eggs is calculated for four different situations: a conventional cage with 550 cm2 per hen (i.e. the predominant situation in 2010), the enriched cage, the German enriched cage (colony cage) and the alternative system (aviary).
The production costs of eggs have been calculated for the systems mentioned. Full details can be found in van Horne et al (2007); Table 4.1 provides an overview. For the enriched cages in particular the housing costs increase as the higher space allowance per bird lowers the bird density per m2 of poultry house. As a result initial investment costs for housing and equipment as well as labour needs increase.
Based on these factors it is estimated that in the enriched cage production costs in relation to the situation in 2006 (conventional cage accommodation with 550 cm2 per hen) are 8% higher. For the German enriched cage the increase is 10%. In the aviary system the increase is 21%. The figures show that in the period after 2012 the system with the lowest production cost will be the enriched cage. It should be noted this increase in production costs is simply based on a comparison with the currently predominant system of production in the EU which remains the conventional cage with 550 cm2 per hen for all layers.
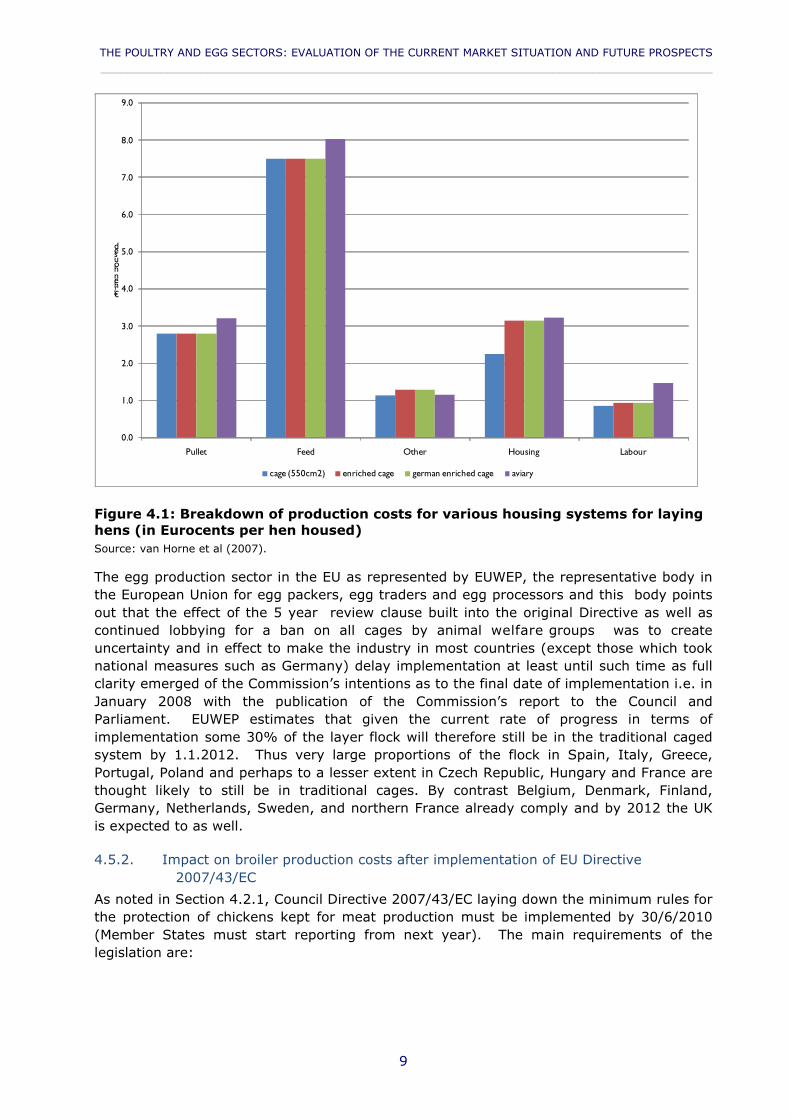
THE POULTRY AND EGG SECTORS: EVALUATION OF THE CURRENT MARKET SITUATION AND FUTURE PROSPECTS____________________________________________________________________________________________
9
0.0
1.0
2.0
3.0
4.0
5.0
6.0
7.0
8.0
9.0
Pullet Feed Other Housing Labour
€/henhoused
cage (550cm2) enriched cage german enriched cage aviary
Figure 4.1: Breakdown of production costs for various housing systems for laying hens (in Eurocents per hen housed)Source: van Horne et al (2007).
The egg production sector in the EU as represented by EUWEP, the representative body in the European Union for egg packers, egg traders and egg processors and this body points out that the effect of the 5 year review clause built into the original Directive as well as continued lobbying for a ban on all cages by animal welfare groups was to create uncertainty and in effect to make the industry in most countries (except those which took national measures such as Germany) delay implementation at least until such time as full clarity emerged of the Commission’s intentions as to the final date of implementation i.e. in January 2008 with the publication of the Commission’s report to the Council and Parliament. EUWEP estimates that given the current rate of progress in terms of implementation some 30% of the layer flock will therefore still be in the traditional caged system by 1.1.2012. Thus very large proportions of the flock in Spain, Italy, Greece, Portugal, Poland and perhaps to a lesser extent in Czech Republic, Hungary and France are thought likely to still be in traditional cages. By contrast Belgium, Denmark, Finland, Germany, Netherlands, Sweden, and northern France already comply and by 2012 the UK is expected to as well.
4.5.2. Impact on broiler production costs after implementation of EU Directive 2007/43/EC
As noted in Section 4.2.1, Council Directive 2007/43/EC laying down the minimum rules for the protection of chickens kept for meat production must be implemented by 30/6/2010 (Member States must start reporting from next year). The main requirements of the legislation are:
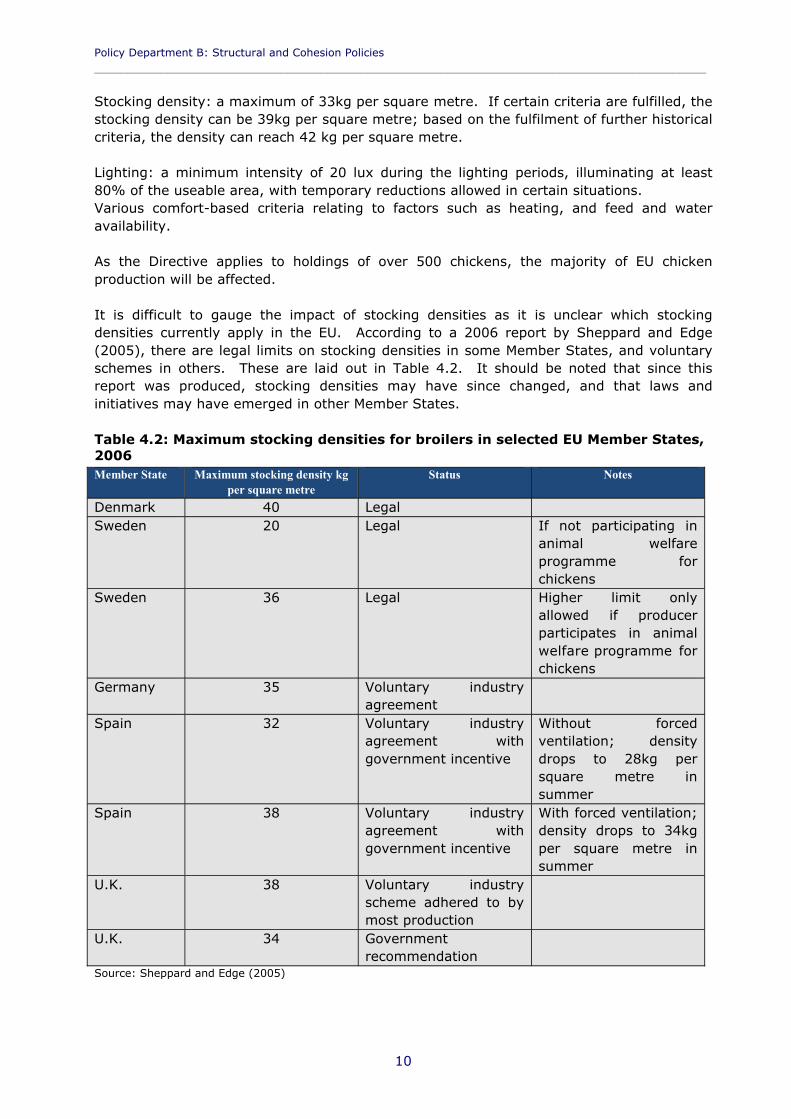
Policy Department B: Structural and Cohesion Policies____________________________________________________________________________________________
10
Stocking density: a maximum of 33kg per square metre. If certain criteria are fulfilled, the stocking density can be 39kg per square metre; based on the fulfilment of further historical criteria, the density can reach 42 kg per square metre.
Lighting: a minimum intensity of 20 lux during the lighting periods, illuminating at least 80% of the useable area, with temporary reductions allowed in certain situations.Various comfort-based criteria relating to factors such as heating, and feed and water availability.
As the Directive applies to holdings of over 500 chickens, the majority of EU chicken production will be affected.
It is difficult to gauge the impact of stocking densities as it is unclear which stocking densities currently apply in the EU. According to a 2006 report by Sheppard and Edge (2005), there are legal limits on stocking densities in some Member States, and voluntary schemes in others. These are laid out in Table 4.2. It should be noted that since this report was produced, stocking densities may have since changed, and that laws and initiatives may have emerged in other Member States.
Table 4.2: Maximum stocking densities for broilers in selected EU Member States, 2006Member State Maximum stocking density kg
per square metreStatus Notes
Denmark 40 LegalSweden 20 Legal If not participating in
animal welfare programme for chickens
Sweden 36 Legal Higher limit only allowed if producer participates in animal welfare programme for chickens
Germany 35 Voluntary industry agreement
Spain 32 Voluntary industry agreement with government incentive
Without forced ventilation; density drops to 28kg per square metre in summer
Spain 38 Voluntary industry agreement with government incentive
With forced ventilation; density drops to 34kg per square metre in summer
U.K. 38 Voluntary industry scheme adhered to by most production
U.K. 34 Government recommendation
Source: Sheppard and Edge (2005)

THE POULTRY AND EGG SECTORS: EVALUATION OF THE CURRENT MARKET SITUATION AND FUTURE PROSPECTS____________________________________________________________________________________________
11
The University of Exeter (2006) study examined the effects of the density limits under the broiler directive proposal in the case of the UK. Of the producers who believed they would have to reduce their stocking density, 59% said they would rear fewer birds in the same house, 4% said they would increase the size of the house, and 37% said they would maintain the same flock size but build more houses to accommodate the flock. It was estimated that the capital cost of providing each new chick place could increase by up to £2 (25%) as a result of the stocking density change, though obviously this would be a one-off cost.
In terms of effects on production costs, the University of Exeter (2006) notes that chick, feed and vaccine costs will not change as a result of a decrease in stocking densities. However, building related costs such as depreciation, heating, electricity and maintenance will change, as will labour costs. The estimations for changes in total cost are in Table 4.3.
Table 4.3: Production costs at different stocking densities
Stocking density (kg per square metre)
Production costs (GBP) Index of production costs (42kg per square metre=100)
42 119.6 pence 100.038 122.0 pence 102.034 125.0 pence 104.530 128.9 pence 107.8
Notes: assumes production using crop thinningSource: University of Exeter
It is also very difficult to examine the effects of the lighting requirement on EU producers due to an even greater lack of data on current lighting levels across the EU. The 2006 study by the University of Exeter examined the effects of the lighting levels in the UK. It should be noted that at the time of the study, the lighting levels of the voluntary UK ACP were below those of the proposed directive. This has since changed, and the ACP scheme now requires lighting levels in line with the EU broiler directive. Nonetheless, findings from the study may provide some insight into the effects of lighting levels in other Member States. Evidence from the study regarding lighting levels employed in UK chicken houses was conflicting, and the study notes that this may be due to a lack of understanding of the lux concept by farmers. However, in summary, 1/3 of farmers interviewed for the study believed they were in line with the requirement of 20 lux over 80% of the area. A fair proportion of interviewed farmers believed that they could meet the 20 lux requirement with existing equipment. For those who provided estimates of the upgrade costs forequipment, these costs varied from £0.21 to £5.66 per square metre.
4.5.3. EU’s competitive position on the world egg market
4.5.3.1. Egg production costs in the EU and third countries
Outside the EU there only a limited number of countries play a role in trade in eggs and egg products. China is by far the largest producer worldwide with the United States ranking second. Currently only three third countries are authorised to sell shell eggs in the EU based on deemedequivalence of status on salmonella (Switzerland, Norway and Croatia). As none of these are significant egg producers the main items imported are egg products and the main exporters of egg products to the EU are the United States, Argentina and India.

Policy Department B: Structural and Cohesion Policies____________________________________________________________________________________________
12
To show the difference in production costs a comparison is made in Figure 4.2 between production cost in the EU (represented by the average of the Netherlands, France, Germany, Spain and Poland) and the United States, Brazil, Argentina and India.
In 2008 the production costs of eggs in these countries were estimated to be around 35% lower than in the EU. All four countries are so called “low-cost countries”. In 2008 India had the lowest production cost of the countries addressed here. It should, however, be noted that fluctuations in the exchange rates of the local currency mean there can be significant year on year changes in relative production costs (expressed in Euros). Thus, for example, in 2008 the US dollar was relatively weak compared to the Euro which gavethe United States egg sector an additional advantage on the export market in that year.
0.0
10.0
20.0
30.0
40.0
50.0
60.0
pullet feed other labour housing general
Centperkg
EU Argentina USA Brazil India
Figure 4.2: Production costs for eggs in the EU and selected third countries, 2008 (Eurocent per kg)Source: van Horne
More generally the lower production costs in the US can be largely explained by the low feed price (due to the favourable domestic supply of feed ingredients for animal feed) and by the favourable operating environment for producers. Production takes place on large, efficient farms where the hens are kept in relatively cheap facilities. Brazil and Argentina also have ample access to low cost domestic supplies of feed ingredients combined with low labour costs. Competitiveness is further enhanced by the fact the industries operate with much less restrictive welfare requirements (including the absence of legislation on beak trimming) and that they are able to use meat-and-bone meal in poultry feed.
4.5.3.2. Offer price of eggs and egg powder in Europe
While production costs are therefore lower in third countries this does not immediately translate into competitiveness on the EU market as this is to a degree protected by an import levy on eggs and the transportation costs for shipment of eggs and egg products to
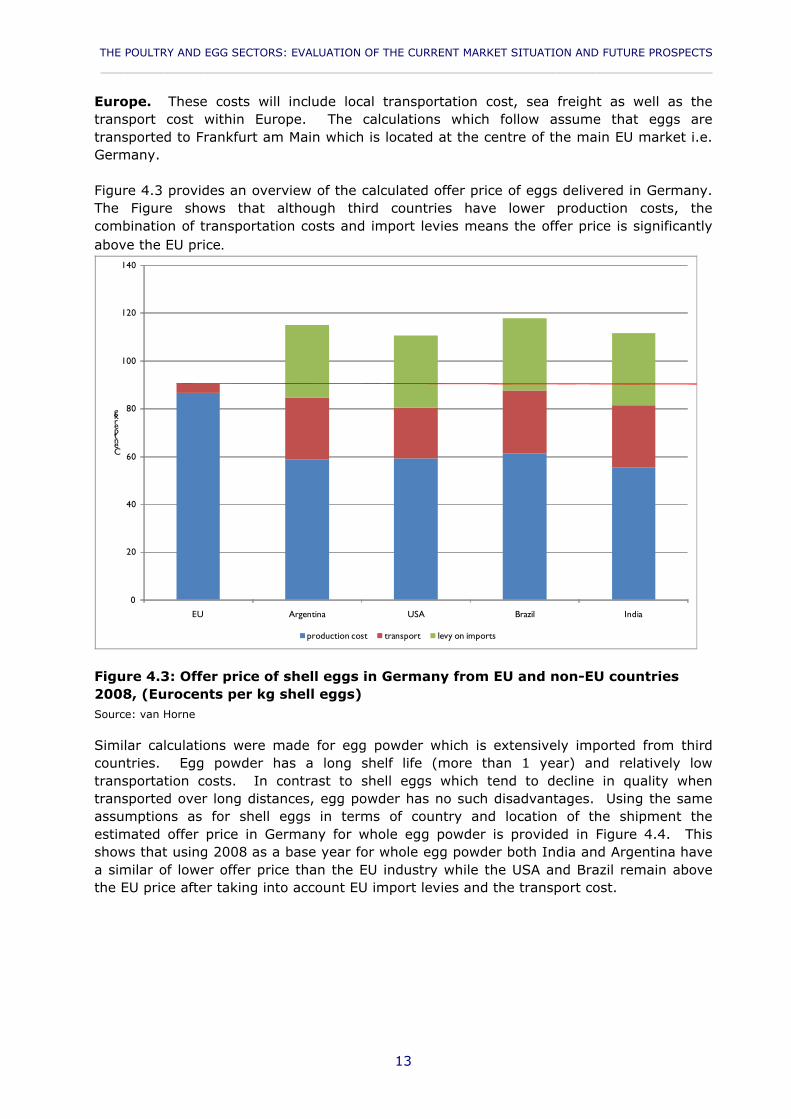
THE POULTRY AND EGG SECTORS: EVALUATION OF THE CURRENT MARKET SITUATION AND FUTURE PROSPECTS____________________________________________________________________________________________
13
Europe. These costs will include local transportation cost, sea freight as well as the transport cost within Europe. The calculations which follow assume that eggs are transported to Frankfurt am Main which is located at the centre of the main EU market i.e. Germany.
Figure 4.3 provides an overview of the calculated offer price of eggs delivered in Germany. The Figure shows that although third countries have lower production costs, the combination of transportation costs and import levies means the offer price is significantly above the EU price.
0
20
40
60
80
100
120
140
EU Argentina USA Brazil India
Centperkg
production cost transport levy on imports
Figure 4.3: Offer price of shell eggs in Germany from EU and non-EU countries 2008, (Eurocents per kg shell eggs) Source: van Horne
Similar calculations were made for egg powder which is extensively imported from third countries. Egg powder has a long shelf life (more than 1 year) and relatively low transportation costs. In contrast to shell eggs which tend to decline in quality when transported over long distances, egg powder has no such disadvantages. Using the same assumptions as for shell eggs in terms of country and location of the shipment the estimated offer price in Germany for whole egg powder is provided in Figure 4.4. This shows that using 2008 as a base year for whole egg powder both India and Argentina have a similar of lower offer price than the EU industry while the USA and Brazil remain above the EU price after taking into account EU import levies and the transport cost.
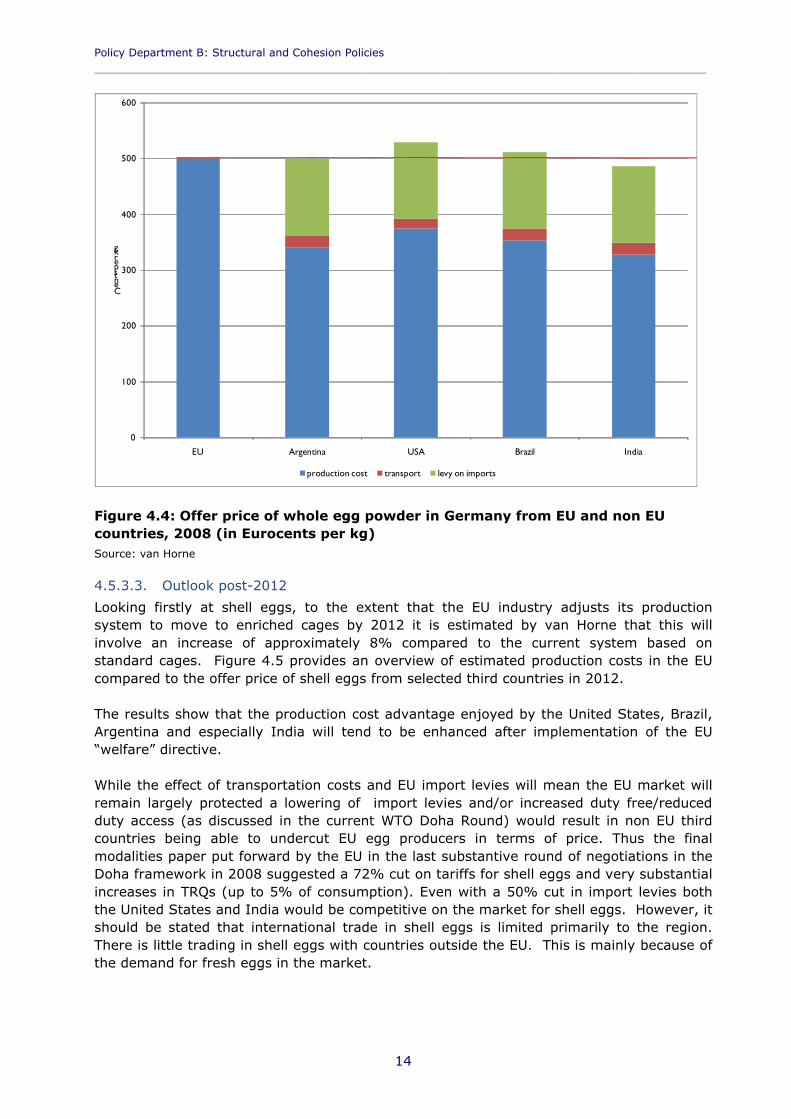
Policy Department B: Structural and Cohesion Policies____________________________________________________________________________________________
14
0
100
200
300
400
500
600
EU Argentina USA Brazil India
Centsperkg
production cost transport levy on imports
Figure 4.4: Offer price of whole egg powder in Germany from EU and non EU countries, 2008 (in Eurocents per kg) Source: van Horne
4.5.3.3. Outlook post-2012
Looking firstly at shell eggs, to the extent that the EU industry adjusts its production system to move to enriched cages by 2012 it is estimated by van Horne that this will involve an increase of approximately 8% compared to the current system based on standard cages. Figure 4.5 provides an overview of estimated production costs in the EU compared to the offer price of shell eggs from selected third countries in 2012.
The results show that the production cost advantage enjoyed by the United States, Brazil, Argentina and especially India will tend to be enhanced after implementation of the EU “welfare” directive.
While the effect of transportation costs and EU import levies will mean the EU market will remain largely protected a lowering of import levies and/or increased duty free/reduced duty access (as discussed in the current WTO Doha Round) would result in non EU third countries being able to undercut EU egg producers in terms of price. Thus the final modalities paper put forward by the EU in the last substantive round of negotiations in the Doha framework in 2008 suggested a 72% cut on tariffs for shell eggs and very substantial increases in TRQs (up to 5% of consumption). Even with a 50% cut in import levies both the United States and India would be competitive on the market for shell eggs. However, it should be stated that international trade in shell eggs is limited primarily to the region. There is little trading in shell eggs with countries outside the EU. This is mainly because of the demand for fresh eggs in the market.
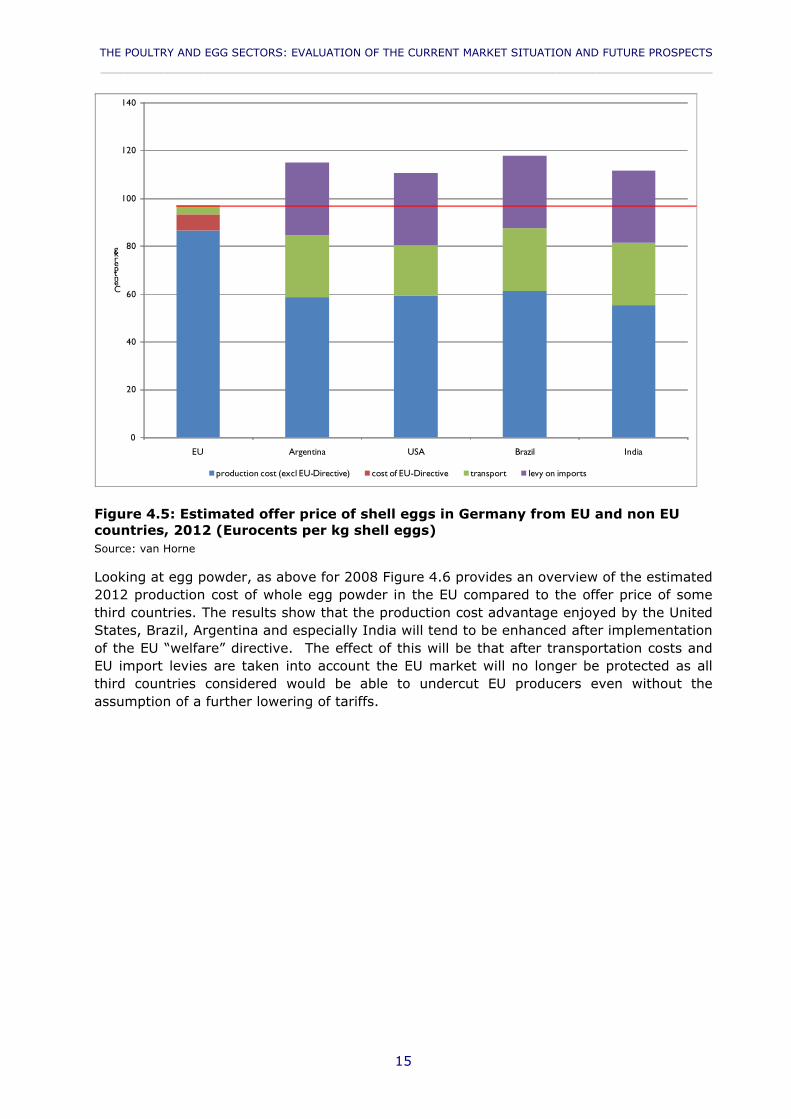
THE POULTRY AND EGG SECTORS: EVALUATION OF THE CURRENT MARKET SITUATION AND FUTURE PROSPECTS____________________________________________________________________________________________
15
0
20
40
60
80
100
120
140
EU Argentina USA Brazil India
Centperkg
production cost (excl EU-Directive) cost of EU-Directive transport levy on imports
Figure 4.5: Estimated offer price of shell eggs in Germany from EU and non EU countries, 2012 (Eurocents per kg shell eggs) Source: van Horne
Looking at egg powder, as above for 2008 Figure 4.6 provides an overview of the estimated 2012 production cost of whole egg powder in the EU compared to the offer price of some third countries. The results show that the production cost advantage enjoyed by the United States, Brazil, Argentina and especially India will tend to be enhanced after implementation of the EU “welfare” directive. The effect of this will be that after transportation costs and EU import levies are taken into account the EU market will no longer be protected as all third countries considered would be able to undercut EU producers even without the assumption of a further lowering of tariffs.

Policy Department B: Structural and Cohesion Policies____________________________________________________________________________________________
16
-
100
200
300
400
500
600
EU Argentina USA Brazil India
Centsperkg
production cost (excl EU-Directive) cost of EU-Directive transport levy on imports
Figure 4.6: Estimated offer price of whole egg powder in EU (average of selected countries) and selected third countries, 2012, (in Eurocents per kilogram) Source: van Horne
Two further scenarios assuming a further lowering of tariffs were calculated for egg powder.
The first scenario assumes a 50% reduction in tariffs and the results are presented in Figure 4.7.
The second scenario assumes that the value of the Euro increases by 10% vis-à-vis the third countries under review14. The results are presented in Figure 4.8.
As would be expected the results provided under these scenarios as shown in Figure 4.7and Figure 4.8 illustrate that in a situation with lower import levies or a changed exchange rate (with a stronger euro compared to other currencies) the offer price of egg powder from non-EU countries falls significantly below the EU level.
14 In 2009 the value of the euro did in fact increase in value compared to the currencies of Argentina, India and Brazil
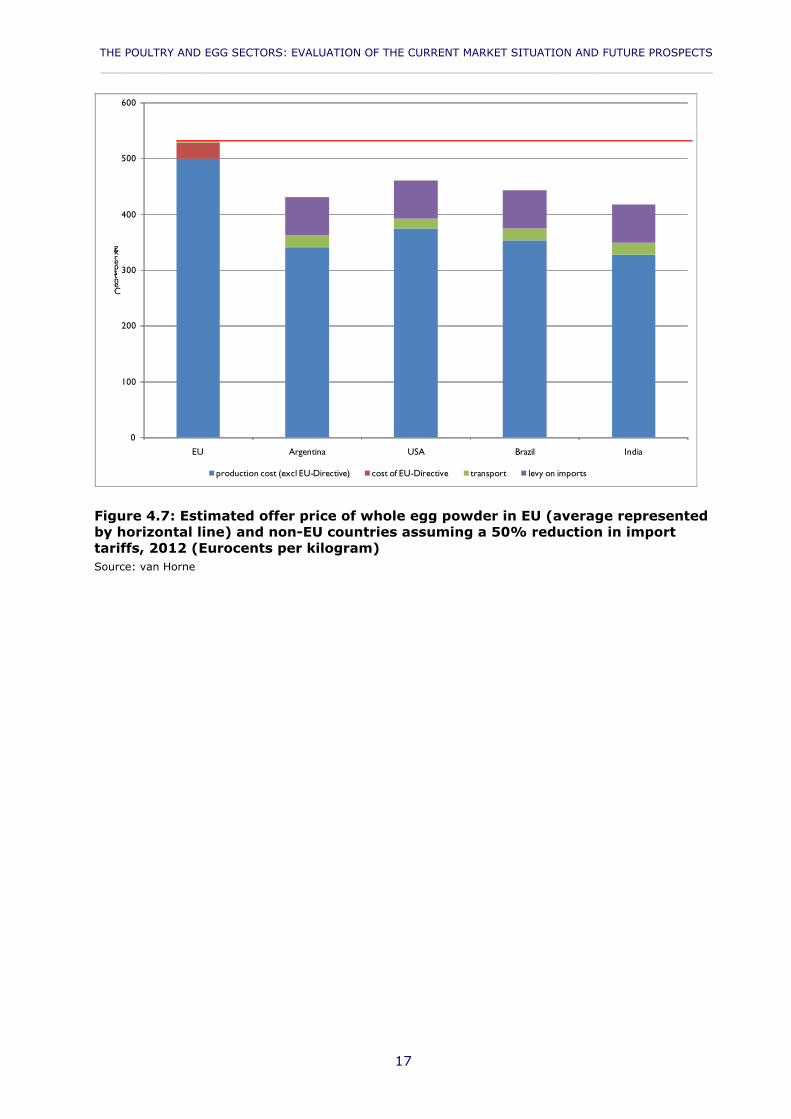
THE POULTRY AND EGG SECTORS: EVALUATION OF THE CURRENT MARKET SITUATION AND FUTURE PROSPECTS____________________________________________________________________________________________
17
0
100
200
300
400
500
600
EU Argentina USA Brazil India
Centsperkg
production cost (excl EU-Directive) cost of EU-Directive transport levy on imports
Figure 4.7: Estimated offer price of whole egg powder in EU (average represented by horizontal line) and non-EU countries assuming a 50% reduction in import tariffs, 2012 (Eurocents per kilogram) Source: van Horne
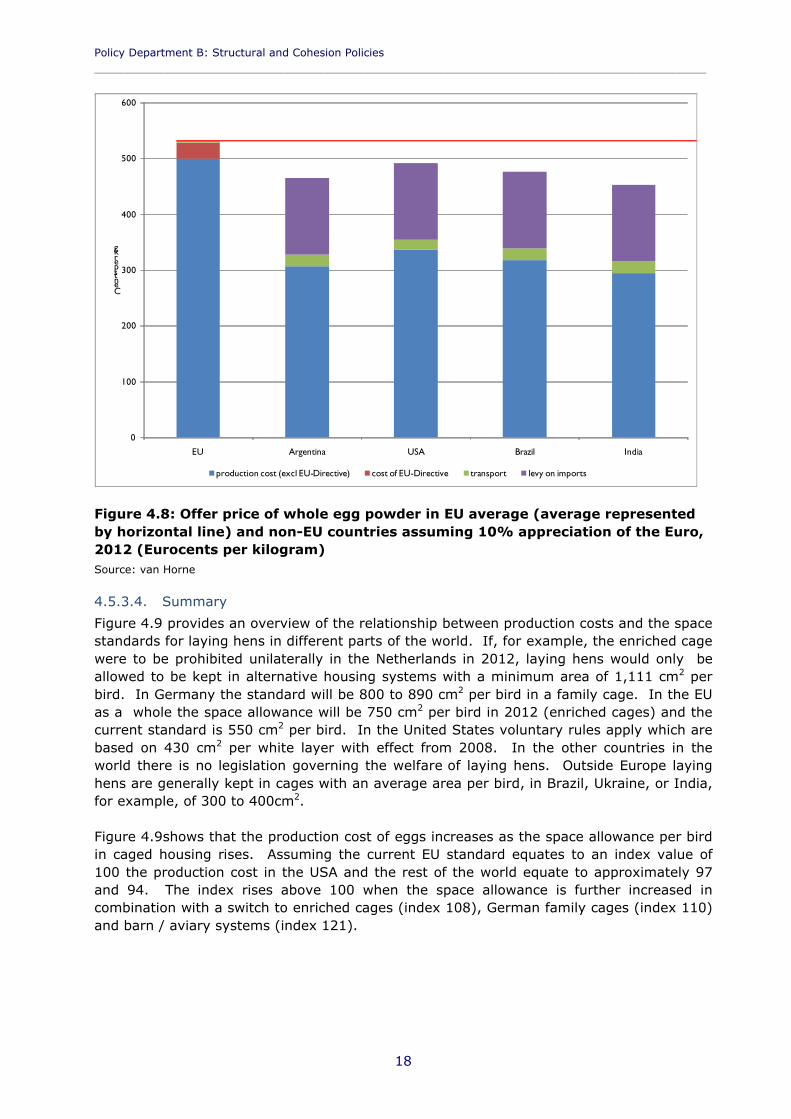
Policy Department B: Structural and Cohesion Policies____________________________________________________________________________________________
18
0
100
200
300
400
500
600
EU Argentina USA Brazil India
Centsperkg
production cost (excl EU-Directive) cost of EU-Directive transport levy on imports
Figure 4.8: Offer price of whole egg powder in EU average (average represented by horizontal line) and non-EU countries assuming 10% appreciation of the Euro, 2012 (Eurocents per kilogram) Source: van Horne
4.5.3.4. Summary
Figure 4.9 provides an overview of the relationship between production costs and the space standards for laying hens in different parts of the world. If, for example, the enriched cage were to be prohibited unilaterally in the Netherlands in 2012, laying hens would only be allowed to be kept in alternative housing systems with a minimum area of 1,111 cm2 per bird. In Germany the standard will be 800 to 890 cm2 per bird in a family cage. In the EU as a whole the space allowance will be 750 cm2 per bird in 2012 (enriched cages) and the current standard is 550 cm2 per bird. In the United States voluntary rules apply which are based on 430 cm2 per white layer with effect from 2008. In the other countries in the world there is no legislation governing the welfare of laying hens. Outside Europe laying hens are generally kept in cages with an average area per bird, in Brazil, Ukraine, or India, for example, of 300 to 400cm2.
Figure 4.9shows that the production cost of eggs increases as the space allowance per bird in caged housing rises. Assuming the current EU standard equates to an index value of 100 the production cost in the USA and the rest of the world equate to approximately 97 and 94. The index rises above 100 when the space allowance is further increased in combination with a switch to enriched cages (index 108), German family cages (index 110) and barn / aviary systems (index 121).

THE POULTRY AND EGG SECTORS: EVALUATION OF THE CURRENT MARKET SITUATION AND FUTURE PROSPECTS____________________________________________________________________________________________
19
0
200
400
600
800
1,000
1,200
70
80
90
100
110
120
130
world USA EU-2003 EU-2012 Germany/NL Europe
Area(cm2perhen)
Costindex(EU2003=100)
cost-index space (cm2/hen)
cage
cage
cage
cage
enriched cage
' colony cage' in DE/NL
aviary /barn system
Figure 4.9: Relationship between costs for animal welfare (wide bar; cost index on left-hand axis) and the area per laying hen (small bar; space allowance per hen in cm2 on right-hand axis)
Source: van Horne
4.5.4. EU’s competitive position on the world poultry meat market
4.5.4.1. Poultry meat production costs in EU and third countries
Broiler production costs for the EU and a number of countries outside the EU are presented in Figure 4.10. In all three major broiler exporting countries (Brazil, US and Thailand), the cost of production is lower. These costs are at their lowest in Brazil and the US.
The lower production costs in the US and Brazil can largely be attributed to lower feed prices. This is the result of a large local supply of feed ingredients. For Brazil and Thailand, the favourable climate and lower labour costs are also important contributing factors.
In the non-EU countries, production costs are also lower due to the lack of regulations and legislation comparable with those within the EU. For example, these include the prohibition of the use of antimicrobial growth stimulators and meat-and-bone meal in poultry feed, which are not allowed in the EU.
Figure 4.10 also provides detail on the cost of slaughter in each country. Slaughter costs are considerably lower in Thailand and Brazil (€1.11 and €0.90 per kg of carcass weight, respectively) than in the EU primarily due to the lower labour costs. The production costs after slaughter are lowest in Brazil. While welfare legislation will impact the production cost in EU countries, it will not affect that of third countries.

Policy Department B: Structural and Cohesion Policies____________________________________________________________________________________________
20
0
20
40
60
80
100
120
140
160
NL G FR UK PL US TH BR
Eurocentsperkgcarcassweight
Primary Slaughter
Figure 4.10: EU and third country broiler production and slaughter costs, 2007
Source: van Horne
The cost of broiler production in the EU is greater than that of the USA, Brazil and Thailand. It is difficult to quantify the effect of existing welfare legislation on broiler production in the EU. In the case of slaughtering, equivalency is requested from Third Country exporters, so EU producers are not disadvantaged. However, in the case of other legislation such as general welfare and protection during transport, equivalency is not requested so only EU producers are impacted. Council Directive 2007/43/EC may produce extra costs for EU producers; both capital outlay costs, and production costs. It is difficult to know how the directive will impact EU production vis-à-vis third country production. On one hand, welfare legislation is largely non-existent in third countries, and so producers can theoretically use higher stocking densities and lower lighting. In practice, there are some voluntary initiatives, and stocking densities may be limited in some countries due to the climate.
Interviewees did not comment on the impact of general animal welfare legislation, or of Directive 2007/43/EC. This implies that concerns with the impact of these items of legislation are low.
However, one interviewee expressed concern that the stunning requirements of Regulation (EC) 1099/2009 may have impacts as an alternative to water bath stunning will be needed. The interviewee commented that the requirements would theoretically apply to third country production as well, but was concerned that this would be difficult to enforce, particularly given that water bath stunning is the global norm.
THE POULTRY AND EGG SECTORS: EVALUATION OF THE CURRENT MARKET SITUATION AND FUTURE PROSPECTS____________________________________________________________________________________________
21
4.6. EU support for compliance with animal welfare legislation
The European Commission has offered support for compliance with animal welfare legislation under pillar two of the Rural Development Programme (RDP). There are three measures which provide funding opportunities:
Measure 121 “modernisation of agricultural holdings”. In the case of enriched cages, support could be granted in advance of the ban, and during a 36 month grace period thereafter.
Measure 131 “Meeting standards based on Community legislation”. Support under this measure can only be applied once a standard is mandatory.
Measure 215 “Animal welfare payments”. Support can be granted to farmers undertaking voluntary animal welfare commitments going beyond EU and national mandatory welfare standards for a period of 5-7 years. Support is not possible once a standard become mandatory.
However, interviewees believed that the support offered has been sparsely used. The following reasons for this were identified:
Member States or regions (depending on the national administrative system) must request the support. Few authorities have in fact done this.
Producers may not have been fully informed about the measures and their availability. One interviewee believed that the support opportunities had been poorly-communicated to producers.
Producers may have been reluctant to change. One interviewee believed that there is low consumer understanding of the egg-numbering system, and that this may have contributed to producer reluctance to change.
Finally, it should be noted that authorities may not have chosen to allocate money to this area from the RDP due to the allocation of RDP funds to other ongoing projects.
4.7. The outlook for animal welfare legislation in the EU
Interviewees provided some comments on the outlook for animal welfare legislation in the EU. One interviewee believed that the requirements of the broiler directive could be further improved; most notably the stocking density quoted is high, and as breeds are not specified, there is no limit on the use of faster growing breeds. While this is an opinion, it does suggest that changes in the requirements are a possibility. The same interviewee believed that any animal welfare requirements should apply to producers both in the EU and in third countries.
One interviewee expressed concerns that the ban on conventional cages may be followed by a ban on all cages in a few years, which would adversely affect producers currently investing in enriched cages. Another interviewee believed that in Belgium a ban on all cages would take effect from 2025. However, the interviewee felt that any ban on cages would be unlikely within the next 10 years, and would ultimately be led by the market.
Finally, one interviewee believed that changes to animal welfare legislation were not currently visible. There are evaluations on European Animal Welfare policies underway (one by the Commission and one by the Parliament), and until these evaluations are completed it is unlikely that new animal welfare legislation will be considered.


THE POULTRY AND EGG SECTORS: EVALUATION OF THE CURRENT MARKET SITUATION AND FUTURE PROSPECTS____________________________________________________________________________________________
3
5. CONCLUSIONS AND RECOMMENDATIONS
The European Parliament has been particularly concerned about historic and potentially adverse future impacts of market disturbances (such as avian influenza and the regulatory burden placed on EU producers by legislation) on the egg and poultry markets. Based on the results of the analysis and industry interviews, a number of general conclusions and recommendations can be made with respect to the evolution of the market situation in these sectors and their future prospects:
Avian influenza. Revised EU legislation on the control and prevention of avian influenza and its implementation in the Member States during 2006 limited the impact of the disease on animal and human health, particularly compared to previous outbreaks. Most of the market and trade impacts resulting from the EU avian influenza outbreak in 2006 were short-term and closely linked to the impact of consumption shocks and the imposition of trade restrictions on market prices. From a production perspective, avian influenza had a limited impact on supply given the rapid supply response of poultry production. However, lower market prices and the unproductive downtime forced on those poultry farms affected both directly and indirectly had a negative effect on industry profitability and market stability.
While EU legislation and its implementation is generally considered to have been effective in limiting the spread of avian influenza in the EU, the main impact on producers’ incomes were due to the depressed market prices as a result of reduced consumer demand. While this would suggest that the revised avian influenza legislation is working as intended in the event of an outbreak to control and prevent further outbreaks of the disease, it would seem that there was a greater need to limit the associated negative impact of the disease on consumer demand and hence market prices.
Recommendation: In the event of future outbreaks, resources need to be deployed promptly to limit negative demand shocks and in particular effective communication to consumers needs to be ensured.
Input costs. Given that feed is the major cost for the production of broilers and eggs, any change in the cost of feed has a significant impact on the overall cost of production. Although poultry feed prices have decreased from their peak in mid-2008, prices have stabilised at levels well in excess of their long-term averages due to the higher cost of soybean meal, which going forward is expected to remain at such levels. However, higher animal feed costs are not unique to the poultry meat and egg sectors. In general, the cost of animal feed ingredients and volatility in agricultural commodity prices are expected to remain higher going forward for alllivestock sectors.
However, there is still a large differential between the cost of poultry feed in the EU and in key world poultry meat and egg producing countries, which is mainly the result of more stringent EU regulations and legislation primarily concerned with increasing food safety. This puts EU poultry meat and egg production at a significant cost disadvantage to key non-EU poultry meat and egg producing countries.
Recommendation: Any direct policy initiative to increase protection against cheaper imports of poultry meat and eggs to mitigate the additional cost of these food safety initiatives would run counter to the direction of recent CAP reforms and WTO commitments. However, of benefit to all livestock sectors would be to revisit the scientific advice on the
Policy Department B: Structural and Cohesion Policies____________________________________________________________________________________________
4
continuation of EU specific food safety legislation concerning, for example, the prohibition of the use of antimicrobial growth stimulators and meat-and-bone meal in poultry feed and the authorisation of GM feed ingredients.
Animal welfare and environmental legislation. EU producers are subject to some legislation, particularly with respect to animal welfare, which none of the major competing producers are subject to except for the requirements on slaughtering which need to be complied with by third countries exporting to the EU.
For both broilers and layers this legislation is in the process of implementation and as this is the case it can be argued that to date the direct impacts of the legislation have been limited since the sectors have also operated with more or less adequate levels of tariff protection (i.e. outside existing TRQs). This having been said, although there are productivity and meat quality benefits from the implementation of the welfare legislation, in particular for broilers as has been highlighted in this report, these benefits are difficult to quantify and arguably do not fully offset the cost disadvantages likely to arise, particularly for egg and egg product production. For eggs the sector operates under the additional disadvantage that while shell eggs produced under different systems in the EU need to be labelled according to the system used for third countries, such labelling is not required and perhaps more importantly in any case the bulk of competition arises for egg products used in the food processing and food service sectors which are generally not as sensitive to welfare concerns but are more focused on price.
Other legislation, such as the IPPC (Integrated pollution and prevention control) Directive and salmonella requirements also have adverse impacts on competitiveness. The IPPC Directive applies for broiler and egg holdings of over 40,000 birds. According to estimations by LKS (2009), IPPC compliance adds costs of €0.0156 per bird place per year.
Recommendation: The Uruguay Round on Agriculture established the current tariff and access basis for both poultry meat and eggs and egg products. In subsequent hitherto unsuccessful multilateral negotiations in the WTO Doha Round poultry has been treated as a sensitive product while eggs and egg products have not been considered as such. Nevertheless, based on the analysis of costs provided in this report and as has been highlighted by stakeholders in both cases any further reductions in tariffs and increases in access via reduced duty tariff quotas in either multilateral or bilateral trade agreements are likely to threaten the competitiveness of EU production. The egg and egg products sector in particular has argued that the tariff lines relating to this sector should also be treated as sensitive or that at the very least the EU should be pushing for animal welfare ‘equivalence’ in bilateral negotiations. The poultry sector argues that the fixing of TRQs should be based on ‘realistic’ estimates of EU consumption particularly for boneless breast meat.
In this context it is noted that animal welfare has been included in bilateral SPS agreements with Chile and more recently with countries such as South Korea. In view of the Commission’s strategy of engagement over imposition in the area of animal welfare norms, it is recommended that the approach of including animal welfare in bilateral agreements is further pursued.
Beyond this there is concern about further extensions of welfare legislation e.g. via the banning of all caged production for layers or via stricter production standards for poultry and it is therefore recommended that prior to the introduction of such measures a full assessment of impact is undertaken.

THE POULTRY AND EGG SECTORS: EVALUATION OF THE CURRENT MARKET SITUATION AND FUTURE PROSPECTS____________________________________________________________________________________________
5
Financial support has been offered to EU producers under the Rural Development Programme (RDP) to enable compliance with animal welfare legislation. However, there appears to have been little uptake of this support. It is therefore recommended that the measures are promoted and uptake is facilitated, in order that EU producers may benefit from financial support for compliance with this legislation.

THE POULTRY AND EGG SECTORS: EVALUATION OF THE CURRENT MARKET SITUATION AND FUTURE PROSPECTS____________________________________________________________________________________________
3
6. REFERENCES Aramyan, L.H., van Wagenberg, C.P.A. and Backus, G.B.C. (2009) EU policy on GM soy: tolerance threshold and asynchronic approval. Report 2009-052. May 2009. Project code 31582.
Bagnara, G.L. (2009) The impact of welfare on the European poultry production: political remarks. In Poultry Welfare Symposium Cervia, Italy, 18-22 May, 2009.
Banse, M., Nowicki, P and van Meijl, H. (2008) Why are current World food prices so high? LEI report 2008-040. LEI Wageningen UR. The Hague, the Netherlands. June 2008.
Chotteau, P. et al. (2009) The impact of increased operating costs on meat livestock in the EU. Report for the European Parliament, Directorate general for internal studies. Brussels, August 2009
EIA (no date) Crude oil prices. US Energy Information Administration: www.eia.doe.gov
EMA (2009) Yearbook 2009
Eurobarometer (2007a) Attitudes of EU citizens towards animal welfare. Special Eurobarometer 270. March 2007.
Eurobarometer (2007b) Attitudes of consumers towards the welfare of farmed animals, wave 2. Special Eurobarometer 229 (2). March 2007.
European Commission (2009) Options for animal welfare labelling and the establishment of a European Network of Reference Centres for the protection and welfare of animals. Brussels, October 2009.
FCEC (2009). Feasibility study on animal welfare labelling and establishing a Community Reference Centre for Animal Protection and Welfare. Berlin / Brussels, January 2009.
Horne, P.L.M van (2008) Production cost of table eggs: an international comparison. LEI report 2008-071 (in Dutch). The Hague. December 2008.
Horne, P.L.M van (2009) Production cost of poultry meat: an international comparison. LEI report 2009-004 (in Dutch). The Hague. March 2009.
Horne, P.L.M van, and Achterbosch, T.J. (2007). Animal welfare in poultry production systems: impact of EU standards on world trade. World's Poultry Science Journal (2008), 64 : 40-52Interview. Two interviews with grain trader / grain buyer.
ITAVI (2009) personal communication.
LEI (no date) Price information: www.lei.wur.nl
LKS (2009). Estudio sobre las consecuencias de la aplicación del modelo de producción europeo al sector español del huevo y sus productos. October 2009.
OECD and FAO (2008). AGRICULTURAL OUTLOOK 2008–2017.

Policy Department B: Structural and Cohesion Policies____________________________________________________________________________________________
4
Sheppard, A., and Edge, S. (2005). Economic and Operational Impacts of the Proposed EU Directive laying down Minimum Standards for the Protection of Chickens kept for Meat Production. Exeter, 2005.
USDA (2010) Oilseed: World markets and trade. Circular Series FOP 01-10. January 2010.
Voituriez, T. (no date) Huasse des prix agricoles et de l’energie: www.ifri.org/files/energie
Wagenberg, C.P.A. (2009) Economic consequences of EU-unapproved GM maize in US soy. Memo 09-071. LEI Wageningen UR. The Hague, the Netherlands. October 2009.

THE POULTRY AND EGG SECTORS: EVALUATION OF THE CURRENT MARKET SITUATION AND FUTURE PROSPECTS____________________________________________________________________________________________
3
7. ANNEX 1: LAYER INDUSTRY IN THE USA, BRAZIL, ARGENTINA AND INDIA
7.1. USA
Egg production in the USA is concentrated in the North-East and South-East of the country. In the commercial egg industry numerous independent producers are marketing on a local basis, applying price competition as a major component of their marketing strategy. It is estimated that the top 10 egg producers, with each more than 5 million layers, represent 44% of the industry. These companies have the “economies of scale” and have a high efficiency in production, marketing and distribution (Shane, 2003). The USA is a large exporter of eggs and egg products.
The issue of animal welfare has become a hot topic in the USA in recent years. Although there is hardly any legislation with regards to poultry welfare, the producer organisation, United Egg Producers (UEP), have set guidelines to stepwise improve the welfare of laying hens. This is done as a reaction to the pressure posed on them by national and local animal rights organisations. The guidelines include more space for the hens in cages, conditions for moulting and standards for beak trimming. Within the UEP program the birds have more space in the cage. The space per bird will increase every year and was 432 cm2 from January 2009 for white layers. White layers are 93% of the total layer population. Participating producers will be audited yearly through an independent certification program.
The perception of animal welfare is the USA is not much different from that in Europe and in fact following the direction Europe has chosen. Due to the attention the animal right organizations ask for the issue of cages layers retailers and food services (fast food restaurants) are changing their attitude. At this moment the market for alternative eggs (around 5%) in the USA is still very low compared to countries in north west Europe (Bracke et al, 2009).
7.2. Brazil
Brazil is the 8th largest egg producer in the world. Brazil has some export of eggs and egg products. However, compared to broiler meat exports this is very small. Some 90-95% of layers in Brazil are housed in cages, with the rest of the hens kept in floor systems in small flocks for local consumption. Commercial farms have a good productivity. Pullets are reared in light controlled houses. Layers are commonly housed in open houses with curtain sides and tunnel ventilation. In warm areas padcooling is practiced. Brazilian egg producers have an abundant access to high quality domestic grain and soya beans. This gives low cost for pullet and layer feed. In general western breeds are used. Standard Brazilian stocking density was reported to be 330cm2 (Madeley, 2001), although in hot areas with simple housing the density can be lower (400 to 430 cm2 per hen). Also other sources report a general density between 330 and 400 cm2 per hen. Specialists believe that the Brazilian egg industry has the potential to grow substantially. Similar to the broiler meat industry the egg sector is willing and capable of meeting the highest demands of customers in the EU or Japan.
7.3. India
All commercial layers kept on modern farms have open sided houses where birds are housed in 3 to 4 rows and three tier conventional cages. The new poultry houses in India have a length of 106 metres by 13.4 metres which can house 20,000 hens. The standard

Policy Department B: Structural and Cohesion Policies____________________________________________________________________________________________
4
cage size for 3 birds is 37.5 cm by 30 cm. The space allowance is 375 cm2 per bird (NECC, 2002). This is much lower than the current EU standard of 550 cm2 per bird.
In India commercial layers are kept in cages in which space allowance is much lower than the European standards. Animal welfare standards do not exist. Animal welfare is not an issue for the government in India and in real life improving animal welfare is limited by poverty of a great part of the population and the life philosophy within the Hindu culture. Egg production in India is mainly focusing on the national market. The growing population in India will increase the local market for poultry products, making export efforts not necessary for Indian producers. However, some of the larger companies are exporting egg powder to the EU and Japan. This can be achieved as a result of the low production costs and the lack of regulations. For the near future India has competitive advantages to be a player on the world market for egg powder (Van Horne, 2005).
7.4. Argentina
Argentina is the 19th largest world producer of eggs in volume terms. Egg production in Argentina has been growing steadily since the 1990s both in production, value and exports. Production is expected to keep growing over the next few years.
Egg processing has also been also growing, currently consuming over 11% of total production. It is the most dynamic in terms of foreign market and contributed to reversing the country’s situation from being an importer of egg products to being an incipient exporter.
No legislation exists that regulates specific animal welfare practices for layers in Argentina. However, there are some public documents and manuals that present a frame of action. Among these are the Procedure Manual on Animal Welfare and a law of 1954 (which, for example, penalises insufficient quantity and quality of feed supply).
In 2009 a surveys was conducted and interviews with producers and businessmen in the egg sector were held. The survey was done by the University of Buenos Aires and included 30 operations (UBA, 2009). Factors directly related to the welfare of the hens include space allowance, methods of beak trimming and mortality rate and these are reported on below:
All farms in the survey kept layers in cages. The type of cages differed between the farms. The average space allowance was 372 cm2 per hen. However, there was a wide range from 278 cm2 (8 companies) to 500 cm2 per hen (1 company).
All surveyed farms used pullets that had their beaks trimmed. The average age at which this was performed was 12 days with a range of 6 to 28 days. The beak trimming also differed in how much of the beaks was trimmed with the majority of farms trimming ¼ or 1/3 of the beak.
The mortality rate, as percentage of the numbers at start, at the surveyed farms was just over 9%. On the larger farms the average mortality rate was 7.7%. The mortality rate ranged from 6% to 16% per company.

THE POULTRY AND EGG SECTORS: EVALUATION OF THE CURRENT MARKET SITUATION AND FUTURE PROSPECTS____________________________________________________________________________________________
3
NOTES