Embed Size (px)
Citation preview
POLICY RESEARCH WORKING PAPER 2960
The Poverty/Environment Nexusin Cambodia and Lao People's
Democratic Republic
Susmita Dasgupta
Uwe Deichmann
Craig Meisner
David Wheeler
The World BankDevelopment Research GroupInfrastructure and EnvironmentJanuary 2003
Pub
lic D
iscl
osur
e A
utho
rized
Pub
lic D
iscl
osur
e A
utho
rized
Pub
lic D
iscl
osur
e A
utho
rized
Pub
lic D
iscl
osur
e A
utho
rized
Pub
lic D
iscl
osur
e A
utho
rized
Pub
lic D
iscl
osur
e A
utho
rized
Pub
lic D
iscl
osur
e A
utho
rized
Pub
lic D
iscl
osur
e A
utho
rized
I POLICY RESEARCH WORKING PAPER 2960
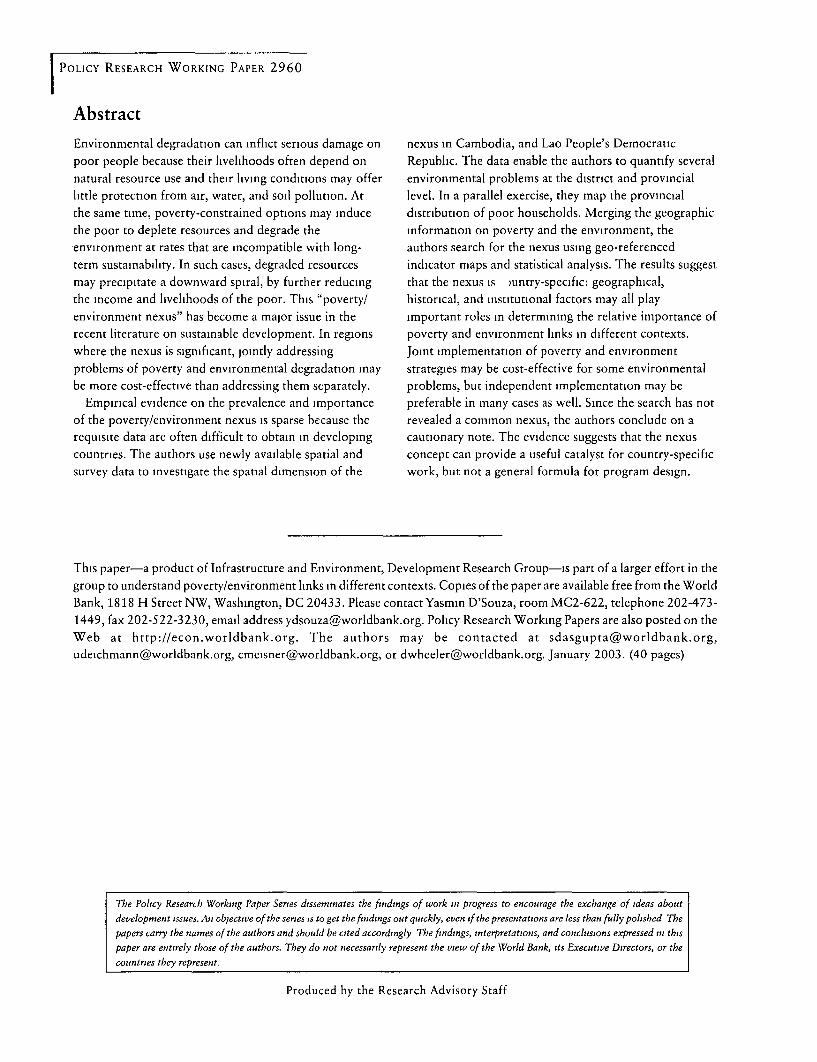
AbstractEnvironmental degradation can inflict serious damage on nexus in Cambodia, and Lao People's Democraticpoor people because their livelihoods often depend on Republic. The data enable the authors to quantify severalnatural resource use and their living conditions may offer environmental problems at the district and provinciallittle protection from air, water, and soil pollution. At level. In a parallel exercise, they map the provincialthe same time, poverty-constrained options may induce distribution of poor households. Merging the geographicthe poor to deplete resources and degrade the information on poverty and the environment, the,environment at rates that are incompatible with long- authors search for the nexus using geo-referencedterm sustainability. In such cases, degraded resources indicator maps and statistical analysis. The results suggestmay precipitate a downward spiral, by further reducing that the nexus is juntry-specific: geographical,the income and livelihoods of the poor. This "poverty/ historical, and institutional factors may all playenvironment nexus" has become a major issue in the important roles in determining the relative importance ofrecent literature on sustainable development. In regions poverty and environment links in different contexts.where the nexus is significant, lointly addressing Joint implementation of poverty and environmentproblems of poverty and environmental degradation may strategies may be cost-effective for some environmentalbe more cost-effective than addressing them separately. problems, but independent implementation may be
Empirical evidence on the prevalence and importance preferable in many cases as well. Since the search has notof the poverty/environment nexus is sparse because the revealed a common nexus, the authors conclude on arequisite data are often difficult to obtain in developing cautionary note. The evidence suggests that the nexuscountries. The authors use newly available spatial and concept can provide a useful catalyst for country-specificsurvey data to investigate the spatial dimension of the work, but not a general formula for program design.
This paper-a product of Infrastructure and Environment, Development Research Group-is part of a larger effort in thegroup to understand poverty/environment links in different contexts. Copies of the paper are available free from the WorldBank, 1818 H Street NW, Washington, DC 20433. Please contact Yasmin D'Souza, room MC2-622, telephone 202-473-1449, fax 202-522-3230, email address [email protected]. Policy Research Working Papers are also posted on theWeb at http://econ.worldbank.org. The authors may be contacted at [email protected],[email protected], [email protected], or [email protected]. January 2003. (40 pages)
The Policy Research Working Paper Series disseminates the findings of work in progress to encourage the exchange of ideas aboutdevelopment issues. An objective of the series is to get the findings out qutckly, even if the presentations are less than fully polished Thepapers carry the names of the authors and should be cited accordingly The findings, interpretations, and conclusions expressed in this
paper are entirely those of the authors. They do not necessarily represent the view of the World Bank, its Executive Directors, or the
countries they represent.
Produced by the Research Advisory Staff
The Poverty/Environment Nexusin
Cambodia and Lao People's Democratic Republic
by
Susmita DasguptaUwe DeichmannCraig MeisnerDavid Wheeler
DECRG

Acknowledgements
Our thanks to Jostein Nygard, Giovanna Dore, Piet Buys, Kiran Pandey and Hua Wang, for their valuablecomments and contributions to this research, which was supported by the World Bank's EnvironmentDepartment and its East Asia and Pacific Unit for Environment and Social Development.
We would also like to express our appreciation to colleagues who met with us in Cambodia and Lao PDR,as well as those who contnbuted to data collection for this research.
In Cambodia, we would like to acknowledge the following individuals:
Mr. Tom Tsui and Mr. Su Yong Song (World Bank - HQ); Mr. Steven N. Schonberger, Mr. Athol Mak andMr. Sivannara Ros (World Bank - Cambodia); Mr. Shiva Kumar (Consultant); Ms. Pum Vichet and Mr. SyRamony (Ministry of Environment); Dr. Hang Chuon Naron and Mr. Sovann Dy (Ministry of Economyand Finance); Mr. Veng Sakhon (Ministry of Water Resources and Meteorology); Mr. Peng Navuth andMr. Cheav Channy (Ministry of Industry, Mines and Energy); Mr. Bouy Kim Sreang (Ministry of RuralDevelopment); Mr. Ty Sokhun and Mr. Teang Sokhum (Department of Forestry and Wildlife); Mr. SarthiAcharya, Mr. Bruce McKenney and Mr. Chan Sophal (Cambodia Development Research Institute, CDRI);Mr. San Sy Than (National Institute of Statistics, NIS); Mr. Dirk Vanderstighelen, Mr. Nguyen Thanh Tm,Mr. Edward Ongley, Mr. Peter Degen, Ms. Cong Nguyen, Ms. Susan Novak, Ms. Solieng Mak, Ms. SeinMay and Ms. Muanpong Juntopas (Mekong River Commission, MRC); Dr. Mahadevan Ramachandran andMr. Sik Boreak (UN World Food Program, UNWFP); Mr. Gouranga Dasvarma and Mr. Khus Chiev(United Nations Population Fund (UNFPA); Mr. Julian Abrams (UN Office for Project Services); Dr. HenkBekedam (World Health Orgamzation, WHO); Mr. Keef Goudswaard (UNICEF); Mr. Ben Davies (DFID);Mr. Lars Lund (CDC-DANIDA); Mr. Shaun Williams and Ms. Ngin Navirak (OXFAM); Mr. RussellPeterson (The NGO Forum on Cambodia); Mr. Yang Saing Koma (Cambodia Center for the Study andDevelopment of Agriculture, CEDAC).
In Lao PDR, we would like to acknowledge the following individuals:
Ms. Linda Schneider, Ms. Malarak Souksavat, Mr. Enrique Crousillat, Mr. Santanu Lahiri, Mr. ThomasMeadley (World Bank - Lao PDR); Mr. Zafar Ahmed (World Bank - HQ); Mr. Somdy Douangdy and Ms.Singkham Khongsavanh (Department of General Planning); Dr. Sisamone Keola and Dr. BounlayPhommasack (Ministry of Health, MoH); Mr. Anonth Khamhung, Mr. Thanousay Ounthouang, Mr.Veunevang Bouttalath and Mr. Limthong Douangphachanh (Ministry of Agriculture and Forestry, MoAF);Dr. Nouanta Maniphousay (National Center for Environmental Health and Water Supply, Nam Saat); Dr.Somphone Dethoudom (Water Supply Authority, WASA); Ms. Keobang A Keola (Science, Technology,Environment Agency, STEA); Mrs. Phonesaly Souksavath and Ms. Phetsamone Sone (National StatisticalCenter, NSC); Mr. Boriboun Sanasisane (National Mekong River Committee); Dr. Outhaki Khamphoul(Lao Women's Organization, Gender Resource Information and Development Centre, GRID); Mr.Malcolm Duthue and Ms. Genevieve Chicoine (UN World Food Program, UNWFP); Ms. JacquelynChagnon (Participatory Development Associates); Mr. Vlademar Holmgren, Mr. Derek Ratcliff and Ms.Carolyn Knight (AF SMG/ SCC Natura, Consultants in Natural Resources Management).
2

1. Introduction
Developing countries have serious environmental problems that range from soil erosionto contamination of urban air. Some problems have significance at the global level, suchas greenhouse gas emissions and threats to biodiversity. Others,- such as erosion and airpollution, cause significant damage at the regional or local levels. Since poverty iswidespread, a share of this damage is generally borne by poor households. In some cases,poor households may degrade the environment in ways that are damaging both tothemselves and to others. Conceptually, the existence of a "poverty/environment nexus"implies that one problem is a significant determinant of the other. Where this is the case,reducing poverty may be an effective way to reduce environmental damage, or vice-versa. Joint solutions may be highly cost-effective policy options when the two problemsare simultaneously determined.
How significant is this nexus in practice? Numerous studies have suggested thatenvironmental damage can have particular significance for the poor. Recent participatorypoverty assessments, conducted in 14 developing countries of Asia, Africa, and LatinAmerica, reveal a common perception by the poor that environmental quality is animportant determinant of their health, earning capacity, security, energy supplies andhousing quality (Brocklesby and Hinshelwood, 2001). Rural studies commonly observethat poor people's economic dependence on natural resources makes them particularlyvulnerable to enviromnental degradation (Ambler, 1999; Cavendish, 1999; Cavendish2000; Kepe, 1999; Reddy and Chakravarty, 1999). Other studies have assessed the healthdamage suffered by poor households that are directly exposed to pollution of the air,water and land (Akbar and Lvovsky, 2000; Bosch et al., 2001; Brooks and Sethi, 1997;Mink, 1993; Songsore and McGranahan, 1993; Surjadi, 1993). In addition,environmental disasters and environment-related conflicts may have regressive impactsbecause the poor are least capable of coping with their effects (Albla-Betrand, 1993;Myers and Kent, 1995).
In some cases, poor households themselves may increase environmental degradation.Poverty-constrained options may induce the poor to deplete resources at rates that areincompatible with long-term sustainability (Holden et al., 1996). In such cases, degradedresources precipitate a "downward spiral," by further reducing the income of the poor(Cleaver and Schreiber, 1994; Dasgupta and Maler, 1994; Durning, 1989; Ekbom andBoj6, 1999; Mink, 1993; Pearce and Warford, 1993; Prakash 1997; World Bank, 1992;World Commission on Environment and Development, 1987). Rapid population growth,coupled with insufficient means or incentives to intensify production, may induce over-exploitation of fragile lands on steep hillsides, or invasion of areas that governments areattempting to protect for environmental reasons. Again, a downward spiral can ensue(World Bank, 1992).
The existing literature also suggests that the strength of poverty-environment linkagesmay be affected by factors as diverse as economic policies, resource prices, localinstitutions, property rights, entitlements to natural resources, and gender relations(Ambler, 1999; Arnold and Bird, 1999; Barbier 2000; Dasgupta and Maler, 1994; Dutt
4
and Rao, 1996; Ekbom and Boj6, 1999; Eskeland and Kong, 1998; Heath andBinswanger,1996; Leach and Mearns, 1991; Roe 1998). By implication, the relativestrength of links between poverty and environment may be very context-specificChomitz, 1999, Bucknall, Kraus, Pillai, 2001; Ekbom and Boj6, 1999).
What does the empirical evidence suggest about the actual prevalence and importance ofthe poverty-environment nexus and complementary problems? Here the actual record issparse, because the requisite data are often difficult to obtain in developing countries. Inprinciple, household-level studies can adequately test whether environmental problemshave a disproportionate impact on the poor. In practice, such tests are rare. For example,some studies have established a link between poverty and consumption of wood fuel, andat least one credible study has established the relationship between indoor combustionand health (Ezzati and Kammen, 2001). However, the research also suggests theimportance of intervening variables such as cooking practices (indoor vs. outdoor) andfuel choice (e.g., charcoal emits far fewer fine particles than wood). Children die ofwaterbome disease at higher rates in poor households, but again, research points to thesignificance of intervening variables such as water source quality and mothers' education(Merick, 1985; Filmer and Pritchett, 1997). Rigorous empirical studies that combinelocal-area environmental variables (deforestation, outdoor air quality, water quality, soilerosion, etc.) with standard household surveys are almost nonexistent. Similarly, veryfew local-area studies relate environmental quality to the number and characteristics ofpoor households.
Empirically, studies of the poverty/environment nexus generally have a spatial dimensionbecause environmental problems are inherently geographical. For example, pollution ofair- and watersheds is determined both by the scale of local emissions and the absorptivecapacity of the local environment (itself determined by topography, wind speed, rainfall,temperature, altitude, etc.). The size of the relevant region is affected by the dispersalcharacteristics of the pollutant and medium: Particulate pollution from cement mills mayonly be dangerous in one urban region, acid rain from sulphur emissions may damageforests hundreds of miles from the source, and eutrophication from fertilizer runoff mayaffect ocean fisheries a thousand miles downstream from the farms that are the source ofthe problem.
From a spatial perspective, a potential poverty/environment nexus exists ifenvironmental damage is significant in high-poverty areas. From a policy perspective, apotential nexus becomes interesting if two conditions are met. First, poverty andenvironment must be linked by at least one-way causation. Under this condition, jointremediation may be preferable to independent strategies for poverty alleviation andenvironmental improvement. Second, and at least equally important, the characteristicsof poor households and environmental damage sources must lend themselves to cost-effective joint remediation. In the best of circumstances, developing-countrygovernments may be stymied by the institutional and logistical challenges of programs toalleviate poverty or improve the environment. Economizing on scarce administrative andtechnical capacity often implies focusing the available resources on the most heavily-impacted areas. By implication, feasible strategies for addressing the poverty/
5

environment nexus will exploit administrative scale economies in contiguous areas whereboth problems are serious.
On the environment side, such scale economies reside in monitoring and enforcementsystems. Monitoring is needed to track environmental damage and its sources (pollution,deforestation, etc.). Sustained improvement requires facilities for infornation collection,storage, retrieval and analysis, as well as staff for regulatory enforcement and technicalassistance to agents whose environmental performance must be improved. The need forfrequent inspections and consultations, coupled with poor transport infrastructure,suggests that sustained progress will depend on agencies that operate at the provincial ordistrict levels. A similar logic applies to targeted programs for poverty alleviation. Froma policy perspective, it seems reasonable to use the same geographic scale to identifypoverty/environment nexus issues. In any case, the available data do not permit furtherspatial dis-aggregation. Accordingly, this paper will analyze the available informationfor Cambodia and Lao PDR at the district and provincial levels.
2. Mapping the Problems
2.1 Absolute Poverty
For each country, we begin the analysis by mapping poverty at the province and districtlevels. From a welfare perspective, the size of the poverty population in each area is abetter guide for policy than the incidence of poverty.' Accordingly, we index provincesand districts by the number of inhabitants who fall below the international norm forabsolute poverty. We also incorporate administrative concerns by mapping thesettlement density of the poor, since providing services to isolated households is morecostly.
2.2 Environmental Problems
We consider five critical environmental problems, two related to natural resourcedegradation and three to pollution. The "Green" problems are deforestation and soildegradation, while the "Brown" problems are indoor air pollution, contaminated waterand sewage, and outdoor air pollution.
Deforestation
The rate of deforestation serves as a proxy for the loss of critical ecosystems andbiodiversity, as well as increased risk of soil erosion in steeply-sloped areas. To test for apoverty/environment nexus in this context, we map forested areas and rates ofdeforestation by province and district. In areas where significant forests remain, we
An extreme example will help clarify the underlymg logic: Ten poor households might constitute theentire population of an isolated district, whose poverty incidence would therefore be 100%. On the otherhand, one million poor households might represent no more than 40% of the population in a large urbanarea.
6
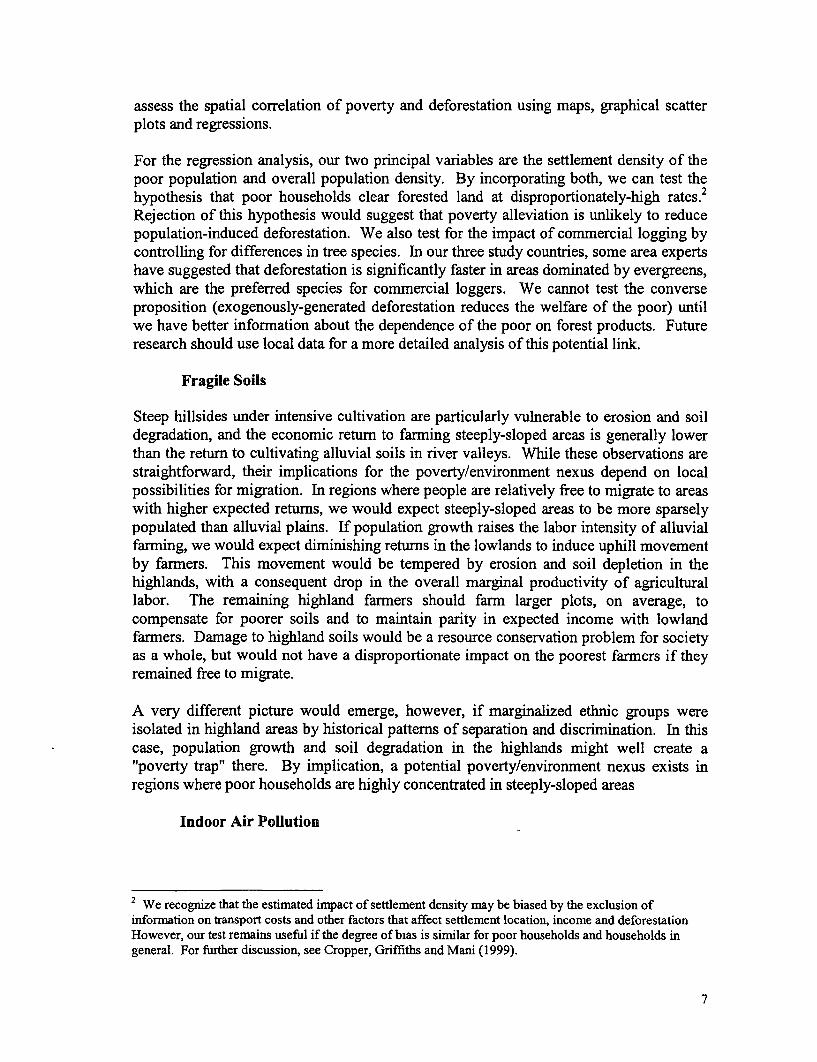
assess the spatial correlation of poverty and deforestation using maps, graphical scatterplots and regressions.
For the regression analysis, our two principal variables are the settlement density of thepoor population and overall population density. By incorporating both, we can test thehypothesis that poor households clear forested land at disproportionately-high rates.2
Rejection of this hypothesis would suggest that poverty alleviation is unlikely to reducepopulation-induced deforestation. We also test for the impact of commercial logging bycontrolling for differences in tree species. In our three study countries, some area expertshave suggested that deforestation is significantly faster in areas dominated by evergreens,which are the preferred species for commercial loggers. We cannot test the converseproposition (exogenously-generated deforestation reduces the welfare of the poor) untilwe have better information about the dependence of the poor on forest products. Futureresearch should use local data for a more detailed analysis of this potential link.
Fragile Soils
Steep hillsides under intensive cultivation are particularly vulnerable to erosion and soildegradation, and the economic return to farming steeply-sloped areas is generally lowerthan the return to cultivating alluvial soils in river valleys. While these observations arestraightforward, their implications for the poverty/environment nexus depend on localpossibilities for migration. In regions where people are relatively free to migrate to areaswith higher expected returns, we would expect steeply-sloped areas to be more sparselypopulated than alluvial plains. If population growth raises the labor intensity of alluvialfarming, we would expect diminishing returns in the lowlands to induce uphill movementby farmers. This movement would be tempered by erosion and soil depletion in thehighlands, with a consequent drop in the overall marginal productivity of agriculturallabor. The remaining highland farmers should farm larger plots, on average, tocompensate for poorer soils and to maintain parity in expected income with lowlandfarmers. Damage to highland soils would be a resource conservation problem for societyas a whole, but would not have a disproportionate impact on the poorest farmers if theyremained free to migrate.
A very different picture would emerge, however, if marginalized ethnic groups wereisolated in highland areas by historical patterns of separation and discrimination. In thiscase, population growth and soil degradation in the highlands might well create a"poverty trap" there. By implication, a potential poverty/environment nexus exists inregions where poor households are highly concentrated in steeply-sloped areas
Indoor Air Pollution
2 We recognize that the estimated impact of settlement density may be biased by the exclusion ofinformation on transport costs and other factors that affect settlement location, income and deforestationHowever, our test remains useful if the degree of bias is similar for poor households and households ingeneral. For further discussion, see Cropper, Griffiths and Mani (1999).
7

Recent research has suggested that indoor air pollution from wood fuels is a major causeof respiratory disease in developing countries. Many households use wood or charcoal inCambodia and Lao PDR, so indoor air pollution may be a significant health problem.Although indoor air monitoring data are not yet available, household surveys haverecorded the use of wood and charcoal. We use regression analysis to test whetherhouseholds living in absolute poverty are significantly greater users of charcoal and woodthan higher-income households. A positive finding would support the case for a jointenvironment/poverty strategy: Reducing indoor air pollution would differentially improvethe welfare of the poor, and reducing poverty would reduce health damage from indoorair pollution.
We recognize that our results can only be suggestive, since the impact of wood fuel usedepends on whether burning is indoors or outdoors. Gauging the true magnitude of theproblem will require household-level pollution monitoring and health assessment. Thisshould be an important topic for future research on poverty/ environment links in ourfocal countries.
Access to Clean Water and Sanitation
Safe water and adequate sanitation are critical determinants of health status, particularlyfor children. Ingestion of coliform bacteria from contaminated drinking water or food isa prime cause of diarrheal disease, which is in turn a major cause of infant mortality indeveloping countries. Although data remain limited in Southeast Asia, we use theavailable information to assess the spatial relationships linking poverty, sanitation anddiarrheal disease. At present, many households in the two countries do not have access tosafe water or sanitation. A poverty/environment nexus exists if the affected householdsare disproportionately poor. We use maps, scatter plots and regressions to test for thispossibility.
Outdoor Air Pollution
Outdoor air pollution is primarily an urban phenomenon, whose severity depends on thescale of polluting activity, its pollution intensity (or pollution per unit of output), and thecharacteristics of the urban air shed. Recent research has established that exposure tofine particulates (diameters of 10 microns (PM1o) or less) is the main cause of pollution-related respiratory disease. Until recently, little was known about fine-particulatepollution levels in Southeast Asian cities. During the past year, however, the WorldHealth Organization and the World Bank have used a large international database todevelop a prediction model for PMIo pollution, based on urban population, income, fueluse and local atmospheric characteristics (wind, rainfall, temperature, altitude, etc.).3
Combining this model with standard "dose-response" functions, we project PM1 Oconcentrations and their impacts on health in urban areas of Cambodia and Lao PDR.Aggregation of the results to the provincial level enables us to test for a
_-poverty/environment nexus by assessing the spatial correlation between poverty andhealth damage from outdoor air pollution.
3 See Bolt, et al. (2002).
8
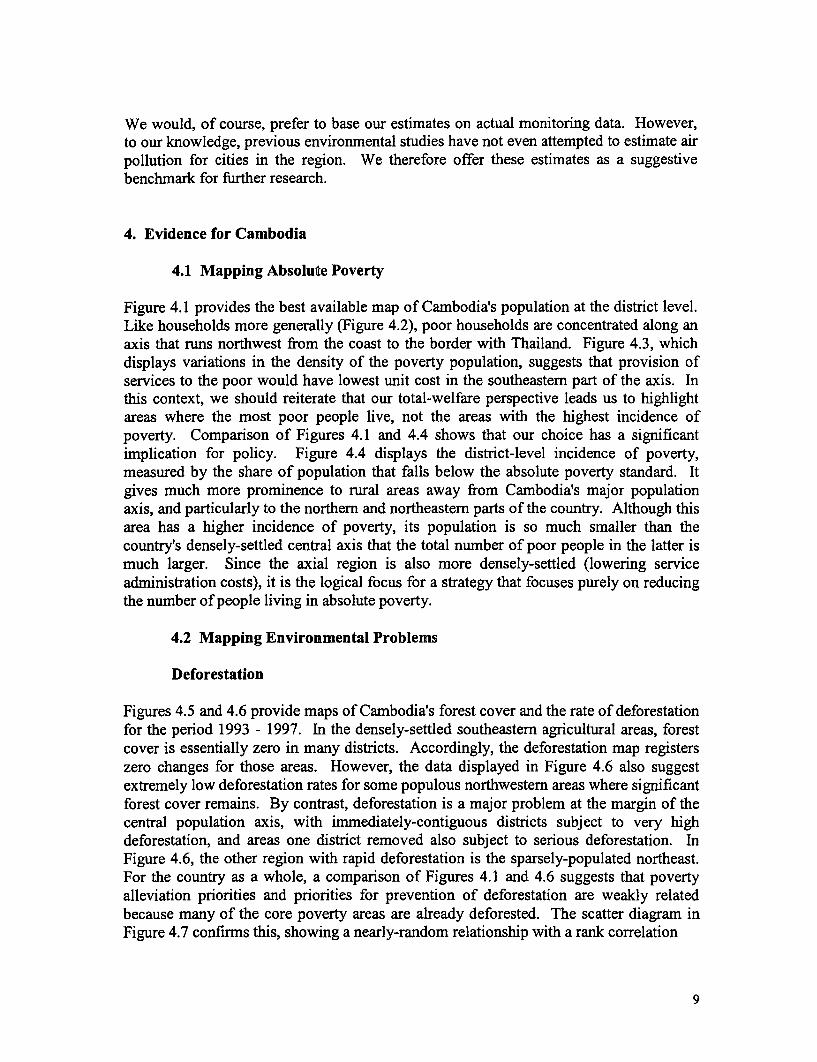
We would, of course, prefer to base our estimates on actual monitoring data. However,to our knowledge, previous environmental studies have not even attempted to estimate airpollution for cities in the region. We therefore offer these estimates as a suggestivebenchmark for further research.
4. Evidence for Cambodia
4.1 Mapping Absolute Poverty
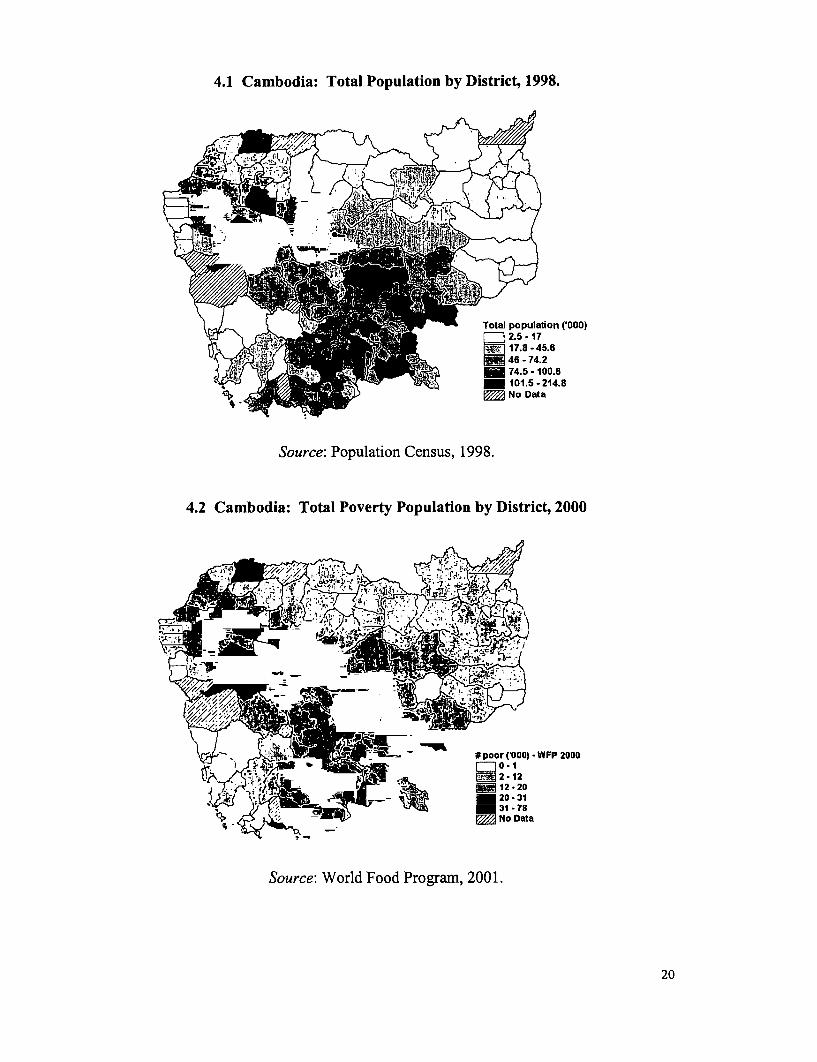
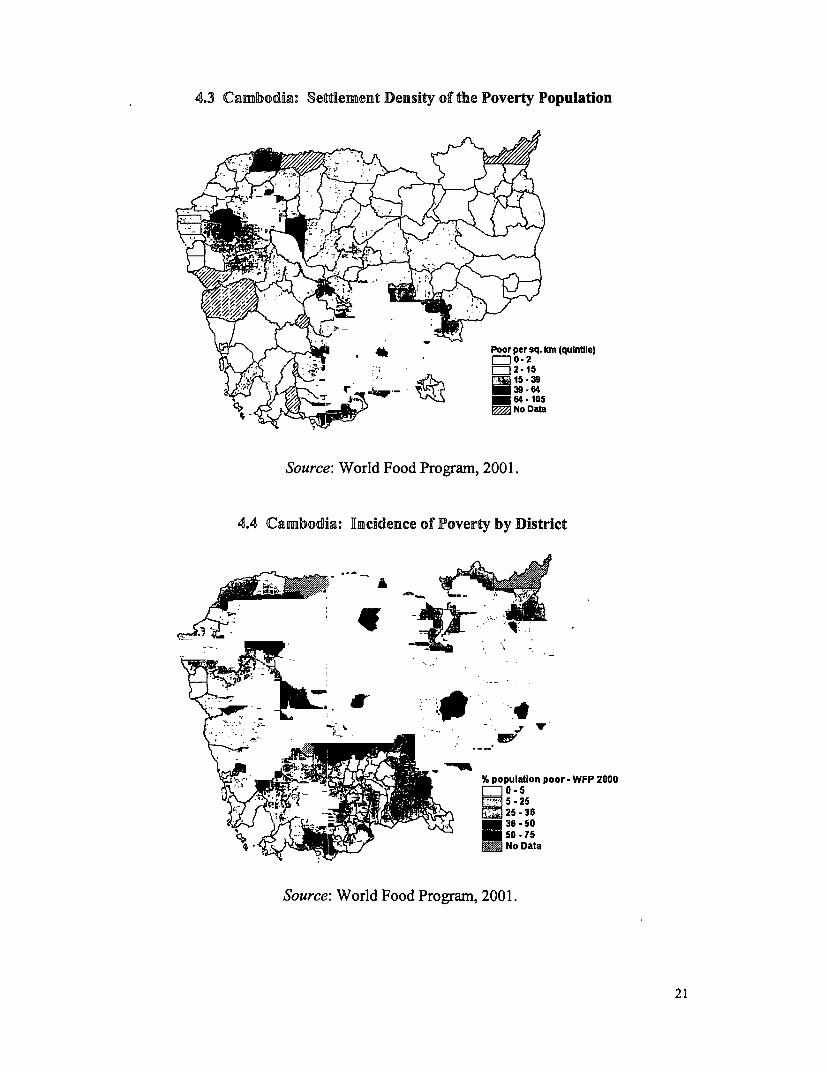
Figure 4.1 provides the best available map of Cambodia's population at the district level.Like households more generally (Figure 4.2), poor households are concentrated along anaxis that runs northwest from the coast to the border with Thailand. Figure 4.3, whichdisplays variations in the density of the poverty population, suggests that provision ofservices to the poor would have lowest unit cost in the southeastern part of the axis. Inthis context, we should reiterate that our total-welfare perspective leads us to highlightareas where the most poor people live, not the areas with the highest incidence ofpoverty. Comparison of Figures 4.1 and 4.4 shows that our choice has a significantimplication for policy. Figure 4.4 displays the district-level incidence of poverty,measured by the share of population that falls below the absolute poverty standard. Itgives much more prominence to rural areas away from Cambodia's major populationaxis, and particularly to the northern and northeastern parts of the country. Although thisarea has a higher incidence of poverty, its population is so much smaller than thecountry's densely-settled central axis that the total number of poor people in the latter ismuch larger. Since the axial region is also more densely-settled (lowering serviceadministration costs), it is the logical focus for a strategy that focuses purely on reducingthe number of people living in absolute poverty.
4.2 Mapping Environmental Problems
Deforestation
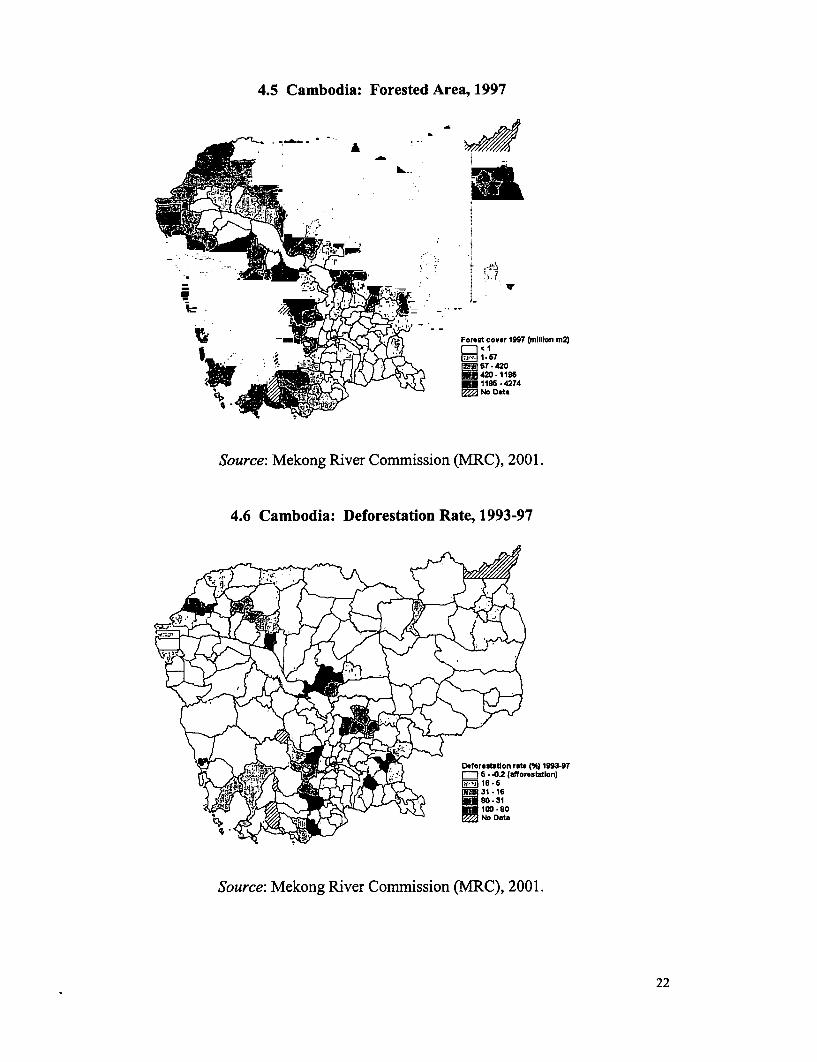
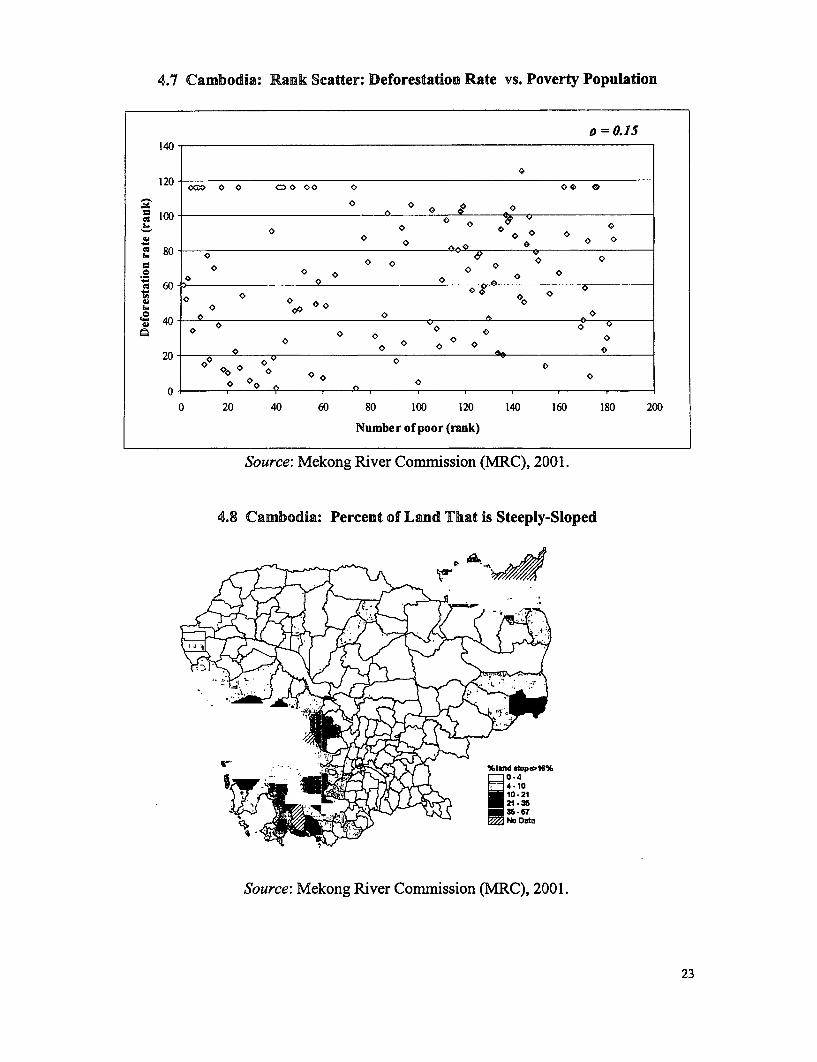
Figures 4.5 and 4.6 provide maps of Cambodia's forest cover and the rate of deforestationfor the period 1993 - 1997. In the densely-settled southeastern agricultural areas, forestcover is essentially zero in many districts. Accordingly, the deforestation map registerszero changes for those areas. However, the data displayed in Figure 4.6 also suggestextremely low deforestation rates for some populous northwestern areas where significantforest cover remains. By contrast, deforestation is a major problem at the margin of thecentral population axis, with immediately-contiguous districts subject to very highdeforestation, and areas one district removed also subject to serious deforestation. InFigure 4.6, the other region with rapid deforestation is the sparsely-populated northeast.For the country as a whole, a comparison of Figures 4.1 and 4.6 suggests that povertyalleviation priorities and priorities for prevention of deforestation are weakly relatedbecause many of the core poverty areas are already deforested. The scatter diagram inFigure 4.7 confirms this, showing a nearly-random relationship with a rank correlation
9
of 0.14.
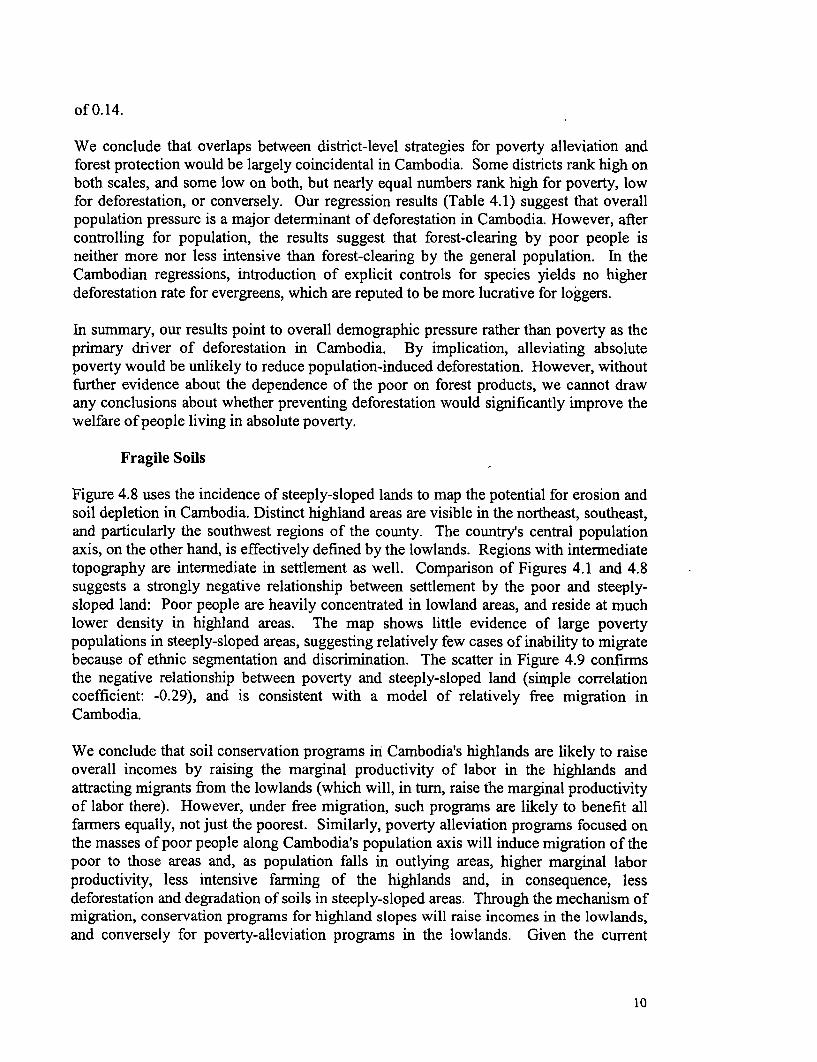
We conclude that overlaps between district-level strategies for poverty alleviation andforest protection would be largely coincidental in Cambodia. Some districts rank high onboth scales, and some low on both, but nearly equal numbers rank high for poverty, lowfor deforestation, or conversely. Our regression results (Table 4.1) suggest that overallpopulation pressure is a major determinant of deforestation in Cambodia. However, aftercontrolling for population, the results suggest that forest-clearing by poor people isneither more nor less intensive than forest-clearing by the general population. In theCambodian regressions, introduction of explicit controls for species yields no higherdeforestation rate for evergreens, which are reputed to be more lucrative for loggers.
In summary, our results point to overall demographic pressure rather than poverty as theprimary driver of deforestation in Cambodia. By implication, alleviating absolutepoverty would be unlikely to reduce population-induced deforestation. However, withoutfiu-ther evidence about the dependence of the poor on forest products, we cannot drawany conclusions about whether preventing deforestation would significantly improve thewelfare of people living in absolute poverty.
Fragile Soils
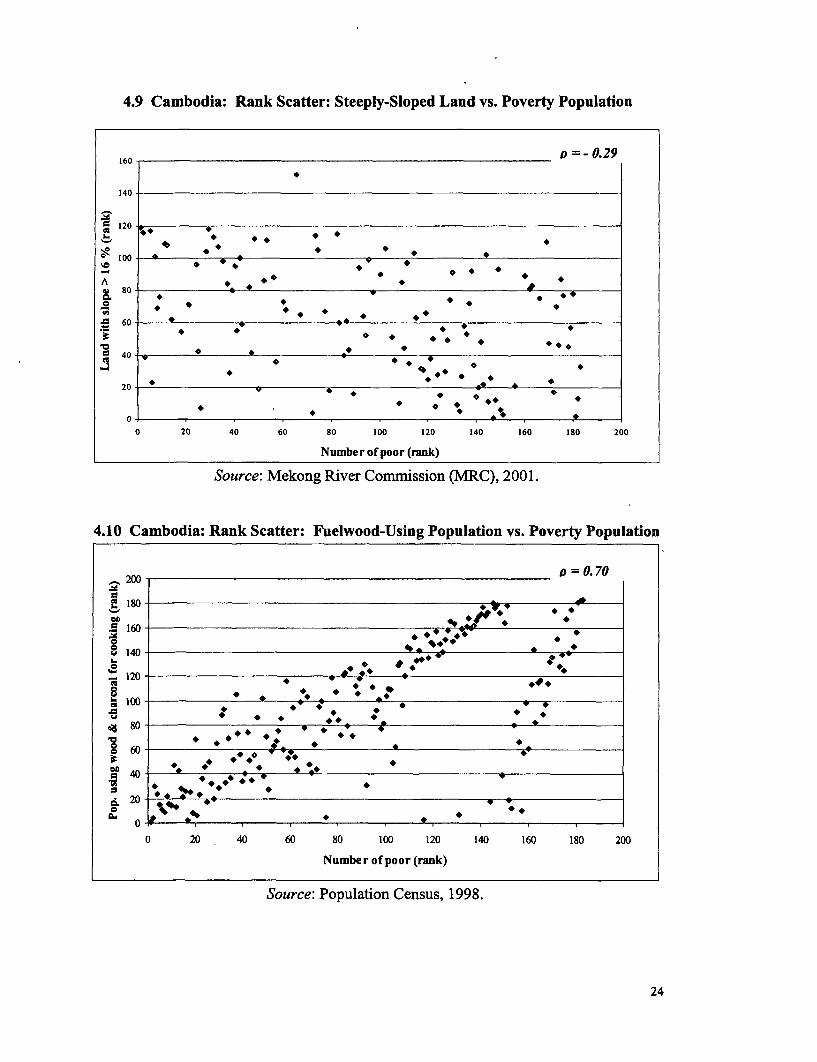
Figure 4.8 uses the incidence of steeply-sloped lands to map the potential for erosion andsoil depletion in Cambodia. Distinct highland areas are visible in the northeast, southeast,and particularly the southwest regions of the county. The country's central populationaxis, on the other hand, is effectively defined by the lowlands. Regions with intermediatetopography are intermediate in settlement as well. Comparison of Figures 4.1 and 4.8suggests a strongly negative relationship between settlement by the poor and steeply-sloped land: Poor people are heavily concentrated in lowland areas, and reside at muchlower density in highland areas. The map shows little evidence of large povertypopulations in steeply-sloped areas, suggesting relatively few cases of inability to migratebecause of ethnic segmentation and discrimination. The scatter in Figure 4.9 confirmsthe negative relationship between poverty and steeply-sloped land (simple correlationcoefficient: -0.29), and is consistent with a model of relatively free migration inCambodia.
We conclude that soil conservation programs iri Cambodia's highlands are likely to raiseoverall incomes by raising the marginal productivity of labor in the highlands andattracting migrants from the lowlands (which will, in turn, raise the marginal productivityof labor there). However, under free migration, such programs are likely to benefit allfarmers equally, not just the poorest. Similarly, poverty alleviation programs focused onthe masses of poor people along Cambodia's population axis will induce migration of thepoor to those areas and, as population falls in outlying areas, higher marginal laborproductivity, less intensive farnning of the highlands and, in consequence, lessdeforestation and degradation of soils in steeply-sloped areas. Through the mechanism ofmigration, conservation programs for highland slopes will raise incomes in the lowlands,and conversely for poverty-alleviation programs in the lowlands. Given the current
10
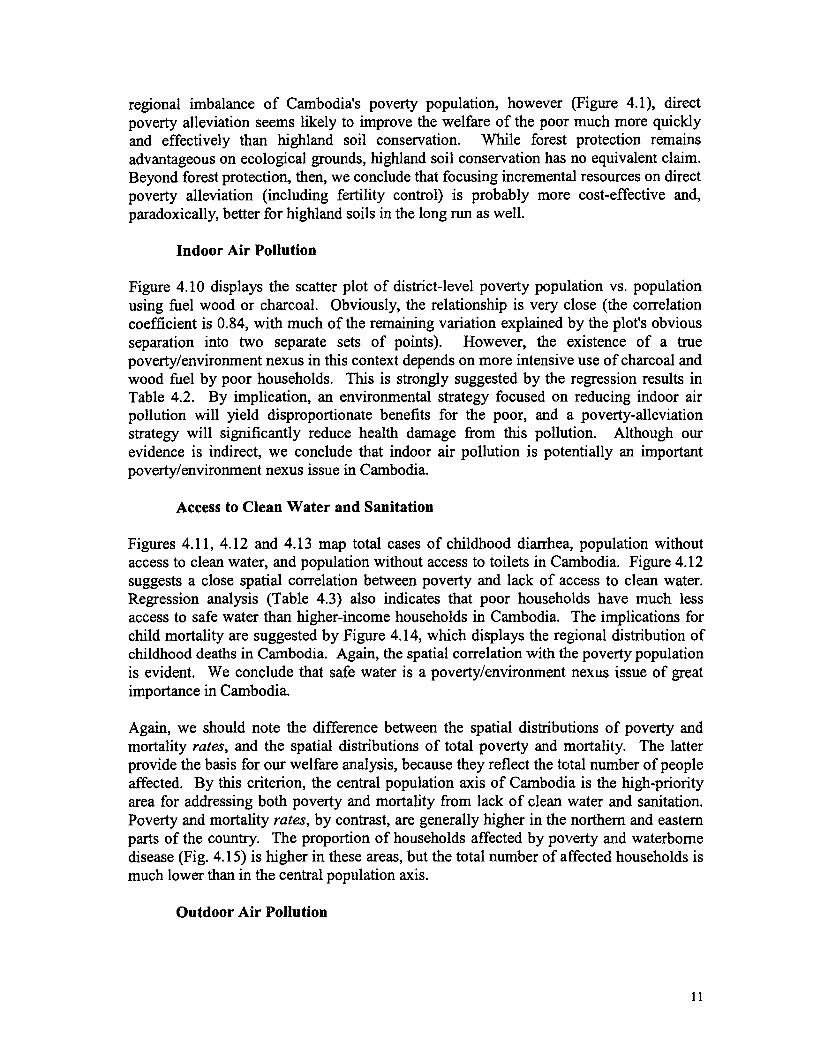
regional imbalance of Cambodia's poverty population, however (Figure 4.1), directpoverty alleviation seems likely to improve the welfare of the poor much more quicklyand effectively than highland soil conservation. While forest protection remainsadvantageous on ecological grounds, highland soil conservation has no equivalent claim.Beyond forest protection, then, we conclude that focusing incremental resources on directpoverty alleviation (including fertility control) is probably more cost-effective and,paradoxically, better for highland soils in the long run as well.
Indoor Air Pollution
Figure 4.10 displays the scatter plot of district-level poverty population vs. populationusing fuel wood or charcoal. Obviously, the relationship is very close (the correlationcoefficient is 0.84, with much of the remaining variation explained by the plot's obviousseparation into two separate sets of points). However, the existence of a truepoverty/environment nexus in this context depends on more intensive use of charcoal andwood fuel by poor households. This is strongly suggested by the regression results inTable 4.2. By implication, an environmental strategy focused on reducing indoor airpollution will yield disproportionate benefits for the poor, and a poverty-alleviationstrategy will significantly reduce health damage from this pollution. Although ourevidence is indirect, we conclude that indoor air pollution is potentially an importantpoverty/environment nexus issue in Cambodia.
Access to Clean Water and Sanitation
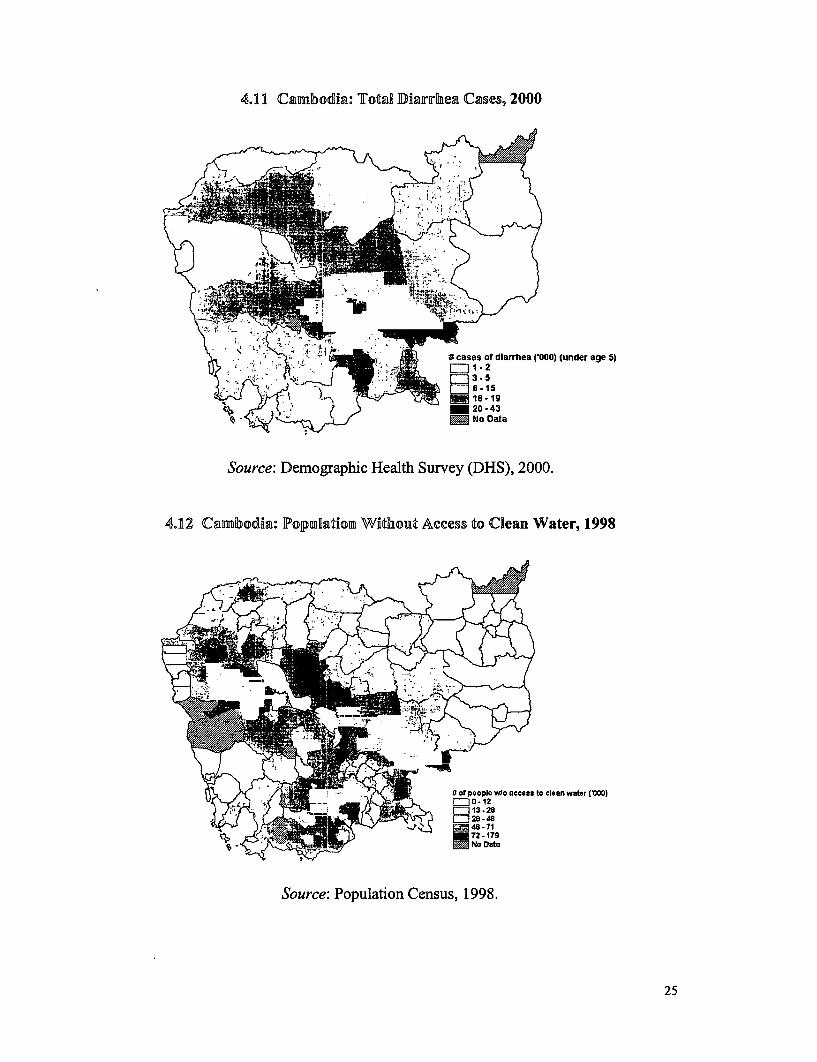
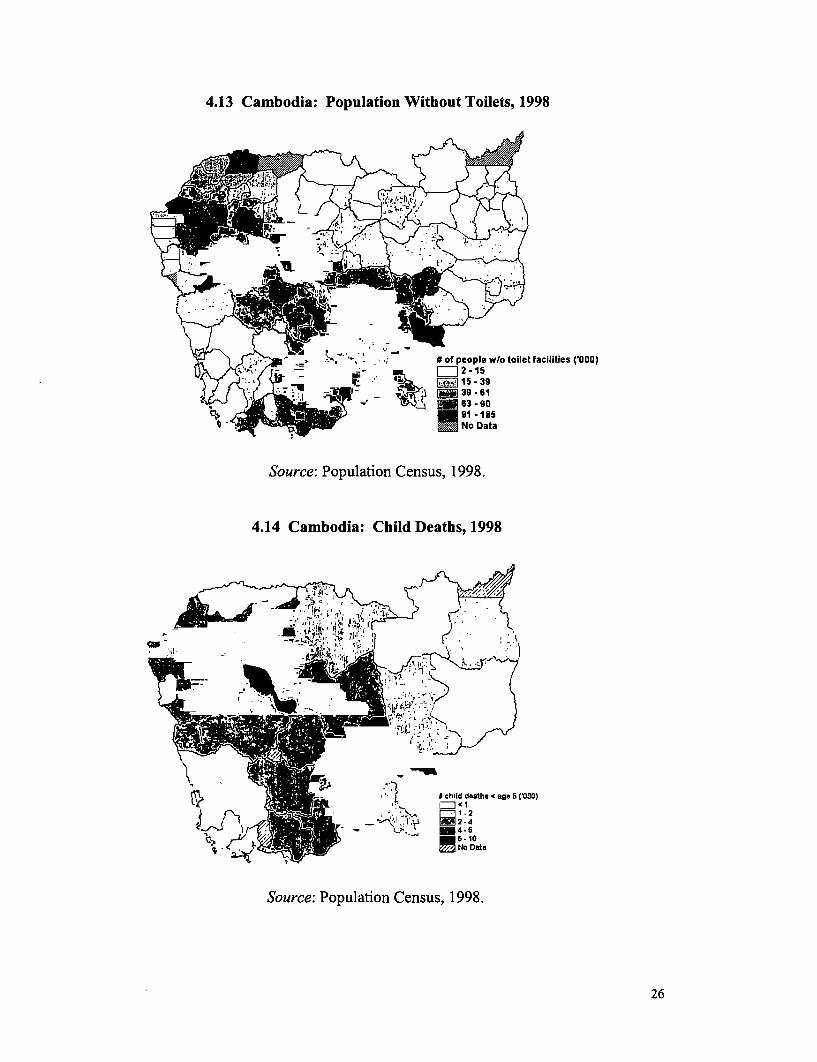
Figures 4.11, 4.12 and 4.13 map total cases of childhood diarrhea, population withoutaccess to clean water, and population without access to toilets in Cambodia. Figure 4.12suggests a close spatial correlation between poverty and lack of access to clean water.Regression analysis (Table 4.3) also indicates that poor households have much lessaccess to safe water than higher-income households in Cambodia. The implications forchild mortality are suggested by Figure 4.14, which displays the regional distribution ofchildhood deaths in Cambodia. Again, the spatial correlation with the poverty populationis evident. We conclude that safe water is a poverty/environment nexus issue of greatimportance in Cambodia.
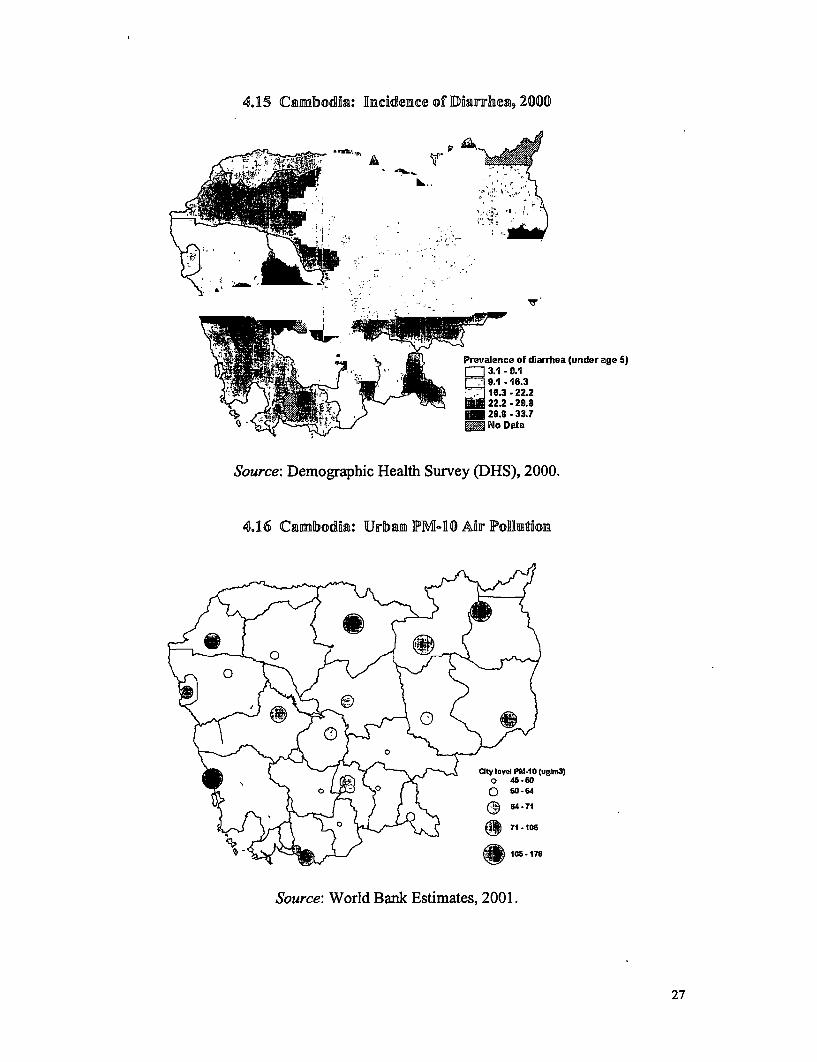
Again, we should note the difference between the spatial distributions of poverty andmortality rates, and the spatial distributions of total poverty and mortality. The latterprovide the basis for our welfare analysis, because they reflect the total number of peopleaffected. By this criterion, the central population axis of Cambodia is the high-priorityarea for addressing both poverty and mortality from lack of clean water and sanitation.Poverty and mortality rates, by contrast, are generally higher in the northem and eastemparts of the country. The proportion of households affected by poverty and waterbomedisease (Fig. 4.15) is higher in these areas, but the total number of affected households ismuch lower than in the central population axis.
Outdoor Air Pollution
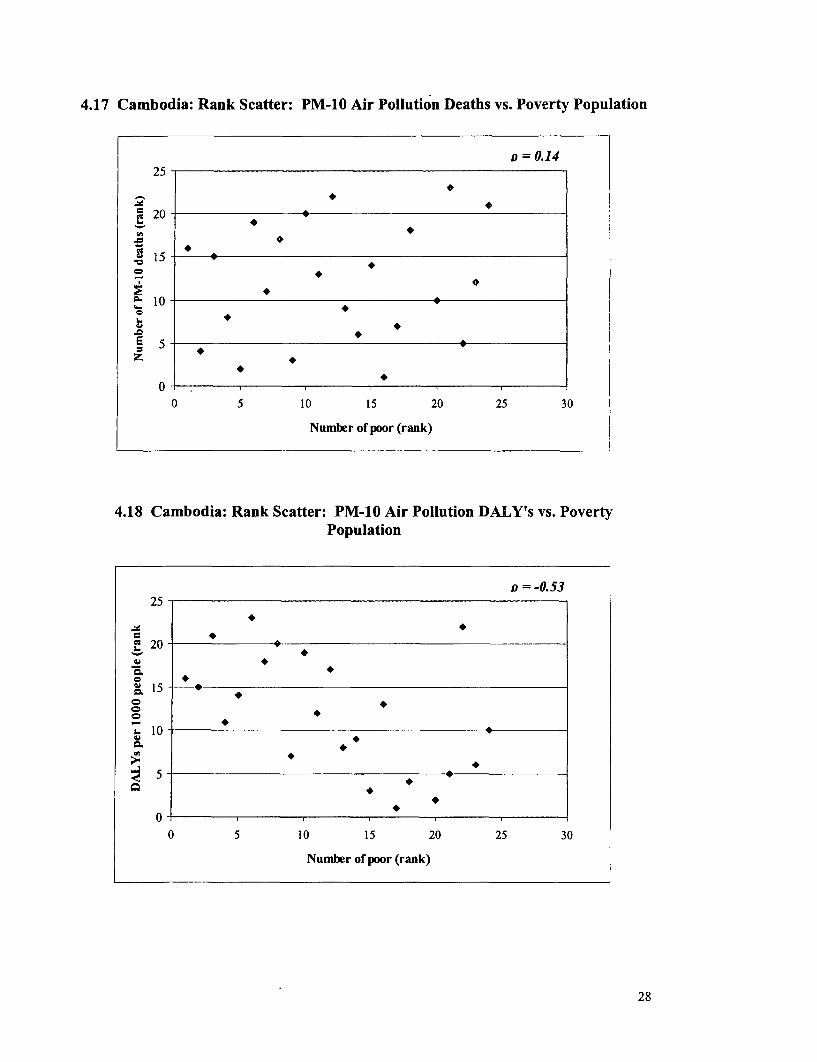
Using the WHO/World Bank model, we project PM1o pollution levels for urban areas inCambodian cities. Figure 4.16 indicates that estimated pollution levels are generallyhigher in cities located in Cambodia's population periphery. Using standard "dose-response" models, we estimate the resulting loss of life and average loss of productivelife-years for these cities and aggregated the results to the provincial level. The results,displayed in Figures 4.17 and 4.18, suggest minimal correlation (0.14) between povertypopulation and deaths from air pollution, and a strongly negative correlation (-0.53)between poverty population and loss of productivity-adjusted life years. The latterreflects differences in provincial demographic composition, and suggests that provinceswith relatively severe air pollution have populations that are, on average, significantlyyounger than the others. In these provinces, the loss of a life translates to the loss of alonger working life and, therefore, a greater productivity loss.
We conclude that outdoor air pollution is not a critical poverty/environment nexus issuein Cambodia. By South- and East-Asian standards, Cambodia has a relatively smallPM1 O problem because it is lightly-industrialized and its motor vehicle fleet is relativelysmall. The WHO/World Bank model estimates total national mortality from air pollutionto be around 1,000 per year, with an associated annual cost that is less than 1% of grossnational income.
4.3 The Poverty/Environment Nexus in Cambodia
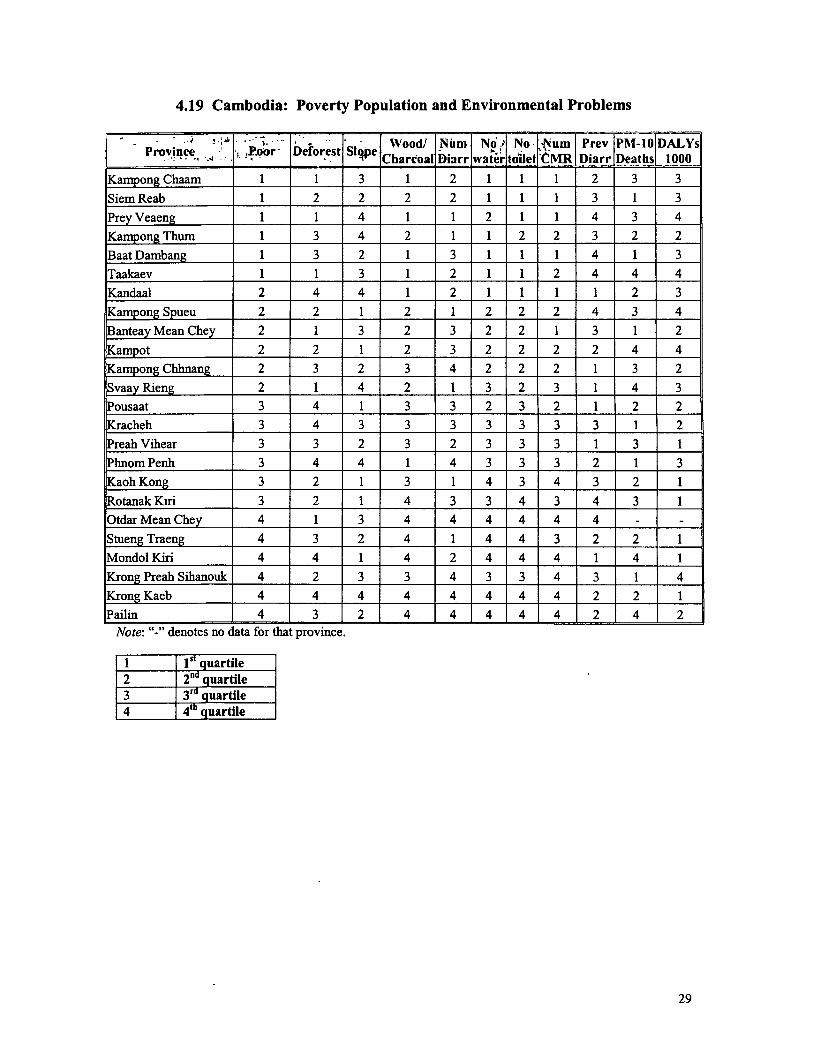
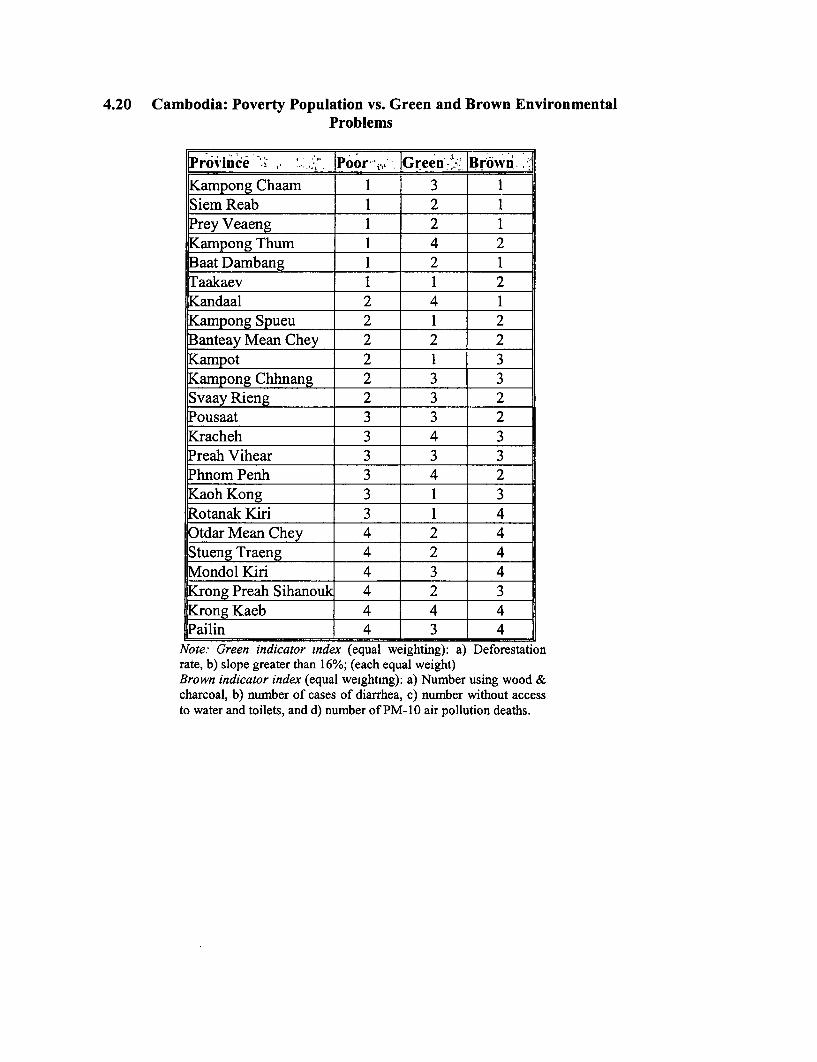
Figure 4.19 summarizes the available evidence for Cambodia's poverty population,deforestation, fragile soils, indoor air pollution, mortality from diarrhea, and mortalityfrom outdoor air pollution. The elements of the matrix are color-coded by severity forease of comparison. Figure 4.20 further summarizes the evidence by presenting averagerankings for the first two ("Green") indices and the last three ("Brown") indices. Whenprovinces are color-coded in four groups, the pattern suggests clear instances of thepoverty/environment nexus for indoor air pollution and water contamination. Bycontrast, there is no evident relationship between the spatial distributions of poverty anddeaths from outdoor air pollution. Nor does there appear to be a significant spatialrelationship between poverty and either of the Green indices. On the basis of currently-available evidence, we conclude that the poverty/environment nexus in Cambodia islargely confined to household-level problems associated with contaminated air and water.
5. Evidence for Lao PDR
5.1 Mapping Absolute Poverty
As Fig. 5.1 shows, provinces at the northern and southern ends of Lao PDR have thehighest percentages of population living below the poverty line. However, the substantialincidence of poverty in more populous areas produces a more even distribution of thetotal poverty population (Figure 5.2). The northern region remains the poorest, but theaffected area expands to include the more populous western districts. As in theCambodian case, a total welfare perspective implies focusing a poverty-reduction
12
strategy on areas where the poor are both numerous and living in relatively highconcentrations. By these criteria, the appropriate focus would be in the northern andsouth-central regions of the country.
5.2 Mapping Environmental Problems
Deforestation
Figures 5.3 and 5.4 provide evidence on forest cover and the rate of deforestation in LaoPDR during the 1990's. They highlight a critical problem in the north, where therelatively small forested area is being cleared at a rapid rate. By contrast, the southernregion of the country has relatively dense forests and relatively low rates of deforestation.Since the poverty and deforestation maps overlap only in the north, it is not clear whetherpoverty itself has any particular significance for deforestation. As in Cambodia, we testthis link with a regression of the rate of deforestation on population per forested area,poverty population per forested area, and controls for tree species (Table 5.1). Thespecies results are similar to those for Cambodia, suggesting that evergreen-dominatedareas are not experiencing faster deforestation once we control for population andpoverty. Between the latter two variables, population density alone is a sufficient controlfor demographic pressure. As in the Cambodian case, we conclude that the evidencedoes not indicate a causal relationship between poverty and deforestation. Basicdemographics seem to tell the story. However, the north is clearly a region in which alarge poverty population is co-located with a high-priority deforestation problem.Although we see no evidence of causality, then, the northern region of Lao PDR isundeniably high-priority for both poverty reduction and forest conservation.
Fragile Soils
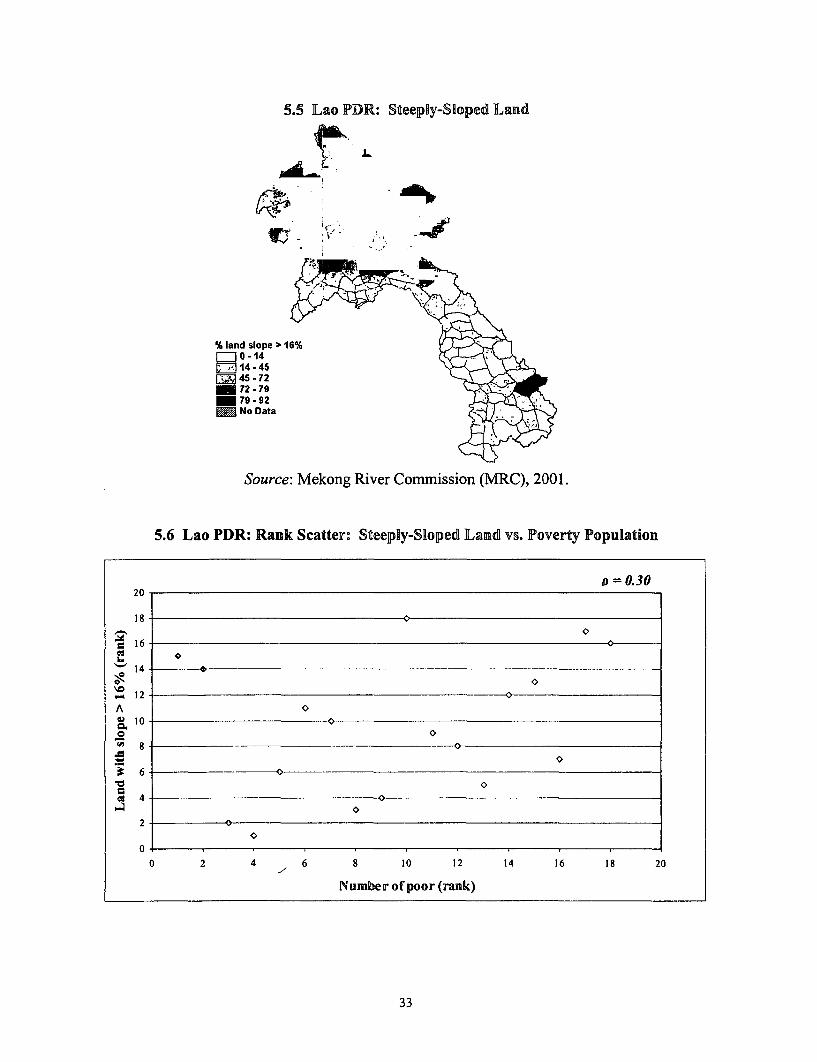
Figures 5.2 and 5.5 provide useful evidence on population clustering on marginal lands inLao PDR. As we noted in Section 3, clustering of poor people in steeply-sloped areasprovides strong suggestive evidence that patterns of ethnic segmentation anddiscrimination have prevented migration from equalizing expected returns to farning indifferent locations. Figure 5.5 shows that the northern and southeastern regions of LaoPDR have extensive steeply-sloped areas. Comparison with Figure 5.2 suggests thatsegmentation is not a problem in the south, since the major poverty areas are not in thehighlands. However, the northern region provides a very different picture. Here poorhouseholds are heavily settled in steeply-sloped areas. Although more micro-levelanalysis would be useful, this evidence suggests that population segmentation has createda poverty/enviromnent nexus in the northern highlands. The scatter in Figure 5.6provides additional supporting evidence, by showing a generally positive relationshipbetween poverty population and erosion potential (measured as the percent of land that issteeply sloped).
Indoor Air Pollution
13
Table 5.2 summarizes the results of regressions that test the impact of poverty onconsumption of wood fuels in Lao PDR. Both linear and log models show that use ofwood fuel and charcoal is far more prevalent among poverty households than in thegeneral population. In fact, the results are much stronger than for Cambodia. Weconclude that indoor air pollution is likely to be an important poverty/environment nexusissue in Lao PDR.
Access to Clean Water and Sanitation
Figures 5.7 - 5.11 provide evidence on the relationship between poverty, sanitation andmortality. Figure 5.7 overlays the estimated number of people without access to safewater on the poverty map. The impression of a strong relationship is confirmed by thescatter in Figure 5.8, which indicates a rank correlation of 0.85 between poverty and lackof access to safe water. A similarly-positive, but somewhat weaker, relationship existsfor access to sanitation (Figure 5.9). The results are clearly visible in Figures 5.10 and5.11, which depict the strong relationship between infant diarrhea and poverty. Weconclude that poverty, safe water, sanitation and infant mortality from diarrhea constituteanother important poverty/environment nexus in Lao PDR.
Outdoor Air Pollution
Figure 5.12 shows that northern Laotian cities have generally-higher estimated airpollution than southern cities. We combine projected air pollution with dose-responsemodels to obtain estimates of total mortality. As Figure 5.13 shows, the result is a highspatial correlation (0.68) between the poverty population and estimated deaths from airpollution. As in Cambodia, however, estimated mortality from air pollution is not highby Asian standards because Lao PDR is not heavily industrialized and the motor vehiclefleet is relatively small.
5.3 The Poverty/Environment Nexus in Lao PDR
Figures 5.14 and 5.15 summarize the evidence on poverty/environment links in Lao PDR.Unlike the Cambodian case, the Lao poverty/environment nexus spans all theenvironmental indices that we consider. Figure 5.14 shows a strong correspondencebetween poverty rank and environment rank in all five categories -- deforestation, erosionpotential, indoor air pollution, contaminated water, outdoor air pollution -- particularlyfor the lowest- and highest-income provinces. When the environmental rankings arecombined into "Green" and "Brown" indices, the correlation is clear across all theprovinces. We conclude that the poverty/environment nexus is very strongly defined forLao PDR, and that the potential synergy between poverty alleviation and environmentalpolicies is very high. The north- and northeastern regions of the country appear to be themain locus for action in this context.
14
6. Summary and Conclusions
In this paper, we have sought to identify the poverty/environment nexus in Cambodia andLao PDR. Our analysis has focused on spatial relations between poverty populations andenvironmental problems at the district and provincial levels. Currently-available datawill not support more spatially-disaggregated analysis. In addition, we believe that aregional focus dovetails with administrative requirements for environmental and povertyalleviation programs. However, we recognize that sub-regional analysis could revealsome additional poverty/environment links, as well as providing a better guide for spatialtargeting of programs. For this reason, we hope that future research projects will promotemore extensive data collection and analysis at the local level.
Our study identifies a poverty/environment nexus for cases where settlement by poorhouseholds exhibits strong spatial correlation with each of five principal environmentalproblems: deforestation, fragile soils, indoor air pollution, unsafe water and sanitation,and outdoor air pollution. Our results suggest that the nexus is quite different in eachcountry. In Cambodia, it seems largely confined to household-level problems associatedwith indoor air pollution, contaminated water, and lack of access to adequate sanitation.Neither our two Green problems (deforestation, fragile soils) nor outdoor air pollutionappear related to the distribution of the poverty population at the district or provincelevels. We conclude that poor households in Cambodia would benefit most strongly fromprograms that jointly address poverty and household-level environmental quality. At thesame time, all of Cambodia's citizens, including the poor, would benefit from moreeffective measures to reduce the rate of deforestation.
On the other hand, our results suggest a much broader poverty/environment nexus in LaoPDR, since all five environmental problems exhibit a spatial correlation with poverty.The overlap is particularly strong in the northern and northeastern regions of the country.We conclude that the welfare of the poor in Lao PDR would be significantly enhanced byclose integration of poverty-alleviation and environmental strategies in all Green andBrown dimensions. A geographic focus on the north would appear to be most beneficial.
Comparison of results for the two countries suggests a common poverty/environmentnexus only for indoor air pollution. It may therefore be appropriate to develop a regionalstrategy for addressing this problem. We recognize that our analysis is far fromexhaustive, and other environmental problems may also warrant close attention. Possiblecandidates include depleted and polluted fisheries (Ahmed et al., 1998; FACT & EJF,2002), and the excessive use of pesticides in Cambodia (EJF, 2002; Koma et al., 2000;Koma et al., 2001). Future research should explore these issues more fully.
15
7. References
Ahmed, M., H. Navy, L. Vuthy, and M. Tiongco, 1998, Socio-Economic Assessment ofFreshwater Capture Fisheries of Cambodia: Report On a Household Survey,Mekong River Commission: Phnom Penh, Cambodia.
Akbar, S. and K. Lvovsky, 2000, "Indoor Air Pollution: Energy and Health for the Poor,"ESMAP Newsletter No. 1, World Bank: Washington, DC.
Albla-Betrand, J. M., 1993, The Political Economy of Large Natural Disasters,Clarendon Press: Oxford, UK.
Ambler, J., 1999, "Attacking Poverty While Improving the Environment: Toward Win-Win Policy Options," Background technical paper prepared for the September 1999Forum of Ministers meeting, under the UNDP-EC Poverty and EnvironmentInitiative; also in Attacking Poverty While Improving the Environment: TowardWin-Win Policy Options (2001), Poverty and Environment Initiative, UNDP: NewYork.
Arnold, J. E. M. and P. Bird, 1999, "Forest and the Poverty-Environment Nexus," Paperpresented at the UNDP-EC Expert Workshop on Poverty and the Environment,Brussels, Belgium, January 20-21, 1999; also in Attacking Poverty WhileImproving the Environment: Toward Win-Win Policy Options (2001), Povertyand Environment Initiative, UNDP: New York.
Barbier, E., 2000, "The Economic Linkages between Rural Poverty and LandDegradation: Some Evidence from Africa. Agriculture, Ecosystems and Environment,Vol. 82, pp. 355-370.
Bolt, K., U. Deichmann, K. Hamilton, C. Meisner, B. Ostro, K. Pandey, and D. Wheeler,2002. "The Human Cost of Air Pollution: New Estimates for Developing Countries,"World Bank Policy Research Working Paper, World Bank: Washington, DC(forthcoming).
Bosch, C., K. Hommann, G. M. Rubio, C. Sadoff and L. Travers, 2001, Water,Sanitation and Poverty Chapter, Poverty Reduction Strategy Papers' SourceBook, World Bank: Washington, DC.
Brocklesby, M. A. and E. Hinshelwood, 2001, Poverty and the Environment: What thePoor Say: An Assessment of Poverty-Environment Linkages in Participatory PovertyAssessments, Centre for Development Studies, University of Wales Swansea, UK.
Brooks, N. and R. Sethi, 1997, "The Distribution of Pollution: CommunityCharacteristics and Exposure to Air Toxins," Journal of Environmental Economicsand Management, 32: 233-250.
16
Bucknall, J., C. Kraus and P. Pillai, 2000, "Poverty and the Environment, EnvironmentStrategy Background Paper," World Bank: Washington, DC.
Cavendish, W., 2000, "Empirical Regularities in the Poverty-Environment Relationshipof African Rural Households. World Development, 28 (11): 1979-2003.
Cavendish, W., 1999, "Poverty, Inequality and Enviromnental Resources: QuantitativeAnalysis of Rural Households," Working Paper Series 99-9. Centre for the Studies ofAfrican Economies. University of Oxford: Oxford, UK.
Chomitz, K., 1999, "Environment-Poverty Connections in Tropical Deforestation,"Discussion notes prepared for the WDR Summer Workshop on Poverty andDevelopment, Washington, DC, July 6-8, 1999.
Cleaver, K. M. and G. A. Schreiber, 1994, Reversing the Spiral: The Population,Agriculture, and Environment Nexus in Sub-Saharan Africa, World Bank:Washington, DC.
Cropper, M., C. Griffiths, and M. Mani, 1999, "Roads, Population Pressures, andDeforestation in Thailand, 1976 - 1989," Land Economics, 75 (1): 58-73.
Dasgupta, P. and K.-G. Maler, 1994, "Poverty, Institutions and the Environment-Resource Base," World Banlc Enviromnent Paper No. 9, World Bank: Washington,DC.
Duming, A. B., 1989, "Poverty and the Enviromnent: Reversing the Downward Spiral,"Worldwatch Paper No. 92, Worldwatch Institute: Washington, DC.
Dutt, A. K. and J. M. Rao, 1996, "Growth, Distribution and the Environment: SustainableDevelopment in India," World Development, 24 (2): 287-305.
Environment Justice Foundation (EJF), 2002, Death in Small Doses: Cambodia'sPesticides Problems and Solutions, Environment Justice Foundation: London, UK.
Ekbom, A. and J. Bojo, 1999, "Poverty and Environment: Evidence of Links andIntegration in the Country Assistance Strategy Process," World Bank Africa RegionDiscussion Paper No. 4, World Bank: Washington, DC.
Eskeland, G. S. and C. Kong, 1998, "Protecting the Environment and the Poor: A PublicGoods Framework and an Application to Indonesia," World Bank Policy ResearchWorking Paper No. 1961, World Bank: Washington, DC.
Ezzati, M. and D. Kammen, 2001, "Indoor Air Pollution from Biomass Combustion as aRisk Factor for Acute Respiratory Infections in Kenya: An Exposure-ResponseStudy," Lancet, 358(9281): 619-624.
17
Filmer, D. and L. Pritchett; 1997, "Child Mortality and Public Spending on Health: HowMuch Does Money Matter?" World Bank Policy Research Department WorkingPaper No. 1864, December.
Fisheries Action Coalition Team (FACT) and Environment Justice Foundation (EJF),2002, Feast or Famine? Solutions to Cambodia's Fisheries Conflicts,Environment Justice Foundation: London, UK.
Heath, J. and H. Binswanger, 1996, "Natural Resource Degradation Effects of Povertyand Population Growth are Largely Policy Induced: The Case of Columbia,"Environment and Development Economics, 1 (1): 65-83.
Holden, S. T., 1996, "Adjustment Policies, Peasant Household Resource Allocation andDeforestation in Northern Zambia: an Overview and some Policy Conclusions," in 0.Stokke (Ed.) Forum for Development Studies, No. 1, 1997, Norwegian Institute ofInternational Affairs: Flekkefjord.
Kepe, T., 1999, "Environmental Entitlements in Mkambati: Livelihoods, SocialInstitutions and Environmental Change on the Wild Coast of the Eastern Cape,"Research Report No. 1, Sussex University, Institute for Development Studies andPLASS (Program for Land and Agrarian Studies): Sussex, UK.
Koma, Y. S., K. Makarady and L. S. Horng, 2001, The Situation of Pesticide Use in theTonle Sap Catchment, Cambodia Center for Study and Development in Agriculture(CEDAC): Phnom Penh, Cambodia.
Koma, Y. S., K. Makarady and L. S. Homg, 2000, Pesticide Market in Cambodia,Cambodia Center for Study and Development in Agriculture (CEDAC): Phnom Penh,Cambodia.
Leach, M. and R. Meams, 1991, "Poverty and Environment in Developing Countries: AnOverview Study," Sussex University, Institute of Development Studies: Sussex, UK.
Merick T., 1985, "The Effect of Piped Water on Early Childhood Mortality in UrbanBrazil," 1970-1976, Demography, Vol. 22: 1-14.
Mink, S., 1993, "Poverty, Population and the Environment," World Bank DiscussionPaper No. 189, World Bank: Washington, DC.
Myers, N. and J. Kent, 1995, Environmental Exodus - An Emergent Crisis in theGlobal Arena, Climate Institute: Washington, DC.
Pearce, D. W. and J. J. Warford, 1993, World Without End - Economics,Environment and Sustainable Development, Oxford University Press: New York.
18
Prakash, S., 1997, Poverty and Environment Linkages in Mountains and Uplands:Reflections on the "Poverty Trap" thesis, CREED Working paper Series No 12,IIED, London.
Reddy, S. R. C. and S. P. Chakravarty, 1999, "Forest Dependence and IncomeDistribution in a Subsistence Economy: Evidence from India," World Development,27(7): 1141-1149.
Roe, E., 1998, Taking Complexity Seriously: Policy Analysis, Triangulation andSustainable Development, Kluwer Academic Publishers: Boston, USA.
Songsore, J. and G. McGranahan, 1993, "Environment, Wealth and Health: Towards anAnalysis of Intra-urban Differentials within the Greater Accra Metropolitan Area,Ghana," Environment and Urbanization, 5 (2): 10-34.
Surjadi, C., 1993, "Respiratory Diseases of Mothers and Children and EnvironmentalFactors Among Households in Jakarta," Environment and Urbanization, 5 (2): 78-86.
World Bank, 1992, World Development Report 1992 - Development and theEnvironment, Oxford University Press: New York.
World Commission on Environment and Development, 1987, Our Common Future,Report of the World Commission on Environment and Development, OxfordUniversity Press: Oxford, UK.
19
4.1 Cambodia: Total Population by District, 1998.
Total population ('000)
17.8 -45.646 -74.274.5 -100.6101.5-.214.8No Data
Source: Population Census, 1998.
4.2 Cambodia: Total Poverty Population by District, 2000
b~~~
~~~~ #~~~~poor (000) -WFP 2000
' X ~~~~~~~~~~~~~~~~~31 -78No Data
Source: World Food Programn, 2001.
20
4.3 Cambodia: Settlement Density of the Poverty Population
Poor per sq. km (quintile)
V< Sg ';F' '; ~ ~~~~ 2- 15
t'~~~ 64 v _ 1i 05Ci ,& J _ = ~~~~~~~~~No Data
Source: World Food Program, 2001.
4.4 Cambodia: [ncidence of Poverty by District
% population poor -WFP 20"0
8 1: ~~~~~~~rNo Data
Source: World Food Program, 2001.
21
4.5 Cambodia: Forested Area, 1997
ML
* ~~~~~Foresrt cover 1997 (millIlon m2)
,,_~~~~~~~~~~~~~~G - 420.
1r'~~~~~~~~~~~~~~~~~~2 . '.-95
Deforesttion rate i1993-9= 6 --0.2 (aforestatlon)
1l!le&e5~~~~~~~E 1- .5
,.~~~~~~~~~~~~~~~E X3, : 1 -
=3No Data
'
Source: Mekong River Commission (MRC), 2001.
22
4.7 Cambodia: Rank Scatter: Deforestation Rate vs. Poverty Population
o = 0.15140
200o 0 40 60 0 10 1
0~~~~~~~~
*..080 *no~~~
QJ 3 0 0 0cu60~~~~~~~
60 ~ 00
0 0
0 0 40 6 0 10 1010 16 0 18 20
Source: Mekong River Commission (MRC), 2001.
0-21
0 0 ~~~~~~~~~~~~I.
Source: Mekong River Commnission (MRC), 2001.
4.8 Cambdia: Perent of and Thatis Steepy-Slo2e
4.9 Cambodia: Rank Scatter: Steeply-Sloped Land vs. Poverty Population
60 D =-0.29
140-
120
~100 *
A
o 20 40 60 80 loo 120 140 160 ISO 200
Number of poor (mnk)
Source: Mekong River Commission (MRC), 2001.
4.10 Cambodia: Rank Scatter: Fuelwood-Using Population vs. Poverty Population
I~~~ .l
160
120
'U 40 2
20** * 4
0440 20 40 60 80 100 120 140 160 180 200
Number of poor (rank)
S Sourekon Rivertio Commsusio 1M9 ),9001
4.10 amboia: ank cattr: Felwod-Usig Poulaton v. PoertyPopuatio
4.111 Cambodia: Total Diarrhea Cases, 2000
8 cases of diarrhea ('000) (under age 5)
Source: Demographic Health Survey (DHS), 2000.
4.12 Cambodiia: Population Withouat Access to Clean Water, 1998
n ~~~~~~~~~~~~~~~D ot poopla wlo access to cleanl water (000O)
Source: Population Census, 1998.
25
4.13 Cambodia: Population Without Toilets, 1998
# of people w/o toilet facilities ('000)
< .f ~~~~ ;t - t 15-~~~39
aaf t ) | ~~WS 63l -0 90<~~~~~~FA i ) 9 -185
g - t _ B ~~~~~~~~No Data
Source: Population Census, 1998.
4.14 Cambodia: Child Deaths, 1998
A ChIld deaths <age 6 oa
6. 0otlNo Data
Source: Population Census, 1998.
26
4.15 Cambodia: -.ncidemce of Diarrhea, 2000
~~~~~~~~~~~~~~~~~91- 11 .3ho...
5 r t ' _ ',;; Xi...'-
!~~~~~~~~~2. .33.>, K ~~~~~~~~~~~Prevalence of diarrhea (under age 5)
Source: Demographic Health Survey (DHS), 2000.
4.16 Cambodia: Urban PM-10 Air PolRlution
/v S at 0 loylPMl(ugfm3)' > L 9 6 ~~~~~~~~~~o 4 -60
Source: World Bank Estimates, 2001.
27
4.17 Cambodia: Rank Scatter: PM-10 Air Pollution Deaths vs. Poverty Population
D =0.1425
20 2
15-
15o
2- *0
C 10 *
00 5 10 15 20 25 30
Number of poor (rank)
4.18 Cambodia: Rank Scatter: PM-10 Air Pollution DALY's vs. PovertyPopulation
o =-0.5325
~20 -
.15 -
10
o
0,
0 5 10 15 20 25 30
Number of poor (rank)
28
4.19 Cambodia: Poverty Population and Environmental Problems
. i 2 ;*1 ' -- W | ^ - [ | iood,' INiim Noi No ,Num Prev fPMf-l10DALYs: Prov,mee, S '; .oor JDeforest SIe Charcoal Diarr water tile 'CR Diarr Deaths 1000
Kampong Chaam 1 1 3 1 2 1 1 1 2 3 3
Siem Reab 1 2 2 2 2 1 1 1 3 1 3
Prey Veaeng 1 1 4 1 1 2 1 1 4 3 4
Kampong Thum 1 3 4 2 1 1 2 2 3 2 2
Baat Dambang 1 3 2 1 3 1 1 1 4 1 3
Taakaev 1 1 3 1 2 1 1 2 4 4 4
Kandaal 2 4 4 1 2 1 1 1 1 2 3
Kampong Spueu 2 2 1 2 1 2 2 2 4 3 4
Banteay Mean Chey 2 1 3 2 3 2 2 1 3 1 2
Kampot 2 2 1 2 3 2 2 2 2 4 4
Kanipong Chhnang 2 3 2 3 4 2 2 2 1 3 2
Svaay Rieng 2 1 4 2 1 3 2 3 1 4 3
Pousaat 3 4 1 3 3 2 3 2 1 2 2
Kracheh 3 4 3 3 3 3 3 3 3 1 2
Preah Vihear 3 3 2 3 2 3 3 3 1 3 1
Phnom Penh 3 4 4 1 4 3 3 3 2 1 3
Kaoh Kong 3 2 1 3 1 4 3 4 3 2 1
Rotanak Kri 3 2 1 4 3 3 4 3 4 3 1
Otdar Mean Chey 4 1 3 4 4 4 4 4 4 - -
Stueng Traeng 4 3 2 4 1 4 4 3 2 2 1
Mondol Kiri 4 4 1 4 2 4 4 4 1 4 1
Krong Preah Sihanouk 4 2 3 3 4 3 3 4 3 1 4
Krong Kaeb 4 4 4 4 4 4 4 4 2 2 1
Pailin 4 3 2 4 4 4 4 4 2 4 2Note: "-" denotes no data for that province.
I1 is quartile2 2d quartile3 3 rd quartile4 4th quartile
29
4.20 Cambodia: Poverty Population vs. Green and Brown EnvironmentalProblems
IProvince >~ [ i :.,' |Poor ,., IGreen I*' |Brown .:1Kampong Chaam 1 3 1Siem Reab 1 2 1Prey Veaeng 1 2 1Kampong Thum 1 4 2Baat Dambang 1 2 1Taakaev 1 1 2Kandaal 2 4 1Kampong Spueu 2 1 2Banteay Mean Chey 2 2 2Kampot 2 1 3Kampong Chhnang 2 3 3Svaay Rieng 2 3 2Pousaat 3 3 2Kracheh 3 4 3Preah Vihear 3 3 3Phnom Penh 3 4 2Kaoh Kong 3 1 3Rotanak Kiri 3 1 4Otdar Mean Chey 4 2 4Stueng Traeng 4 2 4Mondol Kiri 4 3 4Krong Preah Sihanouk 4 2 3Krong Kaeb 4 4 4Pailin 4 3 4
Note: Green indicator index (equal weighting): a) Deforestationrate, b) slope greater than 16%; (each equal weight)Brown indicator index (equal weighting): a) Number using wood &charcoal, b) number of cases of diarrhea, c) number without accessto water and toilets, and d) number of PM-IO air pollution deaths.

5.1 Lao PDR: Incidence of Poverty, 1997/98
fh
% population poor (World Bank)E14 23E23 -38
38 -48_48 -53 Q- _53 -70
Source: G. Datt & L. Wang (World Bank), 2001.
5.2 Lao PDR: Poverty Population, 1997/98
Number of poor ('000) (World Bank) *= 28 -41
43 - 6370 -102
* 104 -1391e9 - 229
Source: G. Datt & L. Wang (World Bank), 2001.
31

5.3 Lao PDR: Forested Area, 1997
Forest cover 1997 (million m2)= 0 -126
fi 141 -3823 388 -654
671 -11531166-38 - F
Source: Mekong River Commission (MRC), 2001.
5.4 Lao PDR: Deforestation Rate, 1993-97
Deforestabon rate (%) 1993-97= .4.6 -0 (aflorestation)
12.5 -23.1ANo Data
Source: Mekong River Commission (MRC), 2001.
32
5.5 Lao PDR: Steeply-Sloped Land
_,-
% land slope > 16%0 0-14ILiTIJ 4 -45
72 -7.: ,9_
79- 92ENo Data
Source: Mekong River Commission (MRC), 2001.
5.6 Lao PDR: Rank Scatter: Steeply-Sloped Land vs. Poverty Population
0=0.3020
18
i 16 o
' 14
- 12An 10 O
J 8
¢6
's 4
2
00 2 4 6 8 10 12 14 16 18 20
Number of poor (rank)
33
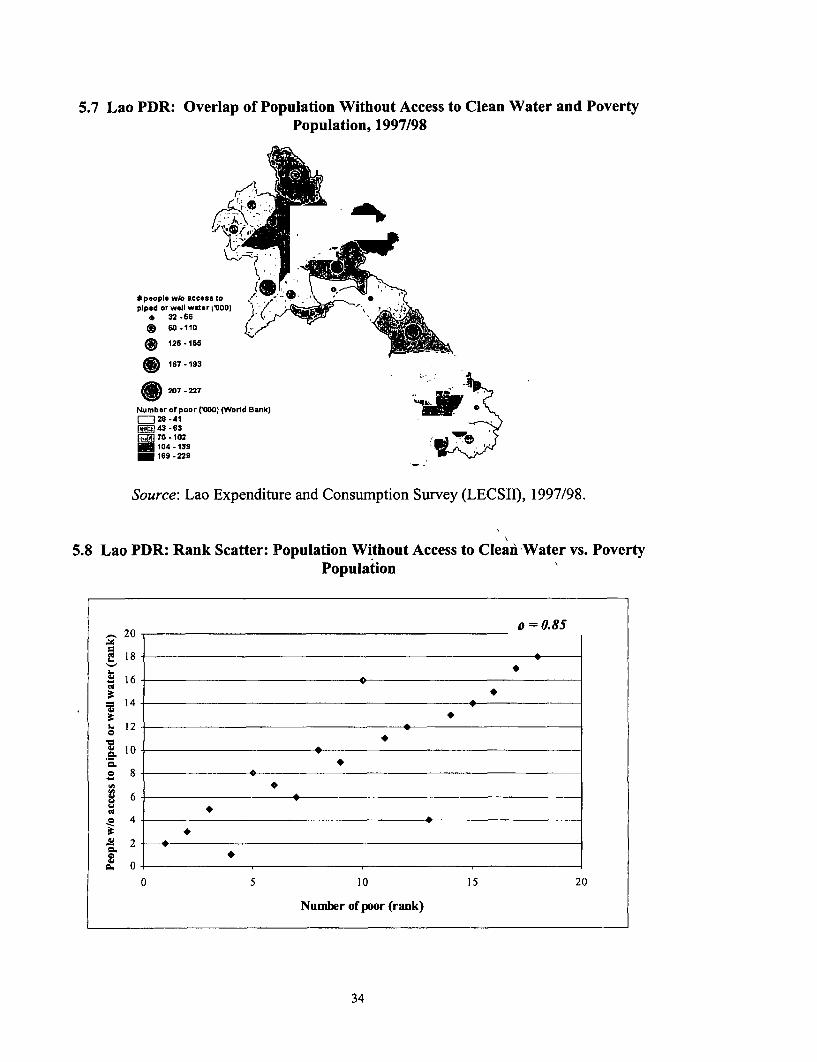
5.7 Lao PDR: Overlap of Population Without Access to Clean Water and PovertyPopulation, 1997/98
*people who access to opiped orwell water ti00 0°°1 '
*32 .66 2r'4~~s 60.110
* 126-166
@ 167 -193
207 .227
Number ofpoor ('000) (World Bank)[= 286-41ffZ 43 -63
O 70.102104 -1391169 -229
Source: Lao Expenditure and Consumption Survey (LECSII), 1997/98.
5.8 Lao PDR: Rank Scatter: Population Without Access to Clean Water vs. PovertyPopulation
20 o= .85
18
16
=14
. 12
10
8
X 4
X 20.
0 5 10 15 20
Number of poor (rank)
34
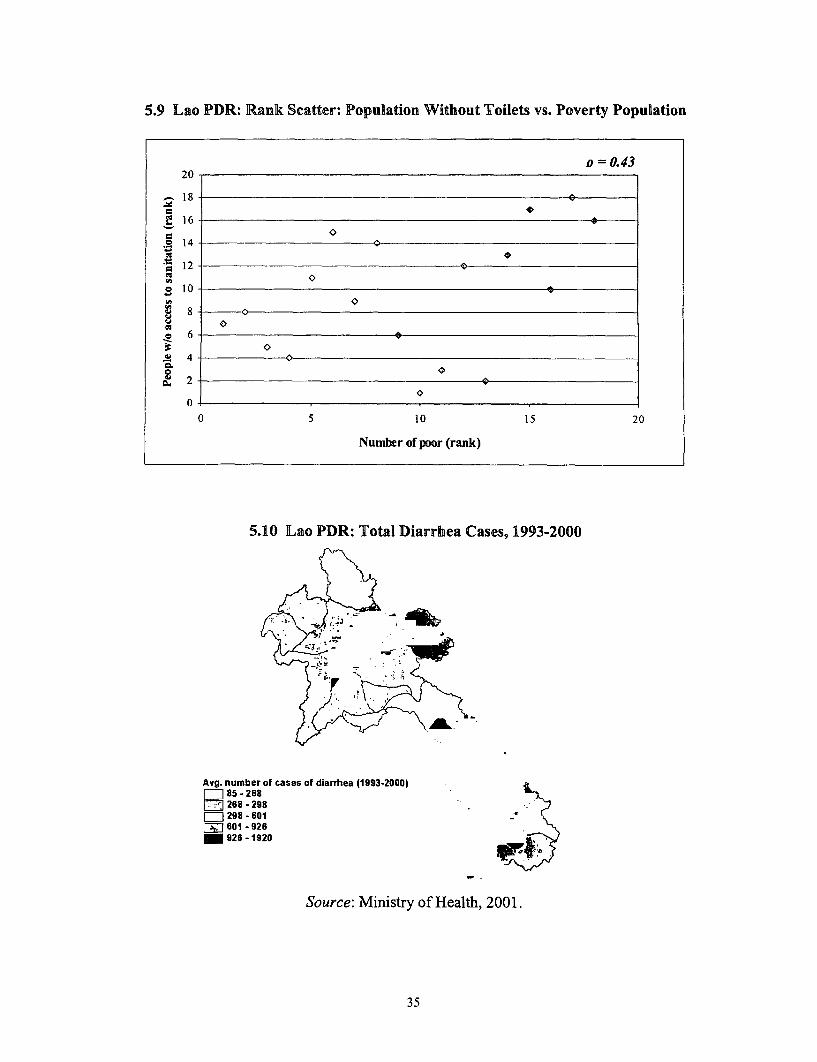
5.9 Lao PDR: Rank Scatter: Population Without Toilets vs. Poverty Population
D 0.4320
18
" 160~~~~~~
o 14
1 2>*; 120
10
18 O0
o6
.f 4
2 2
0
0 5 10 15 20
Number of poor (rank)
5.10 Lao PDR: Total Diarrhea Cases, 1993-2000
U. -; --
Avg. number of cases of diarrhea (1993-2000)85 - 268268 -298
C 298 -601*@ 601 .926
926 -1920
Source: Ministry of Health, 2001.
35

5.11 Lao PDR: Overlap of Diarrhea Cases and Poverty Population
Avg. #cases of dlanfhea(1993-2000)
o 85 -268O 268-298
298 . 601
601 -926
926 1920
Number of poor CO00) (World Bank)E b 28 -41Z 43 -63
70 - 102- 104- 139 4
169 -229
5.12 Lao PDR: Urban PM-10 Air Pollution
City level PM-10 (uglm3)o 48-54C 54-65
65 - 73
8 73-83
83-97
Source: World Bank Estimates, 2001.
36
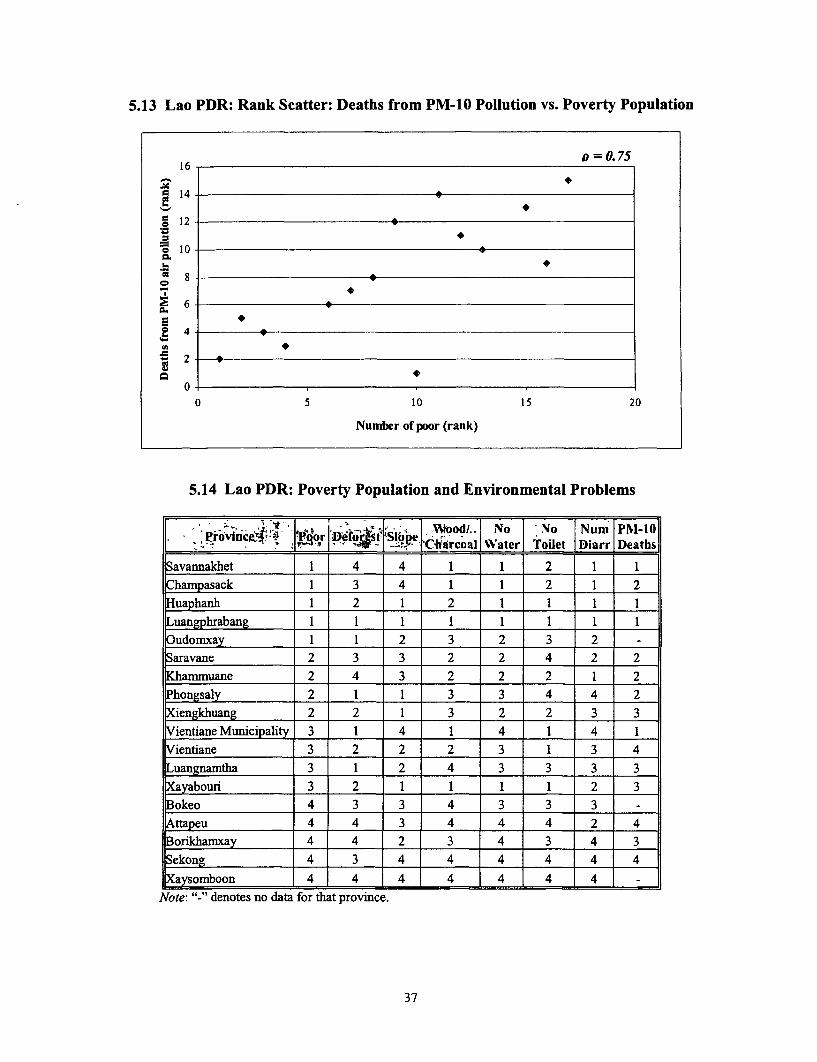
5.13 Lao PDR: Rank Scatter: Deaths from PM-10 Pollution vs. Poverty Population
D =0.7516-
'14
= 12
o 10
8 8
6-
2-
0
0 5 10 15 20
Number of poor (rank)
5.14 Lao PDR: Poverty Population and Environmental Problems
~~~~ ~~~od/.- F No No fN m JPMN 1O].________________ ,loorovin--.~{C4nirc' lwater Toilet I ) iar r Deaths
Savannakhet 1 4 4 1 1 2 1 1Champasack 1 3 4 1 1 2 1 2
Huaphanh 1 2 1 2 1 1 1 1
Luangphrabang 1 1 1 1 1 1 1 1
Oudomxav 1 1 2 3 2 3 2 -
Saravane 2 3 3 2 2 4 2 2
Khammuane 2 4 3 2 2 2 1 2
Phongsaly 2 1 1 3 3 4 4 2
Xiengkhuang 2 2 1 3 2 2 3 3
Vientiane Municipality 3 1 4 1 4 1 4 1
Vientiane 3 2 2 2 3 1 3 4
Luangnamtha 3 1 2 4 3 3 3 3
Xayabouri 3 2 1 1 1 1 2 3
Bokeo 4 3 3 4 3 3 3 -
Attapeu 4 4 3 4 4 4 2 4
Borikhamxay 4 4 2 3 4 3 4 3
Sekong 4 3 4 4 4 4 4 4
Xaysomboon 4 4 4 4 4 4 4Note: "-" denotes no data for that province.
37
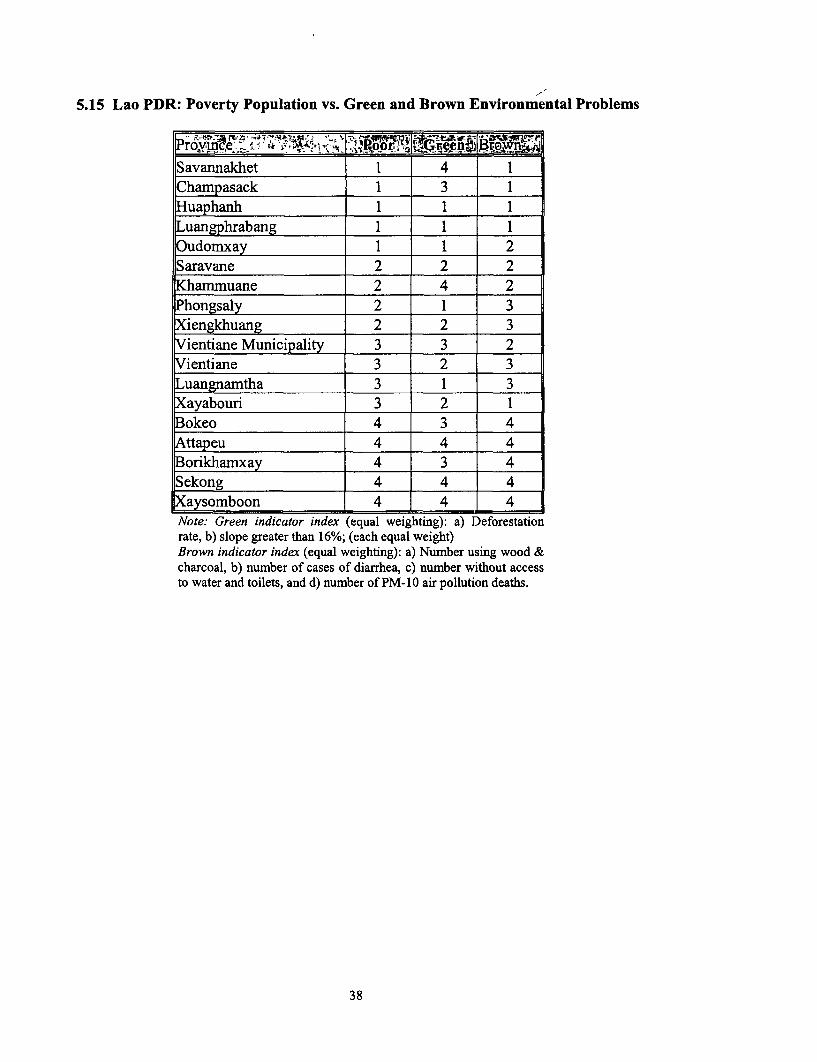
5.15 Lao PDR: Poverty Population vs. Green and Brown Environmental Problems
Savannakhet 1 4 1Champasack 1 3 1Huaphanh 1 1 1Luangphrabang 1 1 1Oudomxay 1 1 2Saravane 2 2 2Khammuane 2 4 2Phongsaly 2 1 3Xiengkhuang 2 2 3Vientiane Municipality 3 3 2Vientiane 3 2 3Luangnamtha 3 1 3Xayabouri 3 2 1Bokeo 4 3 4Attapeu 4 4 4Borikhamxay 4 3 4Sekong 4 4 4Xaysomboon 4 4 4Note: Green indicator index (equal weighting): a) Deforestationrate, b) slope greater than 16%; (each equal weight)Brown indicator index (equal weighting): a) Number using wood &charcoal, b) number of cases of diarrhea, c) number without accessto water and toilets, and d) number of PM- 10 air pollution deaths.
38
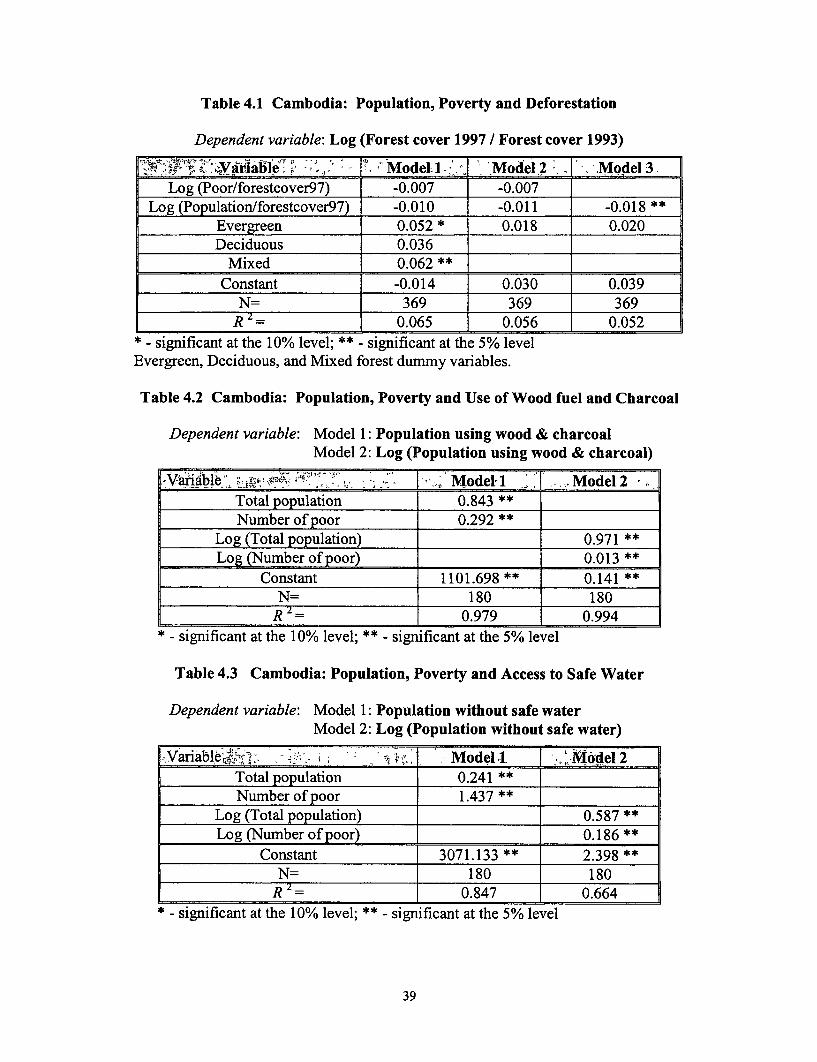
Table 4.1 Cambodia: Population, Poverty and Deforestation
Dependent variable: Log (Forest cover 1997 / Forest cover 1993)
t:Aar1atleE;. ° Model Model2 .Model 3Log (Poor/forestcover97) -0.007 -0.007
Log (Population/forestcover97) -0.010 -0.011 -0.018 **Evergreen 0.052* 0.018 0.020Deciduous 0.036
Mixed 0.062 **
Constant -0.014 0.030 0.039N= 369 369 369
R = 0.065 0.056 0.052* - significant at the 10% level; ** - significant at the 5% levelEvergreen, Deciduous, and Mixed forest dummy variables.
Table 4.2 Cambodia: Population, Poverty and Use of Wood fuel and Charcoal
Dependent variable: Model 1: Population using wood & charcoalModel 2: Log (Population using wood & charcoal)
Vairi ble s ' d' ModeIl . '-Model2Total population 0.843 **
Number of poor 0.292 **
Log (Total population) 0.971 **Log (Number of poor) 0.013 **
Constant 1101.698 ** 0.141 **
N= 180 180R 2 . 0.979 0.994
* - significant at the 10% level; ** - significant at the 5% level
Table 4.3 Cambodia: Population, Poverty and Access to Safe Water
Dependent variable: Model 1: Population without safe waterModel 2: Log (Population without safe water)
V~5!ariable«& - -.. . ........ - i +. Model I -Model 2Total population 0.241 **
Number of poor 1.437 **
Log (Total population) l 0.587 **
Log (Number of poor) l _l 0.186 **
Constant 3071.133 ** 2.398 **
N= 180 180R = 0.847 0.664
* - significant at the 10% level; ** - significant at the 5% level
39
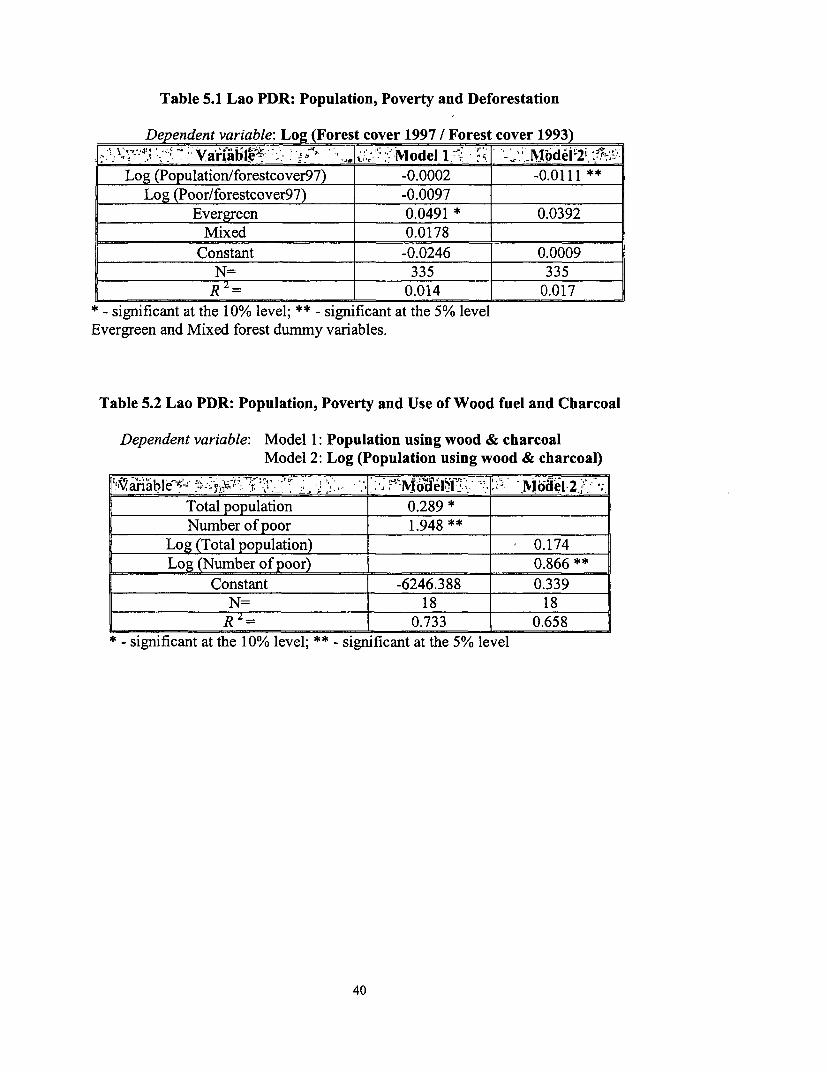
Table 5.1 Lao PDR: Population, Poverty and Deforestation
Dependent variable: Log (Forest cover 1997 / Forest cover 1993)<r;r-: -; -Variiabl- ^ e8 -- -- ' i .. : MNlodel 1 -. -; .odel 2" .2i
Log (Population/forestcover97) -0.0002 -0.0111 **
Log (Poor/forestcover97) -0.0097Evergreen 0.0491 * 0.0392
Mixed 0.0178
Constant -0.0246 0.0009N= 335 335
R 2 = 0.014 0.017* - significant at the 10% level; ** - significant at the 5% levelEvergreen and Mixed forest dummy variables.
Table 5.2 Lao PDR: Population, Poverty and Use of Wood fuel and Charcoal
Dependent variable: Model 1: Population using wood & charcoalModel 2: Log (Population using wood & charcoal)
lilt blR;'F;2e2-r al;~'- ' '1tl -' ; -oeI- ' - NIodel2 ;.
Total population 0.289 *
Number of poor 1.948 **
Log (Total population) 0.174Log (Number of poor) 0.866 **
Constant -6246.388 0.339N= 18 18
R 2_= 0.733 0.658* - significant at the 10% level; ** - significant at the 5% level
40


Policy Research Working Paper Series
ContactTitle Author Date for paper
WPS2938 Recurrent Expenditure Requirements Ron Hood December 2002 M Galatisof Capital Projects. Estimation for David Husband 31177Budget Purposes Fei Yu
WPS2939 School Attendance and Child Labor Gladys L6pez-Acevedo December 2002 M Gellerin Ecuador 85155
WPS2940 The Potential Demand for an HIV/ Hillegonda Maria Dutilh December 2002 H SladovichAIDS Vaccine in Brazil Novaes 37698
Expedito J A LunaMois6s GoldbaumSamuel KilsztajnAnaclaudia RossbachJose de la Rocha Carvalheiro
WPS2941 Income Convergence during the Branko Milanovic January 2003 P SaderDisintegration of the World 33902Economy, 1919-39
WPS2942 Why is Son Preference so Persistent Monica Das Gupta January 2003 M Das Guptain East and South Asia? A Cross- Jiang Zhenghua 31983Country Study of China, India, and the Li BohuaRepublic of Korea Xie Zhenming
Woojin ChungBae Hwa-Ok
WPS2943 Capital Flows, Country Risk, Norbert Fiess January 2003 R lzquierdoand Contagion 84161
WPS2944 Regulation, Productivity, and Giuseppe Nicoletti January 2003 Social ProtectionGrowth OECD Evidence Stefano Scarpetta Advisory Service
85267
WPS2945 Micro-Finance and Poverty Evidence Shahidur R Khandker January 2003 D AfzalUsing Panel Data from Bangladesh 36335
WPS2946 Rapid Labor Reallocation with a Jan Rutkowski January 2003 J RutkowskiStagnant UnemploymentFPoool The 84569Puzzle of the Labor,M4arket in Lithuania
WPS2947 Tax Systems in Transition Pradeep Mitra January 2003 S. Tassew/ Nicholas Stern 88212
WPS2948 The Impact of Contractual Savings Gregorio Impavido January 2003 P BraxtonInstitutions on Securities Markets Alberto R Musalem 32720
Thierry Tressel
WPS2949 Intersectoral Migration in Southeast Rita Butzer January 2003 P KokilaAsia Evidence from Indonesia, Yair Mundlak 33716Thailand, and the Philippines Donald F Larson
WPS2950 Is the Emerging Nonfarm Market Dominique van de Walle January 2003 H SladovichEconomy the Route Out of Poverty Dorothyjean Cratty 37698in Vietnam?
WPS2951 Land Allocation in Vietnam's Martin Ravallion January 2003 H SladovichAgrarian Transition Dominique van de Walle 37698

Policy Research Working Paper Series
ContactTitle Author Date for paper
WPS2952 The Effects of a Fee-Waiver Program Nazmul Chaudhury January 2003 N. Chaudhuryon Health Care Utilization among the Jeffrey Hammer 84230Poor Evidence from Armenia Edmundo Murrugarra
WPS2953 Health Facility Surveys An Magnus Lindelow January 2003 H. SladovichIntroduction Adam Wagstaff 37698
WPS2954 Never Too Late to Get Together Bartlomiej Kaminski January 2003 P FlewittAgain Turning the Czech and Slovak Beata Smarzynska 32724Customs Union into a Stepping Stoneto EU Integration
WPS2955 The Perversity of Preferences The Qaglar Ozden January 2003 P FlewittGeneralized System of Preferences Eric Reinhardt 32724and Developing Country TradePolicies, 1976-2000
WPS2956 Survey Compliance and the Johan A. Mistiaen January 2003 P. SaderDistribution of Income Martin Ravallion 33902
WPS2957 Mexico. In-Firm Training for the Hong Tan January 2003 H TanKnowledge Economy Gladys Lopez-Acevedo 33206
WPS2958 Globalization and Workers in Martin Rama January 2003 H. SladovichDeveloping Countries 37698
WPS2959 Wage Differentials and State- Michael M Lokshin January 2003 P. SaderPrivate Sector Employment Choice Branko Jovanovic 33902in the Federal Republic of Yugoslavia