Embed Size (px)
Citation preview

EQ
UIF
AX
INC
. | 20
16
AN
NU
AL
RE
PO
RT
2016 Annual Report
The Power of Insights
Equifax is a global information solutions company that uses trusted
unique data, innovative analytics, technology, and industry expertise to power organizations and individuals
around the world by transforming knowledge into insights that help make more informed business and
personal decisions. The company organizes, assimilates and analyzes data on more than 820 million
consumers and more than 91 million businesses worldwide, and its database includes employee data
contributed from more than 7,100 employers.
Headquartered in Atlanta, Ga., Equifax operates or has investments in 24 countries in North America,
Central and South America, Europe and the Asia Pacific region. It is a member of Standard & Poor’s (S&P)
500® Index, and its common stock is traded on the New York Stock Exchange (NYSE) under the symbol
EFX. Equifax employs approximately 9,500 employees worldwide.
1Equifax Inc.
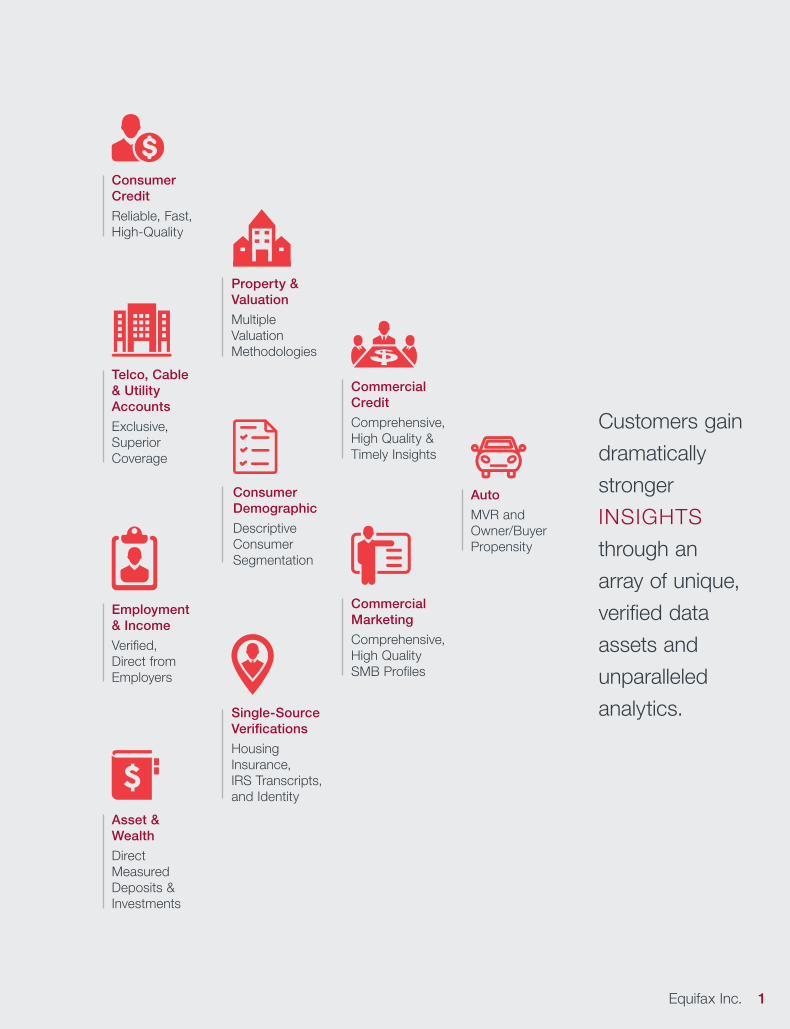
Telco, Cable & Utility Accounts
Exclusive, Superior Coverage
Auto
MVR and Owner/Buyer Propensity
Consumer Demographic
Descriptive Consumer Segmentation
Commercial Credit
Comprehensive, High Quality & Timely Insights
Consumer Credit
Reliable, Fast, High-Quality
Commercial Marketing
Comprehensive, High Quality SMB Profiles
Employment & Income
Verified, Direct from Employers
Single-Source Verifications
Housing Insurance, IRS Transcripts, and Identity
Property & Valuation
Multiple Valuation Methodologies
Asset & Wealth
Direct Measured Deposits & Investments
Equifax Inc. 1
Customers gain
dramatically
stronger
INSIGHTS
through an
array of unique,
verified data
assets and
unparalleled
analytics.
2 2016 Annual Report2016 Annual Report2
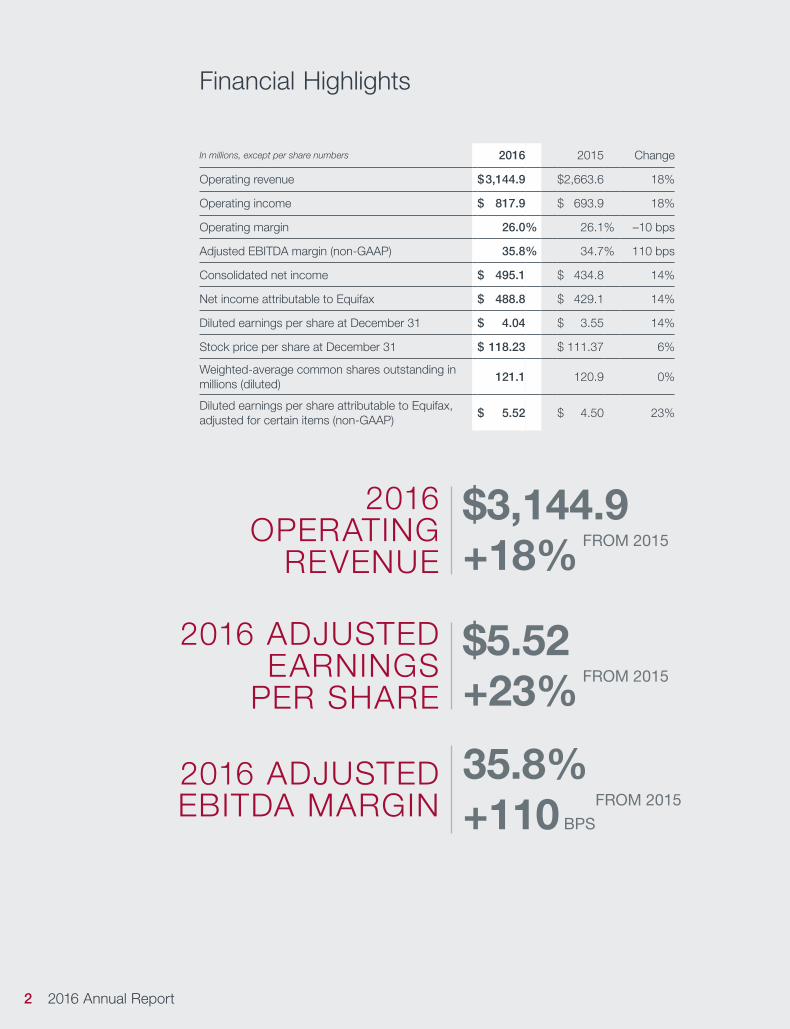
Financial Highlights
In millions, except per share numbers 2016 2015 Change
Operating revenue $ 3,144.9 $ 2,663.6 18%
Operating income $ 817.9 $ 693.9 18%
Operating margin 26.0% 26.1% –10 bps
Adjusted EBITDA margin (non-GAAP) 35.8% 34.7% 110 bps
Consolidated net income $ 495.1 $ 434.8 14%
Net income attributable to Equifax $ 488.8 $ 429.1 14%
Diluted earnings per share at December 31 $ 4.04 $ 3.55 14%
Stock price per share at December 31 $ 118.23 $ 111.37 6%
Weighted-average common shares outstanding in millions (diluted)
121.1 120.9 0%
Diluted earnings per share attributable to Equifax, adjusted for certain items (non-GAAP)
$ 5.52 $ 4.50 23%
2016 OPERATING
REVENUE
$3,144.9+18%
FROM 2015
2016 ADJUSTEDEARNINGS
PER SHARE
$5.52+23%
FROM 2015
2016 ADJUSTED EBITDA MARGIN
35.8%+110 BPS
FROM 2015

By all measures, 2016 was a remarkable year for Equifax. Our performance was outstanding, and our financials reached record levels across the board. We successfully completed the largest acquisition in our history, developed and delivered powerful new insights that drove smart, financially sound decisions, significantly increased investment in our IT platforms, and expanded our global presence. We are truly Powering the World with Knowledge.Equifax delivered strong, profitable growth and shareholder returns in 2016 with revenues of $3.1 billion and adjusted EBITDA margins of 35.8 percent. We returned $158 million to shareholders in the form of dividends. In fact, the fourth quarter of 2016 was the 40th quarter in a row in which we have met or exceeded analysts’ consensus expectations.
Success is no accident at Equifax. We work hard to develop, test, refine, and execute clearly defined processes and behaviors that guide our day-to-day work effort. We understand our customers’ industries and businesses and provide value by delivering insights that enable our customers to make better financial and business choices, and enable consumers to achieve their personal dreams and aspirations. All four Equifax business units contribute by consistently executing on strategic initiatives and leveraging our competitive position on a global scale.
To Our Shareholders:
Richard F. SmithChairman and Chief Executive Officer
Equifax Inc. 3
4 2016 Annual Report
■ Our U.S. Information Solutions (USIS) partnership with Fannie Mae hastransformed the mortgage underwriting process with the addition of amultidimensional profile of 24 months of consumer debt repayment andbalance history to the Tri-Merge Credit Report. This change marked the firstsignificant update to this report in nearly 30 years and is expectedto expand access to credit for consumers and help to further limit lenderrisk. Fannie Mae’s new validation service also incorporates verifiedconsumer income and employment information from Workforce Solutions(WFS), effectively creating a new gold standard for incomeand employment verification. And through Cambrian, our proprietaryBig Data and analytics environment, we have access to upwards of80 months of data for most of our major data assets, resulting inunique and valuable insights that solve problems and enable smarterbusiness decisions.
■ International significantly expanded its footprint with the acquisition ofVeda, a data and analytics company that is the leading provider ofconsumer and commercial credit insights in Australia and New Zealand.We introduced and established our management disciplines and newproduct innovation program to stimulate development of solutions forthese markets, and are moving rapidly to bring our core global platformsto those markets. Veda, the largest acquisition in our history, also providesus with an important gateway to the Asia-Pacific region. With the integrationnearly complete, our operational, strategic, and financial expectationshave been met or exceeded. International also made strong inroads acrossour other core regions: in Europe, where we strengthened our U.K.government agency relationships for our debt management services;in Canada, where we launched our Cambrian platform; and in LatinAmerica, where the acquisition of Mapcity Geo will enhance solutionsfor our customers through the use of socio-economic information andgeographic analysis.
■ Workforce Solutions’ unique data assets, operational excellence, andmarket penetration enabled it to deliver revenue growth of 22 percentand a 310 basis point expansion in its adjusted EBITDA margin. We nowhave over 290 million records from more than 7,100 data contributors inour database. WFS data is also powering the successful Fannie Maepartnership with employment and income verification. Our acquisition ofunemployment-tax and claims-management specialists Barnett Associatesfurther expands our workforce-solutions employer-services customer base.
■ Global Consumer Solutions (GCS) continued to build a strong marketposition in its direct and direct-to-consumer reseller partnerships in additionto its indirect markets. GCS negotiated a multiyear contract with CreditKarma, transforming the partnership from transactional to strategic andfrom domestic to international, leveraging our strong global footprint. Inanother key agreement, GCS successfully integrated its products withLifeLock’s identity protection services, and also launched Renaissance,a best-in-class SaaS eCommerce platform, creating opportunities tofurther personalize the experiences we offer to our clients worldwide.
All of our business units work in concert to innovate and deliver products and solutions to serve our customers’ and consumers’ needs—proof that a well-designed strategy coupled with high-level execution results in sustainable, long-term success and growth.
Our near-term
goal is to surpass
$4 billion in revenue and to
expand adjusted
EBITDA margins to
40 percent.
2016 Annual Report4
5Equifax Inc.Equifax Inc. 5
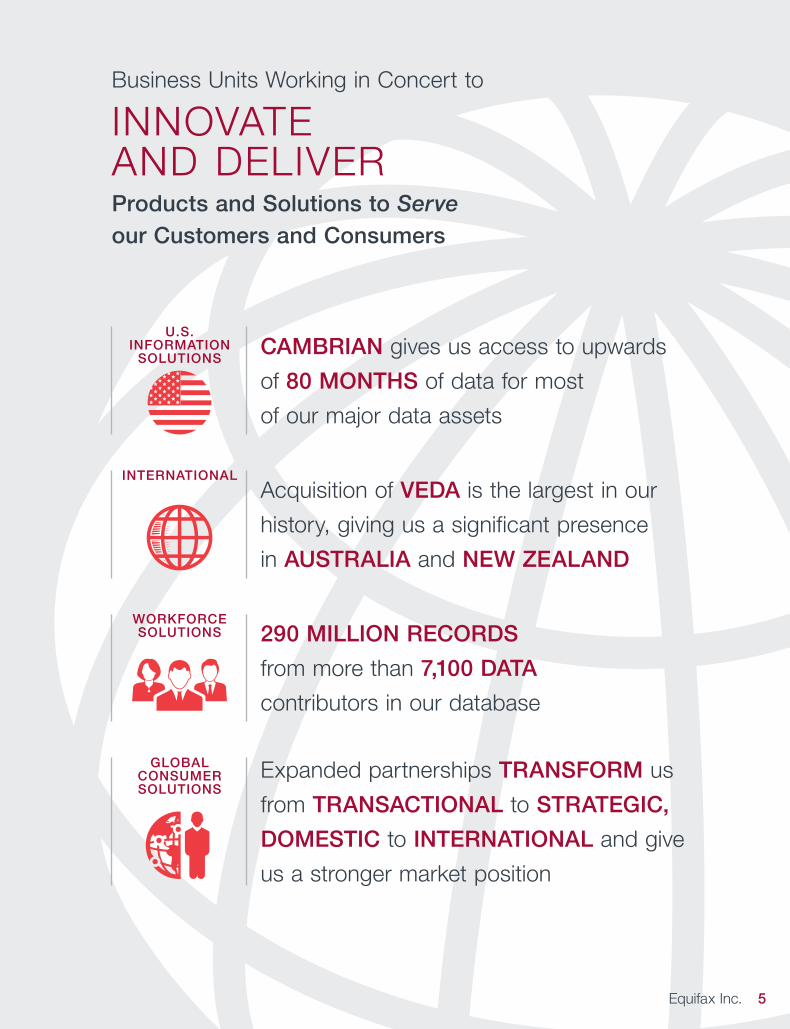
Business Units Working in Concert to
INNOVATEAND DELIVER Products and Solutions to Serve our Customers and Consumers
CAMBRIAN gives us access to upwards
of 80 MONTHS of data for most
of our major data assets
Acquisition of VEDA is the largest in our
history, giving us a significant presence
in AUSTRALIA and NEW ZEALAND
290 MILLION RECORDS
from more than 7,100 DATA
contributors in our database
Expanded partnerships TRANSFORM us
from TRANSACTIONAL to STRATEGIC,
DOMESTIC to INTERNATIONAL and give
us a stronger market position
U.S. INFORMATION
SOLUTIONS
INTERNATIONAL
WORKFORCE SOLUTIONS
GLOBAL CONSUMERSOLUTIONS
6 2016 Annual Report
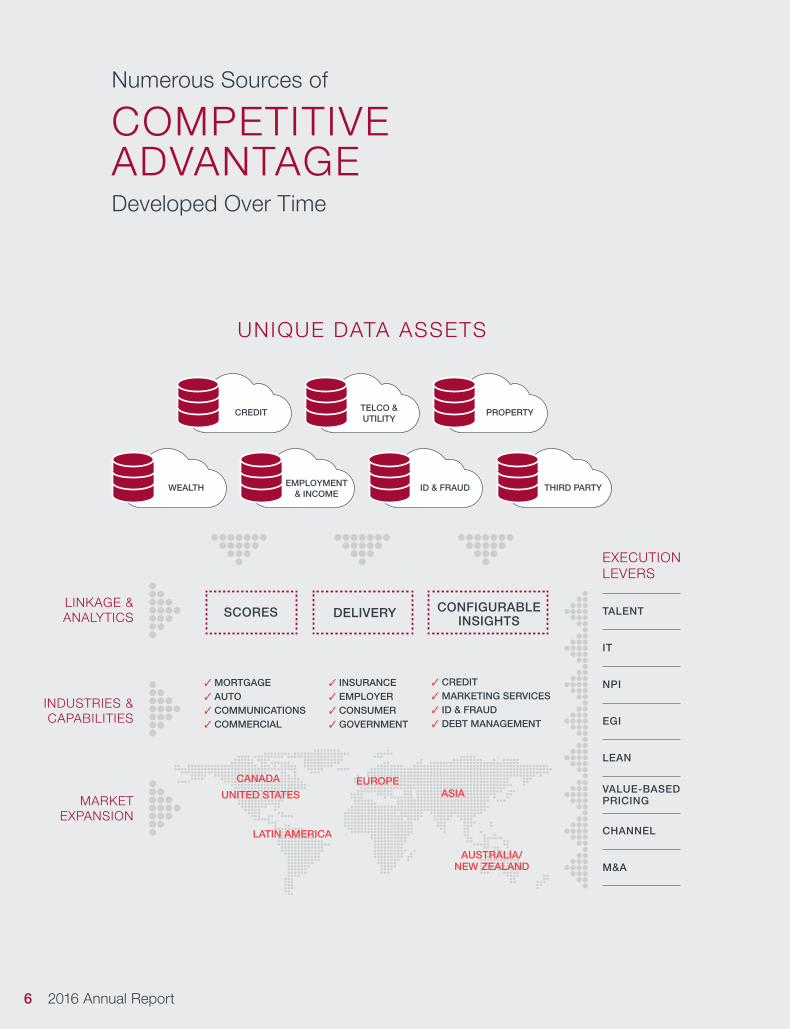
Numerous Sources of
COMPETITIVEADVANTAGE Developed Over Time
2016 Annual Report6
UNIQUE DATA ASSETS
LINKAGE &ANALYTICS SCORES DELIVERY CONFIGURABLE
INSIGHTS
INDUSTRIES &CAPABILITIES
MARKETEXPANSION
✓ MORTGAGE✓ AUTO✓ COMMUNICATIONS✓ COMMERCIAL
✓ INSURANCE✓ EMPLOYER✓ CONSUMER✓ GOVERNMENT
✓ CREDIT✓ MARKETING SERVICES✓ ID & FRAUD✓ DEBT MANAGEMENT
ASIA
LATIN AMERICA
EUROPECANADA
UNITED STATES
AUSTRALIA/NEW ZEALAND
EXECUTION LEVERS
TALENT
IT
NPI
EGI
LEAN
CHANNEL
M&A
VALUE-BASED PRICING
EMPLOYMENT& INCOME
ID & FRAUD THIRD PARTYWEALTH
TELCO &UTILITY
PROPERTYCREDIT
7Equifax Inc.
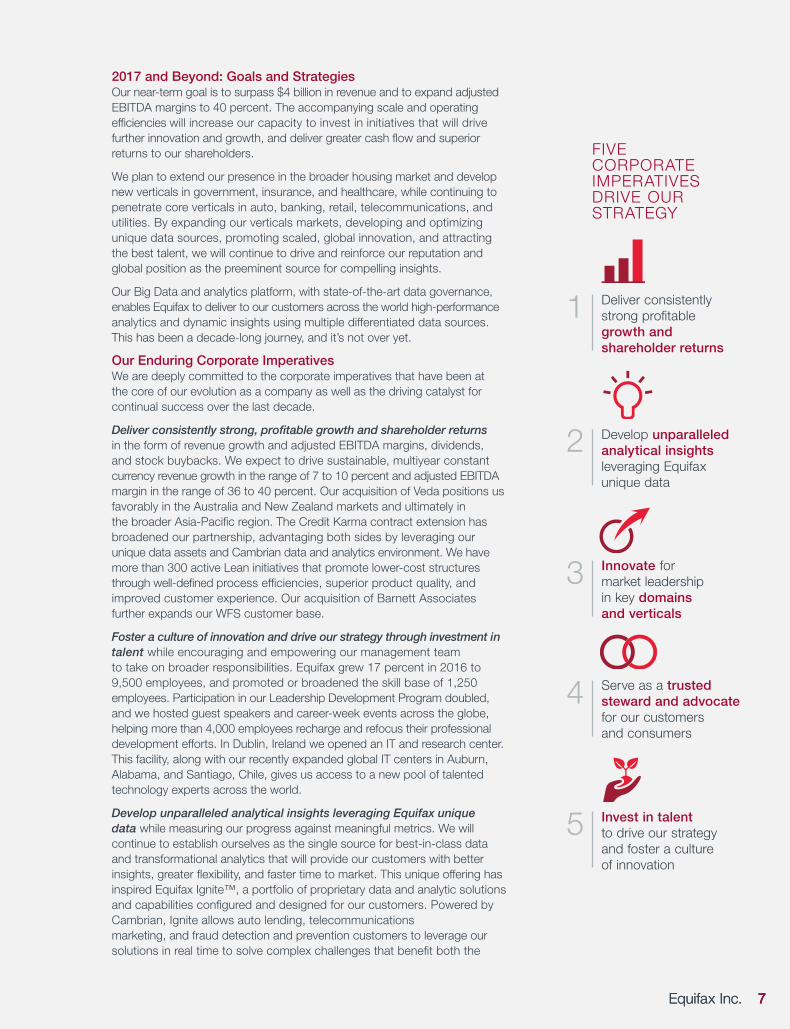
2017 and Beyond: Goals and StrategiesOur near-term goal is to surpass $4 billion in revenue and to expand adjusted EBITDA margins to 40 percent. The accompanying scale and operating efficiencies will increase our capacity to invest in initiatives that will drive further innovation and growth, and deliver greater cash flow and superior returns to our shareholders.
We plan to extend our presence in the broader housing market and develop new verticals in government, insurance, and healthcare, while continuing to penetrate core verticals in auto, banking, retail, telecommunications, and utilities. By expanding our verticals markets, developing and optimizing unique data sources, promoting scaled, global innovation, and attracting the best talent, we will continue to drive and reinforce our reputation and global position as the preeminent source for compelling insights.
Our Big Data and analytics platform, with state-of-the-art data governance, enables Equifax to deliver to our customers across the world high-performance analytics and dynamic insights using multiple differentiated data sources. This has been a decade-long journey, and it’s not over yet.
Our Enduring Corporate ImperativesWe are deeply committed to the corporate imperatives that have been at the core of our evolution as a company as well as the driving catalyst for continual success over the last decade.
Deliver consistently strong, profitable growth and shareholder returns in the form of revenue growth and adjusted EBITDA margins, dividends, and stock buybacks. We expect to drive sustainable, multiyear constant currency revenue growth in the range of 7 to 10 percent and adjusted EBITDA margin in the range of 36 to 40 percent. Our acquisition of Veda positions us favorably in the Australia and New Zealand markets and ultimately in the broader Asia-Pacific region. The Credit Karma contract extension has broadened our partnership, advantaging both sides by leveraging our unique data assets and Cambrian data and analytics environment. We have more than 300 active Lean initiatives that promote lower-cost structures through well-defined process efficiencies, superior product quality, and improved customer experience. Our acquisition of Barnett Associates further expands our WFS customer base.
Foster a culture of innovation and drive our strategy through investment in talent while encouraging and empowering our management team to take on broader responsibilities. Equifax grew 17 percent in 2016 to 9,500 employees, and promoted or broadened the skill base of 1,250 employees. Participation in our Leadership Development Program doubled, and we hosted guest speakers and career-week events across the globe, helping more than 4,000 employees recharge and refocus their professional development efforts. In Dublin, Ireland we opened an IT and research center. This facility, along with our recently expanded global IT centers in Auburn, Alabama, and Santiago, Chile, gives us access to a new pool of talented technology experts across the world.
Develop unparalleled analytical insights leveraging Equifax unique data while measuring our progress against meaningful metrics. We will continue to establish ourselves as the single source for best-in-class data and transformational analytics that will provide our customers with better insights, greater flexibility, and faster time to market. This unique offering has inspired Equifax Ignite™, a portfolio of proprietary data and analytic solutions and capabilities configured and designed for our customers. Powered by Cambrian, Ignite allows auto lending, telecommunications marketing, and fraud detection and prevention customers to leverage our solutions in real time to solve complex challenges that benefit both the
FIVE CORPORATE IMPERATIVES DRIVE OUR STRATEGY
Deliver consistentlystrong profitable growth and shareholder returns
1
Develop unparalleled analytical insights leveraging Equifaxunique data
2
Innovate for market leadershipin key domainsand verticals
3
Serve as a trusted steward and advocate for our customers and consumers
4
Invest in talent to drive our strategy and foster a cultureof innovation
5
Equifax Inc. 7
8 2016 Annual Report
business and the consumer. As we continue forward with our portfolio roll out, we recently expanded Cambrian to Canada and expect to introduce it into Australia, Latin America, and the U.K. as well.
Innovate for market leadership in key domains and verticals to maximize market position and extend common platforms across our global geographic footprint. In 2016, Equifax introduced 53 new products and saw our New Product Innovation (NPI) revenue increase 30 percent over 2015. Now 11 years in practice, NPI has proved to be a valuable and centralized discipline for product development and innovation on a global scale. We are also expanding The Work Number (TWN) focusing initially in Canada and exploring other geographies such as Australia and the U.K.
Serve as a trusted steward and advocate for our customers and consumers. Our goal is to become a valued partner to all of our customers and consumers by providing them with the information and knowledge they need to make important financial decisions. For example, our commitment to financial inclusion in Latin America has enhanced our relationship with the region’s consumers, customers, and regulators. We brought our “Eco nom ics for Success” program to more than 1,600 students in three Latin American countries via a strategic partnership with Junior Achieve ment Americas. And our sponsorship of the 10th World Credit Reporting Conference in Toronto, Canada, enabled us to showcase our expertise in financial capabilities on a global level. These efforts are consistent with our ongoing initiatives designed to enhance the customer experience, while at the same time supporting and influencing the communities in which we operate.
The Power of Insights, the Power of CollaborationWe have a proven business model, outstanding people, and processes and strategies that enable us to consistently perform and deliver attractive financial results. We are dynamic, flexible, and innovative, and have demonstrated our capacity for consistent execution at a very high level. We never take success for granted; we are conditioned to anticipate our customers’ needs and issues and seek solutions on their behalf—often before they even realize they have a problem.
We are repositioning our brand under the slogan Powering the World with Knowledge™, articulating in just five words our vision and strategy to expand our footprint, broaden our growth, and leverage our differentiated assets. While credit is a vital part of our business, we have been doing far more than this for many years. We uncover what cannot easily be seen and transform the way our customers do business. Essentially, we breathe life into data, enabling our customers to see the entire story so they can make decisions with greater confidence and without diluting the overall health of their business.
At Equifax, our strategic focus has stood the test of time. Our operating principals have enabled us to evolve into a better, more sophisticated partner for our customers, consumers, shareholders, and the geographies where we operate. I am extremely proud of the hard work and commitment exhibited by the entire Equifax team. Their focus, dedication, and appreciation of our established principles and processes have made all the difference as we now—more than ever—are Powering the World with Knowledge.
Richard F. SmithChairman and Chief Executive Officer
We are conditioned
to anticipate our
customers’ needs
and issues and
seek solutionson their behalf—
often before they
even realize they
have a problem.
2016 Annual Report8

9Equifax Inc.
Financial Section
10 Selected Financial Data
12 Management’s Discussion and Analysis of Financial Condition and Results of Operations
13 Results of Operations — Twelve Months Ended December 31, 2016, 2015 and 2014
29 Quantitative and Qualitative Disclosures About Market Risk
30 Report of Independent Registered Public Accounting Firm on Internal Control Over Financial Reporting
31 Report of Independent Registered Public Accounting Firm
32 Consolidated Statements of Income
33 Consolidated Statements of Comprehensive Income
34 Consolidated Balance Sheets
35 Consolidated Statements of Cash Flows
36 Consolidated Statements of Shareholders’ Equity and Other Comprehensive Income
38 Consolidated Statements of Shareholders’ Equity and Other Comprehensive Income
39 Notes to Consolidated Financial Statements
73 Schedule II — Valuation and Qualifying Accounts
74 Reconciliations Related to Non-GAAP Financial Measures
77 Shareholder Return Performance Graph
79 Shareholder Information
FORWARD-LOOKING STATEMENTS
This report contains information that may constitute “forward-looking statements.” Generally, the words “believe,” “expect,” “intend,” “estimate,” “anticipate,” “project,” “will” and similar expressions identify forward-looking statements, which generally are not historical in nature. All statements that address operating performance, events or developments that we expect or anticipate will occur in the future are forward-looking statements. Management believes that these forward-looking statements are reasonable as and when made. However, forward-looking statements are subject to certain risks and uncertainties that could cause actual results to differ materially from our Company’s historical experience and our present expectations or projections, including without limitation our expectations regarding the Company’s outlook, long-term organic and inorganic growth, and customer acceptance of our business solutions referenced under “Business Environment and Company Outlook.” These risks and uncertainties include, but are not limited to, those described in our 2016 Annual Report on Form 10-K Risk Factors, and elsewhere in this report and those described from time to time in our future reports filed with the United States Securities and Exchange Commission, or SEC. As a result of such risks and uncertainties, we urge you not to place undue reliance on any such forward-looking statements. Forward-looking statements speak only as of the date when made. We undertake no obligation to publicly update or revise any forward-looking statements, whether as a result of new information, future events or otherwise, except as required by law.
10 2016 Annual Report CONTENTS
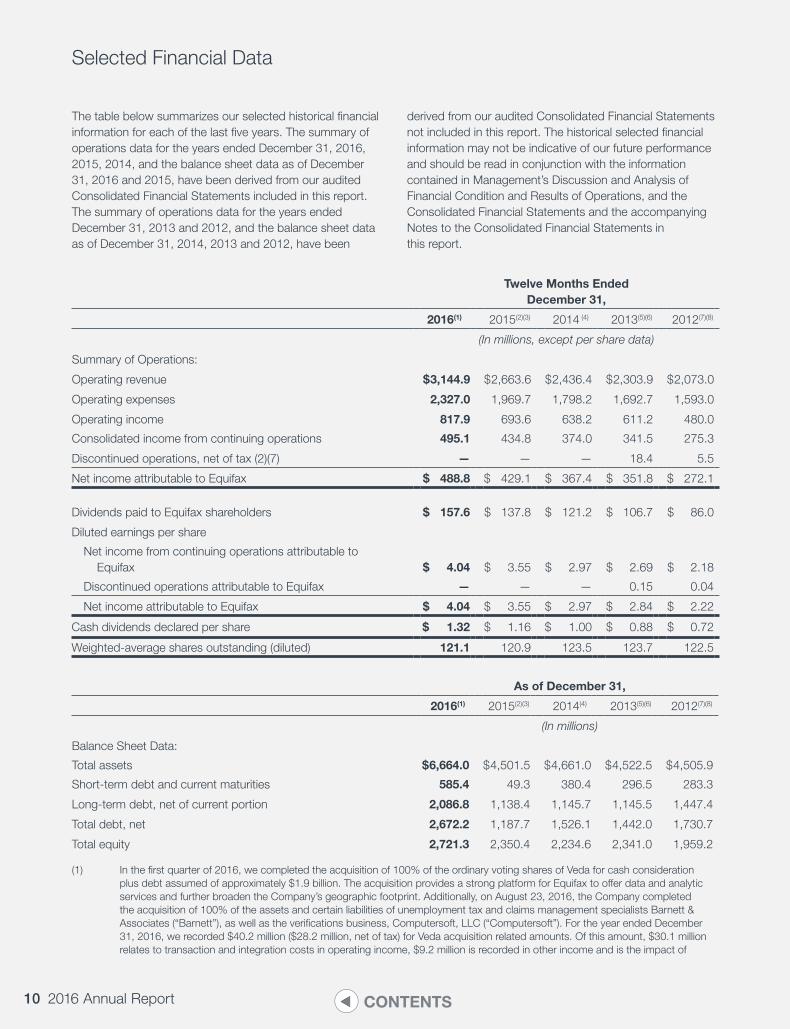
Selected Financial Data
The table below summarizes our selected historical financial information for each of the last five years. The summary of operations data for the years ended December 31, 2016, 2015, 2014, and the balance sheet data as of December 31, 2016 and 2015, have been derived from our audited Consolidated Financial Statements included in this report. The summary of operations data for the years ended December 31, 2013 and 2012, and the balance sheet data as of December 31, 2014, 2013 and 2012, have been
derived from our audited Consolidated Financial Statements not included in this report. The historical selected financial information may not be indicative of our future performance and should be read in conjunction with the information contained in Management’s Discussion and Analysis of Financial Condition and Results of Operations, and the Consolidated Financial Statements and the accompanying Notes to the Consolidated Financial Statements in this report.
Twelve Months Ended December 31,
2016(1) 2015(2)(3) 2014 (4) 2013(5)(6) 2012(7)(8)
(In millions, except per share data)
Summary of Operations:
Operating revenue $ 3,144.9 $ 2,663.6 $ 2,436.4 $ 2,303.9 $ 2,073.0
Operating expenses 2,327.0 1,969.7 1,798.2 1,692.7 1,593.0
Operating income 817.9 693.6 638.2 611.2 480.0
Consolidated income from continuing operations 495.1 434.8 374.0 341.5 275.3
Discontinued operations, net of tax (2)(7) — — — 18.4 5.5
Net income attributable to Equifax $ 488.8 $ 429.1 $ 367.4 $ 351.8 $ 272.1
Dividends paid to Equifax shareholders $ 157.6 $ 137.8 $ 121.2 $ 106.7 $ 86.0
Diluted earnings per share
Net income from continuing operations attributable to Equifax $ 4.04 $ 3.55 $ 2.97 $ 2.69 $ 2.18
Discontinued operations attributable to Equifax — — — 0.15 0.04
Net income attributable to Equifax $ 4.04 $ 3.55 $ 2.97 $ 2.84 $ 2.22
Cash dividends declared per share $ 1.32 $ 1.16 $ 1.00 $ 0.88 $ 0.72
Weighted-average shares outstanding (diluted) 121.1 120.9 123.5 123.7 122.5
As of December 31,
2016(1) 2015(2)(3) 2014(4) 2013(5)(6) 2012(7)(8)
(In millions)
Balance Sheet Data:
Total assets $ 6,664.0 $ 4,501.5 $ 4,661.0 $ 4,522.5 $ 4,505.9
Short-term debt and current maturities 585.4 49.3 380.4 296.5 283.3
Long-term debt, net of current portion 2,086.8 1,138.4 1,145.7 1,145.5 1,447.4
Total debt, net 2,672.2 1,187.7 1,526.1 1,442.0 1,730.7
Total equity 2,721.3 2,350.4 2,234.6 2,341.0 1,959.2
(1) In the first quarter of 2016, we completed the acquisition of 100% of the ordinary voting shares of Veda for cash consideration plus debt assumed of approximately $1.9 billion. The acquisition provides a strong platform for Equifax to offer data and analytic services and further broaden the Company’s geographic footprint. Additionally, on August 23, 2016, the Company completed the acquisition of 100% of the assets and certain liabilities of unemployment tax and claims management specialists Barnett & Associates (“Barnett”), as well as the verifications business, Computersoft, LLC (“Computersoft”). For the year ended December 31, 2016, we recorded $40.2 million ($28.2 million, net of tax) for Veda acquisition related amounts. Of this amount, $30.1 million relates to transaction and integration costs in operating income, $9.2 million is recorded in other income and is the impact of
11Equifax Inc.CONTENTS
foreign currency changes on the transaction structure, including the economic hedges, $0.2 million is recorded in depreciation and amortization, and $0.7 million is recorded in interest expense. For additional information, see Note 3 of the Notes to the Consolidated Financial Statements in this report.
(2) In the first quarter of 2015, we recorded a $20.7 million restructuring charge ($13.2 million, net of tax) all of which was recorded in selling, general and administrative expenses on our Consolidated Statements of Income. This charge resulted from our continuing efforts to realign our internal resources to support the Company’s strategic objectives and increase the integration of our global operations. For additional information, see Note 12 of the Notes to Consolidated Financial Statements in this report.
(3) During the second quarter of 2015, the management of Boa Vista Servicos S.A. (“BVS”), in which we hold a 15% cost method investment, updated the financial projections. The updated projections, along with the continued weakness in the Brazilian consumer and small commercial credit markets were considered indicators of impairment. As a result of these changes, and the associated near-term changes in cash flow expected from the business, we recorded a 46.0 million Brazilian Reais ($14.8 million) impairment of our investment. For additional information, see Note 2 of the Notes to Consolidated Financial Statements in this report.
(4) During the first quarter of 2014, we acquired 100% of the stock of TDX, a data, technology and services company in the United Kingdom that specializes in debt collections and recovery management through the use of analytics, data exchanges and technology platforms. The results of this acquisition have been included in our USIS and International operating segments subsequent to the acquisition. We also purchased Forseva, a provider of end-to-end, cloud-based credit-management software solutions. The results of this acquisition have been included in our USIS operating segment subsequent to the acquisition. For additional information about these acquisitions, see Note 3 of the Notes to Consolidated Financial Statements in this report.
(5) During the first quarter of 2013, we divested two non-strategic business lines, Equifax Settlement Services, which was part of our Mortgage business within the USIS operating segment, and Talent Management Services, which was part of our Employer Services business within our Workforce Solutions operating segment, for a total of $47.5 million. We have presented the Equifax Settlement Services and Talent Management Services operations as discontinued operations for all periods presented.
(6) During the fourth quarter of 2013, the management of BVS, in which we hold a 15% cost method investment, revised its near-term outlook and its operating plans to reflect reduced near-term market expectations for credit information services in Brazil and increased investment needed to achieve its strategic objectives. As a result of these changes, and the associated near-term changes in cash flow expected from the business, we recorded a 40 million Brazilian Reais ($17.0 million) impairment of our original investment of 130 million Brazilian Reais. For additional information, see Note 2 of the Notes to Consolidated Financial Statements in this report.
(7) On December 28, 2012, we acquired certain credit services business assets and operations of Computer Sciences Corporation for $1.0 billion. We financed the acquisition with available cash, the issuance of $500 million of 3.30% ten-year senior notes, and commercial paper borrowings under our CP program. The results of this acquisition are included in our USIS segment after the date of acquisition and were not material for 2012.
(8) During the fourth quarter of 2012, we offered certain former employees a voluntary lump sum payment option of their pension benefits or a reduced monthly annuity. Approximately 64% of the vested terminated participants elected to receive the lump sum payment which resulted in a payment of $62.6 million from the assets in the pension plan. An amendment to the USRIP was also approved which froze future salary increases for non-grandfathered participants and offered a one-time 9% increase to the service benefit. The settlement and amendment resulted in a $38.7 million pension charge.
12 2016 Annual Report CONTENTS
Management’s Discussion and Analysis of Financial Condition and Results of Operations
As used herein, the terms Equifax, the Company, we, our and us refer to Equifax Inc., a Georgia corporation, and its consolidated subsidiaries as a combined entity, except where it is clear that the terms mean only Equifax Inc.
All references to earnings per share data in Management’s Discussion and Analysis, or MD&A, are to diluted earnings per share, or EPS, unless otherwise noted. Diluted EPS is calculated to reflect the potential dilution that would occur if stock options or other contracts to issue common stock were exercised and resulted in additional common shares outstanding.
Business Overview
We are a leading global provider of information solutions, employment and income verifications and human resources business process outsourcing services. We leverage some of the largest sources of consumer and commercial data, along with advanced analytics and proprietary technology, to create customized insights which enable our business customers to grow faster, more efficiently and more profitably, and to inform and empower consumers.
Businesses rely on us for consumer and business credit intelligence, credit portfolio management, fraud detection, decisioning technology, marketing tools, debt management and human resources-related services. We also offer a portfolio of products that enable individual consumers to manage their financial affairs and protect their identity. Our revenue stream is diversified among businesses across a wide range of industries, international geographies and individual consumers.
On February 24, 2016, we completed the acquisition of Veda for cash consideration plus debt assumed of approximately $1.9 billion. We financed the cash portion of the purchase price through a combination of new debt, including the Term Loan, the 364-Day Revolver, and commercial paper. Refer to Note 5 for further information on debt.
Segment and Geographic Information
Segments. The USIS segment, the largest of our four segments, consists of three service lines: Online Information Solutions; Mortgage Solutions; and Financial Marketing Services. Online Information Solutions and Mortgage Solutions revenue is principally transaction-based and is derived from our sales of products such as consumer and commercial credit reporting and scoring, identity management, fraud detection and modeling services. USIS also markets certain decisioning software services, which facilitate and automate a variety of consumer and commercial credit-oriented decisions. Financial Marketing Services revenue is principally project and subscription
based and is derived from our sales of batch credit and consumer wealth information such as those that assist clients in acquiring new customers, cross selling to existing customers and managing portfolio risk.
The International segment consists of Europe, Asia Pacific, Latin America and Canada. Following the acquisition of Veda, we have created an Asia Pacific reporting unit which consists mainly of our Australia and New Zealand operations. Canada’s services are similar to our USIS offerings, while Europe, Asia Pacific and Latin America are made up of varying mixes of service lines that are in our USIS reportable segment. In Europe, Asia Pacific and Latin America, we also provide information and technology services to support lenders and other creditors in the collections and recovery management process.
The Workforce Solutions segment consists of the Verification Services and Employer Services business lines. Verification Services revenue is transaction-based and is derived primarily from employment and income verification. Employer Services revenues are derived from our provision of certain human resources business process outsourcing services that include both transaction and subscription based product offerings. These services include unemployment claims management, employment-based tax credit services and other complementary employment-based transaction services.
Global Consumer Solutions revenue is both transaction and subscription based and is derived from the sale of credit monitoring and identity theft protection products, which we deliver electronically to consumers primarily via the internet in the U.S., Canada, and the U.K. We reach consumers directly and indirectly through partners. We also sell consumer and credit information to resellers who combine our information with other information to provide direct to consumer monitoring, reports and scores.
Geographic Information. We currently have significant operations in the following countries: Argentina, Australia, Canada, Chile, Costa Rica, Ecuador, El Salvador, Honduras, India, Mexico, New Zealand, Paraguay, Peru, Portugal, the Republic of Ireland, Spain, the U.K., Uruguay and the U.S. We also offer Equifax branded credit services in India and Russia through joint ventures, we have investments in consumer and/or commercial credit information companies through joint ventures in Cambodia, Malaysia and Singapore, and have an investment in a consumer and commercial credit information company in Brazil. Of the countries we operate in, 73% of our revenue was generated in the U.S. during the twelve months ended December 31, 2016.
13Equifax Inc.CONTENTS
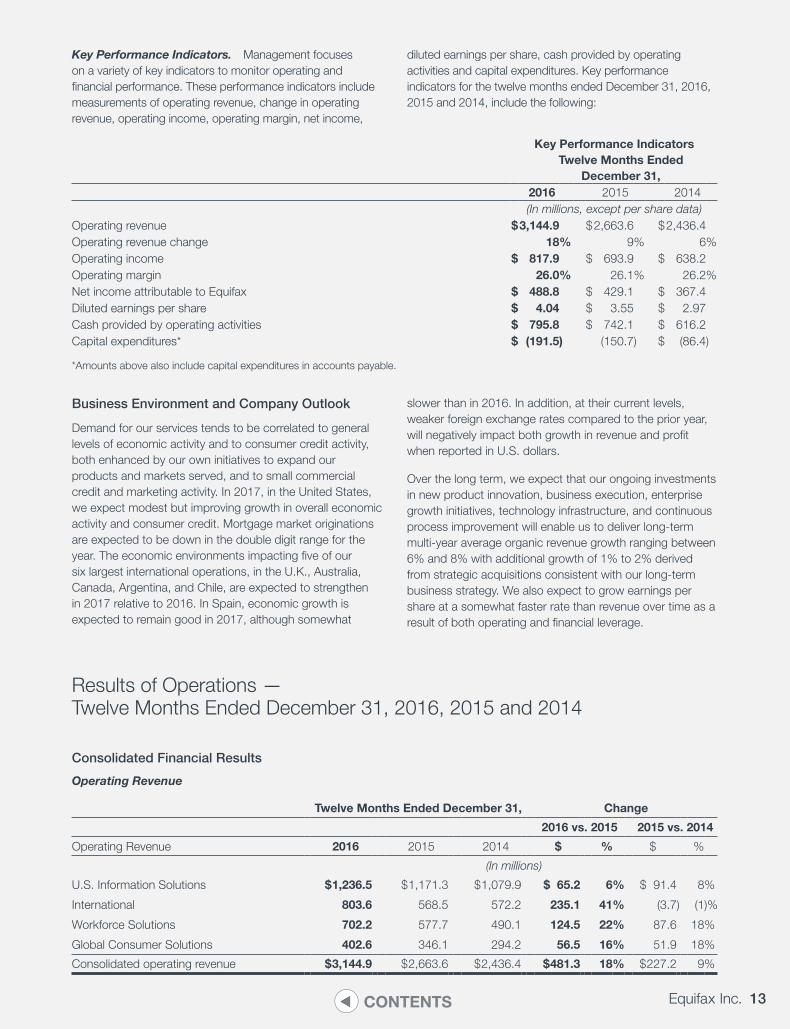
Key Performance Indicators. Management focuses on a variety of key indicators to monitor operating and financial performance. These performance indicators include measurements of operating revenue, change in operating revenue, operating income, operating margin, net income,
diluted earnings per share, cash provided by operating activities and capital expenditures. Key performance indicators for the twelve months ended December 31, 2016, 2015 and 2014, include the following:
Business Environment and Company Outlook
Demand for our services tends to be correlated to general levels of economic activity and to consumer credit activity, both enhanced by our own initiatives to expand our products and markets served, and to small commercial credit and marketing activity. In 2017, in the United States, we expect modest but improving growth in overall economic activity and consumer credit. Mortgage market originations are expected to be down in the double digit range for the year. The economic environments impacting five of our six largest international operations, in the U.K., Australia, Canada, Argentina, and Chile, are expected to strengthen in 2017 relative to 2016. In Spain, economic growth is expected to remain good in 2017, although somewhat
slower than in 2016. In addition, at their current levels, weaker foreign exchange rates compared to the prior year, will negatively impact both growth in revenue and profit when reported in U.S. dollars.
Over the long term, we expect that our ongoing investments in new product innovation, business execution, enterprise growth initiatives, technology infrastructure, and continuous process improvement will enable us to deliver long-term multi-year average organic revenue growth ranging between 6% and 8% with additional growth of 1% to 2% derived from strategic acquisitions consistent with our long-term business strategy. We also expect to grow earnings per share at a somewhat faster rate than revenue over time as a result of both operating and financial leverage.
Results of Operations — Twelve Months Ended December 31, 2016, 2015 and 2014
Consolidated Financial Results
Operating Revenue
Twelve Months Ended December 31, Change
2016 vs. 2015 2015 vs. 2014
Operating Revenue 2016 2015 2014 $ % $ %
(In millions)
U.S. Information Solutions $ 1,236.5 $ 1,171.3 $ 1,079.9 $ 65.2 6% $ 91.4 8%
International 803.6 568.5 572.2 235.1 41% (3.7) (1)%
Workforce Solutions 702.2 577.7 490.1 124.5 22% 87.6 18%
Global Consumer Solutions 402.6 346.1 294.2 56.5 16% 51.9 18%
Consolidated operating revenue $ 3,144.9 $ 2,663.6 $ 2,436.4 $ 481.3 18% $ 227.2 9%
Key Performance Indicators Twelve Months Ended
December 31,2016 2015 2014(In millions, except per share data)
Operating revenue $3,144.9 $2,663.6 $2,436.4Operating revenue change 18% 9% 6%Operating income $ 817.9 $ 693.9 $ 638.2Operating margin 26.0% 26.1% 26.2%Net income attributable to Equifax $ 488.8 $ 429.1 $ 367.4Diluted earnings per share $ 4.04 $ 3.55 $ 2.97Cash provided by operating activities $ 795.8 $ 742.1 $ 616.2Capital expenditures* $ (191.5) (150.7) $ (86.4)
*Amounts above also include capital expenditures in accounts payable.
14 2016 Annual Report CONTENTS
Revenue for 2016 increased by 18% compared to 2015. The growth was driven by broad-based organic growth due to revenue increases in mortgage, government, healthcare, and direct to consumer reseller verticals as well as the Veda acquisition. The effect of foreign exchange rates reduced revenue by $75.2 million or 3% in 2016 compared to 2015.
Revenue for 2015 increased by 9% compared to 2014. This broad-based growth was organic, and was driven by revenue increases in mortgage, direct to consumer reseller, healthcare, government, and auto verticals. The effect of foreign exchange rates reduced revenue by $75.7 million or 3% in 2015 compared to 2014.
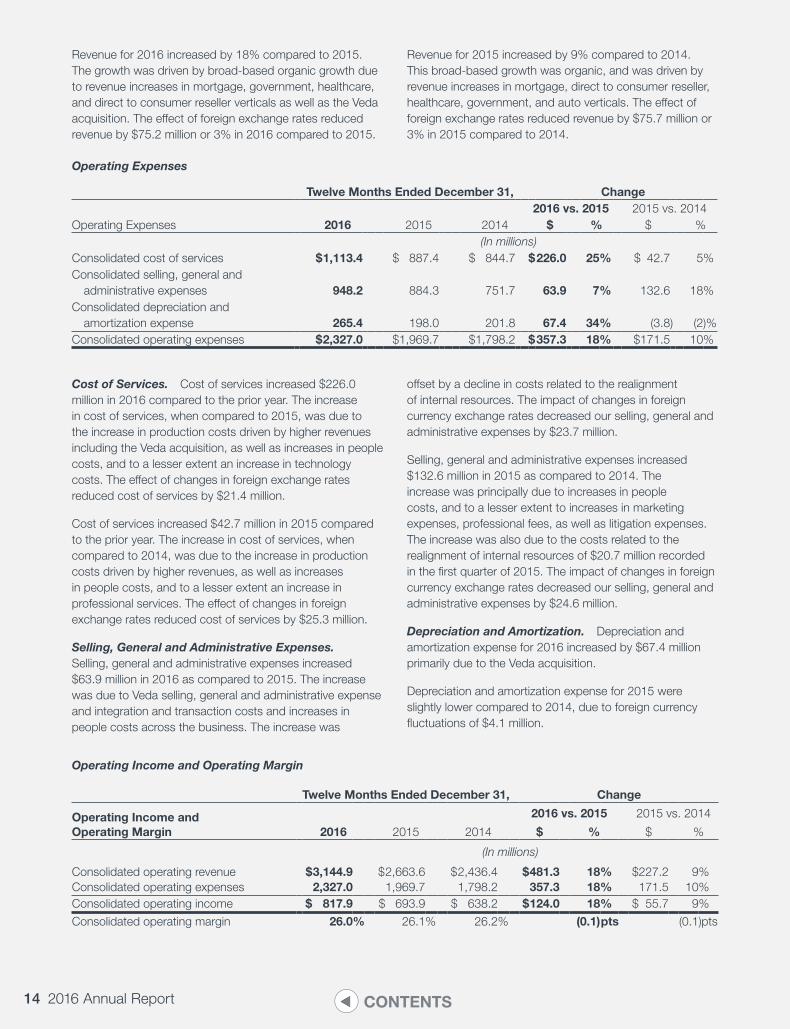
Operating Expenses
Twelve Months Ended December 31, Change2016 vs. 2015 2015 vs. 2014
Operating Expenses 2016 2015 2014 $ % $ %(In millions)
Consolidated cost of services $ 1,113.4 $ 887.4 $ 844.7 $226.0 25% $ 42.7 5%Consolidated selling, general and administrative expenses 948.2 884.3 751.7 63.9 7% 132.6 18%Consolidated depreciation and amortization expense 265.4 198.0 201.8 67.4 34% (3.8) (2)%Consolidated operating expenses $ 2,327.0 $1,969.7 $1,798.2 $357.3 18% $171.5 10%
Cost of Services. Cost of services increased $226.0 million in 2016 compared to the prior year. The increase in cost of services, when compared to 2015, was due to the increase in production costs driven by higher revenues including the Veda acquisition, as well as increases in people costs, and to a lesser extent an increase in technology costs. The effect of changes in foreign exchange rates reduced cost of services by $21.4 million.
Cost of services increased $42.7 million in 2015 compared to the prior year. The increase in cost of services, when compared to 2014, was due to the increase in production costs driven by higher revenues, as well as increases in people costs, and to a lesser extent an increase in professional services. The effect of changes in foreign exchange rates reduced cost of services by $25.3 million.
Selling, General and Administrative Expenses. Selling, general and administrative expenses increased $63.9 million in 2016 as compared to 2015. The increase was due to Veda selling, general and administrative expense and integration and transaction costs and increases in people costs across the business. The increase was
offset by a decline in costs related to the realignment of internal resources. The impact of changes in foreign currency exchange rates decreased our selling, general and administrative expenses by $23.7 million.
Selling, general and administrative expenses increased $132.6 million in 2015 as compared to 2014. The increase was principally due to increases in people costs, and to a lesser extent to increases in marketing expenses, professional fees, as well as litigation expenses. The increase was also due to the costs related to the realignment of internal resources of $20.7 million recorded in the first quarter of 2015. The impact of changes in foreign currency exchange rates decreased our selling, general and administrative expenses by $24.6 million.
Depreciation and Amortization. Depreciation and amortization expense for 2016 increased by $67.4 million primarily due to the Veda acquisition.
Depreciation and amortization expense for 2015 were slightly lower compared to 2014, due to foreign currency fluctuations of $4.1 million.
Operating Income and Operating Margin
Twelve Months Ended December 31, Change
Operating Income and Operating Margin
2016 vs. 2015 2015 vs. 2014
2016 2015 2014 $ % $ %
(In millions)
Consolidated operating revenue $ 3,144.9 $ 2,663.6 $ 2,436.4 $ 481.3 18% $227.2 9%Consolidated operating expenses 2,327.0 1,969.7 1,798.2 357.3 18% 171.5 10%Consolidated operating income $ 817.9 $ 693.9 $ 638.2 $ 124.0 18% $ 55.7 9%
Consolidated operating margin 26.0% 26.1% 26.2% (0.1)pts (0.1)pts
15Equifax Inc.CONTENTS
Total company margin decreased slightly in 2016 versus 2015 due to transaction and integration costs as well as increased amortization of acquired intangibles related to the acquisition of Veda. This was partially offset by a decline in costs related to realignment of internal resources. Margins in our USIS, Workforce Solutions and Global Consumer businesses all increased in 2016, with these increases offset by lower margins in International, principally due to the Veda transaction and integration costs and related amortization of intangibles.
Total company margin decreased slightly in 2015 versus 2014, due to the costs for the realignment of internal resources of $20.7 million and other increases in people costs. Margins increased substantially in both the Workforce Solutions and USIS segments, and partially offset by a decline in the margins of Global Consumer Solutions and lower margins in the International segment principally due to foreign exchange.
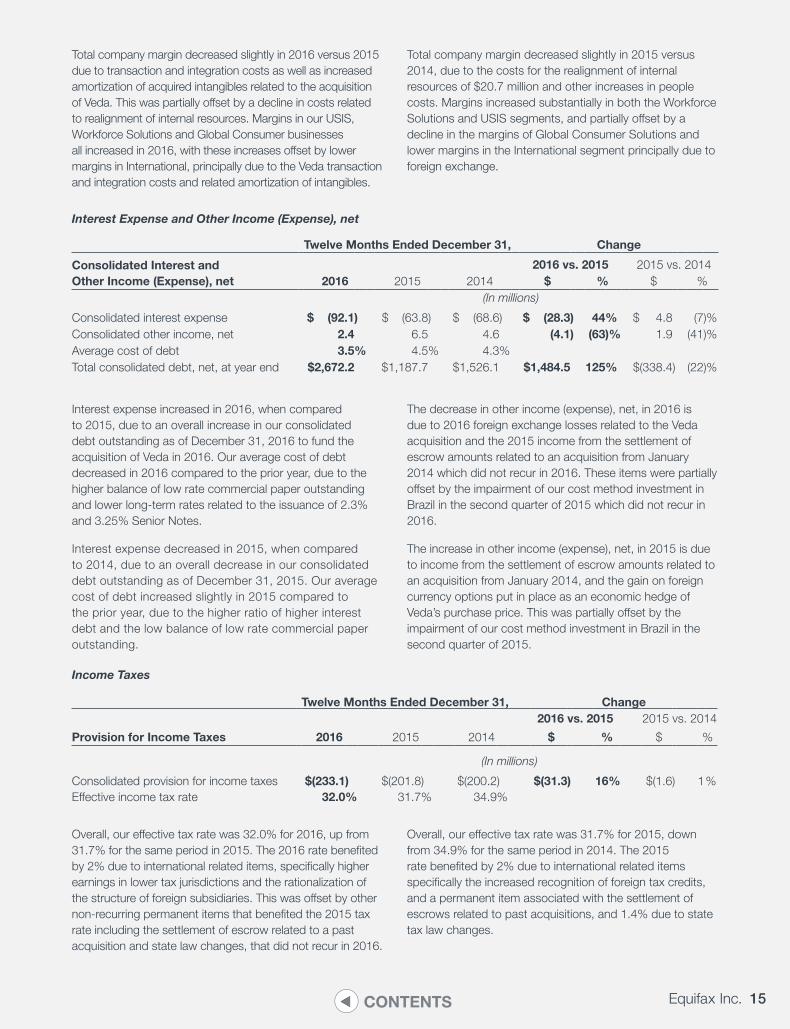
Interest Expense and Other Income (Expense), net
Twelve Months Ended December 31, Change
Consolidated Interest and Other Income (Expense), net
2016 vs. 2015 2015 vs. 20142016 2015 2014 $ % $ %
(In millions)
Consolidated interest expense $ (92.1) $ (63.8) $ (68.6) $ (28.3) 44% $ 4.8 (7)%Consolidated other income, net 2.4 6.5 4.6 (4.1) (63)% 1.9 (41)%Average cost of debt 3.5% 4.5% 4.3%Total consolidated debt, net, at year end $2,672.2 $1,187.7 $1,526.1 $1,484.5 125% $(338.4) (22)%
Interest expense increased in 2016, when compared to 2015, due to an overall increase in our consolidated debt outstanding as of December 31, 2016 to fund the acquisition of Veda in 2016. Our average cost of debt decreased in 2016 compared to the prior year, due to the higher balance of low rate commercial paper outstanding and lower long-term rates related to the issuance of 2.3% and 3.25% Senior Notes.
Interest expense decreased in 2015, when compared to 2014, due to an overall decrease in our consolidated debt outstanding as of December 31, 2015. Our average cost of debt increased slightly in 2015 compared to the prior year, due to the higher ratio of higher interest debt and the low balance of low rate commercial paper outstanding.
The decrease in other income (expense), net, in 2016 is due to 2016 foreign exchange losses related to the Veda acquisition and the 2015 income from the settlement of escrow amounts related to an acquisition from January 2014 which did not recur in 2016. These items were partially offset by the impairment of our cost method investment in Brazil in the second quarter of 2015 which did not recur in 2016.
The increase in other income (expense), net, in 2015 is due to income from the settlement of escrow amounts related to an acquisition from January 2014, and the gain on foreign currency options put in place as an economic hedge of Veda’s purchase price. This was partially offset by the impairment of our cost method investment in Brazil in the second quarter of 2015.
Income Taxes
Twelve Months Ended December 31, Change2016 vs. 2015 2015 vs. 2014
Provision for Income Taxes 2016 2015 2014 $ % $ %
(In millions)
Consolidated provision for income taxes $(233.1) $(201.8) $(200.2) $(31.3) 16% $(1.6) 1%Effective income tax rate 32.0% 31.7% 34.9%
Overall, our effective tax rate was 32.0% for 2016, up from 31.7% for the same period in 2015. The 2016 rate benefited by 2% due to international related items, specifically higher earnings in lower tax jurisdictions and the rationalization of the structure of foreign subsidiaries. This was offset by other non-recurring permanent items that benefited the 2015 tax rate including the settlement of escrow related to a past acquisition and state law changes, that did not recur in 2016.
Overall, our effective tax rate was 31.7% for 2015, down from 34.9% for the same period in 2014. The 2015 rate benefited by 2% due to international related items specifically the increased recognition of foreign tax credits, and a permanent item associated with the settlement of escrows related to past acquisitions, and 1.4% due to state tax law changes.
16 2016 Annual Report CONTENTS
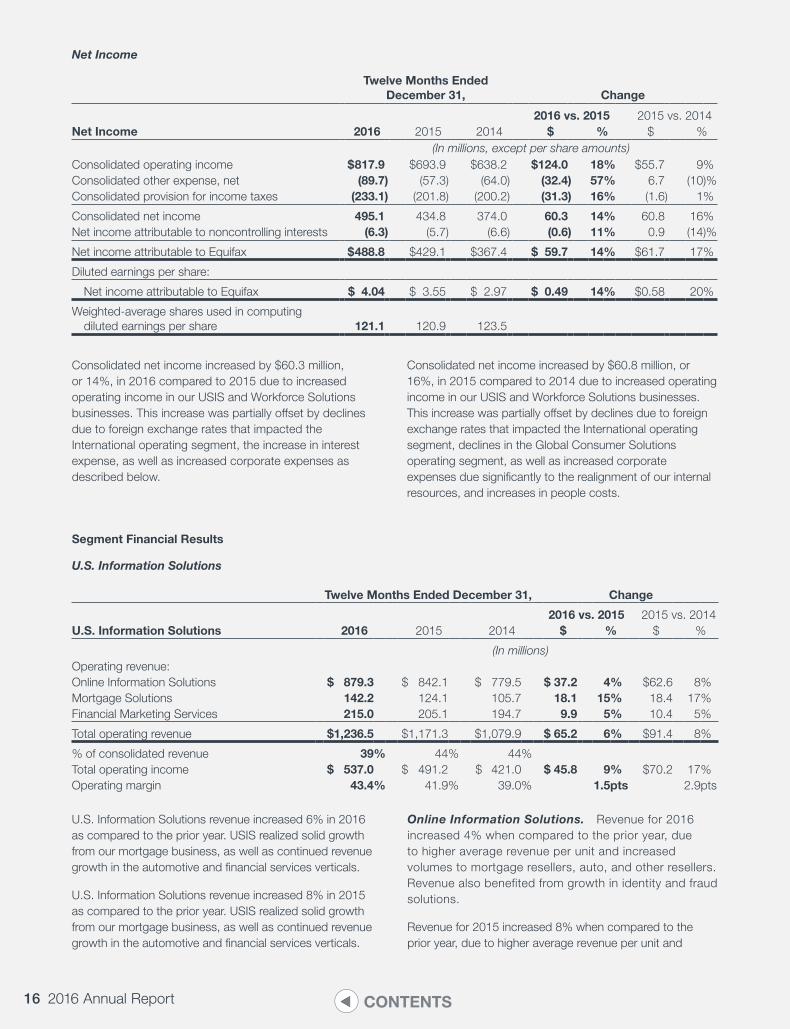
Net Income
Twelve Months Ended December 31, Change
2016 vs. 2015 2015 vs. 2014Net Income 2016 2015 2014 $ % $ %
(In millions, except per share amounts)Consolidated operating income $ 817.9 $693.9 $638.2 $124.0 18% $55.7 9%Consolidated other expense, net (89.7) (57.3) (64.0) (32.4) 57% 6.7 (10)%Consolidated provision for income taxes (233.1) (201.8) (200.2) (31.3) 16% (1.6) 1%
Consolidated net income 495.1 434.8 374.0 60.3 14% 60.8 16%Net income attributable to noncontrolling interests (6.3) (5.7) (6.6) (0.6) 11% 0.9 (14)%
Net income attributable to Equifax $ 488.8 $429.1 $367.4 $ 59.7 14% $61.7 17%
Diluted earnings per share:
Net income attributable to Equifax $ 4.04 $ 3.55 $ 2.97 $ 0.49 14% $0.58 20%
Weighted-average shares used in computing diluted earnings per share 121.1 120.9 123.5
Consolidated net income increased by $60.3 million, or 14%, in 2016 compared to 2015 due to increased operating income in our USIS and Workforce Solutions businesses. This increase was partially offset by declines due to foreign exchange rates that impacted the International operating segment, the increase in interest expense, as well as increased corporate expenses as described below.
Consolidated net income increased by $60.8 million, or 16%, in 2015 compared to 2014 due to increased operating income in our USIS and Workforce Solutions businesses. This increase was partially offset by declines due to foreign exchange rates that impacted the International operating segment, declines in the Global Consumer Solutions operating segment, as well as increased corporate expenses due significantly to the realignment of our internal resources, and increases in people costs.
Segment Financial Results
U.S. Information Solutions
Twelve Months Ended December 31, Change
U.S. Information Solutions2016 vs. 2015 2015 vs. 2014
2016 2015 2014 $ % $ %
(In millions)Operating revenue:Online Information Solutions $ 879.3 $ 842.1 $ 779.5 $ 37.2 4% $62.6 8%Mortgage Solutions 142.2 124.1 105.7 18.1 15% 18.4 17%Financial Marketing Services 215.0 205.1 194.7 9.9 5% 10.4 5%
Total operating revenue $1,236.5 $1,171.3 $1,079.9 $ 65.2 6% $91.4 8%
% of consolidated revenue 39% 44% 44%Total operating income $ 537.0 $ 491.2 $ 421.0 $ 45.8 9% $70.2 17%Operating margin 43.4% 41.9% 39.0% 1.5pts 2.9pts
U.S. Information Solutions revenue increased 6% in 2016 as compared to the prior year. USIS realized solid growth from our mortgage business, as well as continued revenue growth in the automotive and financial services verticals.
U.S. Information Solutions revenue increased 8% in 2015 as compared to the prior year. USIS realized solid growth from our mortgage business, as well as continued revenue growth in the automotive and financial services verticals.
Online Information Solutions. Revenue for 2016 increased 4% when compared to the prior year, due to higher average revenue per unit and increased volumes to mortgage resellers, auto, and other resellers. Revenue also benefited from growth in identity and fraud solutions.
Revenue for 2015 increased 8% when compared to the prior year, due to higher average revenue per unit and
17Equifax Inc.CONTENTS
increased volumes to mortgage resellers, auto, and other resellers. Revenue also benefited from growth in identity and fraud solutions.
Mortgage Solutions. Revenue increased 15% in 2016 when compared to prior year, driven by a strong market for refinancing and purchase activity, as well as growth from other mortgage product offerings.
Revenue increased 17% in 2015 when compared to prior year, driven by a strong market for refinancing and purchase activity, as well as growth from other mortgage product offerings.
Financial Marketing Services. Revenue increased 5% in 2016 as compared to 2015. The increases were driven
by growth in our credit marketing services due to increased demand from financial services customers.
Revenue increased 5% in 2015 as compared to 2014. The increases were driven by growth in our credit marketing services due to increased demand from financial services customers.
U.S. Information Solutions Operating Margin. USIS operating margin increased to 43.4% in 2016 as compared to 2015 of 41.9%. Margin expansion resulted from strong revenue growth and product mix. USIS operating margin increased to 41.9% in 2015 as compared to 2014 of 39.0%. Margin expansion resulted from strong revenue growth and product mix.
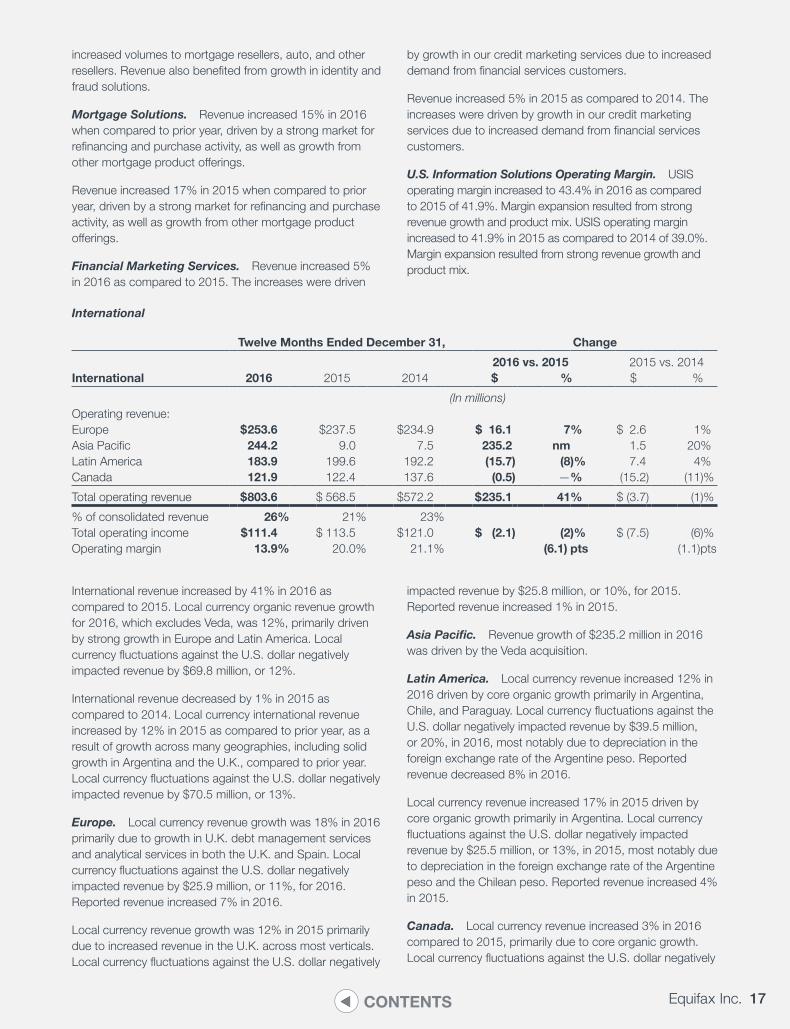
International
Twelve Months Ended December 31, Change
2016 vs. 2015 2015 vs. 2014International 2016 2015 2014 $ % $ %
(In millions)Operating revenue:Europe $ 253.6 $237.5 $234.9 $ 16.1 7% $ 2.6 1%Asia Pacific 244.2 9.0 7.5 235.2 nm 1.5 20%Latin America 183.9 199.6 192.2 (15.7) (8)% 7.4 4%Canada 121.9 122.4 137.6 (0.5) —% (15.2) (11)%
Total operating revenue $ 803.6 $ 568.5 $572.2 $ 235.1 41% $ (3.7) (1)%
% of consolidated revenue 26% 21% 23%Total operating income $111.4 $ 113.5 $121.0 $ (2.1) (2)% $ (7.5) (6)%Operating margin 13.9% 20.0% 21.1% (6.1) pts (1.1)pts
International revenue increased by 41% in 2016 as compared to 2015. Local currency organic revenue growth for 2016, which excludes Veda, was 12%, primarily driven by strong growth in Europe and Latin America. Local currency fluctuations against the U.S. dollar negatively impacted revenue by $69.8 million, or 12%.
International revenue decreased by 1% in 2015 as compared to 2014. Local currency international revenue increased by 12% in 2015 as compared to prior year, as a result of growth across many geographies, including solid growth in Argentina and the U.K., compared to prior year. Local currency fluctuations against the U.S. dollar negatively impacted revenue by $70.5 million, or 13%.
Europe. Local currency revenue growth was 18% in 2016 primarily due to growth in U.K. debt management services and analytical services in both the U.K. and Spain. Local currency fluctuations against the U.S. dollar negatively impacted revenue by $25.9 million, or 11%, for 2016. Reported revenue increased 7% in 2016.
Local currency revenue growth was 12% in 2015 primarily due to increased revenue in the U.K. across most verticals. Local currency fluctuations against the U.S. dollar negatively
impacted revenue by $25.8 million, or 10%, for 2015. Reported revenue increased 1% in 2015.
Asia Pacific. Revenue growth of $235.2 million in 2016 was driven by the Veda acquisition.
Latin America. Local currency revenue increased 12% in 2016 driven by core organic growth primarily in Argentina, Chile, and Paraguay. Local currency fluctuations against the U.S. dollar negatively impacted revenue by $39.5 million, or 20%, in 2016, most notably due to depreciation in the foreign exchange rate of the Argentine peso. Reported revenue decreased 8% in 2016.
Local currency revenue increased 17% in 2015 driven by core organic growth primarily in Argentina. Local currency fluctuations against the U.S. dollar negatively impacted revenue by $25.5 million, or 13%, in 2015, most notably due to depreciation in the foreign exchange rate of the Argentine peso and the Chilean peso. Reported revenue increased 4% in 2015.
Canada. Local currency revenue increased 3% in 2016 compared to 2015, primarily due to core organic growth. Local currency fluctuations against the U.S. dollar negatively
18 2016 Annual Report CONTENTS
impacted revenue by $4.4 million, or 4%, in 2016. Reported revenue was flat in 2016.
Local currency revenue increased 3% in 2015 compared to 2014, primarily due to growth within information and analytical services. Local currency fluctuations against the U.S. dollar negatively impacted revenue by $19.2 million, or 14%, in 2015. Reported revenue decreased 11% in 2015.
International Operating Margin. Operating margin decreased to 13.9% in 2016 as compared to 20.0% in 2015.
The decline primarily resulted from increased purchased intangibles amortization, integration costs related to the Veda acquisition and a decline in the margin in Latin America. The decline was partially offset by increased margins in Europe and Canada. Operating margin decreased in 2015 as compared to 2014 due to geographic and product mix, regionalization efforts, and investments in the U.K. The declines in margin were also a result of inflation-driven pressures on margin in Argentina.
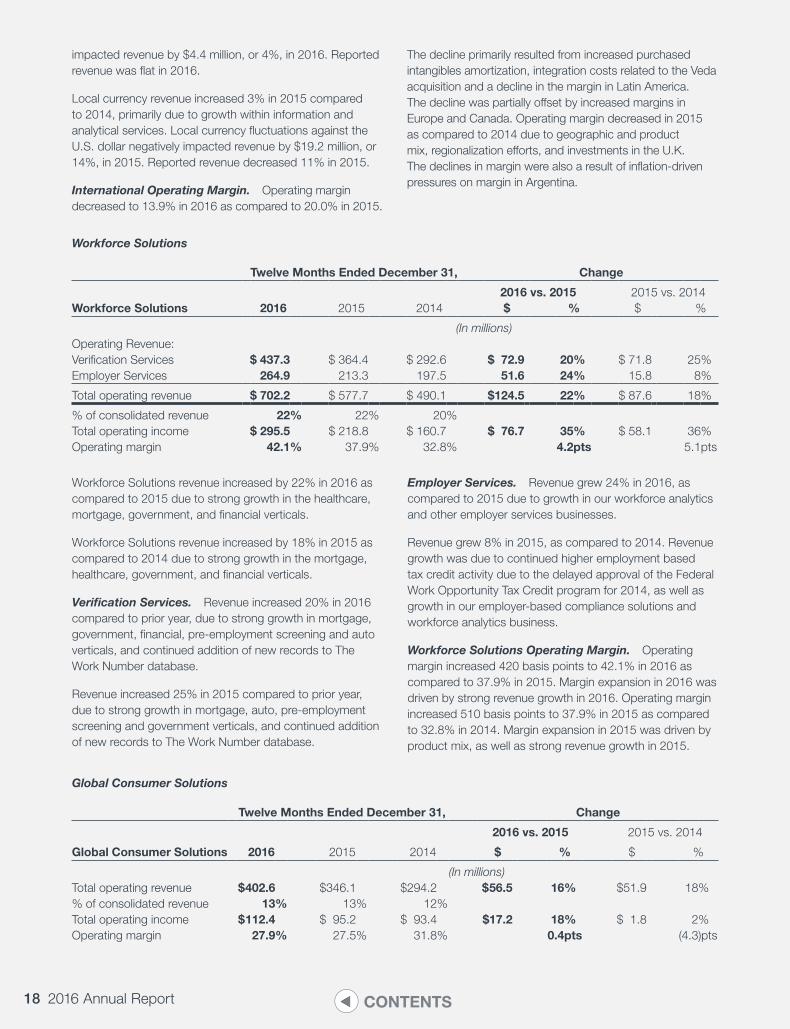
Workforce Solutions
Twelve Months Ended December 31, Change
2016 vs. 2015 2015 vs. 2014Workforce Solutions 2016 2015 2014 $ % $ %
(In millions)Operating Revenue:Verification Services $ 437.3 $ 364.4 $ 292.6 $ 72.9 20% $ 71.8 25%Employer Services 264.9 213.3 197.5 51.6 24% 15.8 8%
Total operating revenue $ 702.2 $ 577.7 $ 490.1 $124.5 22% $ 87.6 18%
% of consolidated revenue 22% 22% 20%Total operating income $ 295.5 $ 218.8 $ 160.7 $ 76.7 35% $ 58.1 36%Operating margin 42.1% 37.9% 32.8% 4.2pts 5.1pts
Workforce Solutions revenue increased by 22% in 2016 as compared to 2015 due to strong growth in the healthcare, mortgage, government, and financial verticals.
Workforce Solutions revenue increased by 18% in 2015 as compared to 2014 due to strong growth in the mortgage, healthcare, government, and financial verticals.
Verification Services. Revenue increased 20% in 2016 compared to prior year, due to strong growth in mortgage, government, financial, pre-employment screening and auto verticals, and continued addition of new records to The Work Number database.
Revenue increased 25% in 2015 compared to prior year, due to strong growth in mortgage, auto, pre-employment screening and government verticals, and continued addition of new records to The Work Number database.
Employer Services. Revenue grew 24% in 2016, as compared to 2015 due to growth in our workforce analytics and other employer services businesses.
Revenue grew 8% in 2015, as compared to 2014. Revenue growth was due to continued higher employment based tax credit activity due to the delayed approval of the Federal Work Opportunity Tax Credit program for 2014, as well as growth in our employer-based compliance solutions and workforce analytics business.
Workforce Solutions Operating Margin. Operating margin increased 420 basis points to 42.1% in 2016 as compared to 37.9% in 2015. Margin expansion in 2016 was driven by strong revenue growth in 2016. Operating margin increased 510 basis points to 37.9% in 2015 as compared to 32.8% in 2014. Margin expansion in 2015 was driven by product mix, as well as strong revenue growth in 2015.
Global Consumer Solutions
Twelve Months Ended December 31, Change
Global Consumer Solutions
2016 vs. 2015 2015 vs. 2014
2016 2015 2014 $ % $ %
(In millions)Total operating revenue $ 402.6 $346.1 $294.2 $ 56.5 16% $51.9 18%% of consolidated revenue 13% 13% 12%Total operating income $ 112.4 $ 95.2 $ 93.4 $17.2 18% $ 1.8 2%Operating margin 27.9% 27.5% 31.8% 0.4pts (4.3)pts
19Equifax Inc.CONTENTS
Revenue increased 16% for 2016, as compared to prior year. Local currency revenue grew 18% in 2016, principally due to the growth of direct to consumer reseller revenue, and to a lesser extent, due to consumer direct revenue growth globally. Local currency fluctuations against the U.S. dollar negatively impacted revenue by $5.4 million, or 2%, for 2016. Operating margin increased in 2016 to 27.9% as compared to 27.5% in the prior year, due to lower marketing expenses partially offset by higher production costs due to reseller product mix and increases in partner implementation costs.
Revenue increased 18% for 2015, as compared to prior year. Local currency revenue grew 19% in 2015, principally due to the growth of direct to consumer reseller revenue, and to a lesser extent, due to consumer direct revenue growth in the U.K. and the U.S. Local currency fluctuations against the U.S. dollar negatively impacted revenue by $5.2 million, or 1%, for 2015. Operating margin decreased in 2015 to 27.5% as compared to 31.8% in prior year, due to higher technology and marketing expenses.
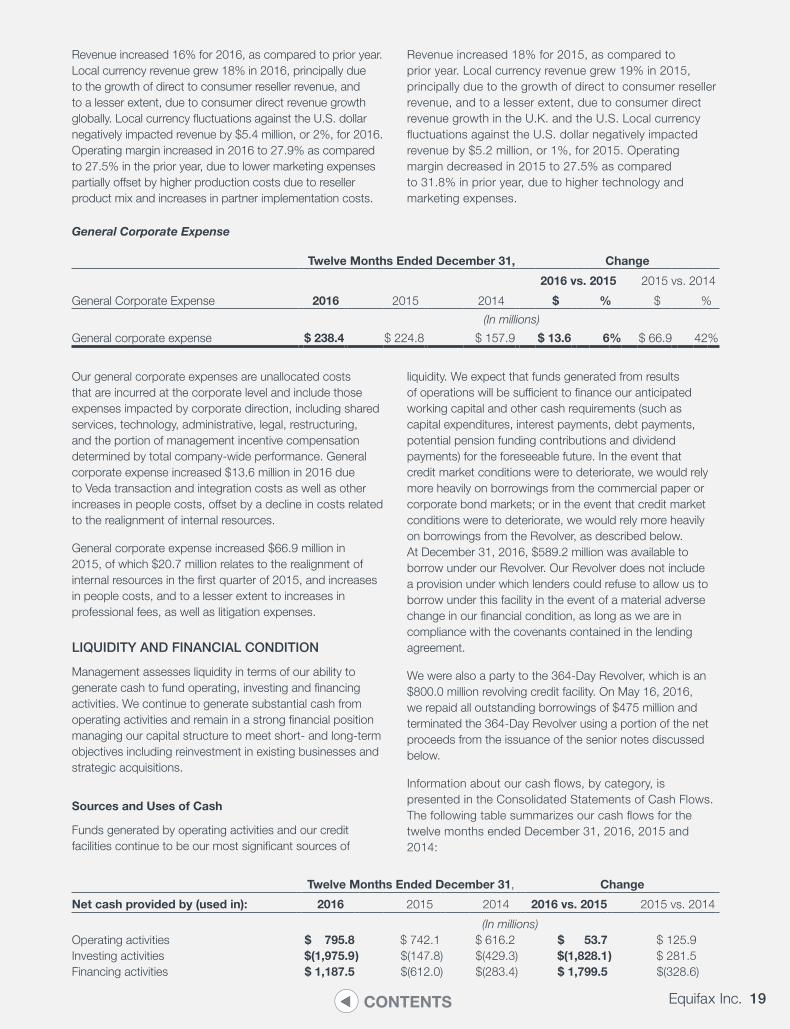
General Corporate Expense
Twelve Months Ended December 31, Change
2016 vs. 2015 2015 vs. 2014
General Corporate Expense 2016 2015 2014 $ % $ %
(In millions)
General corporate expense $ 238.4 $ 224.8 $ 157.9 $ 13.6 6% $ 66.9 42%
Our general corporate expenses are unallocated costs that are incurred at the corporate level and include those expenses impacted by corporate direction, including shared services, technology, administrative, legal, restructuring, and the portion of management incentive compensation determined by total company-wide performance. General corporate expense increased $13.6 million in 2016 due to Veda transaction and integration costs as well as other increases in people costs, offset by a decline in costs related to the realignment of internal resources.
General corporate expense increased $66.9 million in 2015, of which $20.7 million relates to the realignment of internal resources in the first quarter of 2015, and increases in people costs, and to a lesser extent to increases in professional fees, as well as litigation expenses.
LIQUIDITY AND FINANCIAL CONDITION
Management assesses liquidity in terms of our ability to generate cash to fund operating, investing and financing activities. We continue to generate substantial cash from operating activities and remain in a strong financial position managing our capital structure to meet short- and long-term objectives including reinvestment in existing businesses and strategic acquisitions.
Sources and Uses of Cash
Funds generated by operating activities and our credit facilities continue to be our most significant sources of
liquidity. We expect that funds generated from results of operations will be sufficient to finance our anticipated working capital and other cash requirements (such as capital expenditures, interest payments, debt payments, potential pension funding contributions and dividend payments) for the foreseeable future. In the event that credit market conditions were to deteriorate, we would rely more heavily on borrowings from the commercial paper or corporate bond markets; or in the event that credit market conditions were to deteriorate, we would rely more heavily on borrowings from the Revolver, as described below. At December 31, 2016, $589.2 million was available to borrow under our Revolver. Our Revolver does not include a provision under which lenders could refuse to allow us to borrow under this facility in the event of a material adverse change in our financial condition, as long as we are in compliance with the covenants contained in the lending agreement.
We were also a party to the 364-Day Revolver, which is an $800.0 million revolving credit facility. On May 16, 2016, we repaid all outstanding borrowings of $475 million and terminated the 364-Day Revolver using a portion of the net proceeds from the issuance of the senior notes discussed below.
Information about our cash flows, by category, is presented in the Consolidated Statements of Cash Flows. The following table summarizes our cash flows for the twelve months ended December 31, 2016, 2015 and 2014:
Twelve Months Ended December 31, Change
Net cash provided by (used in): 2016 2015 2014 2016 vs. 2015 2015 vs. 2014
(In millions)Operating activities $ 795.8 $ 742.1 $ 616.2 $ 53.7 $ 125.9Investing activities $(1,975.9) $(147.8) $(429.3) $(1,828.1) $ 281.5Financing activities $ 1,187.5 $(612.0) $(283.4) $ 1,799.5 $(328.6)
20 2016 Annual Report CONTENTS
Operating Activities
Cash provided by operating activities for 2016 increased by $53.7 million over the prior year, due to $60.3 million growth in net income, partially offset by an increase in working capital mostly driven by an increase in accounts receivable, lower growth in other liabilities, current and long-term, excluding debt, compared to 2015.
Cash provided by operating activities for 2015 increased by $125.9 million over the prior year, due to $75.6 million growth in net income, adjusted for the Brazil impairment, and improvements in working capital, notably an increase in
current liabilities related to current payables, incentives and unearned income.
Fund Transfer Limitations. The ability of certain of our subsidiaries and associated companies to transfer funds to us may be limited, in some cases, by certain restrictions imposed by foreign governments. These restrictions do not, individually or in the aggregate, materially limit our ability to service our indebtedness, meet our current obligations or pay dividends. We currently hold $117.4 million of cash in our foreign subsidiaries.
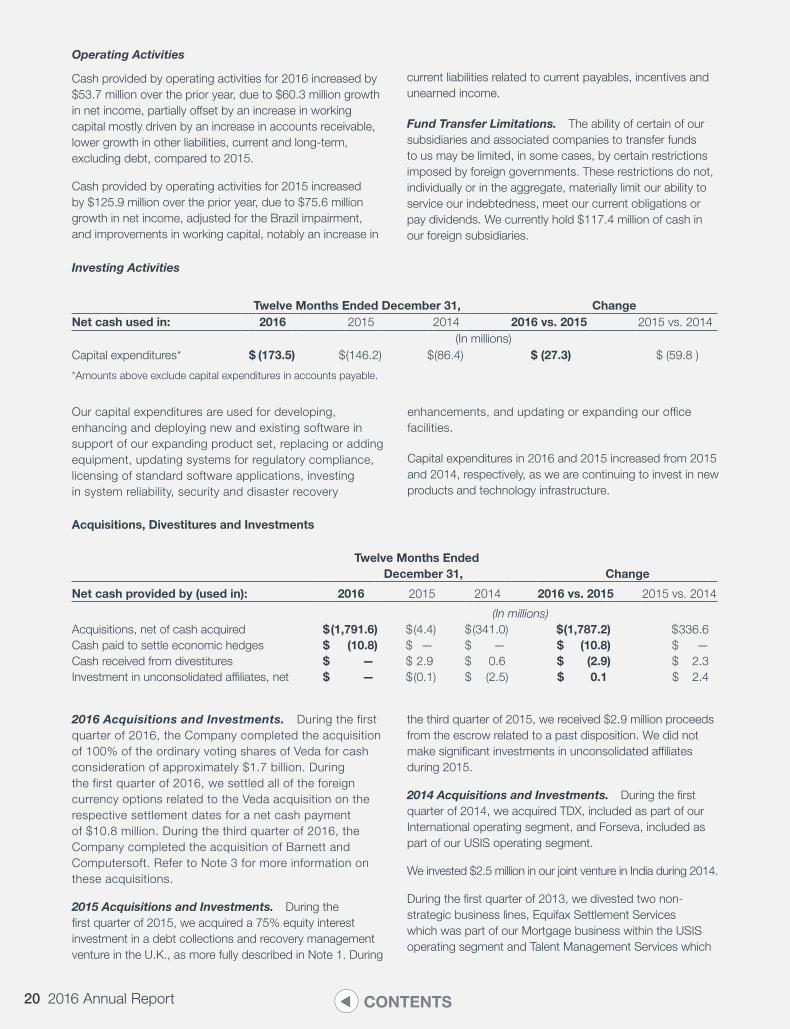
Investing Activities
Twelve Months Ended December 31, ChangeNet cash used in: 2016 2015 2014 2016 vs. 2015 2015 vs. 2014
(In millions)Capital expenditures* $ (173.5) $(146.2) $(86.4) $ (27.3) $ (59.8 )
*Amounts above exclude capital expenditures in accounts payable.
Our capital expenditures are used for developing, enhancing and deploying new and existing software in support of our expanding product set, replacing or adding equipment, updating systems for regulatory compliance, licensing of standard software applications, investing in system reliability, security and disaster recovery
enhancements, and updating or expanding our office facilities.
Capital expenditures in 2016 and 2015 increased from 2015 and 2014, respectively, as we are continuing to invest in new products and technology infrastructure.
Acquisitions, Divestitures and Investments
Twelve Months Ended December 31, Change
Net cash provided by (used in): 2016 2015 2014 2016 vs. 2015 2015 vs. 2014
(In millions)Acquisitions, net of cash acquired $(1,791.6) $(4.4) $(341.0) $ (1,787.2) $ 336.6Cash paid to settle economic hedges $ (10.8) $ — $ — $ (10.8) $ —Cash received from divestitures $ — $ 2.9 $ 0.6 $ (2.9) $ 2.3Investment in unconsolidated affiliates, net $ — $(0.1) $ (2.5) $ 0.1 $ 2.4
2016 Acquisitions and Investments. During the first quarter of 2016, the Company completed the acquisition of 100% of the ordinary voting shares of Veda for cash consideration of approximately $1.7 billion. During the first quarter of 2016, we settled all of the foreign currency options related to the Veda acquisition on the respective settlement dates for a net cash payment of $10.8 million. During the third quarter of 2016, the Company completed the acquisition of Barnett and Computersoft. Refer to Note 3 for more information on these acquisitions.
2015 Acquisitions and Investments. During the first quarter of 2015, we acquired a 75% equity interest investment in a debt collections and recovery management venture in the U.K., as more fully described in Note 1. During
the third quarter of 2015, we received $2.9 million proceeds from the escrow related to a past disposition. We did not make significant investments in unconsolidated affiliates during 2015.
2014 Acquisitions and Investments. During the first quarter of 2014, we acquired TDX, included as part of our International operating segment, and Forseva, included as part of our USIS operating segment.
We invested $2.5 million in our joint venture in India during 2014.
During the first quarter of 2013, we divested two non-strategic business lines, Equifax Settlement Services which was part of our Mortgage business within the USIS operating segment and Talent Management Services which
21Equifax Inc.CONTENTS
was part of our Employer Services business within our Workforce Solutions operating segment, for a total of $47.5 million. $3.5 million of the proceeds of the sale of Talent Management Services was placed into an escrow account to be released to us at a later date. During 2014, we received $0.6 million of the proceeds from the escrow.
For additional information about our acquisitions, see Note 3 of the Notes to Consolidated Financial Statements in this report.
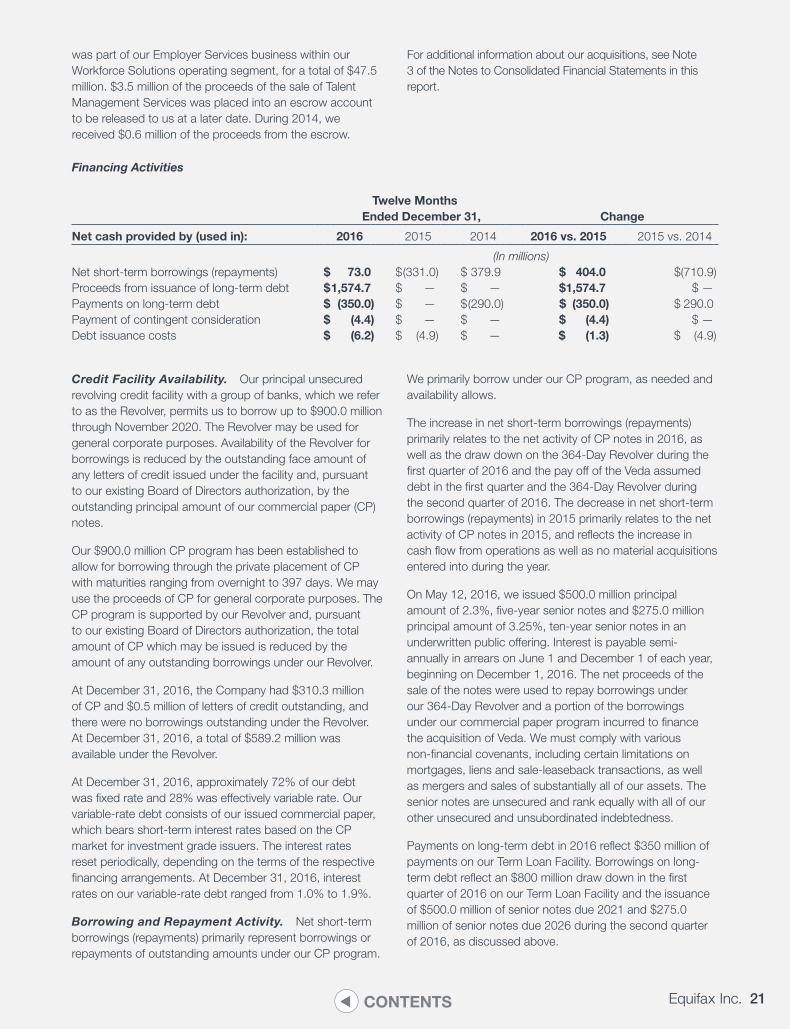
Financing Activities
Twelve Months Ended December 31, Change
Net cash provided by (used in): 2016 2015 2014 2016 vs. 2015 2015 vs. 2014
(In millions)Net short-term borrowings (repayments) $ 73.0 $(331.0) $ 379.9 $ 404.0 $(710.9)Proceeds from issuance of long-term debt $1,574.7 $ — $ — $1,574.7 $ —Payments on long-term debt $ (350.0) $ — $(290.0) $ (350.0) $ 290.0Payment of contingent consideration $ (4.4) $ — $ — $ (4.4) $ —Debt issuance costs $ (6.2) $ (4.9) $ — $ (1.3) $ (4.9)
Credit Facility Availability. Our principal unsecured revolving credit facility with a group of banks, which we refer to as the Revolver, permits us to borrow up to $900.0 million through November 2020. The Revolver may be used for general corporate purposes. Availability of the Revolver for borrowings is reduced by the outstanding face amount of any letters of credit issued under the facility and, pursuant to our existing Board of Directors authorization, by the outstanding principal amount of our commercial paper (CP) notes.
Our $900.0 million CP program has been established to allow for borrowing through the private placement of CP with maturities ranging from overnight to 397 days. We may use the proceeds of CP for general corporate purposes. The CP program is supported by our Revolver and, pursuant to our existing Board of Directors authorization, the total amount of CP which may be issued is reduced by the amount of any outstanding borrowings under our Revolver.
At December 31, 2016, the Company had $310.3 million of CP and $0.5 million of letters of credit outstanding, and there were no borrowings outstanding under the Revolver. At December 31, 2016, a total of $589.2 million was available under the Revolver.
At December 31, 2016, approximately 72% of our debt was fixed rate and 28% was effectively variable rate. Our variable-rate debt consists of our issued commercial paper, which bears short-term interest rates based on the CP market for investment grade issuers. The interest rates reset periodically, depending on the terms of the respective financing arrangements. At December 31, 2016, interest rates on our variable-rate debt ranged from 1.0% to 1.9%.
Borrowing and Repayment Activity. Net short-term borrowings (repayments) primarily represent borrowings or repayments of outstanding amounts under our CP program.
We primarily borrow under our CP program, as needed and availability allows.
The increase in net short-term borrowings (repayments) primarily relates to the net activity of CP notes in 2016, as well as the draw down on the 364-Day Revolver during the first quarter of 2016 and the pay off of the Veda assumed debt in the first quarter and the 364-Day Revolver during the second quarter of 2016. The decrease in net short-term borrowings (repayments) in 2015 primarily relates to the net activity of CP notes in 2015, and reflects the increase in cash flow from operations as well as no material acquisitions entered into during the year.
On May 12, 2016, we issued $500.0 million principal amount of 2.3%, five-year senior notes and $275.0 million principal amount of 3.25%, ten-year senior notes in an underwritten public offering. Interest is payable semi-annually in arrears on June 1 and December 1 of each year, beginning on December 1, 2016. The net proceeds of the sale of the notes were used to repay borrowings under our 364-Day Revolver and a portion of the borrowings under our commercial paper program incurred to finance the acquisition of Veda. We must comply with various non-financial covenants, including certain limitations on mortgages, liens and sale-leaseback transactions, as well as mergers and sales of substantially all of our assets. The senior notes are unsecured and rank equally with all of our other unsecured and unsubordinated indebtedness.
Payments on long-term debt in 2016 reflect $350 million of payments on our Term Loan Facility. Borrowings on long-term debt reflect an $800 million draw down in the first quarter of 2016 on our Term Loan Facility and the issuance of $500.0 million of senior notes due 2021 and $275.0 million of senior notes due 2026 during the second quarter of 2016, as discussed above.
22 2016 Annual Report CONTENTS
The decrease in payments on long-term debt in 2015 reflects the 2014 pay-off of our $15.0 million 7.34% Notes and $275.0 million 4.45% Senior Notes with borrowings under our CP program.
The debt issuance costs in 2016 and 2015 reflect the debt issuance costs paid in connection with the new Senior Credit Facilities entered into in May 2016 and November 2015, respectively.
Debt Covenants. The outstanding indentures and comparable instruments contain customary covenants including, for example, limits on secured debt and sale/leaseback transactions. In addition, the Senior Credit Facilities require us to maintain a maximum leverage ratio of not more than 3.5 to 1.0. As permitted under the terms of the Senior Credit Facilities, we made the election to increase the covenant to 4.0 to 1.0, effective for four consecutive quarters, beginning with the first quarter of 2016 and continuing through the fourth quarter of 2016. None of these covenants are considered restrictive to our operations and, as of December 31, 2016, the Company was in compliance with all of our debt covenants.
The Company does not have any credit rating triggers that would accelerate the maturity of a material amount of the outstanding debt; however, the 6.3% Senior Notes due 2017, 2.3% Senior Notes due 2021, 3.3% Senior Notes due 2022, 3.25% Senior Notes due 2026 and 7.0% Senior Notes due 2037 (together, the “Senior Notes”) contain change in control provisions. If the Company experiences a change of control or publicly announces the Company’s intention to effect a change of control and the rating on the senior notes is lowered by Standard & Poor’s, or S&P, and Moody’s Investors Service, or Moody’s, below an investment grade rating within 60 days of such change of control or notice thereof, then the Company will be required to offer to repurchase the senior notes at a price equal to 101% of the
aggregate principal amount of the senior notes plus accrued and unpaid interest.
Credit Ratings. Credit ratings reflect an independent agency’s judgment on the likelihood that a borrower will repay a debt obligation at maturity. The ratings reflect many considerations, such as the nature of the borrower’s industry and its competitive position, the size of the company, its liquidity and access to capital and the sensitivity of a company’s cash flows to changes in the economy. The two largest rating agencies, S&P and Moody’s, use alphanumeric codes to designate their ratings. The highest quality rating for long-term credit obligations is AAA and Aaa for S&P and Moody’s, respectively. A security rating is not a recommendation to buy, sell or hold securities and may be subject to revision or withdrawal at any time by the assigning rating agency.
Long-term ratings of BBB- and Baa3 or better by S&P and Moody’s, respectively, reflect ratings on debt obligations that fall within a band of credit quality considered to be “investment grade”. At December 31, 2016, the long-term ratings for our obligations were BBB+ and Baa1, which are consistent with the ratings and outlooks which existed at December 31, 2015. A downgrade in our credit rating would increase the cost of borrowings under our CP program and credit facilities, and could limit, or in the case of a significant downgrade, preclude our ability to issue CP. If our credit ratings were to decline to lower levels, we could experience increases in the interest cost for any new debt. In addition, the market’s demand for, and thus our ability to readily issue, new debt could become further affected by the economic and credit market environment.
For additional information about our debt, including the terms of our financing arrangements, basis for variable interest rates and debt covenants, see Note 5 of the Notes to Consolidated Financial Statements in this report.
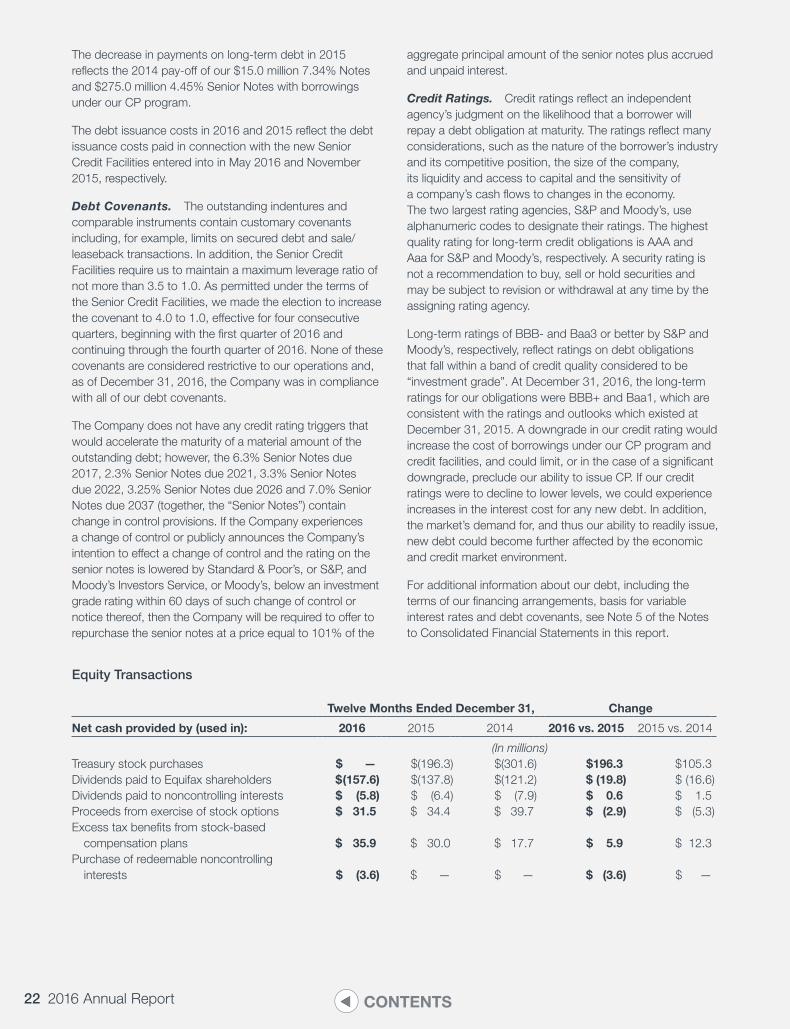
Equity Transactions
Twelve Months Ended December 31, Change
Net cash provided by (used in): 2016 2015 2014 2016 vs. 2015 2015 vs. 2014
(In millions)Treasury stock purchases $ — $(196.3) $(301.6) $196.3 $105.3Dividends paid to Equifax shareholders $ (157.6) $(137.8) $(121.2) $ (19.8) $ (16.6)Dividends paid to noncontrolling interests $ (5.8) $ (6.4) $ (7.9) $ 0.6 $ 1.5Proceeds from exercise of stock options $ 31.5 $ 34.4 $ 39.7 $ (2.9) $ (5.3)Excess tax benefits from stock-based compensation plans $ 35.9 $ 30.0 $ 17.7 $ 5.9 $ 12.3Purchase of redeemable noncontrolling interests $ (3.6) $ — $ — $ (3.6) $ —
23Equifax Inc.CONTENTS
Sources and uses of cash related to equity during the twelve months ended December 31, 2016, 2015 and 2014 were as follows:
• Under share repurchase programs authorized by our Board of Directors, we repurchased 2.1 million and 3.9 million common shares during the twelve months ended December 31, 2015 and 2014, respectively, for $196.3 million and $301.6 million, respectively, at an average price per common share of $94.97 and $76.55, respectively. We did not repurchase any shares in 2016. As of December 31, 2016, under the existing board authorization, the Company is approved for additional stock repurchases valued at $667.2 million.
• During the twelve months ended December 31, 2016, 2015 and 2014, we paid cash dividends to Equifax shareholders of $157.6 million, $137.8 million and $121.2 million, respectively, at $1.32 per share for 2016, $1.16 per share for 2015 and $1.00 per share for 2014.
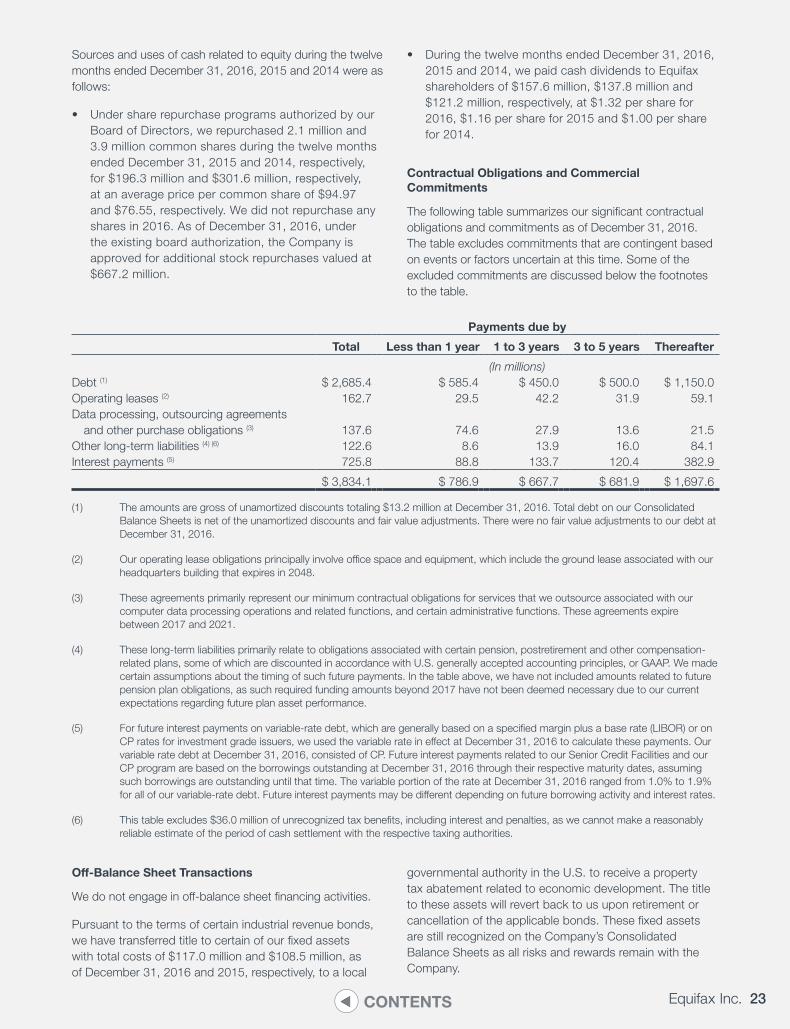
Contractual Obligations and Commercial Commitments
The following table summarizes our significant contractual obligations and commitments as of December 31, 2016. The table excludes commitments that are contingent based on events or factors uncertain at this time. Some of the excluded commitments are discussed below the footnotes to the table.
Payments due by
Total Less than 1 year 1 to 3 years 3 to 5 years Thereafter
(In millions)Debt (1) $ 2,685.4 $ 585.4 $ 450.0 $ 500.0 $ 1,150.0Operating leases (2) 162.7 29.5 42.2 31.9 59.1Data processing, outsourcing agreements and other purchase obligations (3) 137.6 74.6 27.9 13.6 21.5Other long-term liabilities (4) (6) 122.6 8.6 13.9 16.0 84.1Interest payments (5) 725.8 88.8 133.7 120.4 382.9
$ 3,834.1 $ 786.9 $ 667.7 $ 681.9 $ 1,697.6
(1) The amounts are gross of unamortized discounts totaling $13.2 million at December 31, 2016. Total debt on our Consolidated Balance Sheets is net of the unamortized discounts and fair value adjustments. There were no fair value adjustments to our debt at December 31, 2016.
(2) Our operating lease obligations principally involve office space and equipment, which include the ground lease associated with our headquarters building that expires in 2048.
(3) These agreements primarily represent our minimum contractual obligations for services that we outsource associated with our computer data processing operations and related functions, and certain administrative functions. These agreements expire between 2017 and 2021.
(4) These long-term liabilities primarily relate to obligations associated with certain pension, postretirement and other compensation-related plans, some of which are discounted in accordance with U.S. generally accepted accounting principles, or GAAP. We made certain assumptions about the timing of such future payments. In the table above, we have not included amounts related to future pension plan obligations, as such required funding amounts beyond 2017 have not been deemed necessary due to our current expectations regarding future plan asset performance.
(5) For future interest payments on variable-rate debt, which are generally based on a specified margin plus a base rate (LIBOR) or on CP rates for investment grade issuers, we used the variable rate in effect at December 31, 2016 to calculate these payments. Our variable rate debt at December 31, 2016, consisted of CP. Future interest payments related to our Senior Credit Facilities and our CP program are based on the borrowings outstanding at December 31, 2016 through their respective maturity dates, assuming such borrowings are outstanding until that time. The variable portion of the rate at December 31, 2016 ranged from 1.0% to 1.9% for all of our variable-rate debt. Future interest payments may be different depending on future borrowing activity and interest rates.
(6) This table excludes $36.0 million of unrecognized tax benefits, including interest and penalties, as we cannot make a reasonably reliable estimate of the period of cash settlement with the respective taxing authorities.
Off-Balance Sheet Transactions
We do not engage in off-balance sheet financing activities.
Pursuant to the terms of certain industrial revenue bonds, we have transferred title to certain of our fixed assets with total costs of $117.0 million and $108.5 million, as of December 31, 2016 and 2015, respectively, to a local
governmental authority in the U.S. to receive a property tax abatement related to economic development. The title to these assets will revert back to us upon retirement or cancellation of the applicable bonds. These fixed assets are still recognized on the Company’s Consolidated Balance Sheets as all risks and rewards remain with the Company.
24 2016 Annual Report CONTENTS
Letters of Credit and Guarantees
We will from time to time issue standby letters of credit, performance bonds or other guarantees in the normal course of business. The aggregate notional amount of all performance bonds and standby letters of credit was not material at December 31, 2016, and all have a remaining maturity of one year or less. Guarantees are issued from time to time to support the needs of our operating units. The maximum potential future payments we could be required to make under the guarantees is not material at December 31, 2016.
Benefit Plans
We sponsor a qualified defined benefit retirement plan (the U.S. Retirement Income Plan, or USRIP) that covers approximately 15% of current U.S. salaried employees who were hired on or before June 30, 2007, the last date on which an individual could be hired and enter the plan before the USRIP was frozen to new participation at December 31, 2008. This plan also covers many retirees as well as certain terminated but vested individuals not yet in retirement status. We also sponsor a defined benefit plan that covers most salaried and hourly employees in Canada (the Canadian Retirement Income Plan, or CRIP). The CRIP was frozen to new participants entering the plan on or after October 1, 2011.
At December 31, 2016, the USRIP met or exceeded ERISA’s minimum funding requirements. During the twelve months ended December 31, 2016 and 2015, we did not make any contributions to the USRIP. We contributed $0.8 million and $0.2 million to the CRIP during the twelve months ended December 31, 2016 and 2015, respectively. In the future, we will make minimum funding contributions as required and may make discretionary contributions, depending on certain circumstances, including market conditions and liquidity needs. We believe additional funding contributions, if any, would not prevent us from continuing to meet our liquidity needs, which are primarily funded from cash flows generated by operating activities, available cash and cash equivalents, and our credit facilities.
For our non-U.S., tax-qualified retirement plans, we fund an amount sufficient to meet minimum funding requirements but no more than allowed as a tax deduction pursuant to applicable tax regulations. For the non-qualified supplementary retirement plans, we fund the benefits as they are paid to retired participants, but accrue the associated expense and liabilities in accordance with GAAP.
For additional information about our benefit plans, see Note 10 of the Notes to Consolidated Financial Statements in this report.
Seasonality
We experience seasonality in certain of our revenue streams. Revenue generated by the online consumer information
services component of our USIS operating segment is typically the lowest during the first quarter, when consumer lending activity is at a seasonal low. Revenue generated from the Employer Services business unit within the Workforce Solutions operating segment is generally higher in the first quarter due primarily to the provision of Form W-2 preparation services which occur in the first quarter each year. Revenue generated from our financial wealth asset products and data management services in our Financial Marketing Services business is generally higher in the fourth quarter each year due to the significant portion of our annual renewals and deliveries which occur in the fourth quarter of each year.
Effects of Inflation and Changes in Foreign Currency Exchange Rates
Equifax’s operating results are not materially affected by inflation, although inflation may result in increases in the Company’s expenses, which may not be readily recoverable in the price of services offered. To the extent inflation results in rising interest rates and has other adverse effects upon the securities markets and upon the value of financial instruments, it may adversely affect the Company’s financial position and profitability.
A portion of the Company’s business is conducted in currencies other than the U.S. dollar, and changes in foreign exchange rates relative to the U.S. dollar can therefore affect the value of non-U.S. dollar net assets, revenues and expenses. Potential exposures as a result of these fluctuations in currencies are closely monitored. We generally do not mitigate the risks associated with fluctuating exchange rates, although we may from time to time through forward contracts or other derivative instruments hedge a portion of our translational foreign currency exposure or exchange rate risks associated with material transactions which are denominated in a foreign currency.
RECENT ACCOUNTING PRONOUNCEMENTS
For information about new accounting pronouncements and the potential impact on our Consolidated Financial Statements, see Note 1 of the Notes to Consolidated Financial Statements in this report.
APPLICATION OF CRITICAL ACCOUNTING POLICIES AND ESTIMATES
The Company’s Consolidated Financial Statements are prepared in conformity with U.S. generally accepted accounting principles, or GAAP. This requires our management to make estimates and assumptions that affect the reported amounts of assets and liabilities, revenues and expenses and related disclosures of contingent assets and liabilities in our Consolidated Financial Statements and the Notes to Consolidated Financial Statements. The following accounting policies involve critical accounting estimates because they are
25Equifax Inc.CONTENTS
particularly dependent on estimates and assumptions made by management about matters that are uncertain at the time the accounting estimates are made. In addition, while we have used our best estimates based on facts and circumstances available to us at the time, different estimates reasonably could have been used in the current period, or changes in the accounting estimates that we used are reasonably likely to occur from period to period, either of which may have a material impact on the presentation of our Consolidated Balance Sheets and Statements of Income. We also have other significant accounting policies which involve the use of estimates, judgments and assumptions that are relevant to understanding our results. For additional information about these policies, see Note 1 of the Notes to Consolidated Financial Statements in this report. Although we believe that our estimates, assumptions and judgments are reasonable, they are based upon information available at the time. Actual results may differ significantly from these estimates under different assumptions, judgments or conditions.
Revenue Recognition
Revenue is recognized when persuasive evidence of an arrangement exists, collectibility of arrangement consideration is reasonably assured, the arrangement fees are fixed or determinable and delivery of the product or service has been completed. A significant portion of our revenue is derived from the provision of information services to our customers on a transaction basis, in which case revenue is recognized, assuming all other revenue recognition criteria are met, when the services are provided. A smaller portion of our revenues relate to subscription-based contracts under which a customer pays a preset fee for a predetermined or unlimited number of transactions or services provided during the subscription period, generally one year. Revenue related to subscription-based contracts having a preset number of transactions is recognized as the services are provided, using an effective transaction rate as the actual transactions are completed. Any remaining revenue related to unfulfilled units is not recognized until the end of the related contract’s subscription period. Revenue related to subscription-based contracts having an unlimited volume is recognized ratably during the contract term. Revenue is recorded net of sales taxes.
If at the outset of an arrangement, we determine that collectibility is not reasonably assured, revenue is deferred until the earlier of when collectibility becomes probable or the receipt of payment. If there is uncertainty as to the customer’s acceptance of our deliverables, revenue is not recognized until the earlier of receipt of customer acceptance or expiration of the acceptance period. If at the outset of an arrangement, we determine that the arrangement fee is not fixed or determinable, revenue is deferred until the arrangement fee becomes fixed or determinable, assuming all other revenue recognition criteria have been met.
The determination of certain of our tax management services revenue requires the use of estimates, principally related to transaction volumes in instances where these volumes are reported to us by our clients on a monthly basis in arrears. In these instances, we estimate transaction volumes based on average actual volumes reported in the past. Differences between our estimates and actual final volumes reported are recorded in the period in which actual volumes are reported. We have not experienced significant variances between our estimates and actual reported volumes in the past. We monitor actual volumes to ensure that we will continue to make reasonable estimates in the future. If we determine that we are unable to make reasonable future estimates, revenue may be deferred until actual customer data is obtained. Also within our Workforce Solutions operating segment, the fees for certain of our tax credits and incentives revenue are based on a percentage of the credit delivered to our clients. Revenue for these arrangements is recognized based on the achievement of milestones, upon calculation of the credit, or when the credit is utilized by our client, depending on the provisions of the client contract.
We have certain offerings that are sold as multiple element arrangements. The multiple elements may include consumer or commercial information, file updates for certain solutions, services provided by our decisioning technologies personnel, training services, statistical models and other services. To account for each of these elements separately, the delivered elements must have stand-alone value to our customer. If we are unable to unbundle the arrangement into separate units of accounting, we apply one of the accounting policies described above. This may lead to the arrangement consideration being recognized as the final contract element is delivered to our customer or ratably over the contract.
Many of our multiple element arrangements involve the delivery of services generated by a combination of services provided by one or more of our operating segments. No individual information service impacts the value or usage of other information services included in an arrangement and each service can be sold alone or, in most cases, purchased from another vendor without affecting the quality of use or value to the customer of the other information services included in the arrangement. Some of our products require the development of interfaces or platforms by our decisioning technologies personnel that allow our customers to interact with our proprietary information databases. These development services do not meet the requirement for having stand-alone value, thus any related development fees are deferred when billed and are recognized over the expected period that the customer will benefit from the related decisioning technologies service. Revenue from the provision of statistical models is recognized as the service is provided and accepted, assuming all other revenue recognition criteria are met. The direct costs of set up of a
26 2016 Annual Report CONTENTS
customer are capitalized and amortized as a cost of service during the term of the related customer contract.
We have some multiple element arrangements that include software. We recognize the elements for which we have established vendor specific objective evidence at fair value upon delivery, in accordance with the applicable guidance.
We record revenue on a net basis for those sales in which we have in substance acted as an agent or broker in the transaction.
The debt collections and recovery management revenue is calculated as a percentage of debt collected on behalf of the customer and, as such, is primarily recognized when the cash is collected assuming all other revenue recognition criteria are met.
Deferred revenue consists of amounts billed and collected in excess of revenue recognized on sales relating generally to the deferral of subscription fees and arrangement consideration from elements not meeting the criteria for having stand-alone value discussed above. Deferred revenues are subsequently recognized as revenue in accordance with our revenue recognition policies.
Judgments and uncertainties — Each element of a multiple element arrangement must be considered separately to ensure that appropriate accounting is performed for these deliverables. These considerations include assessing the price at which the element is sold compared to its relative fair value; concluding when the element will be delivered; evaluating collectibility; and determining whether any contingencies exist in the related customer contract that impact the prices paid to us for the services.
In addition, as stated above, the determination of certain of our marketing information services and tax management services revenue requires the use of estimates, principally related to transaction volumes in instances where these volumes are reported to us by our clients on a monthly basis in arrears. In these instances, we estimate transaction volumes based on average actual volumes reported in the past. Differences between our estimates and actual final volumes reported are recorded in the period in which actual volumes are reported.
Effects if actual results differ from assumptions — We have not experienced significant variances between our estimates of marketing information services and tax management services revenues reported to us by our customers and actual reported volumes in the past. We monitor actual volumes to ensure that we will continue to make reasonable estimates in the future. If we determine that we are unable to make reasonable future estimates, revenue may be deferred until actual customer data is obtained. However, if actual results are not consistent with our estimates and assumptions, or if our customer arrangements become more complex or include more bundled offerings in the future, we may be required to recognize revenue differently
in the future to account for these changes. We do not believe there is a reasonable likelihood that there will be a material change in the future estimates or assumptions we use to recognize revenue.
Goodwill and Indefinite-Lived Intangible Assets
We review goodwill and indefinite lived intangible assets for impairment annually (as of September 30) and whenever events or changes in circumstances indicate the carrying value of an asset may not be recoverable. These events or circumstances could include a significant change in the business climate, legal factors, operating performance or trends, competition, or sale or disposition of a significant portion of a reporting unit. We have eight reporting units comprised of U.S. Information Solutions (which includes part of Online Information Solutions, Mortgage Solutions and Financial Marketing Services), Asia Pacific, Europe, Latin America, Canada, Global Consumer Solutions, Verification Services, and Employer Services.
The goodwill balance at December 31, 2016, for our eight reporting units was as follows:
December 31,2016
(In millions)Asia Pacific 1,402.4U.S. Information Solutions 1,071.3Europe 150.2Latin America 228.9Canada 33.1
Global Consumer Solutions 136.3
Verification Services 772.9
Employer Services 179.2Total goodwill $ 3,974.3
Qualitative Assessments
We performed a qualitative assessment to determine whether further impairment testing was necessary for all of our reporting units. In this qualitative assessment, we considered the following items for each of the reporting units: macroeconomic conditions, industry and market conditions, overall financial performance and other entity specific events. In addition, for each of these reporting units, the most recent fair value determination resulted in an amount that exceeded the carrying amount of the reporting units. Based on these assessments, we determined the likelihood that a current fair value determination would be less than the current carrying amount of the reporting unit is not more likely than not. As a result of our conclusions, no further testing was required for all of our reporting units.
Loss Contingencies
We are subject to various proceedings, lawsuits and claims arising in the normal course of our business. We determine
27Equifax Inc.CONTENTS
whether to disclose and/or accrue for loss contingencies based on our assessment of whether the potential loss is estimable, probable, reasonably possible or remote.
Judgments and uncertainties — We periodically review claims and legal proceedings and assess whether we have potential financial exposure based on consultation with internal and outside legal counsel and other advisors. If the likelihood of an adverse outcome from any claim or legal proceeding is probable and the amount can be reasonably estimated, we record a liability on our Consolidated Balance Sheets for the estimated amount. If the likelihood of an adverse outcome is reasonably possible, but not probable, we provide disclosures related to the potential loss contingency. Our assumptions related to loss contingencies are inherently subjective.
Effect if actual results differ from assumptions — We do not believe there is a reasonable likelihood that there will be a material change in the future estimates or assumptions we use to determine loss contingencies. However, if facts and circumstances change in the future that change our belief regarding assumptions used to determine our estimates, we may be exposed to a loss that could be material.
Income Taxes
We record deferred income taxes using enacted tax laws and rates for the years in which the taxes are expected to be paid. We assess the likelihood that our deferred tax assets will be recovered from future taxable income or other tax planning strategies. To the extent that we believe that recovery is not likely, we must establish a valuation allowance to reduce the deferred tax assets to the amount we estimate will be recoverable.
Our income tax provisions are based on assumptions and calculations which will be subject to examination by various tax authorities. We record tax benefits for positions in which we believe are more likely than not of being sustained under such examinations. We assess the potential outcome of such examinations to determine the adequacy of our income tax accruals.
Judgments and uncertainties — We consider accounting for income taxes critical because management is required to make significant judgments in determining our provision for income taxes, our deferred tax assets and liabilities, and our future taxable income for purposes of assessing our ability to realize any future benefit from our deferred tax assets. These judgments and estimates are affected by our expectations of future taxable income, mix of earnings among different taxing jurisdictions, and timing of the reversal of deferred tax assets and liabilities.
We also use our judgment to determine whether it is more likely than not that we will sustain positions that we have taken on tax returns and, if so, the amount of benefit to initially recognize within our financial statements. We review
our uncertain tax positions and adjust our unrecognized tax benefits in light of changes in facts and circumstances, such as changes in tax law, interactions with taxing authorities and developments in case law. These adjustments to our unrecognized tax benefits may affect our income tax expense. Settlement of uncertain tax positions may require use of our cash. At December 31, 2016, $36.0 million was recorded for uncertain tax benefits, including interest and penalties, of which it is reasonably possible that up to $7.1 million of our unrecognized tax benefit may change within the next twelve months.
Effect if actual results differ from assumptions — Although management believes that the judgments and estimates discussed herein are reasonable, actual results could differ, and we may be exposed to increases or decreases in income tax expense that could be material.
Pension and Other Postretirement Plans
We consider accounting for our U.S. and Canadian pension and other postretirement plans critical because management is required to make significant subjective judgments about a number of actuarial assumptions, which include discount rates, expected return on plan assets, interest cost and mortality and retirement rates. Actuarial valuations are used in determining our benefit obligation and net periodic benefit cost.
During 2016, we adopted the new MP-2016 mortality scale in determining the liability for the U.S. pension plan. This updated scale partially offset the decrease in the discount rate in 2016, the net of which resulted in the increase in the projected benefit obligation as of December 31, 2016.
During 2015 we adopted the new generational projection scale with MP-2015 in determining the liability for the U.S. pension plan. This updated scale, along with the change in the discount rate, contributed to the decrease in the projected benefit obligation as of December 31, 2015.
During 2014, we adopted the new RP-2014 mortality tables and generational projection scale with MP-2014 in determining the liability for the U.S. pension plan. This new table, along with the change in the discount rate, contributed to the increase in the projected benefit obligation as of December 31, 2014.
Judgments and uncertainties — We believe that the most significant assumptions related to our net periodic benefit cost are (1) the discount rate and (2) the expected return on plan assets, in each case as it relates to our U.S. pension plan. Our Canadian plan is not significant, and the impact of changes in assumptions for that plan is not material.
We determine our discount rates primarily based on high-quality, fixed-income investments and yield-to-maturity analysis specific to our estimated future benefit payments available as of the measurement date. Discount rates are updated annually on the measurement date to reflect
28 2016 Annual Report CONTENTS
current market conditions. We use a third-party yield curve to develop our discount rates. The yield curve provides discount rates related to a dedicated high-quality bond portfolio whose cash flows extend beyond the current period, from which we choose a rate matched to the expected benefit payments required for each plan.
The expected rate of return on plan assets is based on both our historical returns and forecasted future investment returns by asset class, as provided by our external investment advisor. In 2016, the U.S. pension plan investment gains of 6.8% were below the expected return of 7.25% for the third time in eight years. The expected return for the USRIP for 2017 is at 7.25%. The CRIP earned 7.6% in 2016 which was above its expected return of 6.0% for the sixth time in eight years. The expected return for the CRIP for 2017 is at 6.0%. The CRIP has a lower expected return due to a higher asset allocation to fixed income securities. Our weighted-average expected rate of return for both plans for 2017 is 7.14% which is consistent with the 2016 expected rate.
Annual differences, if any, between the expected and actual returns on plan assets are included in unrecognized net actuarial gain or loss, a component of other comprehensive income. In calculating the annual amortization of the unrecognized net actuarial gain or loss, we use a market-related value of assets that smooths actual investment gains and losses on plan assets over a period up to five years. The resulting unrecognized net actuarial gain or loss amount is recognized in net periodic pension expense over the average remaining life expectancy of the participant group since almost all participants are inactive. The market-related value of our assets was $541.2 million at December 31, 2016. We do not expect our 2017 net periodic benefit cost, which includes the effect of the market-related value of assets, to be materially different than our 2016 cost. See Note 10 of the Notes to the Consolidated Financial Statements for details on changes in the pension benefit obligation and the fair value of plan assets.
Effect if actual results differ from assumptions — We do not believe there is a reasonable likelihood that there will be a material change in the future estimates or assumptions that are used in our actuarial valuations. Adjusting our weighted-
average expected long-term rate of return (7.14% at December 31, 2016) by 50 basis points would change our estimated pension expense in 2016 by approximately $2.7 million. Adjusting our weighted-average discount rate (4.23% at December 31, 2016) by 50 basis points would change our estimated pension expense in 2016 by approximately $0.8 million. However, if actual results are not consistent with our estimates or assumptions, we may be exposed to changes in pension expense that could be material.
Purchase Accounting for Acquisitions
We account for acquisitions under Accounting Standards Codification 805, Business Combinations, which changed the application of the acquisition method of accounting in a business combination and also modified the way assets acquired and liabilities assumed are recognized on a prospective basis. In general, the acquisition method of accounting requires companies to record assets acquired and liabilities assumed at their respective fair market values at the date of acquisition. We primarily estimate fair value of identified intangible assets using discounted cash flow analyses based on market participant based inputs. Any amount of the purchase price paid that is in excess of the estimated fair values of net assets acquired is recorded in the line item Goodwill in our Consolidated Balance Sheets. Transaction costs, as well as costs to reorganize acquired companies, are expensed as incurred in our Consolidated Statements of Income.
Judgments and uncertainties — We consider accounting for business combinations critical because management’s judgment is used to determine the estimated fair values assigned to assets acquired and liabilities assumed and amortization periods for intangible assets, which can materially affect our results of operations.
Effect if actual results differ from assumptions — Although management believes that the judgments and estimates discussed herein are reasonable, actual results could differ, and we may be exposed to an impairment charge if we are unable to recover the value of the recorded net assets.
29Equifax Inc.CONTENTS
Quantitative and Qualitative Disclosures About Market Risk
In the normal course of our business, we are exposed to market risk, primarily from changes in foreign currency exchange rates and interest rates that could impact our results of operations and financial position. We manage our exposure to these market risks through our regular operating and financing activities, and, when deemed appropriate, through the use of derivative financial instruments, such as interest rate swaps, to hedge certain of these exposures. We use derivative financial instruments as risk management tools and not for speculative or trading purposes.
Foreign Currency Exchange Rate Risk
A substantial majority of our revenue, expense and capital expenditure activities are transacted in U.S. dollars. However, we do transact business in other currencies, primarily the British pound, the Australian dollar, the Canadian dollar, the Chilean peso, the Argentine peso and the Euro. For most of these foreign currencies, we are a net recipient, and, therefore, benefit from a weaker U.S. dollar and are adversely affected by a stronger U.S. dollar relative to the foreign currencies in which we transact significant amounts of business.
We are required to translate, or express in U.S. dollars, the assets and liabilities of our foreign subsidiaries that are denominated or measured in foreign currencies at the applicable year-end rate of exchange on our Consolidated Balance Sheets and income statement items of our foreign subsidiaries at the average rates prevailing during the year. We record the resulting translation adjustment, and gains and losses resulting from the translation of intercompany balances of a long-term investment nature within other comprehensive income, as a component of our shareholders’ equity. Foreign currency transaction gains and losses, which have historically been immaterial, are recorded on our Consolidated Statements of Income. We generally do not mitigate the risks associated with fluctuating exchange rates, although we may from time to time through forward contracts or other derivative instruments hedge a portion of our translational foreign currency exposure or exchange rate risks associated with material transactions which are denominated in a foreign currency.
For the year ended December 31, 2016, a 10% weaker U.S. dollar against the currencies of all foreign countries in which we had operations during 2016 would have increased our revenue by $50.2 million and our pre-tax operating profit by $16.5 million. For the year ended December 31, 2015, a 10% weaker U.S. dollar against the currencies of all foreign countries in which we had operations during 2015 would have increased our revenue by $52.9 million and our pre-tax operating profit by $17.9 million. A 10% stronger U.S. dollar would have resulted in similar decreases to our revenue and pre-tax operating profit for 2016 and 2015.
On average across our mix of international businesses, foreign currencies at December 31, 2016, were weaker against the U.S. dollar than the average foreign exchange rates that prevailed across the full year 2016. As a result, if foreign exchange rates were unchanged throughout 2017, foreign exchange translation would reduce growth as reported in U.S. dollars. As foreign exchange rates change daily, there can be no assurance that foreign exchange rates will remain constant throughout 2017, and rates could go either higher or lower.
The Veda cash consideration of approximately $1.7 billion (2.4 billion Australian dollars) was denominated in Australian dollars and as such was subject to fluctuations related to the exchange rate of the Australian dollar. In December 2015, in anticipation of the Veda acquisition, we purchased foreign currency options to buy Australian dollars with a weighted average strike price of $0.7225 and a notional value of 1.0 billion Australian dollars. These foreign currency options (“options”) were designed to act as economic hedges for the pending Veda acquisition and are marked to market. In January 2016, we purchased additional options with a weighted average strike price of $0.7091 and a notional value of 1.0 billion Australian dollars. We settled all of the options on the respective settlement dates in February 2016. We recognized a net loss of $15.4 million related to the options in the first quarter of 2016. See Note 1 for further discussion.
Interest Rate Risk
Our exposure to market risk for changes in interest rates relates to our variable-rate commercial paper borrowings. We attempt to achieve the lowest all-in weighted-average cost of debt while simultaneously taking into account the mix of our fixed- and floating-rate debt, and the average life and scheduled maturities of our debt. At December 31, 2016, our weighted average cost of debt was 3.5% and weighted-average life of debt was 5.72 years. At December 31, 2016, 72% of our debt was fixed rate, and the remaining 28% was variable rate. Occasionally we use derivatives to manage our exposure to changes in interest rates by entering into interest rate swaps. A 100 basis point increase in the weighted-average interest rate on our variable-rate debt would have increased our 2016 interest expense by $7.6 million.
Based on the amount of outstanding variable-rate debt, we have exposure to interest rate risk. In the future, if our mix of fixed-rate and variable-rate debt were to change due to additional borrowings under existing or new variable-rate debt, we could have additional exposure to interest rate risk. The nature and amount of our long-term and short-term debt, as well as the proportionate amount of fixed-rate and variable-rate debt, can be expected to vary as a result of future business requirements, market conditions and other factors.
30 2016 Annual Report CONTENTS
Report of Independent Registered Public Accounting Firm on Internal Control Over Financial Reporting
The Board of Directors and Shareholders of Equifax Inc.:
We have audited Equifax Inc.’s (“Equifax” or “the Company”) internal control over financial reporting as of December 31, 2016, based on criteria established in Internal Control—Integrated Framework issued by the Committee of Sponsoring Organizations of the Treadway Commission (“2013 framework”) (the COSO criteria). Equifax’s management is responsible for maintaining effective internal control over financial reporting, and for its assessment of the effectiveness of internal control over financial reporting included in the accompanying Management’s Annual Report on Internal Control Over Financial Reporting. Our responsibility is to express an opinion on the Company’s internal control over financial reporting based on our audit.
We conducted our audit in accordance with the standards of the Public Company Accounting Oversight Board (United States). Those standards require that we plan and perform the audit to obtain reasonable assurance about whether effective internal control over financial reporting was maintained in all material respects. Our audit included obtaining an understanding of internal control over financial reporting, assessing the risk that a material weakness exists, testing and evaluating the design and operating effectiveness of internal control based on the assessed risk, and performing such other procedures as we considered necessary in the circumstances. We believe that our audit provides a reasonable basis for our opinion.
A company’s internal control over financial reporting is a process designed to provide reasonable assurance regarding the reliability of financial reporting and the preparation of financial statements for external purposes in accordance with generally accepted accounting principles. A company’s internal control over financial reporting includes those policies and procedures that (1) pertain to the maintenance of records that, in reasonable detail, accurately and fairly reflect the transactions and dispositions of the assets of the company; (2) provide reasonable assurance that transactions are recorded as necessary to permit preparation of financial statements in accordance with generally accepted accounting principles, and that receipts and expenditures of the company are being made only in accordance with authorizations of management and directors of the company; and (3) provide reasonable assurance regarding prevention or timely detection of unauthorized acquisition, use or disposition of the company’s assets that could have a material effect on the financial statements.
Because of its inherent limitations, internal control over financial reporting may not prevent or detect misstatements. Also, projections of any evaluation of effectiveness to future periods are subject to the risk that controls may become inadequate because of changes in conditions, or that the degree of compliance with the policies or procedures may deteriorate.
As indicated in the accompanying Management’s Annual Report on Internal Control Over Financial Reporting, management’s assessment of and conclusion on the effectiveness of internal control over financial reporting did not include the internal controls of Veda Group Limited, which is included in the 2016 consolidated financial statements of Equifax Inc. and constituted $2,117.2 million and $1,915.2 million of the consolidated total assets and net assets, respectively, as of December 31, 2016 and $236.1 million and $55.6 million of operating revenue and net loss, respectively, for the year then ended. Our audit of internal control over financial reporting of Equifax Inc. also did not include an evaluation of the internal control over financial reporting of Veda Group Limited.
In our opinion, Equifax Inc. maintained, in all material respects, effective internal control over financial reporting as of December 31, 2016, based on the COSO criteria.
We also have audited, in accordance with the standards of the Public Company Accounting Oversight Board (United States), the consolidated balance sheets of Equifax, Inc. as of December 31, 2016 and 2015, and the related consolidated statements of income, comprehensive income, cash flows, and shareholders’ equity and other comprehensive income for each of the three years in the period ended December 31, 2016, of Equifax Inc. and our report dated February 22, 2017 expressed an unqualified opinion thereon.
Atlanta, GeorgiaFebruary 22, 2017
31Equifax Inc.CONTENTS
Report of Independent Registered Public Accounting Firm
The Board of Directors and Shareholders of Equifax Inc.:
We have audited the accompanying consolidated balance sheets of Equifax Inc. as of December 31, 2016 and 2015, and the related consolidated statements of income, comprehensive income, cash flows, and shareholders’ equity and other comprehensive income for each of the three years in the period ended December 31, 2016. Our audits also included the financial statement schedule – Valuation and Qualifying Accounts on page 73. These financial statements and schedule are the responsibility of the Company’s management. Our responsibility is to express an opinion on these financial statements and schedule based on our audits.
We conducted our audits in accordance with the standards of the Public Company Accounting Oversight Board (United States). Those standards require that we plan and perform the audit to obtain reasonable assurance about whether the financial statements are free of material misstatement. An audit includes examining, on a test basis, evidence supporting the amounts and disclosures in the financial statements. An audit also includes assessing the accounting principles used and significant estimates made by management, as well as evaluating the overall financial statement presentation. We believe that our audits provide a reasonable basis for our opinion.
In our opinion, the financial statements referred to above present fairly, in all material respects, the consolidated financial position of Equifax Inc. at December 31, 2016 and 2015, and the consolidated results of its operations and its cash flows for each of the three years in the period ended December 31, 2016, in conformity with U.S. generally accepted accounting principles. Also, in our opinion, the related financial statement schedule, when considered in relation to the basic financial statements taken as a whole, presents fairly in all material respects the information set forth therein.
We also have audited, in accordance with the standards of the Public Company Accounting Oversight Board (United States), Equifax Inc.’s internal control over financial reporting as of December 31, 2016, based on criteria established in Internal Control-Integrated Framework issued by the Committee of Sponsoring Organizations of the Treadway Commission (“2013 framework”) and our report dated February 22, 2017 expressed an unqualified opinion thereon.
Atlanta, GeorgiaFebruary 22, 2017
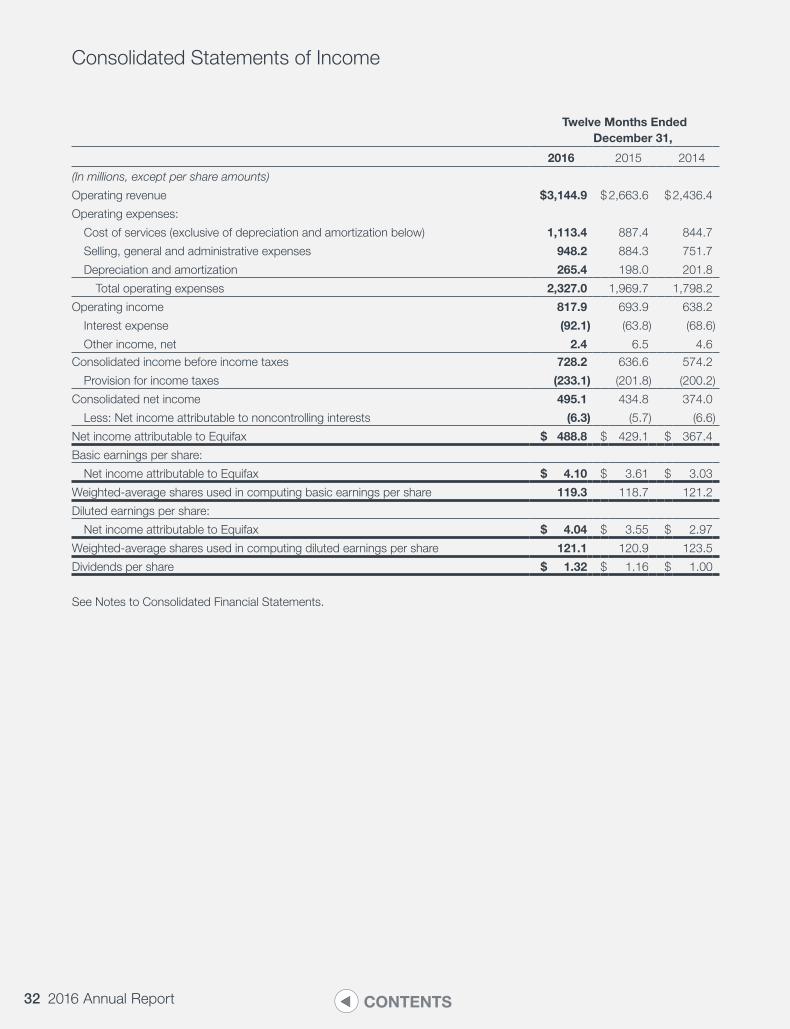
32 2016 Annual Report CONTENTS
Consolidated Statements of Income
Twelve Months Ended December 31,
2016 2015 2014
(In millions, except per share amounts)
Operating revenue $ 3,144.9 $2,663.6 $2,436.4
Operating expenses:
Cost of services (exclusive of depreciation and amortization below) 1,113.4 887.4 844.7
Selling, general and administrative expenses 948.2 884.3 751.7
Depreciation and amortization 265.4 198.0 201.8
Total operating expenses 2,327.0 1,969.7 1,798.2
Operating income 817.9 693.9 638.2
Interest expense (92.1) (63.8) (68.6)
Other income, net 2.4 6.5 4.6Consolidated income before income taxes 728.2 636.6 574.2
Provision for income taxes (233.1) (201.8) (200.2)
Consolidated net income 495.1 434.8 374.0
Less: Net income attributable to noncontrolling interests (6.3) (5.7) (6.6)
Net income attributable to Equifax $ 488.8 $ 429.1 $ 367.4
Basic earnings per share:
Net income attributable to Equifax $ 4.10 $ 3.61 $ 3.03
Weighted-average shares used in computing basic earnings per share 119.3 118.7 121.2
Diluted earnings per share:
Net income attributable to Equifax $ 4.04 $ 3.55 $ 2.97
Weighted-average shares used in computing diluted earnings per share 121.1 120.9 123.5
Dividends per share $ 1.32 $ 1.16 $ 1.00
See Notes to Consolidated Financial Statements.
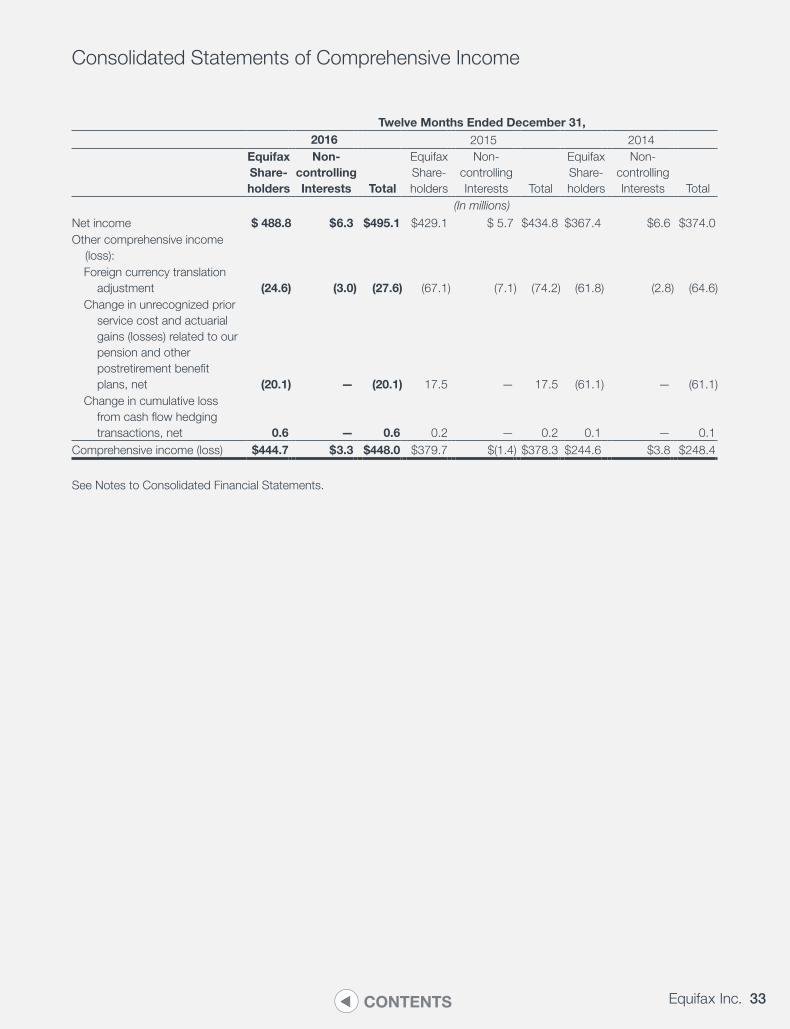
33Equifax Inc.CONTENTS
Consolidated Statements of Comprehensive Income
Twelve Months Ended December 31,2016 2015 2014
Equifax Share-holders
Non-controlling Interests Total
Equifax Share- holders
Non-controlling Interests Total
Equifax Share- holders
Non-controlling Interests Total
(In millions)
Net income $ 488.8 $ 6.3 $495.1 $429.1 $ 5.7 $434.8 $367.4 $6.6 $374.0Other comprehensive income
(loss): Foreign currency translation
adjustment (24.6) (3.0) (27.6) (67.1) (7.1) (74.2) (61.8) (2.8) (64.6) Change in unrecognized prior
service cost and actuarial gains (losses) related to our pension and other postretirement benefit plans, net (20.1) — (20.1) 17.5 — 17.5 (61.1) — (61.1)
Change in cumulative loss from cash flow hedging transactions, net 0.6 — 0.6 0.2 — 0.2 0.1 — 0.1
Comprehensive income (loss) $444.7 $ 3.3 $448.0 $379.7 $(1.4) $378.3 $244.6 $3.8 $248.4
See Notes to Consolidated Financial Statements.
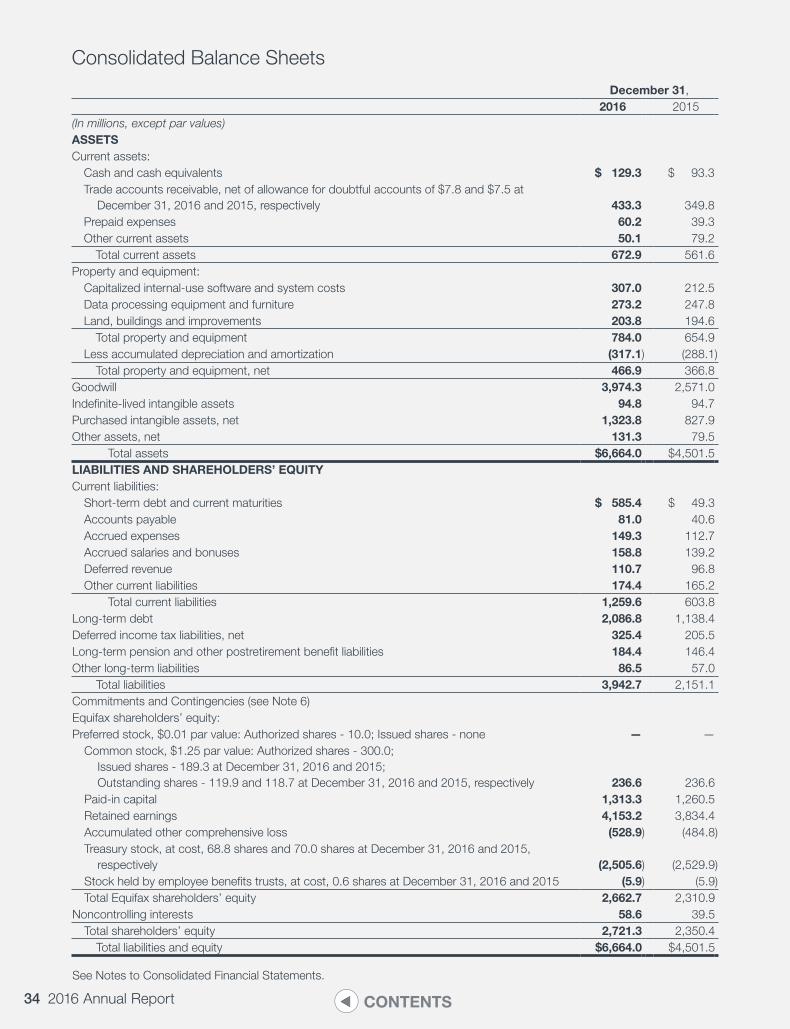
34 2016 Annual Report CONTENTS
Consolidated Balance Sheets
December 31,2016 2015
(In millions, except par values)ASSETSCurrent assets: Cash and cash equivalents $ 129.3 $ 93.3 Trade accounts receivable, net of allowance for doubtful accounts of $7.8 and $7.5 at
December 31, 2016 and 2015, respectively 433.3 349.8 Prepaid expenses 60.2 39.3 Other current assets 50.1 79.2 Total current assets 672.9 561.6Property and equipment: Capitalized internal-use software and system costs 307.0 212.5 Data processing equipment and furniture 273.2 247.8 Land, buildings and improvements 203.8 194.6 Total property and equipment 784.0 654.9 Less accumulated depreciation and amortization (317.1) (288.1) Total property and equipment, net 466.9 366.8Goodwill 3,974.3 2,571.0Indefinite-lived intangible assets 94.8 94.7Purchased intangible assets, net 1,323.8 827.9Other assets, net 131.3 79.5 Total assets $6,664.0 $4,501.5LIABILITIES AND SHAREHOLDERS’ EQUITYCurrent liabilities: Short-term debt and current maturities $ 585.4 $ 49.3 Accounts payable 81.0 40.6 Accrued expenses 149.3 112.7 Accrued salaries and bonuses 158.8 139.2 Deferred revenue 110.7 96.8 Other current liabilities 174.4 165.2 Total current liabilities 1,259.6 603.8Long-term debt 2,086.8 1,138.4Deferred income tax liabilities, net 325.4 205.5Long-term pension and other postretirement benefit liabilities 184.4 146.4Other long-term liabilities 86.5 57.0 Total liabilities 3,942.7 2,151.1Commitments and Contingencies (see Note 6)Equifax shareholders’ equity:Preferred stock, $0.01 par value: Authorized shares - 10.0; Issued shares - none — — Common stock, $1.25 par value: Authorized shares - 300.0;
Issued shares - 189.3 at December 31, 2016 and 2015; Outstanding shares - 119.9 and 118.7 at December 31, 2016 and 2015, respectively 236.6 236.6
Paid-in capital 1,313.3 1,260.5 Retained earnings 4,153.2 3,834.4 Accumulated other comprehensive loss (528.9) (484.8) Treasury stock, at cost, 68.8 shares and 70.0 shares at December 31, 2016 and 2015,
respectively (2,505.6) (2,529.9) Stock held by employee benefits trusts, at cost, 0.6 shares at December 31, 2016 and 2015 (5.9) (5.9) Total Equifax shareholders’ equity 2,662.7 2,310.9Noncontrolling interests 58.6 39.5 Total shareholders’ equity 2,721.3 2,350.4 Total liabilities and equity $6,664.0 $4,501.5
See Notes to Consolidated Financial Statements.
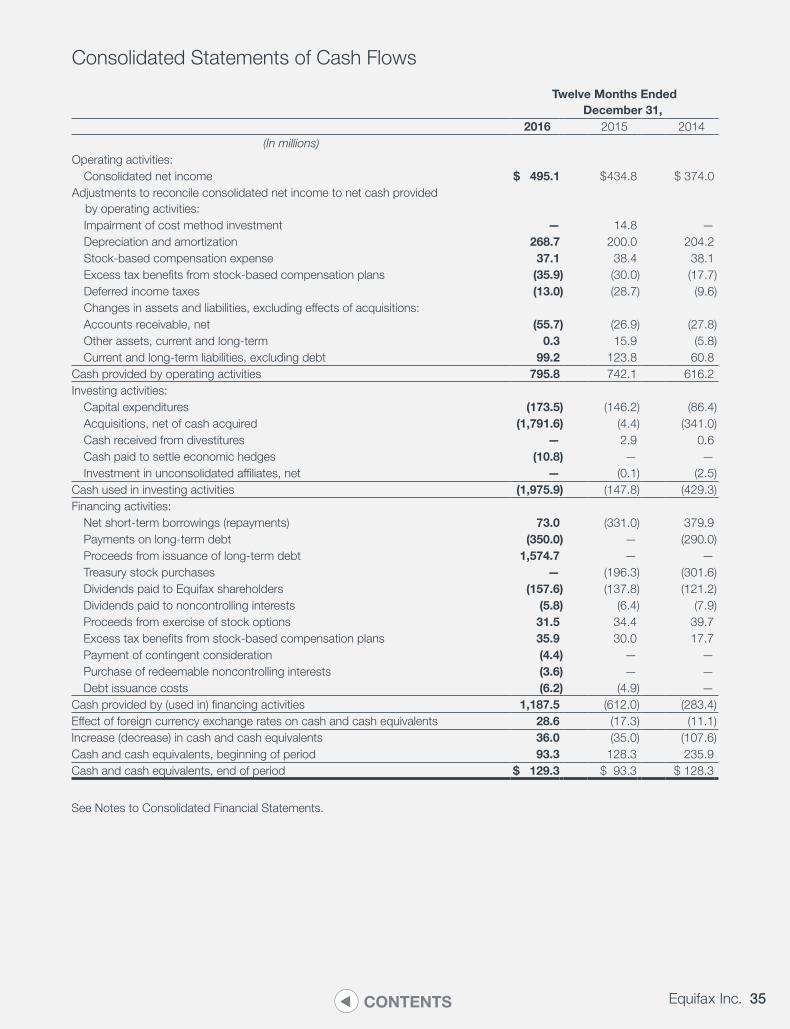
35Equifax Inc.CONTENTS
Consolidated Statements of Cash Flows
Twelve Months Ended December 31,
2016 2015 2014(In millions)
Operating activities: Consolidated net income $ 495.1 $ 434.8 $ 374.0Adjustments to reconcile consolidated net income to net cash provided
by operating activities: Impairment of cost method investment — 14.8 — Depreciation and amortization 268.7 200.0 204.2 Stock-based compensation expense 37.1 38.4 38.1 Excess tax benefits from stock-based compensation plans (35.9) (30.0) (17.7) Deferred income taxes (13.0) (28.7) (9.6) Changes in assets and liabilities, excluding effects of acquisitions: Accounts receivable, net (55.7) (26.9) (27.8) Other assets, current and long-term 0.3 15.9 (5.8) Current and long-term liabilities, excluding debt 99.2 123.8 60.8Cash provided by operating activities 795.8 742.1 616.2Investing activities: Capital expenditures (173.5) (146.2) (86.4) Acquisitions, net of cash acquired (1,791.6) (4.4) (341.0) Cash received from divestitures — 2.9 0.6 Cash paid to settle economic hedges (10.8) — — Investment in unconsolidated affiliates, net — (0.1) (2.5)Cash used in investing activities (1,975.9) (147.8) (429.3)Financing activities: Net short-term borrowings (repayments) 73.0 (331.0) 379.9 Payments on long-term debt (350.0) — (290.0) Proceeds from issuance of long-term debt 1,574.7 — — Treasury stock purchases — (196.3) (301.6) Dividends paid to Equifax shareholders (157.6) (137.8) (121.2) Dividends paid to noncontrolling interests (5.8) (6.4) (7.9) Proceeds from exercise of stock options 31.5 34.4 39.7 Excess tax benefits from stock-based compensation plans 35.9 30.0 17.7 Payment of contingent consideration (4.4) — — Purchase of redeemable noncontrolling interests (3.6) — — Debt issuance costs (6.2) (4.9) —Cash provided by (used in) financing activities 1,187.5 (612.0) (283.4)Effect of foreign currency exchange rates on cash and cash equivalents 28.6 (17.3) (11.1)Increase (decrease) in cash and cash equivalents 36.0 (35.0) (107.6)Cash and cash equivalents, beginning of period 93.3 128.3 235.9Cash and cash equivalents, end of period $ 129.3 $ 93.3 $ 128.3
See Notes to Consolidated Financial Statements.
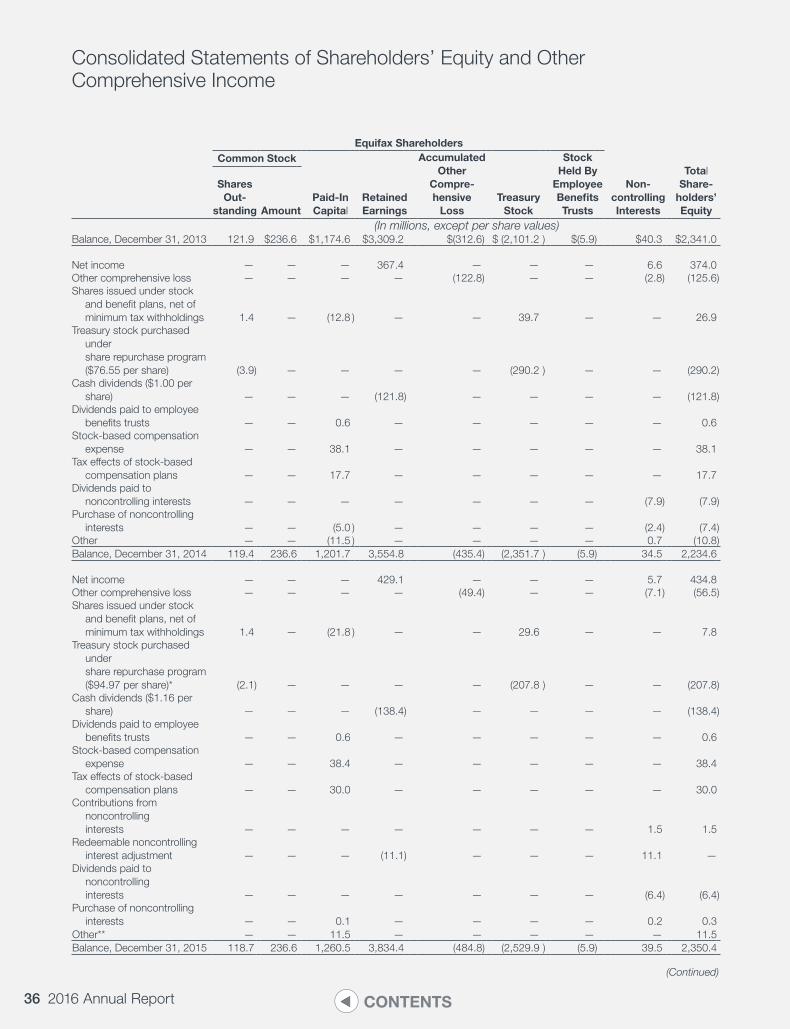
36 2016 Annual Report CONTENTS
Consolidated Statements of Shareholders’ Equity and Other Comprehensive Income
Equifax ShareholdersCommon Stock
Paid-In Capital
Retained Earnings
Accumulated Other
Compre- hensive
LossTreasury
Stock
Stock Held By
Employee Benefits Trusts
Non - controlling Interests
Total Share-
holders’ Equity
Shares Out-
standing Amount(In millions, except per share values)
Balance, December 31, 2013 121.9 $236.6 $1,174.6 $3,309.2 $(312.6) $ (2,101.2 ) $(5.9) $40.3 $2,341.0
Net income — — — 367.4 — — — 6.6 374.0Other comprehensive loss — — — — (122.8) — — (2.8) (125.6)Shares issued under stock
and benefit plans, net of minimum tax withholdings 1.4 — (12.8 ) — — 39.7 — — 26.9
Treasury stock purchased under share repurchase program ($76.55 per share) (3.9) — — — — (290.2 ) — — (290.2)
Cash dividends ($1.00 per share) — — — (121.8) — — — — (121.8)
Dividends paid to employee benefits trusts — — 0.6 — — — — — 0.6
Stock-based compensation expense — — 38.1 — — — — — 38.1
Tax effects of stock-based compensation plans — — 17.7 — — — — — 17.7
Dividends paid to noncontrolling interests — — — — — — — (7.9) (7.9)
Purchase of noncontrolling interests — — (5.0 ) — — — — (2.4) (7.4)
Other — — (11.5 ) — — — — 0.7 (10.8)Balance, December 31, 2014 119.4 236.6 1,201.7 3,554.8 (435.4) (2,351.7 ) (5.9) 34.5 2,234.6
Net income — — — 429.1 — — — 5.7 434.8Other comprehensive loss — — — — (49.4) — — (7.1) (56.5)Shares issued under stock
and benefit plans, net of minimum tax withholdings 1.4 — (21.8 ) — — 29.6 — — 7.8
Treasury stock purchased under share repurchase program ($94.97 per share)* (2.1) — — — — (207.8 ) — — (207.8)
Cash dividends ($1.16 per share) — — — (138.4) — — — — (138.4)
Dividends paid to employee benefits trusts — — 0.6 — — — — — 0.6
Stock-based compensation expense — — 38.4 — — — — — 38.4
Tax effects of stock-based compensation plans — — 30.0 — — — — — 30.0
Contributions from noncontrolling interests — — — — — — — 1.5 1.5
Redeemable noncontrolling interest adjustment — — — (11.1) — — — 11.1 —
Dividends paid to noncontrolling interests — — — — — — — (6.4) (6.4)
Purchase of noncontrolling interests — — 0.1 — — — — 0.2 0.3
Other** — — 11.5 — — — — — 11.5Balance, December 31, 2015 118.7 236.6 1,260.5 3,834.4 (484.8) (2,529.9 ) (5.9) 39.5 2,350.4
(Continued)
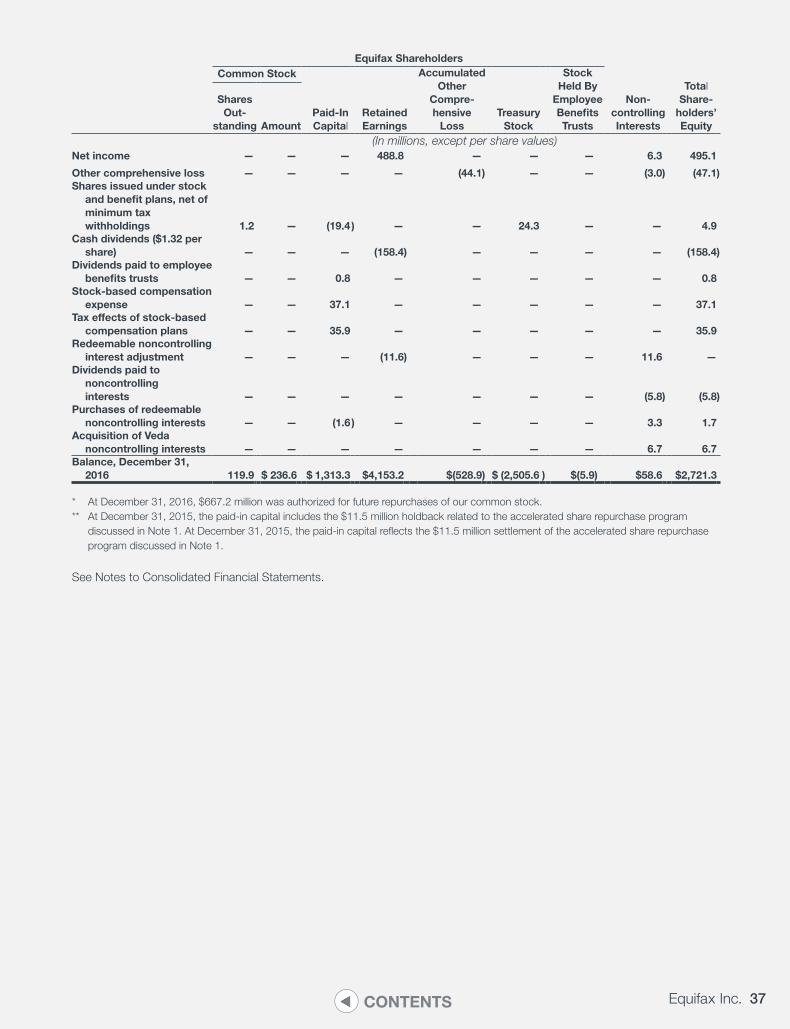
37Equifax Inc.CONTENTS
Equifax ShareholdersCommon Stock
Paid-In Capital
Retained Earnings
Accumulated Other
Compre- hensive
LossTreasury
Stock
Stock Held By
Employee Benefits Trusts
Non - controlling Interests
Total Share-
holders’ Equity
Shares Out-
standing Amount(In millions, except per share values)
Net income — — — 488.8 — — — 6.3 495.1
Other comprehensive loss — — — — (44.1) — — (3.0) (47.1)Shares issued under stock
and benefit plans, net of minimum tax withholdings 1.2 — (19.4) — — 24.3 — — 4.9
Cash dividends ($1.32 per share) — — — (158.4) — — — — (158.4)
Dividends paid to employee benefits trusts — — 0.8 — — — — — 0.8
Stock-based compensation expense — — 37.1 — — — — — 37.1
Tax effects of stock-based compensation plans — — 35.9 — — — — — 35.9
Redeemable noncontrolling interest adjustment — — — (11.6) — — — 11.6 —
Dividends paid to noncontrolling interests — — — — — — — (5.8) (5.8)
Purchases of redeemable noncontrolling interests — — (1.6) — — — — 3.3 1.7
Acquisition of Veda noncontrolling interests — — — — — — — 6.7 6.7
Balance, December 31, 2016 119.9 $ 236.6 $ 1,313.3 $4,153.2 $(528.9) $ (2,505.6 ) $(5.9) $58.6 $2,721.3
* At December 31, 2016, $667.2 million was authorized for future repurchases of our common stock.** At December 31, 2015, the paid-in capital includes the $11.5 million holdback related to the accelerated share repurchase program
discussed in Note 1. At December 31, 2015, the paid-in capital reflects the $11.5 million settlement of the accelerated share repurchase program discussed in Note 1.
See Notes to Consolidated Financial Statements.
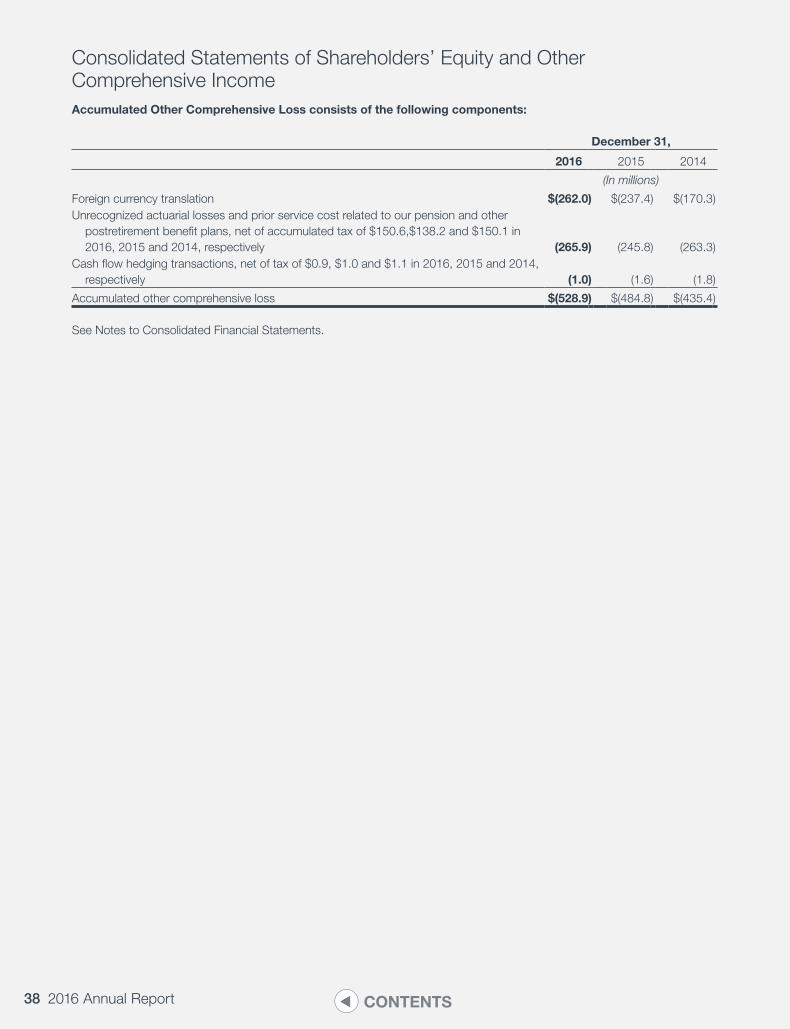
38 2016 Annual Report CONTENTS
Consolidated Statements of Shareholders’ Equity and Other Comprehensive IncomeAccumulated Other Comprehensive Loss consists of the following components:
December 31,
2016 2015 2014
(In millions)
Foreign currency translation $(262.0) $(237.4) $(170.3)Unrecognized actuarial losses and prior service cost related to our pension and other
postretirement benefit plans, net of accumulated tax of $150.6,$138.2 and $150.1 in 2016, 2015 and 2014, respectively (265.9) (245.8) (263.3)
Cash flow hedging transactions, net of tax of $0.9, $1.0 and $1.1 in 2016, 2015 and 2014, respectively (1.0) (1.6) (1.8)
Accumulated other comprehensive loss $(528.9) $(484.8) $(435.4)
See Notes to Consolidated Financial Statements.
39Equifax Inc.CONTENTS
Notes to Consolidated Financial Statements
1. Summary of Significant Accounting Policies
As used herein, the terms Equifax, the Company, we, our and us refer to Equifax Inc., a Georgia corporation, and its consolidated subsidiaries as a combined entity, except where it is clear that the terms mean only Equifax Inc.
Nature of Operations. We collect, organize and manage various types of financial, demographic, employment and marketing information. Our products and services enable businesses to make credit and service decisions, manage their portfolio risk, automate or outsource certain payroll-related, tax and human resources business processes, and develop marketing strategies concerning consumers and commercial enterprises. We serve customers across a wide range of industries, including the financial services, mortgage, retail, telecommunications, utilities, automotive, brokerage, healthcare and insurance industries, as well as government agencies. We also enable consumers to manage and protect their financial health through a portfolio of products offered directly to consumers. As of December 31, 2016, we operated in the following countries: Argentina, Australia, Canada, Chile, Costa Rica, Ecuador, El Salvador, Honduras, India, Ireland, Mexico, New Zealand, Paraguay, Peru, Portugal, Spain, the United Kingdom, or U.K., Uruguay, and the United States of America, or U.S. We also offer Equifax branded credit services in India and Russia through joint ventures, we have investments in consumer and/or commercial credit information companies through joint ventures in Cambodia, Malaysia and Singapore, and have an investment in a consumer and commercial credit information company in Brazil.
We develop, maintain and enhance secured proprietary information databases through the compilation of consumer specific data, including credit, income, employment, asset, liquidity, net worth and spending activity, and business data, including credit and business demographics, that we obtain from a variety of sources, such as credit granting institutions, income and tax information primarily from large to mid-sized companies in the U.S., and survey-based marketing information. We process this information utilizing our proprietary information management systems. We also provide information, technology and services to support debt collections and recovery management.
Basis of Consolidation. Our Consolidated Financial Statements and the accompanying notes, which are prepared in accordance with U.S. generally accepted accounting principles, or GAAP, include Equifax and all its subsidiaries. We consolidate all majority-owned and controlled subsidiaries as well as variable interest entities in which we are the primary beneficiary. Other parties’ interests in consolidated entities are reported as noncontrolling interests. We use the equity method of accounting for
investments in which we are able to exercise significant influence and use the cost method for all other investments. All significant intercompany transactions and balances are eliminated.
Our Consolidated Financial Statements reflect all adjustments which are, in the opinion of management, necessary for a fair presentation of the periods presented therein.
Segments. We manage our business and report our financial results through the following four reportable segments, which are our operating segments:
• U.S. Information Solutions, or USIS
• International
• Workforce Solutions
• Global Consumer Solutions
USIS is our largest reportable segment, with 39% of total operating revenue for 2016. Our most significant foreign operations are located in Australia, the U.K. and Canada.
Use of Estimates. The preparation of our Consolidated Financial Statements requires us to make estimates and assumptions in accordance with GAAP. Accordingly, we make these estimates and assumptions after exercising judgment. We believe that the estimates and assumptions inherent in our Consolidated Financial Statements are reasonable, based upon information available to us at the time they are made including the consideration of events that have occurred up until the point these Consolidated Financial Statements have been filed. These estimates and assumptions affect the reported amounts of assets, liabilities, revenues and expenses and disclosure of contingent assets and liabilities at the date of the financial statements, as well as reported amounts of revenues and expenses during the reporting period. Actual results could differ materially from these estimates.
Revenue Recognition and Deferred Revenue. Revenue is recognized when persuasive evidence of an arrangement exists, collectibility of arrangement consideration is reasonably assured, the arrangement fees are fixed or determinable and delivery of the product or service has been completed. A significant portion of our revenue is derived from the provision of information services to our customers on a transaction basis, in which case revenue is recognized, assuming all other revenue recognition criteria are met, when the services are provided. A smaller portion of our revenues relates to subscription-based contracts under which a customer pays a preset fee for a predetermined or unlimited number of transactions or services provided during
40 2016 Annual Report CONTENTS
the subscription period, generally one year. Revenue related to subscription-based contracts having a preset number of transactions is recognized as the services are provided, using an effective transaction rate as the actual transactions are completed. Any remaining revenue related to unfulfilled units is not recognized until the end of the related contract’s subscription period. Revenue related to subscription-based contracts having an unlimited volume is recognized ratably during the contract term. Revenue is recorded net of sales taxes.
If at the outset of an arrangement, we determine that collectibility is not reasonably assured, revenue is deferred until the earlier of when collectibility becomes probable or the receipt of payment. If there is uncertainty as to the customer’s acceptance of our deliverables, revenue is not recognized until the earlier of receipt of customer acceptance or expiration of the acceptance period. If at the outset of an arrangement, we determine that the arrangement fee is not fixed or determinable, revenue is deferred until the arrangement fee becomes fixed or determinable, assuming all other revenue recognition criteria have been met.
The determination of certain of our tax management services revenue requires the use of estimates, principally related to transaction volumes in instances where these volumes are reported to us by our clients on a monthly basis in arrears. In these instances, we estimate transaction volumes based on average actual volumes reported in the past. Differences between our estimates and actual final volumes reported are recorded in the period in which actual volumes are reported. We have not experienced significant variances between our estimates and actual reported volumes in the past. We monitor actual volumes to ensure that we will continue to make reasonable estimates in the future. If we determine that we are unable to make reasonable future estimates, revenue may be deferred until actual customer data is obtained. Also within our Workforce Solutions operating segment, the fees for certain of our tax credits and incentives revenue are based on a portion of the credit delivered to our clients. Revenue for these arrangements is recognized based on the achievement of milestones, upon calculation of the credit, or when the credit is utilized by our client, depending on the provisions of the client contract.
We have certain offerings that are sold as multiple element arrangements. The multiple elements may include consumer or commercial information, file updates for certain solutions, services provided by our decisioning technologies personnel, training services, statistical models and other services. To account for each of these elements separately, the delivered elements must have stand-alone value to our customer. For certain customer contracts, the total arrangement fee is allocated to the undelivered elements. If we are unable to unbundle the arrangement into separate units of accounting, we apply one of the accounting policies described above. This may lead to the arrangement
consideration being recognized as the final contract element is delivered to our customer or ratably over the contract.
Many of our multiple element arrangements involve the delivery of services generated by a combination of services provided by one or more of our operating segments. No individual information service impacts the value or usage of other information services included in an arrangement and each service can be sold alone or, in most cases, purchased from another vendor without affecting the quality of use or value to the customer of the other information services included in the arrangement. Some of our products require the development of interfaces or platforms by our decisioning technologies personnel that allow our customers to interact with our proprietary information databases. These development services do not meet the requirement for having stand-alone value, thus any related development fees are deferred when billed and are recognized over the expected period that the customer will benefit from the related decisioning technologies service. Revenue from the provision of statistical models is recognized as the service is provided and accepted, assuming all other revenue recognition criteria are met. The direct costs of set up of a customer are capitalized and amortized as a cost of service during the term of the related customer contract.
We have some multiple element arrangements that include software. We recognize the elements for which we have established vendor specific objective evidence at fair value upon delivery, in accordance with the applicable guidance.
We record revenue on a net basis for those sales in which we have in substance acted as an agent or broker in the transaction.
The debt collections and recovery management revenue is calculated as a percentage of debt collected on behalf of the customer and, as such, is primarily recognized when the cash is collected assuming all other revenue recognition criteria are met.
Deferred revenue consists of amounts billed in excess of revenue recognized on sales of our information services relating generally to the deferral of subscription fees and arrangement consideration from elements not meeting the criteria for having stand-alone value discussed above. Deferred revenues are subsequently recognized as revenue in accordance with our revenue recognition policies.
Cost of Services. Cost of services consist primarily of (1) data acquisition and royalty fees; (2) customer service costs, which include: personnel costs to collect, maintain and update our proprietary databases, to develop and maintain software application platforms and to provide consumer and customer call center support; (3) hardware and software expense associated with transaction processing systems; (4) telecommunication and computer network expense; and (5) occupancy costs associated with facilities where these functions are performed by Equifax employees.
41Equifax Inc.CONTENTS
Selling, General and Administrative Expenses. Selling, general and administrative expenses consist primarily of personnel-related costs, restructuring costs, corporate costs, fees for professional and consulting services, advertising costs, and other costs of administration.
Advertising. Advertising costs, which are expensed as incurred, totaled $63.6 million, $65.1 million and $57.1 million during 2016, 2015 and 2014, respectively.
Stock-Based Compensation. We recognize the cost of stock-based payment transactions in the financial statements over the period services are rendered according to the fair value of the stock-based awards issued. All of our stock-based awards, which are stock options and nonvested stock, are classified as equity instruments.
Income Taxes. We account for income taxes under the liability method. We record deferred income taxes using enacted tax laws and rates for the years in which the taxes are expected to be paid. Deferred income tax assets and liabilities are recorded based on the differences between the financial reporting and income tax bases of assets and liabilities. We assess whether it is more likely than not that we will generate sufficient taxable income to realize our deferred tax assets. We record a valuation allowance, as necessary, to reduce our deferred tax assets to the amount
of future tax benefit that we estimate is more likely than not to be realized.
We record tax benefits for positions that we believe are more likely than not of being sustained under audit examinations. We assess the potential outcome of such examinations to determine the adequacy of our income tax accruals. We recognize interest and penalties accrued related to unrecognized tax benefits in the provision for income taxes on our Consolidated Statements of Income. We adjust our income tax provision during the period in which we determine that the actual results of the examinations may differ from our estimates or when statutory terms expire. Changes in tax laws and rates are reflected in our income tax provision in the period in which they occur.
Earnings Per Share. Our basic earnings per share, or EPS, is calculated as net income divided by the weighted-average number of common shares outstanding during the reporting period. Diluted EPS is calculated to reflect the potential dilution that would occur if stock options or other contracts to issue common stock were exercised and resulted in additional common shares outstanding. The net income amounts used in both our basic and diluted EPS calculations are the same. A reconciliation of the weighted-average outstanding shares used in the two calculations is as follows:
Twelve Months Ended December 31,
2016 2015 2014
(In millions)
Weighted-average shares outstanding (basic) 119.3 118.7 121.2
Effect of dilutive securities:
Stock options and restricted stock units 1.8 2.2 2.3
Weighted-average shares outstanding (diluted) 121.1 120.9 123.5
For the twelve months ended December 31, 2016, 2015 and 2014, 0.1 million stock options, respectively, were anti-dilutive and therefore excluded from this calculation.
Accelerated Share Repurchase Program. On October 24, 2014, we entered into an accelerated share repurchase (“ASR”) program to repurchase shares of our common stock under our approved share repurchase program. Under the ASR program, the number of shares to be repurchased is based generally on the daily volume weighted average price of our common stock during the term of the ASR program. On October 24, 2014, we paid $115 million in exchange for an initial delivery of 1.4 million shares to us, subject to a 10%, or $11.5 million, holdback. The maximum number of shares to be received or delivered under the contracts was 3.2 million.
The ASR program was accounted for as an initial treasury stock transaction and a forward stock purchase contract. The initial repurchase of shares resulted in an immediate
reduction of the outstanding shares used to calculate the weighted-average common shares outstanding for basic and diluted net income per share on the effective date of the agreement. The forward stock purchase contracts are classified as equity instruments under ASC 815-40 for “Contracts in Entity’s Own Equity,” and were deemed to have a fair value of zero at the effective date. On February 4, 2015, we settled the ASR and received approximately 0.02 million shares.
Cash Equivalents. We consider all highly-liquid investments with an original maturity of three months or less to be cash equivalents.
Trade Accounts Receivable and Allowance for Doubtful Accounts. We do not recognize interest income on our trade accounts receivable. Additionally, we generally do not require collateral from our customers related to our trade accounts receivable. Accounts receivable are stated at cost.
42 2016 Annual Report CONTENTS
The allowance for doubtful accounts for estimated losses on trade accounts receivable is based on historical write-off experience, an analysis of the aging of outstanding receivables, customer payment patterns and the establishment of specific reserves for customers in an adverse financial condition. We reassess the adequacy of the allowance for doubtful accounts each reporting period. Increases to the allowance for doubtful accounts are recorded as bad debt expense, which are included in selling, general and administrative expenses on the accompanying Consolidated Statements of Income. Bad debt expense was $2.2 million, $4.3 million and $2.5 million during the twelve months ended December 31, 2016, 2015, and 2014, respectively.
Other Current Assets. Other current assets on our Consolidated Balance Sheets includes amounts in specifically designated accounts that hold the funds that are due to customers from our debt collection and recovery management services. As of December 31, 2016 and 2015, respectively, these assets were approximately $28.0 million and $30.2 million with fully offsetting balances in other current liabilities. These amounts are restricted as to their current use, and will be released according to the specific customer agreements. Other current assets also include foreign currency options, receivables related to life insurance policies covering certain officers of the Company, deferred charges, as well as certain current tax accounts.
Long-Lived Assets. Property and equipment are stated at cost less accumulated depreciation and amortization. The cost of additions is capitalized. Property and equipment are depreciated on a straight-line basis over the assets’ estimated useful lives, which are generally three to ten years for data processing equipment and capitalized internal-use software and systems costs. Leasehold improvements are depreciated over the shorter of their estimated useful lives or lease terms that are reasonably assured. Buildings are depreciated over a forty-year period. Other fixed assets are depreciated over three to seven years. Upon sale or retirement of an asset, the related costs and accumulated depreciation are removed from the accounts and any gain or loss is recognized and included in income from operations on the Consolidated Statements of Income, with the classification of any gain or loss dependent on the characteristics of the asset sold or retired.
Certain internal-use software and system development costs are capitalized. Accordingly, the specifically identified costs incurred to develop or obtain software, which is intended for internal use, are not capitalized until the determination is made as to the availability of a technically feasible solution to solve the predefined user and operating performance requirements as established during the preliminary stage of an internal-use software development project. Costs incurred during a software development project’s preliminary stage and post-implementation stage are expensed as incurred. Application development activities that are eligible for capitalization include software design and configuration,
development of interfaces, coding, testing, and installation. Capitalized internal-use software and systems costs are subsequently amortized on a straight-line basis over a three- to ten-year period after project completion and when the related software or system is ready for its intended use.
Depreciation and amortization expense related to property and equipment was $88.9 million, $75.7 million and $71.7 million during the twelve months ended December 31, 2016, 2015, and 2014, respectively.
Industrial Revenue Bonds. Pursuant to the terms of certain industrial revenue bonds, we have transferred title to certain of our fixed assets with total costs of $117.0 million and $108.5 million as of December 31, 2016 and 2015, respectively, to a local governmental authority in the U.S. to receive a property tax abatement related to economic development. The title to these assets will revert back to us upon retirement or cancellation of the applicable bonds. These fixed assets are still recognized in the Company’s Consolidated Balance Sheets as all risks and rewards remain with the Company.
Impairment of Long-Lived Assets. We monitor the status of our long-lived assets in order to determine if conditions exist or events and circumstances indicate that an asset group may be impaired in that its carrying amount may not be recoverable. Significant factors that are considered that could be indicative of an impairment include: changes in business strategy, market conditions or the manner in which an asset group is used; underperformance relative to historical or expected future operating results; and negative industry or economic trends. If potential indicators of impairment exist, we estimate recoverability based on the asset group’s ability to generate cash flows greater than the carrying value of the asset group. We estimate the undiscounted future cash flows arising from the use and eventual disposition of the related long-lived asset group. If the carrying value of the long-lived asset group exceeds the estimated future undiscounted cash flows, an impairment loss is recorded based on the amount by which the asset group’s carrying amount exceeds its fair value. We utilize estimates of discounted future cash flows to determine the asset group’s fair value. We did not record any impairment losses of long-lived assets in any of the periods presented.
Goodwill and Indefinite-Lived Intangible Assets. Goodwill represents the cost in excess of the fair value of the net assets of acquired businesses. Goodwill is not amortized. We are required to test goodwill for impairment at the reporting unit level on an annual basis and on an interim basis if an event occurs or circumstances change that would more likely than not reduce the fair value of a reporting unit below its carrying value. We perform our annual goodwill impairment test as of September 30 each year.
Under ASC 350, we have an option to perform a “qualitative” assessment of our reporting units to determine
43Equifax Inc.CONTENTS
whether further impairment testing is necessary. If an entity believes, as a result of its qualitative assessment, that it is more-likely-than-not that the fair value of a reporting unit is less than its carrying amount, the quantitative impairment test is required. Otherwise, no further testing is required. For reporting units that we determine meet these criteria, we perform a qualitative assessment. In this qualitative assessment, we consider the following items for each of the reporting units: macroeconomic conditions, industry and market conditions, overall financial performance and other entity specific events. In addition, for each of these reporting units, the most recent fair value determination results in an amount that significantly exceeds the carrying amount of the reporting units. Based on these assessments, we determine whether the likelihood that a current fair value determination would be less than the current carrying amount of the reporting unit is not more likely than not. If it is determined it is not more likely than not, no further testing is required. If further testing is required, we continue with the quantitative impairment test.
In analyzing goodwill for potential impairment in the quantitative impairment test, we use a combination of the income and market approaches to estimate the reporting unit’s fair value. Under the income approach, we calculate the fair value of a reporting unit based on estimated future discounted cash flows. The assumptions we use are based on what we believe a hypothetical marketplace participant would use in estimating fair value. Under the market approach, we estimate the fair value based on market multiples of revenue or earnings before interest, income taxes, depreciation and amortization for benchmark companies. If the fair value of a reporting unit exceeds its carrying value, then no further testing is required. However, if a reporting unit’s fair value were to be less than its carrying value, we would then determine the amount of the impairment charge, if any, which would be the amount that the carrying value of the reporting unit’s goodwill exceeded its implied value.
Indefinite-lived reacquired rights represent the value of rights which we had granted to various affiliate credit reporting agencies that were reacquired in the U.S. and Canada. A portion of our reacquired rights are perpetual in nature and, therefore, the useful lives are considered indefinite in accordance with the accounting guidance in place at the time of the acquisitions. Indefinite-lived intangible assets are not amortized. We are required to test indefinite-lived intangible assets for impairment annually and whenever events and circumstances indicate that there may be an impairment of the asset value. Our annual impairment test date is September 30. We perform the impairment test for our indefinite-lived intangible assets by first assessing qualitative factors to determine whether it is necessary to perform a quantitative impairment test. If the qualitative assessment indicates that we need to perform a quantitative impairment test, we compare the asset’s fair value to its carrying value. We estimate the fair value based on
projected discounted future cash flows. An impairment charge is recognized if the asset’s estimated fair value is less than its carrying value.
We completed our annual impairment testing for goodwill and indefinite-lived intangible assets during the twelve months ended December 31, 2016, 2015 and 2014, and we determined that there was no impairment in any of these years.
Purchased Intangible Assets. Purchased intangible assets represent the estimated fair value of acquired intangible assets used in our business. Purchased data files represent the estimated fair value of consumer credit files acquired primarily through the purchase of independent credit reporting agencies in the U.S. and Canada. We expense the cost of modifying and updating credit files in the period such costs are incurred. We amortize purchased data files, which primarily consist of acquired credit files, on a straight-line basis. All of our other purchased intangible assets are also amortized on a straight-line basis.
Asset Useful Life
(In years)
Purchased data files 2 to 15
Acquired software and technology 1 to 10
Non-compete agreements 1 to 5
Proprietary database 6 to 10
Customer relationships 2 to 25
Trade names 1 to 15
Additionally, included in intangible assets are reacquired rights that represent the value of rights which we had granted to Computer Sciences Corporation that were reacquired in connection with the acquisition of CSC Credit Services in the fourth quarter of 2012 based on the accounting guidance in place at that time. These reacquired rights are being amortized over the remaining term of the affiliation agreement on a straight-line basis until August 1, 2018.
Other Assets. Other assets on our Consolidated Balance Sheets primarily represents our equity investment in unconsolidated affiliates, our cost method investment in Boa Vista Servicos (“BVS”), assets related to life insurance policies covering certain officers of the Company, and employee benefit trust assets.
Impairment of Cost Method Investment. We monitor the status of our cost method investment in order to determine if conditions exist or events and circumstances indicate that it may be impaired in that its carrying amount may exceed the fair value of the investment. Significant factors that are considered that could be indicative of an impairment include: changes in business strategy, market conditions, underperformance relative to historical or expected future
44 2016 Annual Report CONTENTS
operating results; and negative industry or economic trends. If potential indicators of impairment exist, we estimate the fair value of the investment using a combination of a discounted cash flow analysis and an evaluation of EBITDA and transaction multiples for comparable companies. If the carrying value of the investment exceeds the estimated fair value, an impairment loss is recorded based on the amount by which the investment’s carrying amount exceeds its fair value. There were no indicators of impairment for 2014 or 2016. We recorded an impairment of our cost method investment in 2015. See Note 2 for further discussion.
Other Current Liabilities. Other current liabilities on our Consolidated Balance Sheets consist of the offset to other current assets related to amounts in specifically designated accounts that hold the funds that are due to customers from our debt collection and recovery management services. These funds were approximately $28.0 million and $30.2 million as of December 31, 2016 and 2015, respectively. These amounts are restricted as to their current use, and will be released according to the specific customer agreements. Other current liabilities also include various accrued expenses such as interest expense, accrued employee benefits, accrued taxes, accrued payroll, and accrued legal expenses.
Benefit Plans. We sponsor various pension and defined contribution plans. We also maintain certain healthcare and life insurance benefit plans for eligible retired U.S. employees. Benefits under the pension and other postretirement benefit plans are generally based on age at retirement and years of service and for some pension plans, benefits are also based on the employee’s annual earnings. The net periodic cost of our pension and other postretirement plans is determined using several actuarial assumptions, the most significant of which are the discount rate and the expected return on plan assets. Our Consolidated Balance Sheets reflect the funded status of the pension and other postretirement plans.
Foreign Currency Translation. The functional currency of each of our foreign operating subsidiaries is that subsidiary’s local currency. We translate the assets and liabilities of foreign subsidiaries at the year-end rate of exchange and revenue and expenses at the monthly average rates during the year. We record the resulting translation adjustment in other comprehensive loss, included in accumulated other comprehensive loss, a component of shareholders’ equity. We also record gains and losses resulting from the translation of intercompany balances of a long-term investment nature in foreign currency translation in other comprehensive loss and accumulated other comprehensive loss. In the years ended December 31, 2016 and 2014, we recorded $8.8 million and $7.0 million of foreign currency transaction losses, respectively. In the year ended December 31, 2015, we recorded $2.0 million of foreign currency transaction gains.
Financial Instruments. Our financial instruments consist primarily of cash and cash equivalents, accounts and notes
receivable, accounts payable and short and long-term debt. The carrying amounts of these items, other than long-term debt, approximate their fair market values due to the short-term nature of these instruments. The fair value of our fixed-rate debt is determined using Level 2 inputs such as quoted market prices for publicly traded instruments, and for non-publicly traded instruments through valuation techniques depending on the specific characteristics of the debt instrument, taking into account credit risk. As of December 31, 2016 and 2015, the fair value of our long-term debt, including the current portion, based on observable inputs was $2.4 billion and $1.2 billion, respectively, compared to its carrying value of $2.4 billion and $1.1 billion, respectively.
Derivatives and Hedging Activities. Although derivative financial instruments are not utilized for speculative purposes or as the Company’s primary risk management tool, derivatives have been used as a risk management tool to hedge the Company’s exposure to changes in interest rates and foreign exchange rates. We have used interest rate swaps and interest rate lock agreements to manage interest rate risk associated with our fixed and floating-rate borrowings. Forward contracts on various foreign currencies have been used to manage the foreign currency exchange rate risk of certain firm commitments denominated in foreign currencies. We recognize all derivatives on the balance sheet at fair value. Derivative valuations reflect the value of the instrument including the value associated with any material counterparty risk.
Economic Hedges. In December 2015, in anticipation of the acquisition of Veda Group Limited (“Veda”), we purchased foreign currency options to buy Australian dollars with a weighted average strike price of $0.7225 and a notional value of 1.0 billion Australian dollars. These foreign currency options (“options”) were designed to act as economic hedges for the pending Veda acquisition and were marked to market. The options had an expiry date of February 18, 2016, and are reflected in other current assets, net, on our December 31, 2015 Consolidated Balance Sheet. We recorded a mark-to-market gain on the options of $4.7 million for the year ended December 31, 2015, which was recorded in other income (expense), net. The fair value of these options at December 31, 2015 was $14.4 million, recorded in other current assets, net, on our Consolidated Balance Sheet. In January 2016, we purchased additional options for a notional amount of 1.0 billion Australian dollars, with a weighted average strike price of $0.7091, with expiry dates of February 11, 2016 and February 16, 2016. We settled all of the options on the respective settlement dates in February 2016. We recognized a net loss of $15.4 million related to the options in the first quarter of 2016, which was recorded in other income (expense), net.
Fair Value Hedges. In conjunction with our fourth quarter 2009 sale of five-year Senior Notes, we entered into five-year interest rate swaps, designated as fair value hedges, which convert the debt’s fixed interest rate to a variable rate. These swaps involve the receipt of fixed rate amounts
45Equifax Inc.CONTENTS
for floating interest rate payments over the life of the swaps without exchange of the underlying principal amount. Changes in the fair value of the interest rate swaps offset changes in the fair value of the fixed-rate Senior Notes they hedge due to changes in the designated benchmark interest rate and are recorded in interest expense. We settled the interest rate swaps on their maturity date during the fourth quarter of 2014, with receipt of $3.8 million from the counterparties. There was no ineffectiveness on our fair value hedge that impacted 2014 earnings.
Cash Flow Hedges. Changes in the fair value of highly effective derivatives designated as cash flow hedges are initially recorded in accumulated other comprehensive income and are reclassified into the line item in the Consolidated Statements of Income in which the hedged
item is recorded in the same period the hedged item impacts earnings. Any ineffective portion is recorded in current period earnings. We did not have any unsettled cash flow hedges outstanding as of December 31, 2016 or December 31, 2015.
Fair Value Measurements. Fair value is determined based on the assumptions marketplace participants use in pricing the asset or liability. We use a three level fair value hierarchy to prioritize the inputs used in valuation techniques between observable inputs that reflect quoted prices in active markets, inputs other than quoted prices with observable market data and unobservable data (e.g., a company’s own data).
The following table presents assets and liabilities measured at fair value on a recurring basis:
Fair Value Measurements at Reporting Date Using:
Description
Fair Value at December 31,
2016
Quoted Prices in Active Markets for
Identical Assets (Level 1)
Significant Other
Observable Inputs (Level 2)
Significant Unobservable
Inputs (Level 3)
(In millions)
Assets and Liabilities:
Deferred Compensation Plan Assets(1) 28.6 28.6 — —
Deferred Compensation Plan Liability(1) (28.6) — (28.6 ) —
Total assets and liabilities $ — $ 28.6 $ (28.6 ) $ —
(1) We maintain deferred compensation plans that allow for certain management employees to defer the receipt of compensation (such as salary, incentive compensation and commissions) until a later date based on the terms of the plans. The liability representing benefits accrued for plan participants is valued at the quoted market prices of the participants’ investment elections. The asset consists of mutual funds reflective of the participants investment selections and is valued at daily quoted market prices.
Assets and Liabilities Measured at Fair Value on a Nonrecurring Basis. As disclosed in Note 3, we completed various acquisitions during the years ended December 31, 2016, 2015, and 2014. The values of net assets acquired and the resulting goodwill were recorded at fair value using Level 3 inputs. The majority of the related current assets acquired and liabilities assumed were recorded at their carrying values as of the date of acquisition, as their carrying values approximated their fair values due to their short-term nature. The fair values of goodwill and definite-lived intangible assets acquired in these acquisitions were internally estimated primarily based on the income approach. The income approach estimates fair value based on the present value of the cash flows that the assets are expected to generate in the future. We developed internal estimates for the expected cash flows and discount rates in the present value calculations. The fair value of the equity method investment assets acquired were internally estimated based on the market approach. Under the market approach, we estimated fair value based on market multiples of comparable companies.
Variable Interest Entities. We hold interests in certain entities, including credit data, information solutions and
debt collections and recovery management ventures, that are considered variable interest entities, or VIEs. These variable interests relate to ownership interests that require financial support for these entities. Our investments related to these VIEs totaled $15.6 million at December 31, 2016, representing our maximum exposure to loss, with the exception of the guarantees referenced in Note 7. We are not the primary beneficiary and are not required to consolidate any of these VIEs, with the exception of a debt collections and recovery management venture, for which we meet the consolidation criteria under ASC 810. In regards to that consolidated VIE, we have a 75% equity ownership interest and control of the activities that most significantly impact the VIE’s economic performance. The assets and liabilities of the VIE for which we are the primary beneficiary were not significant to the Company’s consolidated financial statements, and no gain or loss was recognized because of its consolidation.
In evaluating whether we have the power to direct the activities of a VIE that most significantly impact its economic performance, we consider the purpose for which the VIE was created, the importance of each of the activities in which it is engaged and our decision-making role, if any,
46 2016 Annual Report CONTENTS
in those activities that significantly determine the entity’s economic performance as compared to other economic interest holders. This evaluation requires consideration of all facts and circumstances relevant to decision-making that affects the entity’s future performance and the exercise of professional judgment in deciding which decision-making rights are most important.
In determining whether we have the right to receive benefits or the obligation to absorb losses that could potentially be significant to the VIE, we evaluate all of our economic interests in the entity, regardless of form (debt, equity, management and servicing fees, and other contractual arrangements). This evaluation considers all relevant factors of the entity’s design, including: the entity’s capital structure, contractual rights to earnings (losses), subordination of our interests relative to those of other investors, contingent payments, as well as other contractual arrangements that have the potential to be economically significant. The evaluation of each of these factors in reaching a conclusion about the potential significance of our economic interests is a matter that requires the exercise of professional judgment.
Certain of our VIEs have redeemable noncontrolling interests that are subject to classification outside of permanent equity on the Company’s Consolidated Balance Sheet. The redeemable noncontrolling interests are reflected using the redemption method as of the balance sheet date. Redeemable noncontrolling interest adjustments to the redemption values are reflected in retained earnings. The adjustment of redemption value at the period end that reflects a redemption value in excess of fair value is included as an adjustment to net income attributable to Equifax stockholders for the purposes of the calculation of earnings per share. None of the current period adjustments reflect a redemption in excess of fair value. Additionally, due to the immaterial balance of the redeemable noncontrolling interest, we have elected to maintain the noncontrolling interest in permanent equity, rather than temporary equity, within our Consolidated Balance Sheet.
Change in Accounting Principle. In April 2015, the Financial Accounting Standards Board (“FASB”) issued ASU 2015-03 “Interest - Imputation of Interest.” The guidance modified the presentation of debt issuance costs, to require that debt issuance costs related to a recognized debt liability be presented in the balance sheet as a direct deduction from the carrying amount of that debt liability, consistent with debt discounts. In August 2015, the FASB issued ASU 2015-15 “Interest - Imputation of Interest”, which updated the ASU 2015-03 guidance to state that the SEC staff would not object to an entity deferring and presenting debt issuance costs relating to a line-of-credit arrangement as an asset and subsequently amortizing the deferred debt issuance costs ratably over the term of the line-of-credit arrangement, regardless of whether there are any outstanding borrowings on the line-of-credit arrangement. For public business entities, the amendments in this update are effective for financial statements issued for annual
periods beginning after December 15, 2015, and interim periods within those annual periods.
The Company adopted the new guidance in 2016 and retrospectively presented the debt issuance costs related to its long-term debt as a deduction from the carrying amount of the associated debt on its Consolidated Balance Sheets as of December 31, 2016 and December 31, 2015. The Company continues to present the debt issuance costs related to its revolving credit facilities as an asset on its Consolidated Balance Sheets as of December 31, 2016 and December 31, 2015. This change did not have a material impact on our Consolidated Balance Sheets and did not affect the Company’s consolidated statements of income, cash flows, or shareholders’ equity.
Recent Accounting Pronouncements.
Goodwill. In January 2017, the FASB issued ASU 2017-04 “Simplifying the Test for Goodwill Impairment (Topic 350)”. This standard eliminates Step 2 from the goodwill impairment test, instead requiring an entity to recognize a goodwill impairment charge for the amount by which the goodwill carrying amount exceeds the reporting unit’s fair value. This guidance is effective for interim and annual goodwill impairment tests in fiscal years beginning after December 15, 2019 with early adoption permitted. This guidance must be applied on a prospective basis. We do not expect the adoption of this guidance to have a material impact on our financial position, results of operations or cash flows.
Definition of a business. In January 2017, the FASB issued ASU 2017-01 “Clarifying the Definition of a Business (Topic 805)”. This standard provides criteria to determine when an asset acquired or group of assets acquired is not a business. When substantially all of the fair value of the gross assets acquired (or disposed of) is concentrated in a single identifiable asset or a group of similar identifiable assets, the set is not a business. This reduces the number of transactions that need to be further evaluated. The guidance is effective for interim and annual reporting periods in fiscal years beginning after December 15, 2017 with early adoption permitted. We are currently evaluating the impact of the adoption of this guidance on our financial position, results of operations and cash flows.
Statement of Cash Flows. In August 2016, the FASB issued ASU 2016-15 “Classification of Certain Cash Receipts and Cash Payments (Topic 230)”. This standard provides guidance for eight targeted changes with respect to how cash receipts and cash payments are classified in the statements of cash flows, with the objective of reducing diversity in practice. The guidance is effective in 2018 with early adoption permitted. The Company elected to early adopt this accounting standard which did not have a material impact on its Consolidated Financial Statements.
Share-based payments. In March 2016, the FASB issued ASU 2016-09 “Compensation - Stock Compensation (Topic 718)”. This standard requires the recognition of the
47Equifax Inc.CONTENTS
income tax effects of awards in the income statement when the awards vest or are settled, thus eliminating additional paid-in capital pools. The guidance also allows for the employer to repurchase more of an employee’s shares for tax withholding purposes without triggering liability accounting. In addition, the guidance allows for a policy election to account for forfeitures as they occur rather than on an estimated basis. The guidance is effective in 2017 with early adoption permitted. We recorded $35.9 million, $30.0 million, and $17.7 million as additional paid-in capital in our Consolidated Balance Sheets and as a financing activity in our Consolidated Statements of Cash Flows for the twelve months ended December 31, 2016, 2015, and 2014, respectively. These amounts will be classified prospectively as a tax benefit in net income in our Consolidated Statements of Income and an operating activity in our Consolidated Statements of Cash Flows. We have elected to continue to estimate forfeitures expected to occur to determine the amount of compensation cost to be recognized each period. We plan to adopt the standard beginning with the first quarter of 2017.
Equity method investments. In March 2016, the FASB issued ASU 2016-07 “Investments - Equity Method and Joint Ventures (Topic 323)”. This standard eliminates the requirement that an investor retrospectively apply equity method accounting when an investment that it had accounted for by another method initially qualifies for the equity method. The guidance requires that an equity method investor add the cost of acquiring the additional interest in the investee to the current basis of the investor’s previously held interest and adopt the equity method of accounting as of the date the investment becomes qualified for equity method accounting. The guidance is effective in 2017 with early adoption permitted. The guidance will not have a material impact on our Consolidated Financial Statements.
Leases. In February 2016, the FASB issued ASU 2016-02 “Leases (Topic 842)”. This standard requires lessees to put most leases on their balance sheets but recognize expenses on their income statements in a manner similar to current lease accounting. The guidance also eliminates current real estate-specific provisions for all entities. For lessors, the guidance modifies the classification criteria and the accounting for sales-type and direct financing leases. All entities will classify leases to determine how to recognize lease-related revenue and expense. The guidance becomes effective for fiscal years and interim reporting periods beginning after December 15, 2018 with early adoption permitted and will require recognizing and measuring leases at the beginning of the earliest period presented using a modified retrospective approach. The Company is evaluating the potential effects of the adoption of this standard on its Consolidated Financial Statements.
Reporting of Provisional Amounts in a Business Combination. In September 2015, the FASB issued ASU 2015-03 “Business Combinations (Topic 805): Simplifying the Accounting for Measurement-Period Adjustments”. This
standard eliminates the requirement to restate prior period financial statements for measurement period adjustments following a business combination. The new standard requires that the cumulative impact of a measurement period adjustment (including the impact on prior periods) be recognized in the reporting period in which the adjustment is identified. The prior period impact of the adjustment should be either presented separately on the face of the income statement or disclosed in the notes. The guidance became effective for fiscal years and interim reporting periods beginning after December 15, 2015. The adoption of this standard did not have a material impact on our consolidated financial position, results of operations and cash flows.
Cloud Computing Arrangements. In April 2015, the FASB issued ASU 2015-05 “Intangibles—Goodwill and Other—Internal-Use Software: Customer’s Accounting for Fees Paid in a Cloud Computing Arrangement.” The update provides criteria for customers in a cloud computing arrangement to use to determine whether the arrangement includes a license of software. The guidance becomes effective for fiscal years and interim reporting periods beginning after December 15, 2015. We have elected to adopt the standard prospectively. The adoption of this standard did not have a material impact on our consolidated financial position, results of operations and cash flows.
Revenue Recognition. In May 2014, the FASB issued ASU No. 2014-9, “Revenue from Contracts with Customers.” ASU 2014-9 is a comprehensive new revenue recognition model that requires a company to recognize revenue to depict the transfer of goods or services to a customer at an amount that reflects the consideration it expects to receive in exchange for those goods or services. ASU 2014-9 also requires additional disclosure about the nature, amount, timing and uncertainty of revenue and cash flows arising from customer contracts, including significant judgments and changes in judgments and assets recognized from costs incurred to obtain or fulfill a contract. ASU 2014-9 was originally effective for annual reporting periods, and interim periods within that period, beginning after December 15, 2016 and early adoption was not permitted. On July 9, 2015, the FASB voted to defer the effective date by one year to December 15, 2017 for interim and annual reporting periods beginning after that date and permitted early adoption of the standard, but not before the original effective date of December 15, 2016. Companies may use either a full retrospective or a modified retrospective approach to adopt ASU 2014-9.
Based on our current assessment, we anticipate adopting the standard using the modified retrospective method. The new standard will impact our contracts that have a known quantity over a defined term with price increases or decreases over the contract life. Under the current standard, the revenue related to these contracts were limited by billings in a period. Under the new standard the total contract value will be recognized ratably over the defined term or by using a transactional standalone
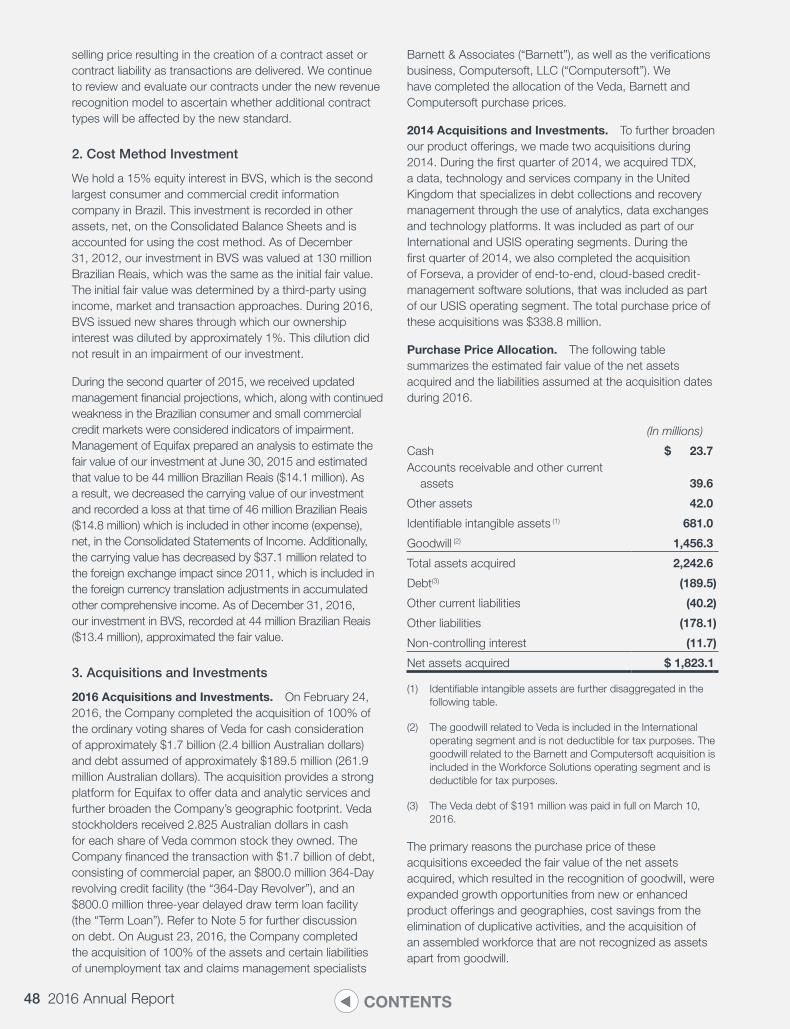
48 2016 Annual Report CONTENTS
selling price resulting in the creation of a contract asset or contract liability as transactions are delivered. We continue to review and evaluate our contracts under the new revenue recognition model to ascertain whether additional contract types will be affected by the new standard.
2. Cost Method Investment
We hold a 15% equity interest in BVS, which is the second largest consumer and commercial credit information company in Brazil. This investment is recorded in other assets, net, on the Consolidated Balance Sheets and is accounted for using the cost method. As of December 31, 2012, our investment in BVS was valued at 130 million Brazilian Reais, which was the same as the initial fair value. The initial fair value was determined by a third-party using income, market and transaction approaches. During 2016, BVS issued new shares through which our ownership interest was diluted by approximately 1%. This dilution did not result in an impairment of our investment.
During the second quarter of 2015, we received updated management financial projections, which, along with continued weakness in the Brazilian consumer and small commercial credit markets were considered indicators of impairment. Management of Equifax prepared an analysis to estimate the fair value of our investment at June 30, 2015 and estimated that value to be 44 million Brazilian Reais ($14.1 million). As a result, we decreased the carrying value of our investment and recorded a loss at that time of 46 million Brazilian Reais ($14.8 million) which is included in other income (expense), net, in the Consolidated Statements of Income. Additionally, the carrying value has decreased by $37.1 million related to the foreign exchange impact since 2011, which is included in the foreign currency translation adjustments in accumulated other comprehensive income. As of December 31, 2016, our investment in BVS, recorded at 44 million Brazilian Reais ($13.4 million), approximated the fair value.
3. Acquisitions and Investments
2016 Acquisitions and Investments. On February 24, 2016, the Company completed the acquisition of 100% of the ordinary voting shares of Veda for cash consideration of approximately $1.7 billion (2.4 billion Australian dollars) and debt assumed of approximately $189.5 million (261.9 million Australian dollars). The acquisition provides a strong platform for Equifax to offer data and analytic services and further broaden the Company’s geographic footprint. Veda stockholders received 2.825 Australian dollars in cash for each share of Veda common stock they owned. The Company financed the transaction with $1.7 billion of debt, consisting of commercial paper, an $800.0 million 364-Day revolving credit facility (the “364-Day Revolver”), and an $800.0 million three-year delayed draw term loan facility (the “Term Loan”). Refer to Note 5 for further discussion on debt. On August 23, 2016, the Company completed the acquisition of 100% of the assets and certain liabilities of unemployment tax and claims management specialists
Barnett & Associates (“Barnett”), as well as the verifications business, Computersoft, LLC (“Computersoft”). We have completed the allocation of the Veda, Barnett and Computersoft purchase prices.
2014 Acquisitions and Investments. To further broaden our product offerings, we made two acquisitions during 2014. During the first quarter of 2014, we acquired TDX, a data, technology and services company in the United Kingdom that specializes in debt collections and recovery management through the use of analytics, data exchanges and technology platforms. It was included as part of our International and USIS operating segments. During the first quarter of 2014, we also completed the acquisition of Forseva, a provider of end-to-end, cloud-based credit-management software solutions, that was included as part of our USIS operating segment. The total purchase price of these acquisitions was $338.8 million.
Purchase Price Allocation. The following table summarizes the estimated fair value of the net assets acquired and the liabilities assumed at the acquisition dates during 2016.
(In millions)
Cash $ 23.7Accounts receivable and other current
assets 39.6
Other assets 42.0
Identifiable intangible assets (1) 681.0
Goodwill (2) 1,456.3
Total assets acquired 2,242.6
Debt(3) (189.5)
Other current liabilities (40.2)
Other liabilities (178.1)
Non-controlling interest (11.7)
Net assets acquired $ 1,823.1
(1) Identifiable intangible assets are further disaggregated in the following table.
(2) The goodwill related to Veda is included in the International operating segment and is not deductible for tax purposes. The goodwill related to the Barnett and Computersoft acquisition is included in the Workforce Solutions operating segment and is deductible for tax purposes.
(3) The Veda debt of $191 million was paid in full on March 10, 2016.
The primary reasons the purchase price of these acquisitions exceeded the fair value of the net assets acquired, which resulted in the recognition of goodwill, were expanded growth opportunities from new or enhanced product offerings and geographies, cost savings from the elimination of duplicative activities, and the acquisition of an assembled workforce that are not recognized as assets apart from goodwill.
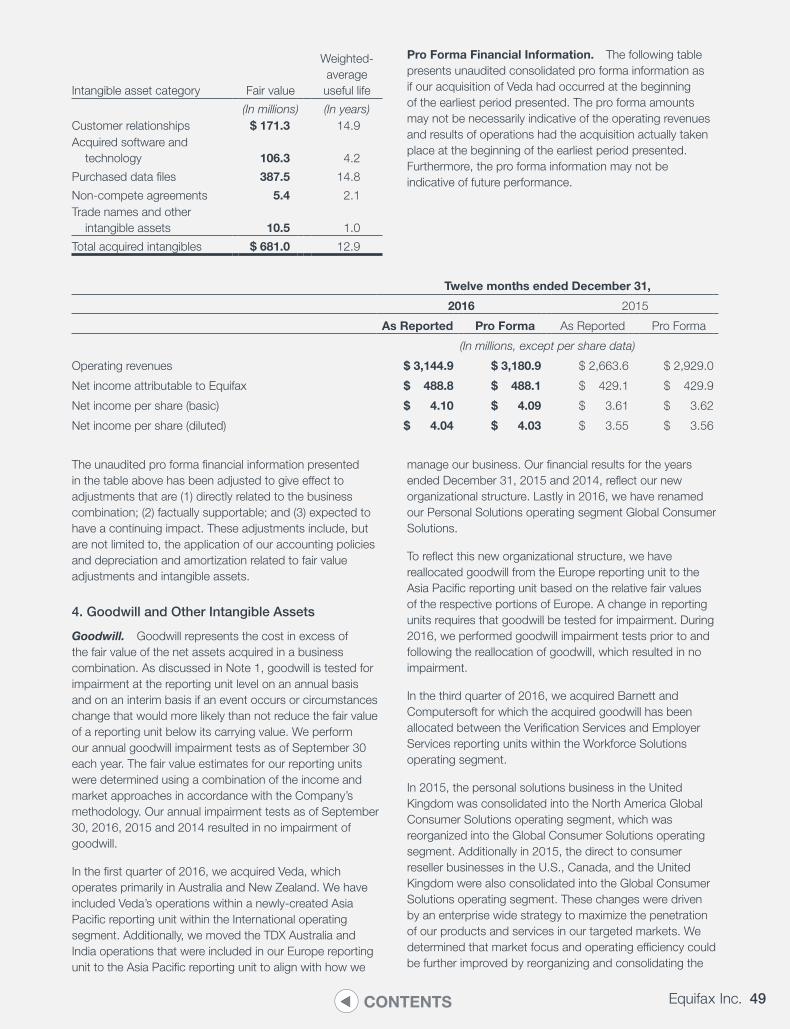
49Equifax Inc.CONTENTS
Intangible asset category Fair value
Weighted-average useful life
(In millions) (In years)Customer relationships $ 171.3 14.9Acquired software and
technology 106.3 4.2
Purchased data files 387.5 14.8
Non-compete agreements 5.4 2.1Trade names and other
intangible assets 10.5 1.0
Total acquired intangibles $ 681.0 12.9
Pro Forma Financial Information. The following table presents unaudited consolidated pro forma information as if our acquisition of Veda had occurred at the beginning of the earliest period presented. The pro forma amounts may not be necessarily indicative of the operating revenues and results of operations had the acquisition actually taken place at the beginning of the earliest period presented. Furthermore, the pro forma information may not be indicative of future performance.
Twelve months ended December 31,
2016 2015
As Reported Pro Forma As Reported Pro Forma
(In millions, except per share data)
Operating revenues $ 3,144.9 $ 3,180.9 $ 2,663.6 $ 2,929.0
Net income attributable to Equifax $ 488.8 $ 488.1 $ 429.1 $ 429.9
Net income per share (basic) $ 4.10 $ 4.09 $ 3.61 $ 3.62
Net income per share (diluted) $ 4.04 $ 4.03 $ 3.55 $ 3.56
The unaudited pro forma financial information presented in the table above has been adjusted to give effect to adjustments that are (1) directly related to the business combination; (2) factually supportable; and (3) expected to have a continuing impact. These adjustments include, but are not limited to, the application of our accounting policies and depreciation and amortization related to fair value adjustments and intangible assets.
4. Goodwill and Other Intangible Assets
Goodwill. Goodwill represents the cost in excess of the fair value of the net assets acquired in a business combination. As discussed in Note 1, goodwill is tested for impairment at the reporting unit level on an annual basis and on an interim basis if an event occurs or circumstances change that would more likely than not reduce the fair value of a reporting unit below its carrying value. We perform our annual goodwill impairment tests as of September 30 each year. The fair value estimates for our reporting units were determined using a combination of the income and market approaches in accordance with the Company’s methodology. Our annual impairment tests as of September 30, 2016, 2015 and 2014 resulted in no impairment of goodwill.
In the first quarter of 2016, we acquired Veda, which operates primarily in Australia and New Zealand. We have included Veda’s operations within a newly-created Asia Pacific reporting unit within the International operating segment. Additionally, we moved the TDX Australia and India operations that were included in our Europe reporting unit to the Asia Pacific reporting unit to align with how we
manage our business. Our financial results for the years ended December 31, 2015 and 2014, reflect our new organizational structure. Lastly in 2016, we have renamed our Personal Solutions operating segment Global Consumer Solutions.
To reflect this new organizational structure, we have reallocated goodwill from the Europe reporting unit to the Asia Pacific reporting unit based on the relative fair values of the respective portions of Europe. A change in reporting units requires that goodwill be tested for impairment. During 2016, we performed goodwill impairment tests prior to and following the reallocation of goodwill, which resulted in no impairment.
In the third quarter of 2016, we acquired Barnett and Computersoft for which the acquired goodwill has been allocated between the Verification Services and Employer Services reporting units within the Workforce Solutions operating segment.
In 2015, the personal solutions business in the United Kingdom was consolidated into the North America Global Consumer Solutions operating segment, which was reorganized into the Global Consumer Solutions operating segment. Additionally in 2015, the direct to consumer reseller businesses in the U.S., Canada, and the United Kingdom were also consolidated into the Global Consumer Solutions operating segment. These changes were driven by an enterprise wide strategy to maximize the penetration of our products and services in our targeted markets. We determined that market focus and operating efficiency could be further improved by reorganizing and consolidating the
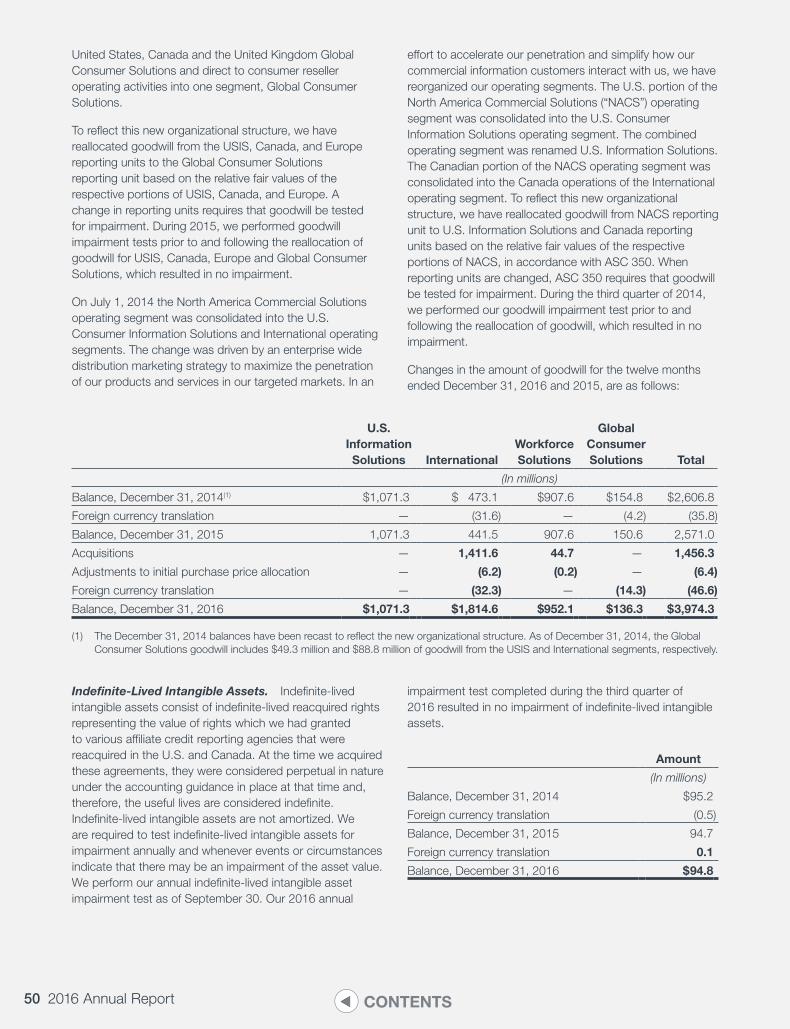
50 2016 Annual Report CONTENTS
United States, Canada and the United Kingdom Global Consumer Solutions and direct to consumer reseller operating activities into one segment, Global Consumer Solutions.
To reflect this new organizational structure, we have reallocated goodwill from the USIS, Canada, and Europe reporting units to the Global Consumer Solutions reporting unit based on the relative fair values of the respective portions of USIS, Canada, and Europe. A change in reporting units requires that goodwill be tested for impairment. During 2015, we performed goodwill impairment tests prior to and following the reallocation of goodwill for USIS, Canada, Europe and Global Consumer Solutions, which resulted in no impairment.
On July 1, 2014 the North America Commercial Solutions operating segment was consolidated into the U.S. Consumer Information Solutions and International operating segments. The change was driven by an enterprise wide distribution marketing strategy to maximize the penetration of our products and services in our targeted markets. In an
effort to accelerate our penetration and simplify how our commercial information customers interact with us, we have reorganized our operating segments. The U.S. portion of the North America Commercial Solutions (“NACS”) operating segment was consolidated into the U.S. Consumer Information Solutions operating segment. The combined operating segment was renamed U.S. Information Solutions. The Canadian portion of the NACS operating segment was consolidated into the Canada operations of the International operating segment. To reflect this new organizational structure, we have reallocated goodwill from NACS reporting unit to U.S. Information Solutions and Canada reporting units based on the relative fair values of the respective portions of NACS, in accordance with ASC 350. When reporting units are changed, ASC 350 requires that goodwill be tested for impairment. During the third quarter of 2014, we performed our goodwill impairment test prior to and following the reallocation of goodwill, which resulted in no impairment.
Changes in the amount of goodwill for the twelve months ended December 31, 2016 and 2015, are as follows:
U.S. Information Solutions International
Workforce Solutions
Global Consumer Solutions Total
(In millions)
Balance, December 31, 2014(1) $1,071.3 $ 473.1 $907.6 $154.8 $2,606.8
Foreign currency translation — (31.6) — (4.2) (35.8)
Balance, December 31, 2015 1,071.3 441.5 907.6 150.6 2,571.0
Acquisitions — 1,411.6 44.7 — 1,456.3
Adjustments to initial purchase price allocation — (6.2) (0.2) — (6.4)
Foreign currency translation — (32.3) — (14.3) (46.6)
Balance, December 31, 2016 $1,071.3 $1,814.6 $952.1 $136.3 $ 3,974.3
(1) The December 31, 2014 balances have been recast to reflect the new organizational structure. As of December 31, 2014, the Global Consumer Solutions goodwill includes $49.3 million and $88.8 million of goodwill from the USIS and International segments, respectively.
Indefinite-Lived Intangible Assets. Indefinite-lived intangible assets consist of indefinite-lived reacquired rights representing the value of rights which we had granted to various affiliate credit reporting agencies that were reacquired in the U.S. and Canada. At the time we acquired these agreements, they were considered perpetual in nature under the accounting guidance in place at that time and, therefore, the useful lives are considered indefinite. Indefinite-lived intangible assets are not amortized. We are required to test indefinite-lived intangible assets for impairment annually and whenever events or circumstances indicate that there may be an impairment of the asset value. We perform our annual indefinite-lived intangible asset impairment test as of September 30. Our 2016 annual
impairment test completed during the third quarter of 2016 resulted in no impairment of indefinite-lived intangible assets.
Amount
(In millions)
Balance, December 31, 2014 $95.2
Foreign currency translation (0.5)
Balance, December 31, 2015 94.7
Foreign currency translation 0.1
Balance, December 31, 2016 $ 94.8
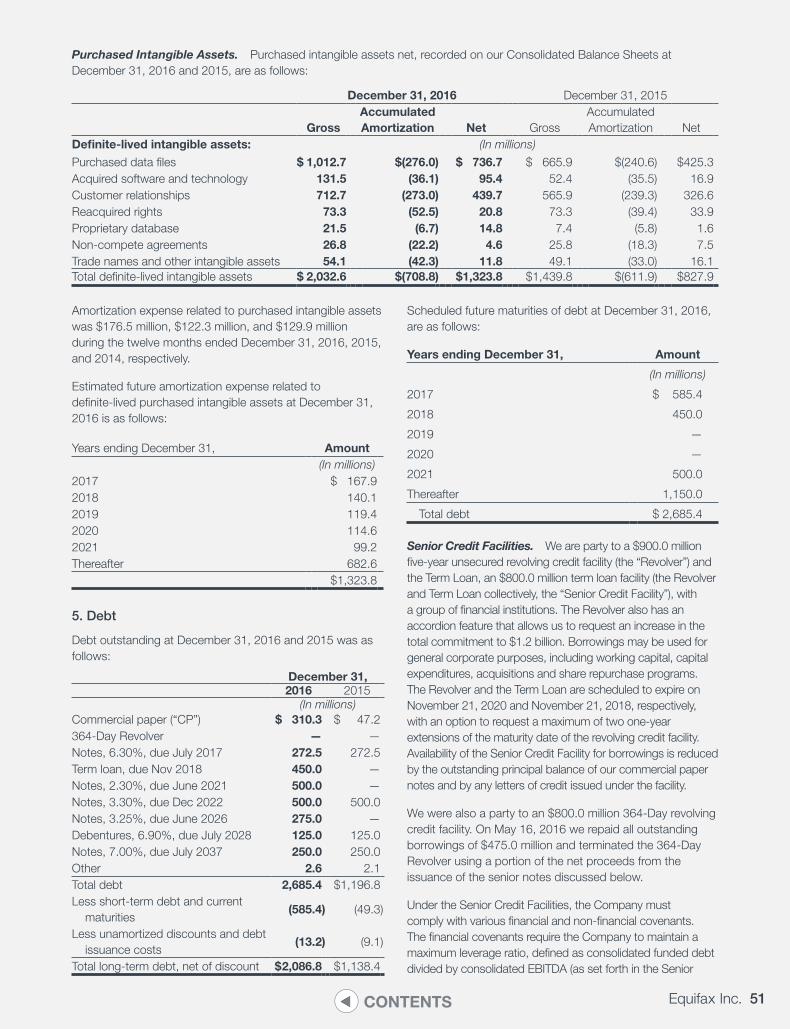
51Equifax Inc.CONTENTS
Purchased Intangible Assets. Purchased intangible assets net, recorded on our Consolidated Balance Sheets at December 31, 2016 and 2015, are as follows:
December 31, 2016 December 31, 2015
GrossAccumulated Amortization Net Gross
Accumulated Amortization Net
Definite-lived intangible assets: (In millions)
Purchased data files $ 1,012.7 $(276.0) $ 736.7 $ 665.9 $(240.6) $425.3Acquired software and technology 131.5 (36.1) 95.4 52.4 (35.5) 16.9Customer relationships 712.7 (273.0) 439.7 565.9 (239.3) 326.6Reacquired rights 73.3 (52.5) 20.8 73.3 (39.4) 33.9Proprietary database 21.5 (6.7) 14.8 7.4 (5.8) 1.6Non-compete agreements 26.8 (22.2) 4.6 25.8 (18.3) 7.5Trade names and other intangible assets 54.1 (42.3) 11.8 49.1 (33.0) 16.1Total definite-lived intangible assets $ 2,032.6 $(708.8) $1,323.8 $1,439.8 $(611.9) $827.9
Amortization expense related to purchased intangible assets was $176.5 million, $122.3 million, and $129.9 million during the twelve months ended December 31, 2016, 2015, and 2014, respectively.
Estimated future amortization expense related to definite-lived purchased intangible assets at December 31, 2016 is as follows:
Years ending December 31, Amount(In millions)
2017 $ 167.92018 140.12019 119.42020 114.62021 99.2Thereafter 682.6
$1,323.8
5. Debt
Debt outstanding at December 31, 2016 and 2015 was as follows:
December 31,2016 2015
(In millions)Commercial paper (“CP”) $ 310.3 $ 47.2364-Day Revolver — —Notes, 6.30%, due July 2017 272.5 272.5Term loan, due Nov 2018 450.0 —Notes, 2.30%, due June 2021 500.0 —Notes, 3.30%, due Dec 2022 500.0 500.0Notes, 3.25%, due June 2026 275.0 —Debentures, 6.90%, due July 2028 125.0 125.0Notes, 7.00%, due July 2037 250.0 250.0Other 2.6 2.1Total debt 2,685.4 $1,196.8Less short-term debt and current
maturities(585.4) (49.3)
Less unamortized discounts and debt issuance costs
(13.2) (9.1)
Total long-term debt, net of discount $ 2,086.8 $1,138.4
Scheduled future maturities of debt at December 31, 2016, are as follows:
Years ending December 31, Amount
(In millions)
2017 $ 585.4
2018 450.0
2019 —
2020 —
2021 500.0
Thereafter 1,150.0
Total debt $ 2,685.4
Senior Credit Facilities. We are party to a $900.0 million five-year unsecured revolving credit facility (the “Revolver”) and the Term Loan, an $800.0 million term loan facility (the Revolver and Term Loan collectively, the “Senior Credit Facility”), with a group of financial institutions. The Revolver also has an accordion feature that allows us to request an increase in the total commitment to $1.2 billion. Borrowings may be used for general corporate purposes, including working capital, capital expenditures, acquisitions and share repurchase programs. The Revolver and the Term Loan are scheduled to expire on November 21, 2020 and November 21, 2018, respectively, with an option to request a maximum of two one-year extensions of the maturity date of the revolving credit facility. Availability of the Senior Credit Facility for borrowings is reduced by the outstanding principal balance of our commercial paper notes and by any letters of credit issued under the facility.
We were also a party to an $800.0 million 364-Day revolving credit facility. On May 16, 2016 we repaid all outstanding borrowings of $475.0 million and terminated the 364-Day Revolver using a portion of the net proceeds from the issuance of the senior notes discussed below.
Under the Senior Credit Facilities, the Company must comply with various financial and non-financial covenants. The financial covenants require the Company to maintain a maximum leverage ratio, defined as consolidated funded debt divided by consolidated EBITDA (as set forth in the Senior
52 2016 Annual Report CONTENTS
Credit Facilities) for the preceding four quarters, of not more than 3.5 to 1.0. The Company may, subject to the terms of the Senior Credit Facilities, increase the covenant by 0.5 (i.e. to 4.0 to1.0) for a four consecutive fiscal quarter period following a material acquisition. As permitted under the terms of the Senior Credit Facilities, we made the election to increase the covenant to 4.0 to 1.0, effective for four consecutive quarters, beginning with the first quarter of 2016 and continuing through the fourth quarter of 2016. Compliance with this financial covenant is tested quarterly. The non-financial covenants include limitations on liens, subsidiary debt, mergers, liquidations, asset dispositions and acquisitions. As of December 31, 2016, we were in compliance with our covenants under the Senior Credit Facilities. Our borrowings under these facilities, which have not been guaranteed by any of our subsidiaries, are unsecured and will rank on parity in right of payment with all of our other unsecured and unsubordinated indebtedness from time to time outstanding.
At December 31, 2016, interest was payable on borrowings under the Senior Credit Facilities at the base rate or London Interbank Offered Rate, or LIBOR, plus a specified margin. The specified margin and the annual unused fee, which we pay on the unused portion of the Revolver, are subject to adjustment based on our debt ratings. As of December 31, 2016, we had $0.5 million of letters of credit outstanding under our Senior Credit Facility. As of December 31, 2016, $589.2 million was available for borrowings and there were no outstanding borrowings under the Senior Credit Facilities.
While the underlying final maturity date of the Revolver is November 2020, it is structured to provide borrowings under short-term loans. Because these borrowings primarily have a maturity of ninety days, the borrowings and repayments are presented on a net basis within the financing activities portion of our Consolidated Statements of Cash Flows as net short-term borrowings (repayments).
Commercial Paper Program. The Company’s $900.0 million CP program has been established through the private placement of CP notes from time to time, in which borrowings bear interest at either a variable rate (based on LIBOR or other benchmarks) or a fixed rate, with the applicable rate and margin. Maturities of CP can range from overnight to 397 days. Because the CP program is backstopped by our Senior Credit Facility, the amount of CP which may be issued under the program is reduced by the outstanding face amount of any letters of credit issued under the facility and, pursuant to our existing Board of Directors authorization, by the outstanding borrowings under our Senior Credit Facility. At December 31, 2016, there were $310.3 million CP notes outstanding, all with maturities of less than 90 days.
2.3% and 3.25% Senior Notes. On May 12, 2016, we issued $500.0 million principal amount of 2.3%, five-year senior notes and $275.0 million principal amount of 3.25%, ten-year senior notes in an underwritten public offering. Interest is payable semi-annually in arrears on June 1 and December 1 of each year, beginning on
December 1, 2016. The net proceeds of the sale of the notes were used to repay borrowings under our 364-Day Revolver and a portion of the borrowings under our commercial paper program incurred to finance the acquisition of Veda. We must comply with various non-financial covenants, including certain limitations on mortgages, liens and sale-leaseback transactions, as well as mergers and sales of substantially all of our assets. The senior notes are unsecured and rank equally with all of our other unsecured and unsubordinated indebtedness.
6.3% and 7.0% Senior Notes. On June 28, 2007, we issued $300.0 million principal amount of 6.3%, ten-year senior notes and $250.0 million principal amount of 7.0%, thirty-year senior notes in underwritten public offerings. Interest is payable semi-annually in arrears on January 1 and July 1 of each year. The net proceeds of the financing were used to repay short-term indebtedness, a substantial portion of which was incurred in connection with our acquisition of TALX. We must comply with various non-financial covenants, including certain limitations on liens, additional debt and mortgages, mergers, asset dispositions and sale-leaseback arrangements. The senior notes are unsecured and rank equally with all of our other unsecured and unsubordinated indebtedness.
3.3% Senior Notes. On December 17, 2012, we issued $500.0 million principal amount of 3.3%, ten-year senior notes in an underwritten public offering. Interest is payable semi-annually in arrears on December 15 and June 15 of each year. The net proceeds of the sale of the notes were used to partially finance the acquisition of CSC Credit Services in December 2012. We must comply with various non-financial covenants, including certain limitations on liens, additional debt and mortgages, mergers, asset dispositions and sale-leaseback arrangements. The senior notes are unsecured and rank equally with all of our other unsecured and unsubordinated indebtedness.
6.9% Debentures. We have $125.0 million of debentures outstanding with a maturity date of 2028. The debentures are unsecured and rank equally with all of our other unsecured and unsubordinated indebtedness.
Cash paid for interest was $85.0 million, $61.6 million and $67.9 million during the twelve months ended December 31, 2016, 2015 and 2014, respectively.
6. Commitments and Contingencies
Leases. Our operating leases principally involve office space and office equipment. Rental expense for operating leases, which is recognized on a straight-line basis over the lease term, was $29.1 million, $24.2 million and $22.6 million for the twelve months ended December 31, 2016, 2015 and 2014, respectively. Our headquarters building ground lease has purchase options exercisable beginning in 2019, renewal options exercisable in 2048 and escalation clauses that began in 2009. Expected future minimum payment
53Equifax Inc.CONTENTS
obligations for non-cancelable operating leases exceeding one year are as follows as of December 31, 2016:
AmountYears ending December 31, (In millions)
2017 $ 29.52018 24.02019 18.22020 17.62021 14.3Thereafter 59.1
$ 162.7
We have no material sublease agreements and as a result, expected sublease income is not reflected as a reduction in the total minimum rental obligations under operating leases in the table above.
Data Processing, Outsourcing Services and Other Agreements. We have separate agreements with IBM, Tata Consultancy Services, Fidelity Information Services, and others to outsource portions of our computer data processing operations, applications development, business continuity and recovery services, help desk service and desktop support functions, operation of our voice and data networks, maintenance and related functions and to provide certain other administrative and operational services. The agreements expire between 2017 and 2021. The estimated aggregate minimum contractual obligation remaining under these agreements is approximately $105 million as of December 31, 2016, with no future year’s minimum contractual obligation expected to exceed approximately $75 million. Annual payment obligations in regard to these agreements vary due to factors such as the volume of data processed; changes in our servicing needs as a result of new product offerings, acquisitions or divestitures; the introduction of significant new technologies; foreign currency; or the general rate of inflation. In certain circumstances (e.g., a change in control or for our convenience), we may terminate these data processing and outsourcing agreements, and, in doing so, certain of these agreements require us to pay significant termination fees.
During 2012, we amended certain portions and terminated certain other portions of our operations support services agreement for North America with IBM. The amended agreement extended certain terms through December 2016 and changed certain variable cost to fixed cost intended to provide financial savings to the Company. In 2015, we further amended our IBM agreement to extend our commitment for services provided in the U.S. to 2020 and in 2016 further amended our IBM agreement to extend our commitment for services provided in Spain to 2019 and for services provided to Canada to 2021. Under our agreement with IBM (which covers our operations in North America and Europe), we have outsourced certain of our mainframe and midrange operations, help desk service
and desktop support functions, and the operation of our voice and data networks. The scope of services provided by IBM, and the term of our agreement with respect to such services, varies by geography and location. The estimated future minimum contractual obligation under the revised North America (US and Canada) and Europe (UK and Spain) agreements is approximately $25 million for the remaining term, with no individual year’s minimum expected to exceed approximately $20 million. We may terminate certain portions of this agreement without penalty in the event that IBM is in material breach of the terms of the agreement. During 2016, 2015 and 2014, we paid approximately $45 million, $50 million and $50 million, respectively, for these services.
Change in Control Agreements. We have entered into change in control severance agreements with certain key executives. The agreements provide for, among other things, certain payments and benefits in the event of a qualifying termination of employment (i.e., termination of employment by the executive for “good reason” or termination of employment by the Company without “cause,” each as defined in the agreements) following a change in control of the Company. In the event of a qualifying termination, the executive will become entitled to continuation of group health, dental, vision, life, disability, 401(k) and similar benefits for two or three years, depending on the eligibility, as well as a lump sum severance payment, all of which differs by executive.
The change in control agreements have a three-year term and automatically renew for another three years unless we elect not to renew the agreements. Change in control events potentially triggering benefits under the agreements would occur, subject to certain exceptions, if (1) any person acquires 20% or more of our voting stock; (2) upon a merger or other business combination, our shareholders receive less than two-thirds of the common stock and combined voting power of the new company; (3) we sell or otherwise dispose of all or substantially all of our assets; or (4) we liquidate or dissolve.
If these change in control agreements had been triggered as of December 31, 2016, payments of approximately $58.1 million would have been made (excluding tax gross-up amounts of $9.3 million). Under the Company’s existing director and employee stock benefit plans, a change in control generally would result in the immediate vesting of all outstanding stock options and satisfaction of the restrictions on any outstanding nonvested stock awards. With respect to unvested performance based share awards dependent upon the Company’s three-year relative total shareholder return, if at least one calendar year of performance during the performance period has been completed prior to the change in control event, the awards will be paid out based on the Company’s performance at that time; otherwise the payout of shares will be at 100% of the target award.
54 2016 Annual Report CONTENTS
Guarantees. We will from time to time issue standby letters of credit, performance bonds or other guarantees in the normal course of business. The aggregate notional amount of all performance bonds and standby letters of credit is not material at December 31, 2016, and all have a remaining maturity of one year or less. We may issue other guarantees in the ordinary course of business. The maximum potential future payments we could be required to make under the guarantees is not material at December 31, 2016. We have agreed to guarantee the liabilities and performance obligations (some of which have limitations) of a certain debt collections and recovery management VIE under its commercial agreements. We cannot reasonably estimate our potential future payments under the guarantees and related provisions described above because we cannot predict when and under what circumstances these provisions may be triggered. We had no accruals related to guarantees on our Consolidated Balance Sheets at December 31, 2016.
General Indemnifications. We are the lessee under many real estate leases. It is common in these commercial lease transactions for us, as the lessee, to agree to indemnify the lessor and other related third parties for tort, environmental and other liabilities that arise out of or relate to our use or occupancy of the leased premises. This type of indemnity would typically make us responsible to indemnified parties for liabilities arising out of the conduct of, among others, contractors, licensees and invitees at or in connection with the use or occupancy of the leased premises. This indemnity often extends to related liabilities arising from the negligence of the indemnified parties, but usually excludes any liabilities caused by either their sole or gross negligence and their willful misconduct.
Certain of our credit agreements include provisions which require us to make payments to preserve an expected economic return to the lenders if that economic return is diminished due to certain changes in law or regulations. In certain of these credit agreements, we also bear the risk of certain changes in tax laws that would subject payments to non-U.S. lenders to withholding taxes.
In conjunction with certain transactions, such as sales or purchases of operating assets or services in the ordinary course of business, or the disposition of certain assets or businesses, we sometimes provide routine indemnifications,
the terms of which range in duration and sometimes are not limited.
The Company has entered into indemnification agreements with its directors and executive officers. Under these agreements, the Company has agreed to indemnify such individuals to the fullest extent permitted by law against liabilities that arise by reason of their status as directors or officers and to advance expenses incurred by such individuals in connection with the related legal proceedings. The Company maintains directors and officers liability insurance coverage to reduce its exposure to such obligations.
We cannot reasonably estimate our potential future payments under the indemnities and related provisions described above because we cannot predict when and under what circumstances these provisions may be triggered. We have no accrual related to indemnifications on our Consolidated Balance Sheets at December 31, 2016 and 2015.
Subsidiary Dividend and Fund Transfer Limitations. The ability of some of our subsidiaries and associated companies to transfer funds to us is limited, in some cases, by certain restrictions imposed by foreign governments, which do not, individually or in the aggregate, materially limit our ability to service our indebtedness, meet our current obligations or pay dividends.
Contingencies. We are involved in legal proceedings, claims and litigation arising in the ordinary course of business. We periodically assess our exposure related to these matters based on the information which is available. We have recorded accruals in our Consolidated Financial Statements for those matters in which it is probable that we have incurred a loss and the amount of the loss, or range of loss, can be reasonably estimated.
Although the final outcome of these matters cannot be predicted with certainty, any possible adverse outcome arising from these matters is not expected to have a material impact on our Consolidated Financial Statements, either individually or in the aggregate. However, our evaluation of the likely impact of these matters may change in the future. We accrue for unpaid legal fees for services performed to date.
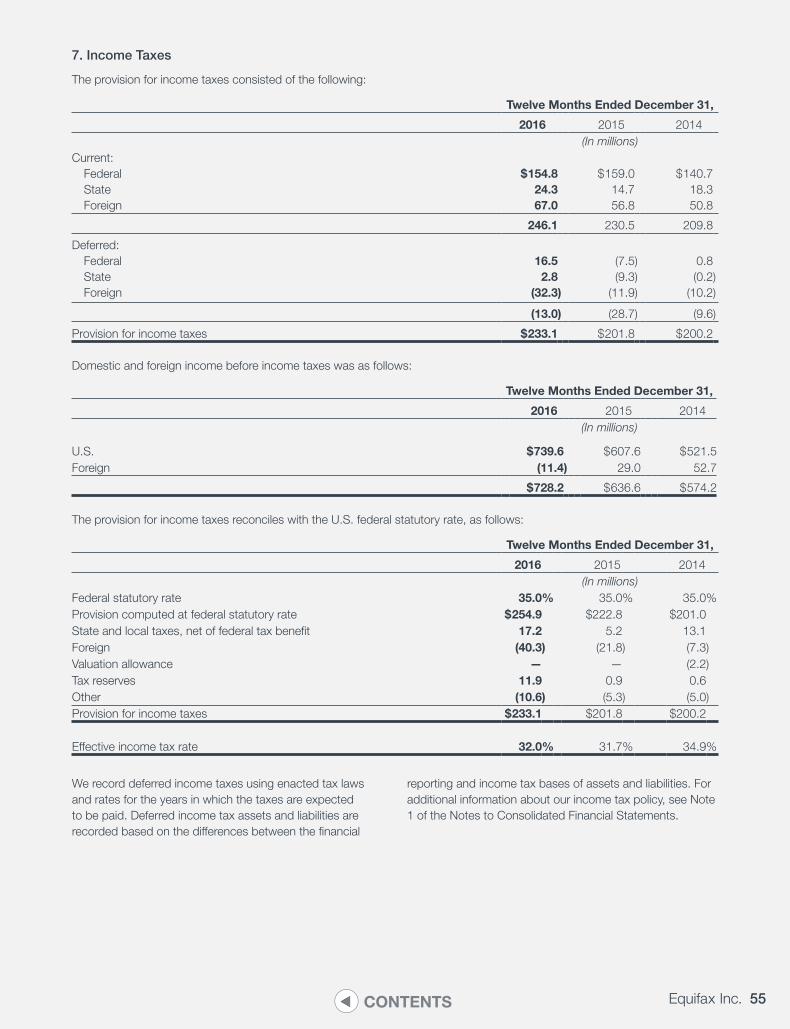
55Equifax Inc.CONTENTS
7. Income Taxes
The provision for income taxes consisted of the following:
Twelve Months Ended December 31,
2016 2015 2014(In millions)
Current: Federal $ 154.8 $ 159.0 $ 140.7 State 24.3 14.7 18.3 Foreign 67.0 56.8 50.8
246.1 230.5 209.8
Deferred: Federal 16.5 (7.5) 0.8 State 2.8 (9.3) (0.2) Foreign (32.3) (11.9) (10.2)
(13.0) (28.7) (9.6)
Provision for income taxes $ 233.1 $ 201.8 $ 200.2
Domestic and foreign income before income taxes was as follows:
Twelve Months Ended December 31,
2016 2015 2014(In millions)
U.S. $ 739.6 $ 607.6 $ 521.5Foreign (11.4) 29.0 52.7
$ 728.2 $ 636.6 $ 574.2
The provision for income taxes reconciles with the U.S. federal statutory rate, as follows:
Twelve Months Ended December 31,
2016 2015 2014(In millions)
Federal statutory rate 35.0% 35.0% 35.0%Provision computed at federal statutory rate $254.9 $222.8 $201.0State and local taxes, net of federal tax benefit 17.2 5.2 13.1Foreign (40.3) (21.8) (7.3)Valuation allowance — — (2.2)Tax reserves 11.9 0.9 0.6Other (10.6) (5.3) (5.0)Provision for income taxes $ 233.1 $201.8 $200.2
Effective income tax rate 32.0% 31.7% 34.9%
We record deferred income taxes using enacted tax laws and rates for the years in which the taxes are expected to be paid. Deferred income tax assets and liabilities are recorded based on the differences between the financial
reporting and income tax bases of assets and liabilities. For additional information about our income tax policy, see Note 1 of the Notes to Consolidated Financial Statements.
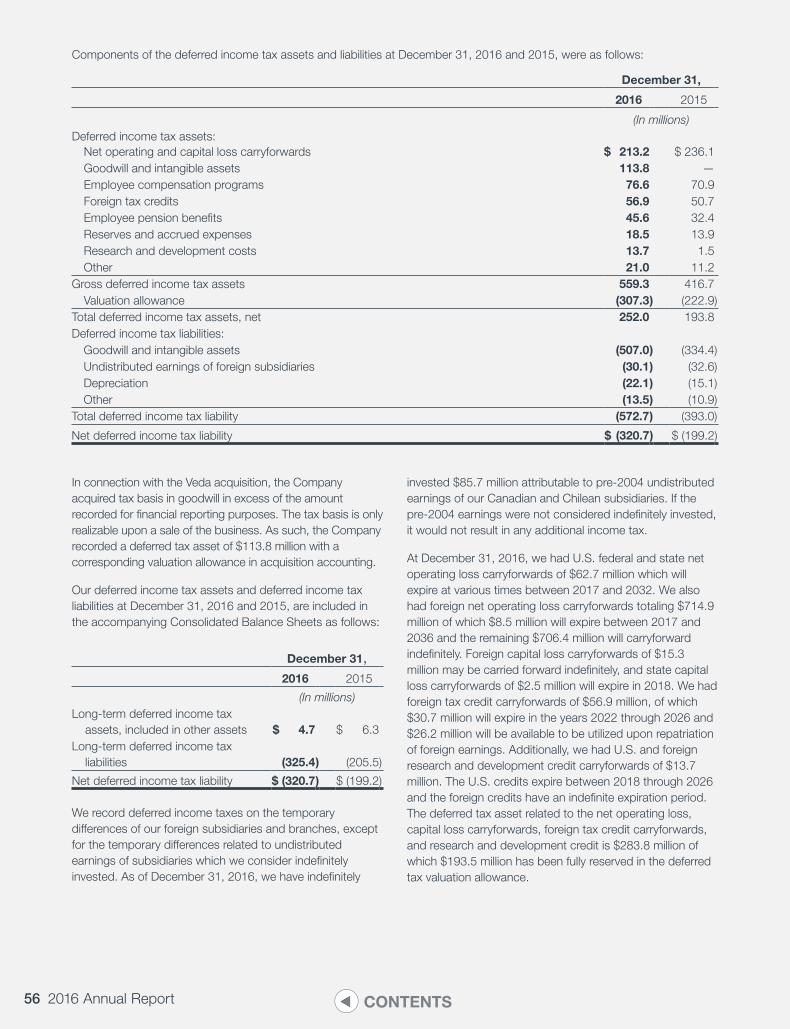
56 2016 Annual Report CONTENTS
Components of the deferred income tax assets and liabilities at December 31, 2016 and 2015, were as follows:
December 31,
2016 2015
(In millions)Deferred income tax assets: Net operating and capital loss carryforwards $ 213.2 $ 236.1 Goodwill and intangible assets 113.8 — Employee compensation programs 76.6 70.9 Foreign tax credits 56.9 50.7 Employee pension benefits 45.6 32.4 Reserves and accrued expenses 18.5 13.9 Research and development costs 13.7 1.5 Other 21.0 11.2Gross deferred income tax assets 559.3 416.7 Valuation allowance (307.3) (222.9)Total deferred income tax assets, net 252.0 193.8Deferred income tax liabilities: Goodwill and intangible assets (507.0) (334.4) Undistributed earnings of foreign subsidiaries (30.1) (32.6) Depreciation (22.1) (15.1) Other (13.5) (10.9)Total deferred income tax liability (572.7) (393.0)
Net deferred income tax liability $ (320.7) $ (199.2)
In connection with the Veda acquisition, the Company acquired tax basis in goodwill in excess of the amount recorded for financial reporting purposes. The tax basis is only realizable upon a sale of the business. As such, the Company recorded a deferred tax asset of $113.8 million with a corresponding valuation allowance in acquisition accounting.
Our deferred income tax assets and deferred income tax liabilities at December 31, 2016 and 2015, are included in the accompanying Consolidated Balance Sheets as follows:
December 31,2016 2015
(In millions)Long-term deferred income tax
assets, included in other assets $ 4.7 $ 6.3Long-term deferred income tax
liabilities (325.4) (205.5)
Net deferred income tax liability $ (320.7) $ (199.2)
We record deferred income taxes on the temporary differences of our foreign subsidiaries and branches, except for the temporary differences related to undistributed earnings of subsidiaries which we consider indefinitely invested. As of December 31, 2016, we have indefinitely
invested $85.7 million attributable to pre-2004 undistributed earnings of our Canadian and Chilean subsidiaries. If the pre-2004 earnings were not considered indefinitely invested, it would not result in any additional income tax.
At December 31, 2016, we had U.S. federal and state net operating loss carryforwards of $62.7 million which will expire at various times between 2017 and 2032. We also had foreign net operating loss carryforwards totaling $714.9 million of which $8.5 million will expire between 2017 and 2036 and the remaining $706.4 million will carryforward indefinitely. Foreign capital loss carryforwards of $15.3 million may be carried forward indefinitely, and state capital loss carryforwards of $2.5 million will expire in 2018. We had foreign tax credit carryforwards of $56.9 million, of which $30.7 million will expire in the years 2022 through 2026 and $26.2 million will be available to be utilized upon repatriation of foreign earnings. Additionally, we had U.S. and foreign research and development credit carryforwards of $13.7 million. The U.S. credits expire between 2018 through 2026 and the foreign credits have an indefinite expiration period. The deferred tax asset related to the net operating loss, capital loss carryforwards, foreign tax credit carryforwards, and research and development credit is $283.8 million of which $193.5 million has been fully reserved in the deferred tax valuation allowance.
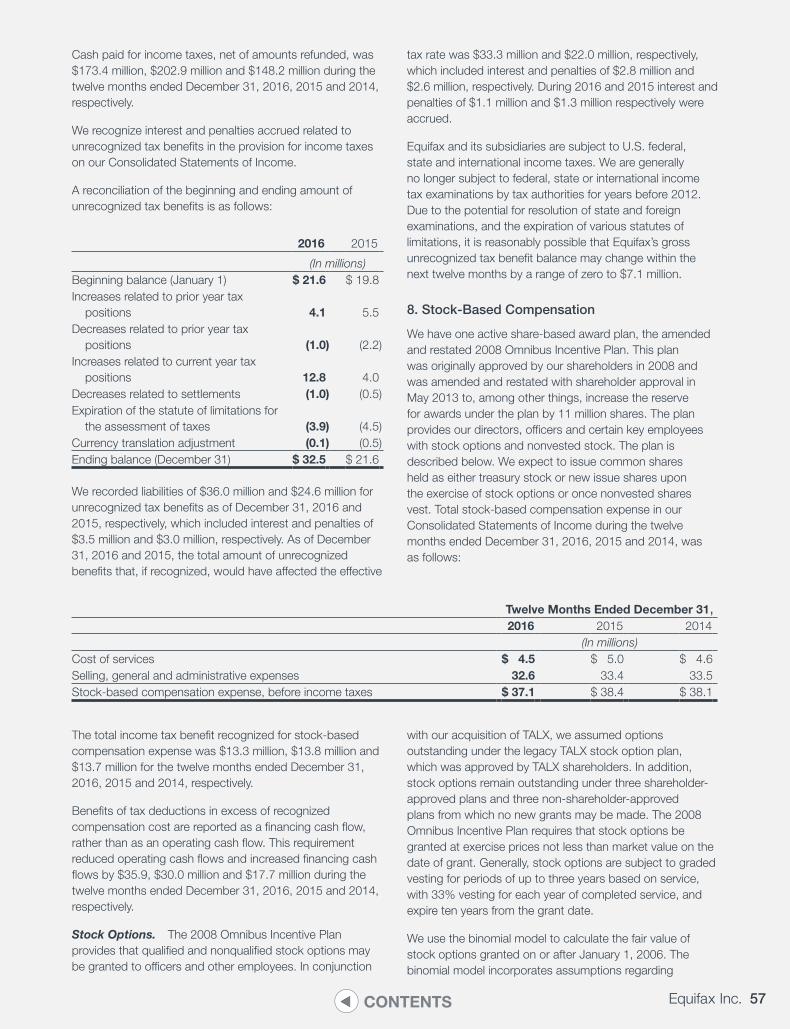
57Equifax Inc.CONTENTS
Cash paid for income taxes, net of amounts refunded, was $173.4 million, $202.9 million and $148.2 million during the twelve months ended December 31, 2016, 2015 and 2014, respectively.
We recognize interest and penalties accrued related to unrecognized tax benefits in the provision for income taxes on our Consolidated Statements of Income.
A reconciliation of the beginning and ending amount of unrecognized tax benefits is as follows:
2016 2015
(In millions)Beginning balance (January 1) $ 21.6 $ 19.8Increases related to prior year tax
positions 4.1 5.5Decreases related to prior year tax
positions (1.0) (2.2)Increases related to current year tax
positions 12.8 4.0Decreases related to settlements (1.0) (0.5)Expiration of the statute of limitations for
the assessment of taxes (3.9) (4.5)Currency translation adjustment (0.1) (0.5)Ending balance (December 31) $ 32.5 $ 21.6
We recorded liabilities of $36.0 million and $24.6 million for unrecognized tax benefits as of December 31, 2016 and 2015, respectively, which included interest and penalties of $3.5 million and $3.0 million, respectively. As of December 31, 2016 and 2015, the total amount of unrecognized benefits that, if recognized, would have affected the effective
tax rate was $33.3 million and $22.0 million, respectively, which included interest and penalties of $2.8 million and $2.6 million, respectively. During 2016 and 2015 interest and penalties of $1.1 million and $1.3 million respectively were accrued.
Equifax and its subsidiaries are subject to U.S. federal, state and international income taxes. We are generally no longer subject to federal, state or international income tax examinations by tax authorities for years before 2012. Due to the potential for resolution of state and foreign examinations, and the expiration of various statutes of limitations, it is reasonably possible that Equifax’s gross unrecognized tax benefit balance may change within the next twelve months by a range of zero to $7.1 million.
8. Stock-Based Compensation
We have one active share-based award plan, the amended and restated 2008 Omnibus Incentive Plan. This plan was originally approved by our shareholders in 2008 and was amended and restated with shareholder approval in May 2013 to, among other things, increase the reserve for awards under the plan by 11 million shares. The plan provides our directors, officers and certain key employees with stock options and nonvested stock. The plan is described below. We expect to issue common shares held as either treasury stock or new issue shares upon the exercise of stock options or once nonvested shares vest. Total stock-based compensation expense in our Consolidated Statements of Income during the twelve months ended December 31, 2016, 2015 and 2014, was as follows:
Twelve Months Ended December 31,2016 2015 2014
(In millions)Cost of services $ 4.5 $ 5.0 $ 4.6Selling, general and administrative expenses 32.6 33.4 33.5Stock-based compensation expense, before income taxes $ 37.1 $ 38.4 $ 38.1
The total income tax benefit recognized for stock-based compensation expense was $13.3 million, $13.8 million and $13.7 million for the twelve months ended December 31, 2016, 2015 and 2014, respectively.
Benefits of tax deductions in excess of recognized compensation cost are reported as a financing cash flow, rather than as an operating cash flow. This requirement reduced operating cash flows and increased financing cash flows by $35.9, $30.0 million and $17.7 million during the twelve months ended December 31, 2016, 2015 and 2014, respectively.
Stock Options. The 2008 Omnibus Incentive Plan provides that qualified and nonqualified stock options may be granted to officers and other employees. In conjunction
with our acquisition of TALX, we assumed options outstanding under the legacy TALX stock option plan, which was approved by TALX shareholders. In addition, stock options remain outstanding under three shareholder-approved plans and three non-shareholder-approved plans from which no new grants may be made. The 2008 Omnibus Incentive Plan requires that stock options be granted at exercise prices not less than market value on the date of grant. Generally, stock options are subject to graded vesting for periods of up to three years based on service, with 33% vesting for each year of completed service, and expire ten years from the grant date.
We use the binomial model to calculate the fair value of stock options granted on or after January 1, 2006. The binomial model incorporates assumptions regarding
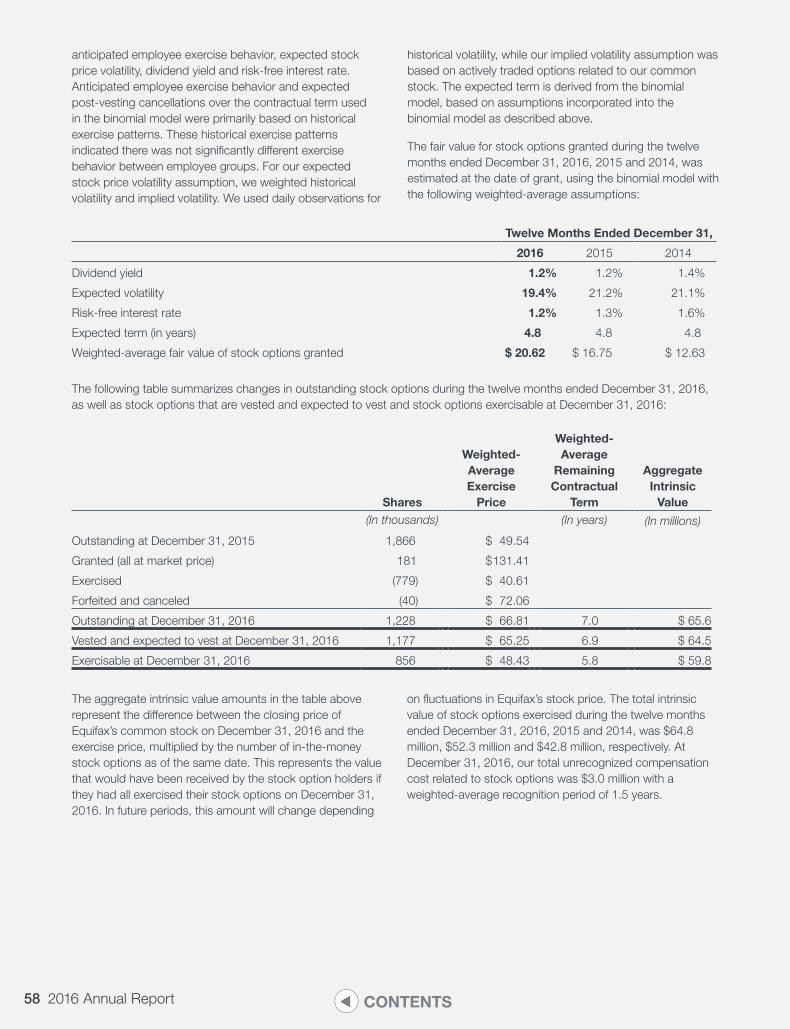
58 2016 Annual Report CONTENTS
anticipated employee exercise behavior, expected stock price volatility, dividend yield and risk-free interest rate. Anticipated employee exercise behavior and expected post-vesting cancellations over the contractual term used in the binomial model were primarily based on historical exercise patterns. These historical exercise patterns indicated there was not significantly different exercise behavior between employee groups. For our expected stock price volatility assumption, we weighted historical volatility and implied volatility. We used daily observations for
historical volatility, while our implied volatility assumption was based on actively traded options related to our common stock. The expected term is derived from the binomial model, based on assumptions incorporated into the binomial model as described above.
The fair value for stock options granted during the twelve months ended December 31, 2016, 2015 and 2014, was estimated at the date of grant, using the binomial model with the following weighted-average assumptions:
Twelve Months Ended December 31,
2016 2015 2014
Dividend yield 1.2% 1.2% 1.4%
Expected volatility 19.4% 21.2% 21.1%
Risk-free interest rate 1.2% 1.3% 1.6%
Expected term (in years) 4.8 4.8 4.8
Weighted-average fair value of stock options granted $ 20.62 $ 16.75 $ 12.63
The following table summarizes changes in outstanding stock options during the twelve months ended December 31, 2016, as well as stock options that are vested and expected to vest and stock options exercisable at December 31, 2016:
Shares
Weighted-Average Exercise
Price
Weighted- Average
Remaining Contractual
Term
Aggregate Intrinsic
Value(In thousands) (In years) (In millions)
Outstanding at December 31, 2015 1,866 $ 49.54
Granted (all at market price) 181 $ 131.41
Exercised (779) $ 40.61
Forfeited and canceled (40) $ 72.06
Outstanding at December 31, 2016 1,228 $ 66.81 7.0 $ 65.6
Vested and expected to vest at December 31, 2016 1,177 $ 65.25 6.9 $ 64.5
Exercisable at December 31, 2016 856 $ 48.43 5.8 $ 59.8
The aggregate intrinsic value amounts in the table above represent the difference between the closing price of Equifax’s common stock on December 31, 2016 and the exercise price, multiplied by the number of in-the-money stock options as of the same date. This represents the value that would have been received by the stock option holders if they had all exercised their stock options on December 31, 2016. In future periods, this amount will change depending
on fluctuations in Equifax’s stock price. The total intrinsic value of stock options exercised during the twelve months ended December 31, 2016, 2015 and 2014, was $64.8 million, $52.3 million and $42.8 million, respectively. At December 31, 2016, our total unrecognized compensation cost related to stock options was $3.0 million with a weighted-average recognition period of 1.5 years.
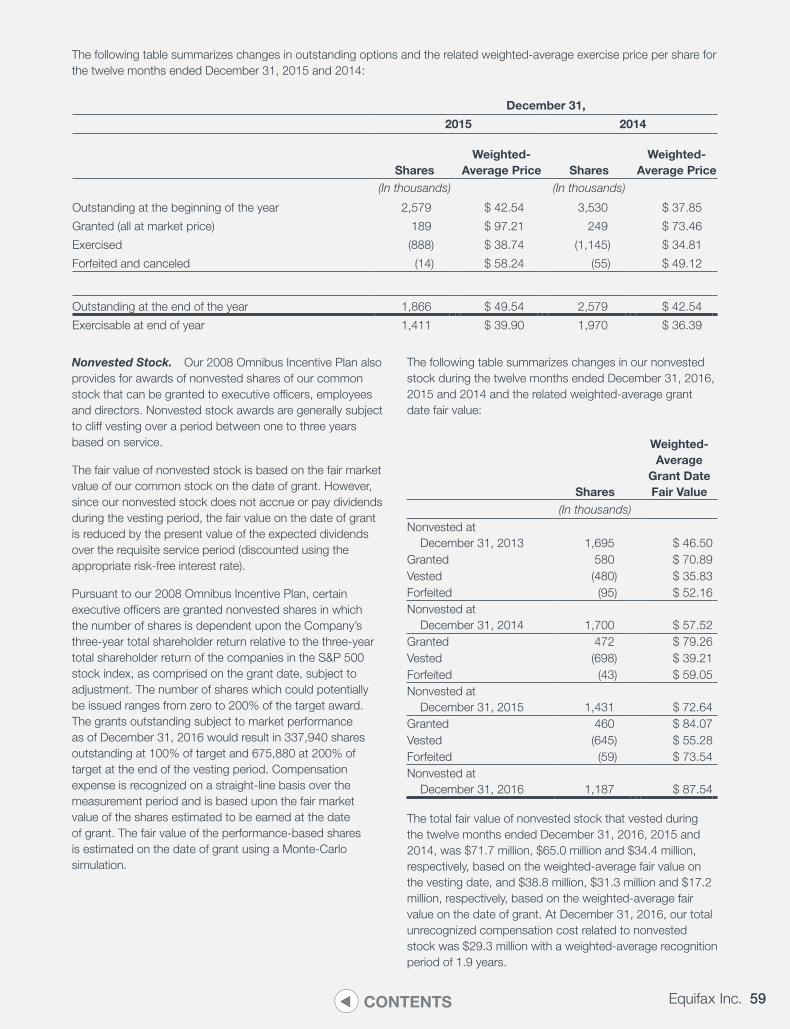
59Equifax Inc.CONTENTS
The following table summarizes changes in outstanding options and the related weighted-average exercise price per share for the twelve months ended December 31, 2015 and 2014:
December 31,
2015 2014
SharesWeighted-
Average Price SharesWeighted-
Average Price(In thousands) (In thousands)
Outstanding at the beginning of the year 2,579 $ 42.54 3,530 $ 37.85
Granted (all at market price) 189 $ 97.21 249 $ 73.46
Exercised (888) $ 38.74 (1,145) $ 34.81
Forfeited and canceled (14) $ 58.24 (55) $ 49.12
Outstanding at the end of the year 1,866 $ 49.54 2,579 $ 42.54
Exercisable at end of year 1,411 $ 39.90 1,970 $ 36.39
Nonvested Stock. Our 2008 Omnibus Incentive Plan also provides for awards of nonvested shares of our common stock that can be granted to executive officers, employees and directors. Nonvested stock awards are generally subject to cliff vesting over a period between one to three years based on service.
The fair value of nonvested stock is based on the fair market value of our common stock on the date of grant. However, since our nonvested stock does not accrue or pay dividends during the vesting period, the fair value on the date of grant is reduced by the present value of the expected dividends over the requisite service period (discounted using the appropriate risk-free interest rate).
Pursuant to our 2008 Omnibus Incentive Plan, certain executive officers are granted nonvested shares in which the number of shares is dependent upon the Company’s three-year total shareholder return relative to the three-year total shareholder return of the companies in the S&P 500 stock index, as comprised on the grant date, subject to adjustment. The number of shares which could potentially be issued ranges from zero to 200% of the target award. The grants outstanding subject to market performance as of December 31, 2016 would result in 337,940 shares outstanding at 100% of target and 675,880 at 200% of target at the end of the vesting period. Compensation expense is recognized on a straight-line basis over the measurement period and is based upon the fair market value of the shares estimated to be earned at the date of grant. The fair value of the performance-based shares is estimated on the date of grant using a Monte-Carlo simulation.
The following table summarizes changes in our nonvested stock during the twelve months ended December 31, 2016, 2015 and 2014 and the related weighted-average grant date fair value:
Shares
Weighted-Average
Grant Date Fair Value
(In thousands)
Nonvested at December 31, 2013 1,695 $ 46.50
Granted 580 $ 70.89Vested (480) $ 35.83Forfeited (95) $ 52.16Nonvested at
December 31, 2014 1,700 $ 57.52Granted 472 $ 79.26Vested (698) $ 39.21Forfeited (43) $ 59.05Nonvested at
December 31, 2015 1,431 $ 72.64Granted 460 $ 84.07Vested (645) $ 55.28Forfeited (59) $ 73.54Nonvested at
December 31, 2016 1,187 $ 87.54
The total fair value of nonvested stock that vested during the twelve months ended December 31, 2016, 2015 and 2014, was $71.7 million, $65.0 million and $34.4 million, respectively, based on the weighted-average fair value on the vesting date, and $38.8 million, $31.3 million and $17.2 million, respectively, based on the weighted-average fair value on the date of grant. At December 31, 2016, our total unrecognized compensation cost related to nonvested stock was $29.3 million with a weighted-average recognition period of 1.9 years.
60 2016 Annual Report CONTENTS
9. Shareholder Rights Plan
The Company’s Board of Directors terminated the previously adopted shareholder rights plan (sometimes referred to as a ‘poison pill’) effective February 19, 2015.
10. Benefit Plans
We have defined benefit pension plans and defined contribution plans. We also maintain certain healthcare and life insurance benefit plans for eligible retired employees. The measurement date for our defined benefit pension plans and other postretirement benefit plans is December 31 of each year.
Pension Benefits. Pension benefits are provided through U.S. and Canadian defined benefit pension plans and two supplemental executive defined benefit pension plans.
U.S. and Canadian Retirement Plans. We sponsor a qualified defined benefit retirement plan (the U.S. Retirement Income Plan, or USRIP) that covers approximately 15% of current U.S. salaried employees who were hired on or before June 30, 2007, the last date on which an individual could be hired and enter the plan before the USRIP was frozen to new participation at December 31, 2008. This plan also covers many retirees as well as certain terminated but vested individuals not yet in retirement status. We also sponsor a defined benefit plan that covers most salaried and hourly employees in Canada (the Canadian Retirement Income Plan, or CRIP), also frozen to new hires on October 1, 2011.
During 2016, we adopted the new MP-2016 mortality scale in determining the liability for the U.S. pension plan. This updated scale partially offset the decrease in the discount rate in 2016, the net of which resulted in the increase in the projected benefit obligation as of December 31, 2016.
During 2015, we adopted the new generational projection scale with MP-2015 in determining the liability for the U.S. pension plan. This updated scale, along with the change in the discount rate, contributed to the decrease in the projected benefit obligation as of December 31, 2015.
During 2014, we adopted the new RP-2014 mortality tables and generational projection scale with MP-2014 in determining the liability for USRIP. This new table, along with the change in the discount rate, contributed to the increase in the projected benefit obligation as of December 31, 2014.
In September 2014, an amendment to the USRIP was approved, which froze future salary increases and service accruals for grandfathered participants and provided a one-time 9% increase to the accrued benefit as determined on December 31, 2014. This amendment did not have a material impact on our pension expense for 2014.
On September 14, 2011, the Compensation Committee of the Board of Directors approved a redesign of our retirement plans for our currently active Canadian employees, effective January 1, 2013, and for our new hires hired on or after October 1, 2011. The changes to our retirement plan froze the Canadian Retirement Income Plan, or CRIP, a registered defined benefit pension plan, for employees who did not meet retirement-eligibility status under the CRIP as of December 31, 2012 (“Non-Grandfathered” participants). Under the plan amendment, the service credit for Non-Grandfathered participants froze, but these participants will continue to receive credit for salary increases and vesting service. Additionally, Non-Grandfathered employees and certain other employees not eligible to participate in the CRIP (i.e., new hires on or after October 1, 2011) are eligible to participate in the enhanced defined contribution component of the CRIP.
During the twelve months ended December 31, 2016, we did not make any contributions to the USRIP and made contributions of $0.8 million to the CRIP. During the twelve months ended December 31, 2015, we did not make any contributions to the USRIP and made contributions of $0.2 million to the CRIP. At December 31, 2016, the USRIP met or exceeded ERISA’s minimum funding requirements.
The annual report produced by our consulting actuaries specifies the funding requirements for our plans, based on projected benefits for plan participants, historical investment results on plan assets, current discount rates for liabilities, assumptions for future demographic developments and recent changes in statutory requirements. We may elect to make additional discretionary contributions to our plans in excess of minimum funding requirements, subject to statutory limitations.
Supplemental Retirement Plans. We maintain two supplemental executive retirement programs for certain key employees. The plans, which are unfunded, provide supplemental retirement payments, based on salary and years of service.
Other Benefits. We maintain certain healthcare and life insurance benefit plans for eligible retired employees. Substantially all of our U.S. employees may become eligible for the retiree healthcare benefits if they reach retirement age while working for us and satisfy certain years of service requirements. The retiree life insurance program covers employees who retired on or before December 31, 2003. We accrue the cost of providing healthcare benefits over the active service period of the employee.
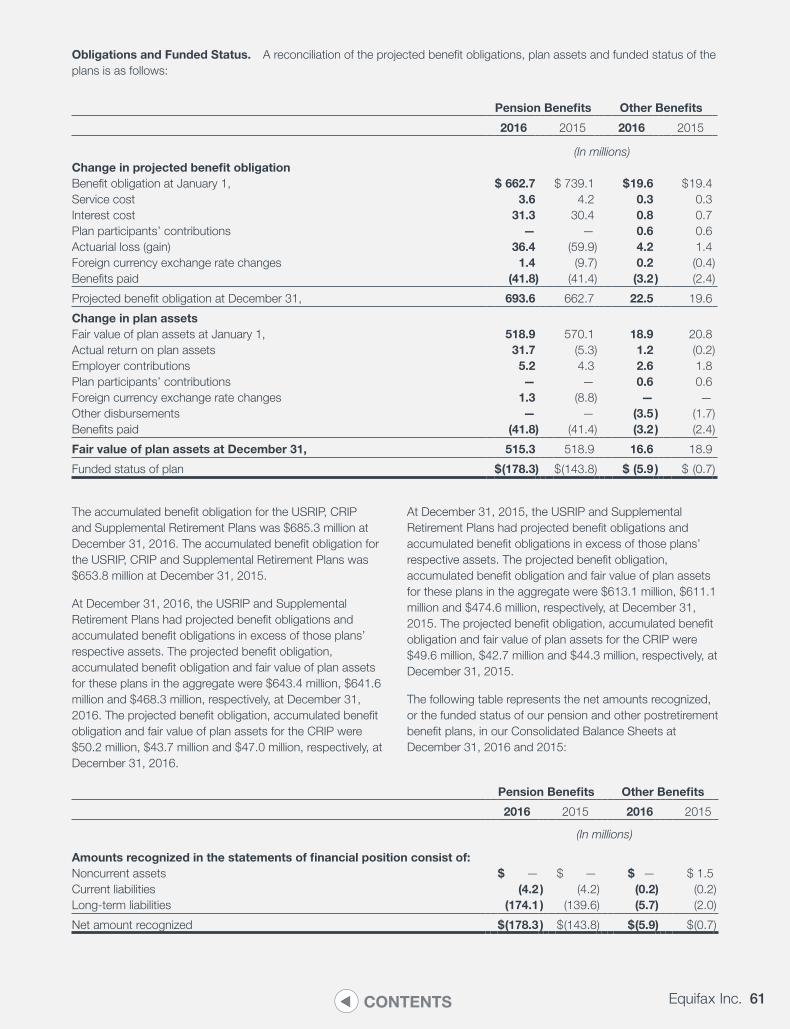
61Equifax Inc.CONTENTS
Obligations and Funded Status. A reconciliation of the projected benefit obligations, plan assets and funded status of the plans is as follows:
Pension Benefits Other Benefits
2016 2015 2016 2015
(In millions)Change in projected benefit obligationBenefit obligation at January 1, $ 662.7 $ 739.1 $ 19.6 $ 19.4Service cost 3.6 4.2 0.3 0.3Interest cost 31.3 30.4 0.8 0.7Plan participants’ contributions — — 0.6 0.6Actuarial loss (gain) 36.4 (59.9) 4.2 1.4Foreign currency exchange rate changes 1.4 (9.7) 0.2 (0.4)Benefits paid (41.8) (41.4) (3.2 ) (2.4)
Projected benefit obligation at December 31, 693.6 662.7 22.5 19.6
Change in plan assetsFair value of plan assets at January 1, 518.9 570.1 18.9 20.8Actual return on plan assets 31.7 (5.3) 1.2 (0.2)Employer contributions 5.2 4.3 2.6 1.8Plan participants’ contributions — — 0.6 0.6Foreign currency exchange rate changes 1.3 (8.8) — —Other disbursements — — (3.5 ) (1.7)Benefits paid (41.8) (41.4) (3.2 ) (2.4)
Fair value of plan assets at December 31, 515.3 518.9 16.6 18.9
Funded status of plan $ (178.3) $ (143.8) $ (5.9 ) $ (0.7)
The accumulated benefit obligation for the USRIP, CRIP and Supplemental Retirement Plans was $685.3 million at December 31, 2016. The accumulated benefit obligation for the USRIP, CRIP and Supplemental Retirement Plans was $653.8 million at December 31, 2015.
At December 31, 2016, the USRIP and Supplemental Retirement Plans had projected benefit obligations and accumulated benefit obligations in excess of those plans’ respective assets. The projected benefit obligation, accumulated benefit obligation and fair value of plan assets for these plans in the aggregate were $643.4 million, $641.6 million and $468.3 million, respectively, at December 31, 2016. The projected benefit obligation, accumulated benefit obligation and fair value of plan assets for the CRIP were $50.2 million, $43.7 million and $47.0 million, respectively, at December 31, 2016.
At December 31, 2015, the USRIP and Supplemental Retirement Plans had projected benefit obligations and accumulated benefit obligations in excess of those plans’ respective assets. The projected benefit obligation, accumulated benefit obligation and fair value of plan assets for these plans in the aggregate were $613.1 million, $611.1 million and $474.6 million, respectively, at December 31, 2015. The projected benefit obligation, accumulated benefit obligation and fair value of plan assets for the CRIP were $49.6 million, $42.7 million and $44.3 million, respectively, at December 31, 2015.
The following table represents the net amounts recognized, or the funded status of our pension and other postretirement benefit plans, in our Consolidated Balance Sheets at December 31, 2016 and 2015:
Pension Benefits Other Benefits
2016 2015 2016 2015
(In millions)
Amounts recognized in the statements of financial position consist of:Noncurrent assets $ — $ — $ — $ 1.5Current liabilities (4.2 ) (4.2) (0.2) (0.2)Long-term liabilities (174.1 ) (139.6) (5.7) (2.0)
Net amount recognized $ (178.3 ) $ (143.8) $ (5.9) $ (0.7)
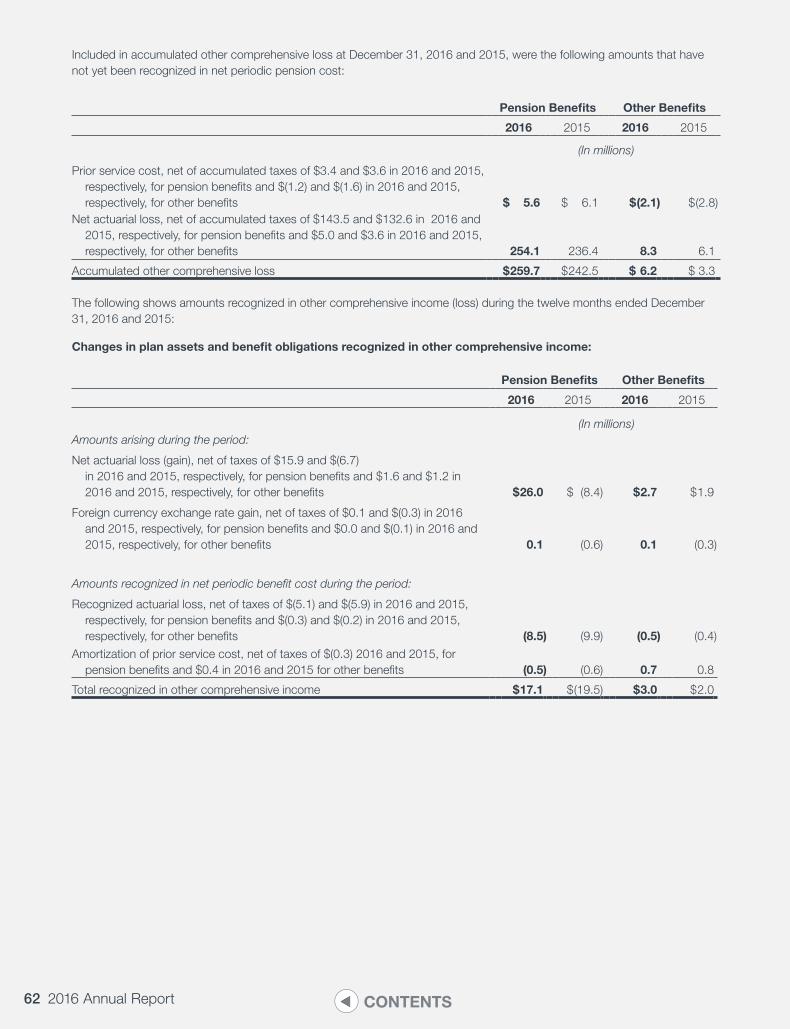
62 2016 Annual Report CONTENTS
Included in accumulated other comprehensive loss at December 31, 2016 and 2015, were the following amounts that have not yet been recognized in net periodic pension cost:
Pension Benefits Other Benefits
2016 2015 2016 2015
(In millions)
Prior service cost, net of accumulated taxes of $3.4 and $3.6 in 2016 and 2015, respectively, for pension benefits and $(1.2) and $(1.6) in 2016 and 2015, respectively, for other benefits $ 5.6 $ 6.1 $ (2.1) $ (2.8)
Net actuarial loss, net of accumulated taxes of $143.5 and $132.6 in 2016 and 2015, respectively, for pension benefits and $5.0 and $3.6 in 2016 and 2015, respectively, for other benefits 254.1 236.4 8.3 6.1
Accumulated other comprehensive loss $ 259.7 $ 242.5 $ 6.2 $ 3.3
The following shows amounts recognized in other comprehensive income (loss) during the twelve months ended December 31, 2016 and 2015:
Changes in plan assets and benefit obligations recognized in other comprehensive income:
Pension Benefits Other Benefits
2016 2015 2016 2015
(In millions)Amounts arising during the period:
Net actuarial loss (gain), net of taxes of $15.9 and $(6.7) in 2016 and 2015, respectively, for pension benefits and $1.6 and $1.2 in 2016 and 2015, respectively, for other benefits $ 26.0 $ (8.4) $ 2.7 $ 1.9
Foreign currency exchange rate gain, net of taxes of $0.1 and $(0.3) in 2016 and 2015, respectively, for pension benefits and $0.0 and $(0.1) in 2016 and 2015, respectively, for other benefits 0.1 (0.6) 0.1 (0.3)
Amounts recognized in net periodic benefit cost during the period:
Recognized actuarial loss, net of taxes of $(5.1) and $(5.9) in 2016 and 2015, respectively, for pension benefits and $(0.3) and $(0.2) in 2016 and 2015, respectively, for other benefits (8.5) (9.9) (0.5) (0.4)
Amortization of prior service cost, net of taxes of $(0.3) 2016 and 2015, for pension benefits and $0.4 in 2016 and 2015 for other benefits (0.5) (0.6) 0.7 0.8
Total recognized in other comprehensive income $ 17.1 $ (19.5) $ 3.0 $ 2.0
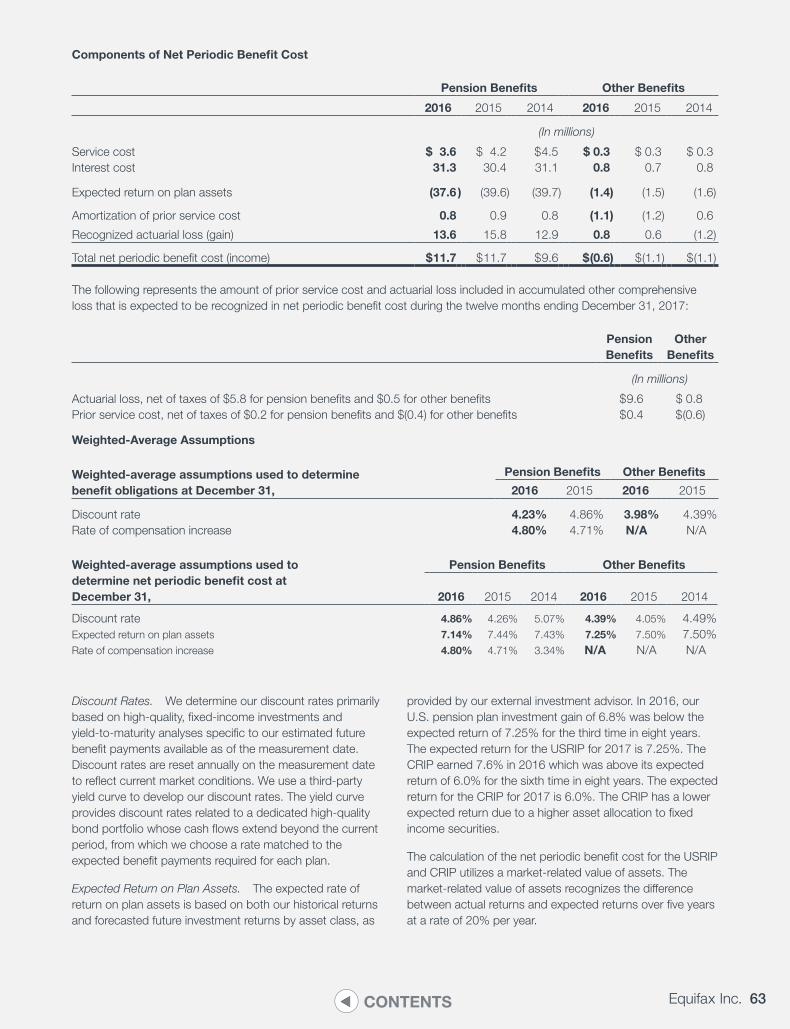
63Equifax Inc.CONTENTS
Components of Net Periodic Benefit Cost
Pension Benefits Other Benefits
2016 2015 2014 2016 2015 2014
(In millions)
Service cost $ 3.6 $ 4.2 $ 4.5 $ 0.3 $ 0.3 $ 0.3Interest cost 31.3 30.4 31.1 0.8 0.7 0.8
Expected return on plan assets (37.6 ) (39.6) (39.7) (1.4) (1.5) (1.6)
Amortization of prior service cost 0.8 0.9 0.8 (1.1) (1.2) 0.6
Recognized actuarial loss (gain) 13.6 15.8 12.9 0.8 0.6 (1.2)
Total net periodic benefit cost (income) $ 11.7 $ 11.7 $ 9.6 $ (0.6) $ (1.1) $ (1.1)
The following represents the amount of prior service cost and actuarial loss included in accumulated other comprehensive loss that is expected to be recognized in net periodic benefit cost during the twelve months ending December 31, 2017:
Pension Benefits
Other Benefits
(In millions)
Actuarial loss, net of taxes of $5.8 for pension benefits and $0.5 for other benefits $ 9.6 $ 0.8Prior service cost, net of taxes of $0.2 for pension benefits and $(0.4) for other benefits $ 0.4 $ (0.6)
Weighted-Average Assumptions
Weighted-average assumptions used to determine benefit obligations at December 31,
Pension Benefits Other Benefits
2016 2015 2016 2015
Discount rate 4.23% 4.86% 3.98% 4.39%Rate of compensation increase 4.80% 4.71% N/A N/A
Weighted-average assumptions used to determine net periodic benefit cost at December 31,
Pension Benefits Other Benefits
2016 2015 2014 2016 2015 2014
Discount rate 4.86% 4.26% 5.07% 4.39% 4.05% 4.49%Expected return on plan assets 7.14% 7.44% 7.43% 7.25% 7.50% 7.50%Rate of compensation increase 4.80% 4.71% 3.34% N/A N/A N/A
Discount Rates. We determine our discount rates primarily based on high-quality, fixed-income investments and yield-to-maturity analyses specific to our estimated future benefit payments available as of the measurement date. Discount rates are reset annually on the measurement date to reflect current market conditions. We use a third-party yield curve to develop our discount rates. The yield curve provides discount rates related to a dedicated high-quality bond portfolio whose cash flows extend beyond the current period, from which we choose a rate matched to the expected benefit payments required for each plan.
Expected Return on Plan Assets. The expected rate of return on plan assets is based on both our historical returns and forecasted future investment returns by asset class, as
provided by our external investment advisor. In 2016, our U.S. pension plan investment gain of 6.8% was below the expected return of 7.25% for the third time in eight years. The expected return for the USRIP for 2017 is 7.25%. The CRIP earned 7.6% in 2016 which was above its expected return of 6.0% for the sixth time in eight years. The expected return for the CRIP for 2017 is 6.0%. The CRIP has a lower expected return due to a higher asset allocation to fixed income securities.
The calculation of the net periodic benefit cost for the USRIP and CRIP utilizes a market-related value of assets. The market-related value of assets recognizes the difference between actual returns and expected returns over five years at a rate of 20% per year.
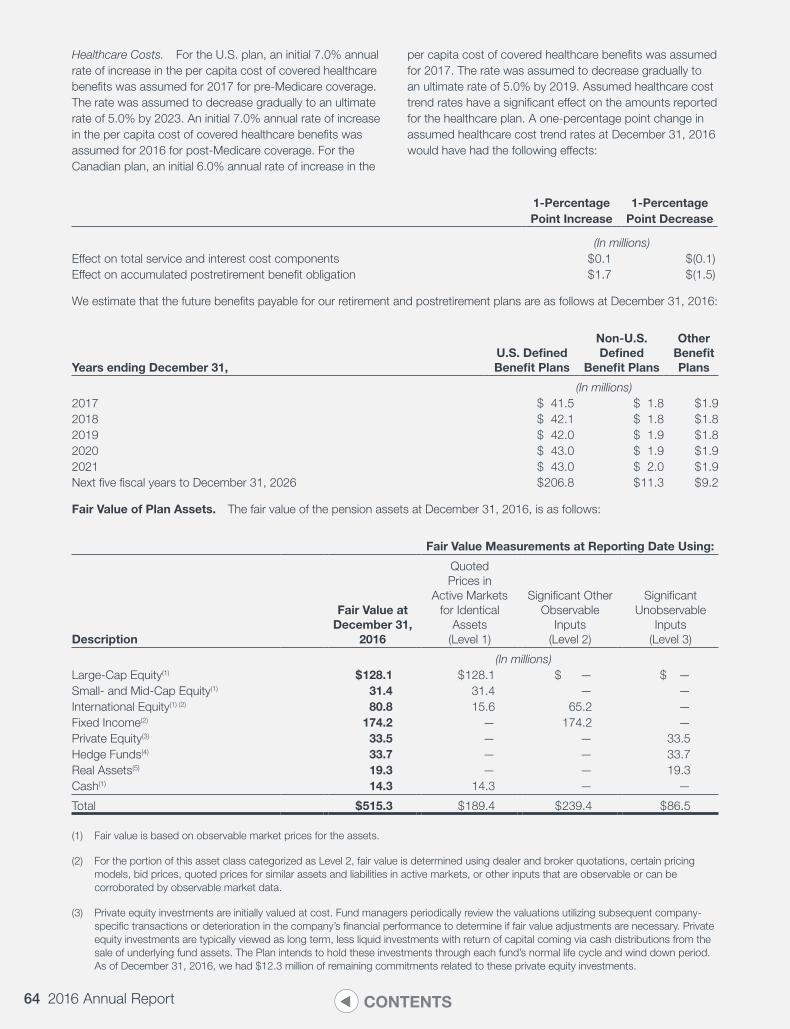
64 2016 Annual Report CONTENTS
Healthcare Costs. For the U.S. plan, an initial 7.0% annual rate of increase in the per capita cost of covered healthcare benefits was assumed for 2017 for pre-Medicare coverage. The rate was assumed to decrease gradually to an ultimate rate of 5.0% by 2023. An initial 7.0% annual rate of increase in the per capita cost of covered healthcare benefits was assumed for 2016 for post-Medicare coverage. For the Canadian plan, an initial 6.0% annual rate of increase in the
per capita cost of covered healthcare benefits was assumed for 2017. The rate was assumed to decrease gradually to an ultimate rate of 5.0% by 2019. Assumed healthcare cost trend rates have a significant effect on the amounts reported for the healthcare plan. A one-percentage point change in assumed healthcare cost trend rates at December 31, 2016 would have had the following effects:
1-Percentage Point Increase
1-Percentage Point Decrease
(In millions)Effect on total service and interest cost components $ 0.1 $ (0.1)Effect on accumulated postretirement benefit obligation $ 1.7 $ (1.5)
We estimate that the future benefits payable for our retirement and postretirement plans are as follows at December 31, 2016:
Years ending December 31,U.S. Defined Benefit Plans
Non-U.S. Defined
Benefit Plans
Other Benefit Plans
(In millions)2017 $ 41.5 $ 1.8 $ 1.92018 $ 42.1 $ 1.8 $ 1.82019 $ 42.0 $ 1.9 $ 1.82020 $ 43.0 $ 1.9 $ 1.92021 $ 43.0 $ 2.0 $ 1.9Next five fiscal years to December 31, 2026 $ 206.8 $ 11.3 $ 9.2
Fair Value of Plan Assets. The fair value of the pension assets at December 31, 2016, is as follows:
Fair Value Measurements at Reporting Date Using:
Description
Fair Value at December 31,
2016
Quoted Prices in
Active Markets for Identical
Assets (Level 1)
Significant Other Observable
Inputs (Level 2)
Significant Unobservable
Inputs (Level 3)
(In millions)Large-Cap Equity(1) $ 128.1 $ 128.1 $ — $ —Small- and Mid-Cap Equity(1) 31.4 31.4 — —International Equity(1) (2) 80.8 15.6 65.2 —Fixed Income(2) 174.2 — 174.2 —Private Equity(3) 33.5 — — 33.5Hedge Funds(4) 33.7 — — 33.7Real Assets(5) 19.3 — — 19.3Cash(1) 14.3 14.3 — —
Total $ 515.3 $ 189.4 $ 239.4 $ 86.5
(1) Fair value is based on observable market prices for the assets.
(2) For the portion of this asset class categorized as Level 2, fair value is determined using dealer and broker quotations, certain pricing models, bid prices, quoted prices for similar assets and liabilities in active markets, or other inputs that are observable or can be corroborated by observable market data.
(3) Private equity investments are initially valued at cost. Fund managers periodically review the valuations utilizing subsequent company-specific transactions or deterioration in the company’s financial performance to determine if fair value adjustments are necessary. Private equity investments are typically viewed as long term, less liquid investments with return of capital coming via cash distributions from the sale of underlying fund assets. The Plan intends to hold these investments through each fund’s normal life cycle and wind down period. As of December 31, 2016, we had $12.3 million of remaining commitments related to these private equity investments.
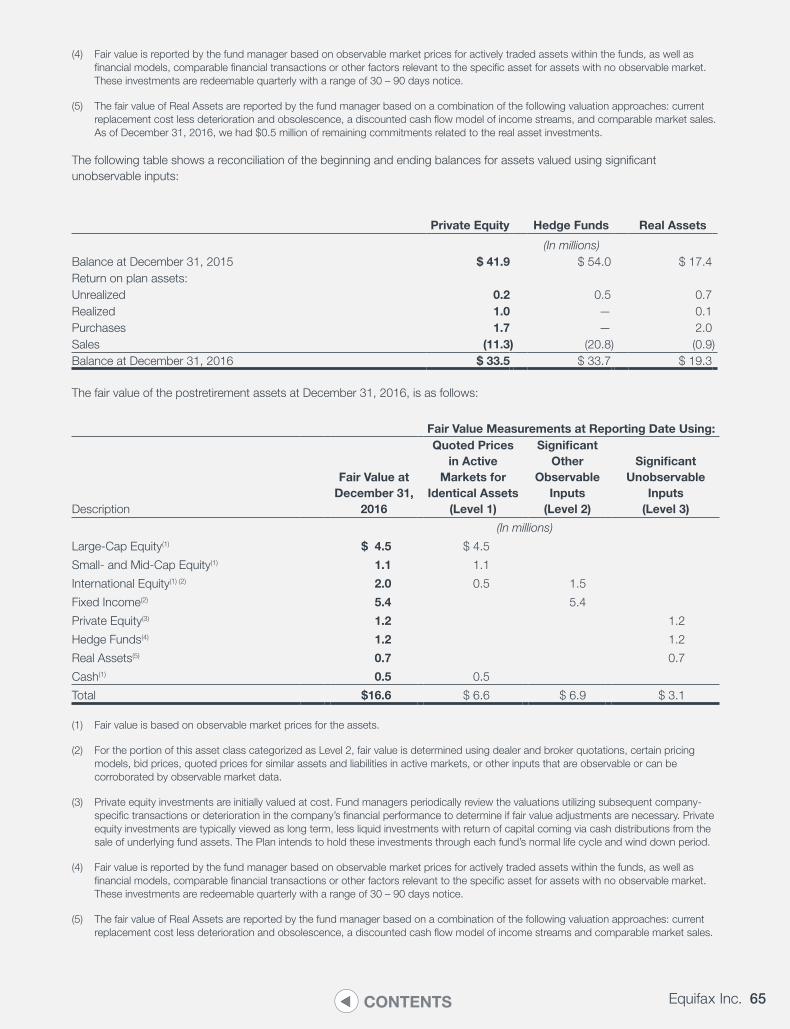
65Equifax Inc.CONTENTS
(4) Fair value is reported by the fund manager based on observable market prices for actively traded assets within the funds, as well as financial models, comparable financial transactions or other factors relevant to the specific asset for assets with no observable market. These investments are redeemable quarterly with a range of 30 – 90 days notice.
(5) The fair value of Real Assets are reported by the fund manager based on a combination of the following valuation approaches: current replacement cost less deterioration and obsolescence, a discounted cash flow model of income streams, and comparable market sales. As of December 31, 2016, we had $0.5 million of remaining commitments related to the real asset investments.
The following table shows a reconciliation of the beginning and ending balances for assets valued using significant unobservable inputs:
Private Equity Hedge Funds Real Assets
(In millions)Balance at December 31, 2015 $ 41.9 $ 54.0 $ 17.4Return on plan assets:Unrealized 0.2 0.5 0.7Realized 1.0 — 0.1Purchases 1.7 — 2.0Sales (11.3) (20.8) (0.9)Balance at December 31, 2016 $ 33.5 $ 33.7 $ 19.3
The fair value of the postretirement assets at December 31, 2016, is as follows:
Fair Value Measurements at Reporting Date Using:
Description
Fair Value at December 31,
2016
Quoted Prices in Active
Markets for Identical Assets
(Level 1)
Significant Other
Observable Inputs
(Level 2)
Significant Unobservable
Inputs (Level 3)
(In millions)
Large-Cap Equity(1) $ 4.5 $ 4.5
Small- and Mid-Cap Equity(1) 1.1 1.1
International Equity(1) (2) 2.0 0.5 1.5
Fixed Income(2) 5.4 5.4
Private Equity(3) 1.2 1.2
Hedge Funds(4) 1.2 1.2
Real Assets(5) 0.7 0.7
Cash(1) 0.5 0.5
Total $16.6 $ 6.6 $ 6.9 $ 3.1
(1) Fair value is based on observable market prices for the assets.
(2) For the portion of this asset class categorized as Level 2, fair value is determined using dealer and broker quotations, certain pricing models, bid prices, quoted prices for similar assets and liabilities in active markets, or other inputs that are observable or can be corroborated by observable market data.
(3) Private equity investments are initially valued at cost. Fund managers periodically review the valuations utilizing subsequent company-specific transactions or deterioration in the company’s financial performance to determine if fair value adjustments are necessary. Private equity investments are typically viewed as long term, less liquid investments with return of capital coming via cash distributions from the sale of underlying fund assets. The Plan intends to hold these investments through each fund’s normal life cycle and wind down period.
(4) Fair value is reported by the fund manager based on observable market prices for actively traded assets within the funds, as well as financial models, comparable financial transactions or other factors relevant to the specific asset for assets with no observable market. These investments are redeemable quarterly with a range of 30 – 90 days notice.
(5) The fair value of Real Assets are reported by the fund manager based on a combination of the following valuation approaches: current replacement cost less deterioration and obsolescence, a discounted cash flow model of income streams and comparable market sales.
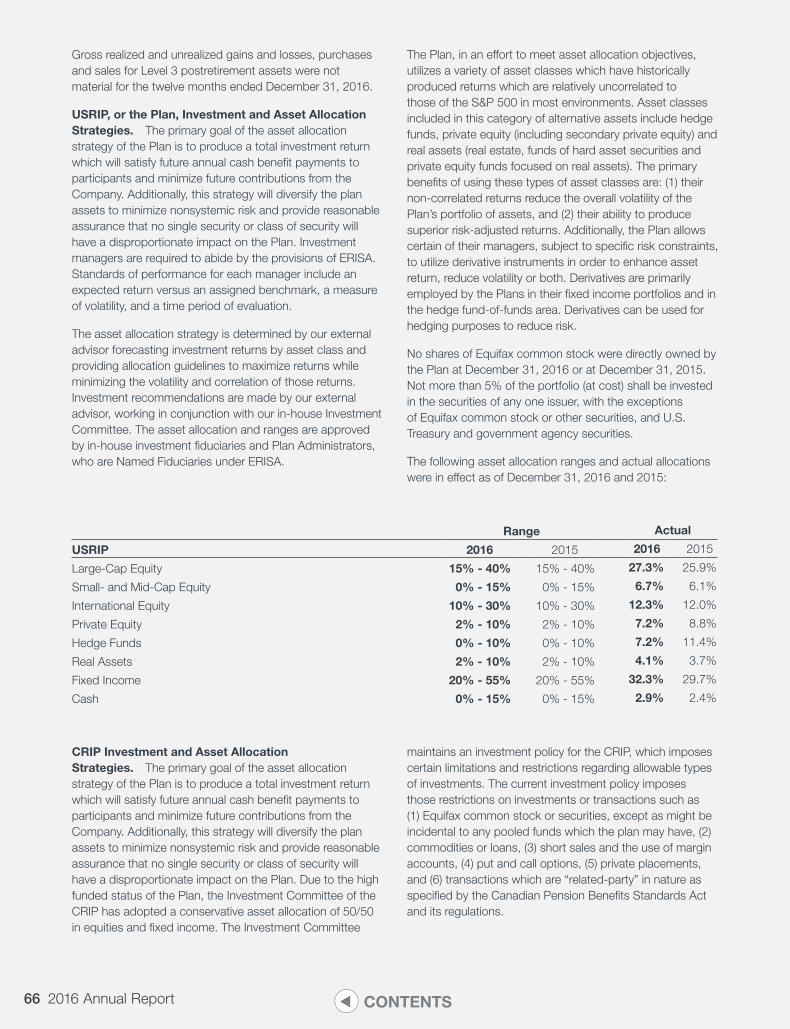
66 2016 Annual Report CONTENTS
Gross realized and unrealized gains and losses, purchases and sales for Level 3 postretirement assets were not material for the twelve months ended December 31, 2016.
USRIP, or the Plan, Investment and Asset Allocation Strategies. The primary goal of the asset allocation strategy of the Plan is to produce a total investment return which will satisfy future annual cash benefit payments to participants and minimize future contributions from the Company. Additionally, this strategy will diversify the plan assets to minimize nonsystemic risk and provide reasonable assurance that no single security or class of security will have a disproportionate impact on the Plan. Investment managers are required to abide by the provisions of ERISA. Standards of performance for each manager include an expected return versus an assigned benchmark, a measure of volatility, and a time period of evaluation.
The asset allocation strategy is determined by our external advisor forecasting investment returns by asset class and providing allocation guidelines to maximize returns while minimizing the volatility and correlation of those returns. Investment recommendations are made by our external advisor, working in conjunction with our in-house Investment Committee. The asset allocation and ranges are approved by in-house investment fiduciaries and Plan Administrators, who are Named Fiduciaries under ERISA.
The Plan, in an effort to meet asset allocation objectives, utilizes a variety of asset classes which have historically produced returns which are relatively uncorrelated to those of the S&P 500 in most environments. Asset classes included in this category of alternative assets include hedge funds, private equity (including secondary private equity) and real assets (real estate, funds of hard asset securities and private equity funds focused on real assets). The primary benefits of using these types of asset classes are: (1) their non-correlated returns reduce the overall volatility of the Plan’s portfolio of assets, and (2) their ability to produce superior risk-adjusted returns. Additionally, the Plan allows certain of their managers, subject to specific risk constraints, to utilize derivative instruments in order to enhance asset return, reduce volatility or both. Derivatives are primarily employed by the Plans in their fixed income portfolios and in the hedge fund-of-funds area. Derivatives can be used for hedging purposes to reduce risk.
No shares of Equifax common stock were directly owned by the Plan at December 31, 2016 or at December 31, 2015. Not more than 5% of the portfolio (at cost) shall be invested in the securities of any one issuer, with the exceptions of Equifax common stock or other securities, and U.S. Treasury and government agency securities.
The following asset allocation ranges and actual allocations were in effect as of December 31, 2016 and 2015:
Range Actual
USRIP 2016 2015 2016 2015
Large-Cap Equity 15% - 40% 15% - 40% 27.3% 25.9%
Small- and Mid-Cap Equity 0% - 15% 0% - 15% 6.7% 6.1%
International Equity 10% - 30% 10% - 30% 12.3% 12.0%
Private Equity 2% - 10% 2% - 10% 7.2% 8.8%
Hedge Funds 0% - 10% 0% - 10% 7.2% 11.4%
Real Assets 2% - 10% 2% - 10% 4.1% 3.7%
Fixed Income 20% - 55% 20% - 55% 32.3% 29.7%
Cash 0% - 15% 0% - 15% 2.9% 2.4%
CRIP Investment and Asset Allocation Strategies. The primary goal of the asset allocation strategy of the Plan is to produce a total investment return which will satisfy future annual cash benefit payments to participants and minimize future contributions from the Company. Additionally, this strategy will diversify the plan assets to minimize nonsystemic risk and provide reasonable assurance that no single security or class of security will have a disproportionate impact on the Plan. Due to the high funded status of the Plan, the Investment Committee of the CRIP has adopted a conservative asset allocation of 50/50 in equities and fixed income. The Investment Committee
maintains an investment policy for the CRIP, which imposes certain limitations and restrictions regarding allowable types of investments. The current investment policy imposes those restrictions on investments or transactions such as (1) Equifax common stock or securities, except as might be incidental to any pooled funds which the plan may have, (2) commodities or loans, (3) short sales and the use of margin accounts, (4) put and call options, (5) private placements, and (6) transactions which are “related-party” in nature as specified by the Canadian Pension Benefits Standards Act and its regulations.
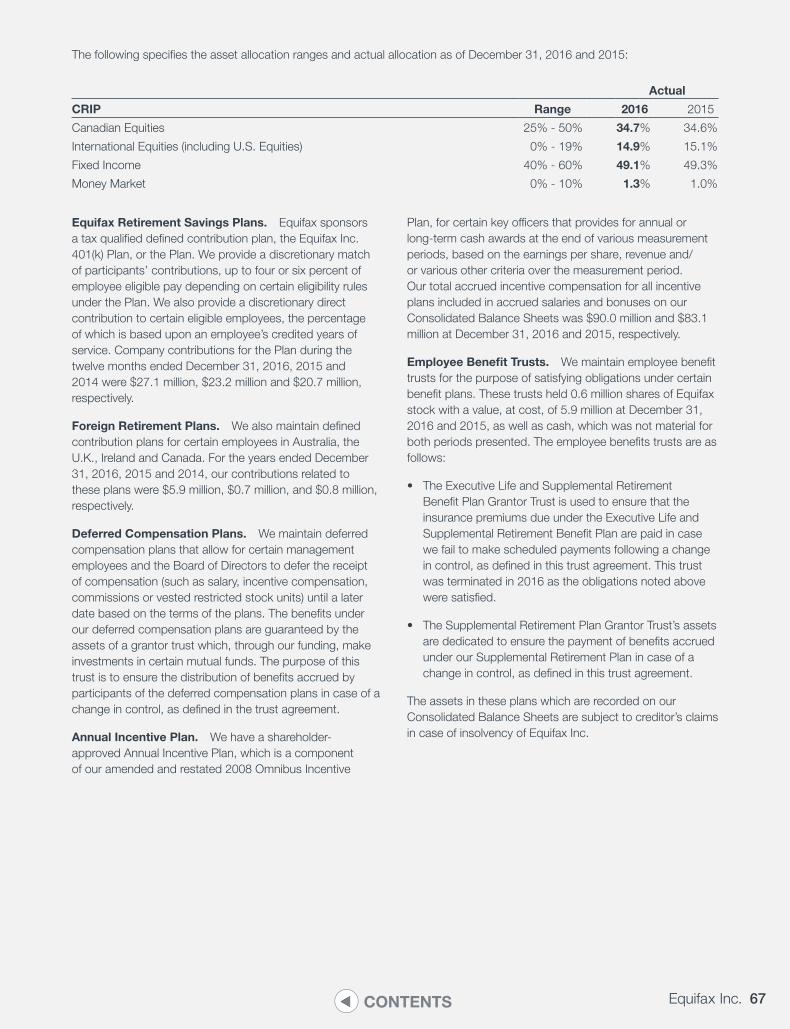
67Equifax Inc.CONTENTS
The following specifies the asset allocation ranges and actual allocation as of December 31, 2016 and 2015:
Actual
CRIP Range 2016 2015
Canadian Equities 25% - 50% 34.7% 34.6%
International Equities (including U.S. Equities) 0% - 19% 14.9% 15.1%
Fixed Income 40% - 60% 49.1% 49.3%
Money Market 0% - 10% 1.3% 1.0%
Equifax Retirement Savings Plans. Equifax sponsors a tax qualified defined contribution plan, the Equifax Inc. 401(k) Plan, or the Plan. We provide a discretionary match of participants’ contributions, up to four or six percent of employee eligible pay depending on certain eligibility rules under the Plan. We also provide a discretionary direct contribution to certain eligible employees, the percentage of which is based upon an employee’s credited years of service. Company contributions for the Plan during the twelve months ended December 31, 2016, 2015 and 2014 were $27.1 million, $23.2 million and $20.7 million, respectively.
Foreign Retirement Plans. We also maintain defined contribution plans for certain employees in Australia, the U.K., Ireland and Canada. For the years ended December 31, 2016, 2015 and 2014, our contributions related to these plans were $5.9 million, $0.7 million, and $0.8 million, respectively.
Deferred Compensation Plans. We maintain deferred compensation plans that allow for certain management employees and the Board of Directors to defer the receipt of compensation (such as salary, incentive compensation, commissions or vested restricted stock units) until a later date based on the terms of the plans. The benefits under our deferred compensation plans are guaranteed by the assets of a grantor trust which, through our funding, make investments in certain mutual funds. The purpose of this trust is to ensure the distribution of benefits accrued by participants of the deferred compensation plans in case of a change in control, as defined in the trust agreement.
Annual Incentive Plan. We have a shareholder-approved Annual Incentive Plan, which is a component of our amended and restated 2008 Omnibus Incentive
Plan, for certain key officers that provides for annual or long-term cash awards at the end of various measurement periods, based on the earnings per share, revenue and/or various other criteria over the measurement period. Our total accrued incentive compensation for all incentive plans included in accrued salaries and bonuses on our Consolidated Balance Sheets was $90.0 million and $83.1 million at December 31, 2016 and 2015, respectively.
Employee Benefit Trusts. We maintain employee benefit trusts for the purpose of satisfying obligations under certain benefit plans. These trusts held 0.6 million shares of Equifax stock with a value, at cost, of 5.9 million at December 31, 2016 and 2015, as well as cash, which was not material for both periods presented. The employee benefits trusts are as follows:
• The Executive Life and Supplemental Retirement Benefit Plan Grantor Trust is used to ensure that the insurance premiums due under the Executive Life and Supplemental Retirement Benefit Plan are paid in case we fail to make scheduled payments following a change in control, as defined in this trust agreement. This trust was terminated in 2016 as the obligations noted above were satisfied.
• The Supplemental Retirement Plan Grantor Trust’s assets are dedicated to ensure the payment of benefits accrued under our Supplemental Retirement Plan in case of a change in control, as defined in this trust agreement.
The assets in these plans which are recorded on our Consolidated Balance Sheets are subject to creditor’s claims in case of insolvency of Equifax Inc.
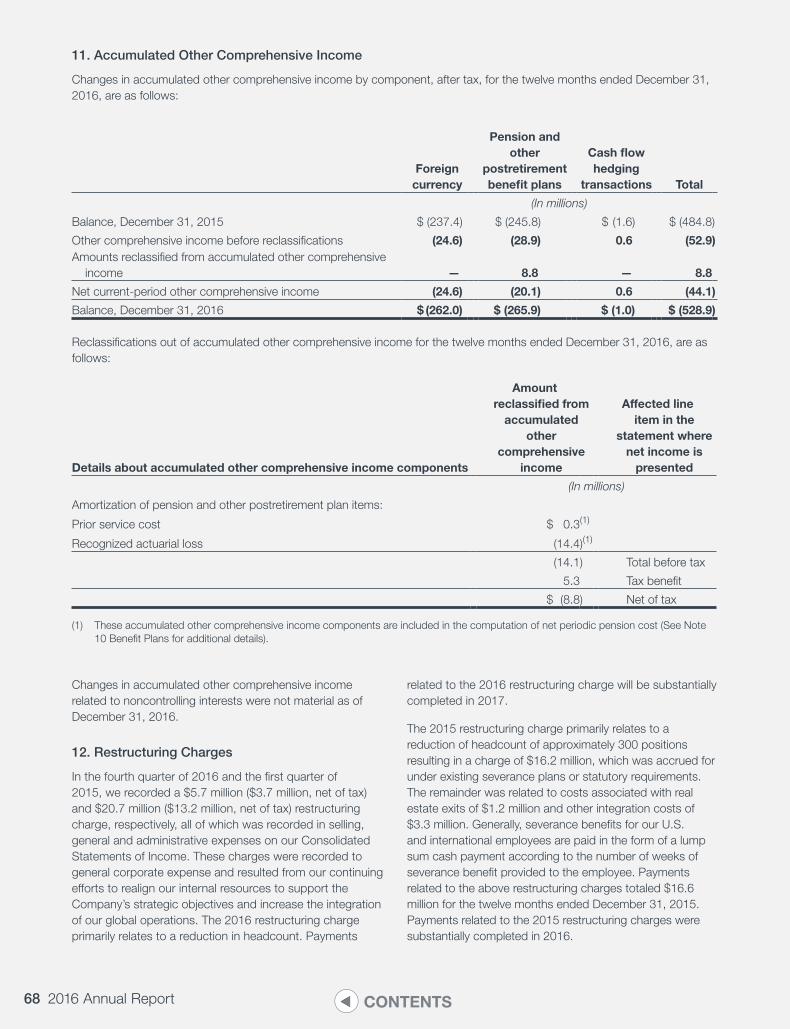
68 2016 Annual Report CONTENTS
11. Accumulated Other Comprehensive Income
Changes in accumulated other comprehensive income by component, after tax, for the twelve months ended December 31, 2016, are as follows:
Foreign currency
Pension and other
postretirement benefit plans
Cash flow hedging
transactions Total
(In millions)
Balance, December 31, 2015 $ (237.4) $ (245.8) $ (1.6) $ (484.8)
Other comprehensive income before reclassifications (24.6) (28.9) 0.6 (52.9)Amounts reclassified from accumulated other comprehensive
income — 8.8 — 8.8
Net current-period other comprehensive income (24.6) (20.1) 0.6 (44.1)
Balance, December 31, 2016 $ (262.0) $ (265.9) $ (1.0) $ (528.9)
Reclassifications out of accumulated other comprehensive income for the twelve months ended December 31, 2016, are as follows:
Details about accumulated other comprehensive income components
Amount reclassified from
accumulated other
comprehensive income
Affected line item in the
statement where net income is
presented
(In millions)
Amortization of pension and other postretirement plan items:
Prior service cost $ 0.3(1)
Recognized actuarial loss (14.4)(1)
(14.1) Total before tax
5.3 Tax benefit
$ (8.8) Net of tax
(1) These accumulated other comprehensive income components are included in the computation of net periodic pension cost (See Note 10 Benefit Plans for additional details).
Changes in accumulated other comprehensive income related to noncontrolling interests were not material as of December 31, 2016.
12. Restructuring Charges
In the fourth quarter of 2016 and the first quarter of 2015, we recorded a $5.7 million ($3.7 million, net of tax) and $20.7 million ($13.2 million, net of tax) restructuring charge, respectively, all of which was recorded in selling, general and administrative expenses on our Consolidated Statements of Income. These charges were recorded to general corporate expense and resulted from our continuing efforts to realign our internal resources to support the Company’s strategic objectives and increase the integration of our global operations. The 2016 restructuring charge primarily relates to a reduction in headcount. Payments
related to the 2016 restructuring charge will be substantially completed in 2017.
The 2015 restructuring charge primarily relates to a reduction of headcount of approximately 300 positions resulting in a charge of $16.2 million, which was accrued for under existing severance plans or statutory requirements. The remainder was related to costs associated with real estate exits of $1.2 million and other integration costs of $3.3 million. Generally, severance benefits for our U.S. and international employees are paid in the form of a lump sum cash payment according to the number of weeks of severance benefit provided to the employee. Payments related to the above restructuring charges totaled $16.6 million for the twelve months ended December 31, 2015. Payments related to the 2015 restructuring charges were substantially completed in 2016.
69Equifax Inc.CONTENTS
13. Segment Information
Organizational Realignment. In the first quarter of 2016, we acquired Veda, which operates primarily in Australia and New Zealand. We have included Veda’s operations within a newly-created Asia Pacific reporting unit within the International operating segment. Additionally, we moved the TDX Australia and India operations that were included in our Europe reporting unit, along with corporate assets including equity method investments in Russia and India, to the Asia Pacific reporting unit to align with how we manage our business. Our financial results for the years ended December 31, 2015 and 2014 reflect our new organizational structure. Additionally in 2016, we have renamed our Personal Solutions operating segment Global Consumer Solutions.
In 2015, the personal solutions business in the United Kingdom was consolidated into the North America Personal Solutions segment, which was reorganized into the Global Consumer Solutions segment. Additionally in 2015, the direct to consumer reseller businesses in the U.S., Canada, and the United Kingdom were also consolidated into the Global Consumer Solutions segment. These changes were driven by an enterprise wide strategy to maximize the penetration of our products and services in our targeted markets. We determined that market focus and operating efficiency could be further improved by reorganizing and consolidating the United States, Canada and the United Kingdom Global Consumer Solutions and Direct to Consumer Reseller operating activities into one segment, Global Consumer Solutions. As a result, we modified our segment reporting effective 2015. Our financial results for the year ended December 31, 2014 has been recast below to reflect our new organizational structure.
On July 1, 2014 the North America Commercial Solutions operating segment was consolidated into the U.S. Consumer Information Solutions and International operating segments. The change was driven by an enterprise wide distribution marketing strategy to maximize the penetration of our products and services in our targeted markets. In an effort to accelerate our penetration and simplify how our commercial information customers interact with us, we have reorganized our operating segments. The U.S. portion of the North America Commercial Solutions (“NACS”) operating segment was consolidated into the U.S. Consumer Information Solutions operating segment. The combined operating segment was renamed U.S. Information Solutions. The Canadian portion of the NACS operating segment was consolidated into the Canada operations of the International operating segment. As a result, we modified our segment reporting effective in the third quarter of 2014.
Reportable Segments. We manage our business and report our financial results through the following four
reportable segments, which are the same as our operating segments:
• U.S. Information Solutions
• International
• Workforce Solutions
• Global Consumer Solutions
The accounting policies of the reportable segments are the same as those described in our summary of significant accounting policies (see Note 1). We evaluate the performance of these reportable segments based on their operating revenue, operating income and operating margins, excluding any unusual or infrequent items, if any. The measurement criteria for segment profit or loss and segment assets are substantially the same for each reportable segment. Inter-segment sales are not material for all periods presented. All transactions between segments are accounted for at fair market value or cost depending on the nature of the transaction, and no timing differences occur between segments.
A summary of segment products and services is as follows:
U.S. Information Solutions. This segment includes consumer and commercial information services (such as credit information and credit scoring, credit modeling services and portfolio analytics (decisioning tools), which are derived from our databases of business credit and financial information, locate services, fraud detection and prevention services, identity verification services and other consulting services); mortgage loan origination information; financial marketing services; and identity management.
International. This segment includes information services products, which includes consumer and commercial services (such as credit and financial information, credit scoring and credit modeling services), credit and other marketing products and services. In Europe, Asia Pacific, Latin America and Canada, we also provide information, technology and services to support debt collections and recovery management.
Workforce Solutions. This segment includes employment, income and social security number verification services as well as complementary payroll-based transaction services and employment tax management services.
Global Consumer Solutions. This segment includes credit information, credit monitoring and identity theft protection products sold directly to consumers via the internet and in various hard-copy formats in the U.S., Canada, and the U.K. We also sell consumer and credit information to resellers who combine our information with other information to provide direct to consumer monitoring, reports and scores.
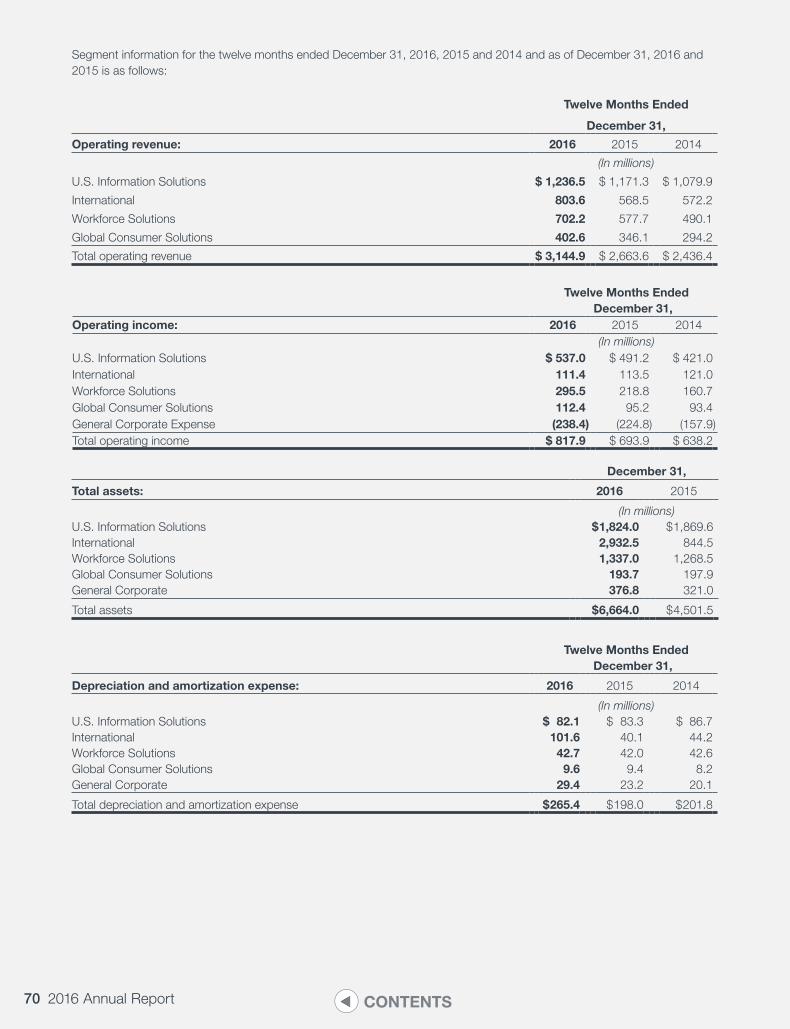
70 2016 Annual Report CONTENTS
Segment information for the twelve months ended December 31, 2016, 2015 and 2014 and as of December 31, 2016 and 2015 is as follows:
Twelve Months Ended
December 31,
Operating revenue: 2016 2015 2014
(In millions)
U.S. Information Solutions $ 1,236.5 $ 1,171.3 $ 1,079.9
International 803.6 568.5 572.2
Workforce Solutions 702.2 577.7 490.1
Global Consumer Solutions 402.6 346.1 294.2
Total operating revenue $ 3,144.9 $ 2,663.6 $ 2,436.4
Twelve Months Ended December 31,
Operating income: 2016 2015 2014(In millions)
U.S. Information Solutions $ 537.0 $ 491.2 $ 421.0International 111.4 113.5 121.0Workforce Solutions 295.5 218.8 160.7Global Consumer Solutions 112.4 95.2 93.4General Corporate Expense (238.4) (224.8) (157.9)Total operating income $ 817.9 $ 693.9 $ 638.2
December 31,
Total assets: 2016 2015
(In millions)U.S. Information Solutions $ 1,824.0 $ 1,869.6International 2,932.5 844.5Workforce Solutions 1,337.0 1,268.5Global Consumer Solutions 193.7 197.9General Corporate 376.8 321.0
Total assets $ 6,664.0 $ 4,501.5
Twelve Months Ended December 31,
Depreciation and amortization expense: 2016 2015 2014
(In millions)U.S. Information Solutions $ 82.1 $ 83.3 $ 86.7International 101.6 40.1 44.2Workforce Solutions 42.7 42.0 42.6Global Consumer Solutions 9.6 9.4 8.2General Corporate 29.4 23.2 20.1
Total depreciation and amortization expense $ 265.4 $ 198.0 $ 201.8
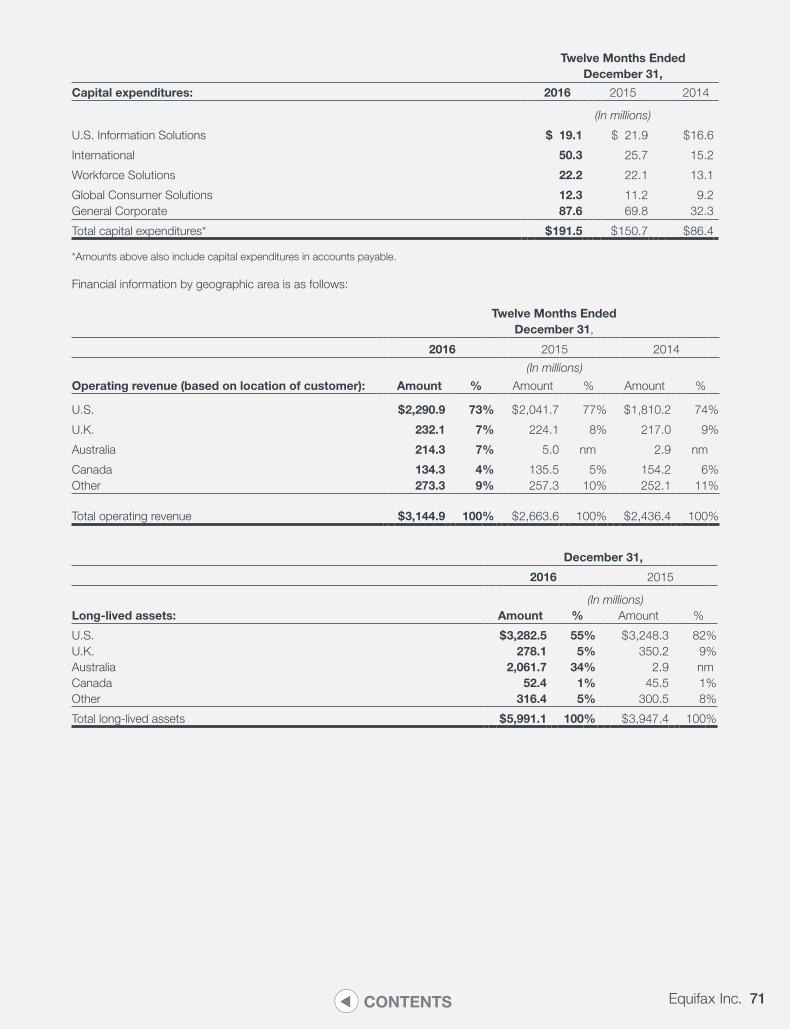
71Equifax Inc.CONTENTS
Twelve Months Ended December 31,
Capital expenditures: 2016 2015 2014
(In millions)
U.S. Information Solutions $ 19.1 $ 21.9 $ 16.6
International 50.3 25.7 15.2
Workforce Solutions 22.2 22.1 13.1
Global Consumer Solutions 12.3 11.2 9.2General Corporate 87.6 69.8 32.3
Total capital expenditures* $ 191.5 $ 150.7 $ 86.4
*Amounts above also include capital expenditures in accounts payable.
Financial information by geographic area is as follows:
Twelve Months Ended December 31,
2016 2015 2014
(In millions)
Operating revenue (based on location of customer): Amount % Amount % Amount %
U.S. $ 2,290.9 73% $ 2,041.7 77% $ 1,810.2 74%
U.K. 232.1 7% 224.1 8% 217.0 9%
Australia 214.3 7% 5.0 nm 2.9 nm
Canada 134.3 4% 135.5 5% 154.2 6%Other 273.3 9% 257.3 10% 252.1 11%
Total operating revenue $ 3,144.9 100% $ 2,663.6 100% $ 2,436.4 100%
December 31,
2016 2015
(In millions)Long-lived assets: Amount % Amount %
U.S. $ 3,282.5 55% $ 3,248.3 82%U.K. 278.1 5% 350.2 9%Australia 2,061.7 34% 2.9 nmCanada 52.4 1% 45.5 1%Other 316.4 5% 300.5 8%
Total long-lived assets $ 5,991.1 100% $ 3,947.4 100%
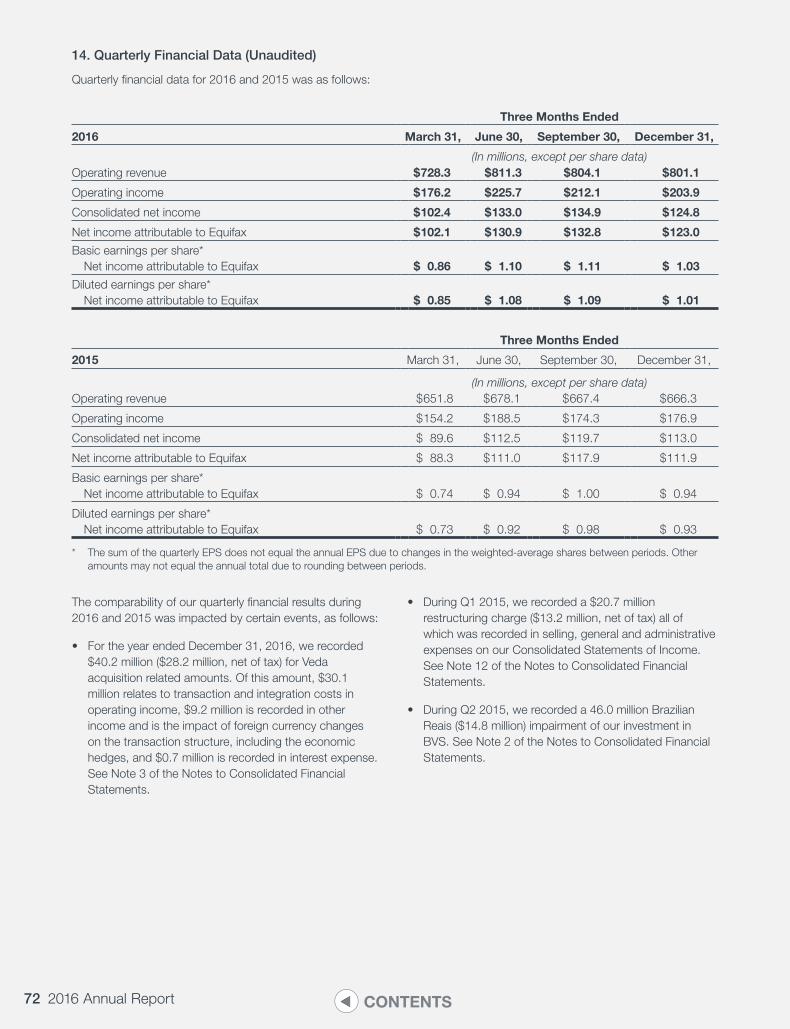
72 2016 Annual Report CONTENTS
14. Quarterly Financial Data (Unaudited)
Quarterly financial data for 2016 and 2015 was as follows:
Three Months Ended
2016 March 31, June 30, September 30, December 31,
(In millions, except per share data)Operating revenue $ 728.3 $ 811.3 $ 804.1 $ 801.1
Operating income $ 176.2 $ 225.7 $ 212.1 $ 203.9
Consolidated net income $ 102.4 $ 133.0 $ 134.9 $ 124.8
Net income attributable to Equifax $ 102.1 $ 130.9 $ 132.8 $ 123.0
Basic earnings per share* Net income attributable to Equifax $ 0.86 $ 1.10 $ 1.11 $ 1.03
Diluted earnings per share* Net income attributable to Equifax $ 0.85 $ 1.08 $ 1.09 $ 1.01
Three Months Ended
2015 March 31, June 30, September 30, December 31,
(In millions, except per share data)Operating revenue $ 651.8 $ 678.1 $ 667.4 $ 666.3
Operating income $ 154.2 $ 188.5 $ 174.3 $ 176.9
Consolidated net income $ 89.6 $ 112.5 $ 119.7 $ 113.0
Net income attributable to Equifax $ 88.3 $ 111.0 $ 117.9 $ 111.9
Basic earnings per share* Net income attributable to Equifax $ 0.74 $ 0.94 $ 1.00 $ 0.94
Diluted earnings per share* Net income attributable to Equifax $ 0.73 $ 0.92 $ 0.98 $ 0.93
* The sum of the quarterly EPS does not equal the annual EPS due to changes in the weighted-average shares between periods. Other amounts may not equal the annual total due to rounding between periods.
The comparability of our quarterly financial results during 2016 and 2015 was impacted by certain events, as follows:
• For the year ended December 31, 2016, we recorded $40.2 million ($28.2 million, net of tax) for Veda acquisition related amounts. Of this amount, $30.1 million relates to transaction and integration costs in operating income, $9.2 million is recorded in other income and is the impact of foreign currency changes on the transaction structure, including the economic hedges, and $0.7 million is recorded in interest expense. See Note 3 of the Notes to Consolidated Financial Statements.
• During Q1 2015, we recorded a $20.7 million restructuring charge ($13.2 million, net of tax) all of which was recorded in selling, general and administrative expenses on our Consolidated Statements of Income. See Note 12 of the Notes to Consolidated Financial Statements.
• During Q2 2015, we recorded a 46.0 million Brazilian Reais ($14.8 million) impairment of our investment in BVS. See Note 2 of the Notes to Consolidated Financial Statements.
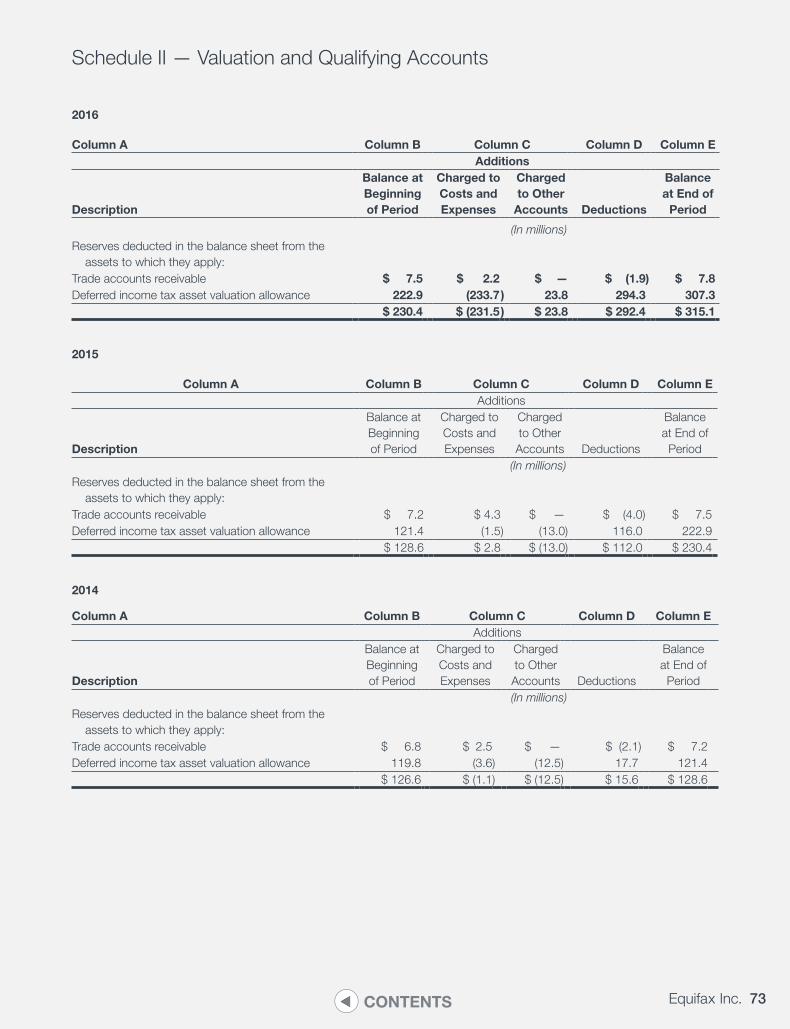
73Equifax Inc.CONTENTS
Schedule II — Valuation and Qualifying Accounts
2016
Column A Column B Column C Column D Column EAdditions
Description
Balance at Beginning of Period
Charged to Costs and Expenses
Charged to Other
Accounts Deductions
Balance at End of
Period
(In millions)Reserves deducted in the balance sheet from the
assets to which they apply:Trade accounts receivable $ 7.5 $ 2.2 $ — $ (1.9) $ 7.8Deferred income tax asset valuation allowance 222.9 (233.7) 23.8 294.3 307.3
$ 230.4 $ (231.5) $ 23.8 $ 292.4 $ 315.1
2015
Column A Column B Column C Column D Column EAdditions
Description
Balance at Beginning of Period
Charged to Costs and Expenses
Charged to Other Accounts Deductions
Balance at End of Period
(In millions)Reserves deducted in the balance sheet from the
assets to which they apply:Trade accounts receivable $ 7.2 $ 4.3 $ — $ (4.0) $ 7.5Deferred income tax asset valuation allowance 121.4 (1.5) (13.0) 116.0 222.9
$ 128.6 $ 2.8 $ (13.0) $ 112.0 $ 230.4
2014
Column A Column B Column C Column D Column EAdditions
Description
Balance at Beginning of Period
Charged to Costs and Expenses
Charged to Other Accounts Deductions
Balance at End of Period
(In millions)Reserves deducted in the balance sheet from the
assets to which they apply:Trade accounts receivable $ 6.8 $ 2.5 $ — $ (2.1) $ 7.2Deferred income tax asset valuation allowance 119.8 (3.6) (12.5) 17.7 121.4
$ 126.6 $ (1.1) $ (12.5) $ 15.6 $ 128.6
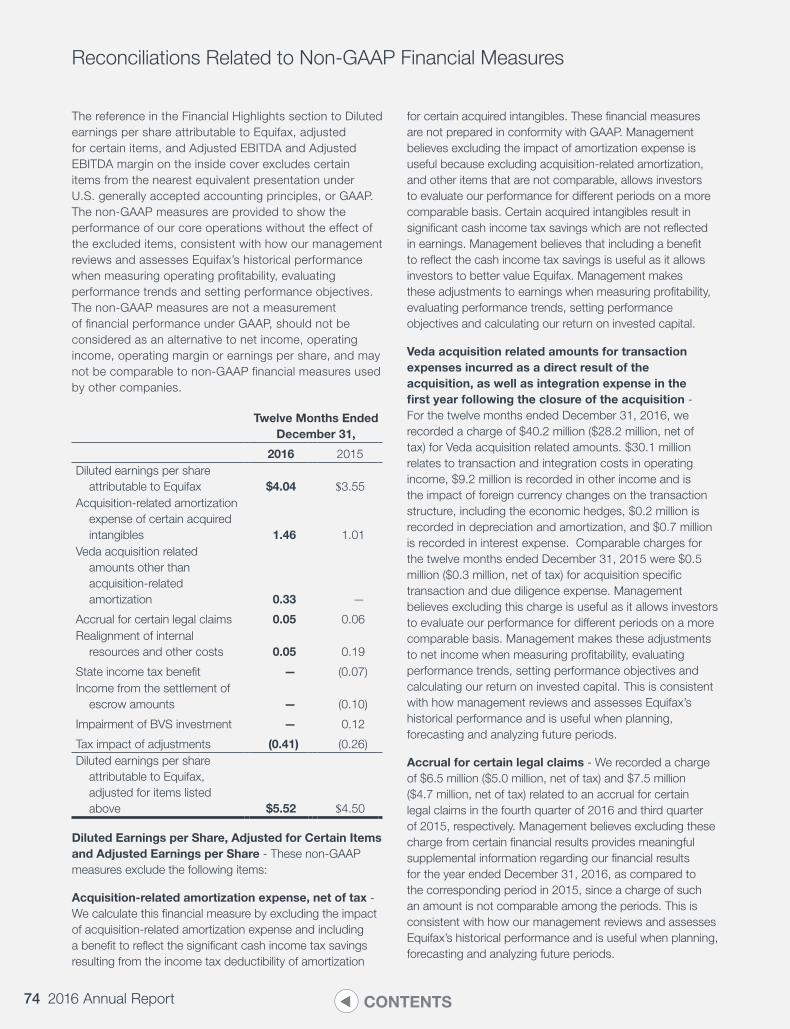
74 2016 Annual Report CONTENTS
Reconciliations Related to Non-GAAP Financial Measures
The reference in the Financial Highlights section to Diluted earnings per share attributable to Equifax, adjusted for certain items, and Adjusted EBITDA and Adjusted EBITDA margin on the inside cover excludes certain items from the nearest equivalent presentation under U.S. generally accepted accounting principles, or GAAP. The non-GAAP measures are provided to show the performance of our core operations without the effect of the excluded items, consistent with how our management reviews and assesses Equifax’s historical performance when measuring operating profitability, evaluating performance trends and setting performance objectives. The non-GAAP measures are not a measurement of financial performance under GAAP, should not be considered as an alternative to net income, operating income, operating margin or earnings per share, and may not be comparable to non-GAAP financial measures used by other companies.
Twelve Months Ended December 31,
2016 2015Diluted earnings per share
attributable to Equifax $4.04 $3.55Acquisition-related amortization
expense of certain acquired intangibles 1.46 1.01
Veda acquisition related amounts other than acquisition-related amortization 0.33 —
Accrual for certain legal claims 0.05 0.06Realignment of internal
resources and other costs 0.05 0.19
State income tax benefit — (0.07)Income from the settlement of
escrow amounts — (0.10)
Impairment of BVS investment — 0.12
Tax impact of adjustments (0.41) (0.26)Diluted earnings per share
attributable to Equifax, adjusted for items listed above $5.52 $4.50
Diluted Earnings per Share, Adjusted for Certain Items and Adjusted Earnings per Share - These non-GAAP measures exclude the following items:
Acquisition-related amortization expense, net of tax - We calculate this financial measure by excluding the impact of acquisition-related amortization expense and including a benefit to reflect the significant cash income tax savings resulting from the income tax deductibility of amortization
for certain acquired intangibles. These financial measures are not prepared in conformity with GAAP. Management believes excluding the impact of amortization expense is useful because excluding acquisition-related amortization, and other items that are not comparable, allows investors to evaluate our performance for different periods on a more comparable basis. Certain acquired intangibles result in significant cash income tax savings which are not reflected in earnings. Management believes that including a benefit to reflect the cash income tax savings is useful as it allows investors to better value Equifax. Management makes these adjustments to earnings when measuring profitability, evaluating performance trends, setting performance objectives and calculating our return on invested capital.
Veda acquisition related amounts for transaction expenses incurred as a direct result of the acquisition, as well as integration expense in the first year following the closure of the acquisition - For the twelve months ended December 31, 2016, we recorded a charge of $40.2 million ($28.2 million, net of tax) for Veda acquisition related amounts. $30.1 million relates to transaction and integration costs in operating income, $9.2 million is recorded in other income and is the impact of foreign currency changes on the transaction structure, including the economic hedges, $0.2 million is recorded in depreciation and amortization, and $0.7 million is recorded in interest expense. Comparable charges for the twelve months ended December 31, 2015 were $0.5 million ($0.3 million, net of tax) for acquisition specific transaction and due diligence expense. Management believes excluding this charge is useful as it allows investors to evaluate our performance for different periods on a more comparable basis. Management makes these adjustments to net income when measuring profitability, evaluating performance trends, setting performance objectives and calculating our return on invested capital. This is consistent with how management reviews and assesses Equifax’s historical performance and is useful when planning, forecasting and analyzing future periods.
Accrual for certain legal claims - We recorded a charge of $6.5 million ($5.0 million, net of tax) and $7.5 million ($4.7 million, net of tax) related to an accrual for certain legal claims in the fourth quarter of 2016 and third quarter of 2015, respectively. Management believes excluding these charge from certain financial results provides meaningful supplemental information regarding our financial results for the year ended December 31, 2016, as compared to the corresponding period in 2015, since a charge of such an amount is not comparable among the periods. This is consistent with how our management reviews and assesses Equifax’s historical performance and is useful when planning, forecasting and analyzing future periods.
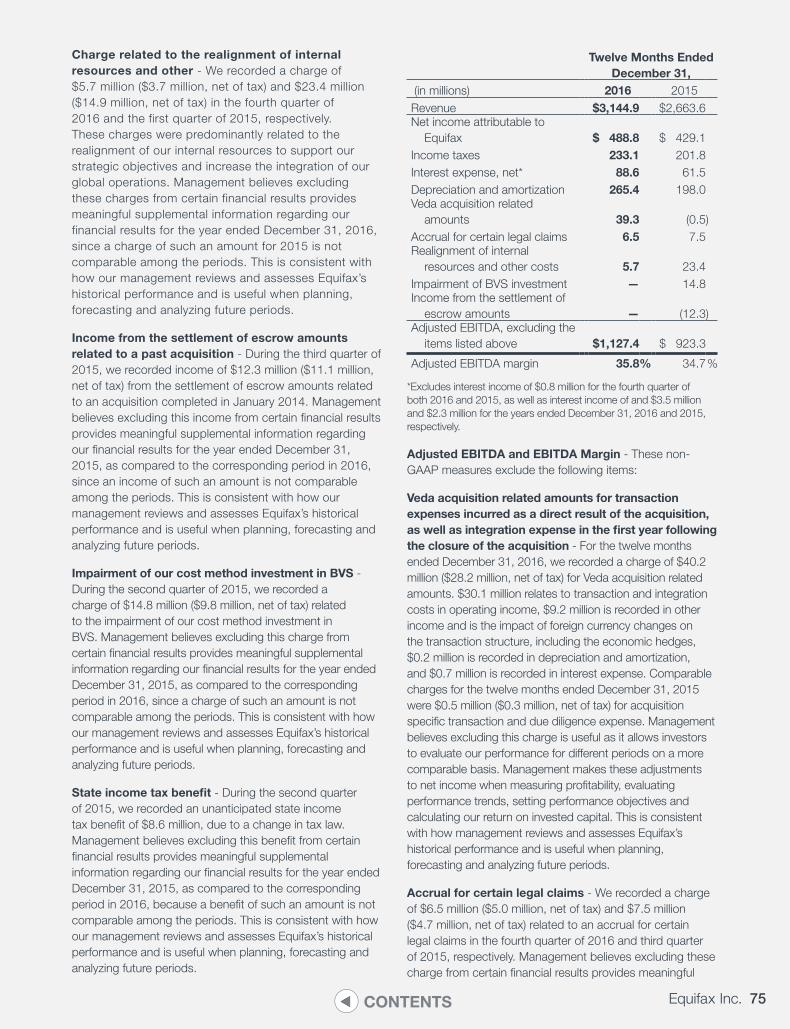
75Equifax Inc.CONTENTS
Charge related to the realignment of internal resources and other - We recorded a charge of $5.7 million ($3.7 million, net of tax) and $23.4 million ($14.9 million, net of tax) in the fourth quarter of 2016 and the first quarter of 2015, respectively. These charges were predominantly related to the realignment of our internal resources to support our strategic objectives and increase the integration of our global operations. Management believes excluding these charges from certain financial results provides meaningful supplemental information regarding our financial results for the year ended December 31, 2016, since a charge of such an amount for 2015 is not comparable among the periods. This is consistent with how our management reviews and assesses Equifax’s historical performance and is useful when planning, forecasting and analyzing future periods.
Income from the settlement of escrow amounts related to a past acquisition - During the third quarter of 2015, we recorded income of $12.3 million ($11.1 million, net of tax) from the settlement of escrow amounts related to an acquisition completed in January 2014. Management believes excluding this income from certain financial results provides meaningful supplemental information regarding our financial results for the year ended December 31, 2015, as compared to the corresponding period in 2016, since an income of such an amount is not comparable among the periods. This is consistent with how our management reviews and assesses Equifax’s historical performance and is useful when planning, forecasting and analyzing future periods.
Impairment of our cost method investment in BVS - During the second quarter of 2015, we recorded a charge of $14.8 million ($9.8 million, net of tax) related to the impairment of our cost method investment in BVS. Management believes excluding this charge from certain financial results provides meaningful supplemental information regarding our financial results for the year ended December 31, 2015, as compared to the corresponding period in 2016, since a charge of such an amount is not comparable among the periods. This is consistent with how our management reviews and assesses Equifax’s historical performance and is useful when planning, forecasting and analyzing future periods.
State income tax benefit - During the second quarter of 2015, we recorded an unanticipated state income tax benefit of $8.6 million, due to a change in tax law. Management believes excluding this benefit from certain financial results provides meaningful supplemental information regarding our financial results for the year ended December 31, 2015, as compared to the corresponding period in 2016, because a benefit of such an amount is not comparable among the periods. This is consistent with how our management reviews and assesses Equifax’s historical performance and is useful when planning, forecasting and analyzing future periods.
Twelve Months Ended December 31,
(in millions) 2016 2015Revenue $3,144.9 $2,663.6Net income attributable to
Equifax $ 488.8 $ 429.1Income taxes 233.1 201.8Interest expense, net* 88.6 61.5Depreciation and amortization 265.4 198.0Veda acquisition related
amounts 39.3 (0.5)Accrual for certain legal claims 6.5 7.5Realignment of internal
resources and other costs 5.7 23.4Impairment of BVS investment — 14.8Income from the settlement of
escrow amounts — (12.3)Adjusted EBITDA, excluding the
items listed above $1,127.4 $ 923.3
Adjusted EBITDA margin 35.8% 34.7%
*Excludes interest income of $0.8 million for the fourth quarter of both 2016 and 2015, as well as interest income of and $3.5 million and $2.3 million for the years ended December 31, 2016 and 2015, respectively.
Adjusted EBITDA and EBITDA Margin - These non-GAAP measures exclude the following items:
Veda acquisition related amounts for transaction expenses incurred as a direct result of the acquisition, as well as integration expense in the first year following the closure of the acquisition - For the twelve months ended December 31, 2016, we recorded a charge of $40.2 million ($28.2 million, net of tax) for Veda acquisition related amounts. $30.1 million relates to transaction and integration costs in operating income, $9.2 million is recorded in other income and is the impact of foreign currency changes on the transaction structure, including the economic hedges, $0.2 million is recorded in depreciation and amortization, and $0.7 million is recorded in interest expense. Comparable charges for the twelve months ended December 31, 2015 were $0.5 million ($0.3 million, net of tax) for acquisition specific transaction and due diligence expense. Management believes excluding this charge is useful as it allows investors to evaluate our performance for different periods on a more comparable basis. Management makes these adjustments to net income when measuring profitability, evaluating performance trends, setting performance objectives and calculating our return on invested capital. This is consistent with how management reviews and assesses Equifax’s historical performance and is useful when planning, forecasting and analyzing future periods.
Accrual for certain legal claims - We recorded a charge of $6.5 million ($5.0 million, net of tax) and $7.5 million ($4.7 million, net of tax) related to an accrual for certain legal claims in the fourth quarter of 2016 and third quarter of 2015, respectively. Management believes excluding these charge from certain financial results provides meaningful
76 2016 Annual Report CONTENTS
supplemental information regarding our financial results for the year ended December 31, 2016, as compared to the corresponding period in 2015, since a charge of such an amount is not comparable among the periods. This is consistent with how our management reviews and assesses Equifax’s historical performance and is useful when planning, forecasting and analyzing future periods.
Charge related to the realignment of internal resources and other - We recorded a charge of $5.7 million ($3.7 million, net of tax) and $23.4 million ($14.9 million, net of tax) in the fourth quarter of 2016 and the first quarter of 2015, respectively. These charges were predominantly related to the realignment of our internal resources to support our strategic objectives and increase the integration of our global operations. Management believes excluding these charges from certain financial results provides meaningful supplemental information regarding our financial results for the year ended December 31, 2016, since a charge of such an amount for 2015 is not comparable among the periods. This is consistent with how our management reviews and assesses Equifax’s historical performance and is useful when planning, forecasting and analyzing future periods.
Impairment of our cost method investment in BVS - During the second quarter of 2015, we recorded a charge of $14.8 million ($9.8 million, net of tax) related to the impairment of our cost method investment in BVS. Management believes excluding this charge from certain financial results provides meaningful supplemental information regarding our financial results for the year ended December 31, 2015, as compared to the corresponding period in 2016, since a charge of such an amount is not comparable among the periods. This is consistent with how our management reviews and assesses Equifax’s historical performance and is useful when planning, forecasting and analyzing future periods.
Income from the settlement of escrow amounts related to a past acquisition - During the third quarter of 2015, we recorded income of $12.3 million ($11.1 million, net of tax) from the settlement of escrow amounts related to an acquisition completed in January 2014. Management believes excluding this income from certain financial results provides meaningful supplemental information regarding our financial results for the year ended December 31, 2015, as compared to the corresponding period in 2016, since an income of such an amount is not comparable among the periods. This is consistent with how our management reviews and assesses Equifax’s historical performance and is useful when planning, forecasting and analyzing future periods.
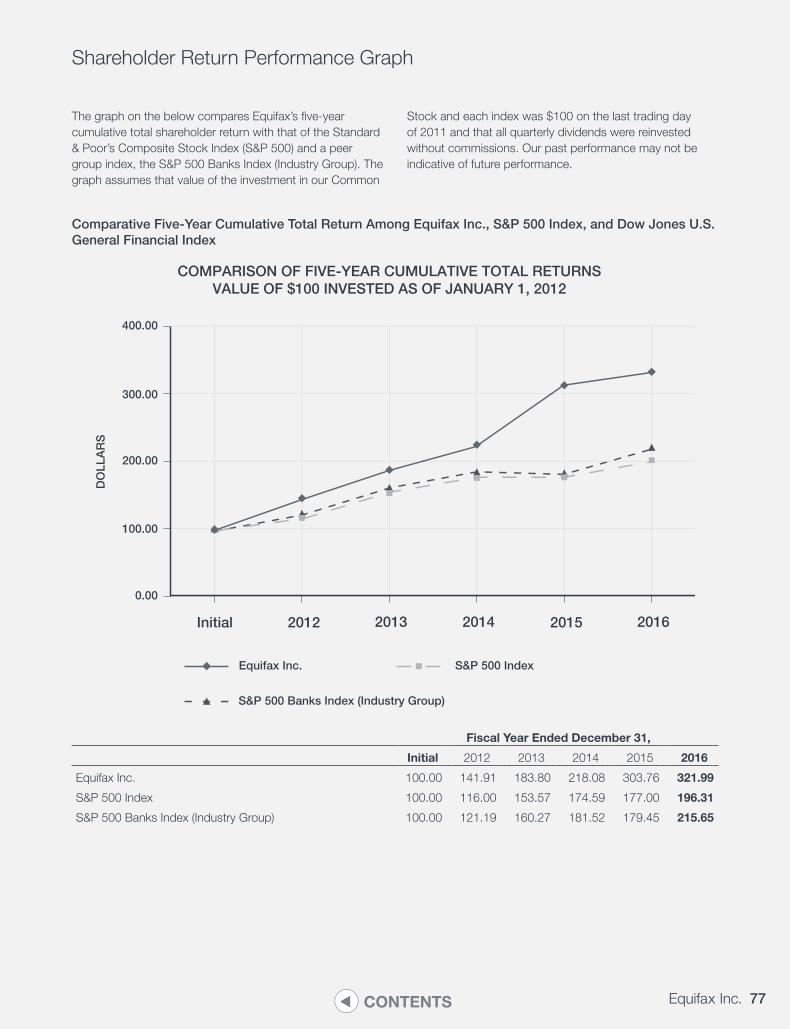
77Equifax Inc.CONTENTS
Shareholder Return Performance Graph
The graph on the below compares Equifax’s five-year cumulative total shareholder return with that of the Standard & Poor’s Composite Stock Index (S&P 500) and a peer group index, the S&P 500 Banks Index (Industry Group). The graph assumes that value of the investment in our Common
Stock and each index was $100 on the last trading day of 2011 and that all quarterly dividends were reinvested without commissions. Our past performance may not be indicative of future performance.
Comparative Five-Year Cumulative Total Return Among Equifax Inc., S&P 500 Index, and Dow Jones U.S. General Financial Index
400.00
300.00
DO
LLAR
S
Equifax Inc.
S&P 500 Banks Index (Industry Group)
S&P 500 Index
Initial 2012 2013 2014 2015 2016
200.00
100.00
0.00
COMPARISON OF FIVE-YEAR CUMULATIVE TOTAL RETURNSVALUE OF $100 INVESTED AS OF JANUARY 1, 2012
Fiscal Year Ended December 31,
Initial 2012 2013 2014 2015 2016
Equifax Inc. 100.00 141.91 183.80 218.08 303.76 321.99
S&P 500 Index 100.00 116.00 153.57 174.59 177.00 196.31
S&P 500 Banks Index (Industry Group) 100.00 121.19 160.27 181.52 179.45 215.65
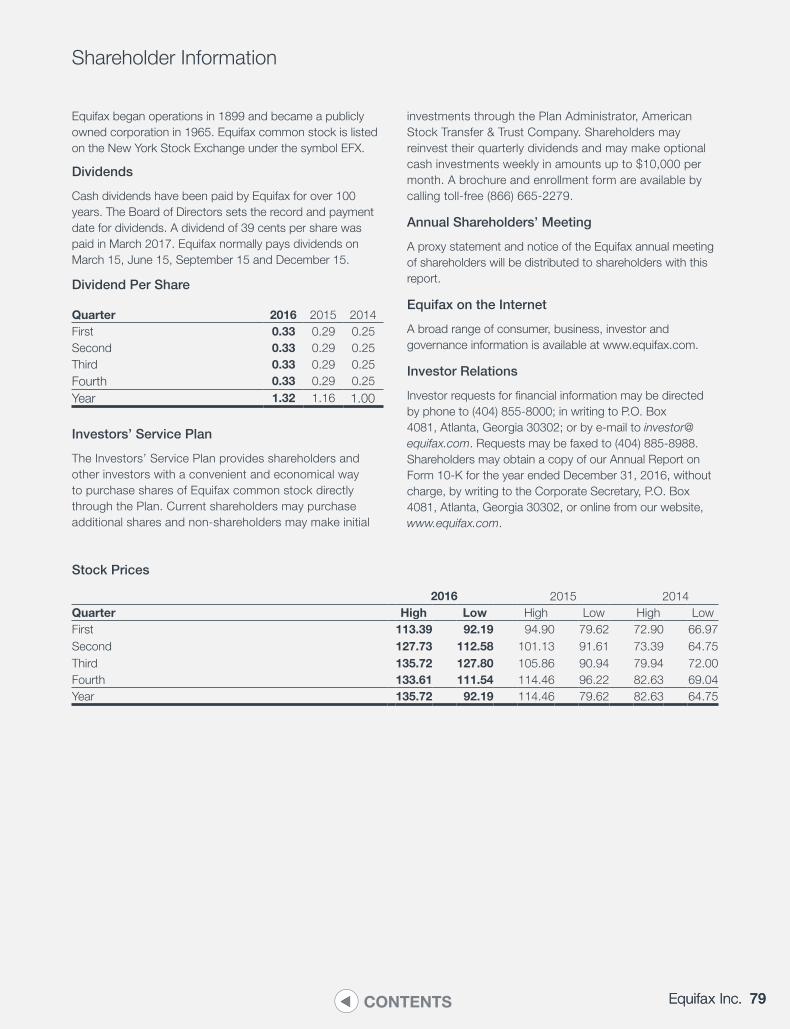
79Equifax Inc.CONTENTS
Shareholder Information
Equifax began operations in 1899 and became a publicly owned corporation in 1965. Equifax common stock is listed on the New York Stock Exchange under the symbol EFX.
Dividends
Cash dividends have been paid by Equifax for over 100 years. The Board of Directors sets the record and payment date for dividends. A dividend of 39 cents per share was paid in March 2017. Equifax normally pays dividends on March 15, June 15, September 15 and December 15.
Dividend Per Share
Quarter 2016 2015 2014First 0.33 0.29 0.25Second 0.33 0.29 0.25Third 0.33 0.29 0.25Fourth 0.33 0.29 0.25Year 1.32 1.16 1.00
Investors’ Service Plan
The Investors’ Service Plan provides shareholders and other investors with a convenient and economical way to purchase shares of Equifax common stock directly through the Plan. Current shareholders may purchase additional shares and non-shareholders may make initial
investments through the Plan Administrator, American Stock Transfer & Trust Company. Shareholders may reinvest their quarterly dividends and may make optional cash investments weekly in amounts up to $10,000 per month. A brochure and enrollment form are available by calling toll-free (866) 665-2279.
Annual Shareholders’ Meeting
A proxy statement and notice of the Equifax annual meeting of shareholders will be distributed to shareholders with this report.
Equifax on the Internet
A broad range of consumer, business, investor and governance information is available at www.equifax.com.
Investor Relations
Investor requests for financial information may be directed by phone to (404) 855-8000; in writing to P.O. Box 4081, Atlanta, Georgia 30302; or by e-mail to [email protected]. Requests may be faxed to (404) 885-8988. Shareholders may obtain a copy of our Annual Report on Form 10-K for the year ended December 31, 2016, without charge, by writing to the Corporate Secretary, P.O. Box 4081, Atlanta, Georgia 30302, or online from our website, www.equifax.com.
Stock Prices
2016 2015 2014Quarter High Low High Low High LowFirst 113.39 92.19 94.90 79.62 72.90 66.97Second 127.73 112.58 101.13 91.61 73.39 64.75Third 135.72 127.80 105.86 90.94 79.94 72.00Fourth 133.61 111.54 114.46 96.22 82.63 69.04Year 135.72 92.19 114.46 79.62 82.63 64.75
79Equifax Inc.

80 2016 Annual Report CONTENTS
Corporate Officers
Corporate Contacts
Richard F. Smith
Chairman and Chief Executive Officer
John W. Gamble, Jr.
Corporate Vice President and
Chief Financial Officer
John J. Kelley III
Corporate Vice President,
Chief Legal Officer and
Corporate Secretary
Joseph (Trey) M. Loughran III
Corporate Vice President and
Chief Marketing Officer
Coretha M. Rushing
Corporate Vice President and
Chief Human Resources Officer
David C. Webb
Chief Information Officer
Nuala M. King
Senior Vice President and
Corporate Controller
Corporate Offices
Equifax Inc.
1550 Peachtree Street, N.W.
Atlanta, Georgia 30309
404-885-8000
equifax.com
Shareholder Services
Christy Cooper
Office of the Corporate Secretary
Investor Relations
Jeffrey L. Dodge
Public Relations
Marisa Salcines
Transfer Agent and Registrar
American Stock Transfer &
Trust Company, LLC
6201 15th Avenue
Brooklyn, New York 11219
866-665-2279
Independent Registered Public Accounting Firm
Ernst & Young LLP
55 Ivan Allen Jr. Boulevard, Suite 1000
Atlanta, Georgia 30308

Board of Directors
Richard F. Smith
Chairman and Chief Executive Officer
Equifax Inc.
James E. Copeland, Jr.
Retired Chief Executive Officer
Deloitte & Touche and
Deloitte Touche Tohmatsu
Robert D. Daleo
Retired Vice Chairman
Thomson Reuters
Walter W. Driver, Jr.
Chairman–Southeast
Goldman, Sachs & Co.
Mark L. Feidler
Founding Partner
MSouth Equity Partners
G. Thomas Hough
Retired Americas Vice Chair
Ernst & Young LLP
L. Phillip Humann
Retired Chairman and Chief Executive Officer
SunTrust Banks, Inc.
Robert D. Marcus
Non-Executive Chairman
Ocelot Partners Limited
Siri S. Marshall
Retired Senior Vice President,
General Counsel and Secretary
General Mills, Inc.
John A. McKinley
Chief Executive Officer, SaferAging, Inc. and
Co-Founder, LaunchBox Digital
Elane B. Stock
Retired Group President
Kimberly-Clark International
Mark B. Templeton
Retired President and Chief Executive Officer
Citrix Systems, Inc.
(Standing) Robert D. Daleo, Mark L. Feidler, Elane B. Stock, Walter W. Driver, Jr., Richard F. Smith, John A. McKinley, L. Phillip Humann, James E. Copeland, Jr., G. Thomas Hough, (seated) Mark B. Templeton, Siri S. Marshall, Robert D. Marcus.

EQUIFAX INC.
1550 Peachtree Street, N.W. Atlanta, Georgia 30309
404-885-8000
equifax.com
Copyright © 2017, Equifax Inc., Atlanta, Georgia. All rights reserved. Equifax and EFX are trademarks of Equifax Inc. 16-0027