Embed Size (px)
Citation preview
i
The prevalence of risk factors for non-communicable
diseases among people living in Mombasa, Kenya.
Nassib Tawa
Mini-thesis submitted in partial fulfillment of the requirements for the degree of
Master of Science in Physiotherapy
Faculty of Community and Health Sciences
Department of Physiotherapy
University of the Western Cape
September, 2009
Supervisor: Professor José Merle Frantz Co-supervisor: Ms. Firdouza Waggie

ii
Keywords
Epidemiology
Prevalence
Chronic diseases
Non-communicable diseases
Morbidity and mortality
Risk factors
Lifestyle
Public health
Surveillance
Prevention
Mombasa

iii
Abstract
Chronic non-communicable diseases, including cardio-vascular diseases and stroke, cancer,
type 2 diabetes and chronic pulmonary disorders, are rapidly emerging as leading causes of
morbidity and premature mortalities globally. The majority of the populations worldwide have
experienced major transformations in disease profiles and health status characterized by a shift
from infectious diseases and nutritional deficiencies to a predominance of chronic diseases of
lifestyle. This epidemiological transition is regarded as an outcome of the environmental and
socioeconomic changes following urbanization.
Common behavioral health risk factors, such as smoking, risky alcohol consumption,
sedentarism, overweigh/obesity and hypertension, have consistently been attributed to the
development of chronic non-communicable diseases among populations.
This thesis seeks to describe the epidemiology of the major common risk factors for non-
communicable diseases among people living in Mombasa, Kenya. The study responds to the
WHO’S recommendations on comprehensive and continuous risk factor surveillance as an
essential component of the public health information system and a vital health promoting
strategy in the control and prevention of non-communicable diseases.
A cross-sectional study design using the WHO STEPwise protocol was employed.
Convenient stratification of the Mombasa population was done according to gender, age and
setting categories. Using the Yamane formula n = N/1+ N(e²), a sample of 500 participants
aged 15 to 70 years was arrived at. The researcher then conveniently selected public high
schools, tertiary institutions, workplaces and a marketplace as the study settings.
The WHO STEPS instrument (Core and Expanded Version 1.4) was used for data
collection. Step 1 involved gathering information on socio-demographic characteristics and

iv
health-related behaviors of the participants using close-ended structured questions. Step 2
involved the taking of simple anthropometrical measurements pertaining to height, weight,
waist circumference, blood pressure and pulse rate.
Data were captured, cleaned and analyzed using the Statistical Analysis System (SAS) and
SPSS version 16.0. Chi-square and Spearman correlation tests were used to determine
associations between socio-demographic variables and behavioral health risk factors.
The results indicated that 61% of the study participants possessed at least one of the
investigated risk factors. 17% of the participants had a multiple risk factor profile, with 54%
more females having a higher mean risk factor score compared to 46% of their male
counterparts.
Physical inactivity, hypertension and overweight/obesity were the most common registered
risk factors, accounting respectively for 42%, 24% and 11%. Physical inactivity and
hypertension formed the commonest cluster of multiple risk factor patterns; they co-occurred
in 68% of the participants with a multiple risk factor profile.
Increasing age, female gender and a low level of educational attainment were factors seen
to be significantly associated with the development of risk factors for non-communicable
diseases among the participants.
It was observed that the burden of risk factors was unequally distributed among Mombasa
residents; intervention programs based on our findings should therefore be used to ensure
effectiveness. Future studies using nationally representative samples are further suggested to
provide a more comprehensive analysis of a national risk factor profile.

v
Declaration
I declare that The prevalence of risk factors for non-communicable diseases among people
living in Mombasa, Kenya is my own work, that it has not been submitted for any degree or
examination in any other university, and that all the sources I have used or quoted have been
indicated and acknowledged by means of complete references.
Nassib Tawa. September, 2009
Signature…………………………
Professor José Merle Frantz.
Witness……………………………….

vi
Dedication
To God the Almighty, through whose mercies and blessings this piece of work was
successfully completed.
To myself for making it this far in my life and career against all odds.

vii
Acknowledgements
I am thankful to the management of the Coast Province General Hospital, Mombasa, Kenya,
for allowing me time off work to study. I am also grateful to my departmental head, Mr. E. K.
Bilo, for his recommendation and to my colleagues for taking over my workplace
responsibilities.
Sincere gratitude goes to my family and friends for their incredible support,
encouragement and prayers. I appreciate your efforts. God bless you.
My supervisors, Professor J. M. Frantz and Ms. Firdouza Waggie, devoted their precious
time and commitment towards the conception and implementation of this work. It was a great
pleasure working with you.
I thank my field research assistants in Mombasa, physiotherapist Mr. D. Minyo, and
occupational therapist Ms. Mwangi, for helping me with data collection. I appreciate your
input, and wish you well in life and career.
I also acknowledge the assistance of Professor R. Madsen, University of Missouri, United
States of America, and Mr. Ghasim, University of the Western Cape. Their work and advice
on statistical analysis enabled me to draw effective conclusions from the field data.

viii
Table of contents
Title page ii
Key words iii
Abstract iv
Declaration vi
Dedication vii
Acknowledgement viii
Table of contents ix
List of figures xiii
List of tables xiv
Acronyms xv

ix
Chapter One Introduction 1.1 Introduction 1 1.2 Background of the study 1 1.3 Problem statement 10 1.4 Aim of the study 10 1.5 Specific objectives of the study 11 1.6 Significance of the study 11 1.7 Definition of terms 12 1.8 Summary of chapters 13
Chapter Two
Literature review 2.1 Introduction 15 2.2 Urbanization and emergence of non-communicable diseases 15 2.3 The epidemiologic transition 17 2.4 Non-communicable diseases: the global situation 19
2.4.1 Non-communicable diseases in developed countries 20 2.4.2 Non-communicable diseases in middle-income countries 21 2.4.3 Non-communicable diseases in low-income countries 22
2.5 Determinants of non-communicable diseases: the role of health risk factors 23
2.6 Prevalence of individual risk factors 26 2.6.1 Physical inactivity 26 2.6.2 Smoking 28 2.6.3 Hypertension 30 2.6.4 Overweight/Obesity 31
2.7 The impact of non-communicable diseases and their risk factors 33 2.7.1 Health impact 33 2.7.2 Socioeconomic impact 34
2.8 Models of best practice in the control and prevention of non-communicable diseases 35
2.9 Conclusion 38

x
Chapter Three Methodology 3.1 Introduction 39 3.2 Research setting 39 3.3 Study design 40 3.4 Study population 40 3.5 Sampling technique 41 3.5.1 High schools 43 3.5.2 Tertiary institutions 43 3.5.3 Workplaces 44 3.5.4 Community 44 3.6 Study instrument 44 3.7 Pilot study 45 3.8 Reliability 46 3.9 Validity 46 3.10 Procedure 47
3.10.1 Permission 47 3.10.2 Recruitment 48
3.11 Data analysis 49 3.12 Ethical consideration 49
Chapter Four Results 4.1 Introduction 51 4.2 Descriptive characteristics of the sample 51 4.3 Analysis of risk factors among study participants 53
4.3.1 Smoking 54 4.3.2 Alcohol consumption 54 4.3.3 Physical inactivity 55
4.4 Analysis of the anthropometrical measurements 57 4.4.1 Blood pressure 57 4.4.1.2 Hypertension 58 4.4.2 Body Mass Index 59 4.4.2.1 Overweight/Obesity 60 4.5 Diet 61 4.6 Blood sugar 62

xi
4.7 Analysis of risk factors by participants’ gender 62 4.8 Clustering of risk factors according to participants’ setting 64 4.9 Clustering of risk factors by age among adult participants 64 4.10 Analysis of multiple risk factors 65 4.11 Analysis of individual risk factors 66
Chapter Five
Discussion 5.1 Introduction 68 5.2 Findings on socio-demographic characteristics 68 5.3 Risk factors among study participants 70
5.3.1 Smoking 70 5.3.2 Risky alcohol consumption 72 5.3.3 Physical inactivity 72 5.3.4 Hypertension 74 5.3.5 Overweight/obesity 75 5.3.6 Diet 76 5.3.7 Blood sugar 77
5.4 Clustering of multiple risk factors 77 5.5 Trends of individual risk factors 78 5.6 Patterns of multiple risk factors 79 5.7 Limitations of the study 80
Chapter Six Summary, conclusion and recommendations 6.1 Introduction 81 6.2 Summary 81 6.3 Conclusion 83 6.4 Recommendations 83
References 85

xii
Appendices Appendix A: Clearance letter from the University of the Western Cape. Appendix B: Letter of permission from the Ministry of Education, Science and Technology, Kenya. Appendix C: Research clearance identification card Appendix D: Approval letter from the District Educational Officer, Mombasa. Appendix E: Participants’ letter of information about the study. Appendix F: Parental permission letter for participants under the age of 18 years. Appendix G: Participants’ consent form Appendix H: Research assistant’s appointment letter Appendix I: WHO STEPS Instrument for NCD risk factors surveillance Appendix J: Student identification card
List of figures
Figure 1.1: Global cause-specific death toll 3 Figure 1.2: Cross-countries comparison of single NCD death toll 4 Figure 1.3: Non-communicable disease deaths according to World Bank income group 5 Figure 2.1: The sequence of health transformations 17 Figure 2.2: Causes of chronic non-communicable diseases 24 Figure 2.3: Estimated annual global death toll due to major risk factors 34 Figure 3.1: Randomized selection of study settings and participants 42 Figure 4.1: Frequency of physical inactivity according to age 55 Figure 4.2: Physical inactivity according to participants’ level of
education 56 Figure 4.3: Hypertension according to participants’ age-group 58 Figure 4.4: Overweight/obesity according to participants’ age-group 61 Figure 4.5: Total risk factors and frequencies among female
participants 63 Figure 4.6: Total risk factors and frequencies among male participants 63 Figure 4.7: Total risk factors according to mean age among adults 65 Figure 4.8: Total number of risk factors among study participants 66 Figure 4.9: Frequencies of individual risk factors among study
participants 66
xiii
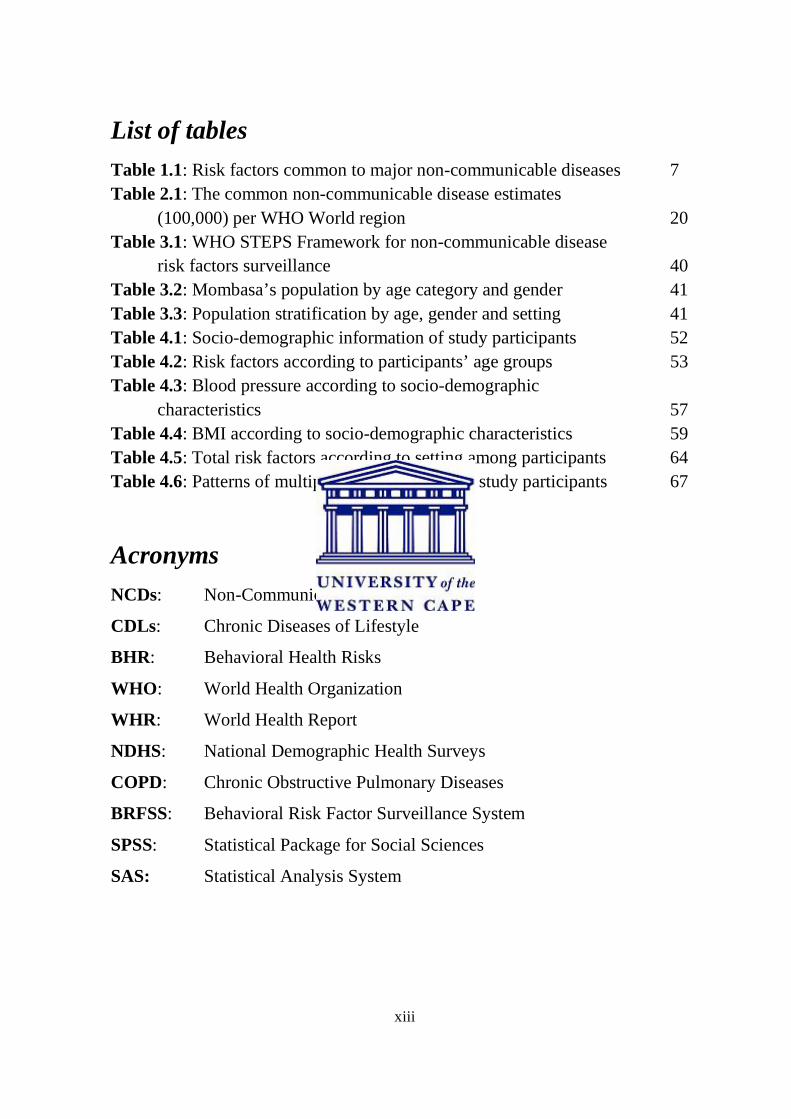
List of tables
Table 1.1: Risk factors common to major non-communicable diseases 7 Table 2.1: The common non-communicable disease estimates
(100,000) per WHO World region 20 Table 3.1: WHO STEPS Framework for non-communicable disease
risk factors surveillance 40 Table 3.2: Mombasa’s population by age category and gender 41 Table 3.3: Population stratification by age, gender and setting 41 Table 4.1: Socio-demographic information of study participants 52 Table 4.2: Risk factors according to participants’ age groups 53 Table 4.3: Blood pressure according to socio-demographic
characteristics 57 Table 4.4: BMI according to socio-demographic characteristics 59 Table 4.5: Total risk factors according to setting among participants 64 Table 4.6: Patterns of multiple risk factors among study participants 67
Acronyms
NCDs: Non-Communicable Diseases
CDLs: Chronic Diseases of Lifestyle
BHR: Behavioral Health Risks
WHO : World Health Organization
WHR : World Health Report
NDHS: National Demographic Health Surveys
COPD: Chronic Obstructive Pulmonary Diseases
BRFSS: Behavioral Risk Factor Surveillance System
SPSS: Statistical Package for Social Sciences
SAS: Statistical Analysis System

xiv
Chapter One
Introduction
1.1 Introduction
This chapter defines chronic non-communicable diseases and their core risk factors. It also
gives an elaborate overview of the global, regional and local trends of NCDs and their risk
factors. Reports on general frequencies and causative influence of the intermediate risk factors
for NCDs, including anthropometrical measurements relating to obesity/overweight and
elevated blood pressure, are illustrated. Associations between health-related behaviours and
gender, age and socioeconomic status are explored. The problem statement, aim, specific
objectives and significance of the study, as well as definitions of the key terms used, are also
given. The chapter ends with a brief summary of the main issues in every chapter.
1.2 Background of the study
Chronic non-communicable diseases (CNCDs) are defined as diseases or conditions which
affect individuals over an extended period of time (years, decades or even an entire lifetime)
and for which there are no known causative agents that are transmitted from one affected
individual to another (Daar et al, 2007). The main characteristic features of CNCDs include
their chronic and insidious clinical manifestations and the resulting long-term disability.

2
A recent report by the World Health Organization (2008) indicates that the global disease
profile is changing at an astonishing rate, with deaths and disabilities from CNCDs exceeding
those from infectious diseases and nutritional deficiencies.
According to Mendes et al (2007), chronic diseases of lifestyle (CDLs), which include
heart diseases, stroke, type 2 diabetes, cancer and chronic obstructive pulmonary diseases
(COPDs), account for almost 60% of global deaths and 47% of the global burden of disease.
Approximately 80% of the global CDLs deaths occur in low-income and middle-income
countries. If this situation persists, it may present a major challenge to global health
development.
According to WHO (2005a), the health and socioeconomic impact of non-communicable
diseases is currently increasing rapidly, making a substantial contribution towards the total
global mortality, global burden of diseases and the loss of disability–adjusted life years
(DALYs). From a total global death toll of 58 million people registered in 2005, non-
communicable diseases, particularly cardiovascular diseases (CVDs), cancer, chronic
obstructive pulmonary diseases (COPDs) and type 2 diabetes, accounted for 38 million deaths
(Ezzati, Lopez, Rodgers, Vander Hoorn, and Murray, 2005). This is double the total death toll
for all infectious diseases, including HIV/AIDS, tuberculosis, malaria, maternal and perinatal
conditions and nutritional deficiencies. It is projected that NCDs will increase by 17% by
2015 if action is not taken (Jong-Wook, 2005). Figure 1.1 below illustrates the most common
causes of death globally.

3
0
4000
8000
12000
16000
HIV/AIDS TB MALARIA CVDs CANCER COPDs DIABETES
Diseases
Dea
ths
in th
ou
san
ds
Figure 1.1: Global cause-specific death toll (Ezzati et al., 2005).
In the developing countries, non-communicable diseases are also emerging as a major public
health concern, and this is believed to be an attribute of the effects of industrialization, e.g.
adoption of a sedentary lifestyle, poor nutrition, cigarette smoking and risky alcohol intake,
coupled with improved health care in infection control and improved general mean life
expectancy (Yusuf, Reddy, Ouupun and Anand, 2001). The major causes of morbidity and
disability in the developing countries have shifted from a predominance of nutritional
deficiencies and infectious diseases to non-communicable diseases (Yusuf, et al, 2001). This
became evident when approximately 75% of the total global individual non-communicable
disease cases were recorded in the developing countries, especially those in sub-saharan
Africa (WHO, 2005a). Figure 1.2 below illustrates the gross disparity in non-communicable
disease deaths between developed and developing countries.

4
Figure 1.2: Cross-countries comparison of single NCD death toll. (World Health
Report, 1999).
This confirms the epidemiologic transition theory which attributes the increasing impact of
NCDs to economic, social and cultural changes which have led to a tremendous increase in
risk factors in the developing countries in which the majority of the world’s population lives
(Levenson, Skerrett, and Gaziano, 2003). This suggests that non-communicable diseases have
shifted from being regarded as diseases of the Western world or the affluent societies to those
of the developing countries and the poor. This was demonstrated by Yusuf et al. (2001) in a
comparative study which revealed a high prevalence of cardiovascular diseases in Nigeria and
Cameroon compared to the United Kingdom and America. The authors also showed that, as
the epidemic advances in the developing countries, the socioeconomic gradient reverses, with
the poor becoming the more vulnerable victims.
This is in line with the WHO’s (2005a) report which indicated that only 20% of non-
communicable diseases occur in high-income countries, with the majority (80%) occurring in
the middle- and low-income countries.

5
The health status and disease profile of human societies are thus linked to the level of their
socioeconomic development. Figure 1.3 below illustrates the global non-communicable
disease deaths per income group as defined by the World Bank for each country.
0
2000
4000
6000
8000
10000
12000
14000
16000
Low income Middle income High income
Income groups.
Tota
l dea
ths
(000
).
Figure 1.3. Non-communicable diseases: deaths per country income group.
(World Health Report, 2002).
Based on the World Bank income groupings, the World Health Report (2002) indicated that
Kenya, South Africa and the United Kingdom represent low-, middle- and high-income
countries respectively.
According to Levenson, Skerrett and Gaziano (2003), chronic disease epidemics take
decades to become fully established and have their origins at early ages.
In a cross-country comparative study by Forrester, Cooper and Weatherall (1998), it was
demonstrated that NCDs deaths occur at much earlier ages in low-income countries such as
Kenya, compared to high-income countries like the United Kingdom, with approximately half
of the victims being females.

6
Kenya and Nigeria are both countries in the sub-saharan region of Africa with similar
environmental and socioeconomic conditions underlying their populations’ health status.
In contrast, the United Kingdom and Canada are both developed countries which have
experienced major advances in the public health sector. These factors link the earlier report on
Kenya and the United Kingdom by Forrester et al (1998) to a recent World Health
Organization’s (2005b) finding that there is a remarkably high NCD death rate among middle-
aged people in Nigeria compared to Canada, where NCD deaths are predominantly among the
oldest age group. It is further illustrated in the report that mortality rates for all NCDs rise
with increasing age, and that almost 45% of NCD deaths occur prematurely under the age of
70 years.
According to the literature, there is a widespread scientific and public health consensus that
the likelihood of developing NCDs is linked to the exposure of an individual, community or
population to a cluster of behavioral risk factors, such as tobacco use, unhealthy diets and
physical inactivity. This has been reported in most chronic disease risk-factors surveillance
studies in different countries by authoritative authors like Bonita, Courten, Dwyer, Jamrozik
and Winkelmann (2001).
Table 1.1 below highlights the common major risk factors for various non-communicable
diseases as illustrated in Bonita et al’s 2001 study.

7
Table 1.1: Risk factors common to major non-communicable diseases (Bonita et al.,
2001).
Risk factor Condition
Cardiovascular disease*
Diabetes Cancer Respiratory conditions**
Smoking � � � �
Alcohol � � � �
[Poor] nutrition � �
Physical inactivity � � � �
Obesity � � � �
Raised blood pressure � �
Blood glucose � � �
Blood lipids � � �
*Including heart disease, stroke, hypertension. ** Including chronic obstructive pulmonary disease and asthma.
These factors are measurable and largely modifiable, hence can be used to describe the future
distribution pattern of diseases in a population.
Existing and developing knowledge regarding these risk factors suggests that prevention of
future epidemics is possible. An epidemiological study of risk factors carried out in
Switzerland by Galobardes, Costanza, Berstein, Dehumeau, and Morabia (2003) demonstrated
that there exists a significant association between NCDs and some socio-demographic and
health factors, including gender, age, ethnicity, level of education and work status.
The association observed by Galobardes et al (2005) is consistent with the outcome of a
National Health Survey on the prevalence of cigarette smoking, risky alcohol consumption,
physical inactivity and overweight among the American population (Fine, Philogene,
Gramling, Coups and Sinha, 2004). The American study revealed that gender, age, occupation
and educational levels are significantly associated with chronic disease risk factors.

8
In the study of risk factors trends in Switzerland by Galobardez et al (2005), it was
further revealed that both men and women of low socioeconomic status possessed adverse risk
factor profiles. For example, current smoking among females was inversely related to
decreasing occupation level, while high physical inactivity levels were predominant among
low socioeconomic status men, and mean BMI increased among men of high socioeconomic
status. This observation, as in most other risk factors surveillance studies, highlights the
intricate relationship between a population’s socio-demographic characteristics and chronic
disease risk factors, which seems to guarantee further explorative studies. In the United
Republic of Tanzania, Chande and Salum (2002) explored the correlation between alcohol
consumption and various socio-demographics, including age, gender, occupation and level of
education. The 25 – 35 years age group showed a high prevalence, with a male predominance.
Primary school drop-outs and teachers drank more than any other educational group, while
businessmen drank more than any other occupational group. The apparent dynamics in
chronic disease risk factor prevalence signify that population-wide primary prevention
interventions are probably less effective, and are an undesirable option for public health
authorities.
The findings of the Fine et al study (2004) suggest that there is quite a considerable body
of epidemiological information regarding the prevalence of individual risk factors. They
indicate that these risk factors often co-occur in specific combinations, yet little is known
about the most recent patterns of risk factors among individuals; this could hopefully
stimulate a target-specific and effective multiple level intervention by the health care systems.
Berrigan, Dodd, Troiano, Krebs-Smith and Barbash (2003) in a National Behavioral Risk
Factor Study demonstrated that the majority of adult Americans have three or more risk
factors, and 17% present with multiple risk factors co-occurring in specific clusters, with the
most common pattern being physical inactivity and overweight/obesity.

9
In a WHO STEPwise study in Indonesia, Nawi, Stenlund, Bonita, Hakimi, Wall and
Weinehall (2006) reported a high smoking prevalence among men in both rural and urban
populations, with clustering of risk factors higher among the richest quintile of the rural
population. This confirms the vulnerability of the poor towards adoption of health risk
lifestyles and the development of non-communicable diseases, a trend which is contrary to the
long-held misconception that non-communicable diseases only affect the rich.
Historically, the prevention and control of infectious diseases was emphasized by
governments and international health organizations through the ministries of health, with non-
communicable diseases generally receiving little attention in the global, regional and local
health care agendas. Supporting this claim is the fact that non-communicable disease control
and prevention is not one of the priority issues of the Millennium Development Goals (MDG)
target, as noted by Ezzati et al (2005) in their comprehensive analysis of the global burden of
diseases. The impact and profile of non-communicable diseases is insufficiently appreciated,
but with their growing health and socioeconomic burden upon people, families, communities
and governments, the need for urgent action is clear.
It is projected that by 2020 non-communicable diseases will surpass infectious diseases as
the world’s leading cause of morbidity and mortality (Levenson, Skerrett and Gaziano, 2003).
Hence identification of the prevalence and the distribution pattern of the major risk factors
known to predispose people to the development of non-communicable diseases forms the
basis for effective primary preventive and control interventions (Bonita et al., 2001). The
authors also recommend that, in order to contain this emerging epidemic, informed
comprehensive population-based preventive programs should be initiated among
communities, as reported by Lazcano-Ponce et al (2003) in the case of the American Medical
Association, which developed guidelines for chronic disease preventive services.

10
This current WHO STEPwise study was therefore motivated by the general lack of
documented information indicating the prevalence of the major common non-communicable
disease risk factors and their distribution pattern among people living in Mombasa, Kenya.
Such information, it was believed, could form the baseline data for a future extensive study. It
was also envisaged that the outcome would inform better decision-making among public
health policy planners and health personnel.
The main chronic non-communicable diseases focused on in this study include
cardiovascular diseases, mainly heart diseases and stroke, cancer, chronic respiratory diseases
and type 2 diabetes. The behavioral and intermediate risk factors discussed include smoking,
risky alcohol consumption, physical inactivity, hypertension and obesity/overweight.
1.3 Problem statement
The emerging threat of non-communicable diseases in Kenya needs to be combated by
effectively monitoring its prevalence and the prevalence of risk factors. Planning and
execution of cost-effective intervention programs calls for identification of the most
vulnerable groups at risk in a population. This challenge motivated the undertaking of this
study in Mombasa, Kenya, where data on risk factors surveillance was lacking.
1.4 Aim of the study
The purpose of this study was to determine the prevalence of risk factors for non-
communicable diseases among men and women aged between 15 and 70 years living in
Mombasa, Kenya.

11
1.5 Specific objectives
1.5.1 To determine the prevalence of health risk behaviors such as smoking, risky
alcohol consumption and physical inactivity.
1.5.2 To determine the prevalence of hypertension.
1.5.3 To record anthropometrical measurements as they relate to obesity/overweight.
1.5.4 To determine the association between socio-demographic factors and the
prevalence of the above risk factors for non-communicable diseases.
1.6 Significance of the study
Most developing countries of sub-saharan Africa, including Kenya, are faced with a double
burden of infectious diseases and the emerging non-communicable disease pandemic. This is
a concern for public health since it poses a great threat to already overstretched and poorly
structured health care systems.
Statistics show that non-communicable disease morbidity and mortality are rapidly
increasing, especially among the poorest of the poor. WHO member countries resolved that
surveillance of the major common risk factors would form a comprehensive baseline starting
point for the legislation, planning and execution of health promotion interventions. Results in
this study would complement the scarce knowledge on the existing interactions between
socio-demographic characteristics, behaviour and non-communicable diseases among
residents of Mombasa. This information will facilitate the training and practice of health care
workers, including medical doctors, physiotherapists, environmental health officers and
nurses. Similarly, various institutions, including schools and organizations, may use our
results to adopt a health-promoting strategy for non-communicable disease control and
prevention in their settings.

12
1.7 Definition of terms
Chronic non- communicable diseases (CNCDs)
CNCDs are defined as diseases or conditions which affect individuals over an extended period
of time and for which there are no known causative agents that could be transmitted from one
affected individual to another (Daar et al, 2007).
Risk factors
A risk factor refers to any attribute, characteristic or exposure of an individual which increases
the likelihood of his or her developing a non-communicable disease (WHO, 2005a).
Lifestyle
The way in which a person or a group lives (Hornby, 2000).
Chronic diseases of lifestyle (CDLs)
This is a group of diseases which affect people who share similar risk factors as a result of
exposure, over many decades, to unhealthy diets, smoking, lack of exercise and possibly
stress. The major risk factors include high blood pressure, tobacco addiction, high blood
cholesterol and diabetes. These are also called non-communicable diseases or degenerative
diseases (Fourie, 2001).
Health promotion
This is defined as the process of enabling people to increase control over, and to improve,
their health, to reach a state of complete physical, mental and social well-being (Coulson,
Goldstein & Ntuli, 2002).
Public health
This is the science and art of promoting, protecting and improving health and well-being
through the organized efforts of society (McPherson, 2001).

13
1.8 Summary of chapters
Chapter one describes the background of the study. A detailed description of the profile of
chronic non-communicable diseases and their common behavioral risk factors is given at the
global, regional and local levels. The purpose, problem statement, aim, specific objectives and
the significance of the study are also presented in this chapter.
Chapter two presents a review of the literature which is pertinent to our study. Global
evolution and epidemiology of chronic non-communicable diseases, as well as
transformations in diseases profiles and health status, are indicated. A multi-level analysis of
the current trends in behavioral health risk factors is presented. An account of the health and
socioeconomic impact of non-communicable diseases on individuals, communities and
governments is also given in this chapter. Finally, the chapter highlights some evidence-based
intervention programs which have proved effective in the prevention and control of non-
communicable diseases.
Chapter three gives an account of the methodology employed during the research process. A
description of the study design, study setting, target population and sample, as well as the
sampling method used, are given. In addition, the method of data collection, the instrument
used and the protocol observed during data collection are mentioned. Matters pertaining to
ethics are also included in this chapter.
In chapter four, an account of the descriptive and inferential statistic analysis of the study is
presented.

14
Chapter five discusses the main findings of the study with regard to the relevant literature
reviewed. Consistencies and disparities between previous studies and our present study are
reported. Limitations encountered during the research process are stated.
Chapter six gives a summary of the main findings of our study. Conclusions drawn from the
main findings are presented. Finally, recommendations based on our analysis are suggested.
15
Chapter Two
Literature review
2.1 Introduction
This chapter presents a review of the relevant literature on the global evolution and
epidemiology of chronic non-communicable diseases. The current trends in behavioral health
risk factors are observed within and between different populations. Studies focusing on the
associations between health risk factors and populations’ socio-demographic characteristics
are reviewed, as well as theories underlying risk factors patterns among populations. The
chapter also looks at the health and socioeconomic impact of non-communicable diseases
upon individuals, societies and governments. Finally, global and regional models of evidence-
based cost-effective preventive and control programs are presented.
2.2 Urbanization and emergence of non-communicable diseases
According to WHO (2008), the disease profile of the world is changing at an astonishingly
rapid rate, especially in low- and middle-income countries. This report is consistent with the
findings of a global health survey by Levenson, Skerrett, and Gaziano (2003) who showed
that non-communicable diseases have in the past century drastically shifted from being
relatively inconsequential to becoming leading causes of morbidity and mortality. In their
report, Levenson et al (2003) also attribute the alarming trend of non-communicable diseases
to improved public health measures and medical care, which has led to longer life spans and a
reduction of mortality from infectious diseases and nutritional deficiencies.

16
However, they further argue that economic, social and cultural changes brought about
by urbanization, especially in the developing countries, substantially contribute to the
evolution of non-communicable diseases through the adoption of a sedentary lifestyle,
western diet and health risk behaviours such as smoking and alcoholism. These observations
confirm the historic emphasis put on infectious diseases control and prevention by health
departments and international health organizations, with relatively little consideration being
given to the impact of urbanization on disease profile and health.
The literature shows that the world has in the past few decades experienced the greatest
historical improvements in health care. Health statistics further indicate that many of the
achievements have been documented under infectious disease prevention and treatment
following scientific advances in medical technology and public health infrastructure. This,
together with the widespread consumption of high-calorie processed foods and a low energy
expenditure due to increased mechanization, is a byproduct of urbanization which has
substantially altered the health status and diseases profiles of most populations globally
(Forrester, Cooper and Weatheral, 1998).
Most of the marked societal, economic and environmental changes have been closely
associated with urbanization. The rates of urbanization, according to Chockalingam and
Balaguer-Vinto (1999), are increasing globally, from 44.8% of the world living in urban areas
in 1994 to a projected 61.1% by 2025. With urbanization being the major driving force behind
the development of non-communicable diseases, this trend reflects an increasing risk of a
potential global epidemic.
2.3 The epidemiologic transition
A theory put forward by Omran (1971) on the evolution of a population’s health, otherwise
known as epidemiologic transition, demonstrates that there is usually a predictable sequence
17
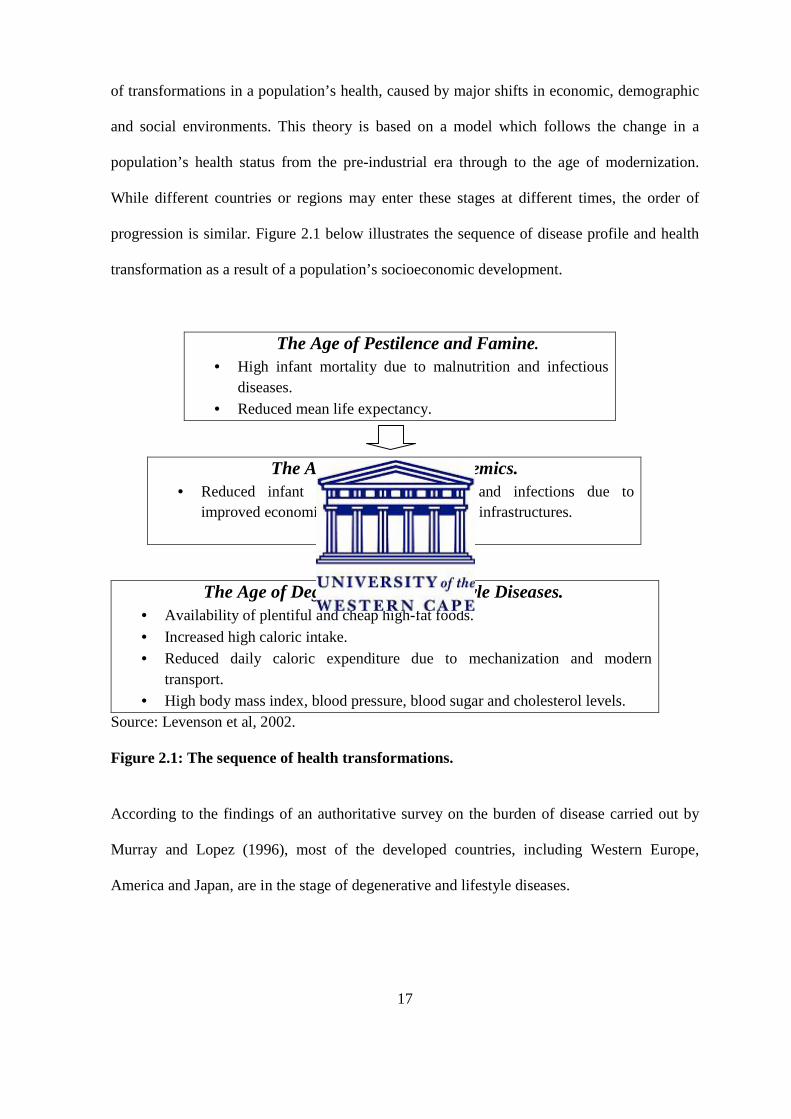
of transformations in a population’s health, caused by major shifts in economic, demographic
and social environments. This theory is based on a model which follows the change in a
population’s health status from the pre-industrial era through to the age of modernization.
While different countries or regions may enter these stages at different times, the order of
progression is similar. Figure 2.1 below illustrates the sequence of disease profile and health
transformation as a result of a population’s socioeconomic development.
The Age of Pestilence and Famine.
• High infant mortality due to malnutrition and infectious diseases.
• Reduced mean life expectancy.
The Age of Receding Pandemics. • Reduced infant mortality, malnutrition and infections due to
improved economic status and public health infrastructures.
Source: Levenson et al, 2002.
Figure 2.1: The sequence of health transformations.
The Age of Degenerative and Lifestyle Diseases. • Availability of plentiful and cheap high-fat foods.
• Increased high caloric intake. • Reduced daily caloric expenditure due to mechanization and modern
transport. • High body mass index, blood pressure, blood sugar and cholesterol levels.
According to the findings of an authoritative survey on the burden of disease carried out by
Murray and Lopez (1996), most of the developed countries, including Western Europe,
America and Japan, are in the stage of degenerative and lifestyle diseases.
18
The authors also state that in most of the developing countries, the transition occurs across
different socioeconomic groups, beginning with the highly privileged and eventually
spreading to those in the lower socioeconomic positions.
The Murray and Lopez study is an excellent comprehensive analysis of the global burden
of disease, and its findings suggest that non-communicable disease trends vary in different
countries and within a population’s socioeconomic classes.
In an epidemiological comparative study by Forrester, Cooper and Weatheral (1998), the
findings demonstrated a virtual absence of hypertension in rural Africans, with a moderate
prevalence in the Caribbean. There was also a steep gradient in the body mass index and its
determinants in Nigeria, Jamaica and America. This reflects the differences in health
transformation among these countries, conforming to the Omran model of epidemiologic
transition.
In a global epidemiological survey of non-communicable diseases and their determinants,
Yusuf, Reddy, Ounpuu and Anand (2001) revealed a significant association between a
population’s health status, its disease profile and the level of its socioeconomic development
and social organization. In their review, they also noted a drastic shift in the global causes of
disability and death, from a predominance of infectious diseases and nutritional deficiencies to
chronic non-communicable diseases, a change they attributed to urbanization. However, it is
concerning to note that in most of the developing and middle-income countries, the increased
incidence of non-communicable diseases adds to the continuing burden of infectious,
nutritional and perinatal diseases, imposing a double burden on these countries.
2.4. Non-communicable diseases: The global situation
According to WHO (2005a), non-communicable diseases, including heart diseases and stroke,
cancer, chronic obstructive pulmonary diseases and type 2 diabetes, are the major causes of
death and disability worldwide, including many young people and those in middle age.

19
This drastic shift in the leading global cause of death, from infectious diseases and
malnutrition to non-communicable diseases, poses a great public health concern. As noted in
the global burden of disease survey by Murray and Lopez (1996), most of the non-
communicable disease cases are detected in the low- and middle-income developing countries
where the majority of the world’s population lives. The increasing impact of non-
communicable diseases in these countries threatens to overwhelm already stretched health
care systems. The Murray and Lopez analysis also revealed that the total global disease
burden, including non-communicable diseases, is unequally distributed, with nearly 90%
occurring in the developing countries, yet only 10% of the total global expenditure is allocated
to those countries. This disparity presents a major public health inequity, one worthy of urgent
address by the international health organizations if a desirable outcome is to be expected in
the prevention and control of non-communicable diseases in the developing countries, which
contribute substantially towards the global morbidity and mortality rates. Table 2.1 below
shows the WHO estimates for non-communicable diseases in different world regions.
Table 2.1: The common non-communicable diseases estimates (100,000) per WHO,
World region.
NCDs Africa Europe America
Cardiovascular diseases (heart diseases &
stroke)
4214
6078
6006
Cancer 1064 1045 1307
Diabetes mellitus 113 264 421
Chronic respiratory conditions 1199 1088 980
Source, WHO 2001.

20
2.4.1 Non-communicable diseases in developed countries
Statistics by the World Health Organization (2008) indicate that deaths worldwide from non-
communicable diseases exceed those from infectious diseases. It was also revealed that a
relatively smaller proportion of approximately 20% of deaths from non-communicable
diseases occur in the developed countries, where major advancements in primary health care
and public health infrastructure have been achieved. However, as revealed lately in the
United States of America by Gregg et al (2008), this status is currently being challenged by
the declining rates in the eradication of non-communicable diseases as well as marked
disparities in prevalence across racial and ethnic boundaries. With reference to the Omran
model on the global epidemiologic transition, various populations face different health status
transformations, depending on their underlying socioeconomic determinants. Developed
countries are in this respect essentially classified in the age of delayed degenerative diseases
characterized by fully advanced primary health care systems and technological advancements
(Levenson et al, 2003).
According to Colagiuri, Colagiuri, Yach and Pramming (2006), there is a considerable
epidemiological consensus that non-communicable diseases, especially cardiovascular
diseases and cancer, are the leading causes of premature mortality and reduced quality of life
in the developed countries.
In a study to evaluate the cause-specific mortality rate in the United States, Europe and
Australia by Unal, Critchley and Capewell (2005), it was revealed that cardiovascular diseases
are the largest cause of death. In line with the findings of the global burden of disease study,
the authors also reported a reduction in the mortality rate in Britain and most of the
industrialized countries. This is likely due to the impact of an improved primary health care
system and advanced medical technology, as seen for example in New Zealand where

21
Capewell, Beaglehole, Seddon and McMurray (2000) reported a 50–75% reduction in cardiac
deaths following a population-wide prevention program and modernized cardiological
treatments.
2.4.2 Non-communicable diseases in middle-income economies
The profile and impact of non-communicable diseases across different economies is well
recognized. In Latin America and the Caribbean countries, which form part of the middle-
income group of countries, this emerging epidemic is no exception. A study by Perel, Casas,
Ortiz and Miranda (2006) indicated a 73% prevalence of mortality from non-communicable
diseases and a 76% prevalence of disability-adjusted life years (DALYs), with the major
contribution being from cardiovascular diseases. This dominance is projected to rise
significantly by 2020. In line with the Yusuf et al (2001) findings, this study identified
urbanization, globalization and population aging as the major driving forces underlying the
dynamics of a population’s health.
Likewise, in Asia and the Pacific region, a report by Sen (1998) suggested that advances in
socioeconomic development and changes in demographics had altered the profile of the major
causes of mortality and morbidity, with indications that infectious and parasitic diseases were
no longer the major causes of death in the region. These findings collectively underline the
transitions in global disease profiles and health facing different populations under the adopted
negative effects of urbanization.
In an African cause-specific mortality rate study using data from demographic surveillance
sites, Adjuik et al (2006) found that South Africa registered more deaths due to non-
communicable diseases when compared to most other African countries. According to the
authors, this is attributable to the country’s socioeconomic and demographic status, supporting
similar associations observed in related studies in the field of non-communicable disease
epidemiology.
22
2.4.3 Non-communicable diseases in low-income countries
The low-income developing countries are composed of most Asian and sub-saharan African
countries. They host the majority of the world’s population and are characterized by poor
health care systems and under-developed public health infrastructures (Mathers and Loncar,
2006). This status puts the developing countries in a challenging position in dealing with
existing infectious diseases and emerging non-communicable diseases. A comparative
international survey on the burden of non-communicable diseases by Boutayeb and Boutayeb
(2005) highlighted a global concern with increasing trends in developing countries, where the
transition imposes more constraints in dealing with the double burden of both infectious and
non-communicable diseases.
This relates to observations made by Unwin et al (2001) that infectious diseases remain a
predominant health problem in developing countries, especially in sub-saharan Africa,
compounded by the emerging epidemic of non-communicable diseases.
The Boutayeb and Boutayeb study also observed an accelerating trend in non-
communicable disease mortality rates, from 47% to 56% between 1990 and 2000, reaching a
projected 69% in 2020. Though relatively lower than the 80% mortality toll reported by Ezzati
et al (2002), the increasing trend poses a great public health challenge in those developing
countries which are characterized by poor health care systems.
In the oft-cited burden of disease study by Murray and Lopez (1996), it was revealed that
more people died of non-communicable diseases in the developing countries compared to the
developed countries. Kenya, as one of the low-income countries of the sub-saharan African
region, is no exception to this emerging public health threat.
23
2.5. Determinants of non-communicable diseases: The role of
health risk factors
A “risk factor” refers to any attribute, characteristic or exposure of an individual
which increases the likelihood of developing non- communicable disease. In the public
health context, risk factor measurement is used to describe the distribution pattern of
future diseases in a population. (WHO, 2001).
According to the findings of an American national health survey by Mokdad, Marks, Stroup
and Gerberding (2004), a large body of epidemiologic studies has clearly demonstrated that
behavioral factors such as cigarette smoking, risky drinking of alcoholic beverages, physical
inactivity and unhealthy dietary practices contribute significantly to preventable chronic non-
communicable disease morbidity and mortality. In line with observations made by WHO
(2005a), the authors also found extensive evidence for a multi-factorial interaction between a
population’s underlying socioeconomic determinants and the risk factors. These analyses,
together with many other studies conducted in this discipline, attempt to present non-
communicable diseases as a consequence of the negative effects of modern lifestyles,
especially among developing populations. Figure 2.2 below illustrates the multi-factorial
determinants underlying the development of chronic non-communicable diseases.

24
Underlying socioeconomic determinants Urbanization, globalization, population ageing.
Common modifiable risk factors Unhealthy diet, physical inactivity, smoking, risky alcohol consumption.
Intermediate risk factors Raised blood pressure, raised blood glucose, abnormal blood lipids, overweight/obesity.
Figure 2.2 Causes of chronic non-communicable diseases (WHO, 2005a).
In America, a chronic disease primary prevention study by Grundy, Bazzarre, Cleeman,
D’Agostino, Hill and Houston-Miller (2000) indicated that most chronic non- communicable
diseases share common preventable risk factors. Although a considerable number of studies
have described the prevalence of individual common risk factors, little has been documented
concerning the most recent patterns of risk factors occurring among populations (Fine,
Philogen, Gramling, Coups and Sinha, 2004). As stated in an Indonesian risk factor
surveillance study by Nawi, Stenlund, Bonita, Hakimi, Wall and Weinehall (2006), risk
factors often co-occur and this clustering significantly increases the risk of morbidity and
mortality from non-communicable diseases.
Main chronic non- communicable diseases Heart diseases, stroke, cancer, chronic respiratory diseases, type 2 diabetes.

25
Although the Nawi et al study findings cannot be generalized, due to the fact that the study
setting was purely rural, consistent observations that risk factors do not occur at random but
rather in specific combinations were made in a previous nationally representative study of
multiple behavioural risk factor patterns in the United States by the American Institute of
Medicine (2001).
The literature in this field reveals a considerable consistency in multiple risk factor trends,
through investigations conducted in different settings. In support of this observation, studies
by Frantz (2006) and Lazcano-Ponce et al (2003) among public high-school adolescents in the
Western Cape, South Africa, and in Morelos, Mexico, reported a high prevalence of multiple
risk factors, setting the stage for non-communicable disease epidemics later in their
adulthood. Though the findings could be criticised on the grounds that the authors focused on
institutionalized adolescents, rather than across a whole population, these reports, in the
opinion of Ezzati et al (2002), have literally shifted the causal attribution of risk factors from
the traditional context of individual risk factor to combined patterns of occurrence.
It is clear that a gap exists in the epidemiological knowledge concerning multiple risk
factor prevalence, especially in developing countries. This in my opinion could be primarily
due to the rudimentary state of the public health research infrastructure. This situation poses a
great challenge to public health planners in their endeavors to plan and execute prevention and
control programs for chronic non- communicable diseases.
2.6 Prevalence of individual health risk factors
2.6.1 Physical inactivity
Sedentarism or the lack of sufficient appropriate physical activity is generally recognized as a
by-product of increased mechanization, economic transitions and the shift to physically less
demanding modes of transportation. Physical inactivity is currently one of the leading
modifiable causes of chronic non-communicable diseases globally (WHO, 2002).

26
According to statistics by the World Health Organization (2008), it is one of the ten leading
global causes of death and disability. Approximately two million deaths each year are
attributable to physical inactivity, according to the global cause-specific mortality rate data
(WHO, 2003).
Physical inactivity has therefore become a major public health concern as patterns of
sedentarism seem to worsen among people of all ages worldwide (CDC, 2001). In the United
States, 25% of the population did not participate in physical activities, according to a report by
the international Center for Disease Control and Prevention (1996). This low level of
participation could be associated with the observed lack of awareness about physical activity
and health among one third of the American population, as reported by Morrow, Jackson,
Bazzarre, Milne and Blaire (1999). Recent data from the Center for Disease Control and
Prevention (2003) further indicates that only about one in five Americans engage in adequate
physical activities.
Diminishing physical activity levels have been observed in several countries, including
Australia by Baumann and Campbell (2001) and Britain (Health Education Authority, 1998).
In Canada, according to Katzmarzk, Gledhill and Shepherd (2000), the trend was rapidly
worsening, eventually prompting an integrated intervention from government, the private
sector and communities.
Although these studies were conducted in the developed countries, the findings could
represent a global profile because, with industrialization, populations in the middle- and low-
income developing countries have adopted westernized sedentary lifestyles.
A regional documentation of physical activity levels among high-school learners in the
Western Cape, South Africa, by (Frantz, 2006) and (Philips, 2001) reported respectively a
32% and 65% prevalence of physical inactivity. Though based on high-school participants,
these analyses present a picture of the future distribution of physical inactivity-related

27
diseases in this community. According to observations made by Frantz (2006), physical
inactivity is prevalent in most countries of the world, including sub-saharan Africa. The rapid
increase in the number of people exposed to the hazard of low physical activity levels poses a
major public health challenge.
Data on the local profile of physical activity levels in Kenya, as reported in a
comprehensive National Health Survey in Kenya (WHO, 2004), demonstrate that 9.4% of
both males and females aged 18 – 69 years are physically inactive. This should concern the
public health authorities since it directly promotes overweight and obesity, the intermediate
risk factors for heart diseases, stroke and type 2 diabetes.
2.6.2 Smoking
The World Health Report (2002) presented smoking as one of the common modifiable risk
factors for chronic non-communicable diseases and the second leading cause of death
worldwide. According to Guindon and Boisclair (2003), it is currently estimated that
approximately 1.3 billion people smoke globally. Among these, about 84% live in developing
and transitional economy countries.
They also observed that while smoking rates are declining in the established market
economies like America, there is an alarming rise in the developing countries, where 70% of
the global tobacco-related deaths occur. The decline in smoking in the established market
economies is a result of advances made in public health policy-making, research and practice
regarding chronic non-communicable disease prevention. In the developing countries, on the
other hand, the increasing trend in smoking rates is considered as a negative effect of
urbanization. This suggests that, as the socioeconomic status of a population improves,
adoption of health risk behaviour becomes predominant, as noted by Levenson, Skerrett and
Gaziano (2002).

28
The WHO (2008) projections demonstrate that by 2020 smoking will account for more
than 12% of total deaths in the developing countries, the highest single-disease death toll ever
registered. Without an integrated action by the governments, private sector and communities,
this trend would translate into a future epidemic of cancers and chronic obstructive pulmonary
disorders. It would increase the total disease burden in these countries where researchers,
including Murray and Lopez (1996) in their comprehensive global burden of disease analysis,
have shown that infectious diseases and nutritional deficiencies are still a major public health
challenge.
The Global Youth Tobacco Survey and the Global School–Based Student Health Survey
(WHO, 2004) reported that smoking begins at the ages of 13 – 15 years, when the ability to
understand the long-term consequences of this behaviour is very limited. This is consistent
with observations made by Coetzee and Underhay (2003) in South Africa, that adolescents
from as early as 13 years participate in health risk behaviours, including smoking.
The rural-urban disparities in smoking prevalence among adolescents have been attributed
to a lack of tobacco-related information in the rural schools and the influence of paternal
smoking, as observed in an Indonesian tobacco control study by Achadi, Soerojo and Barber
(2005).
Researchers in the field of chronic disease epidemiology have identified a number of
correlates for the current smoking trend, such as gender, age, level of education and work
status. In a recent national multi-level analysis of the predictors of smoking in China, Pan and
Hu (2008) found a strong positive correlation between age and smoking prevalence,
suggesting that as people age, they become more likely to smoke. Consistent with previous
literature, males were reported to be more likely to smoke than females. The Pan and Hu
analysis is reliable since it is based on quality data derived from a nationally representative
sample of 4,000 households, coupled with a sound methodology.
29
Locally, a Kenyan national health survey (WHO, 2005c) reported a 21% smoking
prevalence among men aged 18 years and over as the highest of all population categories.
However, smoking studies conducted among high-school learners in Nairobi, Kenya,
(Kwamanga, Adhiambo and Amukoye, 2003) and Kampala, Uganda, (Mpabulungi and
Muula, 2004) reported prevalences of 32% and 17% respectively. This corresponds to the
findings of a Chinese study by Yang, Fan, Tan, Qi, Zhang and Samet (1999), showing that
there has been a rapid lowering in the age of smoking initiation.
A rather higher smoking prevalence regionally is that reported in a demographic health
survey by Pampel (2004) among males aged 15 to 59 years in Malawi and Zambia, which
recorded 40% and 20% smoking prevalences respectively.
While smoking is becoming increasingly common, especially in the developing countries,
data on the prevalence of predictors of smoking and evidence on which to base prevention
programs is still inadequate. This paucity seriously challenges the effectiveness of most anti-
tobacco interventions. The present study therefore attempts to bridge this knowledge gap in
Mombasa, Kenya, as a prerequisite for effective public health action.
2.6.3 Hypertension
According to a report by the American National Joint Committee on Hypertension, raised
blood pressure is now a major public health problem, affecting over 50 million individuals in
the United States and over 1 billion worldwide (Chobanian, Bakris, Black, Cushman, Green,
Izzo, Materson, Oparil, Wright and Roccella, 2003). The authors also indicated that
hypertension is a close correlate of Body Mass Index and has continuously and consistently
remained as a core intermediate health risk factor for coronary heart diseases as well as
ischemic and haemorrhagic stroke, the leading causes of morbidity and mortality worldwide.
Findings from the Strong Heart Study (SHS) by Wang, Lee, Fabsitz, Devereux, Best,
Welty and Howard (2006) in America reported a rising hypertension prevalence rate among

30
American Indians, consistent with the national and global trends. They also found a strong
positive correlation between measures of age, alcohol consumption, diabetes mellitus and the
risk of developing hypertension. This analysis suggests that population ageing, risky alcohol
consumption and being diabetic are combined significant risks of hypertension.
The literature also indicates that, despite the high rate of detection and treatment,
hypertension remains a major public health problem in the developed countries
With reference to the Omran epidemiologic transition model, hypertension is an early
hallmark of the transformation from the age of pestilence and famine to the age of receding
pandemics in the developing countries. According to Huang and Stamler (1996), this probably
explains the higher hypertension rates observed in the urban areas compared to the rural areas
in most developing countries of northern Asia and sub-saharan Africa where cardiovascular
mortality is high due to low detection and poor treatment of hypertension.
This relates to the findings of a risk factor surveillance study by Nawi et al (2006) in
Indonesia, which showed that the prevalence of hypertension was higher among the urban
population and the richest quintile in the rural areas, compared to the poorest rural quintile.
Contrary to this report, however, an earlier review by Popkin (1998) revealed that, as the
hypertension epidemic advances, the social gradient also reverses, with the poor becoming the
most vulnerable victims in both the developed and the developing countries. According to the
literature and as observed in this review, these variations are indicators of a significant direct
association between a population’s socioeconomic status and hypertension.
2.6.4 Overweight/Obesity
Overweight or obesity, together with hypertension, raised blood glucose and lipids levels, is a
major intermediate health risk factor for chronic non-communicable diseases. At least 2.6
million people die each year as a result of overweight and obesity, with mortality rates

31
increasing as the degrees of overweight increase, as measured by BMI (Dobson, Evans and
Ferrario, 1998).
According to Flegal, Carroll, Kuczmarski and Johnson (1998), the mean BMI is rising at
an alarming rate across all sectors of the population among the established market economy
countries like America and the United Kingdom. However, WHO (2005a) demonstrated that
overweight and obesity are not limited to developed countries. In many of the developing
countries, it is on the rise as well. In South Africa, the BRISK study by Steyn, Jooste and
Bourne (1991) reported a 44% obesity rate among African women living in the Cape
Peninsula. WHO (2005a) projects that more than 75% of South African women aged over 30
years will be overweight or obese by 2015.
According to the findings of an Indian study by Reddy, Prabhakaran, Shah and Shah
(2002), the apparently high rate of overweight and obesity in South Africa (WHO,2005a)
could be attributable to urbanization, improved socioeconomic status, the availability of high-
fat and protein foods, and moves towards more sedentary lifestyles.
Overweight and obesity have been known to increase in the late stages of the
epidemiologic transition. However, contrary to this long-held notion, the World Health Report
(1998) revealed a sharp increase in childhood and adolescent overweight and obesity in both
the developed and developing countries. This is suggestive of further increases in the
prevalence of overweight and obesity in the future.
The Kenyan overweight and obesity profile is equally worrying. As demonstrated in a
National Demographic and Health Survey (1998), an estimated 22% of Kenyan women aged
45 – 49 years were reported overweight and obese. Though not based on up-to-date data, the
statistics on the mean BMI are generally alarming and predictive of a future epidemic of
weight-related disorders. This situation needs an urgent address by the public health
authorities, since the cost of inaction is well understood and highly undesirable.

32
2.7 The impact of chronic non-communicable diseases and their
risk factors.
2.7.1 Health impact.
The lives of far too many people are being blighted or cut short by chronic diseases
such as heart disease, stroke, cancer, chronic respiratory diseases and diabetes. This
is no longer only happening in the high income countries. This is a very serious
situation to individuals, societies, public health and economies affected. (Jong-Wook,
2005).
In 2000, the 53rd World Health Assembly reported that public health advocacy, especially in
the developing countries, had been traditionally devoted to infectious diseases. In contrast, it
became clear that the impact and profile of non-communicable diseases had generally been
insufficiently appreciated.
Due to material deprivation, increased exposure to risks and decreased access to health
care services, the non-communicable disease burden is now concentrated among the low- and
middle-income countries with a majority of poor people (WHO, 2005a).
The health impact of chronic non-communicable diseases and their risk factors is estimated
in terms of mortality rate and the burden of diseases (DALYs) attributable to them. According
to the burden of disease study (Ezzati et al, 2002), chronic disease risk factors are the leading
cause of death in all countries, regardless of their economic development status.
Figure 2.3 below shows the global annual estimates of deaths attributable to the major risk
factors for non-communicable diseases.

33
Figure 2.3 Estimated annual global death toll due to major risk factors (WHO,
2005a).
2.7.2 Socioeconomic impact
Chronic diseases and poverty are interconnected in a vicious cycle. The poorest quintile in
almost all countries is more vulnerable to chronic diseases for several reasons, including
greater exposure to health-risk living conditions and decreased access to good-quality health
care services (Sachs, 2005).
Chronic diseases represent a major cost and a profound economic burden to individuals,
families, health systems and societies. According to Marmot (2004), chronic diseases may
cause poverty or worsen already existing poverty by ruining a family’s economic prospects
through direct catastrophic expenditure on health care services and prolonged loss of income.
This argument is supported by the findings of a case study in Jamaica by Henry-Lee and
Yearwood (1999) who found that approximately 59% of people with chronic diseases
reported financial difficulties caused by their illness.

34
A similar consequence was reported by Shobhana, Rama, Lavanya, Williams, Vijay
and Ramachandra (2000) in India, where people with diabetes appeared to spend more than
25% of their annual income on medical care. This suggests that the direct cost of non-
communicable diseases is high and that the indirect economic impact due to loss of income
following disability or premature death warrants serious consideration.
Contrary to this, Hulme and Shepherd (2003) argued that the existing knowledge seems to
underestimate both the economic implications of chronic diseases and the potential of chronic
disease prevention and health promotion in alleviating poverty, especially in the developing
countries. This could be due to the fact that the profile of non-communicable diseases and
their risk factors is insufficiently appreciated and not enough efforts have been made at the
local, national and even international level regarding prevention and control of chronic non-
communicable diseases.
This review has clearly revealed that chronic diseases place a grave economic burden on
individuals, families and countries, and that there is sufficient evidence to show that urgent
action is required to avoid an adverse impact on national socioeconomic development.
2.8 Models of best practice in the control and prevention of non-
communicable diseases
In 2000, the 53rd World Health Assembly passed a resolution on the prevention and control of
non-communicable diseases among member states in their efforts to reduce the toll of
morbidity, mortality and premature mortality related to non-communicable diseases (WHO,
2005a).
The main objective of this global strategy was to map the emerging epidemic and analyze
its social, economic and behavioural determinants in order to provide guidance for policy

35
making and public health action. It was proposed in the assembly that comprehensive and
integrated surveillance of non-communicable disease risk factors would be part of the wider
health information system recommended by the World Health Organization as an essential
national public health function.
The means of preventing and controlling most non-communicable diseases through
comprehensive and integrated action are already established, and have proved applicable and
cost-effective even in resource-constrained settings (Jong-Wook, 2005).
The paucity or lack of data on surveillance and monitoring of non-communicable diseases
and their risk factors, especially in most African countries, forms a hindrance to the planning
and implementation of informed, target-specific and cost-effective interventions.
Successful evidence-based interventions informed by up-to-date data from surveillance
systems have been documented in several WHO member countries. In America, for example,
using data from the 2001 National Health Interview Survey (NHIS), a workplace health
education program by the Johnson & Johnson’s Health and Wellness program established in
2002 offered chronic disease prevention and health promotion services to the company’s
employees (Goetzel et al., 2003). On evaluation a year after the commencement, the authors
recorded a significant reduction in the mean number of risk factors for non-communicable
diseases among the employees.
Another successful American documentation is a school-based health program dubbed the
Child and Adolescents Trial for Cardiovascular Health (CATCH) (Hoelscher et al., 2004).
This program, structured using data from the Behavioural Risk Factor Surveillance System
(BRFSS), was target-designed and recorded a substantial reduction in cardiovascular risk
factors among learners.
In a comparative study to investigate the cost of various public health interventions (World
Education Forum, 2000), the World Bank reported that school-based health programs are

36
highly cost-effective, even in low-income countries. This suggests that adoption and
transferability of such programs is highly feasible.
This review has revealed that national legal frameworks are also a fundamental element in
public health policy and practice. Other than the proactive workplace- and school-based
programs, population-wide policies on tax and price control have also proved effective in
enhancing desirable health-related behaviour.
A successful regional intervention was South Africa’s 33% reduction in smoking following
the introduction of a 50% increase in the retail prices for tobacco products in 1994 (Van
Walbeek, 2002). In the long run this will translate to reduced rates of chronic respiratory
disorders, cardiovascular diseases and multiple cancers among the entire population.
As seen in the cases of Costa Rica (Sankaranarayanan, 2002) and Mexico (Pan American
Health Organization, 2005), clinical prevention interventions are also a key component of
comprehensive programs aimed at reducing the risk of chronic disease onset in both
developing and developed countries. When based on multiple risk factor assessment and
properly delivered, they are highly effective in reducing disease and death and improving the
quality of life of people at risk of or living with chronic diseases. Though there is limited
documentation of proven clinical programs, the available few are notable exceptions and are
of great public health significance.
2.9 Conclusion.
Chronic non-communicable diseases have emerged as a leading cause of death and disability
globally. Health risk behaviors, including poor diet, risky alcohol consumption, smoking and
physical inactivity, have been closely associated with hypertension, overweight and obesity,
high blood sugar and high cholesterol levels, which ultimately lead to the development of

37
chronic diseases. The literature has attributed this to changes in the social, economic and
demographic environments following urbanization.
There is adequate disturbing evidence on the profile of non-communicable diseases, their
impact on health, their socioeconomic effect, and their risk factors at individual, family,
national and global levels.
As this review has demonstrated, knowledge exists on how to deal with this global threat in
order to save millions of lives. Comprehensive on-going surveillance of the major risk factors
is fundamental. For the resource-constrained countries of Africa, action is possible through
cost-effective interventions that have been proven to work in other WHO-member developing
countries.
For the Kenyan Department of Public Health to plan and execute a successful and cost-
effective chronic disease prevention program, a baseline starting point must be put in place.
This essentially involves up-to-date surveillance data on multiple risk factor analysis. The
paucity or absolute lack of such vital public health information motivated the undertaking of
this survey in Mombasa, Kenya, where data on chronic disease risk factor surveillance is
unavailable.

38
Chapter Three
Methodology
3.1 Introduction
This chapter describes the study setting and the rationale for its selection, the research design
employed, and the sampling techniques utilized. Tools of data collection and methods of data
analysis are outlined, as well as a description of the pilot study. The protocol observed to
ensure ethical considerations is also stated.
3.2 Research setting
The study was conducted in Mombasa, Kenya. This metropole is located along Kenya’s
coastline, measuring 83,603 square kilometers off-shore. It is Kenya’s second largest city,
forming the coastal provincial administrative capital. The population has a diverse multi-
ethnic background and is estimated at 828,5000 according to the Kenya National Bureau of
Statistics (1999 census).
Mombasa represents one of Kenya’s major sources of revenue, owing to its local, regional
and global tourism reputation, and to the port of Mombasa, which is a trade and commercial
gateway to most parts of the East and Central Africa.
The institutions where the study was conducted included four public high schools, two
boarding and two day schools. The participating tertiary institutions were a public university,
a university college, and a vocational training college. Workplaces comprised a public referral
hospital, a security firm and a sanitation and waste disposal company. A city marketplace, on
the other hand, was used as a community setting.

39
3.3 Study design
The researcher employed a cross-sectional quantitative design. The WHO STEPwise protocol
(WHO, 2005b), which provides a framework for the surveillance of non-communicable
disease risk factors, was used. This is a sequential process, starting with gathering
questionnaire-based data on key risk factors (Step 1), then moving on to taking simple
physical measurements (Step 2), followed by biomedical measurements (Step 3). The present
study, however, only utilized the first two steps, as advised by WHO for resource-scarce
settings like Kenya.
Table 3.1: WHO STEPS framework for non-communicable diseases risk factors
surveillance (WHO, 2005b).
Measures
STEP 1 (Questionnaire-based information)
STEP 2 (Physical measurements)
Core Self-reported socioeconomic and demographic variables, tobacco and alcohol use, physical inactivity, fruit and vegetable intake.
Measured height, weight, waist circumference, blood pressure.
Expanded core
Educational level, occupation, income, fat consumption, types of physical activities, treatment for hypertension and diabetes.
Hip circumference,
pulse rate.
3.4 Study population
The study was targeted at males and females aged between 15 and 70 years living in
Mombasa, Kenya. Stratification of the population was done according to age and gender, as

40
demonstrated by the Kenya National Bureau of Statistics (1999 census). Table 3.2 below
describes Mombasa’s population for various age categories according to gender.
Table 3.2: Mombasa’s population by age category and gender (Kenya National Bureau
of Statistics, 1999).
Age-group (Years) Male Female Total
15 – 19 25,899 29, 427 55, 329
20 -35 153, 168 118, 073 271, 241
36 – 50 52, 242 34, 983 87, 225
51 – 70 21, 549 14, 358 35, 907
3.5 Sampling technique
The study sample was determined through convenient stratification of the population
according to age, gender and setting.
Table 3.3: Population stratification by age, gender and setting.
Age-group
(Years)
Male Female Total Category Convenient
setting
15 – 19 25, 899 29, 427 55, 329 Adolescents High
schools
20 – 35 153, 168 118, 073 271, 241 Young adults Tertiary
institutions
36 -50 52, 242 34, 983 87, 225 Adults Workplaces
51 – 70 21, 549 14, 358 35, 907 Elderly Community

41
The convenient settings of public high schools, colleges, universities and workplaces were
listed and randomly sampled. The study participants were then randomly selected from the
chosen settings to form the study sample.
Using the Yamane formula n = N 1+ N (e²) (Yamane, 1967) to calculate the study sample, (where n = sample size, N = total population
and e = level of precision), approximately 500 participants were targeted with a composition
of 150 high-school learners, 200 university and college students, 100 from workplaces and 50
from communities. This was meant to ensure proportionate representation of the different
population categories in the selected study sample, as recommended by Babbie and Mouton
(2006).
Figure 3.1: Randomized selection of study settings and participants

42
3.5.1 High schools
From a total of 10 high schools (mixed boarding/day), the researcher randomly selected four
high schools. Using a class list as per admission for the 2008 academic year, 10 learners were
recruited per class per selected school from Forms I to IV by randomly picking every fifth
learner from each class list until the target was reached. In each of the four high schools, all
the randomly selected learners were gathered in a common room where they filled in the
questionnaires (Appendix I). At each school, a convenient corner of the common room was
identified and screened to ensure privacy during the taking of the anthropometrical
measurements.
3.5.2 Tertiary institutions
This category was comprised of two universities, two university colleges and two vocational
training colleges. The researcher randomly selected one institution from each of the three
categories. Stratification was done according to course of study and 70 participants were
conveniently recruited from each of the three selected institutions with a proportionate
composition per course of study. At every tertiary institution, all the selected participants were
asked to gather in a hall where they filled in the questionnaires (Appendix I).
Anthropometrical measurements were taken by the researcher and the research assistants at
the clinic in each institution.
3.5.3 Workplaces
The three workplaces selected consisted of a public referral hospital, a security firm, and a
sanitation and waste disposal company. A total of 35 willing participants from different job
categories were recruited in each of the three settings. Jobs were categorized into office

43
workers such as clerks and managers, station workers doing lifting, carrying or pushing
duties, and field workers involved in heavy lifting or digging. Questionnaires (Appendix I)
were distributed to the selected participants in their respective departments in each of the
workplaces. The taking of the anthropometrical measurements was done by the researcher and
the research assistants in convenient screened rooms allocated by the respective authorities.
3.5.4 Community
A city marketplace was conveniently selected by the researcher for this category. The
rationale for selecting the marketplace was the likelihood of involving the non-
institutionalized Mombasa residents. 50 participants were targeted in this category.
Recruitment for the study was based on participants’ willingness. A well lit and properly
ventilated small room was obtained next to the marketplace and was used as a central base
where participants could fill in the questionnaire (Appendix I). Using screens, a corner of the
room was isolated for taking the anthropometrical measurements.
3.6 Study instruments
Data were gathered using the WHO STEPS framework questionnaire (V1.4) Core and
expanded (Appendix I). This instrument is internationally recommended for surveillance of
the risk factors for non-communicable diseases (Bonita et al., 2001). Through close-ended and
scaled questions, it requires participants to give information concerning socio-demographics,
tobacco use, alcohol consumption, physical activities, diet and any history of diabetes and
hypertension (Step 1). The next procedure (Step 2) involved the measurement of systolic and
diastolic blood pressure and pulse rate. This was done using a Mars automatic digital blood
pressure monitor (MS – 700AM) with the participants seated and their left arms supported on
a flat surface level with the heart. Height and weight for MBI were measured using a Bio-

44
metric machine (BMS™), with participants standing flat-footed and without headgear. BMI
was calculated by dividing the participants’ height in square meters (m²) by their weight in
kilograms. A flexible (Oppo Pro-Sport) tape measure was used to measure the participants’
waist and hip circumference in an erect position. In particular, the researcher took care to
ensure that measurements were not taken on top of loose-fitting or heavy clothing.
3.7 Pilot study
The researcher recruited two research assistants, a physiotherapist and an occupational
therapist, and trained them on the protocol of taking the physical measurements and in
assisting the participants with filling in the questionnaires. This was followed by a pilot study
on 20 participants, composed of five from each of the four age and setting categories, in order
to determine the time taken by participants to complete the questionnaire (Appendix I) and to
ensure that the research assistants understood the protocol for taking the anthropometric
measurements. The piloted participants did not take part in the main study.
3.8 Reliability
Reliability is a fundamental concern in all measurements. It refers to the dependability or
consistency of measurements (Redfern and Norman, 1994). The reliability of the instrument
(Appendix I) in this study has been proved through previous similar studies done in some
WHO member states, such as Thailand in 2001 (WHO, 2005a) and Indonesia (Nawi et al.,
2006).
The anthropometric measurements were tested for intra-rater and inter-rater reliability and
re-tested in a pilot study before the main study to check reliability. The reliability testing
outcome was satisfactory, since repeated measurements by the researcher and research

45
assistants showed negligible differences. Similarly, the differences in the measurements taken
on the same participants by the researcher and the two research assistants were not significant.
The reliability of the anthropometric measurements was further ensured by taking an average
of two measurements for each variable.
3.9 Validity
This refers to the degree to which an account truthfully represents the social phenomena to
which it refers (Silverman, 2000). The adopted WHO STEPS instrument (Appendix I) was
tailored to suit different settings; its content has been proven valid in similar risk factor
surveillance studies across WHO member states, such as in Indonesia (Nawi et al., 2006), and
it uses the same standardized questions and protocol.
3.10 Procedure
3.10.1. Permission
Permission was obtained from the University of the Western Cape, Higher Degrees
Committee (Appendix A). Permission to undertake the study in Mombasa was sought from
the Ministry of Education, Science and Technology (Appendix B), through a written request
after submitting a letter of introduction and a copy of the research proposal.
High schools
The researcher obtained permission from the heads of the four selected high schools by
introducing himself, giving a brief explanation of the study and submitting the approval letters
from the University of the Western Cape, Higher Degrees Committee (Appendix A), the

46
Ministry of Education, Science and Technology (Appendix B), and the Mombasa District
Education Officer (Appendix D).
Tertiary institutions
Permission from these institutions was obtained after a meeting between the researcher and
the respective principals. The researcher introducted himself, before giving a brief description
of the study. Letters of approval from the University of the Western Cape, Higher Degrees
Committee (Appendix A), Ministry of Education, Science and Technology (Appendix B), as
well as from the Mombasa District Education Officer (Appendix D), were submitted to the
principals.
Workplaces
To obtain access to each of the selected organizations, the researcher went through the
administrators and departmental heads in each organization. At both levels, the researcher
introduced himself and gave a brief description of the study before being given access to the
participants. The university and ministerial approval letters (Appendices A and B) were only
submitted to the administrators.
Community
At the marketplace, the researcher met individuals and small groups. He introduced himself as
a student of the University of the Western Cape, using the student identification card
(Appendix J) and the research clearance permit from the National Research Council
(Appendix C). Together with the research assistants, the researcher gave brief descriptions of
the study, after which willing individuals were asked to go to a central place set for
completing the questionnaires (Appendix I) and taking the anthropometrical measurements.

47
3.10.2. Recruitment
Four high schools and three tertiary institutions were randomly selected from the total of 10
and six respectively. 10 high school learners per form per school were randomly selected and
70 participants were conveniently selected from each of the three randomly selected tertiary
institutions, with a proportionate composition per course of study. In the three randomly
selected workplaces, 35 participants were conveniently recruited from each organization, with
a proportionate composition per job category. A total of 50 participants from the city
marketplace were conveniently and willingly recruited. Using the participants’ information
sheet (Appendix E), participants were informed of the study at the various venues and were
asked to voluntarily participate in the study. Written consent was obtained from participants
and guardians (Appendix F) where necessary. Participants completed the self-administered
questionnaire (Appendix I) first and at each venue a central place was set up for the taking of
the various anthropometric measurements. The completed questionnaires (Appendix I) were
then compiled by the principal researcher.
3.11 Data analysis
Data were captured using the Statistical Package for Social Sciences (SPSS V13.0). Data
cleaning and analysis were done using the Statistical Analysis System (SAS). Descriptive
analysis was done using frequencies and percentages to describe the participants and their
health-related behavioral patterns and socio-demographic characteristics. Inferential statistical
analysis was employed to explore the correlation and association between socio-demographic
information and the prevalence of the risk factors among the participants.

48
3.12 Ethical considerations
Approval for the implementation of this study was sought from the Senate Higher Degrees
Committee of the University of the Western Cape. Permission to conduct the study in
Mombasa was obtained from the Ministry of Research and Higher Education and the
governing bodies of the selected high schools, tertiary institutions and workplaces, after the
researcher had submitted a letter of introduction and a copy of the research proposal. The
study purpose, issues of confidentiality, anonymity and participants’ rights to withdraw from
the study at any stage without notice were explained to all the participants using the
participants’ information sheet before they completed a written informed consent form.
School heads, parents or guardians were requested to give consent for participants aged below
18 years. Participants were also informed of any health centres which could be consulted if
any queries were encountered. Completed questionnaires were compiled and stored in a
locked place by the principal researcher.

49
Chapter Four
Results
4.1 Introduction
This chapter presents the descriptive and inferential statistic results of the study. The
descriptive results mainly present the demographic characteristics of the study sample, while
the inferential statistic results highlight the observed correlations and associations between
various demographic variables and the risk factors for non-communicable diseases.
4.2 Descriptive characteristics of the sample
A total of 500 questionnaires were distributed to participants in the various settings. Three
hundred and five (305) questionnaires were completed and returned to the researcher, yielding
a response rate of 61%. One hundred and ninety-five (195) participants did not complete the
questionnaires and were withdrawn from the study. The participants were aged between 15
and 63 years, with a mean age of 22.8 years and a standard deviation of 8.6. In this survey,
181 of the participants were male and 124 were female. Table 4.1 below presents the socio-
demographic data of the respondents.

50
Table 4.1: Socio-demographic information of the study participants.
Variables Gender
Frequency
Proportion Number of participants
Male 181 59.3 305
Female 124 40.7
Age (years)
15- 19 117 38.6
20 – 24 126 41.3 303
25 -29 22 7.2
30 and above 38 12.5 Missing 2 0.7 Level of education No formal education 1 0.34
Primary education 1 0.34
Primary school completed 101 34.24 295
High school completed 130 44.07
College/university completed 59 20.00
Postgraduate 3 1.02
Missing 10 3.3 Work status Government employees 18 6.10
NGO employees 17 5.76
Self-employed 13 4.41
Non-paid 4 1.36
Student 221 74.92 295
Home-makers 7 2.37
Retired 4 1.36
Unemployed (able to work) 11 3.73
Missing 10 3.3
Participants setting category Mean age High school 93 17.45
College/university 124 21.14 291
Work places and community 74 33.21
Missing 14 4.6

51
4.3 Analysis of risk factors among study participants
The studied risk factors for non-communicable diseases, which included tobacco use, risky
alcohol consumption, physical inactivity, overweight/obesity and hypertension, were used to
categorize the respondents into those who were considered to be at risk for developing a non-
communicable disease and those who did not possess the risk factor. Table 4.2 below
illustrates the observed proportions of participants under each risk factor.
Table 4.2: Risk factors according to participants’ age-groups.
Risk Factor
Age-groups (years)
15-19 20-24 25-29 30 and above Total
Tobacco use (N=297)
Smokers 12 (10%) 6 (5%) 4 (18%) 6 (16%) 28 (9%)
Non-smokers 105 (90%) 114 (95%) 18 (82%) 32 (84%) 269 (91%)
Alcohol consumption (N=296)
Risky drinkers 29 (25%) 54 (45%) 15 (68%) 29 (81%) 127 (43%)
Non-drinkers 87 (75%) 66 (55%) 7 (32%) 9 (19%) 169 (57%)
Physical Activity (N=303)
Sedentary 92 (79%) 67 (53%) 7 (32%) 11 (29%) 177 (58%)
Active 25 (21%) 59 (47%) 15 (68%) 27 (71%) 126 (42%)
Body Mass Index (N=303)
Overweight/obese 15 (13%) 18 (14%) 3 (14%) 19 (50%) 55 (19%)
Normal weight 102 (87%) 108 (86%) 19 (86%) 19 (50%) 248 (81%)
Blood Pressure (N=303)
Hypertensive 7 (6%) 12 (10%) 2 (9%) 20 (53%) 41 (24%)
Normal 110 (94%) 114 (90%) 20 (91%) 18 (47%) 262 (76%)
52
4.3.1 Smoking
Participants were defined as smokers if they used any tobacco products (cigarettes, cigars or
pipes) either daily or on some days. In our study, 9% (n=28) of the respondents were smokers,
with an equal representation of 50% for both male and female participants. The mean age at
which participants started smoking was 22 years. Manufactured cigarettes were the only type
reported to be used by all smokers, with a majority of 68% (n=19) smoking an average of 12
cigarettes per day.
The majority of the smokers, 34% (n=10), were aged 25 years and above; however, the
association between smoking risk and age was not statistically significant (p=2.47). Similarly,
participants who had only attained primary education formed the majority, 36% (n=10), of
those who smoked within the level of education category. Further analysis on the work status
category indicated that most of the smokers, 61% (n=17), were students. However, using the
Mantel Haenszel Chi-square test, the observed associations were not statistically significant (p
= 4.08).
4.3.2 Alcohol consumption
Male participants were regarded as risky drinkers if they had an average weekly consumption
of ≥ 14 alcoholic drinks or five or more drinks per day on most days of the week; for women,
it was an average of ≥ 7 alcoholic drinks per week or four or more drinks per day on most
days of the week. In this study, 43% (n=127) of the respondents were risky alcohol drinkers,
with a statistically significant male dominance of 78% (n=99) (p = 0.03). Participants aged 30
years and above comprised a majority of 81% (n=103) of the risky alcohol drinkers. Those
who had attained only up to high school education formed 50% (n=127) according to the level
of education category, while a majority of 62% (n=127) were students as per the work status
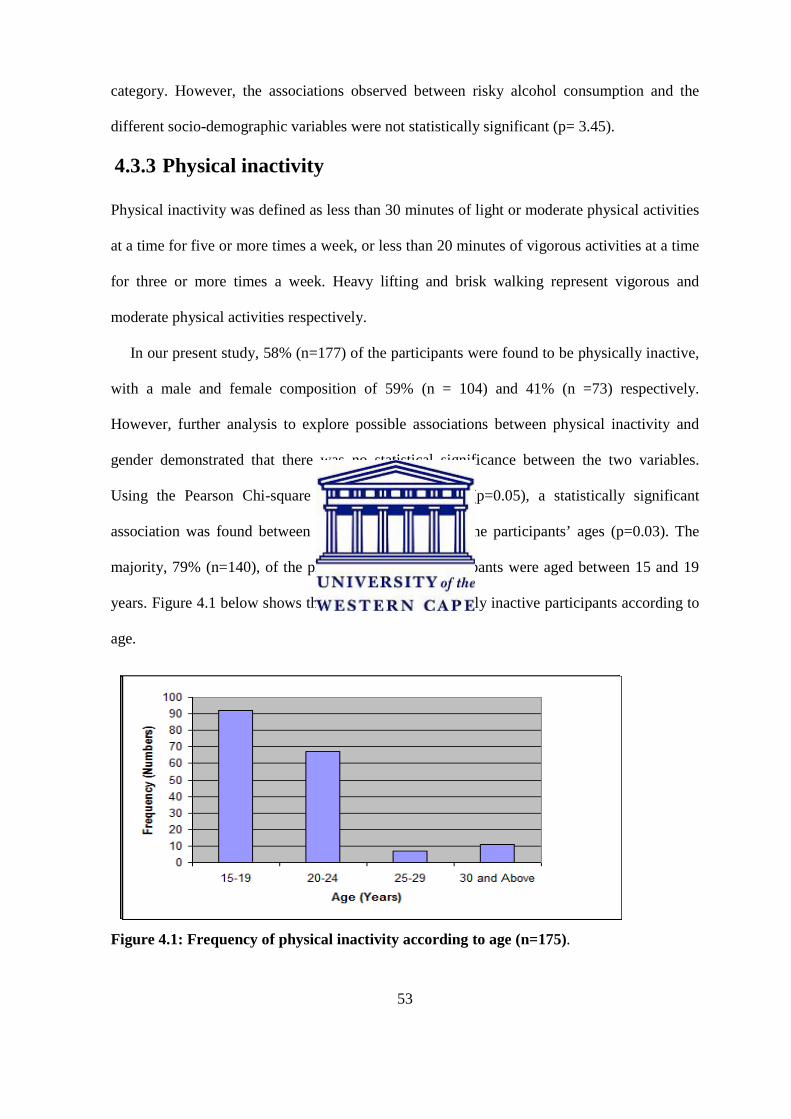
53
category. However, the associations observed between risky alcohol consumption and the
different socio-demographic variables were not statistically significant (p= 3.45).
4.3.3 Physical inactivity
Physical inactivity was defined as less than 30 minutes of light or moderate physical activities
at a time for five or more times a week, or less than 20 minutes of vigorous activities at a time
for three or more times a week. Heavy lifting and brisk walking represent vigorous and
moderate physical activities respectively.
In our present study, 58% (n=177) of the participants were found to be physically inactive,
with a male and female composition of 59% (n = 104) and 41% (n =73) respectively.
However, further analysis to explore possible associations between physical inactivity and
gender demonstrated that there was no statistical significance between the two variables.
Using the Pearson Chi-square test for independence (p=0.05), a statistically significant
association was found between physical inactivity and the participants’ ages (p=0.03). The
majority, 79% (n=140), of the physically inactive participants were aged between 15 and 19
years. Figure 4.1 below shows the proportions of physically inactive participants according to
age.
Figure 4.1: Frequency of physical inactivity according to age (n=175).

54
The participants’ level of education was also proved to be closely associated (p=0.05) with
their patterns of physical activity, with those who had attained only up to primary education
being the most inactive group, representing 49% (n=87) of the study participants within the
level of education category. Figure 4.2 below shows the frequencies of physically inactive
participants according to the level of education attained.
Figure 4.2: Physical inactivity according to participants’ level of education (n=175).
Using the Pearson’s Chi-square test (p=0.05), a statistically significant association was found
between participants’ patterns of physical activity and their work status, with students being
the most sedentary group, at 63% (n=110), within the work status category. It was, however,
revealed that the majority, at 66% (n=83), of the physically active participants indulged in
physical activities during their leisure time, as opposed to during their time of work.

55
4.4: Analysis of the anthropometrical measurements
4.4.1 Blood pressure
Blood pressure is one of the known intermediate risk factors for non-communicable diseases.
In our current study, participants were classified into hypertensive and normal under various
socio-demographic categories, as illustrated in Table 4.3 below.
Table 4.3: Blood pressure according to socio-demographic characteristics.
Category
Blood pressure
Hypertensive Normal Total
Gender
Male 17 (9%) 164 (91%) 181
Female 24 (19%) 100 (81%) 124
Level of Education
No formal schooling _ 1 (100%) 1
Primary education _ 1 (100%) 1
Primary school completed 11 (11%) 90 (89%) 101
High school completed 15 (12%) 115 (88%) 130
College/University 11 (19%) 48 (81%) 59
Postgraduates 3 (100%) _ 3
Work status
Government employees 8 (44%) 10 (56%) 18
NGO employees 4 (24%) 13 (76%) 17
Self-employed 6 (46%) 7 (54%) 13
Non-paid _ 4 (100%) 4
Students 15 (7%) 206 (93%) 221
Home-makers 4 (57%) 3 (43%) 7
Retirees 3 (75%) 1 (25%) 4
Unemployed (able to work) _ 11 (100%) 11

56
4.4.1.2: Hypertension
Participants were classified as having elevated blood pressure if the systolic pressure was >
140mmHg and/or diastolic pressure was > 90mmHg, or if they were taking anti-hypertensive
medication or had been diagnosed as hypertensive by a medical practitioner in the previous 12
months. A proportion of 28% (N=305) had had their blood pressure measured by a doctor or
health care worker in the past 12 months, with 24% (n=84) diagnosed as hypertensive; all of
these were on prescribed anti-hypertensive medication. Inferential statistics indicated a
significant association (p=0.05) between hypertension and participants’ age, gender and level
of education. A proportion of 19% (n=24) of females were hypertensive within the gender
category, with the attainment of an increasing level of education observed to be directly
proportional to high blood pressure. Similarly, participants’ increasing age also proved to be a
statistically significant positive predictor for hypertension, with most of the hypertensive
participants, 53% (n=41), aged 30 years and above. Figure 4.3 below illustrates the observed
association between hypertension and the participants’ ages.
15-19 years17%
20-24 years29%
25-29 years5%
30 years and above49%
Figure 4.3: Hypertension according to participants’ age-groups (n=41).

57
4.4.2: Body Mass Index (BMI)
Body Mass Index (BMI) was used in this study as a standard measure for weight. Participants
were therefore classified as overweight/obese or normal and further categorized under their
various socio-demographic characteristics.
Table 4.4: BMI according to socio-demographic characteristics
Category
BMI
Overweight/obese Normal Total
Gender
Male 16 (9%) 165 (91%) 181
Female 40 (32%) 84 (68%) 124
Level of Education
No formal schooling _ 1 (100%) 1
Primary education _ 1 (100%) 1
Primary school completed 9 (9%) 92 (91%) 101
High school completed 36 (28%) 104 (72%) 130
College/University 16 (27%) 43 (73%) 59
Postgraduates 3 (100%) _ 3
Work status
Government employees 9 (50%) 9 (50%) 18
NGO employees 4 (24%) 13 (76%) 17
Self-employed 4 (31%) 9(69%) 13
Non paid _ 4 (100%) 4
Students 31 (14%) 190 (86%) 221
Home-makers 3(43%) 4 (57%) 7
Retirees 3 (75%) 1 (25%) 4
Unemployed (able to work) _ 11 (100%) 11

58
4.4.2.1: Overweight/obesity
The average BMI was 22.5 kg/m2 with a standard deviation of 4.6. The inferential analysis
indicated that 19% of the study participants were overweight/obese and that the variations in
participants’ body mass index (p=0.02) were significantly associated with their gender. Using
the Pearson Chi-square test (p=0.05), female gender was seen to be a positive predictor for
overweight/obesity, with a 71% majority compared to a 29% male composition (p=0.01).
Although statistically insignificant, attainment of a low level of education, increasing age and
being a student were observed to be predictors for being overweight or obese. A majority of
58% of participants with only up to high school education were obese/overweight, as were
50% of those aged 30 years and above, and 57% of student participants. Figure 4.4 below
illustrates the observed relationships between overweight/obesity and participants’ ages.
15-19 years27%
20-24 years33%
25- 29 years5%
30 years and above35%
Figure 4.4: Overweight/obesity according to participants’ age-group (n=55)

59
4.5 Diet Diet as one of the known determinants for non-communicable disease was also investigated in
this study. In our analysis, fruit and vegetable consumption, together with cholesterol-free
vegetable cooking oil, were used as indicators of proper diet. The results indicated that 42%
(n=114) of the participants ate fruits on most days of the week, with a majority of 34% (n=39)
eating at least two servings in each of the days. Daily vegetable consumption was reported by
36% (n=110) of the respondents, the majority of whom, 44% (n=48), consumed only one
vegetable serving daily. Vegetable oil was reportedly the cooking oil of choice for the
majority of the participants, with 66% (n=201) using it in their daily household cooking.
Using the Pearson’s Chi-square test for independence, a statistically significant association
(p=0.01) was found between level of education and fruit and vegetable consumption, with
60% (n=86) of the participants who ate fruits on most days of the week and 56% (n=61) of
those who reported eating vegetables possessing more than high school education.
4.6 Blood sugar Raised blood sugar or metabolic syndrome is equally a major risk factor for non-
communicable diseases globally. Total prevention or early detection has always been
advocated by most public health stakeholders in the drive to control the non-communicable
diseases pandemic. In our analysis, 13% (n=40) of the participants had had their blood sugar
measured by a health care professional in the previous 12 months, 30% (n=12) of them being
diagnosed as diabetic. Of these, 40% (n=16) were on injectable insulin, while the rest were on
oral drugs and a specially prescribed diet. Increasing age, male gender and high level of
educational attainment were found to be directly proportional to elevated blood sugars.

60
4.7 Analysis of risk factors by participants’ gender
The risk factors included under this analysis were smoking, risky alcohol consumption, poor
diet, physical inactivity, hypertension and overweight/obesity. In our inferential analysis, a
significant association was demonstrated between gender and the mean number of risk factors
possessed by participants. A comparative analysis was performed to observe the variations in
the total number of risk factors possessed by the subjects across gender. The findings
indicated that more females (62%) had at least one risk factor, as opposed to 51% of their
male counterparts. The prevalence of multiple risk factors among both male and female study
participants was 14% (n=37).
The intra-gender analysis of the profile of risk factors among female participants indicated
that a majority of 48% (n=124) of the females had one risk factor for non-communicable
diseases, followed by 31% who possessed none of the risk factors, 19% who had two of the
risk factors, and 2% who had three or more. Figure 4.5 below presents the risk factors profile
of the female participants.
Figure 4.5: Total risk factors and frequencies among female participants (n=124).

61
The risk factor profile for the male participants, however, diverged from that of the females.
The majority of the male subjects, 49% (n=181), was composed of those who showed none of
the risk factors for non-communicable diseases, followed by 40% with one risk factor, 10%
with two, and 1% who had three or more risk factors. Figure 4.6 below presents the profile of
risk factors among male participants.
Figure 4.6: Total risk factors and frequencies among male participants (n=181).
Using the Mantel–Haenszel Chi–square test (p= 0.03) for the association between gender and
the mean number of risk factors, no significant statistical difference was observed between
males and females (p=4.88).
4.8 Clustering of risk factors according to participants’ setting
Total risk factor analysis was performed among the study participants according to different
categories, namely high-school learners, university/college students, and adults. Using the
Chi-square independence test (x² = 8.3507, p = 0.4), no significant difference was found in the
mean number of risk factors between high-school learners, university/college students and
adults. Table 4.5 below shows the observed frequencies and percentages of participants under
different settings according to the number of risk factors they possessed.

62
Table 4.5: Total risk factors according to setting among participants (N = 254)
Participants’ category Number of risk factors 0 1 2 3 4
High-school learners (n=88) 39
(44.3)
37
(42.0)
12
(13.6)
0 0
University/college students
(n=99)
44
(44.4)
44
(44.4)
10
(10.1)
1
(1.0)
0
Adults
(n=67)
30
(44.8)
24
(35.8)
10
(14.9)
1
(1.5)
2
(3.0)
4.9 Clustering of risk factors by age among adult participants
This category comprised 25% (N=295) of the study participants. Among them, 55% had none
of the risk factors and were aged 45 years and below. Those who possessed at least one risk
factor accounted for 45%; the majority of these (32%) had one risk factor, with an average age
of 37 years. Further analysis of possible relationships between age and the total number of
risk factors possessed by the adult participants indicated that there was no statistically
significant association (Spearman’s correlation coefficient = 0.3251, p=0.008) among the
adult participants.
Figure 4.7: Total risk factors according to mean age among adults (n =74)

63
4.10 Analysis of multiple risk factors
In this study, 44% (N=305) of the subjects possessed none of the investigated risk factors for
non-communicable diseases. Those who had one risk factor accounted for 42% (N=305).
Apart from the participants with either none or one risk factor profile, some participants
possessed multiple risk factors, co-occurring in clusters and varying in their combinations.
Those with two risk factors were 13% (N=305), while those with three risk factors or more
comprised 4%. Figure 4.8 below presents the frequencies of participants according to the total
number of risk factors they possessed.
Figure 4.8: Total number of risk factors among study participants (N=305)
4.11 Analysis of individual risk factors
The inferential analysis in this study presented physical inactivity as the most prevalent risk
factor for non-communicable diseases among the participants, accounting for approximately
42% (N=305) of the sample. The other risk factors were registered among participants in the
following percentages: 24% hypertension (high blood pressure), 11% overweight/obesity, 9%
tobacco use (smoking), and 5% risky alcohol consumption.

64
0
20
40
60
80
100
120
140
Smokers
Risky Drin
kers
Ove
rweigh
t/Obe
se
Inac
tive
Hyp
ertensive
Risk Factor
Fre
quen
cy
Figure 4.9: Frequencies of individual risk factors among study participants (N=305).
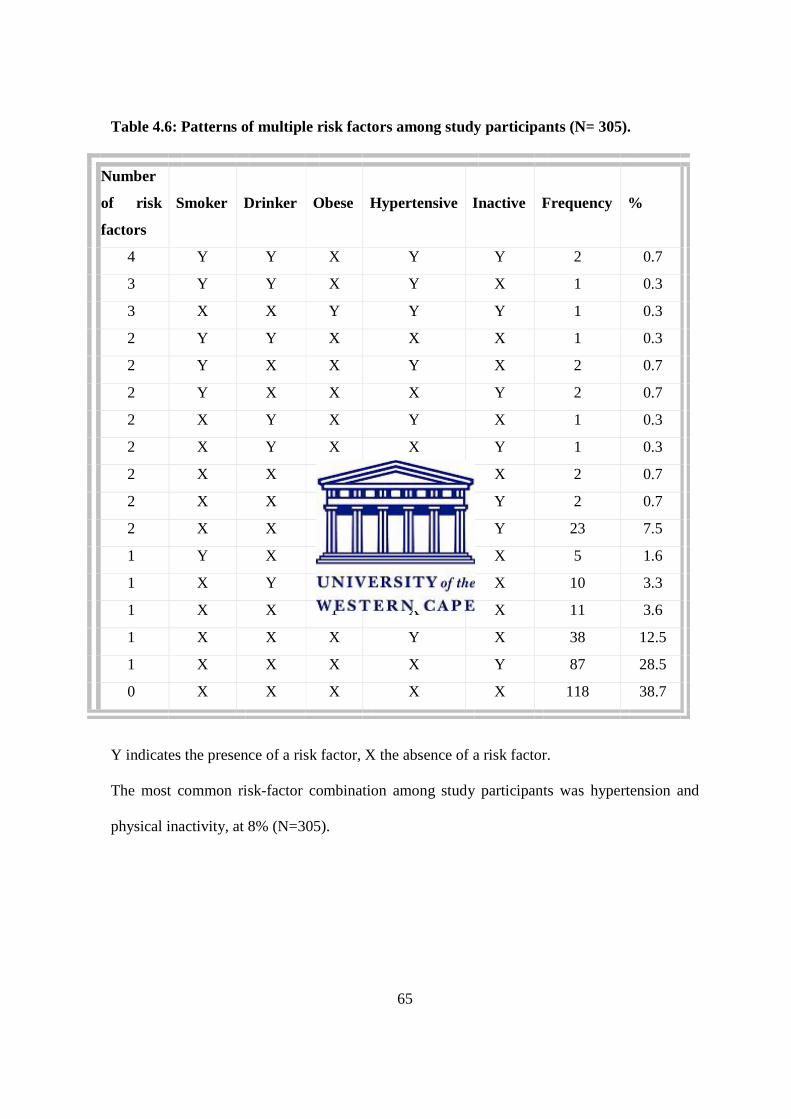
65
Table 4.6: Patterns of multiple risk factors among study participants (N= 305).
Number
of risk
factors
Smoker
Drinker
Obese
Hypertensive
Inactive
Frequency
%
4 Y Y X Y Y 2 0.7
3 Y Y X Y X 1 0.3
3 X X Y Y Y 1 0.3
2 Y Y X X X 1 0.3
2 Y X X Y X 2 0.7
2 Y X X X Y 2 0.7
2 X Y X Y X 1 0.3
2 X Y X X Y 1 0.3
2 X X Y Y X 2 0.7
2 X X Y X Y 2 0.7
2 X X X Y Y 23 7.5
1 Y X X X X 5 1.6
1 X Y X X X 10 3.3
1 X X Y X X 11 3.6
1 X X X Y X 38 12.5
1 X X X X Y 87 28.5
0 X X X X X 118 38.7
Y indicates the presence of a risk factor, X the absence of a risk factor.
The most common risk-factor combination among study participants was hypertension and
physical inactivity, at 8% (N=305).

66
Chapter Five
Discussion 5.1: Introduction
The aim of this study was to establish the prevalence of risk factors for non-communicable
diseases among males and females aged between 15 and 70 years living in Mombasa, Kenya.
In order to realize the specific objectives of the study, a total of three hundred and five (305)
participants were investigated using the WHO STEPwise questionnaire (Appendix I ), which
involved gathering self-reported data on socio-demographics and health-related behaviour
(Step 1), and taking anthropometrical measurements (Step 2). This chapter will discuss the
individual prevalence of the investigated risk factors for non-communicable diseases, and the
clustering of multiple risk factors, as well as associations and correlations between risk factors
and various socio-demographics. Consistencies and disparities between the findings of the
current study and other previous related studies will be established. The chapter will conclude
by highlighting the limitations of the study.
5.2: Findings on Socio-demographic characteristics
Socio-demographic characteristics observed in this study, such as age, gender, level of
education and work status, are known to be substantial determinants for non-communicable
diseases risk factors. The distribution of non-communicable diseases in a population can
therefore be analyzed on the basis of these variables.
The current study produced a response rate of 61%. Participants were aged between 15
and 63 years, with an average age of 22.8 years and a standard deviation of 8.6.
Approximately 80% of the participants were under the age of 25 years, and this explains the

67
large standard deviation. This could however be attributed to the fact that most of the
participants were drawn from tertiary institution settings with no household representation. In
contrast to our study, a similar non-communicable diseases risk factor surveillance study in
Indonesia by Nawi et al (2006), which employed the WHO STEPwise approach, investigated
a sample of 2963 institutionalized and household participants aged 15 to 74 years from both
rural and urban settings. In our present study, males formed the majority of the study sample,
compared to their female counterparts. In the light of the documented literature on the
association between male gender and health-risk behaviour, this may translate into a relatively
higher likelihood of indulgence among the Mombasa residents.
Previous non-communicable disease risk factor studies globally and regionally by Fine et
al (2004) and Pampel (2004) unanimously demonstrated that some socio-demographic
characteristics, including gender and level of education, are indicators of an individual’s
health profile. A study in China by Pan and Hu (2008) reported a significant association
between male gender and smoking, while a similar study by Chande and Salum (2007) in the
United Republic of Tanzania linked males with risky alcohol consumption.
In this study, the level of education was used as an indicator of an individual’s socio-
economic position. With the majority of participants, 44% (N=295), having attained only up
to high school education, the represented population may be expected to possess a higher risk
factor mean score, thus adversely exposing them to the development of chronic diseases. This
relates to reports by Nawi et al (2006) in the Indonesian study that socioeconomic position is
inversely proportional to the mean number of risk factors for non-communicable diseases, and
populations with low socioeconomic status, determined either by income or level of
education, are therefore relatively at higher risk of developing non-communicable diseases.
The socio-demographic characteristics of the Mombasa population as observed in this study
seem to make them vulnerable to the known major risk factors for non-communicable

68
diseases, given that male gender, low level of educational attainment and low socioeconomic
status were dominant.
Epidemiological studies for non-communicable diseases risk factors have
demonstrated that identification and description of risk factors guarantees better
understanding of the health transition facing most of the world’s populations. Using
participants’ attained level of education as an indicator for their socioeconomic position
(SEP), the results of this study revealed that the burden of non-communicable diseases risk
factors is unequally distributed among different SEP classes within the population of
Mombasa. Disease prevention and control strategies should therefore be target-specific if any
desirable outcome is to be achieved. Our analysis is however in agreement with the findings
of Fine et al (2004) in America and Nawi et al (2006) in Indonesia. Consistent with Nawi et
al’s (2006) suggestions, this study further shows that risk factor surveillance offers a
comprehensive picture of the overall non-communicable disease burden, one which is vital to
public health authorities addressing health inequities.
5.3 Risk factors among study participants
5.3.1: Smoking
Tobacco use or smoking is largely acknowledged as one of the common major risk factors
consistently associated with chronic non-communicable diseases, including cancer and
chronic obstructive pulmonary diseases (World Health Report, 2002). The literature has
attributed health risk behaviours like smoking to the adoption of western lifestyles among
populations in the developing countries. In our analysis, we revealed a 9% prevalence of
smoking among the participants who were aged between 15 and 63 years. The minimal rate
recorded could in part be due to the small proportion of adult participants investigated.

69
A regional nationally representative survey in South Africa by Walbeek (2002) indicated a
current smoking prevalence of 27% among the adult population, despite a drastic decline in
tobacco consumption following a legislatively imposed increase in excise tax on all tobacco
products. A rather higher smoking prevalence rate among males aged 15 to 59 years was
documented in regional studies carried out by Pampel (2004) in Malawi and Zambia,
recording 40% and 20% respectively. Similarly, nationally representative studies by Guindon
and Boisclair (2003) and Levenson, Skerrett and Gaziano (2002) in the United States
indicated high and ever increasing smoking trends in developing countries.
However, age-related similarities exist between this present study and Pampel’s (2004)
survey, with participants aged below 30 years as the majority of the smokers in both studies.
This implies that initiation of smoking behaviour now starts at an early age.
A recent Chinese study by Pan and Hu (2008) reported that socio-demographic
characteristics, including male gender and labour-intensive occupations, were significantly
associated with smoking behaviour. This is consistent with previous findings by Anthonisen et
al (2005). Contrary to these reports, our study found no significant associations between
smoking and gender or work status. However, in agreement with the Pan and Hu (2008)
analysis, our findings contradict those of research by Gong et al (2005) which maintained that
level of education, which was used in this study as an indicator for participants’
socioeconomic position, is not a statistically significant predictor of smoking behaviour.
Although our analysis revealed a relatively lower rate of smoking behaviour compared to
similar regional studies, it is expected that a nationally representative sample would yield a
higher rate. It is clear, however, that the age of initiation into smoking behaviour and the mean
age of smokers are alarmingly lower than they were in the past.

70
5.3.2: Risky alcohol consumption
Alcoholic disorder or risky alcohol consumption is one of the common major risk factors
known to predispose individuals to the development of chronic non-communicable diseases
such as type 2 diabetes, hypertension and chronic liver and pancreatic cancers. In this study, a
relatively higher prevalence rate of 43% was recorded, compared to a previous regional rate of
22% reported by Chande and Salum (2002) in the United Republic of Tanzania and a 21%
nation-wide prevalence reported by Fine et al (2004) in the United States of America.
Our current study was markedly similar to the Tanzanian survey in terms of sample size
and the participants’ socio-demographics. However, our analysis indicated that participants
aged between 20 and 24 years drank more than any other age group, a finding that supports
the conclusion drawn by most authors, including Walbeek (2002) in South Africa, that there is
a rapid decline in the average age at which people start indulging in health-risk behaviours.
Contrary to the Tanzanian survey by Chande and Salum (2002), our results indicated that
students were the majority drinkers under the work status category. In both studies, however,
lower level of educational attainment and male gender were seen as indicators for alcoholic
disorder. These variations reflect the complexity and variability of the interactions between
health-related behaviours and socio-demographic characteristics among different populations,
communities and even socioeconomic classes.
5.3.3: Physical inactivity
According to statistics by WHO (2008), physical inactivity or sedentarism has become a
major public health concern, making a significant contribution to the global non-
communicable disease morbidity and mortality rates.

71
This has largely been attributed to urbanization and global socioeconomic transitions. The
results of this study indicated that 58% of the respondents recorded inadequate levels of
physical activity, with an observed positive correlation trend between a participant’s age and
the level of physical activity. The majority of the physically inactive participants were aged
between 15 and 19 years. This is mostly the age of people in secondary and tertiary
institutions, and according to Murenzi (2001), people in Rwanda at this stage in life adopt
sedentary lifestyles. Bray and Born (2004) argued that this could be as a result of the physical
and psycho-social changes they undergo during the transition from high school to college or
university. Illustrations that physical activity is influenced by psychological, social, cultural
and environmental factors (Sallis et al, 1999) allowed this researcher to agree with the
consistencies observed between the current study and the Murenzi (2001) and Bray and Born
(2004) studies.
The literature has consistently shown that patterns of physical activity are worsening
globally. Similar to the findings of this study, a National Health Survey in the United States
by Fine et al (2004), which investigated multiple risk factors among a nationally
representative sample of 29,183 participants, reported a 66% prevalence of physical inactivity.
Though based on high school learners, regional studies by Phillips (2001) in the Western
Cape, South Africa, and Tumuusime and Frantz (2006) in Rwanda are consistent with the
rates of physical inactivity reported in this study. The observed consistencies could however
be associated with similarities in the underlying determinants faced by these populations.
Gender has been reported as a predictor for participation in physical activities. In a recent
American comparative study on physical activity and physical fitness between rural and urban
children by Joens-Matre et al, (2008), it was reported that boys were more active than girls at
all ages in both rural and urban settings. This present study, however, did not discover any
statistically significant gender disparities among the physically inactive participants.

72
Socioeconomic status, which in our study was determined by the participants’ level of
education, has in many epidemiological studies been regarded as the major predictor for non-
communicable diseases. Results from the present study indicated that participants who
attained a rather lower level of education, such as primary education, were more inactive than
those who attained university or post-graduate education. The rate of physical inactivity
declined with an improved level of education, signifying a positive correlation between
physical activity and level of education or socioeconomic status. These findings complement a
previous comprehensive analysis by Galobardes et al, (2003). In a longitudinal study to reveal
the trends of risk factors among various socioeconomic groups in Switzerland, the authors
investigated a nationally representative sample of 8194 adult participants from 1993 to 2000.
Their findings illustrated that physical inactivity was high, especially among the low
socioeconomic status group. This present study found a higher prevalence of physical
inactivity which is significantly associated with low socioeconomic status and young age; this
implies that the young and the poor in Mombasa are more prone to inactivity-related diseases.
5.3.4 Hypertension
High blood pressure or hypertension, together with obesity and overweight, raised blood
glucose and abnormal blood lipids, are generally recognized as the intermediate risk factors
for non-communicable diseases. Hypertension is closely associated with most cardiovascular
diseases, including ischemic and haemorrhagic stroke. Analysis of our results indicated that
24% of the investigated participants had raised blood pressure. Further inferential analyses
revealed that the prevalence of hypertension increased with old age. These findings were
consistent with the outcome of a similar cross-sectional epidemiologic study by Leenen et al,
(2008) which employed similar measures in determining the prevalence of hypertension
among 2551 participants in Ontario, Canada.

73
The results indicated a 21% prevalence of hypertension, with the rate increasing with age.
However, contrary to the male gender predominance in hypertension reported in Leenen et
al’s study, our analysis demonstrated that more women (59%) were hypertensive compared to
their male counterparts (41%).
Studies have indicated that low levels of educational attainment are a predictor of an
individual’s socioeconomic status, which in turn is linked with the prevalence of
hypertension. Contrary to previous findings by Yusuf et al (2001), our analysis revealed that
an increased level of education attained was closely associated with the risk of developing
hypertension. This suggests that residents of Mombasa who possess higher levels of
education, as well as females and people of middle age and above, are more at risk of
developing cardiovascular diseases compared to the other population sub-groups.
5.3.5: Overweight/Obesity
The literature has portrayed overweight and obesity as a by-product of poor diet and
inadequate physical activities following modernization. It is recognized as one of the common
intermediate risk factors for most of the weight-related non-communicable diseases, including
type 2 diabetes and cardiovascular diseases. In our study, however, the results presented a
relatively lower rate of 19%. Similarly, in an Indonesian study by Nawiet et al (2006), which
employed the WHO STEPwise protocol for the surveillance of risk factors for non-
communicable diseases, findings indicated that women had a higher mean BMI compared to
men. Similarly, this present study showed a female predominance of 71% among participants
who were overweight and obese; this presents females in Mombasa as more at risk of
developing weight-related chronic diseases.
74
Our results also showed that factors related to age act in moderating the mean BMI.
This was proved by the higher prevalence of overweight and obesity among participants aged
30 years and above compared to the younger age groups.
Obesity and overweight trends are high and are increasing at an alarming rate across
gender and age groups globally. This is evidenced by Gregg et al’s (2005) findings in the
United States where a 31% prevalence of overweight and obesity was documented among
participants aged 20 to 74 years. This was a comprehensive analysis of five cross-sectional
surveys composed of nationally representative samples.
With overweight/obesity evidently common among adults and females in Mombasa,
target-specific strategies should be embraced if desirable outcomes are to be achieved in
alleviating the emerging chronic disease pandemic.
5.3.6 Diet
High-fat foods, lack of fruits and vegetables, together with the use of low-density cholesterol
cooking oil are all classified as poor dietary practices and have been closely linked to the
development of chronic diseases.
Our study revealed a substantial consumption of fruits and vegetables among the
participants, at 42% and 36% respectively. This rate is seen as significant when compared to
the nation-wide reports by (WHO, 2005) on Kenya. Combining fruits and vegetables with a
66% majority choice for the use of vegetable cooking oil, Mombasa residents can be
considered in this respect to be embracing health-promoting dietary practices.

75
5.3.7 Blood sugar
Elevated blood sugar is another well-known risk factor for non-communicable diseases. With
morbidity and mortality rates attributable to type 2 diabetes on an alarming increase regionally
and globally, early detection remains the health-promoting practice of choice.
Analysis in our study indicated that 13% of the participants had had their blood sugar
tested for type 2 diabetes in the previous 12 months; 3% of those who were tested were
diagnosed as having elevated blood sugar levels and were put on different medications.
Compared to reports by WHO (2008) on the prevalence of diabetes in sub-saharan African
countries, the revealed rates in this study are relatively low. However, the low proportion of
participants who had been tested for diabetes reflects a lack of public sensitization towards
early detection in Mombasa.
5.4: Clustering of multiple risk factors
According to the literature, there are adequate data on the prevalence and profiles of
individual risk factors for non-communicable diseases. Recent studies have however revealed
that there exist quite considerable knowledge gaps on the clustering of these risk factors,
which are known often to co-occur. The WHO (2005a) report indicated that for any desirable
outcome to be achieved in the prevention and control of non-communicable diseases,
governments and public health departments must incorporate identification of the most
common clusters of multiple risk factors in their surveillance systems. In this study, 13% of
both male and female participants had multiple risk factors. This is consistent with the
findings of an American multiple risk factor study by Fine et al (2001) which reported a 17%
multiple risk factor prevalence among a nationally representative sample of 29,183

76
participants. Further analysis revealed inconsistencies in the associations between the
subjects’ demographic characteristics and the mean number of risk factors possessed. Unlike
Fine et al’s (2001) findings, the present study indicated that gender was significantly
associated (p=0.05) with participants’ mean number of risk factors. More females (54%) in
this study had two or more of the risk factors, compared to 46% of their male counterparts.
In our study, the Spearman’s correlation coefficient was not statistically significant
(0.3251) at (p=0.008), showing no correlation between age and the participants’ risk factor
mean score.
The Fine et al (2001) analysis, however, indicated that individuals aged 40 years and above
and those who had attained only up to secondary school education or below possessed a
higher risk factor mean score compared to other age groups and education level categories
respectively.
Using the Chi-square independence test (x² = 8.3507, p = 0.4), the results in this study
showed no significant association between level of education and participants’ risk factor
mean score. This is also contrary to the findings of the comprehensive Galobardes et al survey
(2003) in Geneva, Switzerland. Using level of education as an indicator for socioeconomic
position, the authors reported that individuals with a low socioeconomic position had the
worst risk factor profiles.
5.5: Trends of individual risk factors
This study employed the WHO STEPwise protocol in the surveillance of risk factors for non-
communicable diseases (WHO, 2005a). In line with the findings of the Fine et al (2001)
77
survey, our results indicated that physical inactivity was the most prevalent among the
investigated risk factors for non-communicable diseases, accounting for approximately 42%
of the entire study sample.
The other risk factors were registered among study participants in the following
percentages: 24% hypertension (high blood pressure), 11% overweight/obesity, 9% tobacco
use (smoking), and 5% risky alcohol consumption.
5.6: Patterns of multiple risk factors
It has been demonstrated by most leading authors in the field of risk factor surveillance that
identification of the most common patterns of risk factors remains an essential fundamental
starting point in the planning and implementation of target-specific and cost-effective
intervention programs. According to WHO (2005a), identification of these patterns could
assist in predicting the future epidemiology of non-communicable diseases among a given
population, community or group at risk.
Nawi et al (2006) and Yusuf et al (2001) indicated that different populations or
socioeconomic classes may possess multiple risk factors in patterns or combinations varying
from one another. Complementing these observations, results in our study indicated that the
investigated risk factors co-occurred in combinations of two, three and four, with variations in
proportions among the participants. Subjects with two risk factors composed the majority 89%
(n=38) among those who possessed multiple risk factors. Of these, 68% comprised those who
were both hypertensive and physically inactive. However, as observed in the Fine et al (2001)
study, our results showed that physical inactivity and obesity co-occured among participants;
in the reseacher’s opinion this is a result of the mutual influence between these two risk
factors.

78
Participants in this study with three of the investigated risk factors accounted for 5%
of those who possessed multiple risk factors. The pattern of risk factor combination among
these participants included overweight/obesity, hypertension and physical inactivity among
2.5% of the subjects; the other 2.5% who possessed three risk factors were smokers, risky
drinkers of alcohol, and hypertensive. Four of the investigated risk factors for non-
communicable diseases were revealed to co-occur among 5% of the participants who
possessed multiple risk factors. There were however no variations in the patterns among this
group; instead they were all smokers, risky drinkers of alcohol, hypertensive and had
inadequate levels of physical activities.
5.7: Limitations of the study
Step one of the WHO STEPwise protocol employed in this study involved gathering self-
reported information on the participants’ socioeconomic and demographic characteristics.
Such subjective information may lack representativeness as well as transferability across the
population.
The sampling method used was purposive and convenient. The majority of the participants
were young institutionalized individuals and this could have compromised the quality of the
data collected.
A further limitation in this study was the relatively low average age of the participants; this
could have facilitated over-reporting or under-reporting among most of the respondents.

79
Chapter Six
Summary, conclusion and recommendations
6.1: Introduction
This chapter emphasizes the key findings of the study. A concise summary as well as
conclusion are highlighted. Finally, recommendations based on the main study outcomes are
given.
6.2: Summary
The aim of the study was to determine the prevalence of risk factors for non-communicable
diseases among males and females aged between 15 and 70 years living in Mombasa, Kenya.
To realize this aim, identification and description of individual risk factors was done. Clusters
of multiple risk factors as well as possible socio-demographic facilitators were investigated.
Overall, 61% of the study participants possessed at least one of the investigated risk factors
for non-communicable diseases. However, there were proportional variations according to the
risk factor profiles of the participants. Those who had one risk factor accounted for 42%,
while 13% proved to possess two risk factors, and 4% had three or more risk factors .
The investigated risk factors, which included physical inactivity, hypertension,
overweight/obesity, smoking and risky alcohol consumption, were prevalent among
participants in different proportions. The most common risk factor recorded was physical
inactivity, which accounted for 42% of the entire study sample. This revelation indicates that
most of the participants were living more sedentary lifestyles characterized by inadequate
levels of appropriate physical activities.

80
Hypertension or elevated blood pressure was the second most common risk factor, and was
possessed by 24% of the participants. Overweight/obesity, smoking and risky alcohol
consumption accounted for 11%, 9% and 5% of the participants respectively.
Physical inactivity, hypertension and overweight/obesity were the three most common risk
factors among the participants; this is typically the negative effect of urbanization which is
characterized by poor diet and the adoption of more sedentary lifestyles.
Risk factors were also seen to co-occur in different numbers and in varying patterns of
combinations. Double risk factor clusters were the most common (89%) among those with
multiple risks. Participants who were both physically inactive and hypertensive composed a
majority of 68% of those who had a total risk factor score of two. This observation suggests a
possible relationship between physical inactivity and hypertension which could necessitate a
future study in order to explore the dynamics facilitating their co-occurrence.
Socio-demographic characteristics such as age, gender and level of education or
socioeconomic status were proved to influence health behaviour. Physical inactivity, which
was the most common risk factor among participants, was seen to be influenced by age. The
physical activity profiles of participants aged 25 years and under were the worst. This is the
age of individuals in tertiary learning institutions. The situation could be improved were these
institutions to promote physical activity through adapted facilities and targeted health
education. Likewise, the study showed that increasing age was an indicator for hypertension.
The prevalence of hypertension was seen to vary across gender. Females were more
hypertensive (59%) compared to their male counterparts (41%). Since hypertension is one of
the intermediate risk factors for non-communicable diseases, the variations between male and
female participants who were hypertensive suggests differences in their exposure to the
underlying socioeconomic determinants of non-communicable diseases.

81
Apparently, there exists an intricate relationship between the underlying determinants and
the behavioral health risk factors which in the researcher’s opinion warrants further
exploratory studies in future.
6.3: Conclusion
As revealed in our current study, behavioral risk factors for non-communicable diseases,
mainly physical inactivity, hypertension, overweight/obesity and smoking, are common
among Mombasa residents. The prevalence rates are high and show some increasing trends
suggestive of likely future epidemics of non-communicable diseases. Identification and
description of the most common patterns of multiple risk factor clusters gave a comprehensive
picture of the future epidemiology of non-communicable diseases in Mombasa. This is
undoubtedly an essential component of the national health information system.
The unequal distribution of these risk factors among the people of Mombasa has been
attributed to the influence of various socio-demographic factors, including age, gender, level
of education and economic status. This suggests that for any preventive and control
interventions to be effective, public health authorities and other relevant stakeholders must
exercise targeting in their planning and implementation of health promotion programmes.
6.4: Recommendations.
On the basis of the findings of this study, the following recommendations are suggested to the
various stakeholders:
1. Further risk factor surveillance studies incorporating Step 3 of the WHO STEPwise
protocol should be done to give a more comprehensive profile.

82
2. A continuous national surveillance system on risk factors should be instituted by the
Centre for Diseases Control and Prevention to offer up-to-date analysis of the national
risk factor profile.
3. Data on multiple risk factors should be used as the baseline foundation for legislation
and intervention by the public health authorities and policy planners.
4. Clinicians, including medical doctors, physiotherapists and nurses in both public and
private health care sectors, should incorporate enquiries on modifiable health risk
behaviours in order to ensure early detection at the primary health care level.
5. The Education Department, in collaboration with the Ministry of Health, should
introduce health-promoting schools, to make healthy behaviour an easier option
among students.
6. Institutions, organizations and all workplaces in Mombasa should be advised to
uphold the strategy of health-promoting settings to ensure prevention and control of
non-communicable diseases.

83
References
Achadi, A., Soerojo, W. and Barber, S. (2005). The relevance and prospects of advancing
tobacco control in Indonesia. Health Policy, 72, 333-349.
Adjuik, M., Smith, T., Clark, S., Todd, J., Garrib, A., Kinfu, Y., Kahn, K., Mola, M., Ashraf, A., Masanja, H., Adazu, K., Sacarlal, J., Alam, N., Marra, A., Gbangou, A., Mwageni, E., and Binka, F. (2006). Cause-specific mortality rates in Sub-saharan Africa and Bangladesh. Bulletin of the World Health Organization, 84, 181-188.
Anthonisen, N. R., Skeans, M. A., Wise, R. A., Manfreda, J., Kanner, R.E. and Connet, J. E.
(2005). The effects of a smoking cessation intervention on 14.5-year mortality. A randomized
clinical trial. Annals of Internal Medicine, 142(4), 233-239
Babbie, E. and Mouton, J. (2006). The practice of social research. Cape Town, South Africa.
Oxford University Press.
Bauman, A. and Campbell, T. (2001). Heart Week 2001: Get Active! A call to
action. Medical Journal of Australia 174: 381-382.
Berrigan, D., Dodd, K., Troiano, R. P., Krebs-Smith, S. M. and Barbash, R. B. (2003).
Patterns of Health Behaviour in U.S Adults. Preventive Medicine, 36, 615-623.
Bonita, R., de Courten, M., Dwyer, T., Jamrozik, K. and Winkelmann, R. (2001). Surveillance
of risk factors for noncommunicable diseases: The WHO STEPwise approach. Summary.
Geneva, World Health Organization, 2001.
Boutayeb, A. and Botayeb, S. (2005). The burden of non-communicable diseases in
developing countries. International Journal for Equity in Health, 4(2), 1186-1475.
Bray, R. S. and Born, A. H. (2004). Transition to University and Vigorous Physical Activity:
Implications for Health and Psychological Well-Being. Journal of American College Health,
52, 181-187.

84
Capewell, S., Beaglehole, R., Seddon, M. and McMurray, J. (2000). Explanation to the
decline in coronary heart disease mortality rates in Auckland, New Zealand between 1982 and
1993. Circulation, 102, 1511-1516.
Centre for Chronic Disease Control and Prevention (2003). International Activities.
www.hc.sc.gc.ca/international e html
Center for Disease Control and Prevention (1996). Report for the Surgeon General. Physical
Activity and Health. US Department of Health and Human Services.
Center for Disease Control and Prevention (2001). Increasing Physical Activity. A report on
the recommendations of the Task Force on Community Preventive Services. Morbidity and
Mortality Weekly Report. 50: 1-16.
Chande, H. and Salum, I. (2007). Prevalence of and factors associated with alcohol
consumption in Temeke. East African Journal of Public Health, 4(2), 64-66.
Chobanian, A. V., Bakris, G. L., Black, H. R., Cushman, W. C., Green, L. A., Izzo, J. L.,
Materson, B. J., Oparil, S., Wright, J. T. Jr. and Roccella, E. J.( 2003). The seventh report of
the joint national committee on prevention, detection, evaluation and treatment of high blood
pressure: the JNC report. Journal of American Medical Association, 289, 2560-2572.
Chockalingam, A. and Balaguero-Vinto, I. (1999). Eds. Impending Global Pandemic of
Cardiovascular Diseases: Challenges and Opportunities for the Prevention and Control of
Cardiovascular Diseases Developing Countries and Economies in transition. World Heart
Federation. Barcelona: Prous Science.
Coetzee, M. and Underhay, C. (2003). Gesondheidsrisikogedrag by adolessente van
verskillende ouderdomme. South African Journal for Research in Sport, Physical Education
and Recreation, 25(2), 27-36.
85
Colagiuri, R., Colagiuri, S., Yach, D. and Praming, S. (2006). The Answer to Diabetes
Prevention: Science, Surgery, Service Delivery, or Social Policy? American Journal of Public
Health, 96(9), 1562-1569.
Coulson N, Goldstein S and Ntuli, A (2002). Promoting health in South Africa. An action
manual. Heinemann Higher and Further Education (Pty) Ltd, Cape Town-South Africa.
Daar AS, Singer PA, Persad DL, Pramming SK, and Matthews DR. (2007). Grand challenges
in chronic non-communicable diseases. Nature 450: 494–496. doi:10.1038/450494a.
Dobson, A. J., Evans, A. and Ferrario, M. (1998). Changes in estimated coronary risk in the
1980s: data from 38 populations in the WHO MONICA Project. World Health Organization.
Monitoring trends and determinants in cardiovascular diseases. Annals of Medicine, 30, 199-
205.
Ezzati, M., Lopez, A. D., Rodgers, A., Vander Hoorn, S., Murray, C. J. L. and The
comparative risk assessment collaborating group (2002). Selected major risk factors and
global and regional burden of disease. The Lancet, 360, 1347-1360.
Fine, L. J., Philogene, S., Gramling, R., Coups, E. J. and Sinha, S. (2004). Prevalence of
multiple chronic disease risk factors, 2001 National Health survey. American Journal of
Preventive Medicine. 27(2s), 18 – 24.
Flegal, K. M., Carroll, M. D., Kuczmarski, R. J. and Johnson, C. L. (1998). Overweight and
Obesity in the United States: Prevalence and Trends, 1960 -1994. International Journal of
Obesity and Related Metabolic Disorders, 22, 39-47.
Forrester, T., Cooper, R. S. and Weatherall, D. (1998). Emergence of Western diseases in the
tropical world: The experience with chronic cardiovascular diseases. British Medical Bulletin,
54(2), 463-473.
Fourie J (2001). Definition of chronic diseases of lifestyle.
http://www.mrc.ac.za/chronic/cdloverview.pdf Accessed: May 31, 2005.

86
Frantz, J. M. (2006). Physical inactivity as one of the chronic disease risk factors among high
school learners in public schools in a local community in South Africa. South African Journal
for Research in Sport, Physical Education and Recreation, 28(2), 73-80.
Galobardez, B., Coatsnza, M. C., Bernstein, M. S., Delhumeau, C. and Morabia, A. (2003).
Trends in Risk Factors for Lifestyle-related Diseases by Socio-economic Position in Geneva,
Switzerland, 1993-2000: Health Inequalities Persist. American Journal of Public Health,
93(8), 1302-1309.
Goetzel, R. Z., Ozminkowski, R. J., Bruno, J. A., Rutter, K. R., Isaac, F., and Wang, S.
(2002). The long-term impact of Johnson & Johnson’s Health and Wellness Program on
employee health risks. Journal of Occupational and Environmental Medicine, 44: 417- 424.
Gregg, E. W., Cheng, Y. J., Cadwell, B. L., Imperatore, G., Williams, D. E., Flegal, K. M.,
Venkat Narayan, K. M. and Williamson, D. F. (2005). Secular Trends in Cardiovascular
Disease Risk Factors According to Body Mass Index in US Adults. Journal of American
Medical Association, 293(15), 1861-1918.
Grundy, S. M., Bazzarre, T., Cleeman, J., D’Agostino, R. B. Sr., Hill, M. and Houston-Miller,
N. (2000). Prevention conference V: Beyond secondary prevention: identifying the high-risk
patient for primary prevention: medical office assessment: Writing Group 1. Circulation;
101:e3. Available from: http://circ.ahajournals.org/cgi/content/full/101/1/e3
Guindon, G. E. and Boisclair, D. (2003). Past, Current and Future Trends in Tobacco use.
Economics of Tobacco control paper No. 6. Health, Nutrition and Population discussion
paper.
Health and the Millennium Development Goals. Geneva., World Health Organization,
(2005b).
Health Education Authority (1998). Young and active. A policy framework for young and
health enhancing physical activity. London. Health Education Authority.

87
Henry-Lee, A. and Yearwood, A. (1999). Protecting the poor and the medically indigent
under health insurance: A case study in Jamaica. Bethesda, MD, Partnership for Health
Reform Project and Abi Associates.
Hoelscher, D. M., Feldmam, H. A., Johnson, C. C., Lytle, L. A., Osganian, S. K. and Parcel,
G. S. (2004). School-based health education programes can be maintained over time: Results
from the CATCH institutionalization study. Preventive Medicine, 38, 594- 604.
Hornby A S (2000). Oxford Advanced Learner’s Dictionary. 6th
Ed, Oxford University Press,
UK.
Hulme, D. and Shepherd, A. (2003). Conceptualizing chronic poverty. World Development,
31, 403-423.
Institute of Medicine (2001). Health and Behaviour: The interplay of biological, behavioural
and societal influences. Washington DC: National Academy press.
Joens-Matre, R. R., Welk, G. J., Calabro, M. A., Russel, D. W., Nicklay, E. and Hensley, L.
D. (2008). Rural-urban Differences in Physical Activity, Physical Fitness, and Overweight
prevalence of Children. National Rural Health Association, 24(1), 49-54.
Jong-Wook, L. (2005). World Health Organization Global Report. Preventing chronic
diseases: A vital investment.
Jong-Wook, L. (2005). In: Preventing Chronic Diseases: A Vital Investment. World Health
Organization Global Report.
Katzmarzyk P, Gledhill N and Shepherd R (2000). The economic burden of
physical inactivity in Canada. Canadian Medical Association Journal 163(11):
1435-1440.
Kenya National Bureau of Statistics (2001). The 1999 Population and Housing Census.
Counting our People for Development.

88
Kwamanga, D. H., Odhiambo, J. A. and Amukoye, E. L. (2003). Prevalence and risk factors
of smoking among secondary school students in Nairobi. East African Medical Journal, 80,
207-212.
Lazcano-Ponce, E. C., Hernandez, B., Cruz-Valdez, A., Allen, B., Diaz, R., Hernandez, R.,
Anaya, R. and Hernandez-Avila, M. (2003). Chronic Disease Risk Factors Among
Adolescents Attending Public Schools in the State of Morelos, Mexico. Archives of Medical
Research, 34, 222-236.
Leenen, F. H. H., Dumais, J., Mclnnis, N. H., Turton, P., Stratychuc, L., Nemeth, K., Lum-
Kwong, M. M. and Fodor, G. (2008). Results of the Ontario Survey on the Prevalence and
Control of Hypertension. Canadian Medical Association Journal, 178(11), 1441-1449.
Levenson, J. W., Skerret, P. and Gaziano, M. (2003). Reducing the global burden of
cardiovascular disease: The role of risk factors. Preventive cardiology, 5(4), 188-199.
Marmot, M. (2004). Status Syndrome. London, Bloomsbury.
McPherson K (2001). Public health does not need to be led by doctors. British Medical
Journal 322:1593-1596.
Mendes, S., Fukino, K., Cameron, A., Laing, R., Filipe Jr., A, Khatib, O., Leowski, J. and
Ewen, M. (2007). The availability and affordability of selected essential medicines for chronic
diseases in low- and middle-income countries. Bulletin of WHO 2007, 85:279-288.
Mokdad, A. H., Marks, J. S., Stroup, D. S. F. and Gerberding, J. L. (2001). Actual causes of
deaths in the United States. Journal of the American Medical Association, 291, 1238-1245.
Morrow, J., Jackson, A., Bazzarre, T., Milne, D. and Blair, S. (1999). A One-Year Follow-up
to Physical Activity and Health. A Report of the Surgeon General. American Journal of
Preventive Medicine, (17)1, 24 – 30.

89
Mpabulungi, L. and Muula, A. S. (2004). Tobacco use among High School Students in
Kampala, Uganda: Questionnaire Study. Croatian Medical Journal, 45(1), 80-83.
Murray, C. J. L. and Lopez, A. D. (1996). The Global Burden of Disease. Cambridge, MA:
Harvard School of Public Health.
Murenzi, J. G. (2001). Habitual activity patterns among adolescent learners in Rwanda.
Unpublished Master of Science thesis. Physiotherapy department, University of the Western
Cape.
National Council for Population and Development (1998). Kenya Demographic and Health
Survey. Calverton, Maryland, NDPD, CBS and Macro International Inc.
Nawi, N., Stenlund, H., Bonita, R.,Hakimi, M.,Wall, S. and Weinehall, L. (2006). Preventable
risk factors for non-communicable diseases in rural Indonesia: Prevalence study using the
WHO STEPS approach. Bulletin of the World Health Organization, 84, 305-313.
Omran, A. R. (1971).The epidemiologic transition. A theory of the epidemiology of
population change. Milbank Mem Fund Q.; 49:509-538.
Pampel, F. C. (2005). Patterns of Tobacco Use in the Early Epidemic Stages: Malawi and
Zambia, 2000-2002. American Journal of Public Health, 95(6), 1009-1015.
Pan American Health Organization (2005).
(http://www.paho.org.common.Display.asp.?Lang=S&RECID=7157,accessed, 14, July 2009.
Pan, Z. and Hu, D. (2008). Multi-level analysis of individual and community predictors of
smoking prevalence and frequency in China: 1991-2004. Journal of Public Health Policy,
29(1), 72-84.
Perel, P., Casas, J. P. Ortiz, Z. and Miranda, J. J. (2006). Non-communicable diseases and
injuries in Latin America and the Caribbean: Time for Action. Plos Medicine, 3(9), 1448-
1451.

90
Phillips, J (2001). Recreational activities of high school learners in the Strand.
Unpublished Masters Thesis. University of the Western Cape.
Popkin, B. M. (1998). The nutrition transition and its health implications in lower-income
countries. Public Health Nutrition, 1, 5-21.
Reddy, K. S., Prabhakaran, D., Shah, P. and Shah, B. (2002). Differences in body mass index
and waist: hip ratios in north Indian rural and urban populations. Obesity Reviews, 3, 197-202.
Redfern, S. and Norman, I. (1994). Validity through triangulation. Nursing Researcher 2: 41-
56.
Sachs,J. D. (2005). The end of poverty. New York, NY, Penguin Press.
Sallis, J. F., Calfas, K. J., Nichols, J. F., Sarkin, A. J., Marilyn, F. J., Caparosa, S., Thompson,
S. and Alcaraz, E. J. (1999). Evaluation of a University Course to Promote Physical Activity:
Project GRAD, Research Quarterly for Exercise and Sport, 70, 1-10.
Sankaranarayanan, R. ( 2002). Effective screening programs for cervical cancer in low- and
middle-income developing countries. Bulletin of the World Health Organization, 79, 954-962.
Sen, A. (1998). Non-communicable diseases and achieving the Millennium Development
Goals. Available. www.unescap.org/esid/hds.
Shobhana, R., Rama, R. P., Lavanya, A., Williams, R., Vijay, V. and Ramachandran, A.
(2000). Expenditure on health care incurred by diabetic subjects in a developing country - a
study from southern India. Diabetes Research and Clinical Practice, 48, 37-42.
Silverman, D. (2000). Doing Qualitative Research: A practical handbook. London Sage
Publications.

91
Steyn, K., Jooste, P. L. and Bourne, L. (1991). Risk factors for coronary heart diseases in the
black population of the Cape Peninsula. The BRISK study. South African Medical Journal,
79, 480-485.
The World Health Report (1999). Making a difference. Geneva: World Health Organization.
The World Health Report (2002) – Reducing risks, promoting healthy life. Geneva, World
Health Organization.
Tumuusime, D. K. and Frantz, J. M. (2006). Influence of previous participation in physical
activity on its perceptions among tertiary institution students. African Journal for Physical,
Health Education, Recreation and Dance (AJPHERD), 12(3), 287-297.
Unal, B., Critchley, J. L. and Capewell, S. (2005). Modelling the decline in coronary heart
disease in England and Wales, 1982-2000: Comparing contribution from primary prevention
and secondary prevention. British Medical Journal, doi: 10.1136/bmj.38561.633345.8F.
UNESCO/UNICEF/WHO/World Bank (2000). Focusing resources on effective school health:
A fresh start to enhancing the equality and equity of education. World Education Forum. Final
Report. (http://portal.unesco.org/, accessed, 14, July 2009.
Unwin, N., Setel, P., Rashid, S., Mugusi, F., Mbanya, J., Kitange, H., Hayes, L., Edwards, R.,
Aspray, T. and Alberti, N. (2001). Non-communicable diseases in sub-saharan Africa: Where
do they feature in the health research agenda? Bulletin of the World Health Organization, 79,
947-953.
Van Walbeek, C. (2002). Recent trends in smoking prevalence in South Africa – Some
evidence from AMPS data. South African Medical Journal, 92(6), 468 – 472.
Wang, W., Lee, E. T., Fabsitz, R. R., Devereux, R., Best, L., Welty, T. K. and Howard, B.
V. (2006). A Longitudinal Study of Hypertension Risk Factors and their Relation to
Cardiovascular Disease: The Strong Heart Study. Hypertension, 47, 403-409.

92
WHO (2005a). Preventing Chronic Diseases: A Vital Investment. World Health Organization
Global Report.
WHO (2005b). WHO STEPS Instrument. Department of Chronic Diseases and Health
Promotion. World Health Organization. Geneva, Switzerland.
World Health Organization (2001a). Physical Activity. Department of Non-communicable
Disease Prevention and Health Promotion. World Health Organization: Geneva.
World Health Organization (2002). Reducing Risks: Promoting Healthy Life. World Health
Organization. Geneva.
World Health Organization (2003). Physical inactivity: Direct and indirect health benefits.
Non-communicable diseases and prevention and health promotion. World Health
Organization, Geneva.
World Health Organization (2004). World Health Survey, Kenya.
World Health Organization (2005c). World Health Survey, Kenya.
World Health Organization (2008). Preventing Chronic Diseases: A vital investment.
Available: http://www.who.int/chp/chronic=disease=report/en/. Accessed 30 June 2009.
World Health Organization (200b1). Summary. Surveillance of risk factors for
noncommunicable diseases. The WHO STEPwise approach. Noncommunicable diseases and
Mental Health.
World Health Report (1998). Obesity: Preventing and Managing the Global Epidemic.
Geneva, Switzerland: World Health Organization. WHO/NUT/NCD/98.1.
World Health Report (2004). Building blocks for tobacco control, A handbook. Geneva.

93
Wu, X. and Stamler, Z. (1996). Changes in average blood pressure and incidence of high
blood pressure 1983-1984 to 1987-1988 in four population cohorts in the people’s Republic of
China. The PRC-USA Cardiovascular and Cardiopulmonary Epidemiology Research Group.
Journal of Hypertension, 14(11), 1267-1274.
Yamane, T. (1967). Statistics, An Introductory Analysis, 2nd Edition, New York: Harper and
Row.
Yang, G., Fan, L., Tan, J., Qi, G., Zhang, Y. and Samet, J. M. (1999). Smoking in China:
Findings of the 1996 National Prevalence Survey. Journal of American Medical Association,
33(4), 478-480.
Yusuf, S., Reddy, S., Ounpuu, S. and Anand, S. (2001). Global burden of cardiovascular
diseases. Part 1: General considerations, the epidemiologic transition, risk factors and impact
of urbanization. Clinical cardiology: New Frontiers, 104, 2746-2753.
Retrieved March 26, 2008, from http://www.circulationaha.org.