Embed Size (px)
Citation preview

Challenges in Visualizing Pharmaceutical Business
Information (Diane Webb, BizInt Solutions, Inc.)
II-SDV Conference, Nice, France
April 2013
1
BizInt Smart Charts 2013
Challenges in Visualizing
Pharmaceutical Business Information
April 2013
II-SDV, Nice, France Diane Webb, President, BizInt Solutions Inc.
BizInt Smart Charts 2013
The Problem:
Visualizations developed for
scientific and patent data
do not do a good job of “telling the story”
when applied to drug pipeline data
and often need significant changes.
Challenges in Visualizing Pharmaceutical Business
Information (Diane Webb, BizInt Solutions, Inc.)
II-SDV Conference, Nice, France
April 2013
2
BizInt Smart Charts 2013
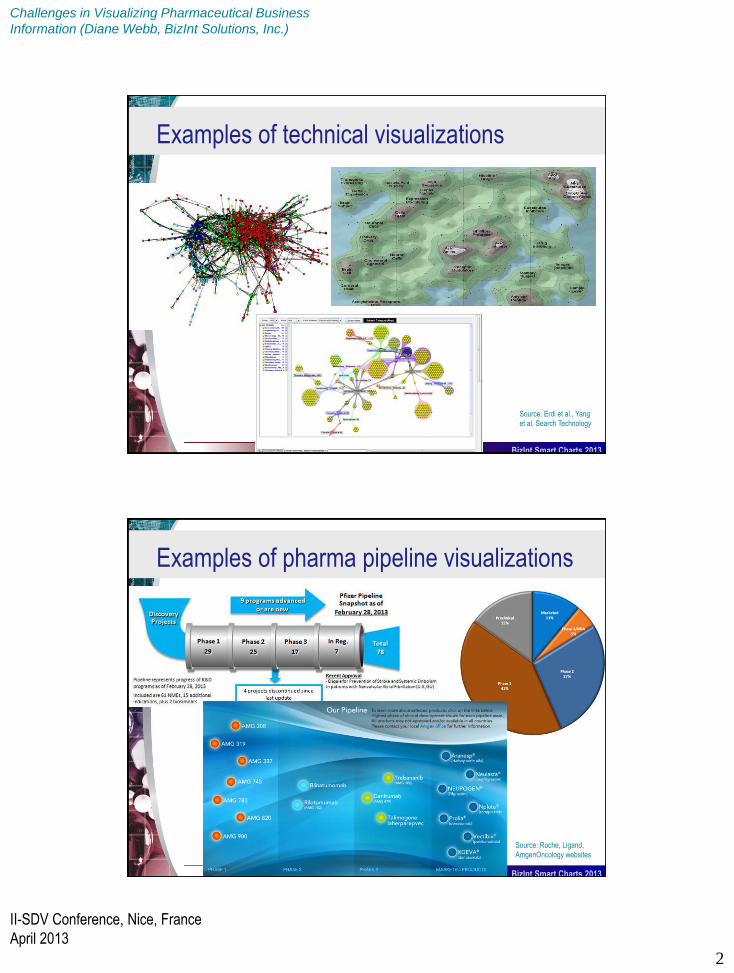
Examples of technical visualizations
Source: Erdi et al., Yang
et al, Search Technology
BizInt Smart Charts 2013
Examples of pharma pipeline visualizations
Source: Roche, Ligand,
AmgenOncology websites
Challenges in Visualizing Pharmaceutical Business
Information (Diane Webb, BizInt Solutions, Inc.)
II-SDV Conference, Nice, France
April 2013
3
BizInt Smart Charts 2013
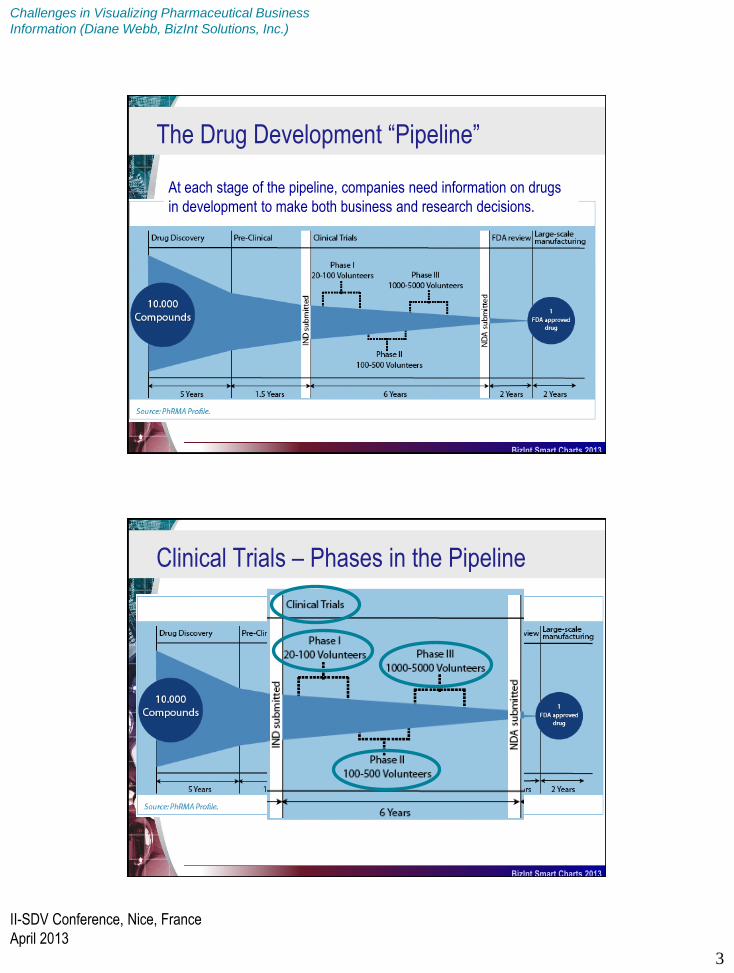
The Drug Development “Pipeline”
At each stage of the pipeline, companies need information on drugs
in development to make both business and research decisions.
BizInt Smart Charts 2013
Clinical Trials – Phases in the Pipeline

Challenges in Visualizing Pharmaceutical Business
Information (Diane Webb, BizInt Solutions, Inc.)
II-SDV Conference, Nice, France
April 2013
4
BizInt Smart Charts 2013
Information on drug pipelines --
Comes from a variety of sources – company
sources, published literature, conferences,
industry news, etc.
Drug Pipelines Databases – constructed by
teams of editors at several companies, reviewing
public and proprietary sources.
Sold to the pharmaceutical industry for
competitive intelligence on drug pipelines.
Examples: Pharmaprojects, Integrity, R&D Focus
BizInt Smart Charts 2013
An example of a company pipeline graph
Created in Excel from
BizInt Smart Charts

Challenges in Visualizing Pharmaceutical Business
Information (Diane Webb, BizInt Solutions, Inc.)
II-SDV Conference, Nice, France
April 2013
5
BizInt Smart Charts 2013
There are lots of problems…
Vocabulary needs
to be normalized.
Created in Excel from
BizInt Smart Charts
BizInt Smart Charts 2013
Challenges in multi-database reports
1. Multiple
Records for the
Same Drug

Challenges in Visualizing Pharmaceutical Business
Information (Diane Webb, BizInt Solutions, Inc.)
II-SDV Conference, Nice, France
April 2013
6
BizInt Smart Charts 2013
Challenges in multi-database reports
2. Conflicting
Data for the
Same Drug
BizInt Smart Charts 2013
Challenges in multi-database reports
3. Terminology
Variation
Challenges in Visualizing Pharmaceutical Business
Information (Diane Webb, BizInt Solutions, Inc.)
II-SDV Conference, Nice, France
April 2013
7
BizInt Smart Charts 2013
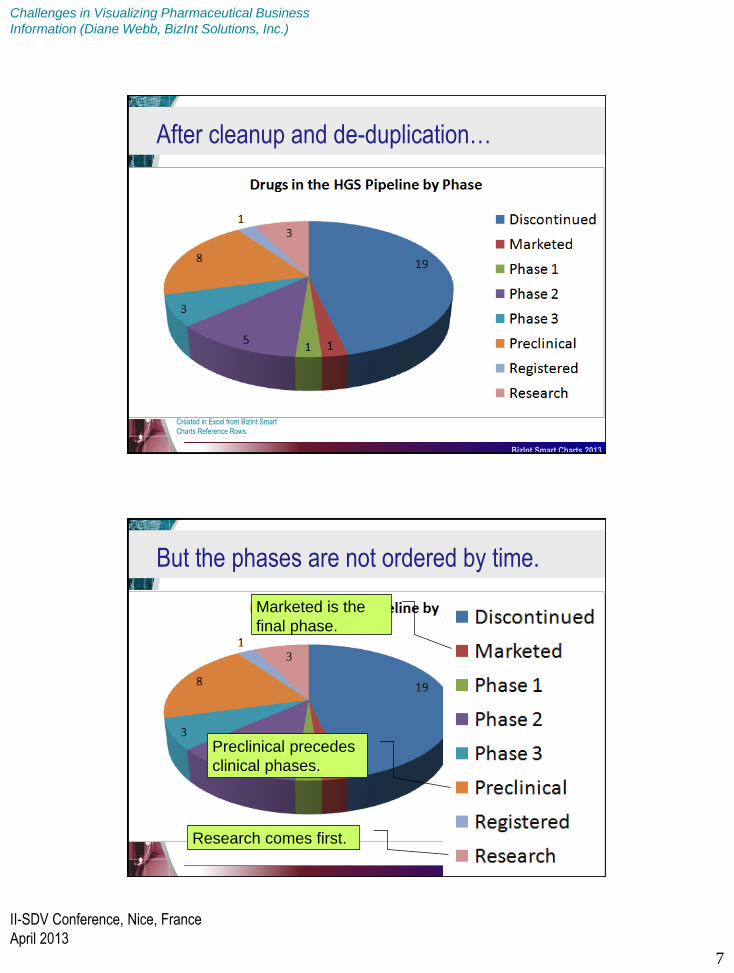
After cleanup and de-duplication…
Created in Excel from BizInt Smart
Charts Reference Rows.
BizInt Smart Charts 2013
But the phases are not ordered by time.
Marketed is the
final phase.
Research comes first.
Preclinical precedes
clinical phases.

Challenges in Visualizing Pharmaceutical Business
Information (Diane Webb, BizInt Solutions, Inc.)
II-SDV Conference, Nice, France
April 2013
8
BizInt Smart Charts 2013
We need to order the phases chronologically
BizInt Smart Charts 2013
Now we have a meaningful pie graph…

Challenges in Visualizing Pharmaceutical Business
Information (Diane Webb, BizInt Solutions, Inc.)
II-SDV Conference, Nice, France
April 2013
9
BizInt Smart Charts 2013
Or we could create a pipeline bar graph…
Created in Excel from BizInt Smart
Charts Reference Rows.
BizInt Smart Charts 2013
But the colors aren’t consistent by phase.

Challenges in Visualizing Pharmaceutical Business
Information (Diane Webb, BizInt Solutions, Inc.)
II-SDV Conference, Nice, France
April 2013
10
BizInt Smart Charts 2013
So we apply color palette for phases.
BizInt Smart Charts 2013
But pipeline bar charts often look like this…
Source: Novartis website

Challenges in Visualizing Pharmaceutical Business
Information (Diane Webb, BizInt Solutions, Inc.)
II-SDV Conference, Nice, France
April 2013
11
BizInt Smart Charts 2013
Each bar/phase is made up of boxes…
Which represent a
drug in that phase.
With a color coding
scheme for another
aspect of the drug.
BizInt Smart Charts 2013
If there are too many drugs in a phase…
The boxes are
stacked in multiple
columns.
Challenges in Visualizing Pharmaceutical Business
Information (Diane Webb, BizInt Solutions, Inc.)
II-SDV Conference, Nice, France
April 2013
12
BizInt Smart Charts 2013
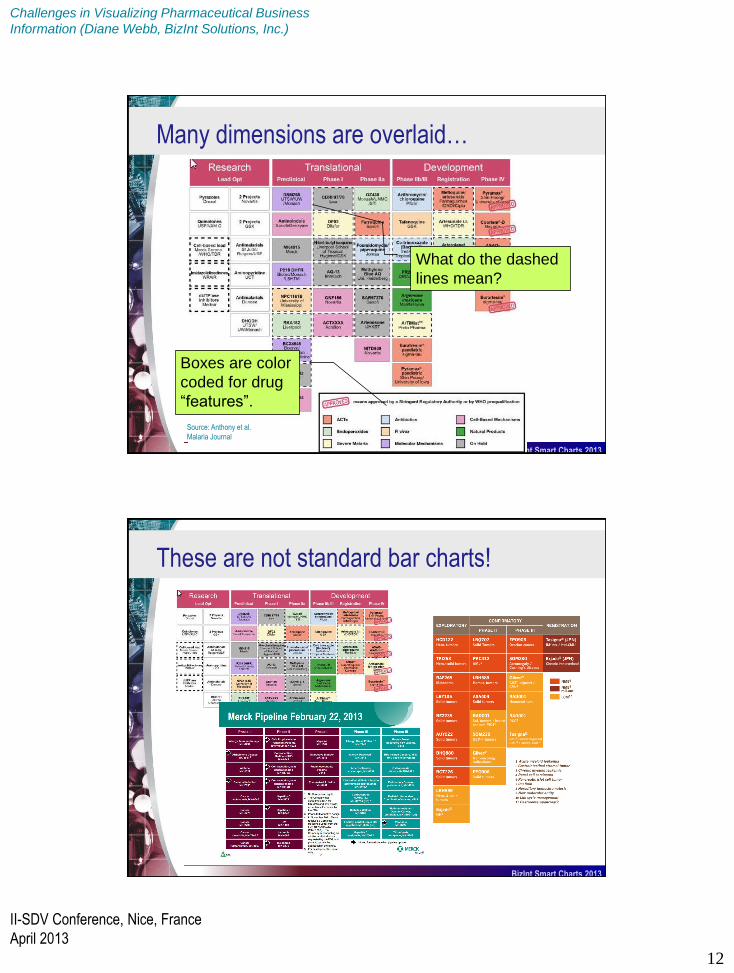
Many dimensions are overlaid…
Source: Anthony et al.
Malaria Journal
Boxes are color
coded for drug
“features”.
What do the dashed
lines mean?
BizInt Smart Charts 2013
These are not standard bar charts!

Challenges in Visualizing Pharmaceutical Business
Information (Diane Webb, BizInt Solutions, Inc.)
II-SDV Conference, Nice, France
April 2013
13
BizInt Smart Charts 2013
Here’s a “bulls-eye” pipeline visualization…
A Koul et al. Nature 469, 483-490 (2011) doi:10.1038/nature09657
A bull’s-eye representation of the current clinical pipeline for TB.
BizInt Smart Charts 2013
Features of a pipeline “bulls-eye”
Each ring is a phase.
The circle is divided into
segments representing
mechanisms (MOA).
Each drug is
placed by phase
and MOA.

Challenges in Visualizing Pharmaceutical Business
Information (Diane Webb, BizInt Solutions, Inc.)
II-SDV Conference, Nice, France
April 2013
14
BizInt Smart Charts 2013
This is not a standard visualization!
A bull’s-eye representation of the current clinical pipeline for TB.
BizInt Smart Charts 2013
It has features of a polar scatter chart.
Sample from Chart Director
chart library.
Challenges in Visualizing Pharmaceutical Business
Information (Diane Webb, BizInt Solutions, Inc.)
II-SDV Conference, Nice, France
April 2013
15
BizInt Smart Charts 2013
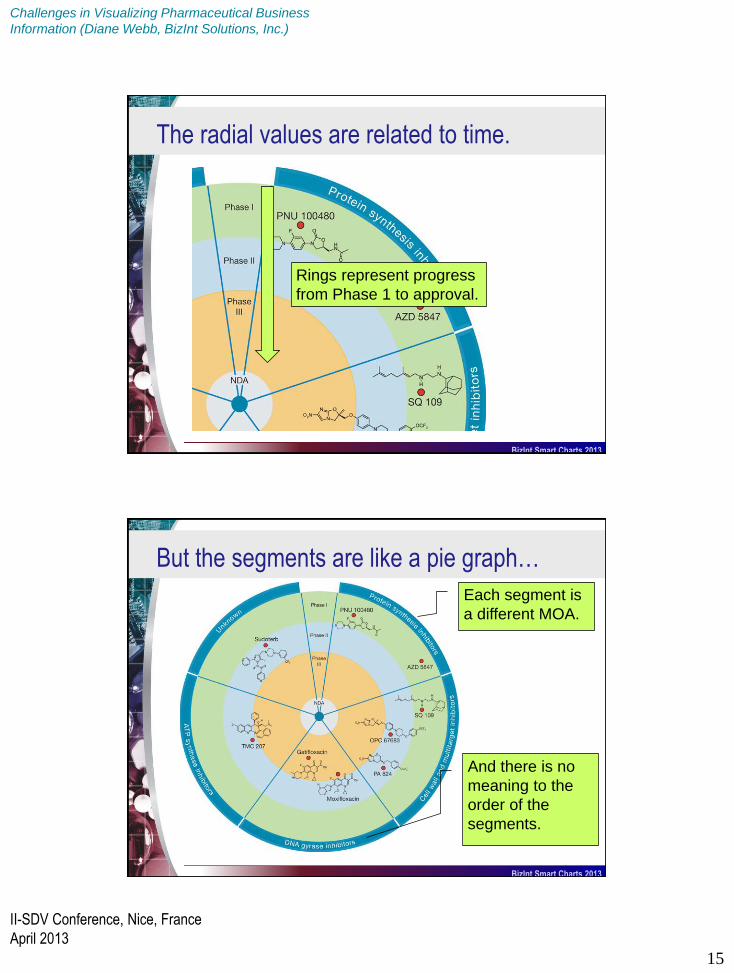
The radial values are related to time.
Rings represent progress
from Phase 1 to approval.
BizInt Smart Charts 2013
But the segments are like a pie graph…
Each segment is
a different MOA.
And there is no
meaning to the
order of the
segments.

Challenges in Visualizing Pharmaceutical Business
Information (Diane Webb, BizInt Solutions, Inc.)
II-SDV Conference, Nice, France
April 2013
16
BizInt Smart Charts 2013
Except the segments are the same size…
Even though
there is 1 drug
for this MOA.
And 3 for this
MOA.
BizInt Smart Charts 2013
In this bulls-eye, segment sizes vary…

Challenges in Visualizing Pharmaceutical Business
Information (Diane Webb, BizInt Solutions, Inc.)
II-SDV Conference, Nice, France
April 2013
17
BizInt Smart Charts 2013
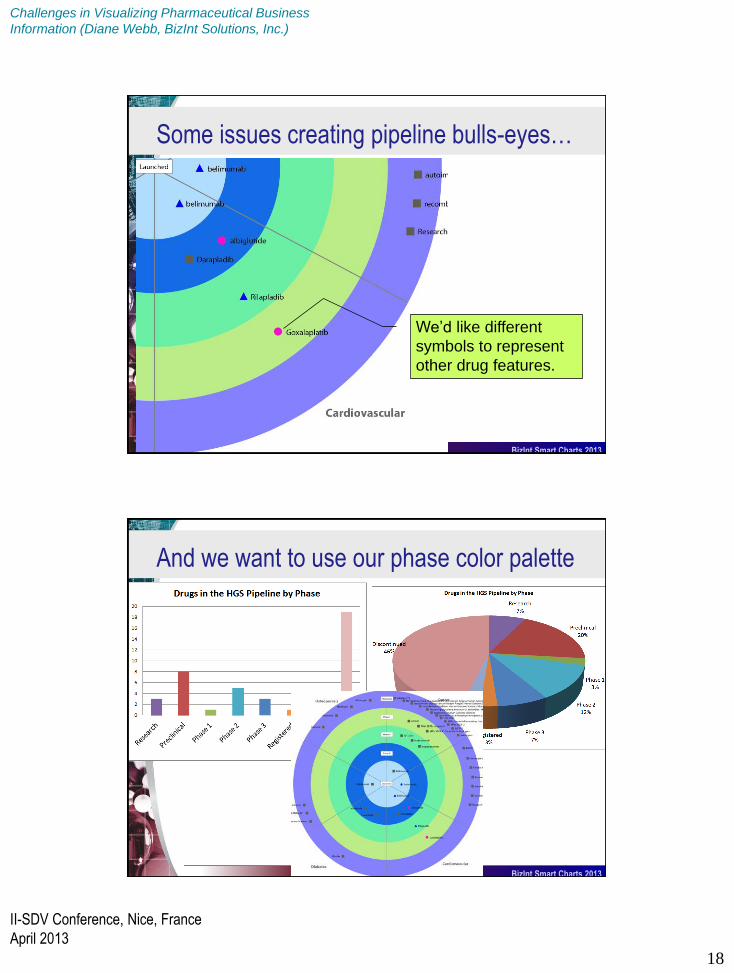
Some issues creating pipeline bulls-eyes…
Artistic mockup created with data from
BizInt Smart Charts Reference Rows.
BizInt Smart Charts 2013
Some issues creating pipeline bulls-eyes…
Where do you plot the
drugs in the segment?
Drug names
can be very
long.
Challenges in Visualizing Pharmaceutical Business
Information (Diane Webb, BizInt Solutions, Inc.)
II-SDV Conference, Nice, France
April 2013
18
BizInt Smart Charts 2013
Some issues creating pipeline bulls-eyes…
We’d like different
symbols to represent
other drug features.
BizInt Smart Charts 2013
And we want to use our phase color palette

Challenges in Visualizing Pharmaceutical Business
Information (Diane Webb, BizInt Solutions, Inc.)
II-SDV Conference, Nice, France
April 2013
19
BizInt Smart Charts 2013
The “phase” in a drug pipeline database…
Represents the furthest progress of clinical trials
for one or more indications in one or more
markets.
There may be multiple clinical trials in progress.
We want to show a timeline of clinical trials for
a particular drug.
Sources: ClinicalTrials.gov; Citeline Trialtrove;
Adis Clinical Trials Insight
BizInt Smart Charts 2013
Applying a standard GANTT visualization
Start/Completion
years not shown in
a familiar format
Cannot see the
trial phase
Created in VantagePoint – BizInt
Smart Charts Edition.
Significant manual
data cleanup
required

Challenges in Visualizing Pharmaceutical Business
Information (Diane Webb, BizInt Solutions, Inc.)
II-SDV Conference, Nice, France
April 2013
20
BizInt Smart Charts 2013
A better trial timeline
Bars now show
duration of trials
Missing data is
clearly displayed
Created in VantagePoint – BizInt
Smart Charts Edition.
Bars color coded
by phase
BizInt Smart Charts 2013
Consistent use of color
Use the phase
color palette
Legend explains
symbols
Created in VantagePoint –
BizInt Smart Charts Edition.

Challenges in Visualizing Pharmaceutical Business
Information (Diane Webb, BizInt Solutions, Inc.)
II-SDV Conference, Nice, France
April 2013
21
BizInt Smart Charts 2013
Why use multiple sources?
Indexing differences may return different results.
Additional trials
returned
BizInt Smart Charts 2013
Why use multiple sources?
Take advantage of content variation
More additional
trials returned
Missing end date
provided by Adis

Challenges in Visualizing Pharmaceutical Business
Information (Diane Webb, BizInt Solutions, Inc.)
II-SDV Conference, Nice, France
April 2013
22
BizInt Smart Charts 2013
To summarize, pipeline visualizations…
Require multiple sources for completeness and
accuracy.
Rely on data cleanup and deduplication tools.
Generally cannot be created with standard
visualization libraries.
BizInt Smart Charts 2013
And pipeline visualizations…
Often show discrete rather than aggregate values.
Often show categorical rather than numeric
coordinate values.
Need consistent use of order and color coding.
Do these visualizations operate at the exploratory or
explanatory levels?
Challenges in Visualizing Pharmaceutical Business
Information (Diane Webb, BizInt Solutions, Inc.)
II-SDV Conference, Nice, France
April 2013
23
BizInt Smart Charts 2013
Come to
our table
to learn
more!
Slides at:
bizcharts.com/slides
Thank you!