Embed Size (px)
Citation preview
Management Systems
in
2016, No 3 (23), pp 145-149
Abstract: The aim of the article is to present a mathematical definition of the object model, that is known in computer science as TreeList and to show application of this model for design evolutionary algorithm, that purpose is to generate structures based on this object. The first chapter introduces the reader to the problem of presenting data using the TreeList object. The second chapter describes the problem of testing data structures based on TreeList. The third one shows a mathe-matical model of the object TreeList and the parameters, used in determining the utility of structures created through this model and in evolutionary strategy, that generates these structures for testing purposes. The last chapter provides a brief summary and plans for future research related to the algorithm presented in the article.
THE PROPOSAL OF A EVOLUTIONARY STRATEGY GENERATING THE DATA STRUCTURES BASED ON A HORIZONTAL TREE FOR THE TESTS
INTRODUCTION
Very often in science, technology, and teaching it exists a situation, that an occurrence or a process which can be described by the model, which is close to a specific struc-ture in the nature. The article focuses on the description of data storage based on structure called tree. In the next three chapters will be discussed the horizontal trees, that are classified as traditional trees. These chapters presents mathematical definition of the structures based on TreeList and essence of the problem raised in the publication in order to maintain consistency of the article.
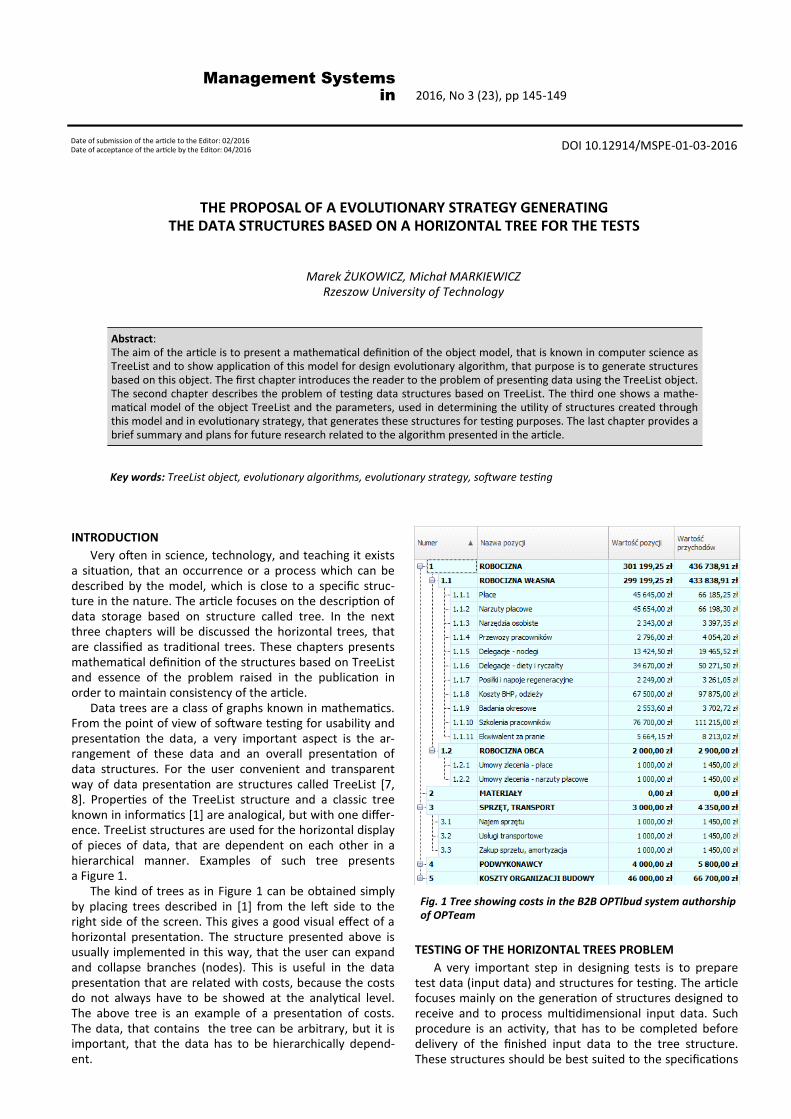
Data trees are a class of graphs known in mathematics. From the point of view of software testing for usability and presentation the data, a very important aspect is the ar-rangement of these data and an overall presentation of data structures. For the user convenient and transparent way of data presentation are structures called TreeList [7, 8]. Properties of the TreeList structure and a classic tree known in informatics [1] are analogical, but with one differ-ence. TreeList structures are used for the horizontal display of pieces of data, that are dependent on each other in a hierarchical manner. Examples of such tree presents a Figure 1.
The kind of trees as in Figure 1 can be obtained simply by placing trees described in [1] from the left side to the right side of the screen. This gives a good visual effect of a horizontal presentation. The structure presented above is usually implemented in this way, that the user can expand and collapse branches (nodes). This is useful in the data presentation that are related with costs, because the costs do not always have to be showed at the analytical level. The above tree is an example of a presentation of costs. The data, that contains the tree can be arbitrary, but it is important, that the data has to be hierarchically depend-ent.
TESTING OF THE HORIZONTAL TREES PROBLEM
A very important step in designing tests is to prepare test data (input data) and structures for testing. The article focuses mainly on the generation of structures designed to receive and to process multidimensional input data. Such procedure is an activity, that has to be completed before delivery of the finished input data to the tree structure. These structures should be best suited to the specifications
Marek ŻUKOWICZ, Michał MARKIEWICZ Rzeszow University of Technology
Key words: TreeList object, evolutionary algorithms, evolutionary strategy, software testing
DOI 10.12914/MSPE-01-03-2016 Date of submission of the article to the Editor: 02/2016 Date of acceptance of the article by the Editor: 04/2016
Fig. 1 Tree showing costs in the B2B OPTIbud system authorship of OPTeam

146 Management Systems in Production Engineering 3(23)/2016 M. ŻUKOWICZ, M. MARKIEWICZ - The proposal of a evolutionary strategy generating the data structures on a horizontal tree for test
of the tested program. The article presents the approach, that using an evolutionary algorithm and given initial struc-tures to creates new better structures suited to the needs of the structure test, basing on the example of using class TreeListControl in designing construction budgets in the B2B OPTIbud system. Evolutionary algorithms have a lot of features that allow in some way to control evolutionary process [6] and thus there is a high probability that gener-ated structures will be characterized by such features as [3]:
dependence on the system (quality depends on tech-nological aspects),
completeness (the degree to which this data has val-ue for all attributes in the system),
timeliness, credibility, cohesion (eg. a consistency between the test data), accuracy (for tests on numbers in applications that
require high accuracy, eg. in the conversion of units of measurement),
dependence on context. All features have to be satisfy for the test data [2, 4, 5].
There are not many such publications that would describe the strategy of testing data structures based on horizontal trees. Therefore, the authors decided to describe this prob-lem and suggest a solution, that allows to generate hori-zontal trees in this way that as the result of evolutionary processes there are created the structure corresponding to the preferences of people designing tests.
MATHEMATICAL DESCRIPTION OF STRUCTURES BASED ON THE HORIZONTAL TREES AND MEASURES OF THEIR USA-BILITY
Durning a designing the evolutionary algorithm, it must to be first make an assumptions about the data structure based on the horizontal tree and about parameters which can be measured in order to formulate a fitness function.
The assumptions concerning of the structure D con-sisting of horizontal trees are as follows:
there is at least one tree (presenting the horisontal data),
a node (including the root) has at least one feature which is described by a number (real positive num-ber),
the value of the specific node numer features in the level is a sum of the children of this node, when the children have only the (n + 1) level,
any number feature of the node x (root too) can be divided (but it is not required ) into periods with val-ues xi, and in this case the sum values for each period is equal, namely:
The possibilities of generating the above-described
structures, which arise from assumptions are infinite. In practice in the information systems every structures are finite. Therefore it is needed a strategy that will provide the structure, which likely will be applied in practice. To achieve this goal, it should be specify measures related to the above-described structure. Before a generating struc-tures will be taken into account the following restrictions:
quantity of trees k in the structure D, a nesting level sk of k-th tree (the level on which the
leaves of a tree), the total number of children tkj for a node j in k-th
tree, number of numerical characteristics u – common
ownership for all trees in the D, number of nonumerical characteristics v – common
ownership for all trees in the D too. Encoding information describing a single tree will be
done by the vector:
where: dk – number of a tree, sk – the nesting level of k-th tree, tk – the total number of children tkj for a node j in k-th tree, (root,s level equals 0).
Let a single tree will be defined by the following func-tion Fk measuring usability:
where: functions f, g : N → (0,1] and w1, w2 are weights.
It is easy to see, that the funktion Fk also has a value in the range (0,1]. The structure, which will consist of the sum of individual trees will have the following description:
where: i – numer of the structure consisting of horizontal trees, ui, vi – numerical and nonnumerical characteristics common for all trees in the structure Di.
This structure will be called later in the article the ma-trix of a structure of horizontal trees.
Let D = {D1, … ,Dn} will be a set of a structures which constist of a horizontal trees.
The fitness function F : D → (0,1] for a structure Di will be given by the formula:
where: wc, wd – weigths of a function F, n – the numer of a trees in a structure Di(ui vi).
Having defined the fitness functions it can be designed an evolutionary algorithm, which will be described in the next chapter [6].
THE EWOLUTIONARY ALGORITHM PROJECT FOR D SET
In evolutionary algorithms, there is the phenomenon of crossing components and their mutation [6]. Therefore, to design an evolutionary algorithm there are needed two functions: one is responsible for crossing elements to one
(1)
m
i
ixx
1
(2) },...,1{ ksktktkskd
(3)
ks
j
kjtjg
ks
wksfw
wwkdkF
12
21
21
1
(4)
(5)
dwcw
n
k
kdkFn
dwivliuhdw
vuiDF
1
1,1
}..,...,1{,..
}..2,...,21{,2..
}..1,...,11{,1....
,2
1
kkstktks
stts
stts
iviuiD
[ [ [
] ] ]
Management Systems in Production Engineering 3(23)/2016 147 M. ŻUKOWICZ, M. MARKIEWICZ - The proposal of a evolutionary strategy generating the data structures on a horizontal tree for test .
another and the second is the mutation operator. There-fore, according to the algorithm: KM Algorithm (crossing and mutation of horizontal trees). Let D1, D2 will be struc-tures consist of horizontal trees. Let D1 will be consist of trees and D2 will be consist of trees. An algorithm KM is given as a function
by the conditions: 1. Take the rest of the division of n by 2, add to the rest 1,
save the calculated value as x. 2. Take the rest of the division of k by 2, add to the rest,
save the calculated value as y. 3. Create a new structure by combining x initial trees,
starting from the first row in the matrix of a structure D1, with rows of the structure D2 starting from the row y.
4. Write down the number of trees in the new structure as s.
5. For each row in the newly established structure write numbers (ti1),…,(tik) binary.
6. For (i=1; i≤s; s++) 7. do { 8. k = 1; 9. Do a mutation of element tik with probability
q, bit by bit. 10. If the mutated element tik is located in the
field of the corresponding function, accept a mutation.
11. If the mutated element tik is not located in the field corresponding function, dont’t accept a mutation.
12. k ++. 13. } while (tik exists in the tree s). 14. The guantity of numerical characteristics from struc-
tures D1, D2, choose randomly from values u1, u2, and save as u.
15. The guantity of nonnumerical characteristics from struc-tures D1, D2, choose randomly from values v1, v2, and save as v.
16. Save newlu structure with parameters u and v. Having defined an algorithm for implementing the pro-
cess of crossover and mutation, it can be to specify evolu-tionary algorithm, in which the field is set D: ALGEN Algo-rithm (w1, w2, wc, wd, q, n, m, c, fv) (Evolutionary algotithm for structures D1, … ,Dn)
{ 1. Draw m structures and mark them as D’1,
D’2, D’3, … ,D’m for (j=1, j < c, j + +) {
2. Do newly structures by using the KM Algorithm: D”1=X(D’1, D’2), D”2=X(D’2, D’3), D”3=X(D’3, D’4), ..... D”m=X(D’m, D’1),
3. Compare the sum s= F[D’i(ui, vi)] with the sum l= F[D”i(ui, vi)] if s ≥ l, start next iteration, if s < l change elements D’1, D’2, D’3,
… ,D’m to D”1, D”2, D”3, … ,D”m, if l > fv break iteration and save elements
D’1, D’2, D’3, … ,D’m }
4. Give generated ofspring D’1, D’2, D’3, … ,D’m. }
where: w1, w2, wc, wd – weights of a function measuring usability (described in the previous section) , q – mutation probability, n – numer of all structures, c – numer of iterations in the case of failure, fv – values, which break algorithm with positve result. This parameter determines whether to generate structures in the next iteration or not. It should also be noted that the values l, v can not be greather than number m.
APPLICATION AN ALGEN ALGORITHM IN THE BUDGET TESTING IN THE B2B OPTIBUD SYSTEM
Budgets in the B2B OPTIbud system
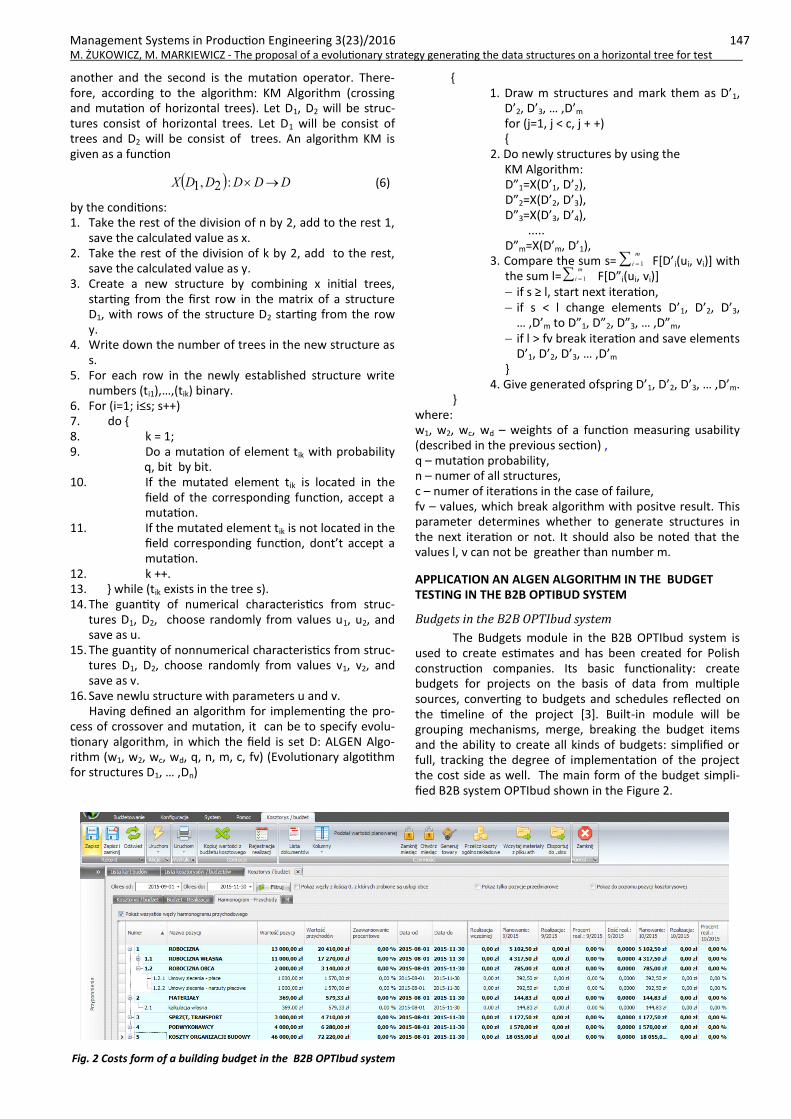
The Budgets module in the B2B OPTIbud system is used to create estimates and has been created for Polish construction companies. Its basic functionality: create budgets for projects on the basis of data from multiple sources, converting to budgets and schedules reflected on the timeline of the project [3]. Built-in module will be grouping mechanisms, merge, breaking the budget items and the ability to create all kinds of budgets: simplified or full, tracking the degree of implementation of the project the cost side as well. The main form of the budget simpli-fied B2B system OPTIbud shown in the Figure 2.
1i
m
1i
m
(6) DDDDDX :2,1
Fig. 2 Costs form of a building budget in the B2B OPTIbud system
148 Management Systems in Production Engineering 3(23)/2016 M. ŻUKOWICZ, M. MARKIEWICZ - The proposal of a evolutionary strategy generating the data structures on a horizontal tree for test
A structure which presetns costs is analogous to the structure described in section mathematical description of structures based on the horizontal trees and mesures of their usability. This structure is a good example of an appli-cation of the ALGEN algotithm. Numerical characteristics shown in the picture are columns: Value of incomes (Wartość pozycji), Value of income (Wartość przychodów), Percentage advancement (Zaawansowanie procentowe), Earlier realization (Realizacja wcześniej), Realization 9/2015 (Realizacja 9/2015), Planning 9/2015 (Planowanie 9/2015), Percentage of realization 9/2015 (Procent real.: 9/2015),itd. Nonnumerical characteristics shown in the picture are col-umns Number (Numer), Name of a position (Nazwa Pozycji), Date from (Data-od), Date to (Data-do). The columns begin-ning with the words Planowanie are values created by divid-ing the planned revenues from the budget by 4, because the budget has that schedule (Date form and Date to). Quantity of a the trees equals 5 in this budget. Level of a tree, which have root with numer 1 equals 2 (root – level 0, nodes 1.1 and 1.2 – level I, so nodes 1.2.1 i 1.2.2 – level II). In the previous chapter are given definitions of a function-swhich measure the fitness of a tested structures. Formulas (3) and (5) contain functions f, g, h, l. The following there are given definitions of these functions, which will be used to im-plement KM and ALGEN algorithms on the system OPTIbud:
1. for
for for
2. for
for for for
for The formulas of the above-described functions have
been deliberately chosen in such a way that did not reach values greater than 1 and an evolutionary algorithm gener-ates the best possible structure for testing (do not have a huge number of nodes).
An implementation of an ALGEN algorithm in the Budgets module in the system B2B OPTIbud
Let the initial input population D will consist of the fol-lowing budgets:
respectively with parametrs u1=6, v1=2, u2=8, v2=2, u3=7, v3=3, u4=7, v4=3, u5=4, v5=2, u6=5, v6=2, u7=6, v7=2, u8=7, v8=3, u9=8, v9=3, u10=10, v10=4. Let the input parameters of the ALGEN algorithm will have values: w1=2, w2=3, wc=2, wd=1, q=0,2, n=10, m=4, c=30, fv=3.7. The results returned by the algorithm after six iterations are: with parameters u’1=6, v’1=3, u’2=8, v’2=2, u’3=7, v’3=3, u’4=7, v’4=3, with values s=3.5003, l=3.7223.
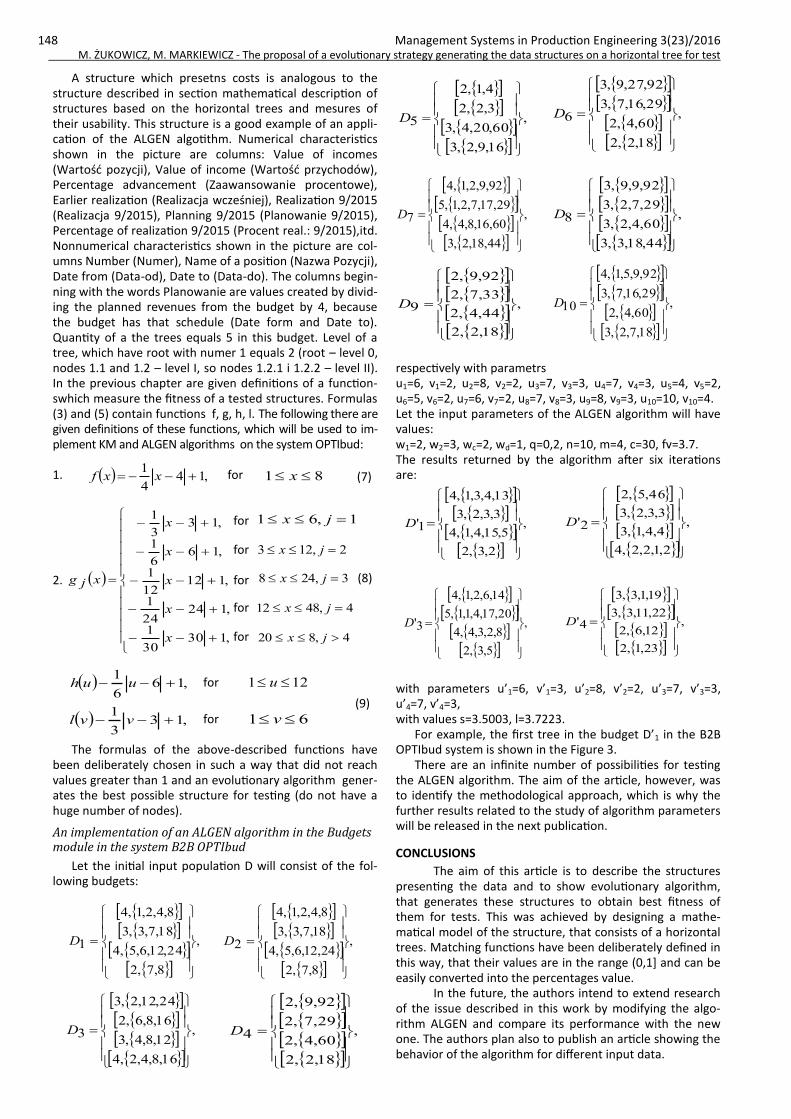
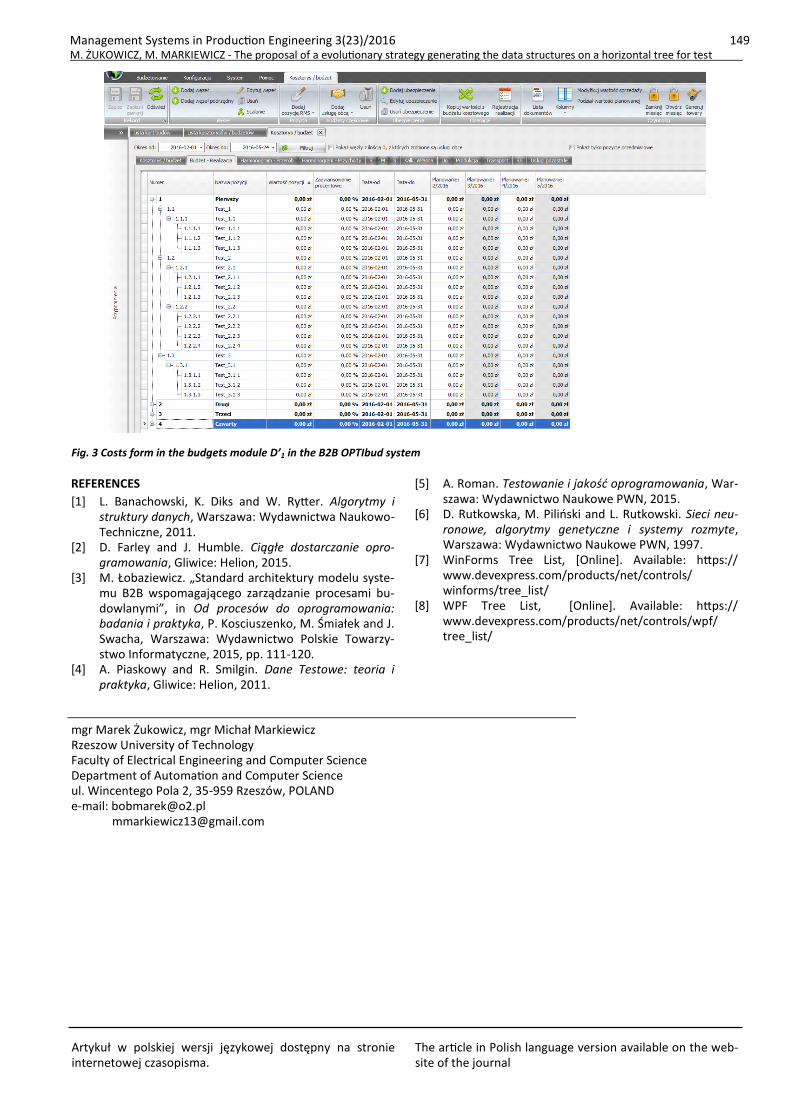
For example, the first tree in the budget D’1 in the B2B OPTIbud system is shown in the Figure 3.
There are an infinite number of possibilities for testing the ALGEN algorithm. The aim of the article, however, was to identify the methodological approach, which is why the further results related to the study of algorithm parameters will be released in the next publication.
CONCLUSIONS
The aim of this article is to describe the structures presenting the data and to show evolutionary algorithm, that generates these structures to obtain best fitness of them for tests. This was achieved by designing a mathe-matical model of the structure, that consists of a horizontal trees. Matching functions have been deliberately defined in this way, that their values are in the range (0,1] and can be easily converted into the percentages value.
In the future, the authors intend to extend research of the issue described in this work by modifying the algo-rithm ALGEN and compare its performance with the new one. The authors plan also to publish an article showing the behavior of the algorithm for different input data.
(7) ,144
1 xxf 81 x
(8)
,13030
1
,12424
1
,11212
1
,166
1
,133
1
x
x
x
x
x
xjg
1,61 jx
2,123 jx
3,248 jx
4,4812 jx
4,820 jx
(9)
,166
1 uuh 121 u
,133
1 vvl 61 v
,
8,7,2
24,12,6,5,4
18,7,3,3
8,4,2,1,4
1
D
,
8,7,2
24,12,6,5,4
18,7,3,3
8,4,2,1,4
2
D
,
16,8,4,2,4
12,8,4,3
16,8,6,2
24,12,2,3
3
D
,
18,2,2
60,4,2
29,7,2
92,9,2
4
D
,
16,9,2,3
60,20,4,3
3,2,2
4,1,2
5
D
,
18,2,2
60,4,2
29,16,7,3
92,27,9,3
6
D
,
44,18,2,3
60,16,8,4,4
29,17,7,2,1,5
92,9,2,1,4
7
D
,
44,18,3,3
60,4,2,3
29,7,2,3
92,9,9,3
8
D
,
18,2,2
44,4,2
33,7,2
92,9,2
9
D
,
18,7,2,3
60,4,2
29,16,7,3
92,9,5,1,4
10
D
,
2,3,2
5,15,4,1,4
3,3,2,3
13,4,3,1,4
1'
D
,
2,1,2,2,4
4,4,1,3
3,3,2,3
46,5,2
2'
D
,
5,3,2
8,2,3,4,4
20,17,4,1,1,5
14,6,2,1,4
3'
D
,
23,1,2
12,6,2
22,11,3,3
19,1,3,3
4'
D
Management Systems in Production Engineering 3(23)/2016 149 M. ŻUKOWICZ, M. MARKIEWICZ - The proposal of a evolutionary strategy generating the data structures on a horizontal tree for test .
mgr Marek Żukowicz, mgr Michał Markiewicz Rzeszow University of Technology Faculty of Electrical Engineering and Computer Science Department of Automation and Computer Science ul. Wincentego Pola 2, 35-959 Rzeszów, POLAND e-mail: [email protected]
REFERENCES
[1] L. Banachowski, K. Diks and W. Rytter. Algorytmy i struktury danych, Warszawa: Wydawnictwa Naukowo-Techniczne, 2011.
[2] D. Farley and J. Humble. Ciągłe dostarczanie opro-gramowania, Gliwice: Helion, 2015.
[3] M. Łobaziewicz. „Standard architektury modelu syste-mu B2B wspomagającego zarządzanie procesami bu-dowlanymi”, in Od procesów do oprogramowania: badania i praktyka, P. Kosciuszenko, M. Śmiałek and J. Swacha, Warszawa: Wydawnictwo Polskie Towarzy-stwo Informatyczne, 2015, pp. 111-120.
[4] A. Piaskowy and R. Smilgin. Dane Testowe: teoria i praktyka, Gliwice: Helion, 2011.
[5] A. Roman. Testowanie i jakość oprogramowania, War-szawa: Wydawnictwo Naukowe PWN, 2015.
[6] D. Rutkowska, M. Piliński and L. Rutkowski. Sieci neu-ronowe, algorytmy genetyczne i systemy rozmyte, Warszawa: Wydawnictwo Naukowe PWN, 1997.
[7] WinForms Tree List, [Online]. Available: https://www.devexpress.com/products/net/controls/winforms/tree_list/
[8] WPF Tree List, [Online]. Available: https://www.devexpress.com/products/net/controls/wpf/tree_list/
Fig. 3 Costs form in the budgets module D’1 in the B2B OPTIbud system
Artykuł w polskiej wersji językowej dostępny na stronie internetowej czasopisma.
The article in Polish language version available on the web-site of the journal