Embed Size (px)
Citation preview


The Provisional Summary Report released in March 2009 has been revised and updated in line with the detailed report approved on 18th September 2009.

Gendering Human Development Indices:Recasting the Gender Development Index and
Gender Empowerment Measure for India
MINISTRY OF WOMEN AND CHILD DEVELOPMENTGOVERNMENT OF INDIA
2009
Summary Report

�
This Report on “Gendering Human Development Indices: Recasting the Gender Development Index and Gender Empowerment Measure for India” is an initiative of the Ministry of Women and Child Development (MWCD), Government of India, supported by the United Nations Development Programme (UNDP) and prepared by the Indian Institute of Public Administration (IIPA), New Delhi.

�
Gender relations are the key to understanding the inequalities between men and women. These inequali-ties are expressed in many ways – explicit and implicit. The explicit measures are well known and are revealed in statistics depicting differences in the sex ratio, child infanticide, literacy rates, health and nutrition indicators, wage differentials and ownership of land and property. The implicit measures are embedded in power and culture. These intra-household inequalities result in unequal distribution of power, unequal control over resources and decision-making; dependence rather than self-reliance; and unfair, unequal distribution of work, drudgery, and even food. For governments and concerned citizens seeking to redress these inequalities, gender disaggregated data and indices are tools that can be used to identify gender inequalities, determine the issues that must be addressed, take steps to redress the inequalities, provide feedback on the effectiveness of actions and re-prioritise allocation of resources.
United Nations Development Programme’s (UNDP) annual Human Development Reports (HDRs) have suc-cessfully shifted the development debates and attention from uni-dimensional, income or Gross Domestic Product based indices to the inclusion of non-income and multi-dimensional variables in measurement of development. The Human Development Index (HDI) introduced by UNDP in 1990 is a simple average of three dimension indices that measure average achievements in a country with regard to ‘A long and healthy life’, as measured by life expectancy at birth; ‘Knowledge’, as measured by the adult literacy rate and the combined primary, secondary and tertiary gross enrolment ratio; and ‘A decent standard of liv-ing’, as measured by estimated earned income in Purchasing Power Parity (PPP) US$. In 1995, the UNDP introduced two new indices: a Gender-related Development Index (GDI) and a Gender Empowerment Measure (GEM). UNDP’s HDRs have estimated HDI each year since 1990 and GDI and GEM since 1995. The Gender Empowerment Measure focuses on opportunities and captures gender inequality in three key areas: ‘Political participation and decision-making power’, as measured by women’s and men’s percent-age shares of parliamentary seats; ‘Economic participation and decision-making power’, as measured by two indicators – women’s and men’s percentage shares of positions as legislators, senior officials and managers and women’s and men’s percentage shares of professional and technical positions; and ‘Power over economic resources’, as measured by women’s and men’s estimated earned income (PPP US$). The GEM was intended to measure women’s and men’s abilities to participate actively in economic and politi-cal life and their command over economic resources.
1.Introduction
�
GDI and GEM developed by UNDP need to be recast to realistically capture the gender gaps in development and empowerment in the Third World. These indices have been developed from a northern perspective and do not incorporate the perspective of the South. How can we recast GDI and GEM to make them meaning-ful for India within the limitations of data availability? Can GDI and GEM become effective instruments for building gender equity?
With this as the objective, the Ministry of Women and Child Development (MWCD) decided to recast GDI and GEM for India and for the States/Union Territories (UTs). UNDP also came forward to support this initia-tive with technical and financial assistance through the MWCD-UNDP project “Promoting Gender Equality”. The Indian Institute of Public Administration (IIPA), New Delhi was identified as the Technical Collaborating Institution for the task. In January 2007, MWCD constituted a Technical Advisory Committee (TAC) with the Statistical Adviser, MWCD, as the Chairperson and Prof. Aasha Kapur Mehta, Professor of Economics, IIPA, as the Member Secretary. The TAC members comprised representatives from the Ministry of Statistics and Programme Implementation, Social Sector Ministries, a few of the women economists who had worked on these indicators in 1996 and UNDP.
An iterative process was followed through three brainstorming TAC Workshops. The final choice of dimen-sions and indicators was based on the need to use variables that are intuitively understandable and relevant, within the constraints imposed by availability of reliable data. The decisions taken in the TAC workshops that enabled determination of these indicators are the following:
• Only two indices would be calculated: (i) GDI and (ii) GEM. These would be calculated at the national or All-India level and for States/UTs. Calculation of GDI and GEM would also be attempted for two districts to identify data gaps. The indices would be calculated for two time periods, 1996 and 2006.
• The index compiled should be simple, easily calculable and easy to interpret.
• For maintaining international comparability, the dimensions used would be the same as those used by UNDP. Equal weights would be assigned to all the dimensions. However, within dimensions, the indica-tors chosen, weights and goal posts would be more relevant to the Indian context.
• Critical gaps in data availability would be highlighted.
�.MinistryofWomenandChildDevelopment’sInitiative:TheProcessofRecastingGDIandGEMforIndiaandtheStates/UnionTerritories

�
The final list of indicators used was constrained by availability of data for India and for most States and Union Territories. Data gaps exist even for the finally selected indicators, thereby requiring assumptions/ap-plications of averages. Apart from GDI and GEM, HDI was also calculated for 1996 and 2006 based on the same dimensions and indicators identified for GDI. The Dimensions and Indicators identified for computing HDI, GDI and GEM are given below.
HDIandGDIHDI and GDI Dimensions 1: ‘A Long and Healthy Life’
Indicators: i) Infant Mortality Rate and ii) Life Expectancy at age 1.
The negative index for infant mortality rate was converted to a positive indicator by subtracting the value from 1.
HDI and GDI Dimension 2: ‘Knowledge’
Indicators: i) 7+ Literacy Rate and ii) Mean Years of Education for 15+ age group
HDI and GDI Dimension 3: ‘A Decent Standard of Living’
Indicator: i) Female/Male Estimated Earned Income share per capita per annum.
GEMGEM Dimension 1: ‘Political Participation and Decision-making Power’
Indicators: i) % Share of Parliamentary Seats (elected); ii) % Share of Seats in Legislature (elected); iii) % Share of Seats in Zilla Parishads (elected); iv) % Share of Seats in Gram Panchayats (elected); v) % Candi-dates in Electoral Process in National Parties in the Parliamentary election and vi) % Electors Exercising the Right to Vote in the Parliamentary election.
GEM Dimension 2: ‘Economic Participation and Decision-making Power’
Indicators: i) % Share of officials in service in Indian Administrative Service, Indian Police Service and Indian Forest Service; and ii) % Share of enrolment in medical and engineering colleges.
�.Dimensions,Indicators,GoalPostsandWeightsforHDI,GDIandGEM

�
GEM Dimension 3: ‘Power over Economic Resources’
Indicators: i) % Female/Male with Operational Land Holdings; ii) % Females/Males with Bank Accounts in Scheduled Commercial Banks (with credit limit above Rs. 2 lakh); iii) Share of Female/Male Estimated Earned Income Share per capita per annum.
Using goal posts and weights, the dimension indices are calculated. In case of GDI and GEM, while calcu-lating dimension indices, the penalty for gender inequality, i.e., the value of epsilon is taken as 2, which is moderate penalty. The methodology of calculation adopted is the same as followed by UNDP.
The goal posts fixed for estimating HDI and GDI are presented in Table 3.1 and weights for combining the three dimensional indices as well as the indicators within each dimension and for HDI, GDI and GEM are in Tables 3.2 and 3.3.
Maximum Minimum
‘A Long and Healthy Life’
Infant Mortality Rate 105 per 1000 live births 0 per 1000 live birthsLife Expectancy at age 1 for HDI 85 years 25 yearsLife Expectancy at age 1 for GDI 87.5 years for females and
82.5 for males27.5 years for females and 22.5 for males
‘Knowledge’
7+ Literacy Rate 100 percent 0 percentMean Years of Education for 15+ age group
25 years 1 year
‘A Decent Standard of Living’
Female/Male Estimated Earned Income Share per capita per annum
Rs 1,50,000 Rs 100
Table 3.1: Goal Posts for HDI and GDI
Dimensions/Indicators Weights
Dimension 1: ‘A Long and Healthy Life’ One-third
Infant Mortality Rate Half for each indicator within the dimensionLife Expectancy at age 1 Dimension 2: ‘Knowledge’ One-third
7+ Literacy rate Two thirds within the dimensionMean Years of Education for 15+ age group One third within the dimensionDimension 3: ‘A Decent Standard of Living’ One-third
Female/Male Estimated Earned Income Share per capita per annum
Table 3.2: Weights for Dimensions and Indicators - HDI and GDI

�
Dimensions/Indicators Weights
Dimension 1: ‘Political Participation and Decision-making Power’
One-third
% Share of Parliamentary Seats (elected)
One sixth for each indicator within the dimension
% Share of Seats in Legislature (elected)% Share of Seats in Zilla Parishads (elected)
% Share of Seats in Gram Panchayats (elected)
% Candidates in Electoral Process in National Parties% Electors exercising the right to voteDimension 2: ‘Economic Participation and Decision-making Power’
One-third
% Share of officials in service in Indian Administrative Service, Indian Police Service and Indian Forest Service Half for each indicator within the
dimension% Share of Enrolment in Medical and Engineering CollegesDimension 3: ‘Power over Economic Resources’ One-third
% Share of Operational Land Holdings
One third for each indicator within the dimension
% Females/Males with Bank Accounts in Scheduled Commercial Banks (with credit limit above Rs. 2 lakh)% Female/Male Estimated Earned Income Share per capita per annum
Table 3.3: Weights for Dimensions and Indicators - GEM

�
�.HDIandGDIEstimatesforIndia:ResultsandAnalysis
HDI and GDI scores estimated for India and the scores for each of the three dimensions for the two points of time viz., 1996 and 2006, are presented in Tables 4.1, 4.2 and 4.3 respectively.
Year Human Development Index Gender Development Index
2006 0.605 0.5901996 0.530 0.514
Table 4.1: Estimated HDI and GDI for India: 2006 and 1996
Year HealthIndex
EducationIndex
IncomeIndex
HumanDevelopment
Index
2006 0.577 0.506 0.730 0.605
1996 0.490 0.429 0.671 0.530
Table 4.2: Dimension scores for HDI for India: 2006 and 1996
Year HealthIndex
EducationIndex
IncomeIndex
Gender Devel-opment Index
2006 0.573 0.494 0.702 0.590
1996 0.490 0.409 0.643 0.514
Table 4.3: Dimension scores for GDI for India: 2006 and 1996
The aggregate HDI and GDI scores estimated for India were 0.530 and 0.514 respectively in 1996 and 0.605 and 0.590 in 2006 (Table 4.1). Over the decade, the value of the Human Development Index increased by 0.075 points and the Gender Development Index by 0.076 points. The Gender Development Index is the HDI adjusted for disparities between women and men and the estimated GDI scores for India are lower than the HDI score at both points of time due to the existence of gender based disparities in all three dimensions.
Each of the three dimension indices that constitute HDI and GDI also reflect an increase over the decade, thereby implying that progress has been made in each of these areas (Tables 4.2 and 4.3).

�
HDIandGDIScoresforStates/UTsTables 4.4 and 4.5 present HDI and GDI scores and their dimensions for India and the States/UTs.
• In 1996, Kerala had the highest score in the country achieving scores of 0.736 on HDI and 0.721 on GDI. However, in 2006, Kerala was ranked 2nd on HDI and 3rd on GDI with scores of 0.764 and 0.745 respectively.
• Chandigarh was ranked 2nd on both HDI and GDI in 1996 but attained the highest HDI and GDI scores in 2006 at 0.784 and 0.763 respectively.
• Goa was ranked 3rd on both HDI and GDI in 1996. It improved its rank to 2nd on HDI (0.764) and GDI (0.747) in 2006.
• The States with consistently low achievement on both HDI and GDI are Bihar, Uttar Pradesh, Madhya Pradesh, Rajasthan and Orissa.
• Bihar had the lowest rank among the 35 States/UTs on HDI and GDI in both 1996 and 2006.
• Uttar Pradesh was 31st on HDI and 32nd on GDI in 1996. The State declined to the second lowest rank (34th ) with regard to both HDI and GDI in 2006.
• Madhya Pradesh ranked 33rd among all the States/UTs on GDI in both 1996 and 2006 and 34th and 33rd on HDI for 1996 and 2006 respectively.
• The largest gains in HDI scores over the decade were by Uttarakhand (0.165), Jharkhand (0.140), Daman & Diu (0.131), Dadra & Nagar Haveli (0.104) and Chhattisgarh and Arunachal Pradesh, (both by 0.098).
• Other States/UTs which increased their HDI scores by more than the All-India average of 0.075 points, included Madhya Pradesh, Manipur, Tripura, Sikkim, Himachal Pradesh, Tamil Nadu, Bihar and Orissa
• The newly formed States of Uttarakhand, Jharkhand and Chhattisgarh achieved the largest gains on GDI and showed a marked improvement in performance on gender development over the decade. Between 1996 and 2006, these three States improved their GDI rank by 11, 5 and 1 places and GDI scores by 0.190, 0.154 and 0.108 respectively.
• Other States/UTs which increased their GDI scores by more than the All-India average of 0.076 points included Daman & Diu, Dadra & Nagar Haveli, Madhya Pradesh, Manipur, Arunachal Pradesh, Sikkim, Bihar, Tripura, Uttar Pradesh, Himachal Pradesh Tamil Nadu, Orissa, Rajasthan and Haryana.
• None of the States/UTs has a GDI score less than 0.5 in 2006 except Bihar.
• The lowest score for HDI is 0.507 for Bihar in 2006 (from 0.430 in 1996). The lowest score for GDI is 0.479 for Bihar (from 0.399 in 1996).
10
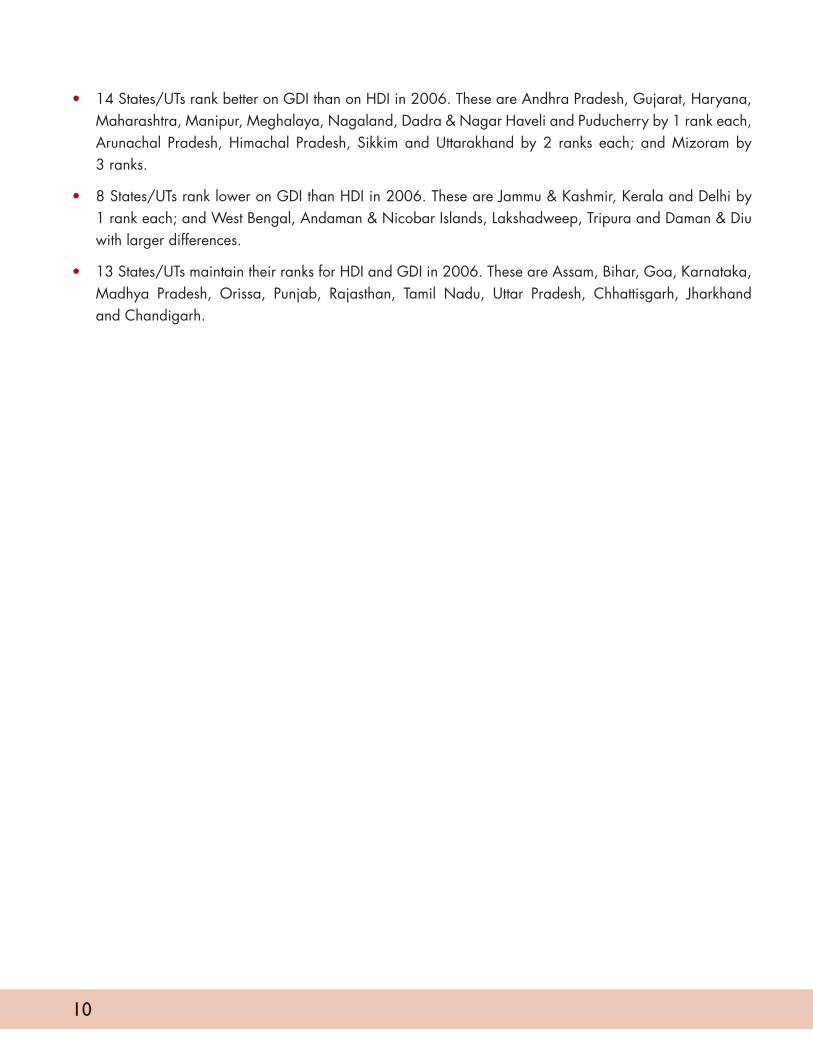
• 14 States/UTs rank better on GDI than on HDI in 2006. These are Andhra Pradesh, Gujarat, Haryana, Maharashtra, Manipur, Meghalaya, Nagaland, Dadra & Nagar Haveli and Puducherry by 1 rank each, Arunachal Pradesh, Himachal Pradesh, Sikkim and Uttarakhand by 2 ranks each; and Mizoram by 3 ranks.
• 8 States/UTs rank lower on GDI than HDI in 2006. These are Jammu & Kashmir, Kerala and Delhi by 1 rank each; and West Bengal, Andaman & Nicobar Islands, Lakshadweep, Tripura and Daman & Diu with larger differences.
• 13 States/UTs maintain their ranks for HDI and GDI in 2006. These are Assam, Bihar, Goa, Karnataka, Madhya Pradesh, Orissa, Punjab, Rajasthan, Tamil Nadu, Uttar Pradesh, Chhattisgarh, Jharkhand and Chandigarh.

11
S.No. States/Union TerritoriesHDI 2006 HDI 1996
HI 06 EdI 06 YI 06 HDI 06 HI 96 EdI 96 Y1 96 HDI 96
1 Andhra Pradesh 0.588 0.434 0.733 0.585 0.525 0.363 0.668 0.5192 Arunachal Pradesh 0.624 0.606 0.712 0.647 0.613 0.358 0.675 0.5493 Assam 0.495 0.607 0.682 0.595 0.444 0.529 0.656 0.5434 Bihar 0.542 0.403 0.575 0.507 0.480 0.317 0.494 0.4305 Goa 0.792 0.654 0.845 0.764 0.735 0.629 0.764 0.7096 Gujarat 0.599 0.545 0.757 0.634 0.544 0.481 0.697 0.5747 Haryana 0.604 0.533 0.792 0.643 0.531 0.455 0.724 0.5708 Himachal Pradesh 0.634 0.598 0.771 0.667 0.566 0.516 0.689 0.5909 Jammu & Kashmir 0.601 0.483 0.686 0.590 0.531 0.434 0.661 0.542
10 Karnataka 0.632 0.504 0.730 0.622 0.594 0.417 0.662 0.55811 Kerala 0.836 0.697 0.758 0.764 0.835 0.679 0.695 0.73612 Madhya Pradesh 0.461 0.470 0.656 0.529 0.340 0.371 0.589 0.43313 Maharashtra 0.699 0.596 0.773 0.689 0.631 0.531 0.725 0.62914 Manipur 0.762 0.635 0.707 0.702 0.684 0.518 0.627 0.61015 Meghalaya 0.562 0.612 0.713 0.629 0.570 0.566 0.648 0.59516 Mizoram 0.695 0.642 0.728 0.688 0.565 0.634 0.656 0.61817 Nagaland 0.719 0.647 0.734 0.700 0.640 0.628 0.692 0.65318 Orissa 0.474 0.463 0.674 0.537 0.356 0.403 0.623 0.46119 Punjab 0.665 0.561 0.777 0.668 0.636 0.486 0.739 0.62120 Rajasthan 0.527 0.415 0.681 0.541 0.425 0.342 0.647 0.47221 Sikkim 0.657 0.610 0.728 0.665 0.545 0.542 0.660 0.58222 Tamil Nadu 0.682 0.566 0.750 0.666 0.590 0.482 0.695 0.58923 Tripura 0.643 0.611 0.733 0.663 0.566 0.551 0.621 0.57924 Uttar Pradesh 0.490 0.459 0.636 0.528 0.405 0.363 0.606 0.45825 West Bengal 0.668 0.533 0.726 0.642 0.578 0.478 0.662 0.57326 Chhattisgarh 0.523 0.429 0.696 0.549 0.393 0.371 0.589 0.45127 Jharkhand 0.594 0.447 0.683 0.574 0.491 0.317 0.494 0.43428 Uttarakhand 0.624 0.607 0.726 0.652 0.492 0.363 0.606 0.48729 Andaman & Nicobar Islands 0.701 0.644 0.780 0.708 0.692 0.605 0.736 0.67830 Chandigarh 0.765 0.684 0.901 0.784 0.739 0.632 0.797 0.72331 Dadra & Nagar Haveli 0.682 0.619 0.730 0.677 0.560 0.488 0.671 0.57332 Daman & Diu 0.715 0.655 0.730 0.700 0.544 0.493 0.671 0.56933 Delhi 0.675 0.707 0.837 0.740 0.639 0.642 0.779 0.68734 Lakshadweep 0.729 0.630 0.730 0.697 0.755 0.632 0.671 0.68635 Puducherry 0.725 0.642 0.809 0.725 0.773 0.575 0.679 0.676
All India 0.577 0.506 0.730 0.605 0.490 0.429 0.671 0.530
Table 4.4: Dimension-wise HDI scores for States/UTs - 2006 and 1996
Note: HI is the Index of ‘A long and healthy life’ based on Infant Mortality Rate and Life Expectancy at age 1; EdI is the Index of ‘Knowledge’ based on 7+ Literacy Rate and Mean Years of Education for 15+ age group; YI is the Index of ‘A decent standard of living’ based on Earned Income and HDI is the ‘Human Development Index’.

1�
Table 4.5: Dimension-wise GDI scores for States/UTs - 2006 and 1996
Note: HI is the Index of ‘A long and healthy life’ based on Infant Mortality Rate and Life Expectancy at age 1; EdI is the Index of ‘Knowledge’ based on 7+ Literacy Rate and Mean Years of Education for 15+ age group; YI is the Index of ‘A decent standard of living’ based on Earned Income and HDI is the ‘Human Development Index’.
S.No. States/UTsGDI 2006 GDI 1996
HI 06 EdI 06 YI 06 GDI 06 HI 96 EdI 96 Y1 96 GDI 96
1 Andhra Pradesh 0.584 0.422 0.716 0.574 0.525 0.346 0.656 0.5092 Arunachal Pradesh 0.621 0.603 0.702 0.642 0.615 0.351 0.667 0.5443 Assam 0.497 0.608 0.650 0.585 0.440 0.523 0.606 0.5234 Bihar 0.536 0.377 0.524 0.479 0.474 0.274 0.449 0.3995 Goa 0.792 0.652 0.797 0.747 0.733 0.627 0.711 0.6916 Gujarat 0.600 0.529 0.742 0.624 0.540 0.454 0.682 0.5597 Haryana 0.601 0.521 0.773 0.632 0.530 0.434 0.700 0.5558 Himachal Pradesh 0.631 0.594 0.767 0.664 0.561 0.506 0.689 0.5859 Jammu & Kashmir 0.600 0.466 0.639 0.568 0.527 0.411 0.638 0.525
10 Karnataka 0.632 0.494 0.707 0.611 0.591 0.403 0.642 0.54511 Kerala 0.834 0.697 0.705 0.745 0.836 0.678 0.649 0.72112 Madhya Pradesh 0.457 0.451 0.641 0.516 0.340 0.335 0.576 0.41713 Maharashtra 0.697 0.587 0.748 0.677 0.626 0.516 0.704 0.61614 Manipur 0.759 0.631 0.705 0.699 0.684 0.505 0.611 0.60015 Meghalaya 0.564 0.609 0.700 0.624 0.570 0.565 0.640 0.59216 Mizoram 0.698 0.640 0.723 0.687 0.566 0.630 0.641 0.61217 Nagaland 0.719 0.644 0.727 0.697 0.585 0.626 0.666 0.62618 Orissa 0.471 0.450 0.651 0.524 0.355 0.380 0.600 0.44519 Punjab 0.680 0.558 0.749 0.663 0.634 0.479 0.701 0.60520 Rajasthan 0.526 0.381 0.672 0.526 0.423 0.284 0.637 0.44821 Sikkim 0.656 0.608 0.713 0.659 0.546 0.537 0.616 0.56622 Tamil Nadu 0.684 0.559 0.722 0.655 0.589 0.469 0.671 0.57623 Tripura 0.641 0.608 0.628 0.626 0.567 0.542 0.529 0.54624 Uttar Pradesh 0.487 0.437 0.604 0.509 0.401 0.321 0.563 0.42925 West Bengal 0.666 0.526 0.675 0.622 0.578 0.468 0.614 0.55326 Chhattisgarh 0.524 0.413 0.688 0.542 0.392 0.335 0.576 0.43427 Jharkhand 0.590 0.418 0.665 0.558 0.490 0.274 0.449 0.40428 Uttarakhand 0.622 0.600 0.718 0.647 0.487 0.321 0.563 0.45729 Andaman & Nicobar Islands 0.698 0.642 0.737 0.692 0.689 0.594 0.723 0.66930 Chandigarh 0.774 0.684 0.832 0.763 0.741 0.633 0.744 0.70631 Dadra & Nagar Haveli 0.679 0.619 0.722 0.673 0.562 0.480 0.667 0.56932 Daman & Diu 0.716 0.660 0.654 0.677 0.546 0.458 0.624 0.54333 NCT Delhi 0.674 0.703 0.727 0.701 0.640 0.641 0.707 0.66334 Lakshadweep 0.728 0.627 0.551 0.635 0.757 0.636 0.589 0.66035 Puducherry 0.721 0.638 0.759 0.706 0.774 0.564 0.645 0.661
All India 0.573 0.494 0.702 0.590 0.490 0.409 0.643 0.514

1�
Year PI EI PoERI GEM
2006 0.625 0.546 0.319 0.497
1996 0.573 0.443 0.231 0.416
Table 5.1: GEM Scores for India, 2006 and 1996
Note: PI = Index of ‘Political Participation & Decision-Making Power’; EI = Index of ‘Economic Participation and Decision-making Power’; PoERI = Index of ‘Power over Economic Resources’; and GEM = Gender Empowerment Measure.
Gender Empowerment Measure (GEM) is intended to measure women’s and men’s ability to participate actively in economic and political life and their command over economic resources. It focuses on opportuni-ties and captures gender inequality in three key areas, ‘Political Participation and Decision-making Power’, ‘Economic Participation and Decision-making Power’ and ‘Power over Economic Resources’. The aggregate score for GEM for India was 0.497 in 2006 and 0.416 in 1996 (Table 5.1).
�.GEM:ResultsandAnalysis
The GEM scores for India estimated by UNDP are a very low 0.228 (UNDP HDR 1998). Using the indicators listed above is more relevant for India and although it yields GEM scores that are double (0.497) those esti-mated by UNDP, the values attained still reflect the existence of sharp disparities in gender empowerment.
Scores for the three composite indices, Index of ‘Political Participation and Decision-making Power’ (PI), Index of ‘Economic Participation and Decision-making Power’ (EI) and Index of ‘Power over Economic Resources’ (PoERI) are also presented in Table 5.1. The scores are highest for PI at 0.573 and lowest for PoERI at 0.231 in 1996. While all three indices reflect an increase over the decade, the increase is smallest for PI (from 0.573 in 1996 to 0.625 in 2006) and largest for EI (from 0.443 in 1996 to 0.546 in 2006). The Index ‘Power over Economic Resources’ (PoERI) increased from 0.231 in 1996 to 0.319 in 2006.

1�
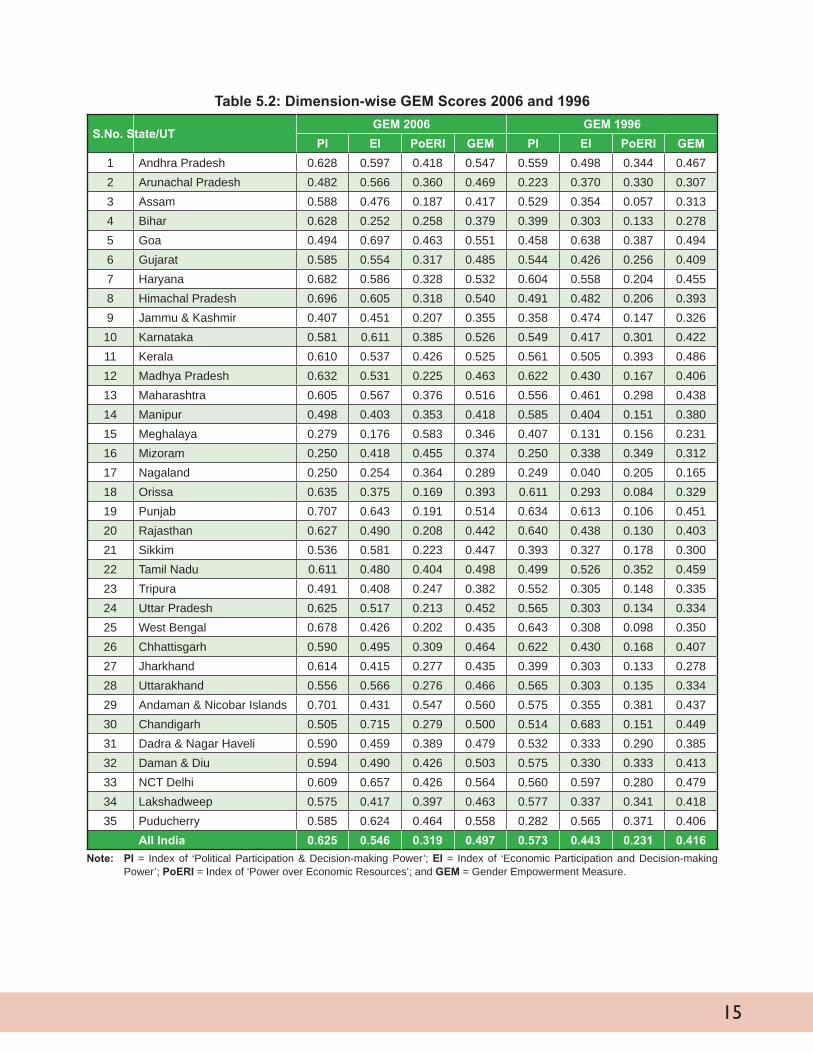
Table 5.2 shows that:
• There was overall improvement in performance on GEM over the decade, both in the All-India score and in the scores achieved by all the States/UTs. 14 States/UTs achieved GEM scores above 0.485 in 2006 while only 2 had achieved scores higher than this in 1996.
• The States/UTs that achieved GEM scores above 0.485 in both 1996 and 2006 were Goa and Kerala.
• NCT Delhi had the highest score for GEM for 2006. It moved from the 3rd rank in 1996 to the 1st rank in 2006 with a significant improvement in its GEM score.
• Nagaland had the lowest rank in both 2006 and 1996 with GEM scores of 0.289 and 0.165 respectively.
• While 13 states improved their ranks over the decade, 19 states lost their relative position on GEM during the same period.
• The newly formed states of Jharkhand and Uttarakhand achieved large gains of 0.157 and 0.132 respectively on GEM scores and improved their GEM ranks by 6 positions each over the decade. While the GEM scores for Uttar Pradesh and Bihar also increased significantly, the improvement in their GEM scores was lower in comparison (0.118 and 0.101 respectively). However, Chhattisgarh improved its GEM score by only 0.058, compared with an improvement of 0.056 by Madhya Pradesh. These States lost 4 and 5 ranks respectively over the decade.
• Other States/UTs which increased their GEM scores by more than the All-India average of 0.081 points included Arunachal Pradesh, Puducherry, Himachal Pradesh, Sikkim, Andaman & Nicobar Islands, Nagaland, Dadra & Nagar Haveli, Meghalaya, Daman & Diu, Assam, Karnataka, West Bengal and NCT Delhi.
• States/UTs that improved their rank on GEM over the decade were Arunachal Pradesh, Himachal Pradesh and Puducherry by 13 and 14 ranks; Sikkim and Andaman and Nicobar Islands by 8 ranks each; and Jharkhand and Uttarakhand by 6 ranks each.
• Other gainers on rank included Dadra & Nagar Haveli with a gain of 4 ranks; Uttar Pradesh and Karnataka with a gain of 3 ranks each; Bihar and NCT Delhi with a gain of 2 ranks each and Daman & Diu with a gain of 1 rank.
• The largest losers on GEM rank were Jammu & Kashmir, Kerala, Madhya Pradesh, Manipur, Rajasthan, Tamil Nadu, Tripura, Chandigarh and Lakshadweep with a fall of between 5 and 9 positions over the decade.
1�
S.No. State/UT GEM 2006 GEM 1996
PI EI PoERI GEM PI EI PoERI GEM
1 Andhra Pradesh 0.628 0.597 0.418 0.547 0.559 0.498 0.344 0.4672 Arunachal Pradesh 0.482 0.566 0.360 0.469 0.223 0.370 0.330 0.3073 Assam 0.588 0.476 0.187 0.417 0.529 0.354 0.057 0.3134 Bihar 0.628 0.252 0.258 0.379 0.399 0.303 0.133 0.2785 Goa 0.494 0.697 0.463 0.551 0.458 0.638 0.387 0.4946 Gujarat 0.585 0.554 0.317 0.485 0.544 0.426 0.256 0.4097 Haryana 0.682 0.586 0.328 0.532 0.604 0.558 0.204 0.4558 Himachal Pradesh 0.696 0.605 0.318 0.540 0.491 0.482 0.206 0.3939 Jammu & Kashmir 0.407 0.451 0.207 0.355 0.358 0.474 0.147 0.32610 Karnataka 0.581 0.611 0.385 0.526 0.549 0.417 0.301 0.42211 Kerala 0.610 0.537 0.426 0.525 0.561 0.505 0.393 0.48612 Madhya Pradesh 0.632 0.531 0.225 0.463 0.622 0.430 0.167 0.40613 Maharashtra 0.605 0.567 0.376 0.516 0.556 0.461 0.298 0.43814 Manipur 0.498 0.403 0.353 0.418 0.585 0.404 0.151 0.38015 Meghalaya 0.279 0.176 0.583 0.346 0.407 0.131 0.156 0.23116 Mizoram 0.250 0.418 0.455 0.374 0.250 0.338 0.349 0.31217 Nagaland 0.250 0.254 0.364 0.289 0.249 0.040 0.205 0.16518 Orissa 0.635 0.375 0.169 0.393 0.611 0.293 0.084 0.32919 Punjab 0.707 0.643 0.191 0.514 0.634 0.613 0.106 0.45120 Rajasthan 0.627 0.490 0.208 0.442 0.640 0.438 0.130 0.40321 Sikkim 0.536 0.581 0.223 0.447 0.393 0.327 0.178 0.30022 Tamil Nadu 0.611 0.480 0.404 0.498 0.499 0.526 0.352 0.45923 Tripura 0.491 0.408 0.247 0.382 0.552 0.305 0.148 0.33524 Uttar Pradesh 0.625 0.517 0.213 0.452 0.565 0.303 0.134 0.33425 West Bengal 0.678 0.426 0.202 0.435 0.643 0.308 0.098 0.35026 Chhattisgarh 0.590 0.495 0.309 0.464 0.622 0.430 0.168 0.40727 Jharkhand 0.614 0.415 0.277 0.435 0.399 0.303 0.133 0.27828 Uttarakhand 0.556 0.566 0.276 0.466 0.565 0.303 0.135 0.33429 Andaman & Nicobar Islands 0.701 0.431 0.547 0.560 0.575 0.355 0.381 0.43730 Chandigarh 0.505 0.715 0.279 0.500 0.514 0.683 0.151 0.44931 Dadra & Nagar Haveli 0.590 0.459 0.389 0.479 0.532 0.333 0.290 0.38532 Daman & Diu 0.594 0.490 0.426 0.503 0.575 0.330 0.333 0.41333 NCT Delhi 0.609 0.657 0.426 0.564 0.560 0.597 0.280 0.47934 Lakshadweep 0.575 0.417 0.397 0.463 0.577 0.337 0.341 0.41835 Puducherry 0.585 0.624 0.464 0.558 0.282 0.565 0.371 0.406 All India 0.625 0.546 0.319 0.497 0.573 0.443 0.231 0.416
Table 5.2: Dimension-wise GEM Scores 2006 and 1996
Note: PI = Index of ‘Political Participation & Decision-making Power’; EI = Index of ‘Economic Participation and Decision-making Power’; PoERI = Index of ‘Power over Economic Resources’; and GEM = Gender Empowerment Measure.
1�
The HDI, GDI and GEM scores attained by the 35 States/UTs reflect their performance on human and gender development indices. Changes in the scores and ranks over time depict the extent to which a State/UT has progressed in translating its growth into a better quality of life for all its people. Disparities in outcomes and access to resources are penalised and result in lower levels of attainment on GDI and GEM. States/UTs can be ranked on the basis of HDI, GDI and GEM scores at the two time points and the improvement in them. However it may be reiterated that the scores and ranks achieved are sensitive to the choice of indicators (constrained by available gender disaggregated data), choice of goal posts, weights used, etc.
Scores and ranks obtained by the States/UTs for HDI, GDI and GEM and the dimensions that comprise these indices, reveal gender-based disparities that can meaningfully be used by policy-makers and analysts. For instance, while Andhra Pradesh performs relatively well on health and income indicators, the Female Literacy Rate and Mean Years of Education are lower than the estimates for some of the States/UTs with high levels of income poverty. The indices draw attention to this and call for corrective action. Similarly, the low scores attained nation-wide on the ‘Power over Economic Resources’ Dimension draw attention to the severe gender disparities that exist with regard to access to resources and assets and the historical discrimination faced by women in access to land, livestock, credit and other productive resources, despite their unpaid and unrec-ognised contribution to agriculture and farm and non-farm family based economic activities. This requires special attention as access to resources can enhance opportunities and lead to enhancement of capabilities, thereby leading to higher levels of gender empowerment as well as development.
Human and gender development indices can be used as tools to re-allocate resources for programmes and schemes designed to correct gender gaps at all levels of governance through monitoring and tracking prog-ress regularly and ensuring implementation; provide access to assets and income earning opportunities for women such as providing right to work to all citizens; provide access to work at decent wages to enable exit from poverty and thereby reduce gender disparities in work and standard of living; provide access to safe drinking water to reduce the disease burden; and provide access to health facilities and timely access to medical care to reduce gender disparities in morbidity and mortality.
MWCD’s Vision Statement is “Ensuring overall survival, development, protection and participation of women and children of the country” and Mission Statement is “Budgeting for Gender Equity”. Together with Gender Budgeting, HDI, GDI and GEM are tools that can be used to identify deep-rooted gender based inequities and demand that corrective policies, programmes and schemes be implemented in order to achieve gender just and equitable development outcomes. Data gaps continue to constrain the construction of appropriate indices especially in the context of access to land, productive assets, credit, income, etc. It is high time that due priority is accorded to bridging the data gaps in gender disaggregated data so that gender disparities can be better measured and corrected through policies, programmes and schemes.
�.Conclusions