Embed Size (px)
Citation preview
1200 18th Street NW • Suite 200 • Washington, DC 20036 • p (202) 906.8000 • f (202) 842.2885 • www.clasp.org
The Public Return to Increasing Postsecondary
Credential Attainment
APRIL 2012 | HEATH PRINCE AND VICKIE CHOITZ
Ample evidence demonstrates that postsecondary credentials are a good investment for individuals, families and
communities. Better educated workers earn higher wages and are more likely to be employed than less educated
ones. Higher education levels also correlate with favorable social returns such as better health and higher rates of
civic participation.
At the same time, experts project that the United States will not have enough credentialed workers to meet labor
market demand or to remain globally competitive in the coming decade. A recent study based on Bureau of Labor
Statistics data found that by 2018, more than two-thirds of the 47 million projected job openings will require some
level of postsecondary education or training, including industry certification.1
As other countries have increased their postsecondary attainment rates, the United States has fallen to 15th place
among 34 Organisation for Economic Cooperation and Development (OECD) member countries in the percentage
of 25 to 34-year olds with an Associate’s level college degree or higher.2 Now, more than half of young adults in
leading OECD countries – Canada, South Korea, and Japan - have college degrees compared to 41 percent in the
United States, and these leading countries are on track to increase their college degree attainments rates to 60
percent by 2020. The United States must match this rate to maintain its global competitiveness and have a chance
at leading the developed world in percent of skilled, educated workers.
At current rates of credential attainment, the United States will fall short by tens of millions of postsecondary
credentials over the next couple of decades. This hard reality comes at a time when many federal policymakers are
struggling to prioritize investments in postsecondary education and workforce development. For example, growing
demand for Pell Grants is a good sign that more low-income students are accessing postsecondary education and,
thereby, helping to meet national demand for postsecondary credentials. But many federal policymakers are
aiming to cut the size of the program and cut grant amounts awarded to students. Funding for employment and
training services as well as adult and technical education is also less, declining 15 percent in fiscal year 2012
compared to fiscal year 2008 (adjusted for inflation).3
State funding for higher education, adult education and workforce development has also declined over the past few
decades. The proportion of state budgets devoted to postsecondary education has fallen by more than 13 percent
since 1990.4 State support for adult education, which can be an onramp for postsecondary education, has fallen
significantly or been eliminated in the last few years as states take pains to balance postsecondary investments with
2
The Credential Differential: The Public Return to Increasing Postsecondary Credential Attainment
significant competing state priorities ranging from infrastructure to K-12 education, Medicaid and other
programs.5
Failure to prioritize investments in postsecondary education will leave states and the nation short millions of
credentials in the coming decades and will cost the nation billions and each state millions of dollars. These
conclusions are based on projections from an interactive online Return on Investment Dashboard developed by the
Center for Law and Social Policy (CLASP) and the National Center for Higher Education Management Systems
(NCHEMS). The dashboard uses Census Bureau, National Center for Education Statistics, and Department of
Education data to project the short- and long-term effects of either maintaining the status quo in postsecondary
education participation and credential attainment or increasing investments.
The tool’s purpose is to help policymakers and advocates calculate the number of postsecondary credentials
needed for each state and the nation to keep up with labor market demand and global competitors. Users can
estimate the necessary increases in postsecondary participation and credential attainment to meet labor market
demand and project economic returns to meeting credential goals. Expert analysis using this tool finds that the
United States will need to produce about 24 million additional credentials by 2025 to keep pace with leading
OECD countries and achieve a 60 percent degree attainment rate among adults ages 25 to 64. At current attainment
rates, the U.S. is on track to produce 278,500 additional credentials by 2025—a significant shortfall.
Maintaining current credential attainment rates will mean billions in lost revenue and increased public
expenditures. Average per capita personal income nationally will essentially remain flat through 2025. State
revenues – derived from taxes on income, sales, and property—will plummet until 2017 while public expenditures
on corrections and Medicaid will increase. By 2025, this downward trend may begin to reverse; however, billions
of dollars will be left on the table in the intervening years. At current credential attainment rates, postsecondary
costs outweigh all revenues, producing a negative return on investment.
The United States can meet credential attainment goals by 2025 if the nation increases overall college participation
rates and credential attainment rates to match the top three performing states. This would result in a projected
additional 19 million Associate’s and Bachelor’s degrees and 6 million undergraduate certificates, for a total of 25
million undergraduate credentials. To meet the 60 percent credential attainment goal, some states will have to
produce more than others. For example, states in the South and Southwest have larger credential gaps than states in
the upper Midwest and New England.
This level of investment would produce significant economic returns to individuals, states, and the nation by 2025.
Average annual per capita income would increase by approximately $1,400 by 2025. Federal revenue of $67
billion in 2025 would be about six times higher than the estimated postsecondary costs of $9.8 billion, and state
revenue of $64 billion would be triple the estimated state postsecondary costs of $21 billion.
3
APRIL 2012
Now more than ever, state and federal policymakers are challenged to use precious public tax dollars wisely. Four
overarching policy considerations should guide policymakers and advocates as they explore postsecondary policy
options to reverse the trend of disinvestment in postsecondary credential attainment. First, states are unlikely to
meet the demand for postsecondary credentials without investing in adult students as well as younger students.
Second, each state must improve postsecondary participation rates and credential attainment rates to meet
credential goals—improving one or the other will not be enough. Third, a primary driver of the costs of credential
attainment is the type of institution producing the credential; therefore, policymakers should consider which
institutions can most cost-effectively produce the types of credentials needed. Fourth, no two states are the same in
their cost and revenue structures; however, all states would see significant positive economic returns to meeting
postsecondary credential attainment goals.
Overall, federal policymakers should avoid deep cuts to programs that help people gain postsecondary credentials
such as the Pell Grant and Workforce Investment Act programs. It is especially important for federal policymakers
to avoid specific cuts to the Pell Grant program that reduce eligibility or grant amounts for adult students,
nontraditional students, and those in in-demand occupational programs. State policymakers should reverse the
trend of disinvestment in public institutions of higher education and ensure that state student aid programs are
adequately funded so states can increase credential attainment to meet demand.
Just as there are long-term economic benefits to investing in postsecondary credential attainment, there are long-
term opportunity costs associated with cutting funding for postsecondary education. The bottom line is increasing
credential attainment pays off. As policymakers face tough budget decisions over the coming months and years,
they must consider not just immediate expenditures but also look at the future returns of investing today in
increasing credential attainment.
4
The Credential Differential: The Public Return to Increasing Postsecondary Credential Attainment
With the shift in the global economy toward a demand for higher-order skills, the labor market maxim that
―credentials count‖ is more relevant than ever, prompting economist Anthony Carnevale to refer to access to
postsecondary education and training as the ―arbiter of opportunity in America.‖6
Many studies have found a positive relationship between educational attainment and increased income, as well as
between educational attainment and labor market mobility. Recent data from the Current Population Survey
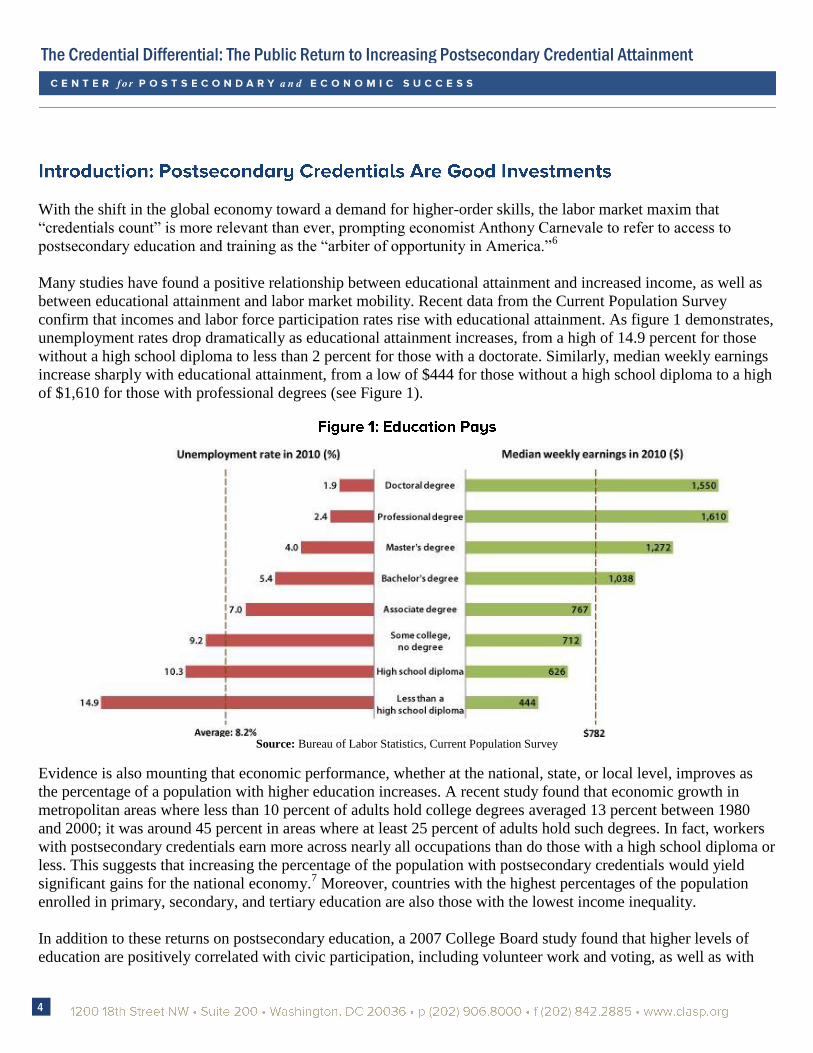
confirm that incomes and labor force participation rates rise with educational attainment. As figure 1 demonstrates,
unemployment rates drop dramatically as educational attainment increases, from a high of 14.9 percent for those
without a high school diploma to less than 2 percent for those with a doctorate. Similarly, median weekly earnings
increase sharply with educational attainment, from a low of $444 for those without a high school diploma to a high
of $1,610 for those with professional degrees (see Figure 1).
Source: Bureau of Labor Statistics, Current Population Survey
Evidence is also mounting that economic performance, whether at the national, state, or local level, improves as
the percentage of a population with higher education increases. A recent study found that economic growth in
metropolitan areas where less than 10 percent of adults hold college degrees averaged 13 percent between 1980
and 2000; it was around 45 percent in areas where at least 25 percent of adults hold such degrees. In fact, workers
with postsecondary credentials earn more across nearly all occupations than do those with a high school diploma or
less. This suggests that increasing the percentage of the population with postsecondary credentials would yield
significant gains for the national economy.7 Moreover, countries with the highest percentages of the population
enrolled in primary, secondary, and tertiary education are also those with the lowest income inequality.
In addition to these returns on postsecondary education, a 2007 College Board study found that higher levels of
education are positively correlated with civic participation, including volunteer work and voting, as well as with

5
APRIL 2012
better health.8 In a 2002 meta-analysis, economists Barbara Wolfe and Robert Haveman found that the social
returns, including private and public returns, on investments in postsecondary education could be as high as 18
percent, a magnitude that few other public or private investments match. This leads Wolfe and Haveman to suggest
that ―a reallocation of resources from other uses to the education sector may be in order.‖9
With severely limited state funding and mounting pressure to cut federal spending, policymakers need to make
informed decisions about what investments in education yield the greatest benefits. Advocates of investments in
postsecondary education face high hurdles even to convince policymakers to maintain current support for students
who are seeking to earn postsecondary credentials. For example, a primary target for cuts is the Federal Pell Grant
program, which helps makes postsecondary education and job training possible for nearly 10 million Americans.
Also, federal funding for both employment and training services and adult and technical education was 15 percent
lower in fiscal year 2012 compared to fiscal year 2008 (adjusted for inflation).10
The proportion of state budgets devoted to postsecondary education has fallen by more than 13 percent since
1990.11
Also, state support for adult education – which can be an important onramp for postsecondary education –
has fallen significantly in the last few years. Some states have cut millions from their adult education budgets, and
others completely eliminated state funding for adult education.12
The Center for Law and Social Policy (CLASP) and the National Center for Higher Education Management
Systems (NCHEMS) have collaborated to develop the interactive, online Return on Investment Dashboard,
designed to help state and federal policymakers and advocates calculate the economic benefits of increasing
postsecondary education attainment. This tool makes it easy to estimate increases to individual income and state
and federal government resulting from rising tax revenues, as well cost savings to states from reductions in
expenditures for public health and corrections as incomes rise. Users can establish postsecondary credential targets
by either setting a postsecondary completion goal, (e.g., 60 percent of adults will have a postsecondary credential)
or simply noting the estimated numbers of various credentials needed to meet projected state demand. Once
credential targets are set, users can use the tool to:
Gauge the level of college participation and credential attainment needed to achieve state-specific targets
for postsecondary completion.
Identify the gap between current levels of postsecondary credential attainment (e.g., of one- or two-year
certificates, Associate’s degrees, Bachelor’s degrees) and those needed to meet the targets.
See approximations of the level of returns to the state and to individuals for meeting the targets.
Calculate the effects of redistributing the enrollment patterns of additional first-time students generated by
improving postsecondary access and completion rates (e.g., by type of institution) and approximate the
level of economic returns under different scenarios.
6
The Credential Differential: The Public Return to Increasing Postsecondary Credential Attainment
Using this tool is similar to making decisions about a common type of personal investment: the 401(k) retirement
account. At the simplest level, individuals make two basic decisions about a 401(k) plan. First, they decide how
much to invest. Using the ROI Dashboard is similar: users can explore various levels of investment—as expressed
in college participation and credential attainment rates. Holders of 401k accounts also decide how to allocate their
investments across a variety of options. Similarly, user of the ROI Dashboard tool can weigh allocations to three
areas: (1) postsecondary participation of different types of students; (2) credential production by different types of
institution; and (3) traditional or nontraditional students at different types of institution.
Once these decisions are set, users can see the corresponding production of credentials as well as the economic
returns, which are expressed as increased tax revenues and decreased public costs in select programs. Decisions
about levels and allocations of investments can lead to dramatically different economic returns. (See the appendix
for more information on the ROI Dashboard tool.)
This paper highlights key findings from using the tool to analyze federal and state data on postsecondary
participation and credential attainment, as well as data on personal income and tax revenue. While outcomes vary
by state, every state and the nation would see large public and private benefits from significantly increasing
postsecondary access and completion rates by 2025.
Under the current investment patterns in college participation and credential attainment, the U.S. will fail to meet
the number of credentials needed to be globally competitive and grow its economy. The investment patterns will
also produce negative returns for individuals as well as state and federal revenues over the near and medium terms.
In 2010, NCHEMS reported that the U.S. had slipped to 10th
among the 34 OECD member countries in the
percentage of 25- to 34-year-olds with college degrees. Since that report, the United States has slipped to 15th
.13
NCHEMS also reported that more than half of young adults in the leading countries (Canada, South Korea, and
Japan) had degrees, compared with just 40 percent in the U.S. (41 percent in the latest OECD report), and the
leading OECD countries were on a course to achieve a 60 percent attainment rate for this age group by 2020.14
Given the relationships among educational attainment, employment, and economic growth, increasing attainment
rates to that level would help to ensure that the U.S. remains competitive with the world’s leading economies.
Not only is the U.S. falling behind its competitors regarding postsecondary credential attainment, it also is
struggling to meet domestic demand for skilled workers. The supply of workers with the technical skills afforded
through postsecondary education falls short of demand for them, with potential implications for economic growth
and equity. In part, this shortage is a result of demographic shifts: highly educated baby boomers are reaching
retirement age, and the U.S. is not producing college-educated workers fast enough to replace them. This shortage
is also due to the rising costs of postsecondary education and the suppressing effect of that on enrollments.
7
APRIL 2012
The trends are clear: employment opportunities for workers without a postsecondary credential are shrinking,
while the demand for workers with postsecondary credentials is expanding. One recent study based on Bureau of
Labor Statistics projections found that by 2018, more than two-thirds of the 47 million job openings will require
some level of postsecondary education or training (including industry certification). Some 34 percent will require
at least a Bachelor’s degree, while 30 percent will require some college or a two-year Associate’s degree. Only 36
percent of those 47 million jobs will be available to workers with a high school diploma or less.15
And as the
education and skill requirements for good jobs rise, the economic inequity between those with and without
postsecondary credentials will likely deepen.
The premiums paid to workers with postsecondary credentials, both in terms of higher income and greater job
security, are indicators of the value the labor market places on these credentials. It is increasingly evident that the
benefits that accrue to the individual and the broader economy merit increased state and federal investment in
greatly expanding the number of individuals with postsecondary credentials.
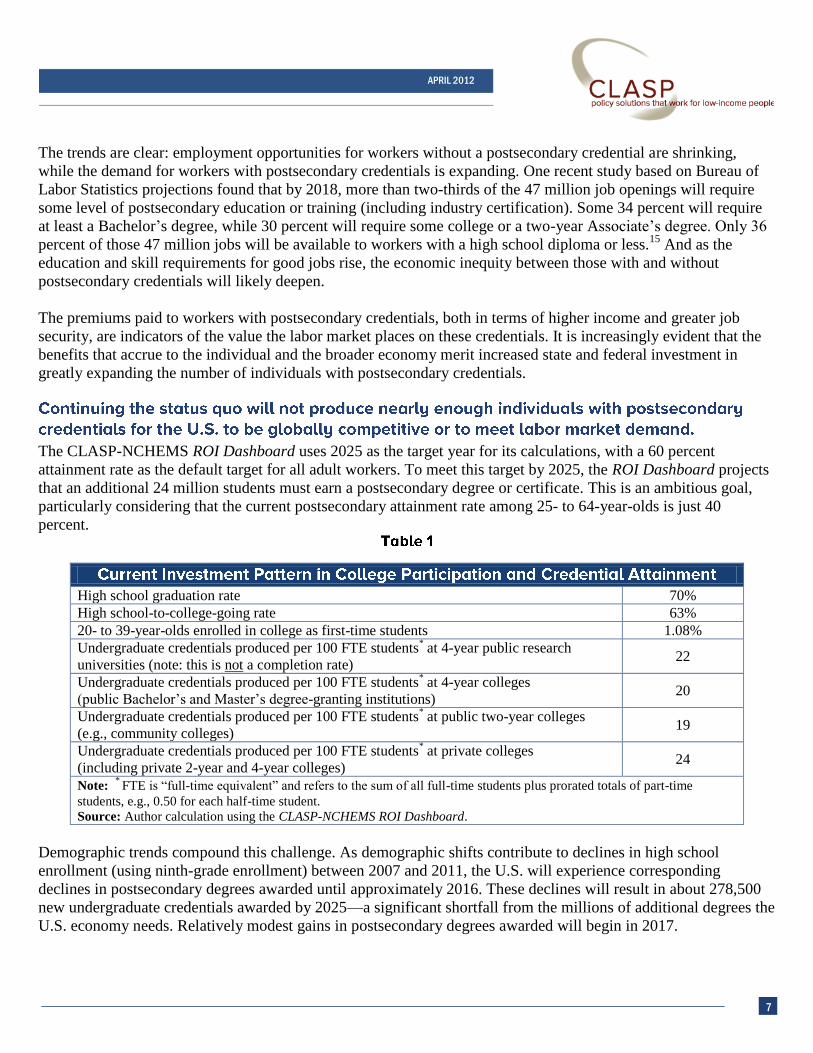
The CLASP-NCHEMS ROI Dashboard uses 2025 as the target year for its calculations, with a 60 percent
attainment rate as the default target for all adult workers. To meet this target by 2025, the ROI Dashboard projects
that an additional 24 million students must earn a postsecondary degree or certificate. This is an ambitious goal,
particularly considering that the current postsecondary attainment rate among 25- to 64-year-olds is just 40
percent.
High school graduation rate 70%
High school-to-college-going rate 63%
20- to 39-year-olds enrolled in college as first-time students 1.08%
Undergraduate credentials produced per 100 FTE students* at 4-year public research
universities (note: this is not a completion rate) 22
Undergraduate credentials produced per 100 FTE students* at 4-year colleges
(public Bachelor’s and Master’s degree-granting institutions) 20
Undergraduate credentials produced per 100 FTE students* at public two-year colleges
(e.g., community colleges) 19
Undergraduate credentials produced per 100 FTE students* at private colleges
(including private 2-year and 4-year colleges) 24
Note: *
FTE is ―full-time equivalent‖ and refers to the sum of all full-time students plus prorated totals of part-time
students, e.g., 0.50 for each half-time student.
Source: Author calculation using the CLASP-NCHEMS ROI Dashboard.
Demographic trends compound this challenge. As demographic shifts contribute to declines in high school
enrollment (using ninth-grade enrollment) between 2007 and 2011, the U.S. will experience corresponding
declines in postsecondary degrees awarded until approximately 2016. These declines will result in about 278,500
new undergraduate credentials awarded by 2025—a significant shortfall from the millions of additional degrees the
U.S. economy needs. Relatively modest gains in postsecondary degrees awarded will begin in 2017.
8
The Credential Differential: The Public Return to Increasing Postsecondary Credential Attainment
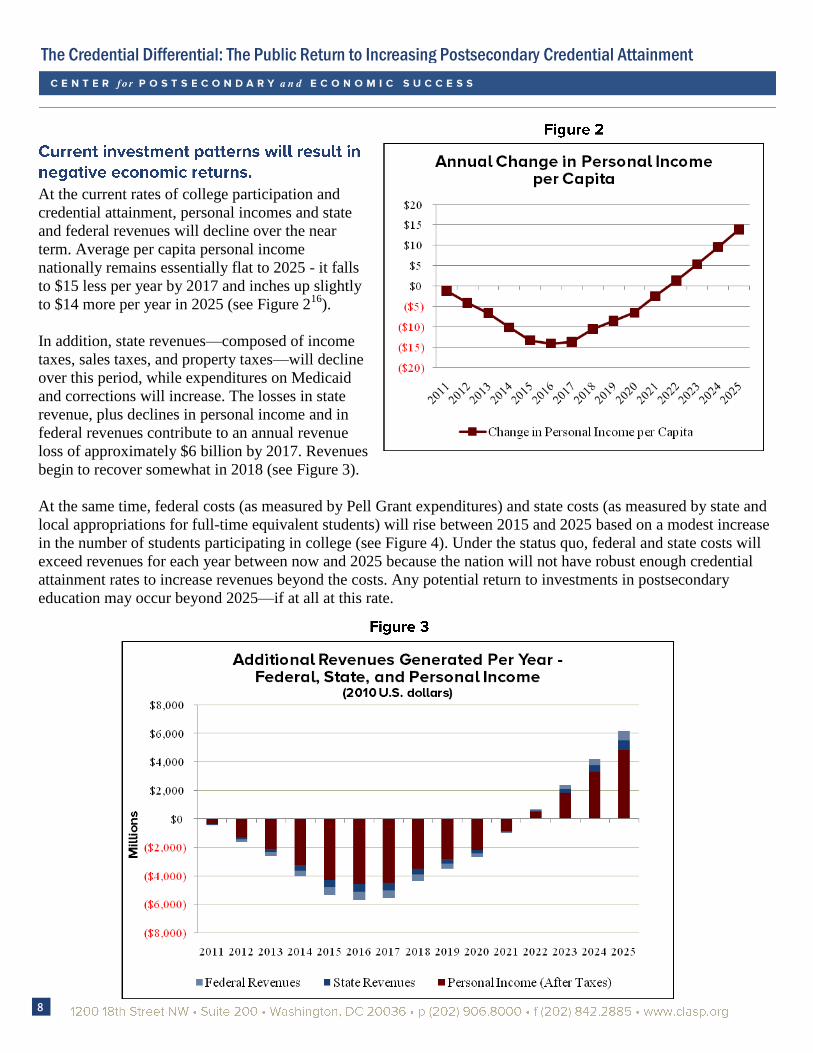
At the current rates of college participation and
credential attainment, personal incomes and state
and federal revenues will decline over the near
term. Average per capita personal income
nationally remains essentially flat to 2025 - it falls
to $15 less per year by 2017 and inches up slightly
to $14 more per year in 2025 (see Figure 216
).
In addition, state revenues—composed of income
taxes, sales taxes, and property taxes—will decline
over this period, while expenditures on Medicaid
and corrections will increase. The losses in state
revenue, plus declines in personal income and in
federal revenues contribute to an annual revenue
loss of approximately $6 billion by 2017. Revenues
begin to recover somewhat in 2018 (see Figure 3).
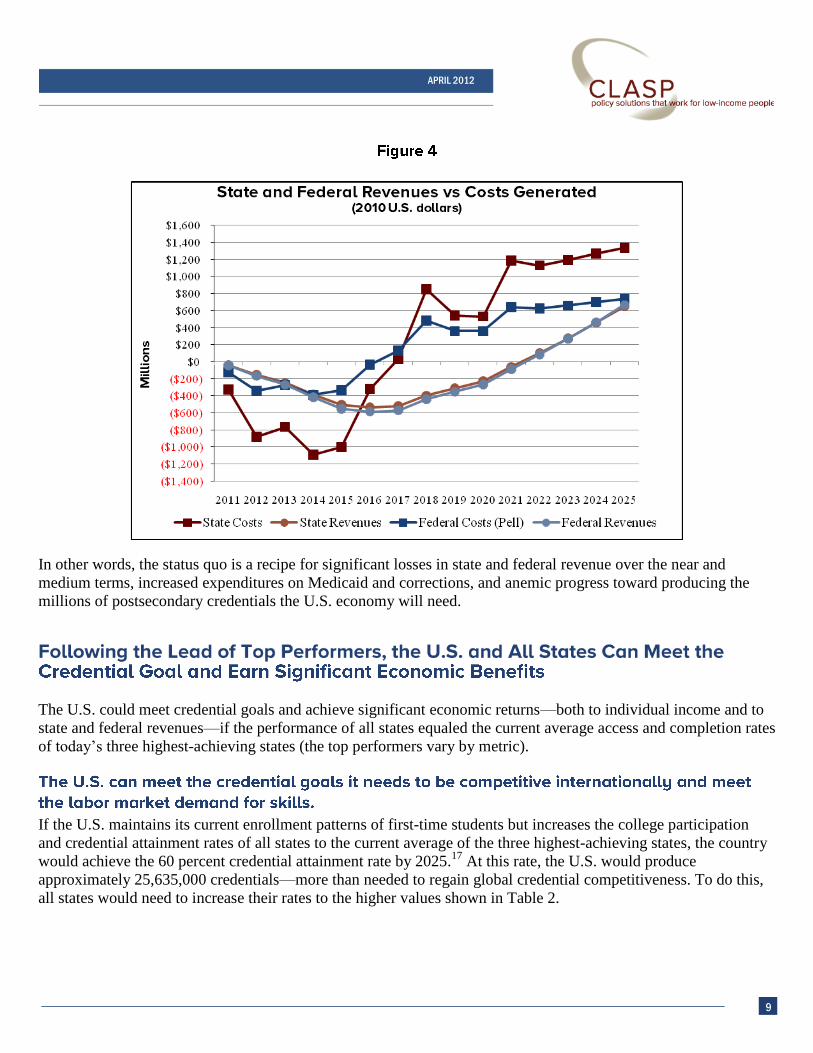
At the same time, federal costs (as measured by Pell Grant expenditures) and state costs (as measured by state and
local appropriations for full-time equivalent students) will rise between 2015 and 2025 based on a modest increase
in the number of students participating in college (see Figure 4). Under the status quo, federal and state costs will
exceed revenues for each year between now and 2025 because the nation will not have robust enough credential
attainment rates to increase revenues beyond the costs. Any potential return to investments in postsecondary
education may occur beyond 2025—if at all at this rate.
9
APRIL 2012
In other words, the status quo is a recipe for significant losses in state and federal revenue over the near and
medium terms, increased expenditures on Medicaid and corrections, and anemic progress toward producing the
millions of postsecondary credentials the U.S. economy will need.
The U.S. could meet credential goals and achieve significant economic returns—both to individual income and to
state and federal revenues—if the performance of all states equaled the current average access and completion rates
of today’s three highest-achieving states (the top performers vary by metric).
If the U.S. maintains its current enrollment patterns of first-time students but increases the college participation
and credential attainment rates of all states to the current average of the three highest-achieving states, the country
would achieve the 60 percent credential attainment rate by 2025.17
At this rate, the U.S. would produce
approximately 25,635,000 credentials—more than needed to regain global credential competitiveness. To do this,
all states would need to increase their rates to the higher values shown in Table 2.
10
The Credential Differential: The Public Return to Increasing Postsecondary Credential Attainment
High school graduation rate 70% 85%
High school-to-college-going rate 63% 75%
20- to 39-year-olds enrolled in college as first time students 1.08% 1.4%
Undergraduate credentials produced per 100 FTE students* at 4-year public research
universities 22 26
Undergraduate credentials produced per 100 FTE students* at 4-year colleges
(public Bachelor’s and Master’s degree-granting institutions) 20 24
Undergraduate credentials produced per 100 FTE students* at public 2-year colleges
(e.g., community colleges) 19 43
Undergraduate credentials produced per 100 FTE students* at private colleges
(including private 2-year and 4-year colleges) 24 37
Note: *
FTE is ―full-time equivalent‖ and refers to the sum of all full-time students plus prorated totals of part-
time students, e.g., 0.50 for each half-time student.
Source: Author calculation using the CLASP-NCHEMS ROI Dashboard.
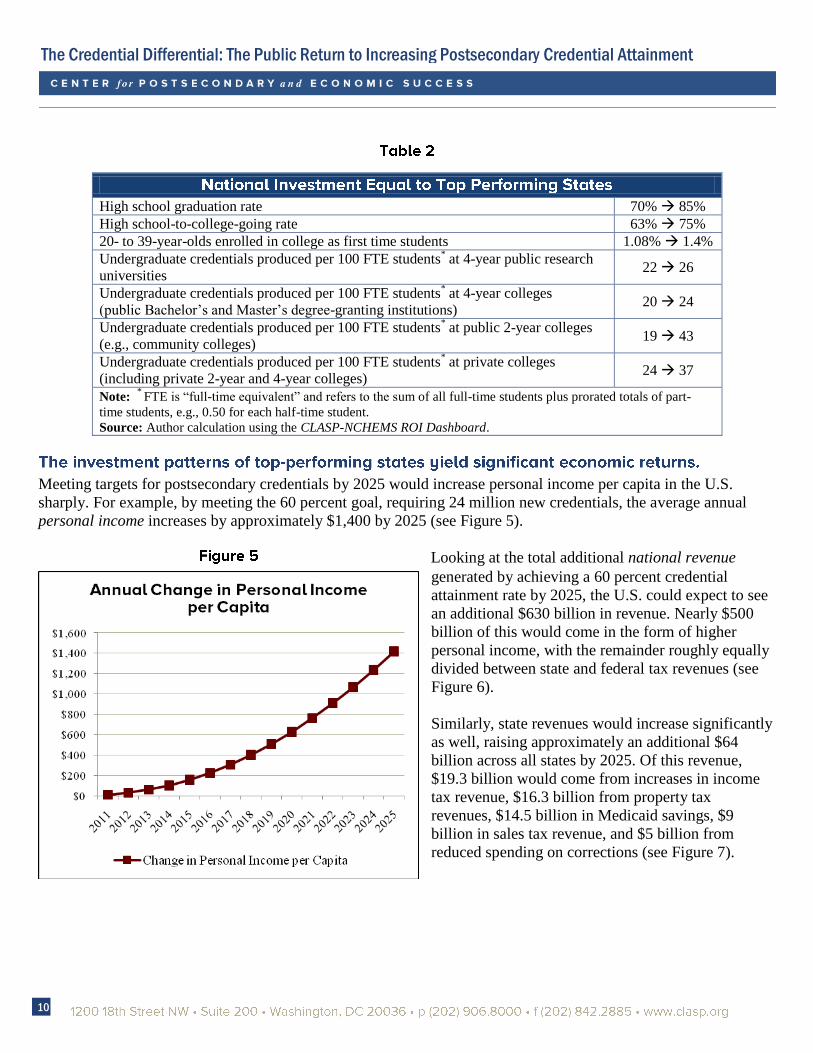
Meeting targets for postsecondary credentials by 2025 would increase personal income per capita in the U.S.
sharply. For example, by meeting the 60 percent goal, requiring 24 million new credentials, the average annual
personal income increases by approximately $1,400 by 2025 (see Figure 5).
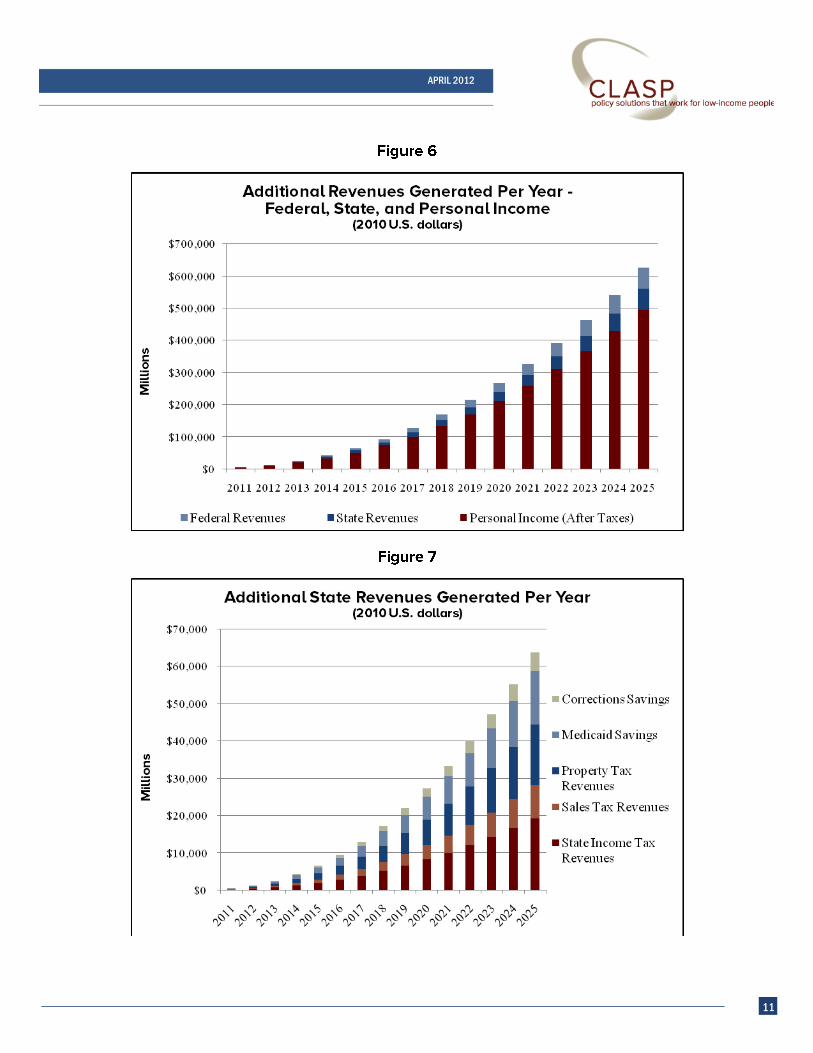
Looking at the total additional national revenue
generated by achieving a 60 percent credential
attainment rate by 2025, the U.S. could expect to see
an additional $630 billion in revenue. Nearly $500
billion of this would come in the form of higher
personal income, with the remainder roughly equally
divided between state and federal tax revenues (see
Figure 6).
Similarly, state revenues would increase significantly
as well, raising approximately an additional $64
billion across all states by 2025. Of this revenue,
$19.3 billion would come from increases in income
tax revenue, $16.3 billion from property tax
revenues, $14.5 billion in Medicaid savings, $9
billion in sales tax revenue, and $5 billion from
reduced spending on corrections (see Figure 7).
11
APRIL 2012
12
The Credential Differential: The Public Return to Increasing Postsecondary Credential Attainment
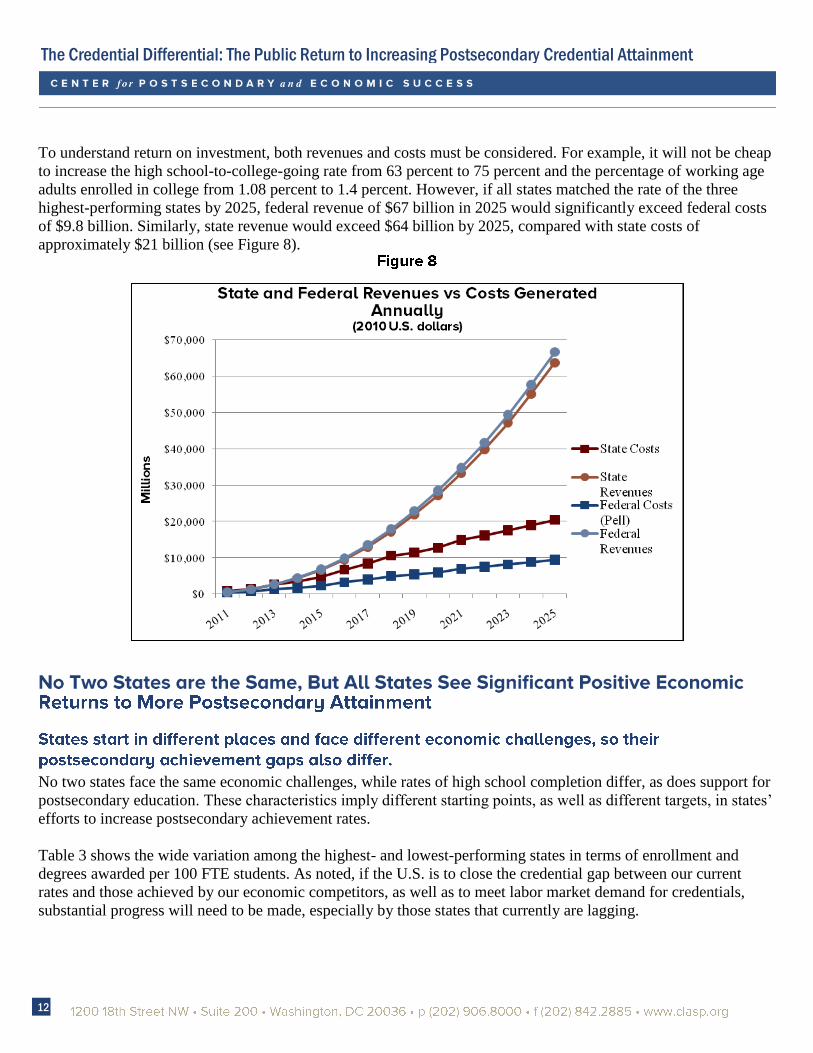
To understand return on investment, both revenues and costs must be considered. For example, it will not be cheap
to increase the high school-to-college-going rate from 63 percent to 75 percent and the percentage of working age
adults enrolled in college from 1.08 percent to 1.4 percent. However, if all states matched the rate of the three
highest-performing states by 2025, federal revenue of $67 billion in 2025 would significantly exceed federal costs
of $9.8 billion. Similarly, state revenue would exceed $64 billion by 2025, compared with state costs of
approximately $21 billion (see Figure 8).
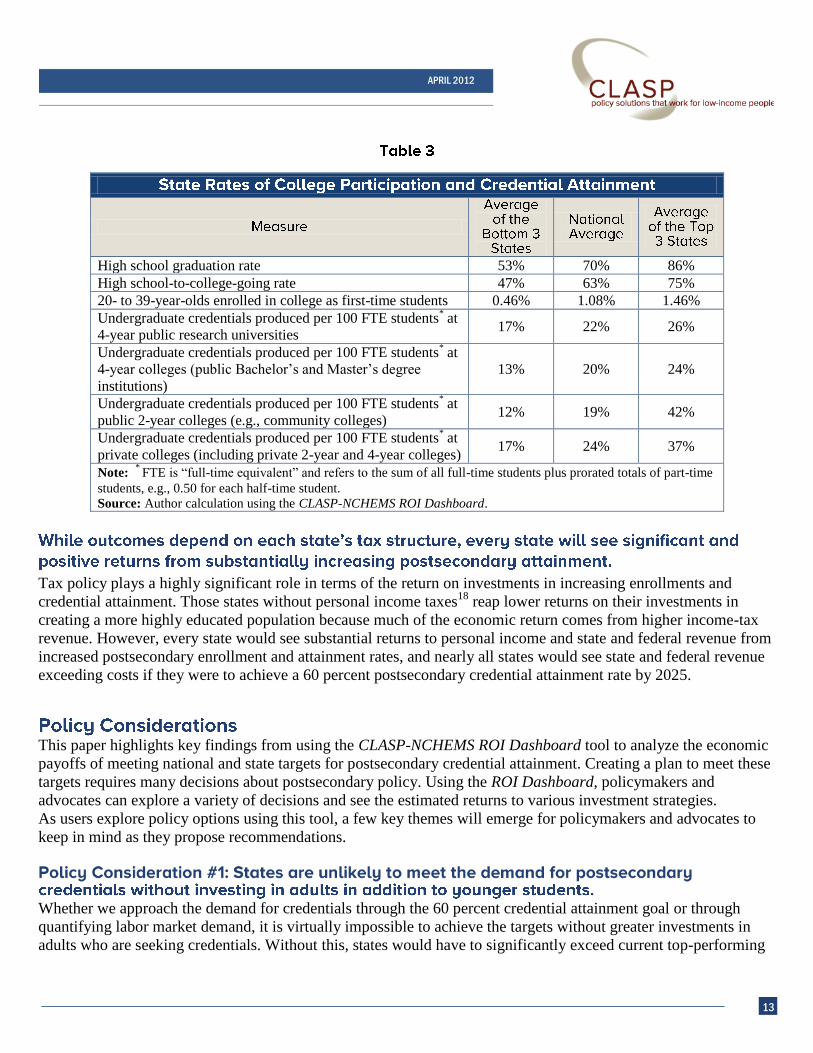
No two states face the same economic challenges, while rates of high school completion differ, as does support for
postsecondary education. These characteristics imply different starting points, as well as different targets, in states’
efforts to increase postsecondary achievement rates.
Table 3 shows the wide variation among the highest- and lowest-performing states in terms of enrollment and
degrees awarded per 100 FTE students. As noted, if the U.S. is to close the credential gap between our current
rates and those achieved by our economic competitors, as well as to meet labor market demand for credentials,
substantial progress will need to be made, especially by those states that currently are lagging.
13
APRIL 2012
High school graduation rate 53% 70% 86%
High school-to-college-going rate 47% 63% 75%
20- to 39-year-olds enrolled in college as first-time students 0.46% 1.08% 1.46%
Undergraduate credentials produced per 100 FTE students* at
4-year public research universities 17% 22% 26%
Undergraduate credentials produced per 100 FTE students* at
4-year colleges (public Bachelor’s and Master’s degree
institutions)
13% 20% 24%
Undergraduate credentials produced per 100 FTE students* at
public 2-year colleges (e.g., community colleges) 12% 19% 42%
Undergraduate credentials produced per 100 FTE students* at
private colleges (including private 2-year and 4-year colleges) 17% 24% 37%
Note: *
FTE is ―full-time equivalent‖ and refers to the sum of all full-time students plus prorated totals of part-time
students, e.g., 0.50 for each half-time student.
Source: Author calculation using the CLASP-NCHEMS ROI Dashboard.
Tax policy plays a highly significant role in terms of the return on investments in increasing enrollments and
credential attainment. Those states without personal income taxes18
reap lower returns on their investments in
creating a more highly educated population because much of the economic return comes from higher income-tax
revenue. However, every state would see substantial returns to personal income and state and federal revenue from
increased postsecondary enrollment and attainment rates, and nearly all states would see state and federal revenue
exceeding costs if they were to achieve a 60 percent postsecondary credential attainment rate by 2025.
This paper highlights key findings from using the CLASP-NCHEMS ROI Dashboard tool to analyze the economic
payoffs of meeting national and state targets for postsecondary credential attainment. Creating a plan to meet these
targets requires many decisions about postsecondary policy. Using the ROI Dashboard, policymakers and
advocates can explore a variety of decisions and see the estimated returns to various investment strategies.
As users explore policy options using this tool, a few key themes will emerge for policymakers and advocates to
keep in mind as they propose recommendations.
Whether we approach the demand for credentials through the 60 percent credential attainment goal or through
quantifying labor market demand, it is virtually impossible to achieve the targets without greater investments in
adults who are seeking credentials. Without this, states would have to significantly exceed current top-performing
14
The Credential Differential: The Public Return to Increasing Postsecondary Credential Attainment
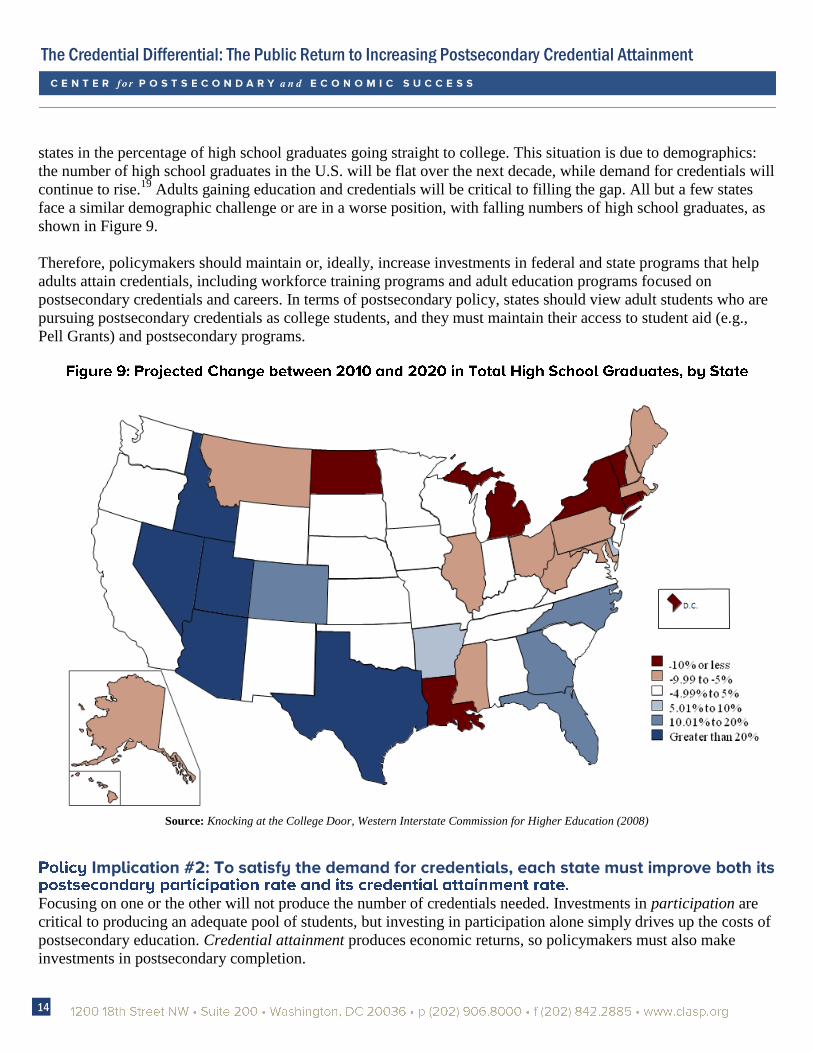
states in the percentage of high school graduates going straight to college. This situation is due to demographics:
the number of high school graduates in the U.S. will be flat over the next decade, while demand for credentials will
continue to rise.19
Adults gaining education and credentials will be critical to filling the gap. All but a few states
face a similar demographic challenge or are in a worse position, with falling numbers of high school graduates, as
shown in Figure 9.
Therefore, policymakers should maintain or, ideally, increase investments in federal and state programs that help
adults attain credentials, including workforce training programs and adult education programs focused on
postsecondary credentials and careers. In terms of postsecondary policy, states should view adult students who are
pursuing postsecondary credentials as college students, and they must maintain their access to student aid (e.g.,
Pell Grants) and postsecondary programs.
Source: Knocking at the College Door, Western Interstate Commission for Higher Education (2008)
Focusing on one or the other will not produce the number of credentials needed. Investments in participation are
critical to producing an adequate pool of students, but investing in participation alone simply drives up the costs of
postsecondary education. Credential attainment produces economic returns, so policymakers must also make
investments in postsecondary completion.
15
APRIL 2012
When considering economic returns to postsecondary investments, it is important to consider the costs of
credential production. Postsecondary institutions have different cost structures, and these affect the economic
return. Policymakers should carefully consider the types of credentials in demand over the coming years, as well as
which types of institution can produce those credentials most cost effectively. This analysis should inform the
postsecondary investment strategy.
There is wide variation in state levels of college participation and credential attainment. Additionally, state tax
structures and public benefit systems and policies are not the same (e.g., a handful of states have no state income
taxes, which results in lower but still positive economic returns to increasing postsecondary credentials).
Policymakers should deliberately review their states’ current rates of postsecondary participation and credential
attainment as well as current allocations of investment across different types of students and institutions. Using this
baseline, policymakers can use the ROI Dashboard tool to estimate numbers of credentials produced and the
economic returns to various postsecondary reform strategies. This will yield a tailored postsecondary investment
plan that is realistic and appropriate for the state.
State and federal policymakers are challenged to use precious public tax dollars wisely. Just as there are long-term
economic benefits to investing in postsecondary credential attainment, there are long-term costs associated with
cutting funding for postsecondary education. None of this is easy. We urge federal policymakers to avoid deep cuts
to programs that help people gain postsecondary credentials, including the Pell Grant program and the Workforce
Investment Act. Federal policymakers also should avoid cutting Pell Grants for adult students and those in
occupational programs that will be in high-demand into the future.
We urge state policymakers to reverse the long-term trend of disinvestment in public institutions of higher
education and to ensure that state student aid programs are adequately funded to meet credential demands. Also,
state policymakers should increase state investments in adult education and workforce education and training and
focus these investments on helping all workers—including those with lower skill levels—attain in-demand
credentials.
Investments in credential attainment pay off. As policymakers face tough budget decisions over the coming
months and years, it is critical that they consider not just immediate expenditures but also future returns on today’s
investments in credential attainment. Policymakers are stewards of the national and state economies, and their
decisions about postsecondary investments will make a great difference in strengthening or weakening our
collective economic future.
16
The Credential Differential: The Public Return to Increasing Postsecondary Credential Attainment
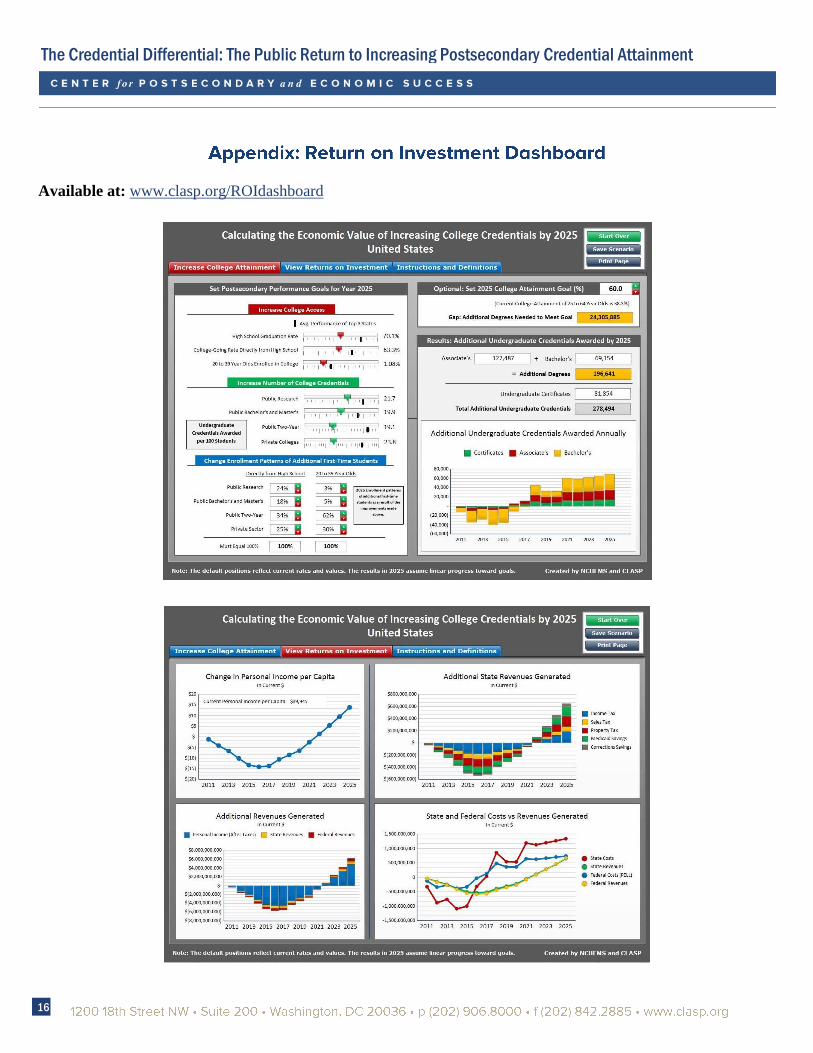
Available at: www.clasp.org/ROIdashboard
17
APRIL 2012
The following are suggested steps for implementing the Return on Investment Dashboard.
1. (Optional first step) In the upper-right corner of the Increase College Attainment tab, set a college attainment
goal for the year 2025, based on a specific credential attainment target or a target driven by labor market analyses.
Doing so will change the additional number of degrees needed to meet the goal. The default setting is 60 percent.
Directly below are figures for the number of additional credentials produced by 2025, broken down by certificates
and Associate’s and Bachelor’s degrees. The U.S. and all states have improved their college attainment rates since
2000; these improvements are projected out to 2025.
2. On the Increase College Attainment tab, choose different scenarios for increasing college degree production by
moving the levers on the dashboard. There are two sets of measures that enable you to gauge the additional college
credentials produced. The first set measures the additional credentials produced as a result of improving the rates
of high school graduation and college access. The second set measures additional credentials produced as a result
of changes in college completion rates by type of institution.
3. Assess the impact of redistributing the first-time enrollment patterns of the additional students generated by
improving college participation and completion. For instance, some states may seek to expand enrollment in the
community college system while limiting enrollment growth in four-year institutions.
4. After modifying the dashboard figures in Tab 1, review the returns on investment in Tab 2. The costs to the
states are in current dollars per full-time equivalent student, assuming constant state funding per student through
2025. The returns reflect additional revenues to individuals, the state, and the federal government.
18
The Credential Differential: The Public Return to Increasing Postsecondary Credential Attainment
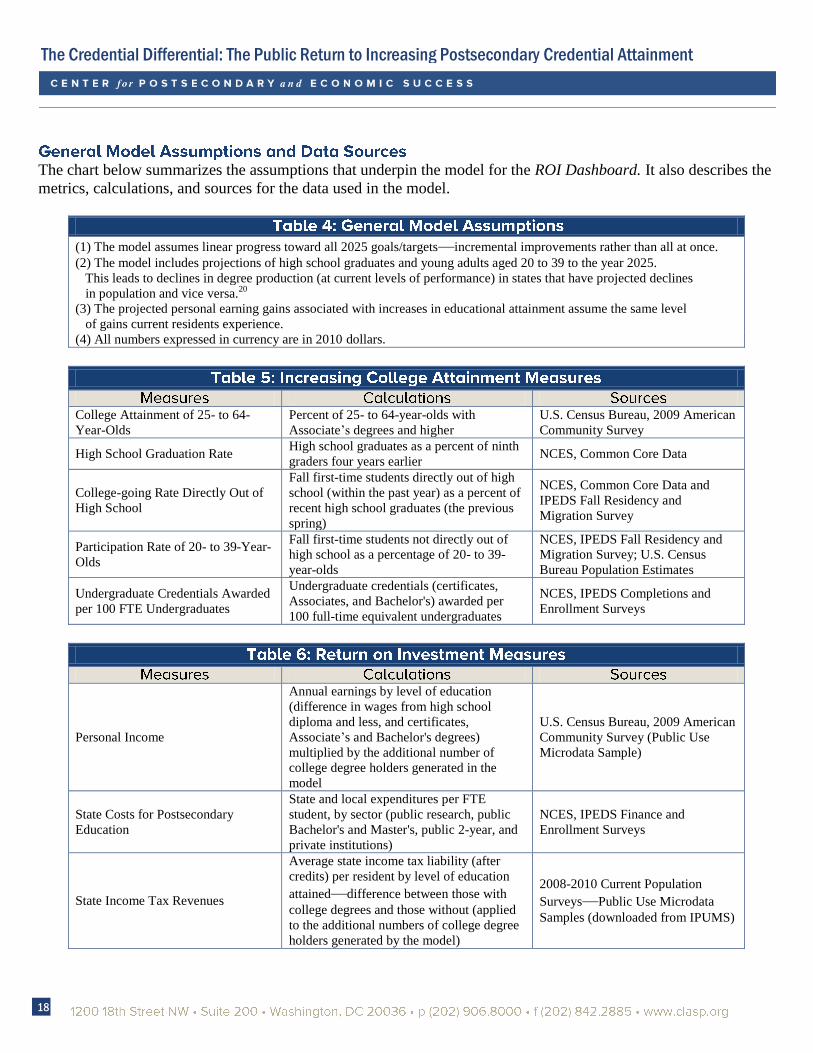
The chart below summarizes the assumptions that underpin the model for the ROI Dashboard. It also describes the
metrics, calculations, and sources for the data used in the model.
(1) The model assumes linear progress toward all 2025 goals/targets—incremental improvements rather than all at once.
(2) The model includes projections of high school graduates and young adults aged 20 to 39 to the year 2025.
This leads to declines in degree production (at current levels of performance) in states that have projected declines
in population and vice versa.20
(3) The projected personal earning gains associated with increases in educational attainment assume the same level
of gains current residents experience.
(4) All numbers expressed in currency are in 2010 dollars.
College Attainment of 25- to 64-
Year-Olds
Percent of 25- to 64-year-olds with
Associate’s degrees and higher
U.S. Census Bureau, 2009 American
Community Survey
High School Graduation Rate High school graduates as a percent of ninth
graders four years earlier NCES, Common Core Data
College-going Rate Directly Out of
High School
Fall first-time students directly out of high
school (within the past year) as a percent of
recent high school graduates (the previous
spring)
NCES, Common Core Data and
IPEDS Fall Residency and
Migration Survey
Participation Rate of 20- to 39-Year-
Olds
Fall first-time students not directly out of
high school as a percentage of 20- to 39-
year-olds
NCES, IPEDS Fall Residency and
Migration Survey; U.S. Census
Bureau Population Estimates
Undergraduate Credentials Awarded
per 100 FTE Undergraduates
Undergraduate credentials (certificates,
Associates, and Bachelor's) awarded per
100 full-time equivalent undergraduates
NCES, IPEDS Completions and
Enrollment Surveys
Personal Income
Annual earnings by level of education
(difference in wages from high school
diploma and less, and certificates,
Associate’s and Bachelor's degrees)
multiplied by the additional number of
college degree holders generated in the
model
U.S. Census Bureau, 2009 American
Community Survey (Public Use
Microdata Sample)
State Costs for Postsecondary
Education
State and local expenditures per FTE
student, by sector (public research, public
Bachelor's and Master's, public 2-year, and
private institutions)
NCES, IPEDS Finance and
Enrollment Surveys
State Income Tax Revenues
Average state income tax liability (after
credits) per resident by level of education
attained—difference between those with
college degrees and those without (applied
to the additional numbers of college degree
holders generated by the model)
2008-2010 Current Population
Surveys—Public Use Microdata
Samples (downloaded from IPUMS)
19
APRIL 2012
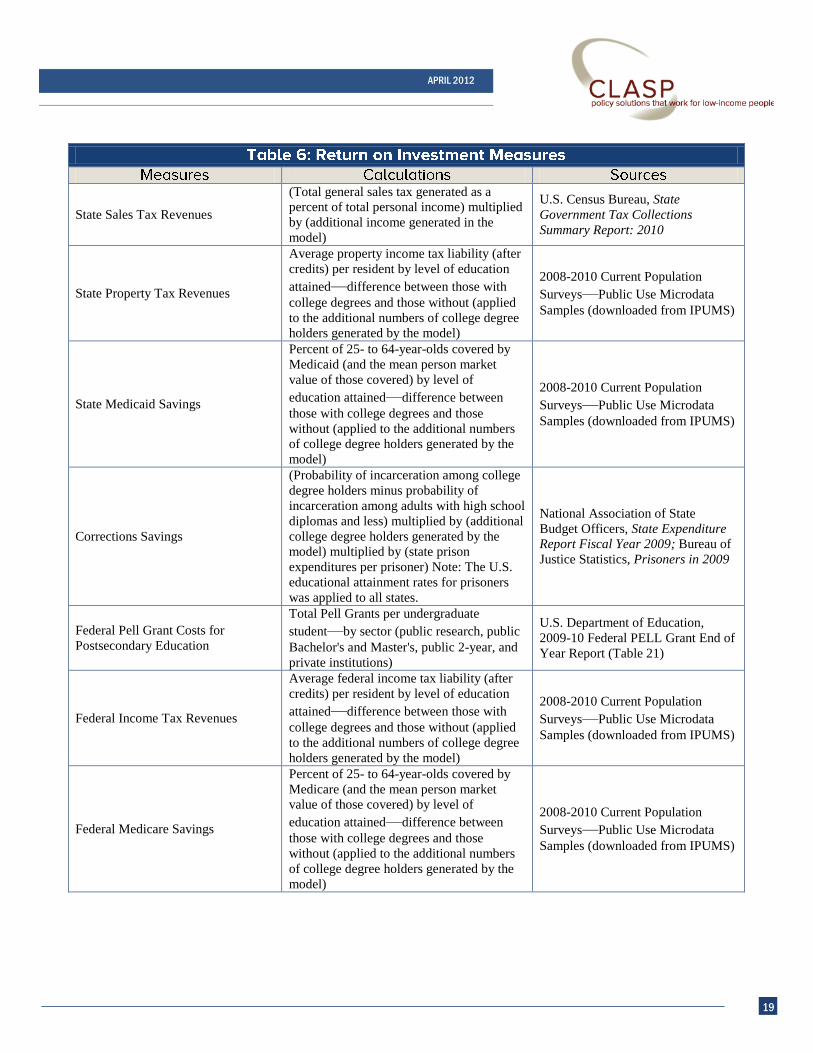
State Sales Tax Revenues
(Total general sales tax generated as a
percent of total personal income) multiplied
by (additional income generated in the
model)
U.S. Census Bureau, State
Government Tax Collections
Summary Report: 2010
State Property Tax Revenues
Average property income tax liability (after
credits) per resident by level of education
attained—difference between those with
college degrees and those without (applied
to the additional numbers of college degree
holders generated by the model)
2008-2010 Current Population
Surveys—Public Use Microdata
Samples (downloaded from IPUMS)
State Medicaid Savings
Percent of 25- to 64-year-olds covered by
Medicaid (and the mean person market
value of those covered) by level of
education attained—difference between
those with college degrees and those
without (applied to the additional numbers
of college degree holders generated by the
model)
2008-2010 Current Population
Surveys—Public Use Microdata
Samples (downloaded from IPUMS)
Corrections Savings
(Probability of incarceration among college
degree holders minus probability of
incarceration among adults with high school
diplomas and less) multiplied by (additional
college degree holders generated by the
model) multiplied by (state prison
expenditures per prisoner) Note: The U.S.
educational attainment rates for prisoners
was applied to all states.
National Association of State
Budget Officers, State Expenditure
Report Fiscal Year 2009; Bureau of
Justice Statistics, Prisoners in 2009
Federal Pell Grant Costs for
Postsecondary Education
Total Pell Grants per undergraduate
student—by sector (public research, public
Bachelor's and Master's, public 2-year, and
private institutions)
U.S. Department of Education,
2009-10 Federal PELL Grant End of
Year Report (Table 21)
Federal Income Tax Revenues
Average federal income tax liability (after
credits) per resident by level of education
attained—difference between those with
college degrees and those without (applied
to the additional numbers of college degree
holders generated by the model)
2008-2010 Current Population
Surveys—Public Use Microdata
Samples (downloaded from IPUMS)
Federal Medicare Savings
Percent of 25- to 64-year-olds covered by
Medicare (and the mean person market
value of those covered) by level of
education attained—difference between
those with college degrees and those
without (applied to the additional numbers
of college degree holders generated by the
model)
2008-2010 Current Population
Surveys—Public Use Microdata
Samples (downloaded from IPUMS)
20
The Credential Differential: The Public Return to Increasing Postsecondary Credential Attainment
1 Anthony Carnevale, Nicole Smith, and Jeffery Strohl, Help Wanted: Projections of Jobs and Education Requirements Through 2018,
Center on Education and the Workforce, Georgetown University, 2010. 2 Organisation for Economic Cooperation and Development, Education at a Glance 2011: OECD Indicators, OECD Publishing, 2011,
http://dx.doi.org/10.1787/eag-2011-en. 3 Hannah Shaw, ―Want to Promote Job Training and Adult Education? Then Fund Them Adequately,‖ Center on Budget and Policy
Priorities, February 10, 2012. 4 Anthony Carnevale, Jeffrey Strohl, and Nicole Smith, ―Help Wanted: Postsecondary Education and Training Required,‖ Chapter 3 of
New Directions for Community Colleges, No. 146, Summer 2009. 5 Marcie Foster, ―With Budgets Slashed, Adult Education Programs Struggle to Keep the Lights On,‖ CLASP, February 21, 2012.
6 Carnevale, Strohl, and Smith, ―Help Wanted: Postsecondary Education and Training Required,‖ 2009.
7 Edward Glaeser and Albert Saiz, ―The Rise of the Skilled City,‖ National Bureau of Economic Research (NBER) Working Paper No.
10191, 2003; Daron Acemoglu and David Autor, ―What does Human Capital Do? A Review of Goldin and Katz's The Race Between
Education and Technology," NBER Working Paper 17820, 2012. 8 Sandy Baum, and Jennifer Ma, ―Education Pays: The Benefits of Higher Education for Individuals and Society,‖ College Board, 2007.
9 Barabara Wolfe and Robert Haveman, ―Social and Nonmarket Benefits from Education in an Advanced Economy,‖ in Yolanda K.
Kodrzycki, ed., Education in the 21st Century: Meeting the Challenges of a Changing World, 2002. 10
Shaw, ―Want to Promote Job Training and Adult Education? Then Fund Them Adequately,‖ 2012. 11
Carnevale, Strohl, and Smith, ―Help Wanted: Postsecondary Education and Training Required,‖ 2009. 12
Foster, ―With Budgets Slashed, Adult Education Programs Struggle to Keep the Lights On,‖ 2012. 13
Education at a Glance 2011: OECD Indicators, OECD Publishing, 2011. 14
Patrick Kelly, ―Closing the College Attainment Gap between the U.S. and Most Educated Countries, and the Contributions to be Made
by the State,‖ National Center for Higher Education Management Systems, 2010. 15
Carnevale, Strohl, and Smith, ―Help Wanted: Postsecondary Education and Training Required,‖ 2009. 16
Figures 3-9 are based on analysis by the author using the CLASP-NCHEMS ROI Dashboard tool. 17
The CLASP/NCHEMS tool uses three metrics to measure enrollment in postsecondary education: the percentage of students who
complete high school within four years; the percentage of high school students who enroll in college in the fall term after graduation; and
the percentage of 20- to 39-year-old students who are enrolled in postsecondary education for the first time. These metrics represent the
college-going public and are used as the basis for calculations of the flow of students into postsecondary education. At present, of those
students who enroll in college in the fall after high school graduation, 24% enroll in public, four-year research universities; 18% enroll in
public Bachelor’s and Master’s degree-granting colleges; 34% enroll in two-year institutions; and 25% enroll in private institutions. Of
those 20- to 39-year-olds who enrolled in postsecondary education as first-time students, 3% enroll in public, four-year research
universities; 5% enroll in public Bachelor’s and Master’s degree-granting colleges; 62% enroll in two-year institutions; and 30% enroll in
private institutions. 18
Alaska, Florida, Nevada, New Hampshire, South Dakota, Tennessee, Texas, Washington, and Wyoming. 19
Patrick Kelly and Julie Strawn, Not Just Kid Stuff Anymore: The Economic Imperative for More Adults to Complete College, National
Center for Higher Education Management Systems and CLASP, 2011. See the profiles of each state with flat or falling numbers of high
school graduates at http://www.clasp.org/in_the_states/. 20
Knocking at the College Door: Projections of High School Graduates by State and Race/Ethnicity, Western Interstate Commission for
Higher Education, 2008.