Embed Size (px)
Citation preview
THE QUALITY OF TEACHERS AND SCHOOL PERFORMANCE IN
URBAN AND RURAL SECONDARY SCHOOLS IN MONDULI DISTRICT,
ARUSHA-TANZANIA
VASCO JACOB MWINUKA
A DISSERTATION SUBMITTED IN PARTIAL FULFILLMENT OF THE
REQUIREMENTS FOR THE DEGREE OF MASTER OF EDUCATION
ADMINISTRATION PLANNING AND POLICY STUDIES OF THE OPEN
UNIVERSITY OF TANZANIA
2016
CERTIFICATION
The undersigned certifies that he has read and hereby recommends for acceptance by
the Open University of Tanzania, a dissertation entitled: “The Quality of Teachers
and School Performance in Urban and Rural Secondary Schools in Monduli District,
Arusha, Tanzania” in fulfillment of the requirement for an award of Masters Degree
in Education Administration, Planning and Policy Studies of the Open University of
Tanzania.
……………………..……………
Prof. Issa Mcholo Omari
(Supervisor)
…………………………
Date
ii
COPYRIGHT
No part of this proposal may be reproduced, stored in any retrieval system or
transmitted in any form by any means, electronic, mechanical, photocopying,
recording or otherwise without prior written permission of the author or the Open
University of Tanzania in that behalf.
iii
DECLARATION
I, Lieutenant Vasco Jacob Mwinuka, do hereby declare that this dissertation is my
own original work and has not been presented and will not be presented to any
college, higher learning institution or other University for similar or any other degree
award.
……………………….…………
Signature
…………………….………
Date
iv
DEDICATION
This work is dedicated to my beloved father, the late Staff Sergeant Jacob Augustino
Mwinuka, my mother Regina Haule, my wife Consolatha and my children, Gladness,
Jacob, Jacqueline and Josephine.
v
ACKNOWLEDGEMENT
Many people have made valuable contribution towards the successful completion of
this work; I am greatly indebted to all of them. It is not possible to mention all of
them individually but the following deserves special appreciation, and are worth
mentioned by names. First, I wish to express my thanks to the Lord God for his
divine provision for the entire period of my studies.
Secondly, I am thankful to my supervisor Prof. Issa Mcholo Omari who guided me
from the beginning of my concept paper to the present form of my work. I appreciate
his constructive criticisms and scholarly inputs. Special thanks to my loving wife
Consolatha, who encouraged me to pursue master’s degree. I would also like to
extend my heartfelt gratitude to all my family members for their moral support.
Finally yet important, I wish to appreciate the contribution of Mr. Thadeus Lekule,
staff of University of Makumira, Mr Valerius Haule, staff of University of Iringa and
my colleague Major Martin Nyalusi, staff of Defense Forces Headquarter.
vi
ABSTRACT
By recognizing the presence of poor performance in secondary schools, the study
sought to investigate the extent to which quality of teachers contributed to secondary
school performance in urban and rural secondary schools. More specifically, the
study aimed at investigating the qualities of teachers, examining working
environment and availability of teaching and learning facilities. The area of study
was Monduli district in Arusha, Tanzania, covering eight secondary schools from
urban and rural areas. The study sample comprised of 16 respondents. The guided
checklists were the method employed. The major findings revealed that, professional
qualifications of teachers were much higher in urban schools than in rural schools.
Teachers’ professional development activities were limited in low performing
schools but fairly moderate in high performing schools. Teachers’ Professional
Development and experience revealed significant relationship with school
performance. Specifically, there is no uniformity in terms of quality and size of
schools’ infrastructure. The working and living condition varies from urban to rural
and from school to school. The study came up with the following conclusions; the
majorities of teachers are low experienced and missed professional development.
The academic performance of private schools matches with experienced teachers.
Many schools newly employed teachers lack mentorship from senior teachers. Most
of low performing secondary schools do not have enough infrastructures like
classroom and laboratories. The study recommends continuous and regular in–
service training of teachers, provision of incentives to motivate teachers, revision on
current Education and Training Policy to run with an increased demand for teachers’
quality is also highly recommended.
vii
TABLE OF CONTENTS
CERTIFICATION......................................................................................................ii
COPYRIGHT............................................................................................................iii
DECLARATION.......................................................................................................iii
DEDICATION...........................................................................................................iii
ACKNOWLEDGEMENT........................................................................................iii
ABSTRACT...............................................................................................................iii
LIST OF TABLES.....................................................................................................iii
LIST OF FIGURES...................................................................................................iii
CHAPTER ONE.........................................................................................................3
1.0 BACKGROUND AND STATEMENT TO THE PROBLEM.........................3
1.1 Introduction....................................................................................................3
1.2 Background to the Problem...........................................................................3
1.3 Statement of the Problem..............................................................................3
1.3.1 Criteria for the Choice of the Problem...........................................................3
1.4 Purpose of the Study......................................................................................3
1.4.1 Specific Objectives of the Study....................................................................3
1.4.2 Research Questions........................................................................................3
1.5 Delimitation and Limitation of the Study......................................................3
1.6 Significance of the Study...............................................................................3
1.7 Conceptual Framework of the Study.............................................................3
CHAPTER TWO........................................................................................................3
2.0 LITERATURE REVIEW....................................................................................3
2.1 Introduction to the Chapter............................................................................3
viii
2.2 Working Environment of Teachers and School Performance.......................3
2.2.1 Teachers Houses, Security and School Performance.....................................3
2.2.2 School Infrastructure and School Performance.............................................3
2.3.1 Hiring of Teachers for Secondary Schools....................................................3
2.3.2 Educational Levels of Teachers in Secondary Schools.................................3
2.3.3 Teachers Professional Training and Development in Secondary Schools... .3
2.3.4 Education Qualifications and Teaching Levels in Secondary Schools..........3
2.3.5 Teachers Experience and School Performance..............................................3
2.3.6 Teachers Efforts, Workloads and School Performance.................................3
2.3.7 Teachers Time on Task and School Performance.........................................3
2.3.8 Teachers Job Satisfaction and School Performance......................................3
2.3.9 Teachers Sex, Age, Experience and School Performance.............................3
2.4 The Knowledge Gap......................................................................................3
CHAPTER THREE...................................................................................................3
3.0 RESEARCH METHODOLOGY........................................................................3
3.1 Introduction to the Chapter............................................................................3
3.2 Research Paradigm and Design.....................................................................3
3.3 Area of Study and Justification......................................................................3
3.4 Target Population, Sample and Sampling Procedures...................................3
3.4.1 Population of the Study.................................................................................3
3.4.2 Study Sample.................................................................................................3
3.4.3 Sampling Techniques.....................................................................................3
3.5 Research Instruments.....................................................................................3
ix
3.5.1 Checklist for Schools Infrastructure..............................................................3
3.5.2 School Records Review.................................................................................3
3.5.3 Strength of the Research Instruments: Validity and Reliability....................3
3.6 Data Collection Techniques...........................................................................3
3.7 Ethical Issues Consideration..........................................................................3
CHAPTER FOUR......................................................................................................3
4.0 DATA ANALYSIS AND PRESENTATION.....................................................3
4.1 Introduction to the Chapter............................................................................3
4.2 Teachers Working Environment in Secondary Schools................................3
4.2.1 Infrastructures and Facilities in the Surveyed Schools..................................3
4.2.2 Status of Teachers Houses in Secondary Schools........................................3
4.2.3 Water Availability and Distance from Teachers Working Stations..............3
4.2.4 Heath Service and Distance from Teachers Working Stations......................3
4.2.5 Access to Roads and Distance from Teachers Working Stations..................3
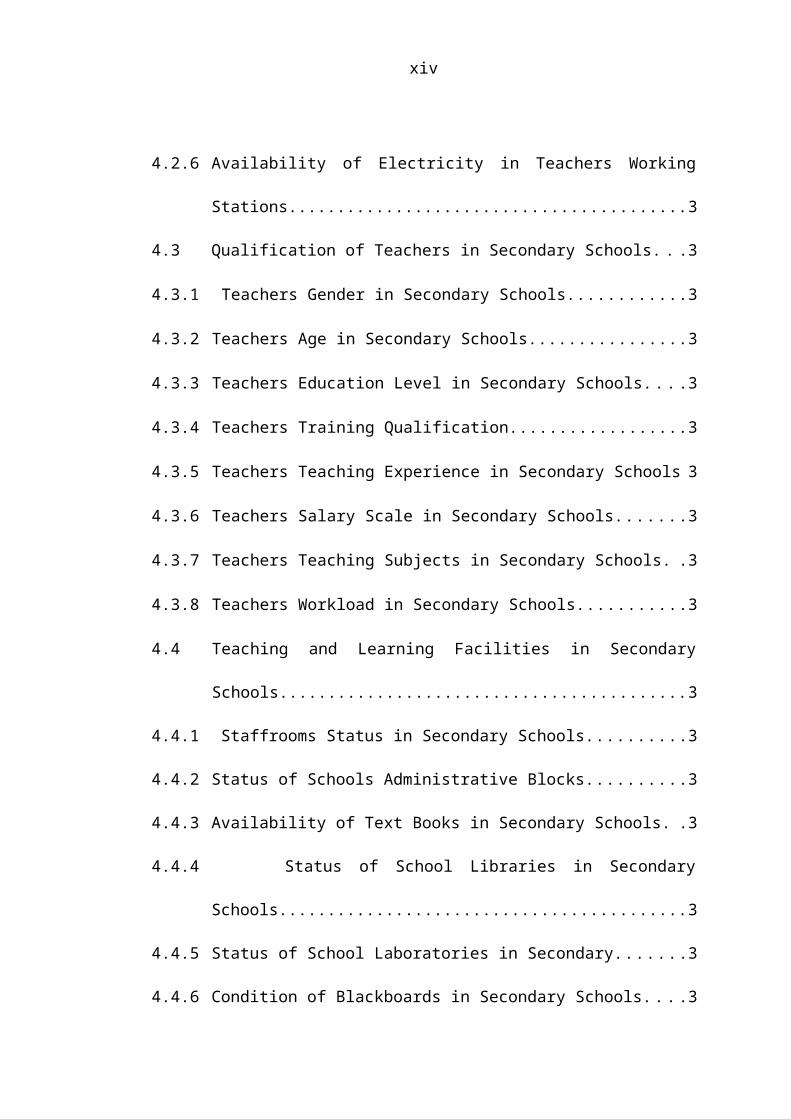
4.2.6 Availability of Electricity in Teachers Working Stations..............................3
4.3 Qualification of Teachers in Secondary Schools...........................................3
4.3.1 Teachers Gender in Secondary Schools.......................................................3
4.3.2 Teachers Age in Secondary Schools..............................................................3
4.3.3 Teachers Education Level in Secondary Schools..........................................3
4.3.4 Teachers Training Qualification....................................................................3
4.3.5 Teachers Teaching Experience in Secondary Schools..................................3
4.3.6 Teachers Salary Scale in Secondary Schools................................................3
4.3.7 Teachers Teaching Subjects in Secondary Schools.......................................3
4.3.8 Teachers Workload in Secondary Schools....................................................3
x
4.4 Teaching and Learning Facilities in Secondary Schools...............................3
4.4.1 Staffrooms Status in Secondary Schools......................................................3
4.4.2 Status of Schools Administrative Blocks.......................................................3
4.4.3 Availability of Text Books in Secondary Schools.........................................3
4.4.4 Status of School Libraries in Secondary Schools............................................3
4.4.5 Status of School Laboratories in Secondary..................................................3
4.4.6 Condition of Blackboards in Secondary Schools..........................................3
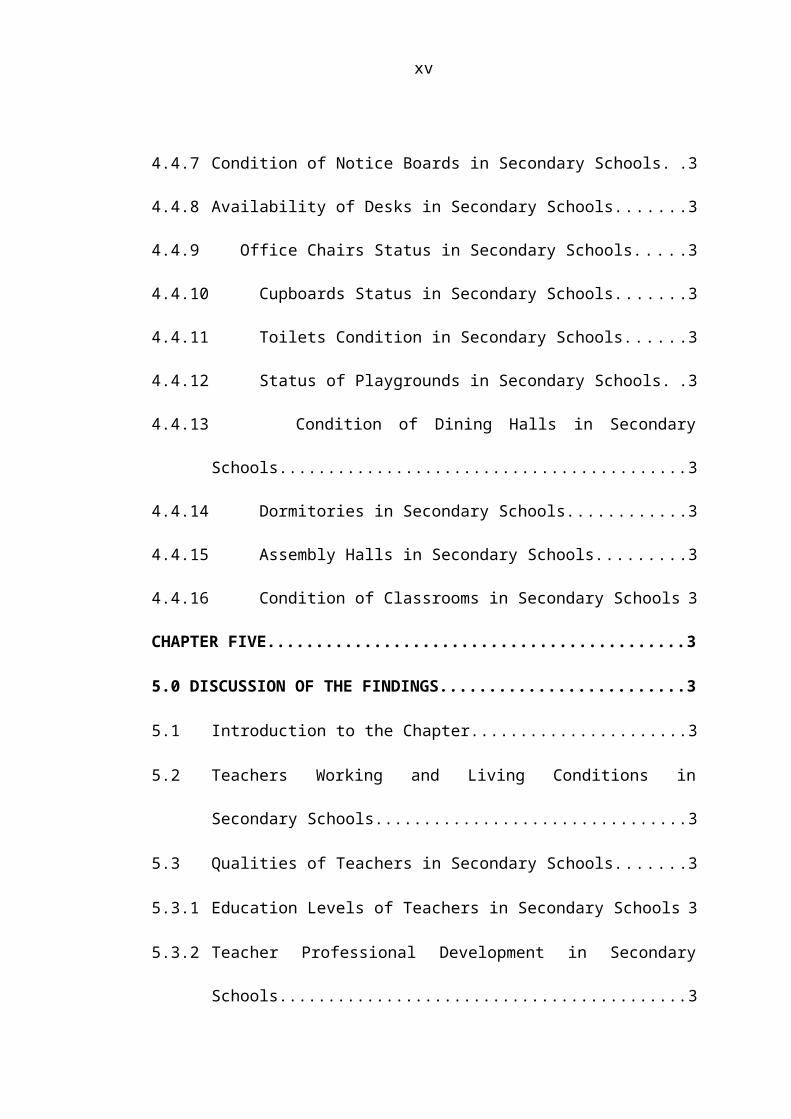
4.4.7 Condition of Notice Boards in Secondary Schools.......................................3
4.4.8 Availability of Desks in Secondary Schools..................................................3
4.4.9 Office Chairs Status in Secondary Schools................................................3
4.4.10 Cupboards Status in Secondary Schools...................................................3
4.4.11 Toilets Condition in Secondary Schools...................................................3
4.4.12 Status of Playgrounds in Secondary Schools............................................3
4.4.13 Condition of Dining Halls in Secondary Schools.....................................3
4.4.14 Dormitories in Secondary Schools...........................................................3
4.4.15 Assembly Halls in Secondary Schools.....................................................3
4.4.16 Condition of Classrooms in Secondary Schools.......................................3
CHAPTER FIVE........................................................................................................3
5.0 DISCUSSION OF THE FINDINGS...................................................................3
5.1 Introduction to the Chapter............................................................................3
5.2 Teachers Working and Living Conditions in Secondary Schools.................3
5.3 Qualities of Teachers in Secondary Schools..................................................3
5.3.1 Education Levels of Teachers in Secondary Schools....................................3
5.3.2 Teacher Professional Development in Secondary Schools............................3
xi
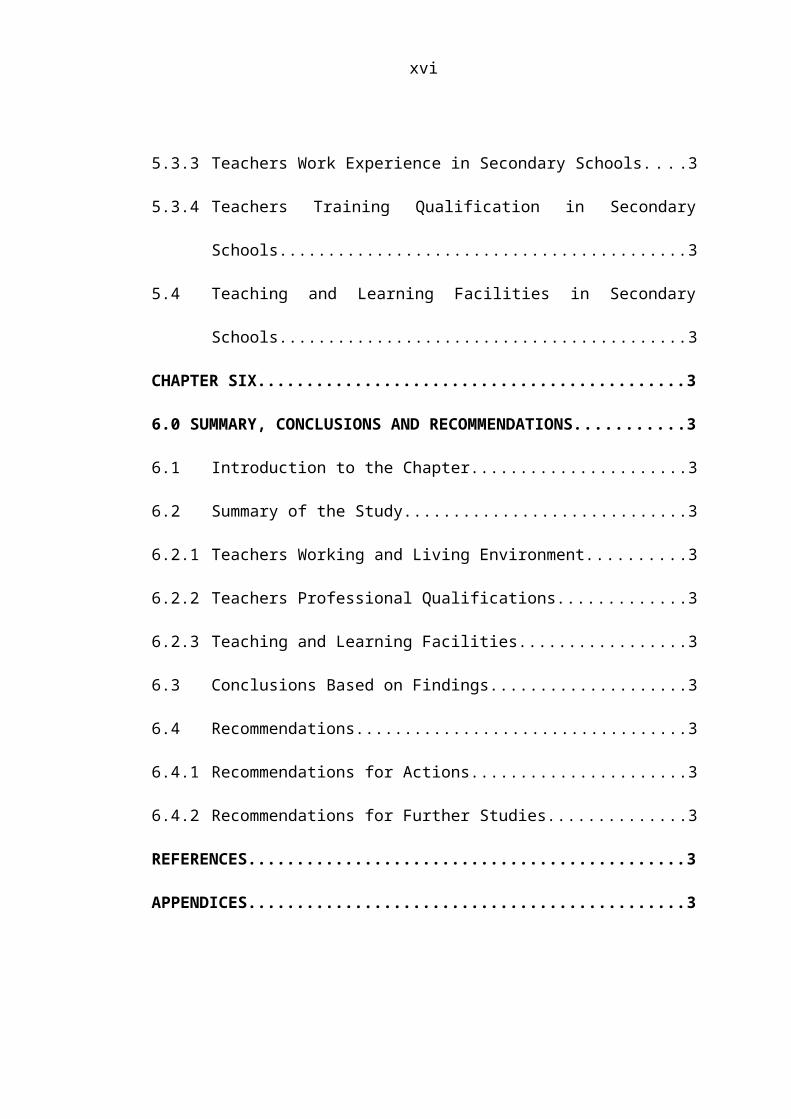
5.3.3 Teachers Work Experience in Secondary Schools........................................3
5.3.4 Teachers Training Qualification in Secondary Schools................................3
5.4 Teaching and Learning Facilities in Secondary Schools...............................3
CHAPTER SIX...........................................................................................................3
6.0 SUMMARY, CONCLUSIONS AND RECOMMENDATIONS......................3
6.1 Introduction to the Chapter............................................................................3
6.2 Summary of the Study...................................................................................3
6.2.1 Teachers Working and Living Environment.................................................3
6.2.2 Teachers Professional Qualifications.............................................................3
6.2.3 Teaching and Learning Facilities...................................................................3
6.3 Conclusions Based on Findings.....................................................................3
6.4 Recommendations..........................................................................................3
6.4.1 Recommendations for Actions.......................................................................3
6.4.2 Recommendations for Further Studies..........................................................3
REFERENCES...........................................................................................................3
APPENDICES............................................................................................................3
xii
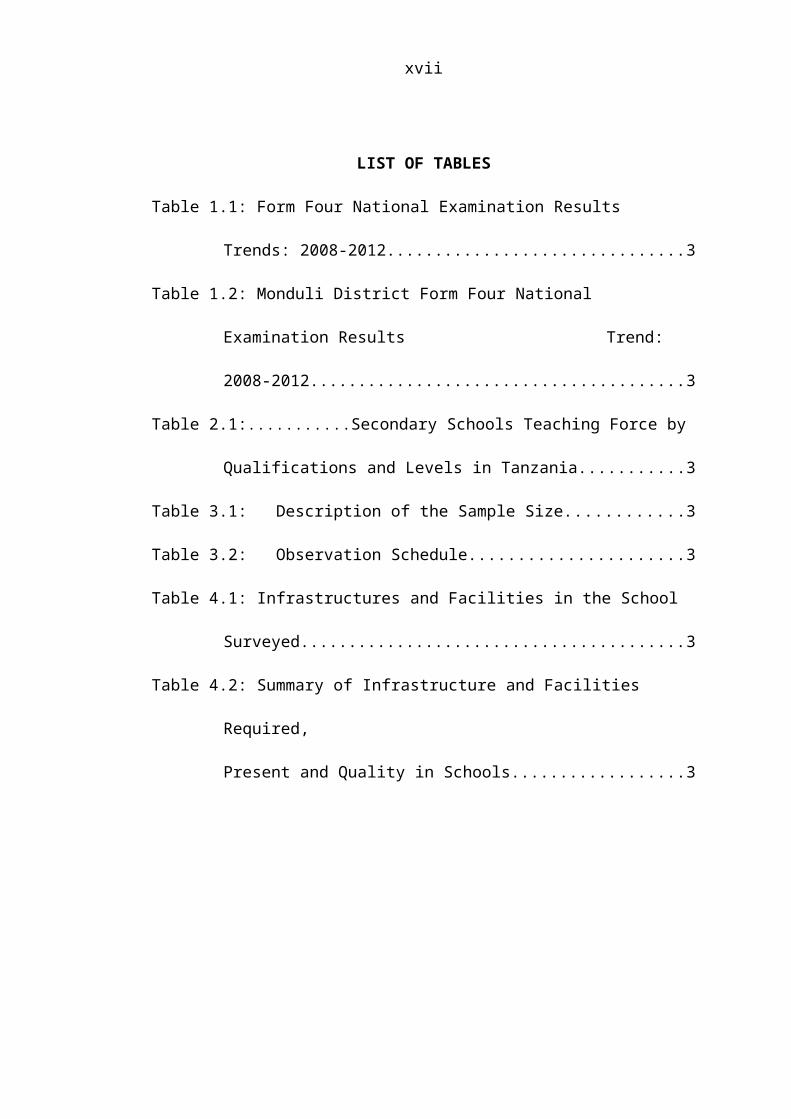
LIST OF TABLES
Table 1.1: Form Four National Examination Results Trends: 2008-2012...................3
Table 1.2: Monduli District Form Four National Examination Results
Trend: 2008-2012.......................................................................................3
Table 2.1: Secondary Schools Teaching Force by Qualifications and Levels in
Tanzania.....................................................................................................3
Table 3.1: Description of the Sample Size.................................................................3
Table 3.2: Observation Schedule...............................................................................3
Table 4.1: Infrastructures and Facilities in the School Surveyed.................................3
Table 4.2: Summary of Infrastructure and Facilities Required,
Present and Quality in Schools...................................................................3
xiii
LIST OF FIGURES
Figure 4.1: Teachers Gender........................................................................................3
Figure 4.2: Teachers Age.............................................................................................3
Figure 4.3: Teachers Education Level..........................................................................3
Figure 4.4: Teachers Trained Qualification.................................................................3
Figure 4.5: Teachers Teaching Experience in Years....................................................3
Figure 4.6: Teachers Salary Scale................................................................................3
Figure 4.7: Proportion of Teachers Teaching Each Subject .......................................3
Figure 4.8: Teachers Workload per Week...................................................................3
xiv
CHAPTER ONE
1.0 BACKGROUND AND STATEMENT TO THE PROBLEM
1.1 Introduction
The introductory chapter presents the significance of teacher quality in enhancing
school academic performance. It represents the background information to the
problem regarding the prerequisite for preparation of quality teachers. The chapter
gives the statement of the problem which focuses mainly on quality of teachers. It
also presents the purpose of the study and its specific objectives and research
questions. In addition, the chapter provides the significance of the study to the
education industry and displays conceptual framework that guides the study.
Limitations that will be encountered during the course of the study are finally
highlighted.
1.2 Background to the Problem
For many years the government has been investing in teacher education. The
government’s efforts have been to ensure a good supply of qualified teachers in
schools. The efforts are aimed at making sure that Tanzanians get quality education
that will help to fight against the three enemies of development, which according to
Mwl. Nyerere include ignorance, poverty and diseases. There are a number of issues
that are contributing to the questionable quality of education in Tanzania, but major
issue is the quality of teachers. There has been also a weakness in the recruitment
and placement of teachers in schools.
It is no doubt that, in any country, the quality of teachers determines the quality of
education. With regard to existing problem on the quality of teachers, the
1
government has taken measures to ensure the availability of enough qualified
teachers. To mention few, some of the measures include the access of in-service
teachers to training, increased of the number of recruitments of teachers in various
colleges and in-service seminars on pedagogical skills, including seminars on
competence based curriculum teaching, with a view of increasing efficiency in
teaching and availability of qualified teachers. Despite of these potential measures,
still there is questionable academic performance in secondary schools. (Haki Elimu,
2007; TENMET, 2010).
One of the major indicators of decline of quality of education in Tanzania is the
abysmal failure of students in public examinations, particularly at the secondary
level of education. The high percentage of candidates who failed Form Four National
Examination yearly is reflected in the low percentage of the candidates that meet the
advanced level admission requirements. According to Uduh (2009), the high
percentage of candidates who failed public examination in Nigeria yearly is reflected
in the low percentage of the candidates that meets the university admission
requirements. The high rates of failure of students in public examinations constitute
wastage on resource investment in secondary education (BEST, 2013).
Secondary Schools Expansion and School Performance: NSGR II (2010)
stipulates that, the expansion of primary and secondary schools was a result of not
only the decentralization policy, but also the Poverty Reduction Strategy of July
2010 in ensuring the accessibility of education services to all people in both rural
and urban areas. STEP, (2015) stipulate that, the total number of students enrolled in
secondary education increased from 14.6 percent of students in 1995 to 59.5 percent
2
in year 2013. Lingam, (2012) noted that, despite the expansion of secondary
education, the supply of teachers does not match with the demand in these schools;
especially ward secondary schools located in rural areas. This has affected the
academic performance of the students. The fight against the prevalence of extreme
poverty and hunger in rural areas can be successful through the provision of
adequate education and training of the human capacity needed for rural
development. Greenwalls, (1996) concludes that poverty alleviation can effectively
be achieved by ensured caring, competent and high qualified teachers in our
classrooms who will effectively achieve the national development goals.
Furthermore, Lingam (2012) argues that, rural areas are not attractive to qualified
teachers because of limited resources. The argument in Lingam (2012) is supported
by findings of Surty (2012), who found that South African rural areas and schools
find it difficult to attract good and suitable teachers, because there are less financial
resources available. For the same reason, Hudson and Hudson (2008) in congruence
with Harris and Farrel, (2007) and Barley (2009) contends that, it was difficult to
retain teachers in rural areas in most African countries. Teacher shortages as well as
subject specialist teacher shortages such as science and mathematics teachers in rural
areas have also been confirmed in Australia and England. Furthermore, even in
American rural schools face difficulties in recruiting and retaining new teachers
because of teaching conditions unique to rural schools.
Qualities of a Good Teacher: Qualities of good teacher are universal. There have
been various perspectives towards the concept of quality education in developed
countries. Despite the absence of consensus, quality issues in all levels rely on the
3
quality of teachers who are the product of quality education from colleges or
universities. Quality of a teacher is indicated by various qualities including;
academic qualification of a teacher from formal training, teachers experience in the
field of teaching, teachers competence in terms of masterly of the subject matter,
motivation and creativity of a teacher on teaching and learning process (URT, 1984;
Anangisye, 2008).
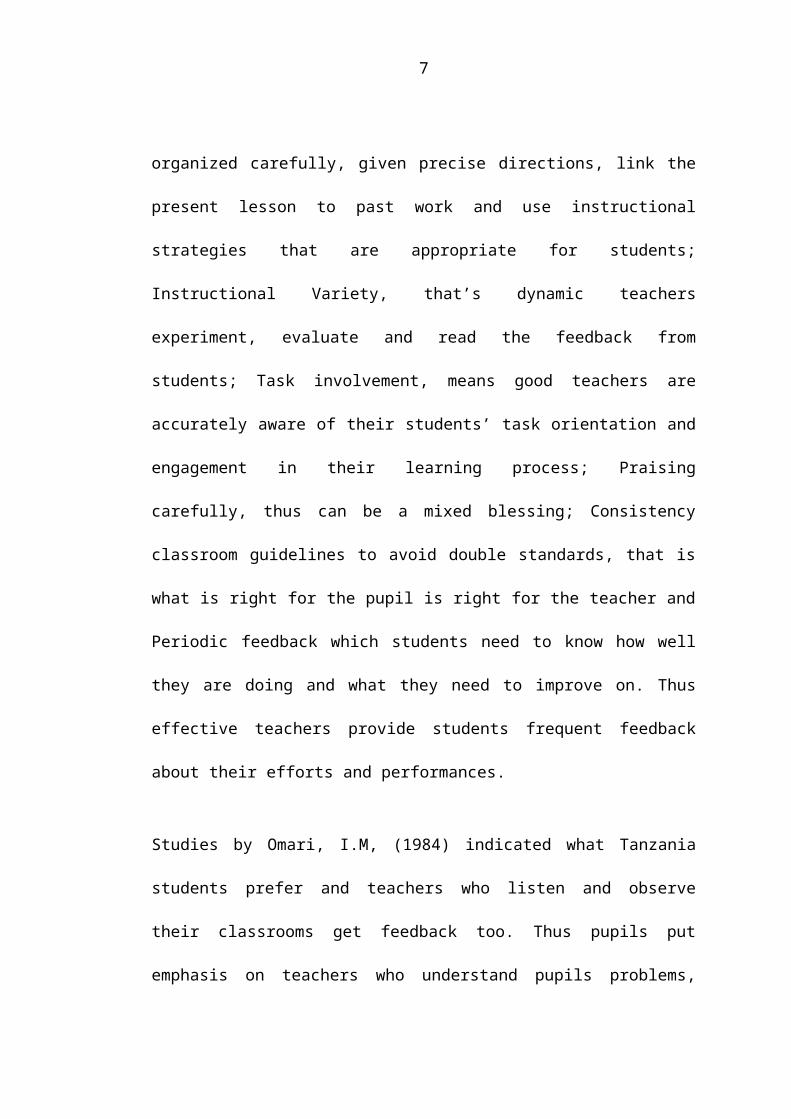
According to Berliner, (1996) as cited in Omari, I.M, (2011) identified the following
behaviors of a good and effective teachers; Lesson Clarity, means students
understand the teacher after materials have been organized carefully, given precise
directions, link the present lesson to past work and use instructional strategies that
are appropriate for students; Instructional Variety, that’s dynamic teachers
experiment, evaluate and read the feedback from students; Task involvement, means
good teachers are accurately aware of their students’ task orientation and
engagement in their learning process; Praising carefully, thus can be a mixed
blessing; Consistency classroom guidelines to avoid double standards, that is what is
right for the pupil is right for the teacher and Periodic feedback which students need
to know how well they are doing and what they need to improve on. Thus effective
teachers provide students frequent feedback about their efforts and performances.
Studies by Omari, I.M, (1984) indicated what Tanzania students prefer and teachers
who listen and observe their classrooms get feedback too. Thus pupils put emphasis
on teachers who understand pupils problems, interested in pupils, stimulating in the
classroom, helpful, have a sense of duty and vocation, knows subject matter well,
have good teaching methods, is hardworking and a teacher who is cooperative and
4
democratic. Therefore it creates a positive learning environment and gives the
impression that what is learnt is important.
The selection of teacher trainees from weak students undermines the teachers and
devalues the teaching profession (Mosha, 1995). To correct the situation, there is a
need for adjustment of criteria used for selection of teacher trainees and duration for
training to ensure quality of teachers trained in colleges. Teachers recruited through
the program concentrated on pedagogy and missed the academic content of their
teaching subjects because the duration of training was minimized from two years to
one year which suggests impossibility of coverage of training curriculum
(Hakielimu, 2009).
In addition, reports reveal that there is limited or no extra academic and professional
development training given to these teachers after their college training and
placement in schools despite the emphasis for maintenance of high quality national
teacher force through re-training in the process of achievement of EFA goals
(UNESCO, 2004). Further reports reveal that, the attention to policies which put
emphasis on teachers’ quality is given less weight by many countries (UNESCO,
2007), Tanzania is inclusive. Among the strategies developed under SEDEP I, was
regular provision of professional development sessions through in-service training,
seminars and workshops; the practice which involve few classroom teachers.
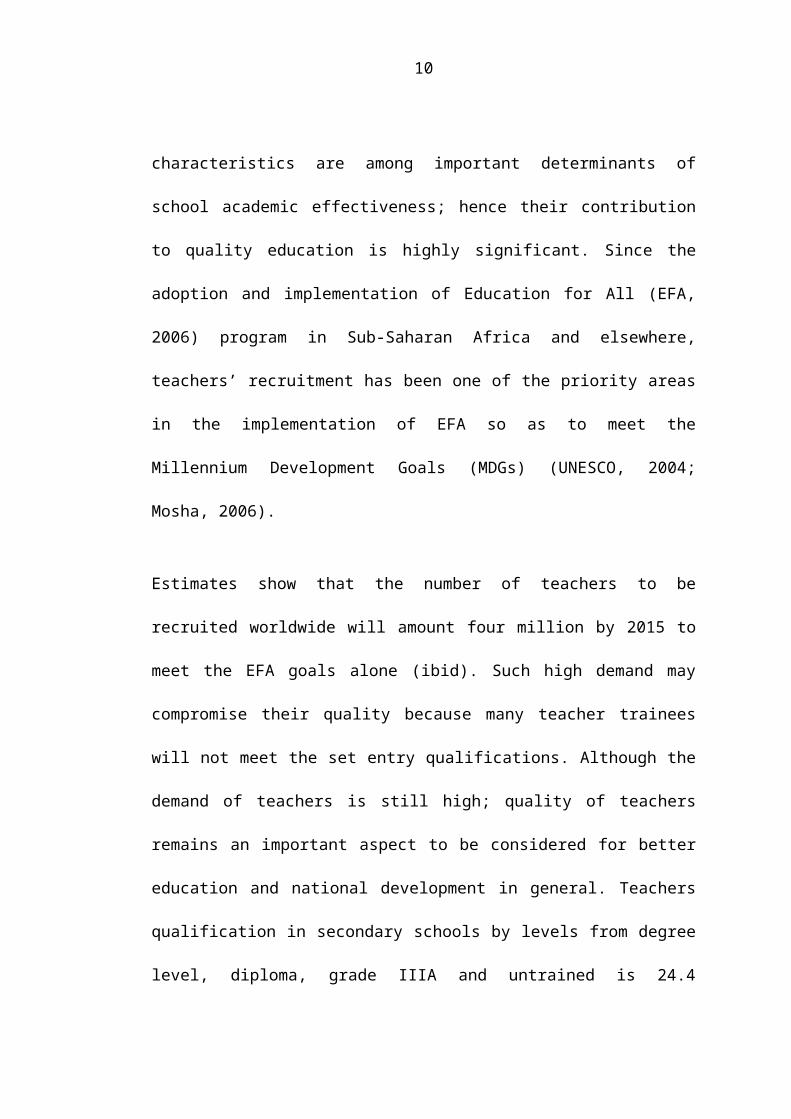
One vital aspect considered to bring about quality education to learners is quality of
teachers. Teachers’ quality to great extent has fundamental role to play in
determining the quality of education provided. Scheerens, (2000) confirms that
5

teachers’ characteristics are among important determinants of school academic
effectiveness; hence their contribution to quality education is highly significant.
Since the adoption and implementation of Education for All (EFA, 2006) program in
Sub-Saharan Africa and elsewhere, teachers’ recruitment has been one of the priority
areas in the implementation of EFA so as to meet the Millennium Development
Goals (MDGs) (UNESCO, 2004; Mosha, 2006).
Estimates show that the number of teachers to be recruited worldwide will amount
four million by 2015 to meet the EFA goals alone (ibid). Such high demand may
compromise their quality because many teacher trainees will not meet the set entry
qualifications. Although the demand of teachers is still high; quality of teachers
remains an important aspect to be considered for better education and national
development in general. Teachers qualification in secondary schools by levels from
degree level, diploma, grade IIIA and untrained is 24.4 percent, 54.7 percent, 0.012
percent and 20.8 percent respectively (BEST, 2011). However, a significant number
of teachers in developing countries have low level of education before they are
recruited and trained to become teachers. Rural areas have more under-qualified
teachers than urban areas. Characteristics such as certification status and degree in
the field to be taught being significantly and positively related to students outcomes,
(Darling, 2000). Teachers’ level of education has negative influence on students’
performance especially in rural ward secondary schools.
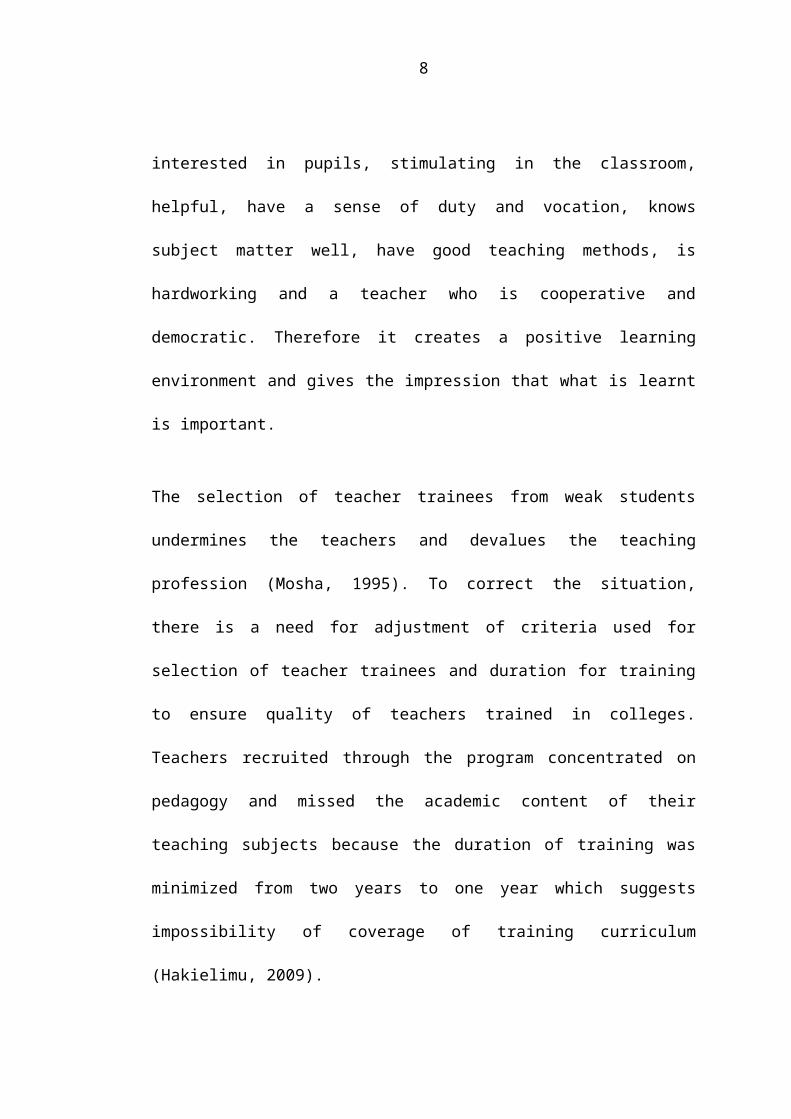
In many developing countries, including Tanzania, and in some developed countries
as well, there are a number of teachers who begin to teach without having any prior
training or preparation in the field. Some have received a degree in a field other than
6

teaching; some have only completed secondary education; others have only
completed primary education. In all of these cases, the majority of the candidates
entering the teaching profession are among the least qualified of all the students who
are entering the professional workforce.
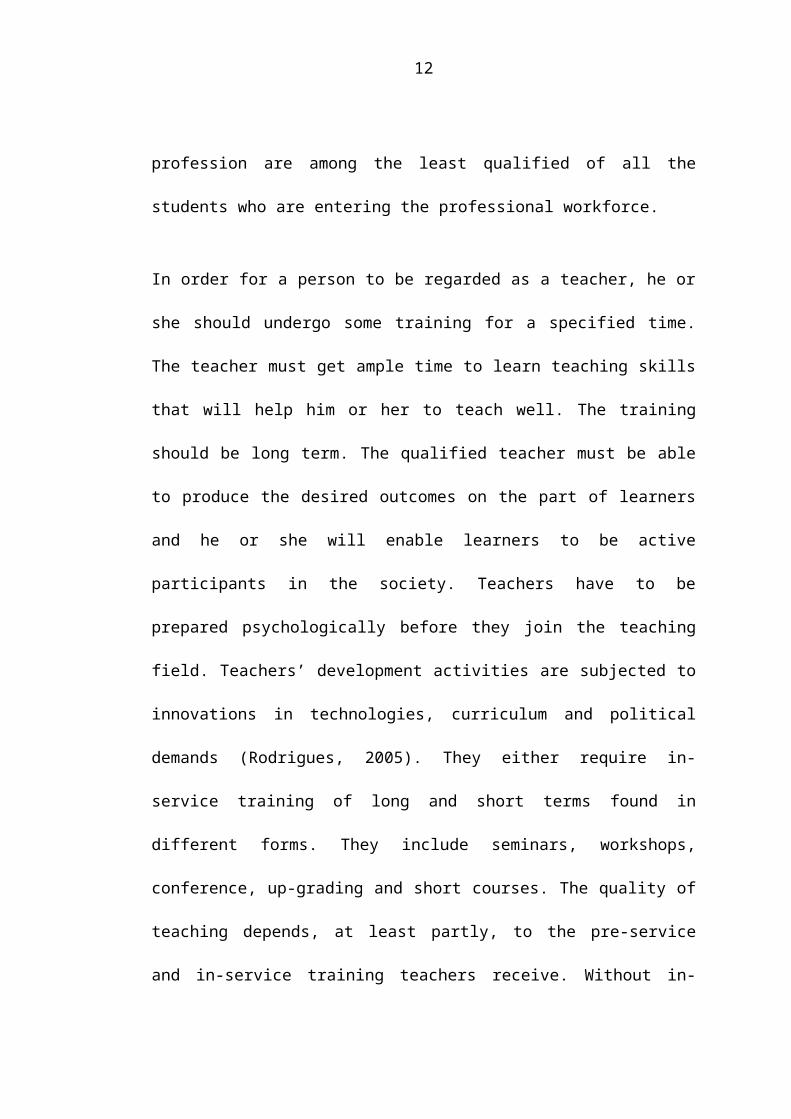
In order for a person to be regarded as a teacher, he or she should undergo some
training for a specified time. The teacher must get ample time to learn teaching skills
that will help him or her to teach well. The training should be long term. The
qualified teacher must be able to produce the desired outcomes on the part of
learners and he or she will enable learners to be active participants in the society.
Teachers have to be prepared psychologically before they join the teaching field.
Teachers’ development activities are subjected to innovations in technologies,
curriculum and political demands (Rodrigues, 2005). They either require in-service
training of long and short terms found in different forms. They include seminars,
workshops, conference, up-grading and short courses. The quality of teaching
depends, at least partly, to the pre-service and in-service training teachers receive.
Without in-service training seminars, discussions and special training that offer new
knowledge, teachers will not be able to cope with the rapidly changing world.
Secondary Schools Academic Performance in Tanzania: School performance
refers to the accomplishment of a given task which is measured against
predetermined standards of accuracy, completeness, cost and speed. In this study,
school performance refers to the act of academic in which students deal with studies
and how well they meet the standards set out by the responsible authorities.
Performance of secondary schools means the rate of school students passing grades
7
in national examination (students overall examination scores). Almost the
performance of ordinary level government schools particularly ward secondary
schools is very poor compared to private schools.
Several factors have been addressed to have contributed to the poor performance in
Form Four National Examinations. Some of the major said factors are such as the
thrust of the two initiatives on expanding school infrastructure while forgetting about
the paramount importance of ensuring availability of teaching and learning
resources, teaching and learning environment, and quality of teachers. The
government’s introduction of crush program some years ago in a spirited move to
curb the shortage of teachers is also argued to have contributed to massive failures,
because it does not guarantee the churning out of their quality to teaching as
stipulated in the 1995 Education Training Policy (Haki-Elimu, 2007; Wankami,
2013). Education quality continues to drop from 90 percent in year 2007 to 43
percent in year 2012 in secondary education (TEP, 2014).
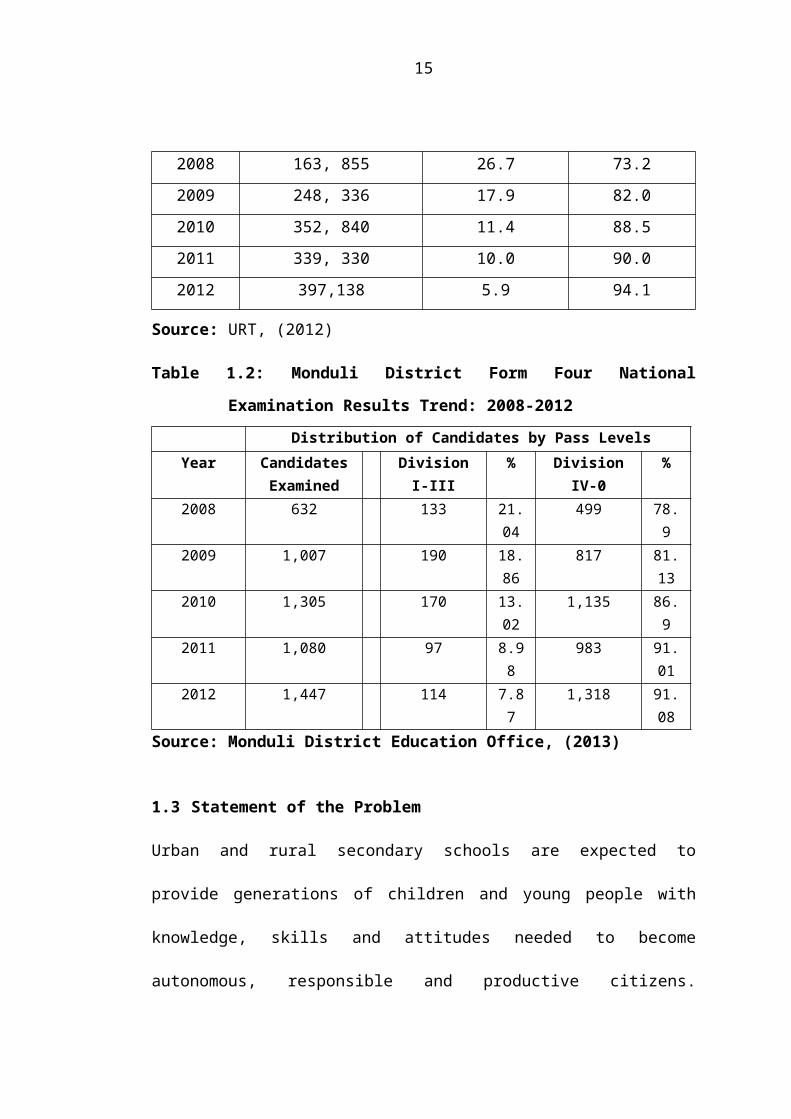
Table 1.1: Form Four National Examination Results Trends: 2008-2012
Distribution of Candidates by Pass Levels in Percentages
Year Candidates Examined Division I-III Division IV-0
2008 163, 855 26.7 73.2
2009 248, 336 17.9 82.0
2010 352, 840 11.4 88.5
2011 339, 330 10.0 90.0
2012 397,138 5.9 94.1
Source: URT, (2012)
8

Table 1.2: Monduli District Form Four National Examination Results Trend:
2008-2012
Distribution of Candidates by Pass LevelsYear Candidates
ExaminedDivision I-III % Division IV-0 %
2008 632 133 21.04 499 78.92009 1,007 190 18.86 817 81.132010 1,305 170 13.02 1,135 86.92011 1,080 97 8.98 983 91.012012 1,447 114 7.87 1,318 91.08
Source: Monduli District Education Office, (2013)
1.3 Statement of the Problem
Urban and rural secondary schools are expected to provide generations of children
and young people with knowledge, skills and attitudes needed to become
autonomous, responsible and productive citizens. Therefore, the quality of teachers
play a vital role in developing and sustaining urban and rural communities and are
crucial to Tanzania’s sustainability and the realization of the Millennium
Development Goals (MDGs); inter elia, eradication of poverty and hunger and
realization of universal basic education by 2015.
Quality of teachers is a serious problem facing public schools in Tanzania, affecting
not only rural ward public secondary schools but also urban public secondary
schools at large. Following problem of quality of teachers in public secondary
schools especially in rural ward secondary schools, the provision of quality
education services has been affected negatively. This has led to the questionable
academic performance in secondary schools especially in rural areas. If quality of
teachers remains unchecked, the efforts to make quality education and improve
students’ performance will not be attained. On top of that, the problem however is
9
that, a little or nothing has been done on addressing the issue of quality of teachers in
ward secondary schools at marginal areas on school effectiveness and performance
of students.
Many studies, including that of Haki Elimu (2007) and Omari (2013) address the
problem of quality of teachers in general by simply referring to the quality of crash
programme teachers without assessing and addressing the quality of teachers in
general. Furthermore, many studies do not clearly address why some of those rural
secondary schools perform better than urban schools. It is not known exactly if most
rural areas have most unqualified teachers and crush program teachers as compared
to urban schools that contribute to poor academic performance. It is also not known
exactly the extent to which the small proportions of those crush program teachers as
compared to large proportions of qualified teachers contribute to poor performance.
On its consequence, aspects of quality of teachers such as working environment,
efforts to teaching, time on task, job satisfaction, job motivation and teachers mix are
not well addressed to have contributed to poor teaching and learning process or not;
and consequently contributing to poor performance or not. Therefore, there is a need
to explore the quality of teachers in general in relation to school performance in
secondary schools to see if quality of teachers is one of the factors that contribute to
questionable academic performance. This study explored the quality of teachers and
school academic performance in urban and rural secondary schools.
1.3.1 Criteria for the Choice of the Problem
The problem chosen was the quality of teachers and school performance in urban
10
and rural secondary schools. The choice of this problem was important as many
educational studies had been done in typically urban areas but not specifically on the
quality of teachers and school performance in rural secondary schools, particularly in
Monduli district, as compared to urban schools.
1.4 Purpose of the Study
The purpose or main objective of this study was to investigate the relationship
between qualities of teachers, working environment and school performance in urban
and rural secondary schools in Monduli district.
1.4.1 Specific Objectives of the Study
The specific objectives of the study were to:-
i. Examine the working environment of teachers in urban and rural secondary
schools versus school performance.
ii. Determine the relationship between qualification of teachers and the school
performance in urban and rural secondary schools.
iii. To examine the availability and effects of teaching and learning facilities in
urban and rural secondary school.
1.4.2 Research Questions
In relation to the objectives, the study had the following questions;
i. What is the condition of working environment in urban and rural secondary
schools?
ii. Is there any relationship between qualification of teachers and the school
11
performance of urban and rural secondary schools?
iii. What is the availability of teaching and learning facilities in urban and rural
secondary school?
1.5 Delimitation and Limitation of the Study
The study was conducted in Tanzania, Arusha Region in Monduli District. The study
focused on population of ward secondary schools in Tanzania. According to Simon,
(2011), limitations of the study are the potential weakness of the research design and
are out of control of the researcher. Limitations are influences that the researcher
cannot control. They are the shortcomings, conditions or influences that cannot be
controlled by the researcher that places restrictions on methodology and conclusions.
The study sample allotted for the study was adequate to cover all aspects needed to
be researched due to the nature of the population under study.
Delimitations of the study describe the boundaries that the researcher had set for the
study and defines the parameters of the investigation such as population or sample,
treatment(s) setting and instrumentation (www.bcps.org/offices). This study was
delimited to ordinary level urban and rural secondary schools in Monduli district.
The research focused on eight secondary schools. Two good performing and two
poor performing urban and rural secondary schools were chosen. The findings
obtained may not necessarily be generalized to other districts. Therefore, a
researcher obtained a sample from a research area which was easy for researcher to
get the required information. The instruments used had small validity, reliability,
consistency and accuracy due to sample chosen. In this study, check list for school
infrastructure and school records on teachers’ quality were used as study instruments
12

to obtain required information from respondents in order to counter the limitations
occurred. The research design qualitatively or quantitatively or both, giving a
researcher greater options in selecting the instruments for data gathering chosen
enabled the researcher to obtain an accurate profile of the people, events or
situations. The researcher had chosen a design which was flexible, that was used
either.
1.6 Significance of the Study
It is expected that the research findings from the study will help policy makers to opt
for more appropriate policies which will result into improved quality of teachers. It
will also help curriculum developers to identify components of teacher quality which
had greatly contributed to students’ academic improvement over years and use them
to design and re-design appropriate and sustainable program for maintenance of
teachers’ quality.
The findings of the study will also help a researcher to have a deep and broader
knowledge on this aspect as well as identify viable areas for further researches.
Then, the findings of this study will provide to other researchers a foundation for
further studies in the related topics and probably extend the research using some
issues raised in this study. The findings, if appropriate used, may contribute to
individual schools initiatives to improve both teachers and pupils’ academic
performance.
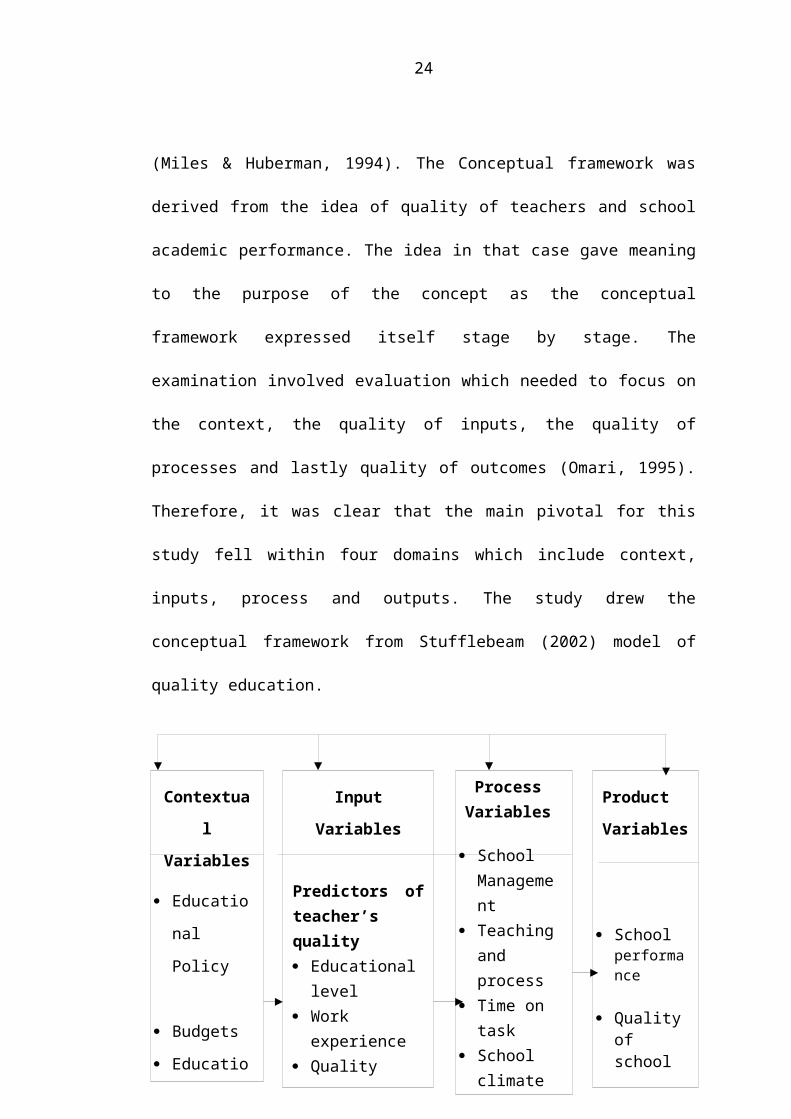
1.7 Conceptual Framework of the Study
Conceptual Framework is a written or visual presentation that explains either
13
graphically or in narrative form, the main things to be studied, the key factors,
concepts or variables and the presumed relationship among them (Miles &
Huberman, 1994). The Conceptual framework was derived from the idea of quality
of teachers and school academic performance. The idea in that case gave meaning to
the purpose of the concept as the conceptual framework expressed itself stage by
stage. The examination involved evaluation which needed to focus on the context,
the quality of inputs, the quality of processes and lastly quality of outcomes (Omari,
1995). Therefore, it was clear that the main pivotal for this study fell within four
domains which include context, inputs, process and outputs. The study drew the
conceptual framework from Stufflebeam (2002) model of quality education.
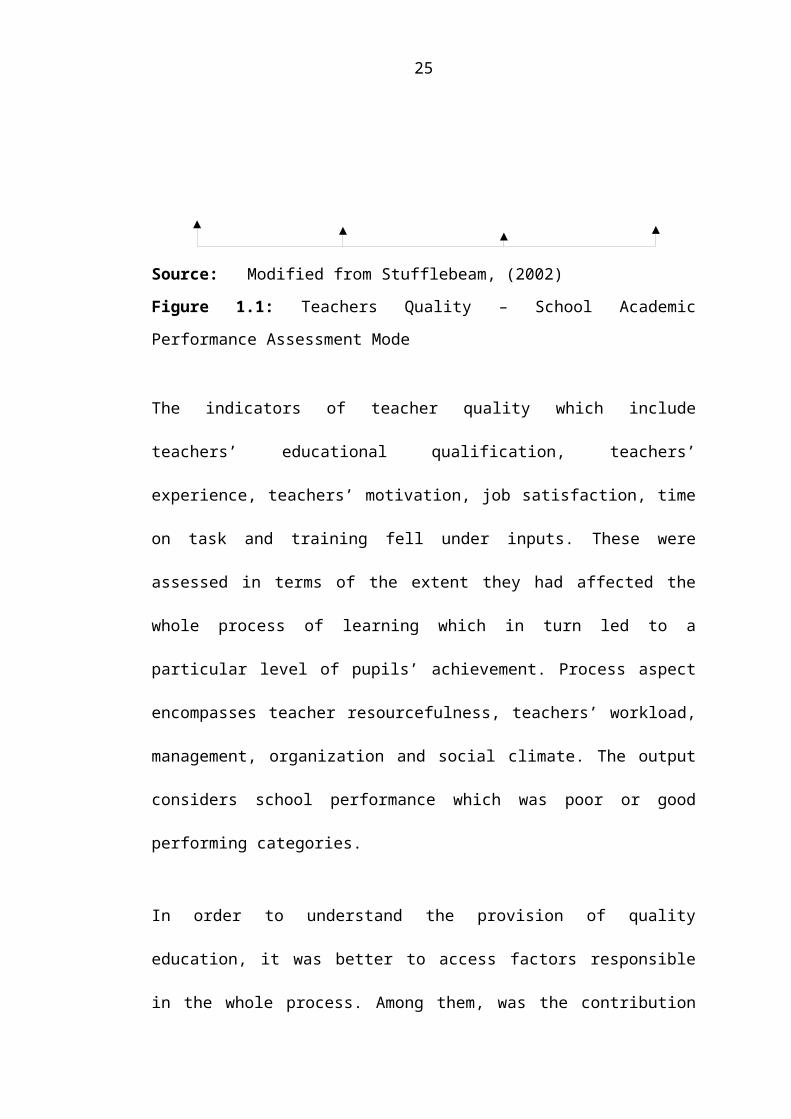
Source: Modified from Stufflebeam, (2002)
Figure 1.1: Teachers Quality – School Academic Performance Assessment Mode
The indicators of teacher quality which include teachers’ educational qualification,
Contextual
Variables
Educational
Policy
Budgets
Educational
programs
Enrolment
Input Variables
Predictors of teacher’s quality Educational level Work experience Quality teachers School materials
and resources School climate Time allocation
Process Variables
School Management
Teaching and process
Time on task School
climate Job
satisfaction Teachers
motivation and efforts
Product
Variables
School performance
Quality of school
14

teachers’ experience, teachers’ motivation, job satisfaction, time on task and training
fell under inputs. These were assessed in terms of the extent they had affected the
whole process of learning which in turn led to a particular level of pupils’
achievement. Process aspect encompasses teacher resourcefulness, teachers’
workload, management, organization and social climate. The output considers school
performance which was poor or good performing categories.
In order to understand the provision of quality education, it was better to access
factors responsible in the whole process. Among them, was the contribution made by
the quality of teachers to schools’ academic achievement. It was thus important to
examine the extent each component of teacher quality contributes to schools’
academic performance.
15
CHAPTER TWO
2.0 LITERATURE REVIEW
2.1 Introduction to the Chapter
The chapter reviews literature related to quality of teachers and school academic
performance. The chapter starts with working environment of teachers in urban and
rural secondary schools. The concept of teacher quality and its components as related
to school performance is also reviewed. The revised literature then gives the
knowledge gap that will be filled.
2.2 Working Environment of Teachers and School Performance
Working environment refers to things such as school safety, school size, school
shifts, school facilities such as buildings, amenities and the like. Working
environment includes teaching and learning environment, teaching and learning
resources, teachers’ houses and security and school infrastructure. Working
environment has direct and indirect impact to teachers in facilitating teaching and
learning process.
In general, good working environment promotes good teaching and learning
environment. Many studies including that of Haki Elimu (2004) and Benel &
Mukyunuzi (2005), contends that most of ward secondary schools have bad working
environment. This causes acute shortage of teachers in harsh environment as well as
rural areas. Most teachers who are placed to rural areas do not report at their working
stations and those already in the villages struggle to quit the rural environment
(URT, 2008). In order to improve the quality of education, the provision of school
learning materials and school infrastructure is important. School need to be supplied
16
with teaching materials to facilitate teaching in classroom, teachers houses, toilets,
stores, teachers offices and furniture.
The scarcity of school and classroom facilities remains a major problem at secondary
levels improvement of quality of schooling in ward secondary schools (URT, 2004).
Availability of text books is still a major problem despite efforts made to provide
text books to schools. In many subjects lack of text books makes teaching very
difficult leading to poor performance of students. Given a lack of teaching and
learning materials, teacher quality assumes a far greater importance in improving the
quality of education than would be the case otherwise. Given this importance, it is
vital to improve the professional competences of teachers and to raise their morale
by improving their living conditions, so that the quality of education does not
decline.
Learning environment refers to the diverse physical locations, context and cultures in
which students learn. Learning environment have both direct and indirect influence
on students learning behavior including their engagement in what is taught,
motivation to learn and their sense of wellbeing, belonging and safety. The learning
environment includes all the facilities, infrastructure available at school and all that
can be found in school surroundings. Teaching environment also has direct and
indirect influence and impact to teachers in facilitating teaching and learning process
(Haki Elimu, 2004). There are a reasonable number of teachers who are running
away from the teaching profession and as a result, thousands of students miss
education opportunities. Difference in living conditions resulting from bigger salary
difference contribute to the hatred towards to the teaching profession. Despite
17

causing acute shortage of teachers in harsh environment as well as rural areas, poor
teaching environment has great impact to school performance (Haki Elimu, 2004).
On overcoming the problem of most teachers denying the rural areas, the
government education policy stipulates that, “To attract and retain qualified teachers,
the government will always continue to create a conducive working environment.
The society and the school surrounding community should be encouraged to help
teachers when appointed to their schools”.
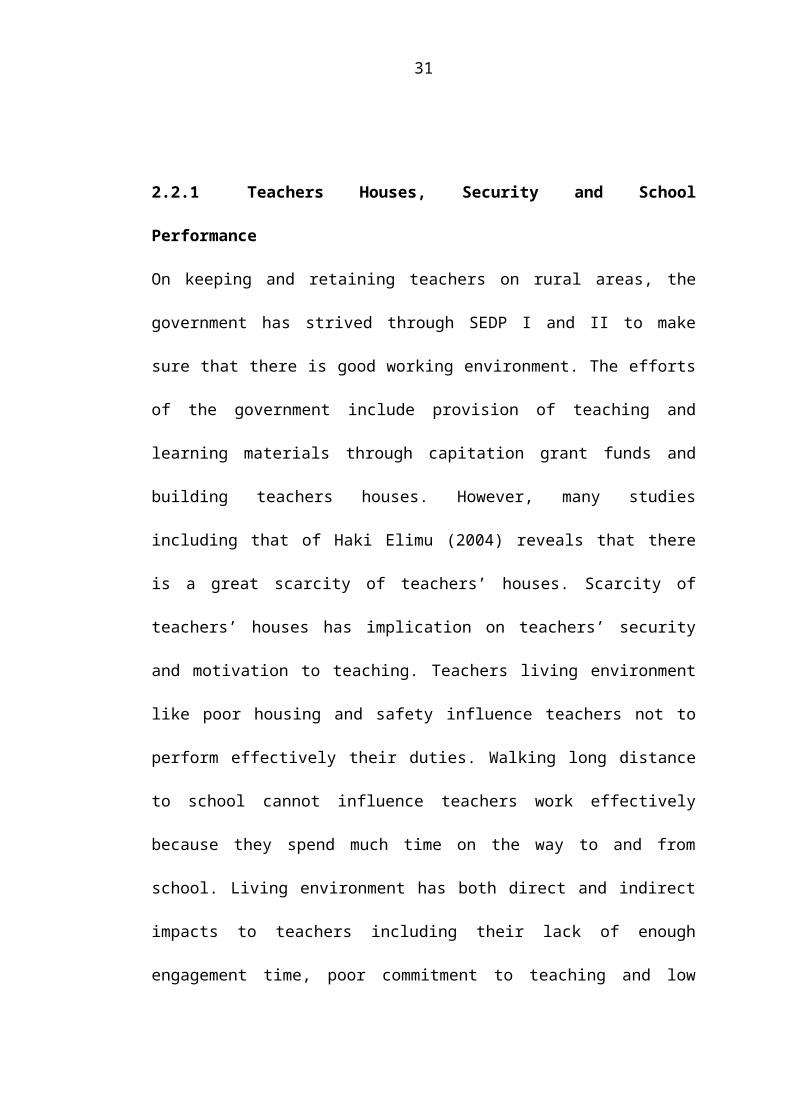
2.2.1 Teachers Houses, Security and School Performance
On keeping and retaining teachers on rural areas, the government has strived through
SEDP I and II to make sure that there is good working environment. The efforts of
the government include provision of teaching and learning materials through
capitation grant funds and building teachers houses. However, many studies
including that of Haki Elimu (2004) reveals that there is a great scarcity of teachers’
houses. Scarcity of teachers’ houses has implication on teachers’ security and
motivation to teaching. Teachers living environment like poor housing and safety
influence teachers not to perform effectively their duties. Walking long distance to
school cannot influence teachers work effectively because they spend much time on
the way to and from school. Living environment has both direct and indirect impacts
to teachers including their lack of enough engagement time, poor commitment to
teaching and low motivation and attitude to teach (Uwazi, 2013).
According to Haki Elimu (2007), low salaries paid to teachers do not assure them to
living security. Most teachers engage in extra economical activities including
facilitating tuitions to their students in school or outside school environment in order
18
to subsidize their income. Other teachers involve on small businesses around the
school campus or elsewhere. These additional economical activities reduce their
engagement time in classroom.
2.2.2 School Infrastructure and School Performance
The main task of school is to provide education which involves a series of programs
and activities. The successful conduct of these programs and activities depends
mainly upon availability of proper infrastructure in the school. School infrastructure
refers to things such as classrooms, desks, laboratories and the libraries. The term
physical infrastructure also stands for the physical facilities of a school. It refers to
buildings, grounds, furniture and apparatus along with equipments essential for
imparting education. A school should be set up in a suitable atmosphere. Its location
has enormous significance. It must have plenty of space with shady trees around, far
away from the noise of crowded city and polluting atmosphere. There should be a
calm and quite atmosphere which is conducive to teaching and learning. It should
have space, utility and attractiveness.
The school buildings should be attractive, have adequate lighting, comfortable
seating, useful service facilities such as library, multipurpose rooms, functional play
grounds, classrooms, chalk and bulletin boards, sinks, work areas filing and storage
space and lockers for pupils and teachers. According to Uwazi (2013), most of the
ward schools are located at the peripherals where school physical infrastructure and
that to the town centre is not deterministic. The difficulties in obtaining basic
services including tiresome travels to collect salaries and other basic needs
demoralize many teachers to work in ward schools.
19
2.3 Qualities of Teachers and School Performance
Teacher quality is the most important school-level determinant of student
performance, and school leadership focused on improving the motivation, capacities
and working environment of teachers is most likely to improve student learning.
School leadership makes a difference to student outcomes when it creates the right
environment for teachers to improve classroom practice and student learning. There
have been varied perspectives towards the concept of quality education in
developing countries; however, the need of the framework to describe the term for
issues of quality in education is badly needed (Anangisye, 2008). It is added that
despite the absence of consensus, quality issues at all levels of education depend
largely on quality of teachers who are products of quality education offered at
schools and colleges.
Teacher quality is described by different features including the academic
qualifications of a teacher before formal training in a college; teachers experience in
the field of teaching, competence in terms of masterly of the subject matter of a
stated curriculum and ability to enable students acquire knowledge and intended
skills; motivation of a teacher and creativity in the delivery of classroom lessons.
Leu (2004) enlists characteristics of good quality teachers as teachers possessing the
following; sufficient knowledge of subject matter to teach with confidence,
knowledge and skills in arrangement of appropriate and varied teaching
methodologies, knowledge of language of instruction, interest in the young learner,
ability to reflect on it. The teaching practice, ability to make changes as a result of
reflection, ability to create effective learning environment, understanding the
20

curriculum particularly new paradigm of teaching and learning once introduced,
good character, sense of ethics and personal discipline, ability to work with others
and to build a good relationship within the school and community.
The constitutes of teacher quality according to Fwu and Wang (2000) can be viewed
through teacher training, these include; content knowledge, pedagogical skills, the
ability to reflect and to empathize, managerial competence, commitment, moral
conduct, the ability to adjust and improvise, the capacity to collaborate with other
teachers, the ability to advance the profession of teaching, and to contribute to
society at large. Thus, Fwu and Wang (2000) suggest that the quality of teachers
should ultimately be evaluated in terms of his/her impact to his/her students’
achievement. In addition, Darling –Hammond (2000) viewed teacher quality as a
combination of characteristics such as certification status, education level,
experience, working and living conditions and professional development. Common
characteristics which cut across the above descriptions of teacher quality include
preparation programs for teaching a teacher underwent, sufficient knowledge of
subject matter, certification, understanding curriculum, experience, professional
development, collaboration with students and fellows teachers as well as motivating
aspect that continually shapes a teacher.
In the following part common characteristics that describe teacher quality are revised
one by one in relation to students’ achievement. The minimum qualification for the
secondary school teachers shall be diploma in education from reputable teachers’
colleges (ETP, 1995). Teachers should be good models in the teaching and learning
process. It is important to adhere to the following principles; reflection on the
21
learning process, patience, justice, feelings, understanding learning differences,
relationship, problem solving and mastery of the subject, discipline, interaction and
motivation (URT:TDMS 2008 pg. 2). National education policy stipulates on the
qualities of teachers and their abilities to teach being, “Diploma and Degree in
education for the secondary schools. Teachers with diploma in education are
expected to teach form I - II while those with degree in education are expected to
teach form III - VI (ETP, 1995:31)
2.3.1 Hiring of Teachers for Secondary Schools
Graduate trained teachers have to apply centrally in the Ministry of Education and
Vocational Training because the Ministry did not in the past recruit directly from the
training colleges. According to the Secondary Education Development Program II
(SEDP II) (URT, 2010) the teacher requirements for secondary education, Form I -
VI were estimated and gave a shortage of 28,581 while school enrolment changed
from about 1,020,510 in 2007 to 1,789,547 in 2011. There is a clear shortage of
teachers in science-based subjects, English, and mathematics at all levels. And the
critical shortages seem to be more prevalent at lower levels (O-levels) rather than A-
level due to mushrooming of new secondary schools with Form III and IV being
under severe pressure. This may in part explain the gross rate of students’ failure at
Form IV examinations.
According to Omari (2013), there have been a variety of different figures put
forward on how many teachers, usually the newly graduated ones, do not report to
their assigned schools each year. The newly graduate secondary schools teachers,
only 61percent took up their posts while 39 percent did not do so on time. Also
22
many teachers never report to difficult rural areas and that among more experienced
teachers there was considerable migration from rural and remote areas to urban
areas. By the estimate (URT, 2008), which is often suppressed, the shortages overall
were very big. The situation has not changed much but may have worsened in some
subjects, given the recent secondary school expansion associated with the
introduction of Ward Secondary Schools. The shortages of science teachers were
very severe in 2008, with physics and mathematics leading the demand. The
demands of the Ward Secondary Schools have undoubtedly exacerbated this demand
for teachers. A recent study completed by TAMASHA assessing 16 secondary
schools in Tanzania showed that students themselves are recommending increasing
the use of peer education to compensate for the shortage of teachers (TENMET,
2013).
2.3.2 Educational Levels of Teachers in Secondary Schools
According to Babyegeya, (2002), a significant number of teachers in developing
countries have low level of education before they are recruited and trained to become
teachers. Rural areas have more under-qualified teachers than urban areas. The effect
of under-qualified teachers is far reaching. The educational training level of
headmasters and headmistresses is hardly higher than that of their teaching staff.
When they come to orienting the new staff or carrying out managerial duties, they
are less confident, suspicious to advice from the staff and act offensively. Rivkin,
(2005) found out that bachelor degree plays a role in determining learners’
performance despite the studies that found out that teachers with master’s degrees do
not outperform teachers with bachelor degrees.
23

Such results contradicts Zhang (2008) who studied the effect of teacher education
level on student achievement and found out that those science teachers possessing
advanced degrees in science and education significantly influenced students’
achievements. Likewise, Darling (2000) found out characteristics such as
certification status and degree in the field to be taught being significantly and
positively related to student outcomes. Teachers’ level of education has negative
influence on students’ performance especially in rural ward secondary schools.
Professional development of teachers is long process that includes regular
opportunities and experiences planned systematically to promote growth and
development in the profession. Teacher Professional Development is described as a
process embracing all activities that enhance professional career growth. Komba and
Nkumbi, (2006) provides a definition that fits less advantaged contexts such as that
of Tanzania and says that, Teacher Professional Development is defined as a process
of improving both the teacher’s academic standing as well as acquisition of greater
competence and efficiency in discharging her/his professional obligations in and
outside the classroom.
In many developing countries, including Tanzania, and in some developed countries
as well, there are a number of teachers who begin to teach without having had any
prior training or preparation in the field. Some have received a degree in a field other
than teaching or education; some have only completed secondary education; others
have only completed primary education. In all of these cases, the majority of the
candidates entering the teaching profession are among the least qualified of all the
students who are entering the professional workforce.
24
Table 2.1: Secondary Schools Teaching Force by Qualifications and Levels in
Tanzania
Qualification Number of Teachers %
Degree 9,910 24.4
Diploma 22,171 54.7
Grade A 8 0.012
Untrained 8,436 20.8
TOTAL 40,525 100
Source: BEST, (2011).
2.3.3 Teachers Professional Training and Development in Secondary Schools
In order for a person to be regarded as a teacher, he or she should undergo some
training for a specified time. The teacher must get ample time to learn teaching skills
that will help him or her to teach well. The training should be long term. The
qualified teacher must be able to produce the desired outcomes on the part of
learners and he or she will enable learners to be active participants in the society.
Teachers have to be prepared psychologically before they join the teaching field.
Teachers’ development activities are subjected to innovations in technologies,
curriculum and political demands (Rodrigues, 2005). They either require in-service
training of long and short terms found in different forms. They include seminars,
workshops, conference, up-grading and short courses. Provision of such training are
geared towards teacher professional development and students’ academic
improvement.
In United States of America, many schools design staff development programs that
involve setting goals collectively and developing in-service training that supports
those goals, according to Swafford (1998) as quoted in Moon (2000). Despite the
25

little support for professional development at school level, teachers see the programs
as opportunities to advance academically, getting more skills, gaining competence,
updating curriculum changes and improving pupils’ academic performance. Experts
invited to facilitate seminars and prepare handouts are also not sufficient as they
need financial supports. Financial constraints in Tanzania has thus been claimed to
affect the provision of Teachers Professional Development, Komba (2007). There
are some teachers who completed lifelong career in teaching without benefiting from
any form of in-service educational programs. It is thus obvious that adding
knowledge of teaching subjects through re-training lead to mastery of subject matter
of a responsible teacher, Koda (2008).
More education and training generally add value to school because some tasks
require specialized training; higher academic qualifications normally improve
technical competencies and school performance, (Omari, 2013). Coleman, 1966,
Husen et al, 1987; Solomon 1987 clearly indicates that teacher quality does have a
positive impact on the level of academic achievement of students attending schools
in developing countries. Bacchus (1996) argues that the poorer the country the
greater the impact which teacher quality is likely to have on students achievement.
The quality of teaching depends, at least partly, to the pre-service and in-service
training teachers receive. Without in-service training seminars, discussions and
special training that offer new knowledge, teachers will not be able to cope with the
rapidly changing world.
2.3.4 Education Qualifications and Teaching Levels in Secondary Schools
Teaching levels as stipulated by ETP, (1995) requires that the minimum qualification
26
for primary schools shall be certificate of education grade IIIA and the minimum
qualification for a secondary school teacher shall be a diploma in education.
Moreover, a teacher with qualification of a diploma should be entitled to teach forms
one and two while a degree holder is entitled to teach forms three, four and above.
Studies done by (Omari, 2013) reveal that, most teachers in ward secondary schools
are diploma holders or crash programs teachers who are assigned to teach all forms,
one to four.
2.3.5 Teachers Experience and School Performance
According to Dembele and Lefoka, (2007), as cited in Bhalalusesa et al, (2011),
experience matters in reducing the amount of time spent on procedural matters in the
classroom and in restoring order, hence, providing more time for the teacher to
interact with students effectively. Teacher education is perceived as service activity
for the education system. It is a process through which prospective and in-service
teachers are enabled to acquire knowledge, attitudes, behaviors and skills they
require to perform their teaching tasks effectively in the classroom. The attainment
of quality education depends on, among other factors, the process of preparing
teachers in teachers’ colleges and Universities.
It is assumed that teacher education can make a difference to teachers’ pedagogical
knowledge and skills, which are in turn, reflected in students’ learning outcomes.
Strong teacher education programs pave the way for quality education. Babyegeya,
(2002) also noted that, experience can not cover the gap created by low education;
schools with teachers of higher post-secondary education have higher-achieving
students than schools under teachers who went through a crash program. This has an
27
implication on pre-service teacher training and make up training that can be provided
as in-service training. Also, this has implication on distribution mixture of teachers
according to type of pre-service and subsequent, in-service training.
Rivkin, Steven, et al, (2005) found out that quality differences between new and
experienced teachers account for five and twenty variances in mathematics
performance. Haycock (1998) and Goldhaber, (2002) in their research, however,
found that teachers experience has either very small or no effects on students
achievements. However, these studies do not disaggregate years of experience into
the first few years versus later years. Experience only matters up to a certain point of
time in the teaching field. That is to say for the first few years of teaching, teachers
follow the stated curriculum and later they go back to personal developed
approaches of handling the teaching and learning matters inside the classroom.
2.3.6 Teachers Efforts, Workloads and School Performance
According to Uwazi (2013), many teachers have big workload. They had too many
periods to teach, their classes were too large, and too many non-teaching activities
needed to be performed, most notably the marking of exercise books. Though the
workload of many teachers did not appear particularly high, partly because teachers
were not always fulfilling their expected or assigned roles and partly because
teachers were on occasion, engaged in other income generating activities. Most
teachers were not willing to take on heavier workloads because they felt that they
were not being treated fairly. What matters most is how teachers and pupils make
use of the resources available to promote teaching and learning. In urban areas, many
teachers are underutilized and work below 50 percent of the required periods per
28
week due to oversupply while in rural areas they are overworked. Teaching loads
should be investigated further to determine if greater efficiency is possible. Omari
and Sumra (2001) observed that a range of 12 periods per week to 60, with
variations between urban and rural schools and no variation by teacher qualification
and experience in the distribution of the load.
2.3.7 Teachers Time on Task and School Performance
Time-on-task refers to the amount of time students spend attending to school-related
tasks (Prater, 1992), such as following directions and engaging in learning activities.
Time-on-task is also sometimes referred to as “engaged time.” Studies indicate that
up to 50 percent of the school day is spent on non-instructional activities in general
and special education classrooms (Good, 1983), leaving ample room for
improvement in the area of time management. While there is some relationship
between time-on-task or engaged time and student achievement, simply increasing
the amount of time available for instruction is not enough to achieve learning gains.
Time allocated for instruction must be appropriate; that is, at the appropriate
instructional level for students and delivered in a way that is effective, efficient,
meaningful, and motivating to students.
It is important to keep in mind that most studies have measured allocated time (time
students are required to be in class), and only a small number of studies have
attempted to measure engaged time (time students participate in learning activities)
and academic learning time (time when true learning occurs) (Aronson, Zimmerman,
& Carlos, 1998). However, findings from those studies tend to support a moderate
relationship between engaged time and achievement and an even larger relationship
29

between academic learning time and achievement, Cotton & Wikelund, 1990.
AERC (2011) complying with Slavin (2006), reported that more than half of the
teachers in school were not in the classroom teaching and that children are taught at
most two hours per day, which translates into three periods per day. Another issue is
how long teachers actually teach when in classroom. Even in developed countries,
many teachers only teach for about 70 per cent of the time they spend in the
classroom. The informal observations suggest that teaching occurs for less than 70
per cent in Tanzania classrooms with the first and last 10 minutes being used for
instruction and assigning homework. Teachers spend very fewer minutes teaching in
the class and spend few hours in actual teaching per day, as few as two and a half
hours, and pupils spend fewer days in school, 194 days as compared to over 200
days in many countries, especially in Asia.
2.3.8 Teachers Job Satisfaction and School Performance
Mullin (2005) contends that job satisfaction is more of an attitude or internal state
associated with personal feelings of achievement, accomplishment, either in a
quantitative or qualitative sense; being recognized and encouraged to do even more.
Hall (2010) adds that job satisfaction is the feeling of pleasure that arises from
individual impressions about the job at hand. Schuller (1983) argues that motivation
raises the morale for work, reduces absenteeism, increases innovation and creativity
in doing the work and ultimately motivation results in more productivity, high
quality and loyalty.
According to Omari (2013), there are lines of thinking which have to do with two
great concepts in the work place, which are job satisfaction and job motivation.
30
Which one comes first is controversial, the relationship between them is complex but
there is no doubt that there is symbiotic or dialectical relationship between the two,
and that all employers would like to maximize the two parameters of human
behaviors. In addition, teacher motivation is anything done to make teachers happy,
satisfied, dedicated and committed to bring out their best in their places of work.
Haki Elimu and TTU (2004) and Bennel and Mukyanuzi (2005) have shown that job
satisfaction and motivation among teachers is low at all levels. This low job
satisfaction is bound to affect the quality of education provided in the country.
Several factors have been addressed to have affected teachers. The said revealed
factors include poor working environment to most schools that are located in the
rural areas, low salaries paid to teachers as compared to other professions. Like other
workers, teachers need motivation to maximize their production. Okumbe (1998)
examined four theories that could be used to explain what motivated teachers. One
of those theories is the Herzberg two-factor theory extended from Maslow’s
hierarchy of need theory. The theory explains factors that motivate individuals at
both high-order and low-order need. With high need theory equated them to
motivators while low needs are referred to as demotivators.
Teachers are motivated if working conditions are secured as well as their payments.
Etsey (2005) examined the job satisfaction of California public school teachers in
USA and found out that one of the overall job predictors was salary one earned from
it. Similarly a study by Lockheed, (1991) indicated that lack of motivation and
professional commitment produce poor attendance and unprofessional attitudes
towards students which in turn affect the performance of students academically.
31
Mbwambo, (2005) found that teachers’ salaries affected students’ academic
performance since salaries were low and paid late. In schools where teaching and
learning materials and accommodation for teachers were available, it was found that
teaching was efficiently and effectively done and thus enhanced students’ academic
performance.
2.3.9 Teachers Sex, Age, Experience and School Performance
Omari, (2013) noted that diversity of skills and optimum mix of teachers is very
important. Education is a complex enterprise requiring many skills, both in subject
areas and in managerial terms. It is important to have a gender mix, different levels
of cognitive ability and aptitudes, an inclusive approach to ethnic diversity and
disabilities and a variety of interests. Education services are delivered best when
there is an optimal and appropriate mix of teachers.
Omari, (2013) also noted that no organization wants to be staffed with only the older
or younger generation. A combination of the two is important to take advantage of
experience of older people. The absence of good mix can cause the productivity and
efficiency problem. In addition to that, more education and training generally add
value and some tasks require specialized training and higher academic qualifications.
In ward secondary schools there are not enough teachers with a good mix. Therefore,
quality of teachers is an optimal and appropriate mix of teachers in the line of
experience, qualification, education level, training, gender, confidence and
competence, commitment, cultural and social awareness. Most of ward secondary
schools do not have such mix of teachers resulting into increasing rate of students’
failure. For children it is important that they are taught both by male and female
32
teachers. It is especially important to have female teachers in rural areas to be role
models for girls.
2.4 The Knowledge Gap
The reviewed literatures have attempted to immensely look into quality of teachers
and school performance in secondary schools in general. Many studies have
concentrated on investigating factors for students’ failure in secondary schools.
Despite a great deal of studies on related area, none of the studies has investigated
the quality of teachers and school performance in urban and rural secondary schools.
Therefore, it is in the light of these studies the researcher explores the “Quality of
Teachers and School Performance in Urban and Rural Secondary Schools.”
33

CHAPTER THREE
3.0 RESEARCH METHODOLOGY
3.1 Introduction to the Chapter
This chapter explains techniques and procedures which were used to obtain and
analyze data in order to address the research objectives. The chapter includes
research paradigm and design, area of study, justification for selecting the study area,
target population, sample and sampling procedure, data collection methods and
instruments for data collection, procedure for data collection and data analysis
strategy.
3.2 Research Paradigm and Design
According to Taylor, Kermode, and Roberts (2007), a paradigm is a broad view or
perspective of something. Additionally, Weaver and Olson’s (2006) definition of
paradigm reveals how research could be affected and guided by a certain paradigm
by stating that paradigms are patterns of beliefs and practices that regulate inquiry
within a discipline by providing lenses, frames and processes through which
investigation is accomplished. Research design is the conceptual understanding and
arrangement for collection and analysis of data in a manner that aims to combine
relevance to the research purpose with economy in procedures.
Moreover, is a conceptual structure within which research is conducted? It
constitutes the basis for the blue print for the collection, measurement and analysis
of data (Kothari, 2004). The researcher used a survey research design in order to
obtain information concerning quality of teachers and how they contribute to school
performance. Leedy and Ormrod (2001) ascertain that survey design is suitable for a
34
descriptive research since it examines the situation as it is. This design was preferred
due to its advantage of fact finding with adequate and accurate interpretation of the
findings and description of what actually exist.
3.3 Area of Study and Justification
Area of study is a place where data are to be collected (Franfort, 1996). The study
was conducted within Tanzania mainland, mainly in Arusha Region. Specifically,
the study was undertaken in Monduli district. Monduli district is one of the five
districts of Arusha Region of Tanzania. It is among the districts that are growing in
terms of its population hence increase in schools and increase in demand of more
teachers. Urban areas attract more workers due to availability of basic services which
are insufficient in rural areas. According to the 2002 Tanzania National Census, the
population of the Monduli District was 185,237 people. Overall, the literacy rate in
Monduli district is 45 percent, however, there are noticeable differences across
gender, (for instance women literacy level is 35 percent), poverty status and area of
residence (GoT, 2005).
The district economic level is 51 percent, in which the poverty rate is significantly
higher in rural than in peri-urban areas (EDI, 2005). Thus most of the households
have a consumption level below the Basic Need Poverty Line leading to high level
of child labour. The culture of Monduli district is dominated by Maasai culture
because it is a native tribe in the district. Maasai people are pastoralists who move
with their livestock (cattle) from one place to another. Recently, they start to practice
semi-sedentary farming system. Purposively, the researcher focused the study on
eight purposively selected secondary schools in Monduli district. Monduli district
35
was selected for the study because it is among the districts which have urban and
rural secondary schools that had experienced poor school performance, thus would
be a representative in giving a clear picture of causes of the problem. Another reason
considered was that Monduli district is one of the district which are at peripherals,
thus would give the answers to the study.
3.4 Target Population, Sample and Sampling Procedures
3.4.1 Population of the Study
According to Best (2003), described population as any group of individuals who
have one or more characteristics in common, that are of interest to the researcher.
Therefore, the total target population of this study comprised of 277 teachers in 19
secondary schools found in Monduli district. These had been selected because they
were considered to have necessary information that would meet the objectives of the
study.
3.4.2 Study Sample
According to Kothari (2007), the size of the sample will depend on the nature of the
universe, number of classes proposed, nature of study, type of sampling, standard of
accuracy required, availability of finance and time constraint. Eight secondary
schools were drawn from a population of 19 secondary schools from Monduli
district by purposeful sampling method. The guiding principle was that, the two most
performing schools and the two poorly performing schools were selected
purposefully from both rural and urban secondary schools. The schools selected
provided heads of schools and academic teachers as respondents. In this study, the
sample constituted 8 head of schools and 8 academic teachers respectively from 8
36
secondary schools located at Monduli district who represented the entire population
277 teachers. The table below describes the proportion of sample selected from the
population of 277 teachers in the selected schools.
Table 3.1: Description of the Sample Size
School Name Characteristics
S/
No
School Locatio
n
Number of Teachers
in Highly
Performing Schools
Number of Teachers
in Poorly Performing
Schools
1. Moringe Urban 25 -
2. Nanja Urban 32 -
3. Moita Rural 22 -
4. Lowassa Rural 36 -
5. Engutot
o
Urban - 54
6. Irkisong
o
Urban - 57
7. O,lengai Rural - 19
8. Oltinga Rural - 32
Total 115 162
Source: Monduli District Education Office, 2013
3.4.3 Sampling Techniques
Sampling technique refers to a plan for obtaining a sample from a given population.
It is the procedure the researcher would adapt in selecting items for the sample
(Kothari, 2004). The researcher employed purposeful sampling methods. This is a
type of non-probability sampling technique. Non-probability sampling focuses on
sampling technique where the units that are investigated are based on the judgment
37

of the researcher. In this non-probability sampling design, a purposeful sampling
method was used to select heads of schools and academic teachers.
3.5 Research Instruments
According to Migendi (1999), research instrument refers to the technique or
methodology used in data collection. In this study, check list and school records
were used to obtain required information for the study. These instruments were
designed in such a way that they possessed validity, reliability, consistency and
accuracy of respondents’ responses so as to elicit valid information from them.
3.5.1 Checklist for Schools Infrastructure
A checklist is a comprehensive list of important or relevant actions, or steps to be
taken in a specific order or is a type of informational job aid used to reduce a failure
by compensating for potential limits of human memory and attention. It helps to
ensure consistency and completeness in carrying out a task. These instruments were
used to collect some information from heads of schools or academic masters. (See
Appendixes A, B1 and B2)
3.5.2 School Records Review
School records refers to various extracts found in offices or places dealing or
associated with the issue relating to what the researcher is investigating (Miles,
1996). The school records that were reviewed included teachers qualification form,
teachers load distributions, students performance records for the year 2010 and 2014
and school infrastructure information. The data obtained from that instrument were
compared with responses obtained from checklist for school infrastructure for the
purpose of triangulating the information.(See Appendix A,B1 and B)
38
3.5.3 Strength of the Research Instruments: Validity and Reliability
Prior to main survey, the instruments were pre-tested on a smaller sample of
respondents. The findings of the pre-test were used for reviewing the instruments.
Questions that did not yield useful information were revised or discarded. In order to
ensure validity and reliability, the following were undertaken; To ensure validity,
research instruments were given to experts and made some correction before the
final copy was taken to the field. From the obtained comments, the instruments were
validated according to relevance, accuracy and coverage of the study. To ensure
reliability, the interview questions were written in English language because the
interview was to be done in English language. The instruments that were used for
data collection was test-retested in order to ensure their reliability. This was achieved
by administering the instruments to a pilot school in the area of study but was not be
included in the main study.
Table 3.2: Observation Schedule
Data Sought Respondents Instruments UsedWorking environment of teachers
Heads of schools Checklist
Qualities of Teachers Heads of schools School records Teaching/learning facilities and school infrastructure
Heads of schools Checklist
School records and performance Heads of schools School Records
Source: Researcher’s Data, 2015
3.6 Data Collection Techniques
Bernard (1973) strongly suggested using more than one data collection technique.
39

He postulated that no single instrument is relatively superior to the others. Every
technique for collecting data has strengths and limitations. Therefore using different
methods for collecting data has a probability of giving more consistent and
convincing data. The data and information were a result of a survey carried out in 8
secondary schools from four wards. The researcher used guided checklist questions
and schools records to probe the respondent’s information regarding the objectives
of the study.
3.7 Ethical Issues Consideration
Leeds (2002) categorized ethical issues in research into groups. These are protection
from harm, honesty with professional colleagues, right to privacy and informed
consent. Others are anonymity and confidence. Omari, I.M. (2011) propounded that
research is supposed to be clean sophisticated business. It is therefore of outermost
importance that research should be conducted with the highest standards of moral
and ethical considerations. The researcher first secured a clearance letter from the
office of Research and Postgraduate Studies on behalf of Vice Chancellor, OUT.
That allowed the researcher to go to the regional Administration Secretary for
Research Approval, who wrote a letter of introduction to MEO of Monduli District
Council.
The MEO issued the permit letter which allowed to a researcher to go through the
selected secondary schools. The selected respondents were informed about the study
and its purpose to obtain their consent. Then, assured confidentiality and anonymity
so that their information was not to be disclosed or published without their
permission. Lastly, a number of other scholars’ works were consulted; these include
40
books, journals, articles, dissertations, newspapers and report internet sources. The
researcher acknowledged all scholars’ works and data consulted accordingly.
CHAPTER FOUR
4.0 DATA ANALYSIS AND PRESENTATION
4.1 Introduction to the Chapter
During and after collection of information from the field, data were coded by the
researcher and thereafter were entered into the computer using SPSS and MS excel
software. This yielded presentable information in form of percentages, bar graphs,
pie charts and tables. Data were analyzed and the findings were discussed in
different sections according to the research questions for the study.
Therefore, data analysis intended to derive descriptive statistics by classifying,
organizing and summarizing the data into tables, charts and graphs accordingly. In
addition, data analysis lead to the development of inferences from the findings and
provided room for decision making on interested bodies in the community as well as
the whole country for the better improvement of education sector. Data coding was
done simultaneously with data collection, data interpretation and report writing. In
order to maintain internal validity, consistency, reliability and accuracy, the
researcher constantly compared data from checklist with that obtained from schools
records, and lastly, logical conclusions were drawn.
4.2 Teachers Working Environment in Secondary Schools
Table 4.1 below shows infrastructure and facilities in the surveyed schools in terms
41
of the number of infrastructure and facilities required, available, shortage and the
quality. The infrastructures and facilities surveyed were classrooms, staff rooms,
administration blocks, libraries, laboratories, blackboards, notes boards, desks, store
rooms, office chairs and tables, cupboards, toilet holes, play grounds, teachers
42

houses, dining halls, dormitories and assembly halls. Table 4.2 gives the summary of all infrastructures and facilities in those schools
surveyed.
Table 4.1: Infrastructures and Facilities in the School Surveyed
SCHOOL
CLASS ROOMS STAFF ROOMS ADMINISTRATI-ON BLOCKS SCHOOL LIBRARY
RE
QU
IRE
D
AV
AIL
AB
LE
SHORTAGE
QUALITY
RE
QU
IRE
D
AV
AIL
AB
LE
SHORTAGE
QUALITY
RE
QU
IRE
D
AV
AIL
AB
LE
SHORTAGE QUALITY SHORTAGE
QUALITY
%
V.G
OO
D
GO
OD
POO
R
%
V.G
OO
D GO
OD
POO
R
%
V.G
OO
D
GO
OD
POO
R
RE
QU
IR
ED
AV
AIL
AB
LE
%
V.G
OO
D
GO
OD
POO
R
MORINGE 23 19 04 17 V 01 01 - - V 01 01 - - V 01 01 - - V
NANJA 14 8 6 43 V 1 1 - - V 1 1 - - V 1 0 1 100
V
MOITA 12 8 4 33 V 1 1 - - V 1 1 - - V 1 1 - - V
LOWASSA 18 15 3 17 V 1 0 1 100 - - - 1 0 1 100 - - - 1 0 1 100
V
ENGUTOTO
20 17 3 15 V 1 1 - - V 1 1 - - V 2 0 2 100
V
IRKISONGO
22 20 2 09 V 1 1 - - V 1 1 - - V 1 1 - - V
KIPOK 12 9 3 25 V 1 1 - - V 1 0 1 100 V 1 0 1 100
- - -
OLTINGA 12 12 - - V 1 1 - - V 1 1 - - V 1 1 - - V
TOTAL 133
108
22 17 V 8 7 1 13 V 8 6 2 25 V 9 4 5 56
Source: Head of schools, 2015
43
SCHOOL
SCHOOL LABORATORY BLACKBOARDS NOTES BOARDS DESKS
RE
QU
IRE
D
AV
AIL
AB
LE
SHORTAGE
RE
QU
IRE
D
AV
AIL
AB
LE
SHORTAGE
QUALITY
RE
QU
IRE
D
AV
AIL
AB
LE
SHORTAGE
QUALITY SHORTAGE QUALITY
%
V.G
OO
D
GO
OD
POO
R
%
V.G
OO
D
GO
OD
POO
R
%
V.G
OO
D
GO
OD
POO
R
RE
QU
IRE
D
AV
AIL
AB
LE %
V.G
OO
D
GO
OD
POO
R
MORINGE 3 1 2 67
V
23 19 4 17
V
2 1 1 50 V 650 680 - -
VNANJA 3 3 - -
V
14 8 6 43
V
4 2 2 50 V 548 533 15 3
VMOITA 3 3 - -
V
12 8 4 33
V
3 1 2 67 V 465 480 - - V
LOWASSA 3 3 - -
V
15 15 - -
V
2 2 - -
V
700 700 - -
VENGUTOTO
4 3 1 25
V
20 17 3 15 V 3 3 - - V 750 750 - - V
IRKISONGO
3 1 2 67
V
22 20 2 9
V
4 4 - -
V
891 800 91 10
VKIPOK 3 2 1 33
V
12 9 3 25
V
2 1 1 50 V 420 430 - - V
OLTINGA 3 1 2 67
V
12 12 - -
V
2 2 - -
V
350 350 - -
VTOTAL 25 17 8 32 130 108 22 17 22 16 6 27 4774 4723 106 2
Source: Head of schools, 2015
44
SCHOOL
STORE ROOMS OFFICE CHAIRS CUPBOARDS TOILETS
RE
QU
IRE
D
AV
AIL
AB
LE
SHORTAGE
RE
QU
IRE
D
AV
AIL
AB
LE
SHORTAGE
QUALITY
RE
QU
IRE
D
AV
AIL
AB
LE
SHORTAGE
QUALITY SHORTAGE
QUALITY
%
V.G
OO
D
GO
OD
POO
R
%
V.G
OO
D
GO
OD
POO
R
%
V.G
OO
D
GO
OD
POO
R
RE
QU
IRE
AV
AIL
AB
LE %
V.G
OO
D
GO
OD
POO
R
MORINGE
2 1 1 50
V
30 25 5 17
V
10
6 4 40
V
12 6 6 50
VNANJA
3 1 2 67
V
35 32 3 9
V
3 4 2 67
V
44 24 20 45 V
MOITA
3 1 2 67
V
30 27 3 10
V
8 5 3 38
V
18 14 4 22
VLOWASSA
2 2 - -
V
49 12 37 76 V 9 3 6 67
V
20 13 7 35
VENGUTOTO
3 3 - -
V
61 50 11 18
V
3 1 2 67 V 30 24 6 20
VIRKISONGO
3 3 - -
V
69 37 32 46
V
9 6 3 33
V
45 34 11 24
V
KIPOK
2 1 1 50 V 26 30 6 23
V
4 2 2 50
V
20 12 8 40
VOLTINGA
2 1 1 50
V
28 14 14 50
V
4 3 1 25
V
28 28 - -
V
45

TOTAL
20 13 7 35 328 227 111 34 50 27 23 46 254 155 61 24
46
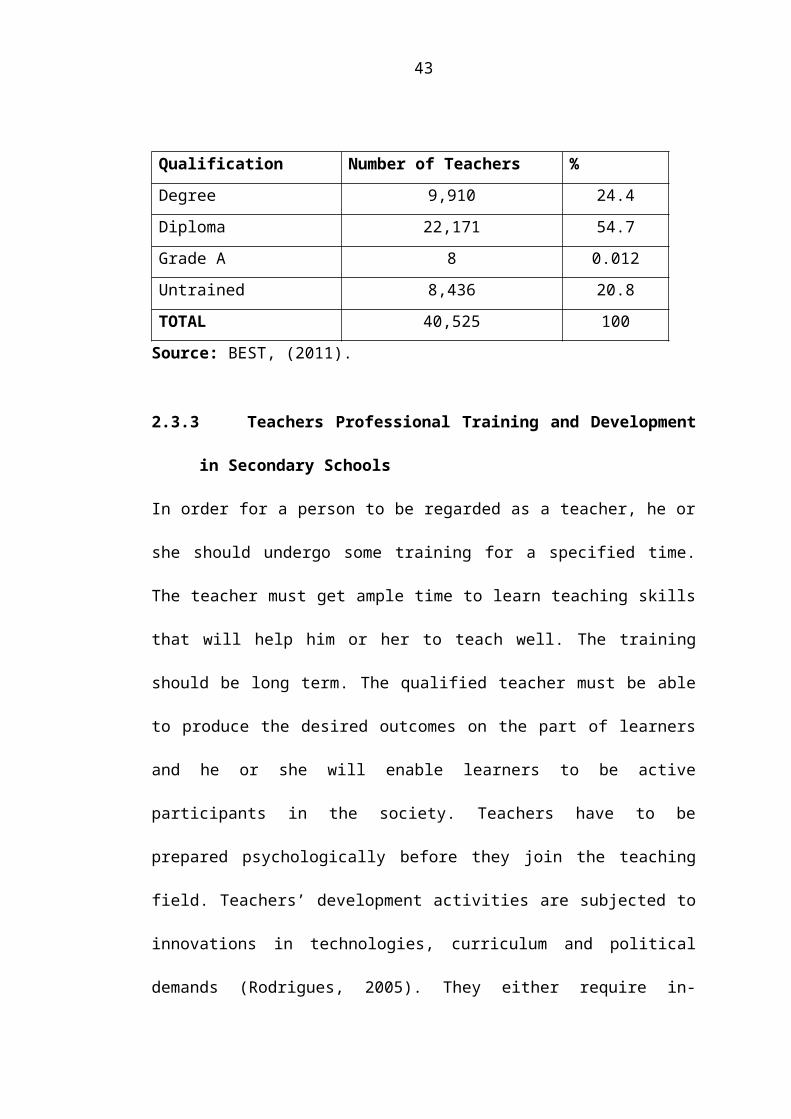
SCHOOL
PLAY GROUNDS TEACHERS HOUSES DINING HALLS DOMITORIESR
EQ
UI
AV
AIL
SHORTAGE
RE
QU
IA
VA
IL
SHORTAGE QUALITY
RE
QU
IA
VA
IL
SHORTAGE QUALITY SHORTAGE QUALITY
%
V.G
OO
D
GO
OD
POO
R
%
V.G
OO
D
GO
OD
POO
R
%
V.G
OO
D
GO
OD
POO
R
RE
QU
IRE
D
AV
AIL
AB
LE %
V.G
OO
D
GO
OD
POO
R
MORINGE 5 2 3 60
V
25 22 3 12
V
1 1 - -
V
11 10 1 9
VNANJA 5 3 2 40
V
30 6 24 80
V
1 1 - -
V
12 5 7 58
VMOITA 5 3 2 40
V
30 10 70 67 V 1 1 - -
V
4 3 1 25
VLOWASSA 5 3 2 40
V
21 8 20 71
V
1 1 - -
V
9 7 2 22
VENGUTOTO 8 6 2 25
V
61 6 55 90 V
V
1 1 - -
V
10 8 2 20
VIRKISONGO
4 0 4 100
V
54 7 47 87
V
1 0 1 100
-
- 11 6 5 45
VKIPOK 5 3 2 40 V 26 4 22 85
V
1 1 - -
V
4 3 1 25
VOLTINGA 4 1 3 75
V
28 6 22 79
V
1 0 1 100 -
-
- 4 3 1 25
VTOTAL 51 21 21 41 282 69 213 76 8 6 2 25 65 45 2
03
Source: Head of schools, 2015
47

Table 4.1: Infrastructures and Facilities in the School Surveyed (cont…)
SCHOOL
ASSEMBLY HALLS
RE
QU
IRE
D
AV
AIL
AB
LE
SHORTAGE
%
V.G
OO
D
GO
OD
POO
R
MORINGE 1 0 1 100 - - -NANJA 1 0 1 100 - - -MOITA 1 0 1 100 VLOWASSA 1 1 - - VENGUTOTO 1 0 1 100 - - -IRKISONGO 1 0 1 100 - - -KIPOK 1 0 1 100 - - -OLTINGA 1 0 1 100 - - -TOTAL 8 1 7 88 - - -
Source: Head of schools, 2015
4.2.1 Infrastructures and Facilities in the Surveyed Schools
Table 4.2: Summary of Infrastructure and Facilities Required, Present and
Quality in SchoolsS/No
Infrastructure/Facilities
Req
uire
d
Ava
ilabl
e
in %
Shor
tage
in %
Quality when Available
V. Good Good Poor
1. Classrooms 133 39% 61% 12.5% 75% 12%
2. Staff rooms 08 28% 72% 25% 62% 26%
3. Administration Block 08 38% 62% 25% 50% 25%
4. School library 08 15% 85% 0% 37% 62%
5. School laboratories 24 38% 62% 25% 62.5% 12.5%
6. Classroom blackboards 130 41.5% 58.5% 25% 62.5% 12.5%
7. Notes boards 22 36.5% 63.5% 37.5% 62.5% 00%
8. Desks 4774 49% 51% 50% 50% 00%
9. Office chairs and tables 328 33.1% 66.9% 12.5% 62.5% 25%
10. Cupboards 50 28.7% 71.3% 37.5% 62.5% 00%
11. Toilets 254 36% 64% 25% 62.5% 12.5%
12. School play grounds 51 30% 70% 25% 50% 25%
13. Teachers houses 282 12% 88% 12.5% 75% 12.5%
14. Dining Halls 08 33.3% 66.7% 25% 37.5% 37.5%
15. Dormitories 65 38% 62% 14.3% 71.4% 14.3%
48
16 Assembly Halls 08 11.1% 88.9% 23.5% 30.5% 46%
Source: Head of Schools, (2015)
4.2.2 Status of Teachers Houses in Secondary Schools
From the summary Table 4.1 in all surveyed schools the available houses for
teachers was 12% and the shortage was 88%. However the respondents rated the
quality of such houses as 12.5% of very good, 75% good and 12.5 poor. From the
findings it’s obvious that many schools are short of teachers houses although the
available few are generally of good condition. Lack of teachers’ houses perhaps is a
limiting factor to teachers effective working especially when living far from their
work environment.
4.2.3 Water Availability and Distance from Teachers Working Stations
The study findings revealed that that 42.9% of the respondents claimed that water
was ‘Available in short distance’, 28.6% claimed water was ‘Available in Moderate
distance’ while 28.6% claimed that water was ‘available in a long distance’.
However from the respondents the quality of the available water was rated as 20%
very good, 20% good while 60% very poor. Form the findings it can be concluded
that although water was accessed in different distance in teachers working
environment but still is was suspicious quality, a factor a undermining teachers
preference in settling and working in such environment.
4.2.4 Heath Service and Distance from Teachers Working Stations
Of all the respondents 87.5 claimed that health services were available in teachers
working environments, while only 12.5% claimed that a dispensary or healthy
service was not available. However on the quality of available healthy services,
49
42.9% of the respondents claimed the service to be very good, 28.6% claimed good
and 28.6% claimed very poor. From the findings researcher realized that a
dispensary or health service was almost available in all teachers working
environments with moderately good quality. Therefore teachers’ access to health
services was not a major problem among the surveyed schools.
4.2.5 Access to Roads and Distance from Teachers Working Stations
With regards to access to roads, 50% of the respondents claimed that the access to a
road was ‘less than ½ kilometers, 25% claimed access to a road was ‘less than 1km’
while 25% claimed that access to road was ‘more than 2 kilometers’. From the
findings, majority of the schools were located near to major roads and that teachers
and students could easily access roads whenever they needed to go to other areas in
search of different services.
4.2.6 Availability of Electricity in Teachers Working Stations
Majority of the respondents that is 87.5% claimed that there was electricity in
teachers working condition while only a few of them that is 12.5% claimed that there
was no electricity in the secondary schools they were working in. From the findings
the researcher realized that electricity was not a stumbling block for teachers to work
in different secondary schools.
4.3 Qualification of Teachers in Secondary Schools
4.3.1 Teachers Gender in Secondary Schools
50
Figure 4.1: Teachers Gender
Table 4.2: Summary of Teaches Qualifications in Schools Surveyed
SCHOOLS
NO. OF TEACHERS
SEX AGETRAINING QUALIFIC
ATION
EDUCATION LEVEL
TEACHING EXPERIENC
E
TEACHING GRADE
NO. OF TEACHIN
G SUBJETS
TEACHING LOAD PER
WEEK
M F
BE
LO
W 3
0 Y
RS
30-4
0 Y
RS
41-5
0 Y
RS
51+
YR
S
ED
UC
AT
ION
OT
HE
RS
CE
RT
IFIC
AT
E
DIP
LO
MA
DE
GR
EE
MA
STE
RS
0-10
YR
S
11-2
0 Y
RS
21+
YR
S
CD E
TW
O S
UB
J-E
CT
10-1
9 PE
R IO
DS
20+
PER
IOD
S
MORINGE
20 16
04
01
07
05
07
17
03
- 12
-08
- 05
09
06 12
08
- 11
09 - 02
18
NANJA
31 16
15
13
18
- - 31
- - 17
14
- 31
- - 17
06
08 12
19 02
04
25
MOITA
22 17
05
10
12
- - 22
- - 08
14
- 21
01
- 06
15
01 04
18 04
14
04
LOWASSA
48 34
14
32
15
01
- 48
- 02
29
17
- 42
06
- 06
15
01 17
31 05
27
17
ENGUTOTO
55 25
30
15
38
02
- 55
- - 20
34
01
46
09
- 11
40
04 03
52 - 42
13
IRKISONGO
22 08
14
07
14
01
- 22
- - 07
15
- 19
02
- 06
16
- 02
20 02
17
03
KIPOK
21 12
09
17
04
- - 21
- - 10
11
- 21
- - 11
10
- 11
10 01
20
-
OLTINGA
12 09
03
05
07
- - 12
- - 10
02
- 11
01
- 10
02
- - 12 06
06
-
TOTAL
231 137
94
100
115
09
07
228
03
02
113
115
01
196
28
06 79
112
15 60
171 20
132
80
% 100 59
41
43
50
04
03
98.7
01
0.9
49
50
0.4
85
12
03 34
48
06 26
74 09
57
35
Source: Head of Schools, 2015
Figure 4.1 show that there were more male teachers (58%) than female teachers
(42%). Male teachers outnumbered the female teachers by 16% in the study area.
Teachers' Gender
Female42%
Male58%
51

This means that the teaching profession is still male dominant although there is a
gradual but steady increase of female teachers into the profession. Figure 4.2, shows
that most teachers were between 25 – 34 years. This perhaps is due to the increased
employment of teachers to meet the increased number of students in the newly
opened ward secondary schools. However teachers with age range above 50 years
were mostly found in private secondary schools whereby majority of these teachers
were retired.
4.3.2 Teachers Age in Secondary Schools
Figure 4.2: Teachers Age
Figure 4.2: Teachers Age in Secondary Schools
4.3.3 Teachers Education Level in Secondary Schools
5%
34%40%
12%
2% 4%1% 2% 1%
0%
10%
20%
30%
40%
50%
20 - 24 25 - 29 30 - 34 35 - 39 40 - 44 45 - 49 50 - 54 55 - 59 60 - 64
Teachers' Age
52
Figure 4.3: Teachers Education Level
From Figure 4.3 shows that majority of teachers were degree holders (51%)
followed by diploma holders (48%) while masters degree holders were only 1%.
Higher percentage of first degree holders could be attributed to increased access to
higher education through either increased institution for higher learning or access to
higher education loans.
4.3.4 Teachers Training Qualification
Figure 4.4: Teachers Trained Qualification
Figure 4.4 shows that 99% of all teachers were trained specifically into teaching
Teachers' Education Level
Degree51%
Master's Degree1%
Diploma48%
Teachers' Trained Qualification
Non Educational1%
Education99%
53
profession while only 1% of teaching staff were not trained as professional teachers.
This means that almost all the teacher staff was qualified teachers meaning the
teaching profession is self sufficient.
4.3.5 Teachers Teaching Experience in Secondary Schools
Figure 4.5: Teachers Teaching Experience in Years
From Figure 4.5 shows that, 31.2% of teachers had less than two years in the
teaching profession and 25.9% had taught for 3 – 5 years. This situation implies that
in many ward schools newly employed teachers were lacking mentorship from
senior teacher. On the other side the high number of less experienced teacher could
attribute to newly opened ward secondary schools which needed high number of
teachers.
4.3.6 Teachers Salary Scale in Secondary Schools
Teachers' Teaching Experince in Years
31.2%
25.9%
19.5%
13.7%
4.9%
1.5%
0.5%
1.5%
1.0%
0.5%
0% 5% 10% 15% 20% 25% 30% 35%
0 - 2
03 - 05,
06 - 08,
09 - 11,
12 - 14,
15 - 17
18 - 20
21 - 23
27 - 29
30 >
Year
s
54
Figure 4.6: Teachers Salary Scale
From Figure 4.6 shows that majority, 54% of teachers were in ‘D’ scale, 38% were
in ‘C’ scale, while only 8% of the teaching personnel were in ‘E’ scale. This implies
that most of the teachers in secondary schools are in low grades hence their income
is also low. Perhaps this is the reason of poor academic performance in secondary
schools since these teachers lack motivation.
4.3.7 Teachers Teaching Subjects in Secondary Schools
Teachers' Salary Scale
D54%
E8% C
38%
55
Figure 4.7: Proportion of Teachers Teaching Each Subject (N=277)
Figure 4.7 shows that there were more English teachers (12%), followed by
Mathematics (6.3%), while Geography and Kiswahili both were (5.9%) of teachers
in terms of a single subject teaching. The rest of the teachers were teaching more
than one subject combination whereby History/Geography were taught by 8.3% of
teachers followed by History/Kiswahili with 7.8% and Biology/Chemistry 6.8% of
teachers. However 0.5% was for subjects such as Commerce, Book-keeping and
Teachers' Teaching Subjects
3.9%
5.9%
2.4%
6.3%
5.9%
2.4%
0.5%
2.0%
12.7%
2.9%
2.4%
8.3%
7.8%
1.5%
0.5%
1.5%
6.8%
1.0%
2.9%
2.0%
3.4%
3.9%
2.9%
1.5%
0.5%
2.9%
0.5%
0.5%
0.5%
2.4%
1.5%
0% 2% 4% 6% 8% 10% 12% 14% 16% 18% 20%
History
Geography
Civics
Mathematics
Kiswahili
Agriculture
Chemistry
Physics
English
Biology
History/Civics
History/Geography
History/Kiswahili
Geography/Kiswahili
Geography/Civics
Kiswahili/Civics
Biology/Chemistry
Biology/Physics
Biology/Agriculture
Chemistry/Physics
English/Kiswahili
English/History
English/Geography
English/Civics
Mathematics/Chemistry
Mathematics/Physics
Nutrition
B/Keeping
Commerce
Geography/Biology
Mathematics/Geography
56
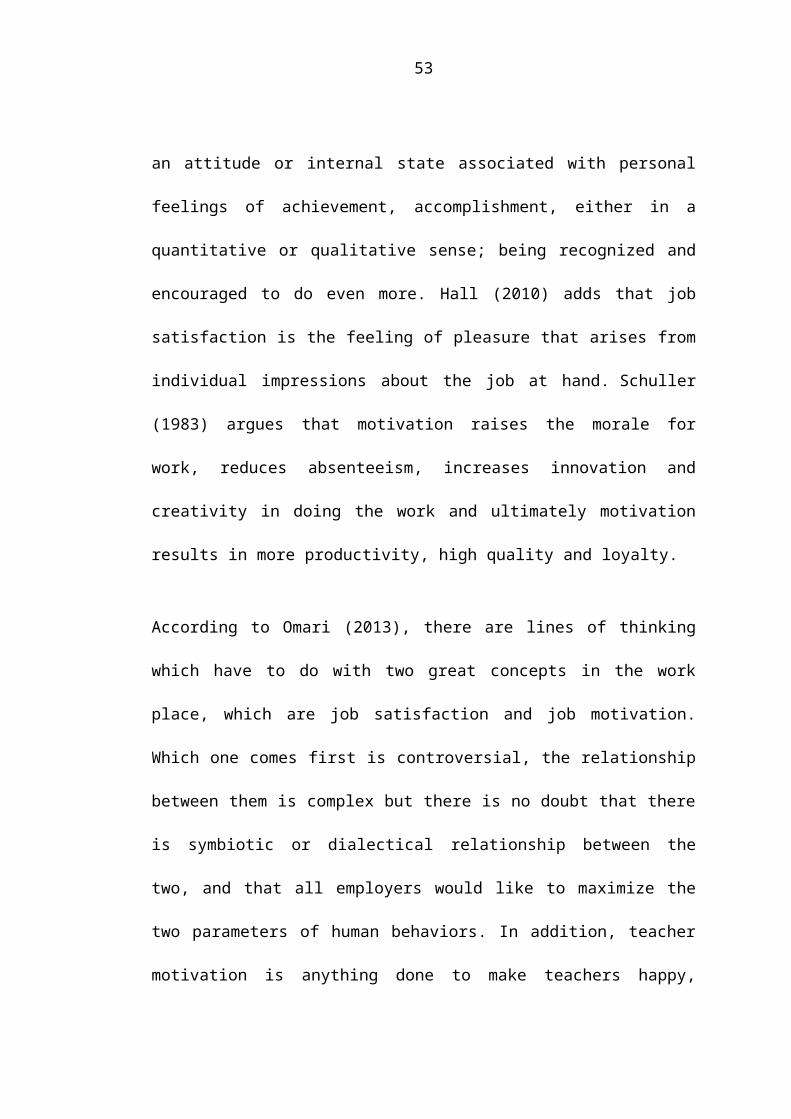
Nutrition having fewer teachers than all other subjects. Perhaps the subjects taught
by the fewest teachers were found in few schools that were involved in this study.
4.3.8 Teachers Workload in Secondary Schools
Figure 4.8: Teachers Workload per Week
From the figure 8 above, shows that 33.2% of teachers, the majority were having 16
– 20 periods per week, followed 23.4% of teachers teaching 26 – 30 periods per
week and 20.5% of teachers taught between 11 – 15 lessons per week. However,
only 1% of teachers were teaching more than 30 lessons per week. Therefore
majority of teachers had the required workload per week.
4.4 Teaching and Learning Facilities in Secondary Schools
4.4.1 Staffrooms Status in Secondary Schools
Table 4.1 shows that in the surveyed schools, available staffrooms were 33% while
67% were the shortage. The respondents rated the quality of such staffrooms as 25%
being ‘Very good’, 62.5% as good and 12.5% as very poor. In connection with the
findings the researcher observed that most staffrooms were in bad shape and some
were meant for other purpose but being used as staffroom. Perhaps poor quality of
Teachers' Workload per Week
13.2%
20.5%
33.2%
8.8%
23.4%
1.0%
0%
5%
10%
15%
20%
25%
30%
35%
06 - 10, 11 - 15, 16 - 20 21 - 25 26 - 30 31>
Periods per Week
57
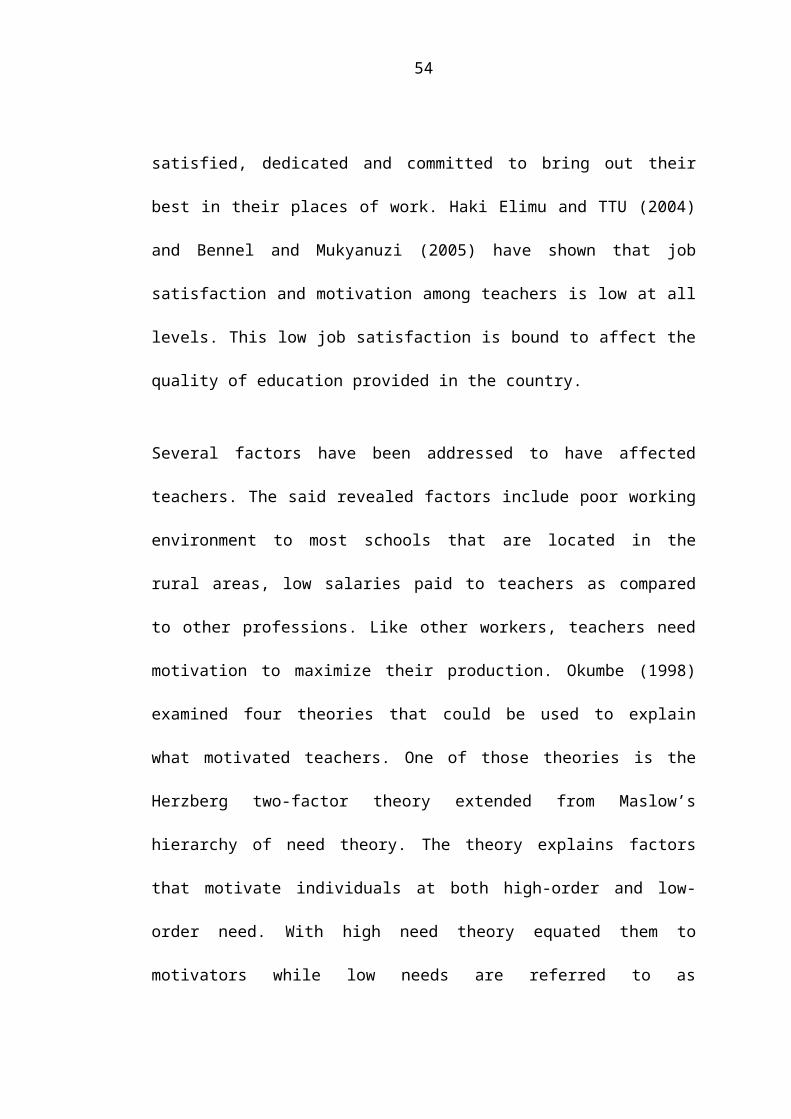
staffrooms was a stumbling block to teachers’ efficient performance.
4.4.2 Status of Schools Administrative Blocks
As in table 4.1 above out of the required Administration blocks, available were 38%
while the shortage was 62%. This shows that most school in the surveyed are short
of an administration block which is the most important building in a school.
However there is no uniformity in terms of quality, size, and furniture in different
schools surveyed although 75% of the administrative blocks were in good condition.
4.4.3 Availability of Text Books in Secondary Schools
Presence of textbook in schools is one of the important factors towards academic
achievement. From the study data shows that only 37.5% of the respondents claimed
text books to be ‘enough’ while majority of the respondents that is 62.5% claimed
that textbooks were ‘not enough’. Therefore most schools still have not reached the
1:1 ratio of books and students, meaning each student having his/her own book.
4.4.4 Status of School Libraries in Secondary Schools
Table 4.1 above shows in all schools surveyed, available libraries were only 15%
while the shortages were as high as 85%. This means many of the schools surveyed
had no libraries. The question is how students and teachers in those schools meet
their library needs? However the quality of those few present libraries was also a
challenge as 0% was rated as Very good, 37% as good and 62% Very poor. It can be
concluded that perhaps lack of library services and poor quality of the few were the
limiting factors not only to teachers’ performance but also to students’ academic
achievements.
58
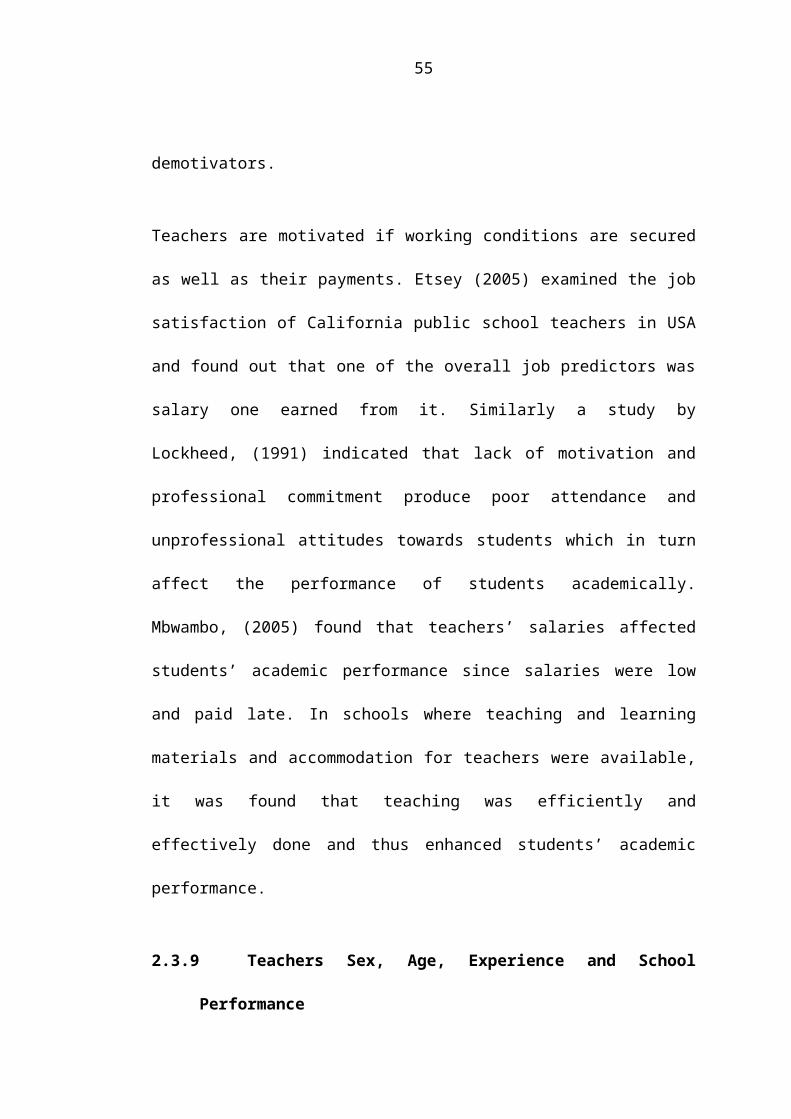
4.4.5 Status of School Laboratories in Secondary
Table 4.1 above shows the surveyed schools available laboratories were 38% while
shortages were 62%. When compared to the available libraries its vivid that there
were more laboratory than libraries in the surveyed schools, perhaps this could be
connected to the government policy of BRN which directed installation of
laboratories in all secondary schools. However the quality of the laboratories in the
surveyed schools was rated as 25% being Very good, 62.5% as good and 12.5 as
Very poor. Therefore, most of the laboratories are either not completed or lacking
important equipments or instruments to make them fully functional for students and
teachers’ academic practices.
4.4.6 Condition of Blackboards in Secondary Schools
A blackboard is unavoidable to any teaching especially in secondary schools. From
the findings as presented on Table 4.1 that out of the requirements for blackboards
available were 41.5% while the shortage was 58.5%. This means some classes in
secondary schools had no blackboards to be used in the teaching and learning
process. On the other hand 25 % of the blackboards were rated by the respondents as
‘Very good in quality’ while 62.5% were rated as in ‘good quality’ and 12.5 as Very
Poor in quality.
4.4.7 Condition of Notice Boards in Secondary Schools
The findings in Table 4.1 show that in the surveyed secondary schools out of the
required for Notice Boards, available were 36.5 % while the shortage was 13.6%.
The findings revealed that more than half of the surveyed schools had no notice
boards which are important platforms for communication. Of all the available notice
59

boards only 37.5% were rated by respondents in terms of quality as ‘very good’ and
62.5% as just ‘good’. This suggests that although some schools had notice boards
but most of them had compromising quality.
4.4.8 Availability of Desks in Secondary Schools
In reference to Table 4.1 the status of desks in surveyed schools was as follows;
available 49%, and the shortage of 51%. The findings suggest that the problem of
desks in schools was almost half solved although the quality of such desks was rated
‘very good’ by 50% and ‘good’ by 50% of the respondents. It can be concluded that
almost half of all the desks required are available and generally in good condition.
4.4.9 Office Chairs Status in Secondary Schools
The finding on Table 4.1 shows that, out of the required office chairs in the surveyed
schools available were 33.1% and shortage 66.9%. On the other hand the quality of
such chairs was rated as 12.5% being ‘Very good’ and 62.5 % as being ‘good’ while
25% were rated as ‘very poor’. From the findings, although most of the surveyed
schools had office chairs but only few were in very good quality. Missing a chair or
having a discomforting chair is a setback to teachers performance.
4.4.10 Cupboards Status in Secondary Schools
From the summary Table 4.1 in the surveyed schools out of the required cupboards,
available were 28.7% while 71.3% was the shortage. Such a low presence of
cupboards in the surveyed schools suggests that presence of a cupboard was less
desired or of less priority. On the quality of such available cupboards, the
respondents claimed that 37.5% were in ‘very good’ condition, while 62.5% were in
‘good’ condition. The findings indicate although cupboards were less desired by
60
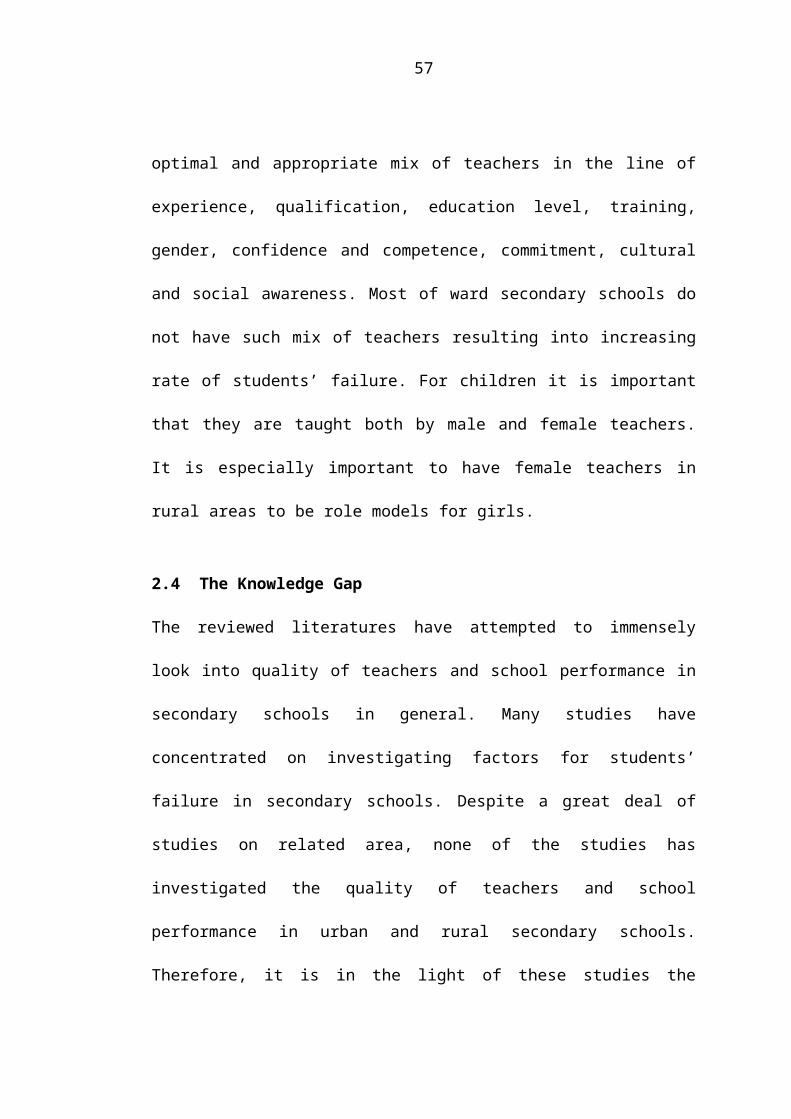
schools but those available were generally in good condition hence better handling
of documents.
4.4.11 Toilets Condition in Secondary Schools
As it can be seen from Table 4.1 in all surveyed schools available toilets were 36%
while the shortage was 64%. Of all the available toilets in the surveyed schools only
25% were claimed to be in ‘very good’ quality, 62.5% were claimed to be in ‘good’
quality and 12.5% were in ‘poor’ quality. Having good toilets in schools could be
one factors qualifying for a good working/studying condition. From the findings it is
obvious that there is a need for more toilets to curter for teachers and students
although those available were generally in good condition.
4.4.12 Status of Playgrounds in Secondary Schools
In all surveyed schools the available playgrounds were 30% while the shortage was
70% (Table 4.1). However with regards to the quality of such playgrounds, 25%
were rated as in ‘very good’ quality, 50% as ‘good’ and 12% as of ‘poor’ quality.
From the findings it can be concluded that majority of the school lack playgrounds
but for those few available were generally of good quality.
4.4.13 Condition of Dining Halls in Secondary Schools
A dining hall is an important place in any school as its place where students have to
get their meals. From Table 4.1 in the surveyed schools, available Dining Halls were
33.3% while the shortage was 66.7%. The quality of the available Dining Halls was
40% rated as ‘very good’ and 60% rated as ‘good’. The findings suggest that were
less than a half of the required Dining Halls in all Schools. The question is where do
61

students take their meals from? Is it in the classrooms or is it outside under trees?
However the quality of such available Dining Halls is generally good.
4.4.14 Dormitories in Secondary Schools
From Table 4.1 available dormitories in the surveyed schools were 38% while the
shortage was 62%. The quality of such dormitories was claimed to be 14.3% as ‘very
good’, 71.4% as ‘good’ and 14.3% as ‘very poor’. The findings suggest that only
less than half of the school dormitories were present but most of them were of
generally good condition perhaps that allow for students to have basic
accommodation facilities.
4.4.15 Assembly Halls in Secondary Schools
In the surveyed school the available assembly halls were only 11.1% with a more
than half shortage of 88.9%. On the other hand the quality of such assembly halls
was rated as 23.5% ‘very good’, 30.5% as ‘good’ and 46% as ‘very poor’ (Table
4.1). The findings show that most schools do not have assembly halls, perhaps they
do not have resources to build assembly halls or assembly halls were of less priority
in schools compared to other facilities.
4.4.16 Condition of Classrooms in Secondary Schools
From table 4.1 shows that in all surveyed schools classrooms out of the required,
available classrooms were 39% while 61% was the shortage. This means that in
some schools students were forced either to learn in overcrowded classrooms or go
into shifts.
62
CHAPTER FIVE
5.0 DISCUSSION OF THE FINDINGS
5.1 Introduction to the Chapter
This chapter discusses in detail the findings as per objectives of the study. Firstly,
the working and living environment of teachers and school academic performance
were discussed. Secondly, the quality of teachers and school performance were also
discussed and thirdly, the availability of teaching and learning facilities and school
performance were lastly discussed.
5.2 Teachers Working and Living Conditions in Secondary Schools
This section focuses on factors which motivate teachers in teaching career. The main
focus was on the availability of teaching and learning materials, economic incentives
for teachers, availability of staff quarters, transport to and from the working station.
The presence of these factors makes the working environment conducive to motivate
teachers. The absence of these factors makes the working environment un-conducive
to motivate teachers. The working and living conditions among the Tanzanian
teachers is a controversial issue. Teaching effectiveness results is the outcome of
conducive environment. Lack of good working and living standard facilities among
teachers demoralizes them and draws back their working spirit. Good facilities
among the teachers are a sort of motivation and encourage working. Furthermore,
living in different environment adds difficulties to teachers as they cannot cultivate
relationship necessary for effective school organization.
Teachers’ motivation aspects were delivered from ideas described in Okumbe (1998)
for Herzberg two-factor motivational theory. The theory looked at motivators as high
63
needs of teachers that drive them to work and de-motivators as low needs of teachers
that lead to dissatisfaction of continuing working. Teachers are motivated to work if
they are recognized or they make some achievement. However, teachers are not
motivated if working conditions are not secured as well as their payments. They end
up showing dissatisfaction with their job. Omari (2013) contends that, there are lines
of thinking which have to do with two great concepts in the work place, which are
job satisfaction and job motivation. Which one comes first is controversial. In
addition teacher motivation is anything done to make teachers happy, satisfied,
dedicated and committed to bring out their best in their places of work.
Findings show that majority of teachers are affected by low salaries unless one
served for a long period. Almost 54 percent were in “D” scale, 38 percent were in
“C” scale and only 8 percent were in “E” scale. For instance, the basic salary for a
graduate teacher is TGTs D1 which is Tshs.471,000 (URT, 2013) while a graduate
medicine doctor starts with PGSS 11-14 ranging between Tshs 900,000 to 1,100,000
and in other public institutions graduate starts with PHTS 5-8 whose salary scale
ranges between 800,000 to 1,000,000 ( URT, 2013). So far salaries can attract
workers to do well what they are required to do. This view concurs with Anangisye
(2009) who examined the status of teachers in Tanzania and found that both teachers
and teaching profession has a low status than it was during pre-independent times.
And also, Mbwambo (2005) found that, teachers’ salaries affected school
performance since salaries were low and paid late.
Undesirable working and living conditions accounted for de-motivation of and low
status of teaching profession. Findings from this study indicate that there was a
64
shortage of 38 percent of teachers houses, with regards to the quality of available
houses 12.5 percent were rated to be of poor quality. From the findings it can be
concluded that shortage of teachers houses is one of de-motivating factor in teaching
profession. This also collaborates with the findings by Etsey (2005) and Challe
(2010) who in different studies revealed that poor working conditions are among
major sources of teachers’ dissatisfaction. In this study, the findings also showed
shortage of staffrooms by 24 percent, administrative blocks by 13 percent, office
chairs by 16 percent, cupboards by 21.3 percent in both high and low performing
schools in general. These also might contribute to de-motivation and dissatisfaction
leading poor school academic performance.
In both high and low performing schools, results showed that teachers were
motivated with the subject allotted to teach and this showed the effort to teach. This
is because most of them were assigned subjects of their preference which they were
undergone training. The findings also indicated that 33.2 percent of teachers were
having 16-20 periods per week, followed by 23.4 percent of teachers teaching 26-30
periods per week and 20.5 percent of teachers taught 11-15 lessons per week.
However, only 1 percent of teachers were teaching more than 30 lessons per week.
Therefore, majority of teachers had the required workload per week. These findings
were contrary to the findings of Uwazi (2013) that indicated that many teachers have
big work load. Omari and Sumra (2001) also observed that a range of 12 -60 periods
per week with variation between urban and rural schools and no variation by teacher
qualification and experience in the distribution of the load. The results of this study
contradict with the study of Uwazi and Omari and Sumra because it might be their
65
study were done in the past and when the number of teachers was still low.
Therefore teaching loads should be investigated further to determine if greater
efficiency is possible.
5.3 Qualities of Teachers in Secondary Schools
The descriptive statistics for teacher quality for eight schools were presented
respectively. The teacher quality aspects examined were teachers academic or
professional level, work experience, teachers age, professional development
activities, teachers motivation, working conditions, teachers salary and teaching
subjects. Through questionnaires administered to heads of schools, eight aspects of
teacher quality are presented below.
5.3.1 Education Levels of Teachers in Secondary Schools
The findings of this study revealed that the education level of teachers range from
diploma to masters degree. It was found that the majority of teachers (51 percent)
hold bachelor degree in education. Further, the study found that 48 percent of
teachers were diploma holders and 1 percent was holders of masters’ degree
respectively. The academic qualification of teachers for both high and low
performing schools did not display any significant difference.
The study went further to examine the status of professional qualifications of
teachers in additional to their academic levels. Through school records the study
revealed that 51 percent of teachers were degree holders in education, 48 percent of
teachers were diploma holders in education, which is the minimum qualification for
secondary school teachers in Tanzania education system. The majority of teachers in
66
both high and low performing schools were degree holders. Thus assigning diploma
teachers to lower classes was common to both high and low performing schools.
Allocation of teachers to classes and subjects according to their professional grades
was also common practice.
The findings of this study contradicts with findings by Mosha (2006) and Omari
(1995) who found out that teachers in secondary schools were of very low
qualification. In this study, more than 98 percent of teachers had qualified to teach in
secondary schools. This difference could be explained by the fact that the study of
Mosha and Omari (1995) was conducted some years back when qualification of
teachers for secondary schools in Tanzania did not expand as it is today. Previous
studies indicated that qualification of teachers have a role to play in affecting school
performances, however the caution given in the same study was unfavorable
working conditions may slow down the performance of teachers and place qualified
teachers in the same level of standard of quality (Agyeman, 1993). According to
Komba (2007), teacher professional development programs are the alternative
strategy that is reliable in improving mastery of subjects.
5.3.2 Teacher Professional Development in Secondary Schools
Teacher professional development has a significant role in shaping teachers quality.
Improvement of instructional practice or students learning outcome is associated
with teachers professional development, therefore, it is an essential to asses as per
education and training policy (ETP) of 1995 (MOEC, 1995). Teachers development
activities are subjected to innovations in technologies, curriculum and political
demands (Rodrigues, 2005). They either require in-service training of long and short
67
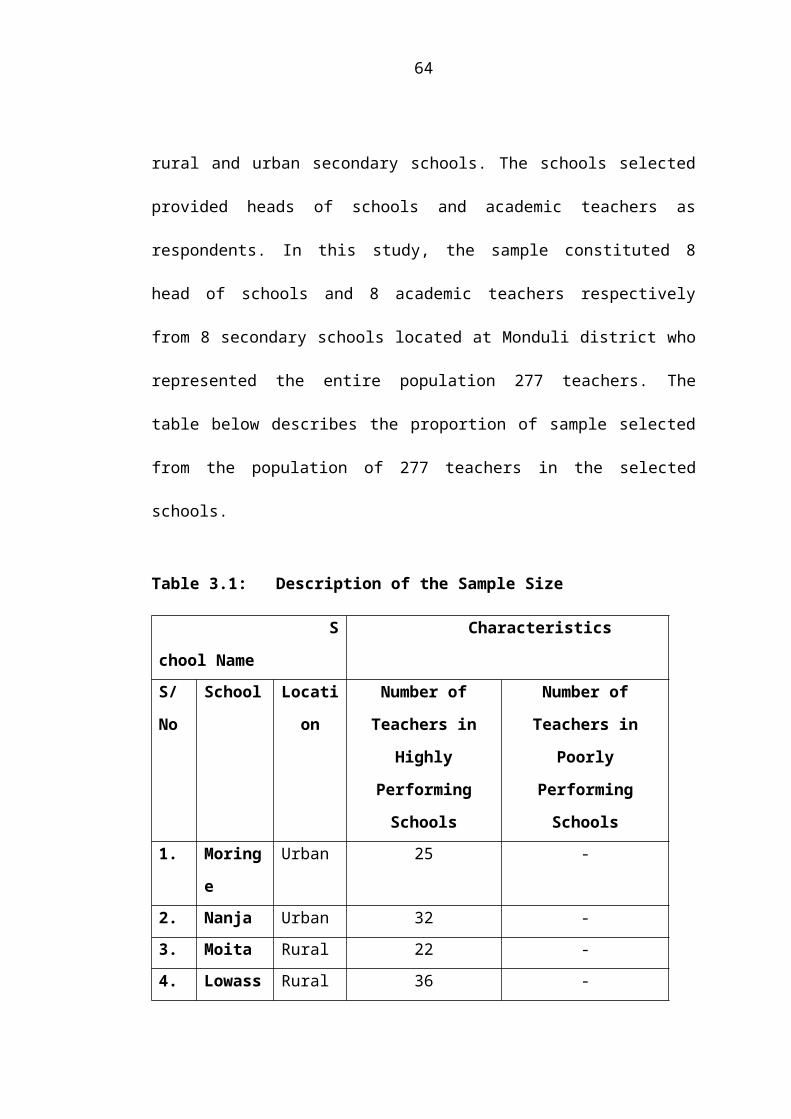
terms found in different forms. They include seminars, workshops, conference, up-
grading and short courses. Provision of such training are geared towards teacher
professional development and school academic improvement. The quality of
teaching depends, partly, to the pre-service and in-service training teachers receive.
Without in-service training, seminars, discussions and special training that offer new
knowledge, teachers will not be able to cope with the rapidly changing world. From
the findings of this study, teachers’ professional development was low since the
majority of teacher especially in low performing schools which most of them were
government schools were between 0-5 years of experience (57.1 percent). This may
be was a reasons since it was only a short period from enrollment, however, financial
constraints in Tanzania has thus been claimed to affect the provision of teachers
professional development( Komba, 2007).
5.3.3 Teachers Work Experience in Secondary Schools
Work experience is an important aspect to examine in relation to school
performance. Teachers work experience allows theory and practice of teaching to be
closely linked. Teacher gets an opportunity to build on his/her strengths or work on
his/her weakness in teaching. All these benefits work together to determine the
performance of students. The components of work experience taken into account by
this study were the numbers of years of teaching as well as number of years
teaching.
Dembele and Lefoka, (2007) as cited in Bhalalusesa et al, (2011) expressed that
experience matters in reducing the amount of time spent on procedural matters in the
classroom and in restoring order. The findings from this study displayed that range
68
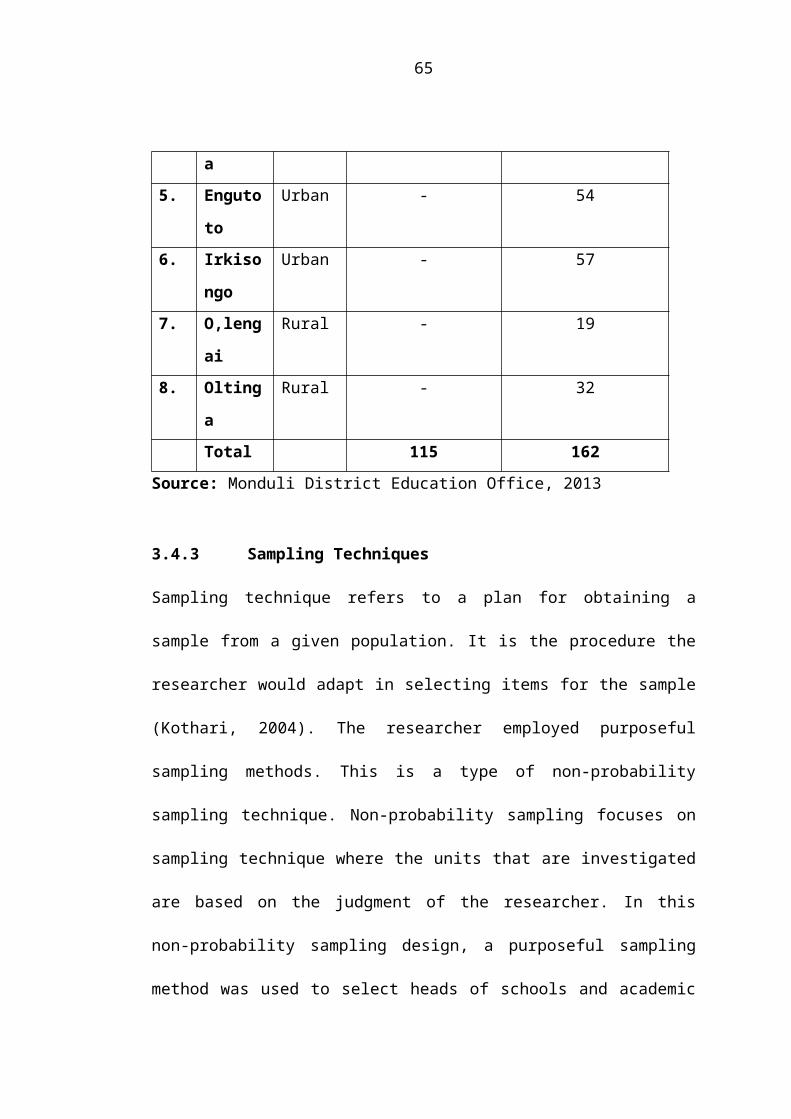
of work experience that lies between 0 to 30 years plus. 31.2 percent of teachers had
less than 2 years in teaching profession and 25.9 percent had taught for 2-3 years.
This situation implies that in many secondary schools newly employed teachers were
lacking mentorship from senior teachers. On the other side, the number of less
experienced teachers could attribute to newly opened ward secondary schools which
needed high number of teachers. Teachers, work experience could be associated with
high and low performing schools. The average work experiences in high performing
schools were higher than in low performing schools. Thus, it can be observed that
teacher experience contributed to the performance of students. This agrees with the
findings by Rice (2003) and Leu (2004) on different characteristics that form teacher
quality. According to their findings, mastery of subject is achieved through teaching
experience.
5.3.4 Teachers Training Qualification in Secondary Schools
ETP, (1995) requires that minimum qualification for secondary school teacher shall
be a diploma in education. Teachers have to be prepared psychologically before they
join the teaching field. Moreover, a teacher with qualification of diploma should be
entitled to teach forms one and two while degree holder is entitled to teach forms
three, four and above. Entry qualification according to ETP is meant to raise the
efficiency and excellence of teachers which in turn results into raising school
academic performance.
Additionally, due to development of new technologies and approaches of teaching,
the ETP recommends alternative measure; it states that in-service training and
retraining program shall be compulsory in order to ensure teacher quality and
69
professionalism (ETP, 1995). From the findings of this study, 99 percent of all
teachers were trained into teaching profession while only 1 percent of teaching staff
were not trained as professional teachers. This meant that almost all teacher staff was
qualified teachers, meaning the teaching profession is self sufficient. Studies done by
Omari (2013) reveals that, most of teachers in ward secondary schools were diploma
holders or crash program teachers who were assigned to teach all forms, one to four.
The finding of Omari contradicts with the findings of this study as the study of
Omari was done when there were shortage of teachers in secondary schools the
problem that had been minimized and those crash program teachers had already
undergone further professional training.
5.4 Teaching and Learning Facilities in Secondary Schools
Teaching and learning materials are considered to make teaching and learning
environment conducive. These include laboratories, staffrooms, furniture,
classrooms, administrative blocks, libraries, blackboards, notice boards, just mention
a few. The findings of this study revealed that teaching and learning facilities to
some extent were available to make teaching and learning conducive. In some
schools students were forced either to learn in overcrowded classrooms or go into
shifts. The overall results showed that there was a shortage of 13 percent of
classrooms.
The findings also indicated that staffrooms shortage was 24 percent of the total
number required. Though figures suggest availability of more than a half of the
staffrooms, but the quality and size differs in each school considerably. The
administrative blocks were also observed in both high and low performing schools.
70
Most of schools had administrative blocks which are important building in a school,
however there was no uniformity in terms of quality, size and furniture in different
schools surveyed. From the surveyed schools the status of school libraries and
laboratories were also observed, in which there was a great shortage of 50 percent
libraries which meant many schools had no libraries. It can be concluded that
perhaps lack of library services in secondary schools is one of the limiting factors
not only to teachers’ performance but also to students’ academic achievements. In
case of school laboratories there were more laboratories than libraries in the
surveyed schools.
Generally the shortage was 15 percent; perhaps this could be connected to with the
government policy of BRN which directed installation of laboratories in all
secondary schools. However the qualities of the laboratories were rated as 29 percent
as very good and 71 percent was rated as good. This meant most of the laboratories
were either not completed or lack important equipments to make them fully utilized.
Therefore, poor school teaching and learning facilities demoralizes many teachers to
work in teaching profession.
71

CHAPTER SIX
6.0 SUMMARY, CONCLUSIONS AND RECOMMENDATIONS
6.1 Introduction to the Chapter
This chapter summarizes key findings from the study. It also gives recommendations
for improvement of teacher quality so as to enhance school academic performance.
Concluding remarks are also given.
6.2 Summary of the Study
The study was conducted to analyze the quality of teachers and the school academic
performance in urban and rural secondary schools in Monduli district. The main
focus was on the quality of teachers, working and living environment and
availability of teaching and learning facilities versus academic performance of
secondary schools. Questionnaires in the form of check list were the method
employed.
6.2.1 Teachers Working and Living Environment
The study findings revealed that the working and living condition as a motivating
factors to teachers varied between urban and rural schools and between school to
school. The poor provision of attractive salary, housing and incentives led to
unsatisfactory and negative attitudes towards teaching career in low performing
schools especially those located in rural areas. Availability of water from teachers
working stations as revealed by the study findings shows that more than 50% of
teachers get water from moderate and long distance, however the quality of the
available water is questionable. Thus may be this is among the reasons undermining
teachers preference for working in such stations and poor motivation leading to poor
72
school academic performance.
The majority of working and living stations of teachers are located near major roads.
Only 25% of working stations claimed to have located more than 2 kilometers
distance to road. Thus shows it is not a major stumbling block to working and living
environment to teachers. Electricity in teachers working stations is available to the
majority of secondary schools while only few of them that is 12.5% have no
electricity in their secondary schools which is a stumbling block for teachers
motivation in few secondary schools.
6.2.2 Teachers Professional Qualifications
Teachers differed in professional qualifications; however, 51% of teachers were
bachelor degree holders. Again, teacher training duration as an aspect of teacher
quality indicate most of them had undergone pre-service training accordingly. About
teachers experience it was found that many teachers had long experience in schools
rated high performing than those rated low performing ones. Teacher professional
development was found to have limited number of in-service training attended. The
correlation between teacher qualities was found to be significant to school
performance by teaching experience in all schools. From the findings, 31.2% of
teachers had less than two years in the teaching profession and 25.9% had taught for
3 – 5 years. This situation implies that in many ward schools newly employed
teachers were lacking mentorship from senior teacher. On the other side the high
number of less experienced teacher could attribute to newly opened ward secondary
schools which needed high number of teachers.
73
6.2.3 Teaching and Learning Facilities
These include laboratories, staffrooms, furniture, classrooms, administrative blocks,
libraries, blackboards and notice boards. In some schools these facilities to some
extent were available. The quality, size and quantity of teaching and learning
facilities differed from one school to another. Lack and shortage of teaching and
learning facilities in some secondary schools are stumbling blocks to both teachers
effectiveness and students performance in various fields. Therefore, these stumbling
blocks in teaching and learning facilities may be result into poor school academic
performance.
6.3 Conclusions Based on Findings
From the findings, several conclusions can be drawn in this study. The researcher
investigated the quality of teachers and the trend of school academic performance.
Findings showed that; the majority of teachers are low experienced and missed
teacher professional development (in –service training) for a long period, although
51% of them were found to hold bachelor degree in education but they are of few
years in service. Thus the quality of teachers should be considered as an important
determinant of school performance especially in secondary schools located in rural
areas where important sills are to be developed.
The academic performance of private schools matches with experienced teachers
who had retired in government and hired again in private schools. 5% of teachers
were found having above15 years in teaching profession and most of them were in
private schools while 56% are below 6 years experience and most of them were
found in government school.
74
Teachers are not motivated in working conditions as they are not well secured in
their environments due to insufficient educational infrastructures, high teacher-pupil
ratio as well as their payments. It also undermines the teachers’ preference for
working in rural areas. They end up showing dissatisfaction with their job. The
teaching and learning facilities in most schools do not meet the needs effectiveness
for good school performance as many of them are still questionable.
6.4 Recommendations
6.4.1 Recommendations for Actions
Based on the findings of this study, the researcher recommends the following:
i. The Ministry of Education and Vocation Training should make effort to raise
the level of teacher quality by addressing the issues that directly contribute to
poor teacher quality.
ii. The District Councils should ensure continuous in-service training to many
teachers as possible. This can be easily attained through collaboration of
Teachers Training Institutes with districts or municipal councils.
iii. Most of public secondary schools do not have enough infrastructures like
classrooms, staff quarters, laboratories and others. Communities, educators
and other education stakeholders must mobilize support funds so as to reduce
the problem at least to the minimum in their respective areas instead of
waiting the government.
iv. In-service training for teachers including short courses, seminars, workshops
and even further studies should be deliberately prioritized for capacity
building among teachers, this will help the work more effectively.
75
v. Policy makers should review the current Education and Training Policy ETP)
and consider updating by incorporating practical strategies to improve
teacher quality in public schools.
vi. Policy makers should also formulate revised and flexible short term
educational plans to be carried in future to ensure that the educational
stakeholders such as education officers, head of schools and community, get
room to recommend what they see as proper way of motivating teachers in
secondary schools.
vii. Teachers –Parents Association should be established and regular meetings
need to be done to build good rapport and educating the parents and the
entire community on their significant role in supporting educational
programs.
viii. The ceased 50% of teaching allowance provided during the early 1990s
should be resumed so as to motivate teachers who see themselves as
neglected.
6.4.2 Recommendations for Further Studies
This study has focused on secondary schools located in rural and urban areas,
drawing its sample from Monduli district. The findings should not be generalized
since the study has taken small area. There is a need therefore, similar studies to be
carried out to other parts of Tanzania for the purpose of drawing conclusion to
matters pertaining to teachers’ motivation. As a study covered only a proportion of
problems of school academic performance in urban and rural secondary schools, and
the sole responsibility is to monitor and ensure quality education, a similar study
76
should be conducted on teachers’ time on task in secondary schools to ensure
effective teaching and learning. There is also a need for conducting a study on
students-teacher ratio in secondary schools so as to check whether the number of
teachers required in secondary schools is achieved according to subjects’
requirements.
77
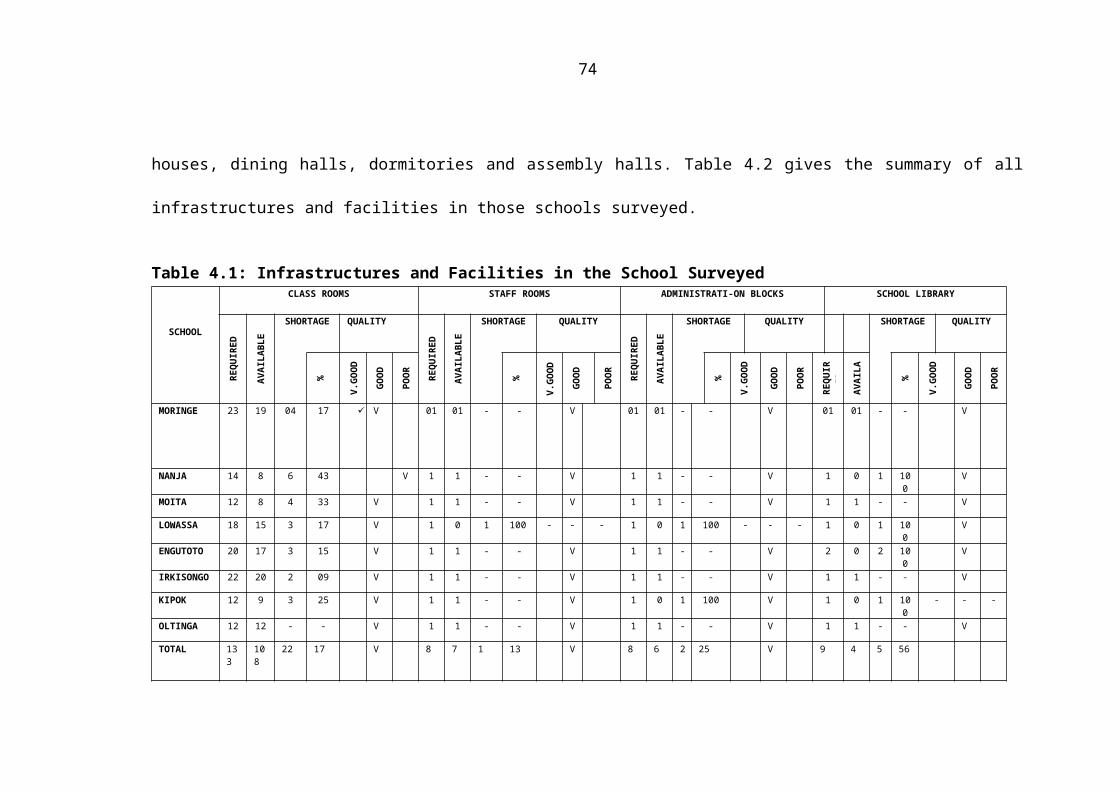
REFERENCES
Ajayi, I. A. & Ekundayo, H. T. (2010). Contemporary issues in educational
management Bolabay.
Anangisye, W.A.L. (2008). Developing quality teacher professionals; a reflective
inquiry on the practice and challenges in Tanzania. Journal of
international cooperation in education. 11 (3), 137-154.
Aremu, A. O. & Sokan, B. O., (2003). A multi-causal evaluation of academic
performance of Nigerian learners: Issues and implications for national
development. Department of Guidance of Counseling, University of
Ibadan, Ibadan.
Aremu, A. O. (2000). Academic performance 5-factor inventory. Ibadan: Stirling-
Horden.
Aronson, J., Zimmerman, J. & Carlos, L. (1998). Improving student achievement by
extending schools: Is it just a matter of time? San Fransisco, CA: WestEd.
Retrieved frm http://www.wested.org
Babyegeya, B.N., (2002). Educational planning and administration. Dar es salaam,
Tanzania.
Bhalalusesa, E.et al, (2011). Teacher Preparation and Continuing Professional
development in Africa (TPA): the preparation of teachers in reading and
mathematics and influence on practices in Tanzania primary schools,
www.Success.ac.uk/cie/documentary/report-tanzania
Barley, Z. A. and Brigham, N., (2008). Preparing teachers to teach in rural schools
(Issues & Answers. Report, REL 2008-No. 045). Washington, DC: U.S.
Department of Education.
78

Bauch, P.A. (2001). School-community partnership in rural schools: Leadership,
renewal, and a sense of place. Peabody Journal of Education, 76 (2), 204-
221.
Beach and Reinhatz, (1989). Supervision: Focus on Instruction. New York: Harper
and Row.
Best, M. (2003). Fundamentals of statistical geography. Oxford University Press,
London.
Besterfield A. D. et al., 3rd Ed., (2003). Total quality management. Pearson
Education Inc., New Jersey.
Cano, F. (2011). Epistemological beliefs and approaches to learning: Their change
through secondary school and their influence on academic
performance. British Journal of Educational Psychology, Volume 75,
Issue 2, pages 203–221, June 2005.
Darling-Hammond, L. (2000). Teacher quality and student achievement: A review of
state policy evidence. Accessed on 12th, April, 2011 from:
http://epaa.asu.edu/ojs/article/view/392.
EDI, (2005). Survey on poverty, welfare and service in Monduli District.
Etsey, K. (2005). Causes of low academic performance of primary school pupils in
the Shama sub-metro of Shama Ahanta East Metropolitan Assembly
(SAEMA) in Ghana. Paper presented at the Regional Conference on
Education in West Africa, Dakar, Senegal. 1st—2nd November.
Etsey, K. A.; Amedahe, F. K. & Edjah, K. (2005). Do private primary schools
perform better than public schools in Ghana? Unpublished paper.
Department of Educational Foundations, University of Cape Coast, Cape
79

Coast.
Fagbamiye, E.O (1998). Examination malpractice in Nigerian education institution:
Is there any hope? In A. Adegboye, O. Olutoye & J. O. Issues on
examination malpractice in Nigeria. Ado- Ekiti: PETOA.
Fwu, B. and Wang, H. (2002). From uniformity to diversification: Transformation of
teacher education in pursuit of teacher quality in Taiwan from 1949 to
2000. International Journal of Education Development. 22 (2). 155-167.
GoT, (2005). Poverty and Human Development Report. Dar es salaam. Mkuki Nyota
Publishers.
Good, T. (1983). Classroom research: A decade of progress. Educational
Psychologist, 18, 127-144.
Goldhaber, D, at al, (2002). The mystery of good teaching: Surveying the evidence
on student achievement and teachers’ characteristics. Education Next 2 (1)
50-55.
Haki Elimu, (2009). The significance of quality teacher training. Dar es salaam:
Haki Elimu.
Harris, K.L., & Farrell, K. (2007). The science shortfall: An analysis of the shortage
of suitably qualified science teachers in Australian schools and the policy
implications for universities. Journal of Higher Education Policy and
Management, 29(2), 159-171.
Haycock, K., (1998). Education Good teaching matters: How well-qualified
teachers can close the gap. Trust, Washington, DC.
Hossler, C., Stage, F., & Gallagher, K. (1988,). The relationship of increased
instructional time to student achievement. Policy Bulletin: Consortium
80
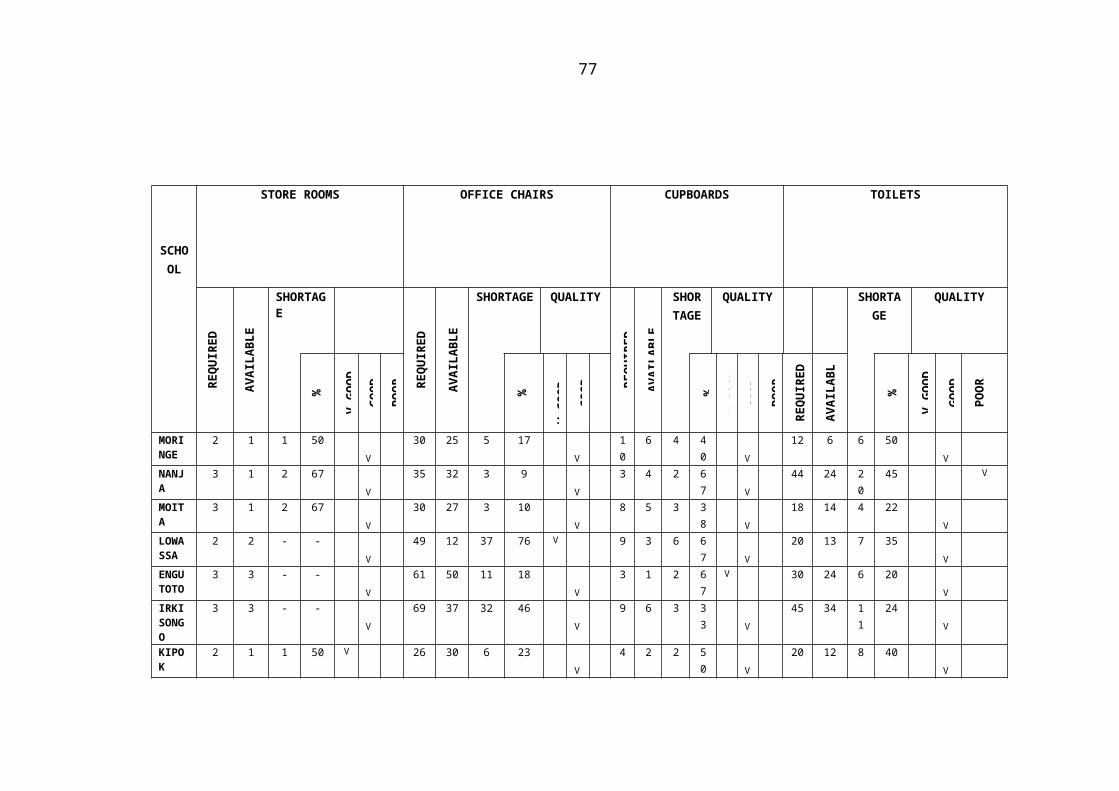
on Educational Policy Studies.
Hudson, P.B and Hudson, S.M. (2008). Changing pre-service teachers’ attitudes for
teaching in rural schools. Australian Journal of Teacher Education, 33
(4), 67-77.
Ishikida, M.Y. (2005). Japanese education in 21st century. Lincoln: center for US-
Japan comparative social studies.
Karande, S. & Kulkarni, M. (2005). Poor school performance. Indian Journal of
Pediatrics. 72(11): 961— 967.
Kerlinger, C., (1973). Research methodology: Methods and techniques: New Delhi.
Wishwa Prakashan.
Komba, W.L. (2007). Teacher professional development in Tanzania: perception
and practice. In Papers in Education and Development, 27(1-27).
University of Dar es salaam.
Kothari, C. K (2004). Research methodology: Methodology and techniques (2nd ed).
New Age International Publication, New Delhi.
Kovach, K.A., (1984). What motivates employees? Workers supervisors give
different answers: Business Horizons.
Kraft, R. J. (1994). Teaching and learning in Ghana. Boulder CO: Mitchell Group.
Leedy, P.D. and Omrod, J.E. (2001). Practical Research: Planning and Design.
New Jersey: Prentice-Hall.
Leu, D.J.,Jr., Leu, D.D & Coiro, J. (2004). Teaching with the internet: New literacies
for new times (4th ed.). Norwood, MA: Christopher-Gordon.
Lingham, G.I., (2012). Preparing teachers for rural schools: An empirical evidence
from a Fiji case. Greener Journal of Educational Resaerch, 2 (2), 1-12.
81

Mafuru, W.L., (2011). Coping with Inadequacy: Understanding the effects of central
recruitment in six ward secondary schools in Tanzania. Leiden: African
Studies Centre.
Meena, W.E. (2009). Curriculum Innovation in Teacher Education: Exploring
Conceptions among Tanzanian Teacher Educators. Abo Akademi
University press (http://library.out.ac.tz/cgibin/koha/opacdetail.pl?biblio
number=1618&shel browse_itemnumber=2117), Retrieved on 09/02/2013.
Mbwambo, E.E. (2005). Teacher motivation and student academic performance in
secondary schools. Unpublished MA dissertation. University of Dar es
salaam.
Ministry of Education and Culture. (1995). Education and Training Policy. Dar es
salaam.
Moon, B. Butcher, J. and Bird, E. (2000). Leading professional development in
education, London: Routledge Falmer.
Mkonongwa, P (2012). Quality education in Tanzanian context. A paper presented to
the African Federation of Head of Schools’ Conference Mlimani from
10th -13th, October, 2012.
McMillan, J. H. & Schumacher, S. (2003). Research in education: A conceptual
introduction, (3rd ed). New York. Harper Collins College Publishers.
Meece, J. L et al (2006). Classroom goals structure, student motivation, and
academic achievement. Retrieved from; Annu. Rev. Psychol. 2006.
57:487–503doi: 10.1146/annurev.psych.56.091103.070258
Miles, M.B., & Huberman A. M., (1994). Qualitative data analysis. An expanded
source book (2nd edition), Thousands Oakes: Sage.
82
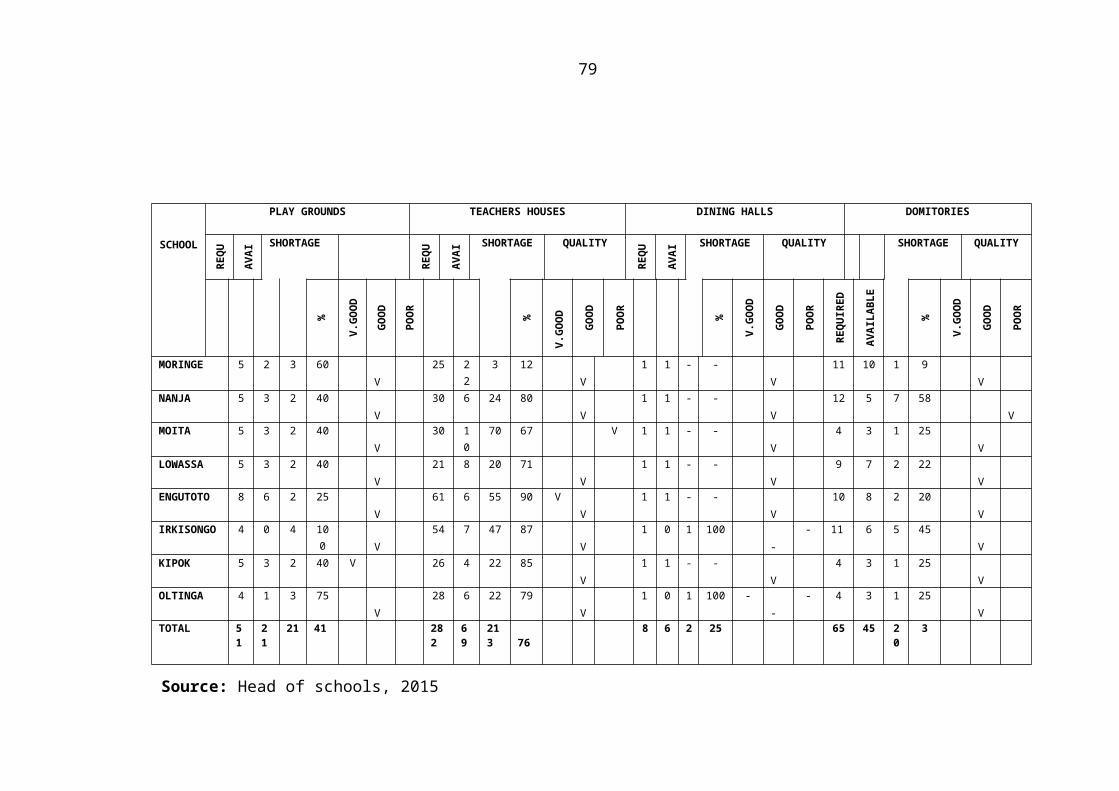
Morakinyo, A. (2003). Relative efficacy of systematic desensitization, self statement
monitoring and flooding on students’ test anxiety. Unpublished Ph.D.
thesis. University of Ibadan, Ibadan.
Mosha, H.J. (2006). Planning education systems for excellence. Dar es salaam: E&D
Publishers.
MoVET, (2011). Basic educational statistics in Tanzania. Dar es salaam. MOEST,
(2010). Education in Tanzania. Retrieved October 5, 2010 from
www.msthe.go
NSGRP II, (2010). Service function of decentralization. Dar es salaam: Ministry of
Finance and Economic Affairs, July 2010.
Nyerere, J. K., (1967). Education for self reliance. Oxford University Press. Dar es
salaam.
Okumbe, J.A. (1998). Educational management: theory and practice. Nairobi:
university of Nairobi.
Omari, I.M, (1984). Students Conceptions of the qualities of a good teacher; Zambia
Educational Review.
Omari, I.M & Sumra, S. A. (2001). Study on policy options for the rationalization of
the Primary school teaching force in Tanzania. Dar es salaam: PMO-
RALG.
Omari, I. M, (2011). Concepts and methods in educational research. Oxford
University Press. Dar es salaam.
Omari, I. M, (2013). The Education sector human resources production and
management crisis in Tanzania. Dar es salaam.
Prater, M. A. (1992). Increasing time-on-task in the classroom: Suggestions for
83
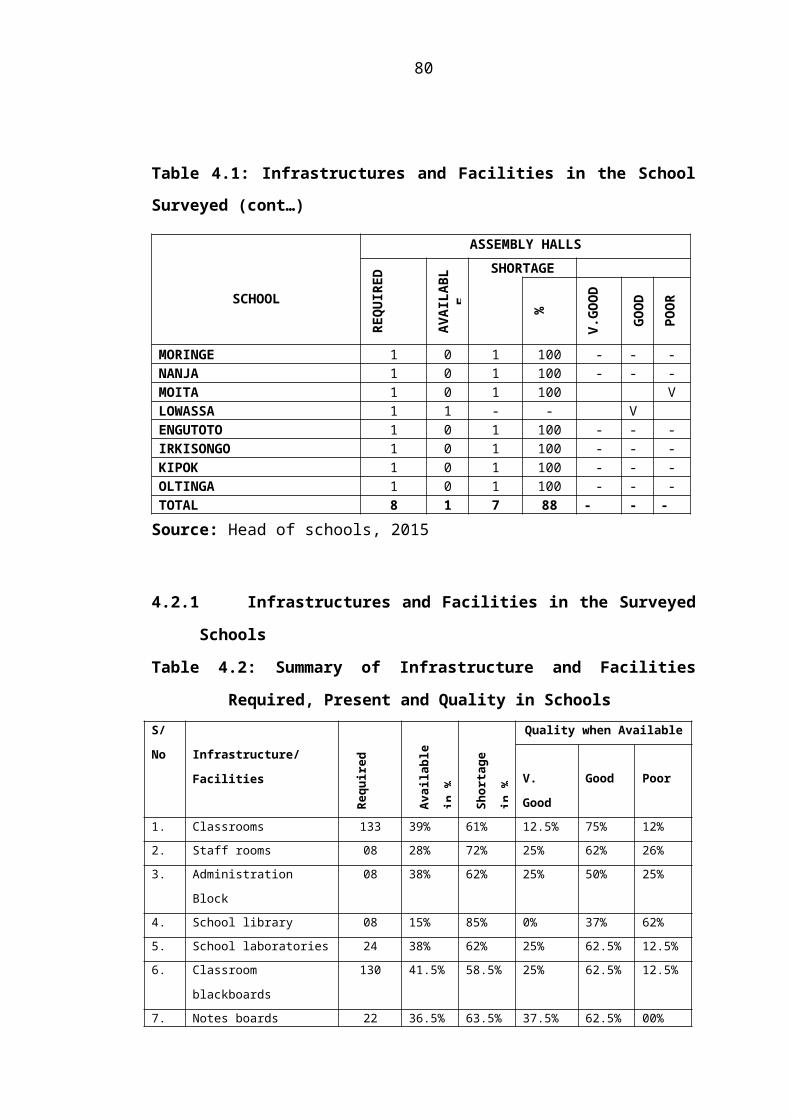
improving the amount of time learners spend in on-task behaviors.
Intervention in School and Clinic, 28 (1), 22-27
Rodridgues, S. (2005). International perspectives on teacher professional
development. New York: Nova Science Publisher.
Stufflebeam, D. L, (2002). Institutionalizing evaluation in schools. The International
handbook of educational evaluation. Boston: Kluwer.
Scheerens, J. (2000). Improving school effectiveness. Paris: UNESCO, IIEP.
Surty, E., (2012). Quality education for rural schools in South Africa-challenges and
solutions. South Africa Rural Educator, 17, 8-15.
TAHOSA, (2014). Annual report, Dar es salaam.
TENMET, (2013). Bringing Tanzania back on track. Statement on 2012 Form IV
Results.
URT, (2012). Basic Education Statistics in Tanzania. Dar es Salaam: The Ministry of
Education and Vocation Training.
URT-MoEC, (1995). Education & Training policy, Dar es salaam, Government
Printer.
Yin, R.K., (2003). Case study research: Design and Methods (3rd). Thousand Oaks,
CA: Sage.
84

APPENDICES
Appendix A
Date conducted: …………..
School Name: ……………………
Working Environment of Teachers
S/No
Infrastructure/Facilities
Required
Available
Shortage
Quality when available
V. Good
Good
V. Poor
1. Classrooms 2. Staff rooms3. Administration Block4. School library
5. School laboratories6. Classroom
blackboards7. Notes boards8. Desks9. Store rooms10. Office chairs and
tables11. Cupboards 12. Toilets13. Size of teaching
classrooms 14. School play grounds15. Water availability
and distance16. Dispensary and
distance17. Teachers’ houses18. Dining Halls 19. Dormitories20. Hostels21. Access to road22. Electricity23. Text books 24. Size of teachers’
offices25. Assembly Halls
85
Appendix B1
Date conducted: …………
School Name: ……………………….
Qualification of Teachers
S/
No
Names of
Teachers
Sex Age Educatio
n Level
Training
Qualification
Years of
Teaching
Teachin
g Grade
Teachin
g
Subject
Teachin
g Load
per week
1.
2.
3.
4.
5.
6.
7.
8.
9.
10.
11.
12.
13.
14.
86
Appendix B2
Students Performance Records for Years 2010-2014
Y
R
2010 2011 2012 2013 2014
D
I
V
1 2 3 4 0 1 2 3 4 0 1 2 3 4 0 1 2 3 4 0 1 2 3 4 0
S/
N
SCHOO
L
1. Moringe
2. Nanja
3. Moita
4. Lowasa
5. Engutot
o
6. Irkisong
o
7. O,lengai
8. Oltinga
Total
87