Embed Size (px)
Citation preview

THE
QUARTERLY JOURNALOF ECONOMICS
Vol. CXXI August 2006 Issue 3
PAY, REFERENCE POINTS, AND POLICEPERFORMANCE*
ALEXANDRE MAS
Several theories suggest that pay raises below a reference point will reducejob performance. Final offer arbitration for police unions provides a unique op-portunity to examine these theories, as the police officers either receive theirrequested wage or receive a lower one. In the months after New Jersey policeofficers lose in arbitration, arrest rates and average sentence length decline, andcrime reports rise relative to when they win. These declines in performance arelarger when the awarded wage is further from the police union’s demand. Thefindings support the idea that considerations of fairness, disappointment, and,more generally, reference points affect workplace behavior.
I. INTRODUCTION
While much of our understanding of labor markets derivesfrom the idea that workers respond to incentives, an importanttheoretical literature stresses psychological and nonmarket fac-tors as determinants of employee performance.1 There is growingevidence that employees are less satisfied not just with low pay,
* I am indebted to Orley Ashenfelter and Gordon Dahl for providing the dataon arbitration cases. I am also grateful to George Akerlof, David Card, HenryFarber, Alan Krueger, Jonathan Leonard, David Levine, Enrico Moretti, MatthewRabin, Rebecca Rainof, Cecilia Rouse, Jesse Rothstein, and seminar participantsat Humboldt University, Nuffield College, Hebrew University, Universitat Pom-peu Fabra, University of California–Berkeley, University of California–Davis,Stanford Graduate School of Business, London School of Economics, NationalBureau of Economic Research, and University of Illinois–Urbana-Champaign,and the Princeton University labor lunch for helpful suggestions. Financial sup-port was provided by Fellowship for Woodrow Wilson Scholars and the IndustrialRelations Section of Princeton University.
1. A prominent example is the fair wage-effort hypothesis of Akerlof andYellen [1990].
© 2006 by the President and Fellows of Harvard College and the Massachusetts Institute ofTechnology.The Quarterly Journal of Economics, August 2006
783

but with pay below a reference or “fair” wage.2 Although there isprovocative evidence from laboratory experiments (e.g., Fehr andGachter [2000]), there is little field evidence about whether thesedeviations also reduce productivity. This paper assesses the re-lationship between pay raises, expectations, and employee per-formance in an actual labor market.
Final offer arbitration of wage disputes provides an attrac-tive real-world laboratory to investigate how on-the-job perfor-mance of labor market participants responds to changes in com-pensation relative to a reference point. In final offer arbitration(FOA), disputing parties submit offers to an arbitrator who isconstrained to choose one of the disputant’s offers in a bindingsettlement. Final offer arbitration is commonly employed in ne-gotiations involving public sector unions. I employ a data setcontaining information on final offer arbitration cases involvingcompensation disputes between New Jersey police bargainingunits and municipalities in the years between 1978 and 1996.After matching the arbitration data to monthly measures of po-lice effectiveness by jurisdiction, I test whether police perfor-mance depends on the arbitration outcome and, when arbitratorsrule against the union, the size of the loss incurred.
There are several reasons why arbitration systems are at-tractive for this study. First, because there is often divergencebetween what the union asked for and what they actually re-ceived, I can assess the effect of deviations of awarded pay frompay demands on productivity. Second, arbitration rulings have asurprise component, as the arbitrator’s preferred award may beunknown. In fact, the equilibrium outcome in standard theories offinal offer arbitration—for example, Farber [1980]—is for thearbitrator to select the winning party at random. This is becausethe offers the disputing parties submit to the arbitrator serve assufficient statistics for information relevant to police compensa-tion. Consistent with this prediction, I cannot reject that cities inwhich the arbitrator ruled against the unit have the same mu-nicipal level characteristics as cities where the arbitrator ruled inits favor. The empirical strategy employed in this paper, however,
2. Adams [1965] is a classic study on equity theory that experimentally linkshigher pay with higher effort. More recently, surveys of employers suggest thatdeviations from reference wages affect worker morale and that managers arereluctant to lower wages [Bewley 1999; Blinder and Choi 1990; Kaufman 1984;Agell and Lundborg 1995]. Brown et al. [2005] present survey and experimentalevidence that relative pay matters for employee satisfaction.
784 QUARTERLY JOURNAL OF ECONOMICS
is robust to violations of this condition, as it allows for differencesin prearbitration levels of police effectiveness and for perma-nent unobserved heterogeneity of bargaining units and theiremployers.
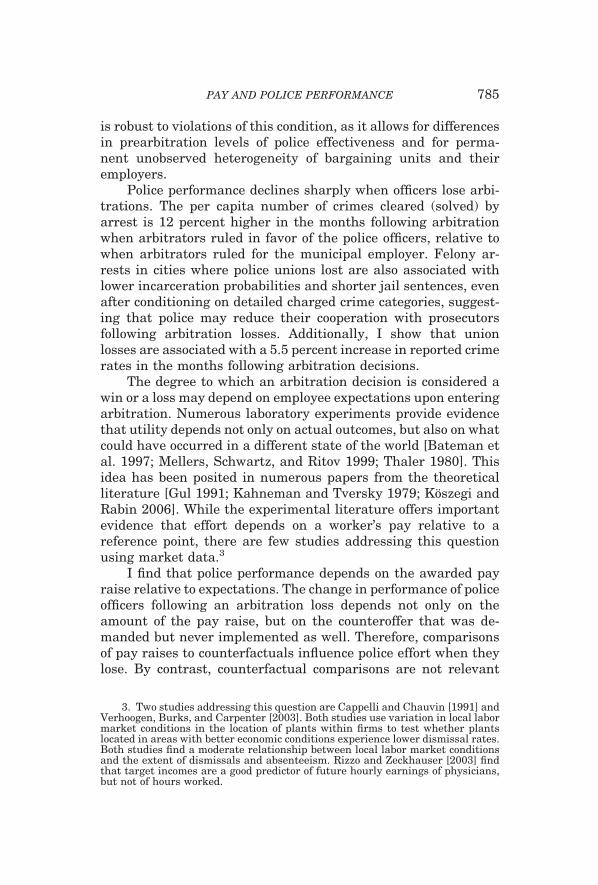
Police performance declines sharply when officers lose arbi-trations. The per capita number of crimes cleared (solved) byarrest is 12 percent higher in the months following arbitrationwhen arbitrators ruled in favor of the police officers, relative towhen arbitrators ruled for the municipal employer. Felony ar-rests in cities where police unions lost are also associated withlower incarceration probabilities and shorter jail sentences, evenafter conditioning on detailed charged crime categories, suggest-ing that police may reduce their cooperation with prosecutorsfollowing arbitration losses. Additionally, I show that unionlosses are associated with a 5.5 percent increase in reported crimerates in the months following arbitration decisions.
The degree to which an arbitration decision is considered awin or a loss may depend on employee expectations upon enteringarbitration. Numerous laboratory experiments provide evidencethat utility depends not only on actual outcomes, but also on whatcould have occurred in a different state of the world [Bateman etal. 1997; Mellers, Schwartz, and Ritov 1999; Thaler 1980]. Thisidea has been posited in numerous papers from the theoreticalliterature [Gul 1991; Kahneman and Tversky 1979; Koszegi andRabin 2006]. While the experimental literature offers importantevidence that effort depends on a worker’s pay relative to areference point, there are few studies addressing this questionusing market data.3
I find that police performance depends on the awarded payraise relative to expectations. The change in performance of policeofficers following an arbitration loss depends not only on theamount of the pay raise, but on the counteroffer that was de-manded but never implemented as well. Therefore, comparisonsof pay raises to counterfactuals influence police effort when theylose. By contrast, counterfactual comparisons are not relevant
3. Two studies addressing this question are Cappelli and Chauvin [1991] andVerhoogen, Burks, and Carpenter [2003]. Both studies use variation in local labormarket conditions in the location of plants within firms to test whether plantslocated in areas with better economic conditions experience lower dismissal rates.Both studies find a moderate relationship between local labor market conditionsand the extent of dismissals and absenteeism. Rizzo and Zeckhauser [2003] findthat target incomes are a good predictor of future hourly earnings of physicians,but not of hours worked.
785PAY AND POLICE PERFORMANCE

when police win in arbitration, signifying that these workers areprone to a form of loss aversion. On the whole, these resultshighlight the importance of managing and, in particular, lower-ing employee expectations prior to manipulating wage policy inorganizations.
II. CONCEPTUAL FRAMEWORK OF FINAL OFFER ARBITRATION
Before proceeding, it is helpful to review the context sur-rounding the arbitration cases under analysis, as well as to out-line a conceptual framework of final offer arbitration. Between1978 and 1996 the default procedure for dispute resolution be-tween police bargaining units and their employers in New Jerseywas final offer arbitration.4 Beginning in 1968, public sectoremployees in New Jersey were allowed to engage in collectivebargaining but were not allowed to strike in cases where negotia-tions failed. As a result, many negotiations were drawn out, oftenresolved well after the date of the contract. To remedy this prob-lem, arbitration was legislated in 1977 specifying the procedureby which such impasses would be resolved. The New Jersey Fireand Police Arbitration Act mandated that collective bargainingmust be initiated 120 days prior to the contract expiration date,and, if an agreement was not reached 60 days before that date,parties must begin arbitration proceedings. Between 1976 and1996, approximately 9 percent of contract expirations of policeofficers resulted in arbitration over salary demands.
Salient questions in the theoretical analysis of FOA arewhether parties in dispute can reach an agreement before arbi-tration, what the determinants of the final offers are if the partiescannot reach an agreement, and how the arbitrator rules giventhe final offers. In traditional theoretical models of FOA, thearbitrator rules in favor of the party whose offer is nearest to hisor her preferred award. Farber’s [1980] insight is that from thepoint of view of the disputants, the arbitrator’s preferred award isstochastic. Therefore, the parties in dispute will make their de-cision under uncertainty and choose offers that maximize theirexpected utility. To make the model concrete, I present the basic
4. Ashenfelter and Dahl [2005] and Lester [1984] review public sector disputeresolution procedures in New Jersey.
786 QUARTERLY JOURNAL OF ECONOMICS

setup of Farber’s model of final offer arbitration.5 While thismodel may not be a literal description of reality, it provides auseful framework for thinking about the problem negotiatingparties face in arbitration.
Denote ra as the arbitrator’s preferred pay raise, re as theemployer’s proposed pay raise, ru as the union’s proposed payraise, and w as the wage from the previous contract. A simpledecision rule for the arbitrator is to select the employer’s offer if�ra � re� � �ra � ru�. While disputing parties do not observe ra,they do know its distribution, which by the arbitrator exchange-ability condition has a common distribution for all arbitrators.6
The “facts” of the case enter into the model through the mean, �,of ra. If the police are relatively productive and they deserve asizable pay raise, then � will be large, but how large depends onhow the population of arbitrators value performance. Under theassumption that the arbitrator rules in favor of the party whoseoffer is closest to his or her preferred award, disputing partiesselect offers that will maximize their expected utility, given theoffer of the opposing party, by trading off the probability ofwinning in arbitration and the resulting payoff. Denoting P as theprobability that the arbitrator rules in favor of the employer, theexpected utility for the employer and union, respectively, is
EU�re,ru� � P � U��1 � re� � w� � �1 � P� � U��1 � ru� � w�,
EV�re,ru� � P � V��1 � re� � w� � �1 � P� � V��1 � ru� � w�.
The solution concept for this model is Nash equilibrium,whereby both parties choose offers such that neither party canachieve higher expected utility by changing it. Three predictionsof the model are that
(i) If disputing parties are equally risk-averse, the winner inarbitration is determined by a coin toss.
(ii) If parties exhibit constant absolute risk aversion, the arbi-trator will be more likely to rule in favor of the more risk-averse party. However, the probability of an employer win isfixed, and is therefore invariant to the facts of the case.7
5. Another classic model of FOA, developed by Gibbons [1988], in which thearbitrator learns from the proposed offers, will lead to similar intuitions.
6. Ashenfelter [1987] notes that since, generally, parties must each agree onthe arbitrator in FOA, if arbitrators value work they will ensure that theirdecisions are unpredictable but drawn from the same distribution as other arbi-trators. This feature of the theory of FOA is called arbitrator exchangeability.
7. Prediction (ii) follows from equation (8) of Farber [1980].
787PAY AND POLICE PERFORMANCE

(iii) The offer spread (ru � re) is a function of �, the uncertaintyabout the arbitrator’s preferred award.
Prediction (i) can be understood by recognizing that informa-tion from the case that the arbitrator uses to make a decision istaken into account in the disputants’ final offers. The arbitratorselects an offer based on forecast error that is uncorrelated to thefacts of the case. If the union is more risk-averse than the em-ployer, then prediction (ii) implies that while we may not observean equal proportion of wins for police and employers in the data,cities where police won and lost in arbitration should not besystematically different. In Section IV, I offer evidence that arbi-trator rulings are in fact orthogonal to the facts of the case.Prediction (iii) implies that as the arbitrator’s preferred awardbecomes more unpredictable, the offer spread increases.
The model is silent as to why disputes ever reach arbitration.If parties know the distribution of the arbitrator’s preferredaward, then they should settle at the mean of the award distri-bution. However, if disputants have divergent beliefs regardingthe population distribution of arbitrator awards or experiencemental rigidity in negotiations, then there may be an incentive toenter into arbitration proceedings. Under these scenarios, theremay be variation in the likelihood that the employer is selected,depending on the size of the offers. For example, the modeldescribed above can be easily modified to allow parties to observethe true � with measurement error. Parties will submit offersthat are higher or lower than would otherwise be optimal, de-pending on the error realization. In this case, the probability thatthe arbitrator rules in favor of the employer will depend onmeasurement error. As I will discuss later, there is evidence thathigher average offers are associated with higher probabilities ofemployer selection, suggesting that parties vary in the conserva-tiveness of their offers. But because there is no relationshipbetween the arbitration outcome and past performance, it ap-pears that the factors leading parties to submit more or lessrealistic offers are not systematically related to historical mea-sures of police performance.
III. DATA SOURCES
Ideally, performance by police would be proxied by variablesthat are thought to unambiguously impact public welfare, forexample, response times or complaints filed against police
788 QUARTERLY JOURNAL OF ECONOMICS

officers. Unfortunately, these measures are not systematicallyavailable for police departments from the period analyzed in thispaper. Instead, the main measure of police performance used inthis paper is the number of crimes cleared by arrest per 100,000residents in a municipality. Clearances refer to the number ofcrimes that have been “solved” by the arrest of one or moreindividuals.8 In general, I will use the term “clearance rate” todenote the number of crimes cleared by arrest in a month per100,000 capita. Police officers have discretion over the number ofarrests they make through a number of mechanisms includingovertime work, absenteeism (the “Blue Flu”), or simply throughthe share of the working day spent actively policing.
Arrests represent costly effort for the police officers involved,due to the energy expended both in the act of arrest and in thesubsequent paperwork. However, under some circumstances, ar-rests could be welfare reducing, for example, if police arrestresidents randomly or, perhaps, target minorities in a discrimi-natory fashion. Nevertheless, a greater number of arrests maysignal a more active police presence in communities, and, in fact,police departments often base their own internal evaluations onthis measure. I will also consider measures of performance thatmay be more closely aligned to public welfare, in particular, crimerates and the sentencing outcomes of arrestees. These measureswill not be at the core of my analysis because of sporadic dataavailability in the case of sentencing and the extent of noise in thecase of the crime rate.
Three sources of data are used in this paper. Informationabout arbitration cases and rulings comes from New Jersey Pub-lic Employment Relations Commission (PERC) documents at theNew Jersey Department of Labor and was used in Ashenfelterand Dahl [2005]. The data describe FOA cases between cities andpolice unions in New Jersey between 1978 and 1995 and includeinformation on the offers submitted to the arbitrator (which areexpressed as percent changes on the previous contract’s wage)and information on whether the arbitrator ruled in favor of themunicipal employer or bargaining unit. I match arbitration casesto monthly clearance and crime data from the FBI Uniform CrimeReporting System (UCR) data files for 1976 through 1996. Some
8. Clearances will differ from the number of arrests if an individual isarrested for multiple crimes or if multiple arrests clear one crime, although thesetwo measures are highly correlated.
789PAY AND POLICE PERFORMANCE

of the cases are dropped from the analysis because they lie tooclose to one another, resulting in overlapping event-study win-dows. The Data Appendix explains the sample selection criteriain more detail. The resulting data set contains 383 arbitrationcases from 255 different cities over salary disputes.
I also use data from the Offender Based Transaction Statis-tics (OBTS). These data track individuals arrested for felonycrimes through the courts and, if convicted, the sentence. Thedata allow me to test whether arrestees have differential proba-bilities of conviction and incarceration, as well as sentence length,depending on the outcome of arbitration. A disadvantage of theOBTS data is that they are available for only a limited number ofyears.
IV. SAMPLING SCHEME AND EMPIRICAL STRATEGY
The models considered in this paper are identified from thestaggered timing of the arbitration rulings. Arbitration cases arestaggered by year and month allowing me to estimate the effect ofarbitration rulings on outcomes after controlling for year �month, as well as arbitration case-specific heterogeneity. Foreach arbitration case I construct an arbitration window of length(N1,N2), which consists of the arbitration month, the N1 monthspreceding arbitration and the N2 months following arbitration.Initially, the analysis only includes cities that experienced arbi-tration and, for these cities, only months that are contained in thearbitration window. I then consider specifications with an aug-mented sample, consisting of the initial sample and a comparisongroup of cities that never underwent arbitration, in order tofacilitate the estimation of statewide time patterns in clearancesand crime.
Because there are cities with multiple arbitration cases, Idrop a number of cases, or months within cases, when the arbi-tration windows overlap. The Data Appendix describes the rulesused to determine inclusion into the study. In general, there is atrade-off between the length of the arbitration window and thenumber of arbitration cases that are used, but the findings arerobust to the use of different lengths of the arbitration window.
A city in which the arbitrator ruled in favor of the policebargaining unit will be denoted as a “Union” city. Likewise, a city
790 QUARTERLY JOURNAL OF ECONOMICS
in which the arbitrator ruled in favor of the municipal employerwill be denoted as an “Employer” city. In the simplest estimator,I compare the average difference in clearances in Union andEmployer cities prior to arbitration with the average difference inclearances after arbitration. This difference-in-difference estima-tor measures the impact of arbitration rulings on performance inUnion cities relative to Employer cities. In richer models, I con-trol for time and arbitration window dummies and also allow forthe additional comparison group of nonarbitrating municipalitiesto help estimate the time effects.
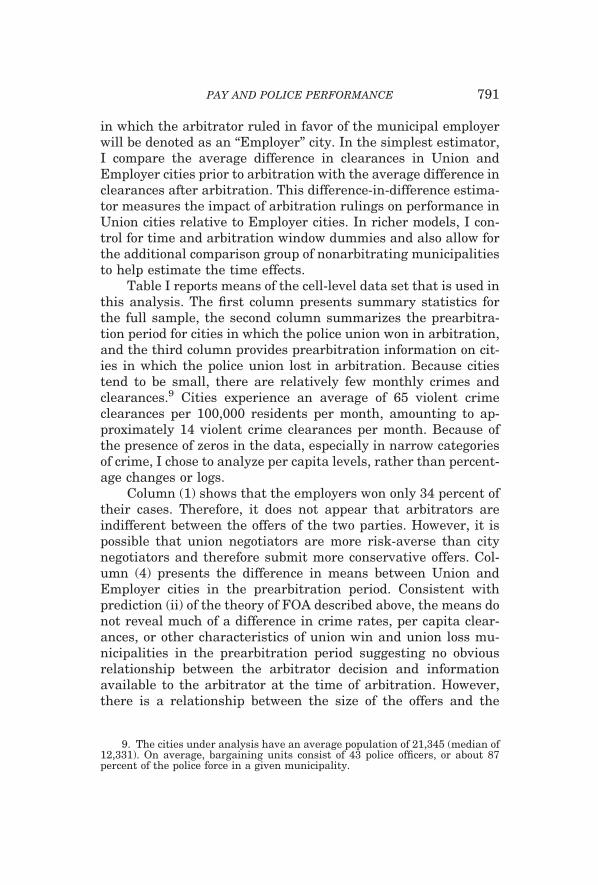
Table I reports means of the cell-level data set that is used inthis analysis. The first column presents summary statistics forthe full sample, the second column summarizes the prearbitra-tion period for cities in which the police union won in arbitration,and the third column provides prearbitration information on cit-ies in which the police union lost in arbitration. Because citiestend to be small, there are relatively few monthly crimes andclearances.9 Cities experience an average of 65 violent crimeclearances per 100,000 residents per month, amounting to ap-proximately 14 violent crime clearances per month. Because ofthe presence of zeros in the data, especially in narrow categoriesof crime, I chose to analyze per capita levels, rather than percent-age changes or logs.
Column (1) shows that the employers won only 34 percent oftheir cases. Therefore, it does not appear that arbitrators areindifferent between the offers of the two parties. However, it ispossible that union negotiators are more risk-averse than citynegotiators and therefore submit more conservative offers. Col-umn (4) presents the difference in means between Union andEmployer cities in the prearbitration period. Consistent withprediction (ii) of the theory of FOA described above, the means donot reveal much of a difference in crime rates, per capita clear-ances, or other characteristics of union win and union loss mu-nicipalities in the prearbitration period suggesting no obviousrelationship between the arbitrator decision and informationavailable to the arbitrator at the time of arbitration. However,there is a relationship between the size of the offers and the
9. The cities under analysis have an average population of 21,345 (median of12,331). On average, bargaining units consist of 43 police officers, or about 87percent of the police force in a given municipality.
791PAY AND POLICE PERFORMANCE

probability of an employer win. This relationship suggests that,conditional on the facts of the case, parties may submit offers ofvarying sizes, perhaps due to heterogeneity in risk aversion ordivergent beliefs. On average, larger offers lead to a higher prob-ability of employer selection. But the degree to which offers areout-of-line with the arbitrator’s preferred award is uncorrelatedwith city characteristics prior to arbitration.
TABLE ISAMPLE CHARACTERISTICS IN THE �12- TO �12-MONTH EVENT TIME WINDOW
(1) (2) (3) (4)
Full samplePrearbitration:employer wins
Prearbitration:employer
loses
Prearbitration:employer win-employer loss
Arbitrator rules foremployer
0.344
Final Offer: Employer 6.11 6.44 5.94 0.50[1.65] [1.54] [1.68] (0.18)
Final Offer: Union 7.65 7.87 7.54 0.32[1.71] [2.03] [1.51] (0.18)
Population 21,345 22,893 20,534 2,358[33,463] [34,561] [32,915] (3,598)
Contract length 2.09 2.09 2.09 0.007[0.66] [0.64] [0.66] (0.071)
Size of bargaining unit 42.58 41.36 43.22 �1.86[97.34] [53.33] [113.84] (15.66)
Arbitration year 85.56 85.85 85.41 0.436[4.75] [5.10] [4.56] (0.510)
Clearances per 100,000 120.31 122.28 118.57 3.71capita [106.65] [108.76] [104.35] (9.46)
Violent crime clearances 64.79 65.29 63.16 2.14per 100,000 capita [71.28] [72.64] [66.79] (6.11)
Property crime 55.51 56.99 55.42 1.57clearances per 100,000capita
[58.72] [58.61] [61.43] (4.92)
Crime reports per 444.03 453.06 439.75 13.30100,000 capita [364.23] [411.99] [309.80] (35.92)
Violent crime reports per 95.49 95.31 92.90 2.41100,000 capita [103.16] [101.78] [98.61] (9.44)
Property crime reports 348.45 357.65 346.72 10.93per 100,000 capita [292.10] [335.62] [242.84] (28.71)
Number of arbitrationcases
383 132 251
Standard errors are in parentheses. Standard deviation are in brackets. In the full sample, observationsare municipality � month cells for the 12 months before and the 12 months after arbitration. The offers arepercentage changes from wages in the previous contract. t-tests involving time-invariant city characteristicsin column (4) are conducted on one month only. For other characteristics, namely clearance and crime rates,t-tests are conducted by regressing the characteristic on an employer win indicator on all prearbitrationmonths while employing robust standard errors that are clustered within the arbitration window. The fullsample in column (1) contains 9538 observations. There are 210 arbitration cases missing information onnumber of police officers in unit. Author’s calculations are based on NJ PERC arbitration cases matched tomonthly municipal clearance and crime rates at the jurisdiction level from FBI Uniform Crime Reports.
792 QUARTERLY JOURNAL OF ECONOMICS

V. THE EFFECT OF ARBITRATION RULINGS ON CLEARANCE RATES
V.A. Graphical Evidence
In order to determine how arbitration outcomes affect thenumber of crimes cleared by arrest, I begin by comparing theaverage number of clearances in the months prior to arbitrationwith the number of clearances in the months after arbitration forUnion and Employer cities. I present these averages in Figure Ifor the grand total of clearances using a relatively long (23,23)month arbitration window, which has the disadvantage of exclud-ing many arbitration rulings, but allows one to examine both thepersistence of effects and prearbitration trends over a relativelylong time span.10 The plot suggests that prior to arbitrationUnion and Employer cities had similar monthly clearance rates,but that after arbitration the clearance rates in these two types ofcities diverged, with police forces in Union cities clearing more
10. The sample means, as in most estimates in this paper, are weighted bypopulation of the jurisdiction in 1976.
FIGURE IMonth-by-Month Comparison of Union and Employer City
Average Clearance RatesAuthor’s calculation based on NJ PERC arbitration cases matched to monthly
municipal clearance rates at the jurisdiction level from FBI Uniform CrimeReports. Sample is weighted by 1976 population. Data span the years 1976through 1996 for arbitration cases occurring between 1978 and 1996.
793PAY AND POLICE PERFORMANCE

crimes by arrest. This clearance rate differential appears toemerge around four months after arbitration, peaking at sevenmonths, and persisting for approximately 22 months. Visual in-spection of Figure I reveals that Union and Employer cities do notappear to have differential trends in per capita clearances prior toarbitration, something one would expect to see if the arbitratorincorporated trends in clearance rates as part of his or her deci-sion rule even after conditioning on the final offers of the disput-ing parties.11
By adding arbitration window and time (month � year) fixed-effects, I allow for arbitrary unobserved heterogeneity acrossarbitration windows—to hold constant permanent differences inclearance rates in cities around the time of arbitration—and Iallow for a general time pattern in clearances in the state over thesample period. In order to facilitate the estimate of the timeeffects, I include a comparison group of 197 cities that neverunderwent arbitration with police unions. These additional citiesare included in the sample for the entire 1976–1996 period. Thesample therefore consists of cities that underwent arbitration inmonths within the arbitration window and cities that did notundergo arbitration for all months in the 1976 to 1996 interval.
Figure II is the regression-adjusted version of Figure I. Toconstruct the figure, I estimate
(1) yt�bc � � � FE � � � UnionWinsb
� �� � EmployerWinsb � εt�bc, � � �23, . . . , 23,FE � �t � b � �c,
where yt�bc denotes clearances per 100,000 capita in time periodt (month � year), time since arbitration �, arbitration window b,and city c. The term FE denotes the collection of fixed-effectsincluded in the model, consisting of arbitration window fixed-effects ( b), month � year fixed-effects (�t), and city fixed-effects(�c). Note that the arbitration window fixed-effects absorb thecity fixed-effects in cities that experienced arbitration, as they arespecific to the time period around the arbitration date. Because ofthe inclusion of the arbitration window fixed-effects, it is notpossible to identify parameters �� and � for each of the months
11. Formally, I cannot reject that union win and union loss cities have thesame prearbitration trends in clearances at conventional levels of significance.
794 QUARTERLY JOURNAL OF ECONOMICS

relative to arbitration. Therefore, �0 and 0 are excluded from themodel, and the remaining coefficients should be interpreted rela-tive to clearances in the arbitration month. The estimated coef-ficients ��� and �� (� � �23, . . . , 23) are plotted against event-timein Figure II.
Figure II confirms that the pattern observed in Figure I isunaffected by regression adjustments. As with the raw means,there does not appear to be a difference in the trend of monthlyclearance rates in the prearbitration period, but there is amarked divergence between the union win and union loss munici-palities in clearances after arbitration.
I conduct inference by estimating the cumulative effect ofarbitration rulings on clearance rates over each of the postarbi-tration months. Using shortened (12,23) windows, in order to
FIGURE IIRegression-Adjusted Event-Study Estimates of the Effect of Arbitration Rulings
on per Capita ClearancesRegression-adjusted estimates are based on a regression of clearances per
100,000 capita on event-time dummies interacted with indicators for whether thearbitrator ruled in favor of the union or against the union. Estimates on theinteracted event-time dummies are plotted relative to the omitted month ofarbitration for Union and Employer cities. Regression model includes controls foryear � month of arbitration dummies, arbitration window fixed-effects, and cityfixed-effects for the group of cities that never underwent arbitration. Author’scalculations are based on NJ PERC arbitration cases matched to monthly munici-pal clearance rates at the jurisdiction level from FBI Uniform Crime Reports.Sample is weighted by population in the jurisdiction in 1976. Data span the years1976 through 1996 for arbitration cases occurring between 1978 and 1996.
795PAY AND POLICE PERFORMANCE

allow for more arbitration cases in the analysis, I fit the followingmodel to the data:12
(2) yt�bc � � � FE � �� � �� � UnionLosesb � εt�bc,� � 1, . . . , 23.
The estimate �� is the estimated gap in per capita clearancesbetween Union and Employer cities in month � after arbitration,relative to the average gap in clearances between Union andEmployer cities during the entire prearbitration period. A nega-tive value of �� means that the gap in the clearance rate betweenUnion and Employer cities in the �th month after arbitration iswider than the average gap in the clearance rate between thesetwo groups during the entire prearbitration period, holding otherthings constant. For each postarbitration date I cumulatively addthe difference-in-difference estimates �� to obtain the total unex-plained gap in the number of clearances between Union andEmployer cities j months after arbitration:
�j � ���1
j
��, j � 1, . . . , 23.
The estimate �j is the cumulative difference-in-difference esti-mate of the effect of winning versus losing arbitration rulings onclearances j months after arbitration.
The plot of �j along with a 90 percent confidence interval ispresented in Figure III. Because there is autocorrelation inmonthly clearances within municipalities, standard errors areclustered within the arbitration windows. In Figure III theUnion/Employer clearance rate gap is significantly larger follow-ing arbitration than in the months before arbitration. The plotted�j points are negative and downward sloping. The decline inclearances in Employer municipalities relative to Union munici-palities begins after the second month, although I cannot rejectthat �j is significantly different from zero at the 10 percent leveluntil four months after arbitration.13 The postarbitration differ-ence in clearances between Employer and Union communitiesappears to persist for approximately one year, and the cumulative
12. Estimates are robust to the use of alternative arbitration windows.13. One reason that it takes a few months for this difference to emerge may
be that it takes time to develop cases leading to arrest.
796 QUARTERLY JOURNAL OF ECONOMICS
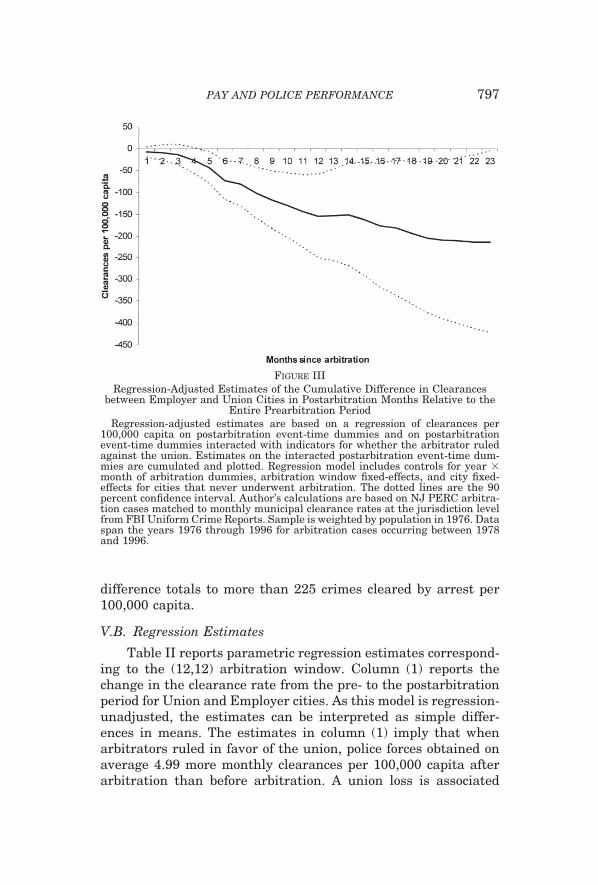
difference totals to more than 225 crimes cleared by arrest per100,000 capita.
V.B. Regression Estimates
Table II reports parametric regression estimates correspond-ing to the (12,12) arbitration window. Column (1) reports thechange in the clearance rate from the pre- to the postarbitrationperiod for Union and Employer cities. As this model is regression-unadjusted, the estimates can be interpreted as simple differ-ences in means. The estimates in column (1) imply that whenarbitrators ruled in favor of the union, police forces obtained onaverage 4.99 more monthly clearances per 100,000 capita afterarbitration than before arbitration. A union loss is associated
FIGURE IIIRegression-Adjusted Estimates of the Cumulative Difference in Clearances
between Employer and Union Cities in Postarbitration Months Relative to theEntire Prearbitration Period
Regression-adjusted estimates are based on a regression of clearances per100,000 capita on postarbitration event-time dummies and on postarbitrationevent-time dummies interacted with indicators for whether the arbitrator ruledagainst the union. Estimates on the interacted postarbitration event-time dum-mies are cumulated and plotted. Regression model includes controls for year �month of arbitration dummies, arbitration window fixed-effects, and city fixed-effects for cities that never underwent arbitration. The dotted lines are the 90percent confidence interval. Author’s calculations are based on NJ PERC arbitra-tion cases matched to monthly municipal clearance rates at the jurisdiction levelfrom FBI Uniform Crime Reports. Sample is weighted by population in 1976. Dataspan the years 1976 through 1996 for arbitration cases occurring between 1978and 1996.
797PAY AND POLICE PERFORMANCE

with a reduction of 6.79 monthly clearances per 100,000 capita. Incolumn (2) the sample is weighted by population in the jurisdic-tion in 1976. As is evident, weighting does not have a substantialeffect on the magnitude of the estimates.
Column (3) presents estimates from a model that controls fortime effects as well as arbitration window and city fixed-effects.As in the statistical models that were used to construct Figures IIand III, I incorporate a comparison group of 197 cities that neverunderwent arbitration in order to facilitate the estimation of thetime effects. Adding the comparison group and controlling forfixed-effects does not change the basic conclusions from the re-gression-unadjusted specifications: that police wins are associ-
TABLE IIEVENT STUDY ESTIMATES OF THE EFFECT OF ARBITRATION RULINGS ON
CLEARANCES: �12- TO �12-MONTH EVENT TIME WINDOW
All clearancesViolent crime
clearancesProperty crime
clearances
(1) (2) (3) (4) (5) (6) (7) (8) (9)
Constant 118.57 141.25 63.16 75.10 55.42 66.15(5.12) (9.94) (3.13) (6.86) (2.88) (4.55)
Postarbitration � �6.79 �8.48 �9.75 �2.54 �3.10 �3.77 �4.26 �5.39 �4.45Employer win (2.62) (2.20) (2.70) (1.75) (1.35) (1.78) (1.62) (2.25) (1.87)
Postarbitration � 4.99 7.92 5.96 4.17 5.62 5.31 0.819 2.31 2.19Union win (2.09) (2.91) (2.65) (1.53) (1.95) (1.42) (1.24) (1.58) (1.37)
Row 3 � Row 2 11.78 16.40 15.71 6.71 8.71 9.08 5.08 7.69 6.40(3.35) (3.65) (3.75) (2.32) (2.37) (2.26) (2.04) (2.75) (2.30)
Employer win 3.71 �2.81 2.14 �5.73 1.57 2.92(Yes � 1) (9.46) (14.92) (6.11) (9.53) (4.93) (7.51)
Fixed-effects? Yes Yes YesWeighted sample? Yes Yes Yes Yes Yes YesAugmented sample? Yes Yes YesMean of the 120.31 120.31 130.82 64.79 64.79 72.15 55.51 55.51 58.63
dependentvariable
[106.65] [106.65] [370.58] [71.28] [71.28] [294.78] [58.72] [58.72] [180.55]
Sample size 9,538 9,538 59,137 9,538 9,538 59,135 9,538 9,538 59,136R2 0.0008 0.005 0.63 0.0007 0.0078 0.59 0.001 0.0015 0.55
Standard errors, clustered on the intersection of arbitration window and city, are in parentheses.Standard deviations are in brackets. The dependent variable is clearances per 100,000 capita. Whenindicated, the sample is weighted by population size in 1976. Observations are municipality � month cells.There are 383 arbitration cases under analysis. The samples in models (1), (2), (4), (5), (7), and (8) consist ofmunicipalities that underwent arbitration, limited to months that are in the arbitration window—12 monthsafter and 12 months before arbitration. The remaining models augment that sample with data on 197municipalities that never underwent arbitration with police departments over wage disputes in the sampleperiod. These additional municipalities are included for all months between 1976 and 1996. The employer-win main-effect is absorbed by the arbitration window dummies and is therefore omitted from models (3), (6),and (9). “Fixed-effects” consist of month � year effects (252), arbitration window effects (383), and city effects(452). All models include a constant. Author’s calculations are based on NJ PERC arbitration cases matchedto monthly municipal clearance rates at the jurisdiction level from FBI Uniform Crime Reports.
798 QUARTERLY JOURNAL OF ECONOMICS
ated with increases in clearances after arbitration, while policelosses are associated with declines. Note that because there areno arbitration cases that lead to no decision, it is not possible toseparately identify the effect of winning in arbitration, losing inarbitration, and simply finishing arbitration, irrespective of theoutcome. But while there may be a postarbitration effect onclearances irrespective of the arbitration outcome, it is still pos-sible to identify the effect of a police win relative to a police loss.The fourth row of Table II corresponds to the change in theUnion/Employer clearance rate differential between the postar-bitration and prearbitration periods. In column (3) this change isestimated as 15.71 clearances per 100,000 capita with a t-ratio of4.19. This estimate implies that the difference in the number ofmonthly clearances per 100,000 capita between Union and Em-ployer cities widened by 12 percent after arbitration.
The postarbitration Union/Employer differentials in clear-ances are present and roughly of the same magnitude for bothviolent and property crimes (see Table II, columns (4)–(9)). TableIII presents estimates of postarbitration clearance rate differen-tials by specific crime type. To the extent that officers may exer-cise discretion on whom to arrest, they do not appear to alterenforcement in murder and rape cases following arbitration rul-ings. However, arbitration rulings have a large effect on clear-ances of assault and robbery crimes as well as all categories ofproperty crimes.
VI. THE EFFECT OF ARBITRATION RULINGS ON CRIME RATES
Table IV shows that the changes in postarbitration clearancerates are not being driven by changing crime rates. In fact,clearances and crime rates move in the opposite direction afterarbitration. Column (6) shows that postarbitration months inEmployer cities are associated with 19.86 additional monthlyproperty crimes per 100,000 capita (t-ratio � 1.78), whereasunion arbitration wins are not associated with a significantchange in the property crime rate following arbitration. Thereappears to be no relationship, however, between the arbitrationdecision and the violent crime rate. Some caution is warranted ininterpreting the estimates for the reported crime outcome, sincethey are measured somewhat imprecisely. While the difference-in-difference estimate of the effect of a union arbitration winrelative to a union arbitration loss is fairly large, estimated as
799PAY AND POLICE PERFORMANCE

TA
BL
EII
IE
VE
NT-S
TU
DY
ES
TIM
AT
ES
OF
TH
EE
FF
EC
TO
FA
RB
ITR
AT
ION
RU
LIN
GS
ON
CL
EA
RA
NC
ES
BY
SP
EC
IFIC
CR
IME
CA
TE
GO
RY:
�12
-T
O�
12-M
ON
TH
EV
EN
T
TIM
EW
IND
OW
(1)
(2)
(3)
(4)
(5)
(6)
(7)
Mu
rder
clea
ran
ces
Rap
ecl
eara
nce
sA
ssau
ltcl
eara
nce
sR
obbe
rycl
eara
nce
sB
urg
lary
clea
ran
ces
Mot
orve
hic
leth
eft
clea
ran
ces
Lar
cen
ycl
eara
nce
s
Pos
tarb
itra
tion
��
0.04
2�
0.07
5�
4.82
�0.
376
�1.
25�
0.15
6�
3.04
Em
ploy
erw
in(0
.064
)(0
.091
)(1
.41)
(0.1
94)
(0.5
89)
(0.1
56)
(1.5
3)P
osta
rbit
rati
on�
�0.
011
�0.
043
2.67
1.16
0.55
10.
271
1.37
Un
ion
win
(0.0
57)
(0.1
32)
(1.5
1)(0
.536
)(0
.527
)(0
.237
)(1
.20)
Row
2�
Row
10.
030
0.03
37.
481.
531.
800.
428
4.41
(0.0
87)
(0.1
60)
(2.0
3)(0
.582
)(0
.778
)(0
.278
)(1
.92)
Mea
nof
the
depe
nde
nt
0.18
41.
1568
.83
1.98
13.7
43.
8541
.05
vari
able
[3.3
3][2
6.53
][2
88.3
1][3
0.69
][1
10.8
2][5
6.25
][1
23.5
8]S
ampl
esi
ze59
,137
59,1
3559
,137
59,1
3759
,136
59,1
3759
,137
R2
0.11
0.18
0.56
0.65
0.20
0.13
0.60
Sta
nda
rder
rors
,clu
ster
edon
the
inte
rsec
tion
ofar
bitr
atio
nw
indo
wan
dci
ty,a
rein
pare
nth
eses
.Sta
nda
rdde
viat
ion
sar
ein
brac
kets
.Obs
erva
tion
sar
em
un
icip
alit
y�
mon
thce
lls.
Th
esa
mpl
eis
wei
ghte
dby
popu
lati
onsi
zein
1976
.Th
ere
are
383
arbi
trat
ion
case
su
nde
ran
alys
is.T
he
sam
ple
ism
un
icip
alit
ies
that
un
derw
ent
arbi
trat
ion
,lim
ited
tom
onth
sth
atar
ew
ith
inth
ear
bitr
atio
nw
indo
w,a
ugm
ente
dw
ith
197
mu
nic
ipal
itie
sth
atn
ever
un
derw
ent
arbi
trat
ion
.Mu
nic
ipal
itie
sth
atn
ever
un
derw
ent
arbi
trat
ion
are
incl
ude
dfo
ral
lmon
ths
betw
een
1976
and
1996
.All
mod
els
incl
ude
mon
th�
year
effe
cts
(252
),ar
bitr
atio
nw
indo
wef
fect
s(3
83),
and
city
effe
cts
(452
).A
llm
odel
sin
clu
dea
con
stan
t.A
uth
or’s
calc
ula
tion
sar
eba
sed
onN
JP
ER
Car
bitr
atio
nca
ses
mat
ched
tom
onth
lym
un
icip
alcl
eara
nce
rate
sat
the
juri
sdic
tion
leve
lfr
omF
BI
Un
ifor
mC
rim
eR
epor
ts.
800 QUARTERLY JOURNAL OF ECONOMICS

�15.46 in column (6), it is imprecise, having a standard error of13.96. Nevertheless, the point estimates suggest the effect of anarbitration loss on the number of crimes cleared by arrest will infact be larger in magnitude than the estimates reported in TableII, as, mechanically, police make more clearances when crimerates are higher.
To better assess the relationship between arbitration out-come and the per capita crime rate in the months after arbitra-tion, I construct figures plotting the cumulative effect of arbitra-tion rulings on reported crime over event time. A cumulative plotof postarbitration crime rates for Union cities relative to Em-ployer cities, analogous to Figure III, shows that Employer citiesexperienced elevated crime rates in the postarbitration monthsrelative to Union cities. However, the confidence interval is verywide, and the cumulative estimates are never significantly differ-
TABLE IVEVENT-STUDY ESTIMATES OF THE EFFECT OF ARBITRATION RULINGS ON CRIME: �12-
TO �12-MONTH EVENT TIME WINDOW
All crime Violent crime Property crime
(1) (2) (3) (4) (5) (6)
Constant 612.18 150.26 461.81(63.98) (23.23) (42.00)
Postarbitration � 26.86 24.68 7.75 4.87 19.19 19.86Employer win (25.29) (14.68) (7.85) (4.70) (18.17) (11.19)
Postarbitration � 7.64 6.68 7.07 2.49 0.170 4.40Union win (16.24) (11.42) (5.46) (4.46) (11.68) (7.87)
Row 3 � Row 2 �19.21 �18.01 �0.68 �2.38 �19.02 �15.46(30.06) (19.12) (9.56) (6.63) (21.60) (13.96)
Employer win �31.81 �20.43 �11.35(Yes � 1) (84.42) (27.57) (59.50)
Fixed-effects? Yes Yes YesMean of the dependent 444.03 519.42 95.49 98.26 348.45 421.28
variable [364.23] [2037.4] [103.16] [363.76] [292.10] [1865.8]Sample size 9,528 59,060 9,529 59,085 9,537 59,119R2 0.001 0.54 0.007 0.76 0.0003 0.42
Standard errors, clustered on the intersection of arbitration window and city, are in parentheses.Standard deviations are in brackets. Observations are municipality � month cells. The dependent variablesare crime reports per 100,000 capita. The sample is weighted by population size in 1976. There are 383arbitration cases under analysis. The sample is municipalities that underwent arbitration, limited to monthsthat are within the arbitration window, augmented with 197 municipalities that never underwent arbitra-tion. Municipalities that never underwent arbitration are included for all months between 1976 and 1996.“Fixed-effects” consist of month � year effects (252), arbitration window effects (383), and city effects (452).All models include a constant. Author’s calculations are based on NJ PERC arbitration cases matched tomonthly municipal clearance rates at the jurisdiction level from FBI Uniform Crime Reports.
801PAY AND POLICE PERFORMANCE

ent from zero. Recalling Table IV, however, there is a significantchange in the crime rate in Employer cities after arbitration.Therefore, it is instructive to make fewer demands on the dataand simply plot the cumulative difference in Employer city crimerates at each postarbitration month relative to the average crimerate in Employer cities during the entire prearbitration period. Toconstruct this figure, I estimate
(3) ymt�b � � � FE � �� � UnionWinb
� �� � EmployerWinb � εmt�b, � � 1, . . . , 23.
For each postarbitration date I calculate the cumulative excessnumber of crimes reports up to that date in Employer municipal-ities relative to the average crime rate during the entire prearbi-tration period:
�j � �k�1
j
�k, j � 1, . . . , 23.
Estimates of �j are plotted in Figure IV for total crime reports.Inspection of Figure IV shows that there were more than 600excess crime reports per 100,000 capita in Employer cities in the23 months after arbitration. Crime reports appear to rise fivemonths after arbitration and are statistically distinguishablefrom zero at the 10 percent level of significance during months 6through 16.
The estimates on the crime outcome are additionally inter-esting from the perspective of the economics and crime literature.A long-standing question is the effect of increased police presenceon crime. While the point estimates are somewhat imprecise, theysuggest that the elasticity of crime with respect to clearances isapproximately �0.3, assuming that arbitration rulings affectcrime only through changes in police presence. This elasticity isin line with the OLS estimates on the elasticity of crime withrespect to police as reported in Levitt [1997] and McCrary [2002].The increase in crime observed after police arbitration losses mayoccur either through criminals’ response to the reduced presenceof police, or through a containment channel—more clearancesresult in fewer free potential criminals.
The estimate on reported crime due to a losing arbitrationoutcome can also be used to bound how much the employer(taxpayers) are willing to pay in order to reduce crime. A back-
802 QUARTERLY JOURNAL OF ECONOMICS

of-the-envelope calculation implies that the willingness to pay toprevent a single crime is bounded above at $487, which is a verylow quantity.14 To put this figure into perspective, assume thatthe elasticity of crime with respect to police officers is �0.3. In atypical town in the sample, hiring one additional police officer at$50,000 per year would result in a decline of nine crimes, amount-ing to $5,560 per crime prevented. It may be that the willingnessto pay to reduce crime is low because most of the excess crimes
14. We can suppose that a risk-neutral employer compares the expectedpayoff from entering into arbitration with the expected payoff from settling withthe union. Consider the case of a typical town in the sample, which has apopulation of 21,345 and 50 police officers with salaries of $50,000 per year. Usinga probability of a union arbitration win of 0.66 if the employer does not settle withthe union, it reveals that it is unwilling to pay more than 2 � wage bill � (unionoffer � employer offer), or $75,000, in order to prevent 154 crimes from occurring.
FIGURE IVRegression-Adjusted Estimates of the Cumulative Effect of
Union Losses on CrimeRegression-adjusted estimates are based on a regression of crimes per 100,000
capita on event-time dummies for the postarbitration months interacted withindicators for whether the arbitrator ruled in favor of the union or against theunion. Postarbitration event-time dummies interacted with an employer windummy are cumulated and plotted. Regression model includes controls for yearand month of arbitration dummies as well as arbitration window fixed-effects.Cities that never underwent arbitration are also included and are each assigneda fixed-effect. The dotted lines are the 90 percent confidence interval. Author’scalculations are based on NJ PERC arbitration cases matched to monthly munici-pal crime rates at the jurisdiction level from FBI Uniform Crime Reports. Sampleis weighted by population in 1976. Data span the years 1976 through 1996 forarbitration cases occurring between 1978 and 1996.
803PAY AND POLICE PERFORMANCE

reported following arbitration losses are property crimes and maybe relatively minor in nature. It could also be that city managersfailed to recognize the social costs associated with police arbitra-tion losses. If this is the case, then the ratio of the true willingnessto pay to prevent crime and the one implied by the calculationabove may be considered a measure of the ignorance of employernegotiators.
While there were statistically significant increases in re-ported crime in Employer cities after arbitration, as stressedearlier, these change are not statistically distinguishable fromthe change in the crime rate occurring from the pre- to thepostarbitration period in Union cities, which is negligible butestimated with large standard errors. The noisiness that is in-herent in the crime outcome complicates inference and leads toestimates that are measured imprecisely in some cases. There-fore, I will focus primarily on clearances as the outcome of inter-est in the subsequent analysis.
VII. THE EFFECT OF ARBITRATION RULINGS ON
SENTENCING OUTCOMES
In this section I ask how arbitration affects defendant out-comes through the courts, focusing in particular on the probabil-ity of conviction and incarceration and on the sentencing of ar-restees. These measures are informative about how the “quality”of policing may have changed after arbitration. I will considerwhether the elevated number of clearances following police arbi-tration wins is the result of police targeting a different mix ofcrimes depending on the arbitration ruling and whether sentenc-ing outcomes of arrestees depends on the arbitration outcomebecause police collect less evidence or present lower quality evi-dence to the prosecutor following losses.
Unfortunately, the UCR data do not contain information onthe final disposition of the arrestee, specifically, whether thearrest resulted in a conviction and, if so, the sentence. Instead, Iuse information from administrative data on information of ar-restees from the point of arrest through final disposition drawnfrom the Offender Based Transaction Statistics (OBTS). Thisseries was produced by the Bureau of Justice Statistics with theintention of tracking individuals from the point of entry into thecriminal justice through final disposition. By matching arrestedindividuals in the OBTS to agencies in the arbitration data files,
804 QUARTERLY JOURNAL OF ECONOMICS

I can test whether conviction rates, incarceration rates, and sen-tencing depend on the arbitration outcome at the time of arrest.
The OBTS files include New Jersey for the period 1987–1990,although identifiers for arresting agency and month are onlyavailable for 1989 and 1990. Cases in the OBTS are reported bydate of final disposition. Data in the 1989 and 1990 files containindividuals who reached their final disposition in these two years.Therefore, for this section I limit the arbitration cases underanalysis to those for which the first and last month of a (12,12)arbitration window occur between 1987 and 1990. This exclusionresults in the use of 40 arbitration cases in the analysis. I matcheach individual to the municipality where he or she was arrestedand retain individuals who were arrested in the twelve monthsbefore or in the twelve months after an arbitration ruling. Ulti-mately, I compare sentencing outcomes of individuals who werearrested for felonies in Union and Employer cities between 1987and 1990 and obtained final disposition between 1989 and 1990 inmunicipalities that experienced arbitration between 1988 and1989. Because the data files are organized by date of disposition,I am necessarily missing defendants who were involved in pro-longed trials and whose cases may have been relatively serious.This may present a problem when comparing the pre- to postar-bitration periods, since individuals who appear in the data setand were arrested postarbitration will have had their cases dis-posed of relatively quickly as compared with individuals arrestedin the prearbitration period. However, it is still possible to com-pare postarbitration outcomes in Union and Employer cities.
The OBTS analysis, while limited by the relatively smallnumber of arbitration cases that can be used, suggests that thedifferences in policing activity observed in the postarbitrationperiod are substantive. Panel A of Table V displays estimatesfrom linear probability models for the probability of conviction(columns (1) and (2)) and incarceration (columns (3) and (4)). Allmodels in the table include controls for demographic informationof the defendants, year and season effects, year of final disposi-tion dummies, and arbitration window dummies.
The difference-in-difference estimates on conviction probabil-ities in columns (1) and (2) show that the probability of convictionfor individuals arrested in Union cities did not change from thepre- to the postarbitration period relative to Employer cities.These estimates suggest that the rising number of arrests in
805PAY AND POLICE PERFORMANCE

TABLE VARBITRATION DECISIONS AND SENTENCING OUTCOMES
Panel A: Sentencing
OLS: Conviction(Yes � 1)
OLS: Incarceration(Yes � 1)
(1) (2) (3) (4)
Postarbitration � 0.0190 0.0186 �0.0115 �0.0009Employer win (0.0606) (0.0328) (0.0405) (0.0378)
Postarbitration � 0.0161 0.0080 0.0645 0.0535Union win (0.0273) (0.0238) (0.0295) (0.0261)
Row 2 � Row 1 �0.0028 �0.0106 0.0760 0.0543(0.0599) (0.0368) (0.0215) (0.0226)
Charge dummies? Yes YesMean of the dependent 0.791 0.791 0.318 0.318
variable [0.407] [0.407] [0.466] [0.466]Sample size 6,685 6,685 6,685 6,685R2 0.041 0.135 0.050 0.111
Panel B: Outcomes Conditional on Conviction
Incarceration (Yes � 1) Sentence
(1) (2) (3) (4)
Postarbitration � �0.0321 �0.0156 �0.1866 0.0878Employer win (0.0430) (0.0435) (0.1629) (0.1704)
Postarbitration � 0.0771 0.0722 0.6382 0.4964Union win (0.0291) (0.0254) (0.2234) (0.1844)
Row 2 � Row 1 0.1092 0.0878 0.8249 0.4086(0.0250) (0.0264) (0.1589) (0.1277)
Charge dummies? Yes YesMean of the dependent 0.402 0.402 1.658 1.658
variable [0.490] [0.490] [3.861] [3.861]Sample size 5,289 5,289 5,162 5,162R2 0.054 0.128 0.031 0.334
Standard errors, clustered on arbitration window, are in parentheses. Standard deviations are inbrackets. Observations are individuals arrested for felonies between 1987 and 1990, who obtained finaldisposition between 1989 and 1990, in municipalities that experienced arbitration between 1988 and 1989.There are 40 arbitration cases used in this analysis. There are 85 charge dummies, which indicate the crimefor which the defendant was charged. All models include a constant, year and month of arrest dummies, yearof final disposition dummies, and arbitration window dummies. For the sentence outcome, 13 offenders whoreceived the death penalty were dropped from the sample. If the same offender appears more than once in thedata, only the first offense is used. Offenders with a missing offense code or conviction code are dropped fromthe sample. Sentence is the maximum length of the jail sentence imposed for an offense expressed in fractionsof a year. Conditional on conviction, the average sentence is 1.66 years (std. dev. � 3.86). Conditional onincarceration, the average sentence is 4.28 years (st. dev. � 5.22). Author’s calculations are based on NJPERC arbitration data matched to arrestees from the Offender Based Transaction Statistics.
806 QUARTERLY JOURNAL OF ECONOMICS

Union municipalities following arbitration is not the result ofpolice arresting the innocent. Defendants who were arrested afteran arbitration decision were no less likely to be convicted if thearbitrator ruled in favor of the police relative to when the arbi-trator ruled against the police.
The estimates in column (3) of Panel A indicate that defen-dants arrested following union wins were more likely to be incar-cerated as compared with defendants arrested after union losses.In column (3) the probability of incarceration increased by 0.076points in Union cities relative to Employer cities in the twelvemonths after arbitration relative to the twelve months beforearbitration. This estimate has a t-ratio of 3.55 and corresponds toapproximately a 22 percent increase in the incarceration proba-bility in Union cities from the pre- to the postarbitration periodrelative to the change in the incarceration probability in Em-ployer cities. The effect of arbitration on the incarceration out-come is large and suggests that there were important differencesin policing strategies depending on the arbitration outcome in thecities in this sample. One reason that there could be such a largeincrease in the probability of incarceration is that police in Em-ployer cities shifted their arrests toward less-serious offenders.However, when conditioning on charged offense categories incolumn (4), the difference-in-difference estimate of a union winversus a union loss declines by only 0.022 points. It appears thatdefendants in Union cities have a higher incarceration probabil-ity for a given crime charged suggesting that, perhaps, policecollected less evidence, or provided less evidence to prosecutors,following arbitration losses.
VIII. EMPLOYMENT, OVERTIME, AND TURNOVER
The observed changes in clearance and crime rates afterarbitration are not the result of changes in the number of police,as Mas [2006] shows that employment in Union cities did notchange significantly relative to employment in Employer citiesfollowing arbitration. It is possible, though, that, in response toarbitration rulings, police officers change their labor supply de-cision at the intensive margin, for example through changingovertime hours. In fact, this may be a mechanism through whichthe observed changes in performance measures from the pre- topostarbitration period may occur. However, basic economic the-
807PAY AND POLICE PERFORMANCE

ory would not predict that these changes in overtime hours sup-plied by officers are the rational response to changing prices. Ifthe labor demand curve is downward sloping, then the increase inwages associated with a union win would lead the municipalemployer to cut overtime hours, resulting in fewer clearances, incontrast to what actually occurs. Additionally, all of the arbitra-tion cases involved nominal pay raises, and most involved realpay raises. If the patterns seen in the data were the result of achange in the labor supply of police officers at the intensivemargin in response to the changes in the wage, then it would haveto be the case that, on average, the substitution effect dominatesthe income effect when police win in arbitration, but the incomeeffect dominates when police lose. Such behavior would beunusual.
Two additional mechanisms that may account for postarbi-tration changes in productivity are increased turnover and ad-verse selection of officers following union losses.15 There areseveral reasons why these mechanisms fail to explain the pat-terns in clearance rates seen in the data. First, the turnover rateof police officers is typically low, as compared with other occupa-tions; typical officers have ten years of seniority [Aamodt 2004].Second, collective bargaining agreements would not permit a cityto substitute higher for lower skilled officers. If the increase inclearances following police wins is coming from new and rela-tively skilled recruits, these recruits would have to fill existingvacancies. But, as already mentioned, there is no evidence thatemployment levels changed after arbitration. Finally, police arehighly responsive to arbitration rulings even though the gapsbetween the disputing party’s offers are often not large, averagingaround 1.5 percent. The pronounced response to arbitration rul-ings with relatively small spreads suggests that psychologicalfactors may have influenced the quantity of effort supplied by theofficers following arbitration. I now turn to this question.
15. The higher pay that is associated with an arbitration win may lead toreduced turnover, as in Salop [1979], and as a result, higher productivity. In theadverse selection case, arbitration losses may result in a situation where bettermembers of police departments leave and are replaced by less skilled officers, asin Weiss [1980]. However, McCrary [2003] finds no evidence that the introductionof affirmative action quotas in police departments led to increases in crime, eventhough the quotas meant hiring candidates with test scores below what wouldhave been acceptable prior to their introduction.
808 QUARTERLY JOURNAL OF ECONOMICS

IX. REFERENCE POINT COMPARISONS AND POLICE PERFORMANCE
In Bewley’s [1999] study, managers report that morale ishurt when pay raises are lower than expectations. The conse-quences of low morale can be significant, resulting in a mood thatis not conducive to work and work environments where employ-ees are unwilling to make sacrifices for the organization. Em-ployee reactions to lower than expected pay may represent aresponse to a perceived insult, or simply disappointment. Underboth of these scenarios, productivity depends on changes in payrelative to a reference level. A central goal of this study is toexamine whether, in fact, the degree to which workers reduceeffort following arbitration depends on the size of the loss that isincurred.
IX.A. Clearances Depend on the Comparison of Awarded Pay toPay Demands
As mentioned in the Introduction, determining whether pro-ductivity depends on pay raises in relation to a reference point istypically challenging because reference points are unobserved. Anatural reference point candidate is the “fair wage,” or what otherpolice officers earn in similar circumstances. Such a wage may bedifficult to calculate because, to do so, one must have the sameinformation on police performance and city characteristics thatwas available to the parties at the time of arbitration, or somenotion of the right comparison city. However, because informa-tion on each party’s offer in arbitration is available, this calcula-tion is unnecessary in this case. Unions engage in arbitrationprecisely because, from their point of view, the employer’s offer isnot the fair offer. Therefore, in the case of a union loss, the gapbetween the union’s demand and the award (the employer’s offer)is a measure of the degree of the loss. A simple test of whethercomparisons of pay to reference points affect police performanceis to determine whether reductions in clearances following arbi-tration become more pronounced as the gap between the uniondemand and the arbitrator award widens. Such a finding wouldsuggest that counterfactuals, which have no material effect onthe police officers, affect workplace behavior.
A convenient way to implement the test is to plot the rela-tionship between postarbitration changes in performance and thedeviation of the award from the average of the offers. This way,one can see how performance responds to both the distance be-
809PAY AND POLICE PERFORMANCE

tween the union demand and the award, in the case of a policeloss, and the distance between the award and the employer offer,in the case of a police win.16 In Figure V, I examine this relation-ship. For each of the 383 arbitration cases, I calculate the changein the average clearance rate from the twelve months before tothe twelve months after arbitration. I then nonparametricallyestimate the expected change in clearances conditional on thedistance of the arbitrator award to the average of the final offers,
16. Another way to think about this approach, from the theoretical perspec-tive, is that the arbitrator forms a preferred (fair) offer by determining what otherpolice forces would earn in similar cities. In expectation, the average of theparties’ equilibrium offers is the arbitrator’s preferred award.
FIGURE VEstimated Expected Change in Clearances Conditional on the Deviation of the
Award from the Average of the OffersThe figure plots the local-linear estimate of the expected change in clearances
conditional on the gap between the arbitrator award and the average of the finaloffers for 383 arbitration cases from the 12 months prior to arbitration to the 12months after arbitration. The dotted line is the 90 percent confidence band. Thesample is weighted by population in the jurisdiction in 1976. Data span the years1976 through 1996 for arbitration cases occurring between 1978 and 1996. Au-thor’s calculations are based on NJ PERC arbitration cases matched to monthlymunicipal clearance rates at the jurisdiction level from FBI Uniform CrimeReports.
810 QUARTERLY JOURNAL OF ECONOMICS

allowing for a break at zero, using a local linear smoother. I termthis conditional expectation the “effort-response” function.
The effort-response function provides support for the refer-ence point hypothesis. In interpreting Figure V, it is useful tonote that when the award is greater than the average of the finaloffers the union has won arbitration, and when the award is lowerthan the average of the final offers the employer has won arbi-tration. The noteworthy feature of this plot is that when policelose in arbitration there is a pronounced positive relationshipbetween the distance of the award from the average of the finaloffers and the change in clearances following arbitration. Thisrelationship indicates that police effort following arbitration de-pends on the gap between the pay raise that the union demandedin negotiations and the actual award.
Theories of reference-dependent preferences emphasize thatlosses resonate more than gains [Kahneman and Tversky 1979].If the observed positively sloped effort-response function occur-ring when police lose has a psychological explanation, as would bethe case if comparisons of awards to reference points lead policeto reduce performance due to considerations of fairness or disap-pointment, then we should expect this function to flatten whenthe award meets or exceeds the reference point, in other words,when police win. Indeed, the figure shows that as the differencebetween the award and the average of the offers crosses the zerothreshold, there is a marked jump in the effort-response function,but the slope of the curve flattens considerably.
Column (1) of Table VI confirms that the degree of loss isstrongly related to the change in postarbitration clearances in aparametric model with covariates. This column presents esti-mates from a parsimonious parameterization of the effort-re-sponse function:
(4) ymt�b � � � FE � 1post� � 2�post� � LOSS SIZEb� � εmt�cb,
where LOSS SIZE � (union demand � arbitrator award). Theestimate on the coefficient on LOSS SIZE is �10.31, with a t-ratioof 6.49, signifying that the gap between the award and the uniondemand has a very strong relationship to the change in thepostarbitration clearance rate.17 This relationship implies that if
17. In New Jersey, the spread in offers has declined over time, and conse-quently, the results can also be interpreted as capturing a downward trend in themagnitude of postarbitration productivity declines in Employer cities across ar-
811PAY AND POLICE PERFORMANCE

two unions each receive a 5 percent raise, but one asked for 15percent while the other asked for 6 percent then, ceteris paribus,the union that demanded the smaller amount will clear approxi-mately 90 more crimes per 100,000 capita each month followingarbitration than the union that demanded a larger raise.
The flat portion of the effort-response function in Figure V,when the award exceeds the average of the offers, suggests thatthe size of the award alone does not drive postarbitration produc-
bitration years. While it is not possible to completely discount this possibility, Ihave experimented with the inclusion of interacting postarbitration � EmployerWin and postarbitration � Union Win with time trends, which do not qualita-tively change the results of Table VI.
TABLE VIHETEROGENEOUS EFFECTS OF ARBITRATION DECISIONS ON CLEARANCES BY LOSS
SIZE, AWARD, AND DEVIATION FROM THE EXPECTED OFFER:�12- TO �12-MONTH EVENT TIME WINDOW
(1) (2) (3) (4) (5) (6)Police lose Police win
Postarbitration 5.72 �8.17 12.99 �7.42 4.97 7.30(2.31) (9.58) (8.45) (4.76) (3.14) (4.17)
Postarbitration � Award 1.23 �1.00(1.16) (0.98)
Postarbitration � Loss size �10.31 �10.93 �0.20(1.59) (1.89) (4.54)
Postarbitration � Union 13.38win (5.32)
Postarbitration � �17.72 2.82(expected award-award) (7.94) (4.13)
Postarbitration �p(loss size)a
Included
Sample size 59,137 59,137 59,137 59,137 52,857 55,879R2 0.63 0.63 0.63 0.63 0.60 0.62
Standard errors, clustered on the intersection of arbitration window and city, are in parentheses.Standard deviations are in brackets. Observations are municipality � month cells. The sample is weightedby population size in 1976. The dependent variable is clearances per 100,000 capita. Loss size is defined asthe union demand (percent increase on previous wage) less the arbitrator award. Among cities that under-went arbitration, the mean loss size is 0.489 with a standard deviation of 0.953. The expected award is themathematical expectation of the award given the union and employer offers and the predicted probability ofan employer win. The predicted probability of an employer win is estimated with a probit model using aspredictors year of arbitration dummies, the average of the final offers, log population, and the length of thecontract. See text for details. The samples in models (1)–(4) consist of the 12 months before to the 12 monthsafter arbitration, for jurisdictions that underwent arbitration, as well as all jurisdictions that never under-went arbitration for all months between 1976 and 1996. The sample in model (5) consists of cities where theunion lost in arbitration and the comparison group of nonarbitrating cities. The sample in model (6) consistsof cities where the union won in arbitration and the comparison group of nonarbitrating cities. All modelsinclude month � year effects (252), arbitration window effects (383), and city effects (452). Author’s calcu-lations are based on NJ PERC arbitration cases matched to monthly municipal clearance rates at thejurisdiction level from FBI Uniform Crime Reports.
a. p(loss size) denotes a cubic polynomial in loss size.
812 QUARTERLY JOURNAL OF ECONOMICS

tivity. Formally, I make this inference by regressing the percapita clearance rate on a postarbitration dummy and a postar-bitration dummy interacted with the size of the award. Thesecond and third columns of Table VI show that the estimatedcoefficient on this interaction is small in magnitude and statisti-cally indistinguishable from zero. Police receiving larger payraises are not exerting more effort than those receiving smallerpay raises following arbitration. The mechanism underlying thepostarbitration effects is clearly more complicated than a simpleeffort/wage relationship. At first blush, this conclusion may beconsidered to be at odds with the results showing that there arepositive productivity effects arising from union wins. In fact, thepositive productivity effect following union wins comes aboutfrom the jump in the effort-response function at the point wherethe difference in the award and the average of the offers is zero.This discontinuous jump in the effort-response function, which Iwill term the “Vince Lombardi” effect, suggests that losing arbi-tration affects productivity, even when the stakes are triviallysmall and may be indicative of a “warm glow” that comes fromwinning arbitration or a cloud that comes from losing.18
In order to estimate the Lombardi effect, I fit a model thatallows postarbitration productivity to depend on a cubic term inthe size of the loss and an indicator for whether there is a policewin:
(5) ymt�b � � � FE � �1post� � �2post�
� UnionWinb � �post� � p�LOSS SIZEb�� � εmt�cb,
where p(LOSS SIZEb) denotes a cubic polynomial in LOSS SIZE.The coefficient �2 determines the change in performance when theloss size is zero and the police win in arbitration, relative to whenthe loss size is zero and the police lose in arbitration. If �2 ispositive, then winning in arbitration increases clearances even ifthe difference between the offers is trivially small. In column (4)of Table VI, the Lombardi effect is estimated as 13.38, with at-ratio of 2.52. This estimate suggests that police incorporatereference points which are based on categories (win versus loss)as well as pay. However, this result must be interpreted withsome care. As noted earlier, because there are no arbitration
18. Professional football coach Vince Lombardi is attributed to have saidthat, “winning isn’t everything, it’s the only thing.”
813PAY AND POLICE PERFORMANCE
cases that lead to no-decision, it is not possible to disentangle theeffect of an arbitration win, arbitration loss, and simply finishingarbitration. Therefore, while the Lombardi effect shows that win-ning is important, it should be interpreted as the productivityresponse of a win in relation to a loss. For example, it could bethat losing in arbitration leads to productivity declines, winningarbitration does not lead to productivity gains, while just finish-ing arbitration leads to gains in productivity. In this case, theLombardi effect reflects the productivity decline associated with asmall loss.
IX.B. Expectation-Based Counterfactuals
There is considerable support in the psychology literature forthe idea that comparisons to expectation-based counterfactualsmatter for emotional responses to outcomes and decisions.19 Thepain or pleasure following an outcome depends on the utility ofthe outcome, comparisons of actual to counterfactual outcomes,and the surprise associated with the actual outcome. For exam-ple, if the employees propose a pay raise that has no chance ofselection, then they may not react as adversely as in the case thatthe proposed pay raise has a positive probability of selection. Astructured way to account for both anticipation and the gapbetween the award and the union demand is to model policeperformance as depending on the difference between the awardand the rationally expected award, where the expected awarddepends on the probabilities of winning and the offers presented.This specification is in line with the modeling approach of Koszegiand Rabin [2006] who argue that reference points are bestthought of as rational expectations. Taking this line of thoughtseriously, I can use variation in the probability of employer winsacross arbitration cases to test whether deviations in the arbitra-tor award from the expected award can account for differences inpostarbitration relative to prearbitration clearance rates, evenafter controlling for the distance between the union demand andthe arbitrator award.
Divergent beliefs, political economy, differences in degrees ofrisk aversion across parties, changes in arbitrator behavior overtime, and mental rigidity in negotiations are all reasons that maylead parties to submit offers with varying probabilities of selec-tion. If parties vary in the conservativeness of their offers, then
19. For example, see Mellers, Schwartz, and Ritov [1999].
814 QUARTERLY JOURNAL OF ECONOMICS

the probability of winning will vary across cases as well. If this isthe case, then the mean of the final offers can be used to predictthe probability of an employer win, as noted by Ashenfelter andBloom [1984]. Conditional on the facts of the case, the higher theaverage of the offers, the higher is the probability of employerselection. Following Ashenfelter and Bloom’s [1984] and Ashen-felter and Dahl’s [2005] approach, if one assumes that the arbi-trator’s preferred award is normally distributed, then the proba-bility of employer selection is a probit function depending on theaverage of the offers. Therefore, the starting point for this analy-sis is to estimate the predicted probability of employer arbitrationwins using a probit model, using as an explanatory variable theaverage of the final offers. Using these predicted probabilities, Icalculate the expected award for each arbitration case: expectedawardb � pb employer offerb � (1 � pb) union offerb, where pbis the predicted probability of an employer win in arbitration caseb. I then construct the difference between the expected award andthe arbitrator award.
For ease of exposition, in the context of a union loss I will callthe gap between the union demand and the award the “loss size,”and the gap between the expected offer and the award the “devia-tion from expectation.” The finding presented in column (5) ofTable VI is that, in cases of union losses, when both the loss sizeand the deviation from expectation are included in the model(after being interacted with a postarbitration dummy), the devia-tion from expectation explains substantially more of the variationin the magnitude of the postarbitration declines in clearancesthan the loss size. In fact, loss size has no significant relationshipto clearances after controlling for the deviation from the expectedaward. The reason that the coefficient on the loss size is large incolumn (1), but is virtually zero in column (5), is that the loss sizeand the deviation from the expected award are highly correlated.The deviation from the expected award captures both the notionthat some awards are more anticipated than others and the sizeof the loss. The effect of a union arbitration loss on clearances isgreater both when the union offer is far from the employer offerand when there is greater anticipation of a union win. If the unionsubmits an offer that is very large but has a low probability ofbeing selected, then the productivity response will be limited.20
20. Another way to understand this finding is that the degree to which a lossaffects performance is effectively mediated by the size of the offer. Large losses,
815PAY AND POLICE PERFORMANCE

These findings validate the idea that effort depends on the degreeto which pay raises fall below expectations, in this case rationalexpectations. By contrast, when the pay raise exceeds expecta-tions, there is no statistically distinguishable effect on the per-formance of police officers, as seen in column (6). The lack of arelationship in this case signifies that loss aversion is an impor-tant determinant of workplace performance.
IX.C. Adaptation and Dynamics
An important aspect of the findings that remains to be dis-cussed concerns the productivity dynamics following arbitration.Figure I shows that the productivity effects arising from arbitra-tion decisions are persistent, peaking at seven months followingarbitration, and appearing to reach a new steady state after abouta year. It is useful to interpret these dynamics through the lens ofthe theory of the “hedonic treadmill,” which holds that subjectivewell-being (SWB) adjusts to current circumstances [Brickmanand Campbell 1971]. This proposition implies that life eventsinduce transitory deviations of SWB from baseline levels. Howquickly SWB returns to baseline following an event depends onthe kind of event considered and the research design of the study.Studies of lottery winners [Brickman, Coates, and Janoff-Bulman1978] and people with severe spinal cord injuries [Silver 1982]show that adaptation to these extreme life events occurs within ashort time frame, typically within a year. By contrast, a morerecent literature has found that repeated spells of unemployment[Lucas et al. 2004] and changes in marital status [Lucas et al.2003] appear to have long-lasting effects on life satisfaction.Nevertheless, it may be considered puzzling that people adapt tosome major life events relatively quickly, but the reduced perfor-mance of police officers following an arbitration loss persists forover a year. One important difference between the context of thisstudy and the ones reviewed above is that, in this study, policereactions to adverse or positive events may have been augmentedby social interactions. The literature on group polarization sug-gests that members of group discussions advocate more extremepositions than individuals who do not participate in group dis-cussion. Additionally, if there are strong feedback effects in the
which occur when the gap between the union demand and the award is large, donot hurt as much when the average of the offers is sizable relative to when theaverage is smaller.
816 QUARTERLY JOURNAL OF ECONOMICS

transmission of job satisfaction across individuals due to socialinteractions, one-time shocks to morale may, in theory, be highlypersistent.
X. CONCLUSION
Arbitration systems offer a rich setting to study how workersrespond to relative changes in compensation. The advantage ofthe approach taken in this paper is multifold. First, informationon both the enacted offers and the counteroffers allows me toexplore how deviations from reference payoffs affect productivity.Second, theoretical models of final offer arbitration suggest thatarbitration rulings are orthogonal to the facts of the case becausethe information that is relevant to compensation is already incor-porated into the final offers. In addition, the statistical models areflexible, and the parameters of interest are identified even if thearbitrator draws from the information set available to him or herat the time of arbitration. Last, high frequency data on clearancesallow me to capture dynamics in performance that may not bedetected using coarser time intervals.
It is well-known that final offer arbitration awards are lowquality because they lie outside the range of negotiated settle-ments. This study shows that final offer arbitration can haveadditional inefficiencies arising from the behavioral response ofparticipants to unfavorable outcomes. Ichniowski [1982] findsthat arbitration helps reduce the propensity for police to strike,which suggests that police departments in contract disputes notsubject to compulsory arbitration could, in principle, experienceproductivity losses that are even more sizable than the onespresented in this paper.
The findings in this paper suggest several avenues for futurework. First, additional work needs to be done to determinewhether productivity responses to arbitration are exacerbated bythe fact that the arbitration rulings in this paper represent grouplevel outcomes. That is, are the effects of falling below a referencepoint amplified when the resulting disappointment affects anentire group of workers? Second, models of final offer arbitrationcan be written to take into account the effect of differentialrulings on productivity. For example, a question that arises iswhether employers manage expectations of workers to minimizethe behavioral costs arising from unfavorable payoffs. In somecases, it may be optimal for employers engaged in final offer
817PAY AND POLICE PERFORMANCE

arbitration to increase expected productivity by making offersthat arbitrators are unlikely to select. Such behavior could be onereason why employer win rates are fairly low in this study. Last,future studies should consider whether the behavioral responsesassociated with differential arbitration outcomes, as outlined inthis study, represent a general phenomenon relating to allocativemechanisms that clearly demarcate winners from losers, for ex-ample negotiations that involve a single and discrete high-stakesissue.
DATA APPENDIX
NJ PERC
The data provide information on FOA cases that took place inNew Jersey between 1978 and 1995 and include information onthe offers submitted to the arbitrator, which are expressed aspercent changes on the previous contract’s wage, and informationon whether the arbitrator ruled in favor of the municipal em-ployer or police bargaining unit.
FBI UCR
I match arbitration to monthly clearance and crime datafrom the FBI Uniform Crime Reporting System (UCR) data filesobtained from the Inter-University Consortium for Political andSocial Research (ICPSR) for 1975 through 1996. The data filesinclude reports by police departments on felony crimes and clear-ances. Data sets were matched on the name of the municipality.This merge was complicated because reporting of municipalnames was not uniform in the NJ PERC data file and the UCRfiles and because there are multiple cities in New Jersey with thesame name. For example, New Jersey has five Washington Town-ships and a Washington Borough. In such cases I used additionalinformation, like county and census population size, to match thecities. Several municipalities that did undergo arbitration aredropped from the analysis because they lie too close to one an-other, resulting in overlapping event-study windows. The exactnumber depends on the length of the arbitration window, and therules used to determine eligibility for inclusion in cases withoverlapping windows are described below. There are an addi-tional 104 arbitration cases on noncompensation disputes thatare not used in the main analysis. One arbitration case is dropped
818 QUARTERLY JOURNAL OF ECONOMICS

because the city never reported to the FBI in the period of arbi-tration. After these exclusions, 383 arbitration cases remain.
As described in the text, I include a comparison group con-sisting of municipalities that never underwent arbitration. Thereare 211 municipalities that never arbitrated with police unionsbetween 1978 and 1995. In order to preserve a balanced panel forthe comparison group, I only include cities that missed reportingto the FBI in at most 10 percent of months. This filter results inthe use of 197 municipalities in the comparison group. The re-sults are robust to different selection rules.
Selection of Cases with Overlapping Windows
I employ the following selection rules when arbitration win-dows overlap:
(i) Exclude an arbitration window if the arbitration datefalls on the postarbitration period of another case (in thesame city).
(ii) If the arbitration date in case A falls on the prearbitra-tion window of case B, then only exclude months in A’swindow that overlap with the postarbitration months ofcase B. By the previous rule, case B is excluded.
(iii) If the postarbitration months in A overlap with theprearbitration months in B, then keep A and exclude B.
One may be concerned that in dropping only part of anarbitration window, I allow for the possibility of composition biassince some arbitration windows will be truncated. However, drop-ping incomplete bargaining windows does not qualitativelychange the estimates, nor do specifications that control for arbi-tration window fixed-effects, which control for permanent differ-ences in cities around the time of arbitration.
OBTS Datafile
File consists of individuals who were arrested for feloniesbetween 1987 and 1990 and obtained final disposition between1989 and 1990 in municipalities that experienced arbitrationbetween 1988 and 1989. There are 40 arbitration cases used inthis analysis. For the sentence outcome, thirteen offenders whoreceived the death penalty were dropped from the sample. If thesame offender appears more than once in the data, only the firstoffense is used. Offenders with a missing offense code or convic-tion code are dropped from the sample. Sentence is the maximum
819PAY AND POLICE PERFORMANCE

length of the jail sentence imposed for an offense expressed infractions of a year. OBTS are available from ICPSR.
UNIVERSITY OF CALIFORNIA, BERKELEY
REFERENCES
Aamodt, Michael, “Law Enforcement Selection: Research Summaries” (Washing-ton, DC: Police Executive Research Forum, 2004).
Adams, J. Stacy, “Inequity in Social Exchange,” in L. Berkowitz, ed., Advances inExperimental Social Psychology, Volume 2 (New York, NY: Academic Press,1965).
Agell, Jonas, and Per Lundborg, “Theories of Pay and Unemployment: SurveyEvidence from Swedish Manufacturing Firms,” Scandinavian Journal ofEconomics, XCVII (1995), 1027–1039.
Akerlof, George, and Janet Yellen, “The Fair Wage-Effort Hypothesis and Unem-ployment,” Quarterly Journal of Economics, CV (1990), 255–283.
Ashenfelter, Orley, “Arbitrator Behavior,” American Economic Review, LXXVII(1987), 342–346.
Ashenfelter, Orley, and David Bloom, “Models of Arbitrator Behavior: Theory andEvidence,” American Economic Review, LXXIV (1984), 111–124.
Ashenfelter, Orley, and Gordon Dahl, “Strategic Bargaining Behavior, Self-Serv-ing Biases, and the Role of Expert Agents: An Empirical Study of Final-OfferArbitration,” Industrial Relations Section, Princeton University, February2005.
Bateman, Ian, Alistair Munroe, Bruce Rhodes, Chris Starmer, and Robert Sug-den, “Does Part-Whole Bias Exist? An Experimental Investigation,” EconomicJournal, CVII (1997), 322–332.
Bewley, Truman, Why Wages Don’t Fall During a Recession (Cambridge, MA:Harvard University Press, 1999).
Blinder, Alan, and Don Choi, “A Shred of Evidence on Theories of Wage Sticki-ness,” Quarterly Journal of Economics, CV (1990), 1003–1015.
Brickman, Philip, and Don Campbell, “Hedonic Relativism and Planning the GoodSociety,” in Adaptation-Level Theory, M. H. Appley, ed. (New York: AcademicPress, 1971), pp. 287–305.
Brickman, Philip, Dan Coates, and Ronnie Janoff-Bulman, “Lottery Winners andAccident Victims: Is Happiness Relative?” Journal of Personality and SocialPsychology, XXXVI (1978), 917–927.
Brown, Gordon D. A., Jonathan Gardner, Andrew Oswald, and Jing Qian, “DoesWage Rank Affect Employees’ Well-Being?” IZA Discussion Paper No. 1505,2005.
Cappelli, Peter, and Keith Chauvin, “An Interplant Test of Efficiency WageArguments,” Quarterly Journal of Economics, LXXIII (1991), 769–787.
Fehr, Ernst, and Simon Gachter, “Fairness and Retaliation,” Journal of EconomicPerspectives, LXXIII (2000), 159–182.
Farber, Henry, “An Analysis of Final-Offer Arbitration,” Journal of Conflict Reso-lution, XXIV (1980), 683–705.
Gibbons, Robert, “Learning in Equilibrium Models of Arbitration,” AmericanEconomic Review, LXXVIII (1988), 896–912.
Gul, Faruk, “A Theory of Disappointment Aversion,” Econometrica, LIX (1991),667–686.
Ichniowski, Casey, “Arbitration and Police Bargaining: Prescriptions for the BlueFlu,” Industrial Relations, XXI (1982), 149–166.
Kahneman, Daniel, and Amos Tversky, “Prospect Theory: An Analysis of Decisionunder Risk,” Econometrica, XLVII (1979), 263–291.
Kaufman, Roger, “On Wage Stickiness in Britain’s Competitive Sector,” BritishJournal of Industrial Relations, XXII (1984), 101–112.
Koszegi, Botond, and Matthew Rabin, “A Model of Reference-Dependent Prefer-ences,” Quarterly Journal of Economics, CXXI (2006), forthcoming.
820 QUARTERLY JOURNAL OF ECONOMICS

Lester, Richard, Labor Arbitration in State and Local Government, IndustrialRelations Section, Princeton University, 1984.
Levitt, Steven, “Using Electoral Cycles in Police Hiring to Estimate the Effect ofPolice on Crime,” American Economic Review, LXXXVII (1997), 270–290.
Lucas, Richard, Andrew Clark, Yannis Georgellis, and Ed Diener, “ReexaminingAdaptation and the Set Point Model of Happiness: Reactions to Changes inMarital Status,” Journal of Personality and Social Psychology, LXXXIV(2003), 527–539.
Lucas, Richard, Andrew Clark, Yannis Georgellis, and Ed Diener, “Unemploy-ment Alters the Set Point for Life Satisfaction,” Psychological Science, XV(2004), 8–13.
Mas, Alexandre, “Pay, Reference Points, and Police Performance,” National Bu-reau of Economic Research Working Paper No. W12202, April 2006.
McCrary, Justin, “Using Electoral Cycles in Police Hiring to Estimate the Effectof Police on Crime: Comment,” American Economic Review, XCII (2002),1236–1243.
——, “The Effect of Court-Ordered Hiring Quotas on the Composition and Qualityof Police,” University of Michigan, 2003.
Mellers, Barbara, Alan Schwartz, and Ilana Ritov, “Emotion-Based Choice,” Jour-nal of Experimental Psychology: General, CXXVIII (1999), 332–345.
Rizzo, John, and Richard Zeckhauser, “Reference Incomes, Loss Aversion, andPhysician Behavior,” Review of Economics and Statistics, LXXXV (2003),909–922.
Salop, Steven C., “A Model of the Natural Rate of Unemployment,” AmericanEconomic Review, LXIX (1979), 117–125.
Silver, Ruth, “Coping with an Undesirable Life Event: A Study of Early Reactionsto Physical Disability,” Northwestern University, 1982.
Thaler, Richard, “Toward a Positive Theory of Consumer Choice,” Journal ofBehavior and Organization, I (1980), 36–60.
Verhoogen, Eric, Stephen Burks, and Jeffrey Carpenter, “Fairness and Freight-Handlers: Local Labor Market Conditions, Wage Fairness Perceptions, andEmployee Performance in a Trucking Firm,” Columbia University, 2003.
Weiss, Andrew, “Job Queues and Layoffs in Labor Markets with Flexible Wages,”Journal of Political Economy, LXXXVIII (1980), 526–538.
821PAY AND POLICE PERFORMANCE