Embed Size (px)
Citation preview

THE
QUARTERLY JOURNALOF ECONOMICS
Vol. 132 February 2017 Issue 1
THINKING, FAST AND SLOW? SOME FIELD EXPERIMENTSTO REDUCE CRIME AND DROPOUT IN CHICAGO*
SARA B. HELLER
ANUJ K. SHAH
JONATHAN GURYAN
JENS LUDWIG
SENDHIL MULLAINATHAN
HAROLD A. POLLACK
We present the results of three large-scale randomized controlled trials(RCTs) carried out in Chicago, testing interventions to reduce crime and dropoutby changing the decision making of economically disadvantaged youth. We studya program called Becoming a Man (BAM), developed by the nonprofit Youth Guid-ance, in two RCTs implemented in 2009–2010 and 2013–2015. In the two studies
∗The title is, of course, a reference to the 2011 book by Daniel Kahne-man, Thinking, Fast and Slow. This project was supported by the Universityof Chicago’s Office of the Provost, Center for Health Administration Studies,and School of Social Service Administration, the city of Chicago, the ChicagoPublic Schools, the Illinois Criminal Justice Information Authority, the EuniceKennedy Shriver National Institute of Child Health and Human Development ofthe National Institutes of Health (awards R21-HD061757 and P01-HD076816),CDC grant 5U01CE001949-02 to the University of Chicago Center for Youth Vi-olence Prevention, grant number 2012-JU-FX-0019 from the Office of JuvenileJustice and Delinquency Prevention, Office of Justice Programs, U.S. Depart-ment of Justice, and grants from the Laura and John Arnold Foundation, theChicago Community Trust, the Edna McConnell Clark Foundation, the CrownFamily, the Exelon corporation, the Joyce Foundation, J-PAL, the Reva and DavidLogan Foundation, the John D. and Catherine T. MacArthur Foundation, theMcCormick Foundation, the Polk Bros Foundation, the Smith Richardson Foun-dation, the Spencer Foundation, the University of Chicago Women’s Board, a pre-doctoral fellowship to Heller from the U.S. Department of Education’s Institute forEducation Sciences, and visiting scholar awards to Ludwig from the Russell Sage
C© The Author(s) 2016. Published by Oxford University Press on behalf of the Presi-dent and Fellows of Harvard College. All rights reserved. For Permissions, please email:[email protected] Quarterly Journal of Economics (2017), 1–54. doi:10.1093/qje/qjw033.Advance Access publication on October 10, 2016.
1

2 QUARTERLY JOURNAL OF ECONOMICS
participation in the program reduced total arrests during the intervention periodby 28–35%, reduced violent-crime arrests by 45–50%, improved school engage-ment, and in the first study where we have follow-up data, increased graduationrates by 12–19%. The third RCT tested a program with partially overlapping com-ponents carried out in the Cook County Juvenile Temporary Detention Center(JTDC), which reduced readmission rates to the facility by 21%. These large be-havioral responses combined with modest program costs imply benefit-cost ratiosfor these interventions from 5-to-1 up to 30-to-1 or more. Our data on mecha-nisms are not ideal, but we find no positive evidence that these effects are due tochanges in emotional intelligence or social skills, self-control or “grit,” or a genericmentoring effect. We find suggestive support for the hypothesis that the programswork by helping youth slow down and reflect on whether their automatic thoughtsand behaviors are well suited to the situation they are in, or whether the situa-tion could be construed differently. JEL Codes: C91, C93, D03, D1, I24, I3, I32,K42.
I. INTRODUCTION
Disparities in youth outcomes in the United States are strik-ing. For example, for 15–24-year-olds, the male homicide rate in
Foundation and LIEPP at Sciences Po. For making this work possible we are grate-ful to the staff of Youth Guidance, World Sport Chicago, the Chicago Public Schools,and the Cook County Juvenile Temporary Detention Center, and to Ellen Al-berding, Roseanna Ander, Mayor Richard M. Daley, Anthony Ramirez-DiVittorio,Earl Dunlap, Mayor Rahm Emanuel, Wendy Fine, Hon. Curtis Heaston, MichelleMorrison, Dave Roush, and Robert Tracy. For helpful comments we thank LarryKatz, Andrei Shleifer, four anonymous referees, Stefano DellaVigna, Dan Gilbert,John Rickford, and seminar participants at Case Western, Columbia, Duke, Eras-mus, Harvard, MDRC, Notre Dame, Northwestern, Sciences Po, Stanford, Univer-sity of Chicago, University of Miami, University of Michigan, University of Penn-sylvania, University of Toronto, University of Virginia, University of Wisconsin,Yale, the MacArthur Foundation, NBER, New York City Department of Proba-tion, and the joint New York Federal Reserve/NYU education workshop. For helpaccessing administrative data we thank the Chicago Public Schools, the ChicagoPolice Department, and ICJIA, for providing Illinois Criminal History Record In-formation through an agreement with the Illinois State Police. For invaluable helpwith monitoring, data collection, and analysis we thank Nour Abdul-Razzak, SamCanas, Brice Cooke, Stephen Coussens, Gretchen Cusick, Jonathan Davis, NathanHess, Anindya Kundu, Heather Sophia Lee, Duff Morton, Kyle Pratt, Julia Quinn,Kelsey Reid, Catherine Schwarz, David Showalter, Maitreyi Sistla, Matthew Veld-man, Robert Webber, David Welgus, John Wolf, and Sabrina Yusuf. The findingsand opinions expressed here are those of the authors and do not necessarily reflectthose of the Department of Justice, National Institutes of Health, the Centers forDisease Control, or any other funder or data provider.

FIELD EXPERIMENTS TO REDUCE CRIME AND DROPOUT 3
2013 was 18 times higher for blacks than whites (71 versus 4per 100,000).1 Black males lose more years of potential life be-fore age 65 to homicide than to America’s leading overall killer—heart disease.2 A large body of research emphasizes that—beyondinstitutional factors—choices and behavior also contribute tothese outcomes, including decisions around dropping out of highschool, involvement with drugs or gangs, or responses to con-frontations that could escalate to serious violence. In this articlewe present the results of three large-scale randomized controlledtrials (RCTs) that seek to reduce crime and dropout by changingthe decision making of disadvantaged youth at elevated risk forthese outcomes.
Given the current focus of U.S. social policies aimed at chang-ing these behaviors, one noteworthy feature of the interventionswe study is what they are not. They do not involve early childhoodeducation, or academic skill development, or vocational or techni-cal training, or subsidized jobs or internships, or cash transfers, orin-kind supports, or efforts to change parenting or the home envi-ronment, or any sort of incentive scheme for children, parents, orteachers. Another noteworthy feature is that, unlike most previ-ous interventions for low-income youth, those we study here seemto generate large impacts on important behavioral outcomes.
To provide some concrete sense of what the programs are,we describe the first activity youth do in one of the programswe study: the Becoming a Man (BAM) program developed by theChicago nonprofit Youth Guidance (YG). Students are divided intopairs and one is given a ball, which the other student is told he has30 seconds to get from his partner. Almost all youth use physicalforce to try to take the ball out of the other’s fist. During thedebrief, the group leader points out that no one simply asked forthe ball. When prompted about why they did not simply ask, mostrespond with some version of “he wouldn’t have given it,” or “hewould have thought I was a punk.” The leader then asks the otheryouth, “How would you have reacted if asked nicely for the ball?”The answer typically is something like, “I would have given it;it’s just a stupid ball.” This exercise, like many in the program,teaches youth to think more carefully about the situations theyare in.
1. Our calculations compare non-Hispanic blacks to whites and focuson homicides (excluding fatalities from legal intervention); see WISQARS(http://webappa.cdc.gov/sasweb/ncipc/mortrate10 us.html).
2. WISQARS (http://webappa.cdc.gov/sasweb/ncipc/ypll10.html).

4 QUARTERLY JOURNAL OF ECONOMICS
The interventions we study here were carried out in very dis-advantaged neighborhoods on the south and west sides of Chicago.Our first two RCTs tested BAM, first randomizing 2,740 youth to aone-year program in the 2009–2010 academic year (AY), with thesecond RCT stretching the curriculum out over two years in AYs2013–2014 and 2014–2015 with 2,064 youth.3 We measure out-comes with longitudinal government administrative data. In bothstudies the effect on program participants during the programperiod were similar, reducing total arrests by 28–35%, violent-crime arrests by 45–50%, and arrests for other crimes by 37–43%.While these impacts on arrests did not persist beyond the pro-gram period in the first BAM study (we do not have postprogramdata for the second BAM study), we did find persistent impactson schooling outcomes—including gains in high school graduationrates of 6 to 9 percentage points (12–19%).
Our third RCT was carried out in a very different setting—the Cook County, Illinois Juvenile Temporary Detention Center(JTDC), where high-risk juvenile arrestees in the Chicago areaare taken for pretrial detention. The intervention, carried out insome residential units in the JTDC but not others, consisted ofa package of reforms that included a token economy for good be-havior inside the facility, increased educational requirements forstaff, and a daily program delivered by the detention center’s staffthat had many elements similar in spirit to BAM. We focus on the2,693 male admissions to the JTDC from 2009 to 2011 who wererandomly assigned to units with or without the reforms, and forwhom we have at least 18 months of follow-up data. Receipt ofprogramming reduced readmission rates by 16 percentage points(21%) and had impacts on the number of readmissions or read-missions plus arrests that were similarly large but sometimes lessprecisely estimated.
What is striking about these interventions is not just thatthey generated such large behavioral responses but also that theywere able to do so at relatively low cost—less than $2,000 perparticipant (and sometimes much less). In our first BAM RCT,for which we have the most complete data on outcomes, we esti-mate that the value of crime reduction alone yields benefit-cost
3. The program is also abbreviated as “B.A.M.” but for consistency we use acommon style for all acronyms. Some youth also received after-school programmingdeveloped to reinforce the BAM curriculum by a nonprofit called World SportChicago. We argue below that our results are not due simply to incapacitation ofyouth during after-school hours when sports were held nor to sports more generally.

FIELD EXPERIMENTS TO REDUCE CRIME AND DROPOUT 5
ratios that range from 5-to-1 up to 30-to-1. These are likely tobe lower-bound estimates, given our findings that BAM increaseshigh school graduation rates as well.
Why do these programs work so well? Existing theories ofwhat (beyond academic skills) determines people’s life outcomessuggest a few possible channels such as self-control, conscien-tiousness, “grit,” emotional intelligence, social skills, support frompro-social adults (“social capital”), or an understanding of the re-turns to education. To measure these candidate mechanisms wehave surveys administered throughout the Chicago Public School(CPS) system, including to youth in our first BAM study. Thesedata are not totally ideal, partly because they captured responsesfrom just under half of the youth in our study and partly becausethey did not capture measures related to every possibly relevanttheory from the prior literature. With these caveats in mind, wefind no positive evidence that any of the candidate mechanismssuggested by prior research for which we have measures explainmuch of the treatment effect. Our estimates of treatment effectson these potential mediators, and the relationship between media-tors and outcomes, suggest that these mechanisms are unlikely toaccount for more than a modest share of the program effects on be-havioral outcomes. Using arrest records with exact date of arrest,we can also rule out that the effects were due merely to keepingyouth busy (voluntary incapacitation) on days when after-schoolactivities occurred.
When we look at the curricula for the programs we studyhere, we can see why commonly discussed mechanisms do notseem so important for these interventions. Consider, for example,BAM’s “fist” exercise described above. This does not seem to act oncommonly discussed mechanisms like self-control or social skillsor grit. The exercise does not help youth learn how to either rec-ognize or stifle feelings of anger, or learn the most polite way torequest the ball, or how to persist in trying to get the ball. Manyother BAM activities are similar in that regard.
Another noteworthy aspect of the fist exercise (and the BAMprogram as a whole) is that it does not tell youth the “right”thing to do. BAM providers recognize that these youth live indistressed neighborhoods where being aggressive or even fight-ing may—unfortunately—sometimes be necessary to avoid devel-oping a reputation as someone who is an easy victim. It is nothard to see how someone navigating that sort of neighborhoodenvironment could develop a tendency to reflexively push back

6 QUARTERLY JOURNAL OF ECONOMICS
against being challenged. That response can lead to trouble if it isovergeneralized and sometimes applied in settings where it is nothelpful—such as school.
This illustrates our own hypothesis for why these programschange youth behavior, based on the psychology of automaticity.4
Because conscious deliberation is mentally costly, all of us de-velop a series of automatic responses that are usually adaptive tosituations that we commonly face—such as youth in distressedurban neighborhoods fighting back aggressively when challenged.Why might a teenager overgeneralize and deploy this response ina setting where it is not adaptive, such as in school? Behavioral sci-ence shows that we all make automatic assumptions about whatsituation we are in and that these assumptions can sometimes bewrong (Ross and Nisbett 2011). Being yelled at by a teacher inschool to stop talking so class can begin may at first glance feellike one’s reputation is being challenged, just as on the street. Wehypothesize that these interventions improve youth outcomes insubstantial part because they help youth slow down in high-stakessettings, examine their automatic assumptions about what situa-tion they are in, and ask whether the situation could be construeddifferently. That is, the programs help youth have a greater senseof occasion.5
The difference between this theory and other commonly dis-cussed mechanisms is highlighted by the fact that the BAMproviders say some of their youth have the problem of not be-ing aggressive enough. That is, rather than having the problem oftaking the automatic response adaptive for the neighborhood andovergeneralizing to the school setting, some youth have the op-posite problem of overgeneralizing the response that is adaptivefor school—which in turn gets them into trouble in the neighbor-hood. For these youth, BAM can have the effect of increasing thefrequency with which they assert themselves—ideally only in theright situations.
To test this theory, we administered a decision-making exer-cise (an iterated dictator game) to about half of the youth in oursecond BAM study. This exercise made youth think they had beenprovoked by a classmate and then gave them a chance to retaliate.
4. Within psychology automaticity is most notably associated with dual sys-tems models, which are well summarized in Kahneman (2011). Other economicmodels of dual systems thinking include Cunningham (2015) and for impulse con-trol Fudenberg and Levine (2006).
5. We thank our colleague Dan Gilbert for suggesting this wonderful phrase.

FIELD EXPERIMENTS TO REDUCE CRIME AND DROPOUT 7
Our theory predicts BAM youth should slow down and spend moretime thinking about how to respond. Our theory does not predicthow they will respond, since that depends on what situation theyconstrue themselves to be in. Consistent with our theory, BAMincreased decision-making time in response to the provocation by80%. In terms of the amount of retaliation administered, we foundfew differences between BAM youth and controls, which does notseem consistent with mechanisms that emphasize changes in fac-tors that would make youth uniformly more pro-social across allsituations.
This hypothesis gives us a way to understand why these inter-ventions are more successful than so many previous efforts. Manysocial policies intended to help disadvantaged youth try to changebehavior by changing the long-term returns to pro- or antisocialbehavior, usually with disappointing results. More promising maybe to directly help youth recognize their automatic assumptionsand responses and make better decisions in high-stakes situa-tions. As one JTDC staff member told us, “20% of our residentsare criminals; they will harm other people if they are not lockedup. But the other 80%, I always tell them—if I could give you backjust 10 minutes of your lives, you wouldn’t be here.”6
II. INTERVENTION STRATEGY
This section describes the two interventions we study, keyparts of which may be lumped together under the broad heading ofwhat psychologists call cognitive-behavioral therapy (CBT). CBTis designed to get youth to “think about their thinking,” or engagein “meta-cognition” (Beck 2011).7 There are other elements of the
6. Personal communication, Darrien McKinney to Jens Ludwig, Sendhil Mul-lainathan, and Anuj Shah, October 18, 2012.
7. CBT programs vary in their focus, including the degree to which they try toreduce automaticity, and not all interventions to reduce automaticity will neces-sarily be called CBT. Since the 1970s, CBT has been used to address mental healthdisorders such as substance abuse, anxiety, and depression and can be more ef-fective than antidepressant drugs (Rush et al. 1977). Since then, there has beengrowing practitioner interest in using different versions of CBT as a social policytool to address socially costly behaviors. Yet there is little good evidence currentlyabout effects on those behaviors of greatest policy concern such as youth delin-quency, violence, and dropout. (This is discussed in detail in the Online Appendix,specifically see Online Appendix A and Tables A.1 and A.2). One recent excep-tion is Blattman, Jamison and Sheridan (forthcoming) who found a CBT programfor adults in Liberia was successful, especially when combined with cash grants.

8 QUARTERLY JOURNAL OF ECONOMICS
two programs we study that only partially overlap. This providesus with one source of leverage for learning more about underlyingmechanisms.
II.A. Becoming a Man (BAM)
The BAM program was developed by Youth Guidance abouta decade before our first RCT of the program in AY 2009–2010.The program was operating in a single Chicago high school anda few elementary schools before being taken to scale for our RCT.In the first experiment, BAM offered youth the opportunity toparticipate in 27 one-hour, once-a-week group sessions held dur-ing the school day over a single school year. The intervention isdelivered in groups, which helps control costs, with groups keptsmall (assigned groups of no more than 15 students and averagerealized groups of about 8) to help develop relationships. Studentsskip a class to participate, which is a draw for some youth. In ourfirst BAM RCT some youth were also offered the chance to par-ticipate in after-school sports programming delivered by WorldSport Chicago, to increase participation and (because coacheswere trained in parts of the BAM curriculum) to reinforce theprogram.8 The second BAM RCT was carried out in AYs 2013–2014 and 2014–2015, with the curriculum stretched out over twoyears (up to 45 sessions) so providers could go into more depth oneach topic as well as cover more advanced material (particularlyrelated to self-reflection and skill building). In this second studysports were also offered in the first year but very little in thesecond year, which helps us isolate the effect of BAM from sports.
Table I illustrates a few of the key types of activities includedin the BAM curriculum and provides a brief description of each se-lected activity. The program is manualized and can be delivered bycollege-educated men without specialized training in psychologyor social work, although YG had a preference for such training inselecting program providers. YG also prioritized hiring counselorswho were able to keep youth engaged, and often hired people fromneighborhoods similar to those in which they would be working.
The curriculum includes standard elements of CBT (Beck2011), such as a common structure to most sessions that starts
That program had a variety of behavioral components, including teaching angermanagement and self-discipline.
8. The sessions were one to two hours each and included nontraditional sportslike archery, boxing, wrestling, weightlifting, handball, and martial arts.
FIELD EXPERIMENTS TO REDUCE CRIME AND DROPOUT 9
TABLE ISELECT BAM ACTIVITIES
Activitycategory Example activities
Immersive/experiential
The Fist: Students are told to get an object from apartner. Many try to use force. The counselor asksquestions to highlight how their partners were willingto give up the object if they calmly requested it.Plates: Students reflect on what it has taken tosuccessfully complete group missions and write thoseattributes on a plate. The plates are placed on the floor,and students must cross the floor by using the plates.However, if no one is standing on a plate, then it isremoved (making the task more difficult).Trust Walk: Students follow group leaders around theschool silently and without disrupting the school. Theyare told that with freedom comes responsibility.Focus Mitt Drill: Students punch focus mitts for anextended period.Human Knot: Students stand in a circle and grab thehands of someone standing across from them. Theymust then untangle themselves without letting go.
Reflective/introspective
Check-ins: Students talk to each other about whatthey are doing well and areas where they still need toimprove. Students must listen patiently while someoneelse discusses their attributes.
Role-playing Our Story of What Happened: Students imagine aconflict and discuss why the conflict came about. Theyexamine thinking distortions that might have madethe conflict worse.High School Day: Students do a role-play where astudent and administrator have a confrontation. Theyact out the conflict with “out of control” and “in control”anger expressions.$10 Role-play: Students role play a student borrowingmoney and then never paying it back.
Skill-building Cognitive Thought Replacement: Students learnhow to recognize negative thoughts that arise and howto replace them. It is not necessary to replace negativethoughts with positive thoughts, but rather to insteadfocus on what can be done to control the situation thatis leading to the negative thought.Manhood Questions and Rites of Passage:Students discuss the key moments when boys becomemen and various rites of passage that exist.Positive Anger Expression: Students are taughtabout how to express anger in a controlled way.

10 QUARTERLY JOURNAL OF ECONOMICS
TABLE I(CONTINUED)
Activitycategory Example activities
Stories anddiscussion
Rudy: Students watch and discuss the movie Rudy.Before beginning the movie, the counselor holds up $2and asks who wants the money. Even as students raisetheir hand, he keeps asking who wants it untilsomeone simply takes it from him. He explains that weoften overlook opportunities, but the student who tookthe money saw it as an opportunity and took a chance.The Boy Who Cried Wolf: Students listen to anddiscuss the story where one day a boy pretends that heis being attacked by a wolf. He is amused by how histown responds to this prank. So when he feels bored onanother day, he does it again. And again. He promisesto stop playing around, but when he feels bored hecan’t help but do it again. In the end, when he isactually attacked by a wolf, no one responds to hispleas for help.Miracle: Students watch and discuss the film Miracleabout the U.S. men’s hockey team.
with a “check-in.” Youth sit in a circle with the counselor, who re-flects on how things in his life are going in various domains. Theyouth then follow suit. This is an example of what we call “retro-spective/introspective” activities, which include various efforts toget youth to talk about the things they are doing well and areas inwhich they still need to still improve, and also share what othersare doing well and need to improve.
Another type of activity in the BAM curriculum we call “im-mersive or experiential,” of which the fist exercise described aboveis one example. Another example is called the stick. Youth aredivided into two groups and lined up facing each other. They aretold to put their arms out chest high and extend their index fin-gers, and the counselor then lays a 10- or 15-foot plastic pipeacross everyone’s fingers. The group is then told that they mustlower the pipe to the floor but their fingers must be touching thepipe at all times. This leads everyone to put upward pressure onthe pipe, which makes it go up rather than down. As youth becomeimmersed in the activity, they can lose themselves in the momentand become frustrated, blaming each other rather than recogniz-ing that each of them contributes to the problem (and that theycould help solve the problem themselves by trying to coordinateand lead the group).
FIELD EXPERIMENTS TO REDUCE CRIME AND DROPOUT 11
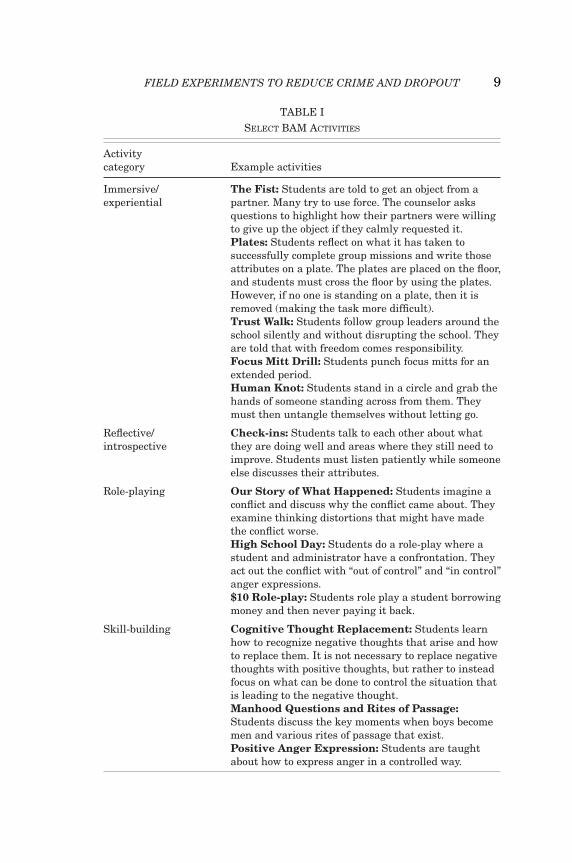
Other types of activities included in the BAM curriculum arewhat we call “role-playing” and “stories and discussions.” For ex-ample, in the $10 role-play activity, students act out a scene inwhich one of them has borrowed money from another but thennever paid it back. The youth act out how they would respondand then the group discusses what happened and why, and whatmight have led to a better outcome. Stories include the elephantand the rhino, in which two large animals are very persistent intheir refusal to make way for the other, to both their detriments.
The program also does some “skill building.” This includeslessons in muscle relaxation, deep breathing, and channelinganger productively. It also includes cognitive thought replace-ment, a CBT element that asks youth to identify and replaceproblematic or false beliefs. Finally, the curriculum includes a dis-cussion of different conceptions of masculinity and some generalvalues like the importance of integrity and personal accountabil-ity. It also takes youth on field trips to local colleges to highlightthe value of education, and, by putting youth in regular contactwith a pro-social adult, has a mentoring component as well.
II.B. Juvenile Detention
The setting for our third RCT is the Cook County JuvenileTemporary Detention Center, which is where the highest-risk ju-venile arrestees in Cook County are taken after they are arrested.Youth are held for an average of three to four weeks until theircases are adjudicated in court, although youth whose cases are be-ing heard in the adult court system can be detained much longer.In May 2007 the JTDC began to implement a series of reformsthat included the use of a token economy system to help main-tain order and twice-daily participation in group CBT sessionswhen youth were not attending the school inside the JTDC, re-placing time that had typically been spent watching TV. The CBTprogram used a manualized curriculum9 and was delivered bytrained JTDC staff. Partly to help implement these reforms, theJTDC also required increased educational requirements for staffworking in the newly reformed centers.
9. The specific intervention studied here was developed by Dr. Bernie Glosand his associates from the DuPage County, Illinois Juvenile Detention Center.The curriculum is adapted from the best material from several prior CBT modelsthat had been used in detention and is based in part on the cognitive behavioraltraining ideas from Maultsby (1975, 1990) (see also Ellis 1957; Ellis and Harper1975).

12 QUARTERLY JOURNAL OF ECONOMICS
Table II summarizes a few key types of activities and spe-cific activities included in the JTDC curriculum. While BAM uses“check-ins” at the start of most sessions to get youth to engage inreflection or introspection, the JTDC program requires youth tocarry out “thinking reports” every time their misbehavior causesdetention staff to give them a “time out” (a certain amount oftime alone in their cell). Examples of other activities in the reflec-tive/introspective category in the JTDC include retrospectivelytalking through experiences and focusing on what an outside, ob-jective observer would have seen (or, taking a “camera view”). Theprogram in the JTDC also continually emphasizes the importanceof learning to “stop, look, and listen.”
While BAM emphasizes youth engagement and seeks to“show, not tell,” the JTDC program in comparison is much more“tell, not show.” In the JTDC curriculum there are no immer-sive/experiential activities (like the stick or the fist) or even anyphysical activities (including no sports). In addition to reflec-tive/introspective activities, “skill-building” activities are commonin the JTDC curriculum. As in BAM, the “skill-building” curricu-lum focuses on helping youth “keep cool when they are angry”(using anger expression and relaxation techniques), as well as onthings like setting goals, interpersonal problem solving, and pay-ing attention to one’s feelings. The token economy is often used toreinforce the CBT curriculum by rewarding positive behaviors orthoughts consistent with these lessons.
III. EVIDENCE FROM THREE RANDOMIZED CONTROLLED TRIALS
This section presents the results of our three large-scaleRCTs, two of which tested BAM and the third of which testeda related program implemented inside the Cook County JuvenileTemporary Detention Center. The exact outcome measures andtime horizons we examine are not identical across all three stud-ies, but the results are qualitatively consistent in showing sizableyouth responses on different measures of criminal behavior orschooling.
III.A. Studies 1 and 2: Becoming a Man
1. Samples and Randomization. For our first RCT of BAM(hereafter “study 1”), during the summer of 2009 we recruited18 elementary and high schools in the CPS located on Chicago’s

FIELD EXPERIMENTS TO REDUCE CRIME AND DROPOUT 13
TABLE IISELECT JTDC ACTIVITIES
Activitycategory Example activities
Reflective/introspective
Self-talk: Students are taught about how the mindalways tries to make sense of what is going on and howthese thoughts drive our behavior. For example, thecounselor might hold out his hand and see how peoplerespond. He then explains how the students’ mindshave an automatic interpretation of and reaction to hisoutstretched hand.Hot Button Situations: Students talk aboutsituations that make them upset. They describe thesituation and their thoughts in that situation. Theyidentify elements of “hot” self-talk that leads tonegative consequences and they identify hot buttonsituations that trigger these thoughts.Camera Check: Students imagine a hot buttonsituation and then describe how they would navigateit. They then imagine the situation again from aneutral outsider perspective.Rational Self-Analysis (RSA): After antisocialbehavior, students complete an RSA, writing down thefacts of the incident, identifying what self-talk/feelingsled to the behavior, reporting what a camera wouldhave seen, and brainstorming alternative/moreadaptive self-talk. Youth then process their RSA withstaff and discuss the new self-talk options they havedeveloped.
Skill-building Goal Setting: Students are encouraged to make oneconcrete statement about something they want to dobetter or differently.Goals and Choices: Students discuss what they wantversus what they need. And they discuss how goals,wants, and needs are always set internally. No one elsecan set them for you. Students talk about “big wins”that they want to achieve and think about how theycan break down long-term goals into shorter, moremanageable pieces to help them achieve their goals.Keeping Cool When You Get Angry: Studentsdiscuss how situations can drive angry self-talk, whichleads to negative outcomes. They are taught aboutvarious cognitive distortions. They then learntechniques to physically calm down and to replacenegative or angry thoughts.

14 QUARTERLY JOURNAL OF ECONOMICS
TABLE II(CONTINUED)
Activitycategory Example activities
Skill-building Me Mode and We Mode: Students discuss elementsof self-talk that are focused only on one’s own needsinstead of other people’s needs.Problem Solving: Students are given a 6-stepapproach for solving problems that involves identifyingthe problem, thinking about several solutions, andpicking the best solution.
Stories anddiscussion
Thinking Patterns: Students are shown severaloptical illusions that can be seen in two ways. A lessonfollows about how the mind sometimes only sees oneinterpretation or how it only sees what it expects tosee. Students fill out a sheet on their expectationsabout their lives and basic rules for their lives.Moral Development Groups: Students arepresented with morally ambiguous situations, and areasked to identify various potential outcomes forthemselves and others based on different responses.
Other Drugs and Alcohol: Students use the frameworkthey’ve developed to specifically focus on situationsinvolving drugs and alcohol.
low-income, racially segregated south and west sides, where thecity’s violent crime is disproportionately concentrated (see OnlineAppendix Figure A.1). Our sample was essentially the 2740 7th-to 10th-grade male students at highest risk of failure in theseschools, after excluding students who rarely attended school (andso would not benefit from a school-based intervention) or hadserious disabilities. This sample represented around 75% of allmales in grades 7 through 10 in the study schools (see OnlineAppendix B). Our second BAM RCT (“study 2”) was carried out in2013–15 with 2064 male 9th and 10th graders attending nine CPShigh schools. Similar sample eligibility and randomization proce-dures were used for study 2, though the larger number of BAMslots per school meant study 2 covered a broader risk spectrumthan did study 1.
Both studies were block-randomized experiments, where stu-dents were the unit of randomization and were randomly assignedwithin schools (study 1) or school-by-grade “blocks” (study 2).In study 1 youth were randomized to one of three treatmentarms (in-school BAM, after-school sports programming that

FIELD EXPERIMENTS TO REDUCE CRIME AND DROPOUT 15
incorporated BAM elements, or both) or the control group.10 Un-fortunately, due in part to treatment-arm crossover, study 1 doesnot have adequate statistical power to disentangle the separateeffects of BAM from the after-school program; in our main anal-yses, we pool the treatment arms together (results separately bytreatment arm and details about crossover are in Online AppendixC, Figure A.2 and Table A.11). In study 2 youth were randomlyassigned to either be offered BAM for two years (2013–14 and2014–15) or to the control group. There were some sports sessionsoffered in five of the nine schools in study 2, but sports participa-tion was low in the first year and then declined by 80% from thefirst to second year. We return to this below.
Table III shows that both studies enrolled very disadvan-taged samples of youth, and that random assignment appears tohave been carried out correctly. In both studies youth were about15 years old at baseline,11 with one-third to one-half being old forgrade. They missed on average eight weeks of school in study 1(when the school year was 170 days) and six weeks in study 2(when the school year was 180 days); many had been arrestedbefore. Reflecting the composition of their neighborhoods, around70% of youth are black and the remainder Hispanic. In neitherstudy can we reject the null hypothesis that the set of base-line characteristics is the same for treatment and control groups(F(18,2543) = 1.04, p = .409 and F(18,1752) = 0.38, p = .99, re-spectively).12 We also find that the youth in study 1 were moredisadvantaged on average than those in study 2; we can rejectthe null hypothesis that the difference in study 1 versus study 2baseline means are jointly zero, F(18,4348) = 329.31, p < .001.13
10. Three of our 18 schools could not offer after-school programming because oflogistical or space reasons. Eight schools offered both in- and after-school treatmentarms in some combination but not all three treatment arms.
11. Even though study 1 covers youth in grades 7–10 and study 2 coversyouth in high school grades only (9–10), the average age is slightly higher in study1 because of a larger number of youth 17- or 18-years-old at baseline.
12. The baseline variables in the joint test are: age; grade; number of in-schoolsuspensions; number of out-of-school suspensions; number of each type of arrest(violent, property, drug, and other); number of each type of grade earned (A throughF); and indicator variables for being black, Hispanic, old-for-grade, and having alearning disability.
13. The difference is not just because of age or school differences in the sample;when we hold age constant and compare youth in 9th and 10th grade in just thethree schools that are common to both BAM studies, we still see that the study 1youth are more disadvantaged on average than those in study 2.

16 QUARTERLY JOURNAL OF ECONOMICS
TABLE IIIBECOMING A MAN STUDIES 1 AND 2: BASELINE CHARACTERISTICS
Study 1 Study 2
Control Treatment Control Treatment
No. of students 1,267 1,473 1,048 1,016
Baseline characteristic
DemographicsAge 15.70 15.51 14.75 14.81Black 72% 69% 70% 68%Hispanic 28% 31% 28% 30%
SchoolingGrade 9.42 9.29 9.41 9.46Old for grade 55% 51% 35% 35%GPA 1.68 1.73 2.11 2.16Days present 129.86 133.60 148.18 149.78Learning disability 20% 19% 17% 16%
CrimeAny baseline arrests 37% 35% 23% 23%
No. of baseline arrests for:Violent offenses 0.35 0.35 0.19 0.18Property offenses 0.21 0.19 0.14 0.13Drug offenses 0.17 0.18 0.11 0.14Other offenses 0.45 0.47 0.29 0.32
p-value on F-test oftreatment-controlcomparison for allbaselinecharacteristics
.409 .991
Notes. Asterisks indicate statistical significance of pairwise treatment-control comparison for a given base-line characteristic controlling for randomization block fixed effects with heteroscedasticity-robust standarderrors. Data from Chicago Public Schools administrative data, Illinois State Police arrest records (study 1),and Chicago Police Department arrest records (study 2). Means calculated using non-missing observationsfor each variable. Pre-program arrests are arrests prior to start of program school year. For study 1, thebaseline school year (AY2009–10) was 170 days; for study 2, the baseline year (AY2013–14) was 180 days.GPA is measured on a 0–4 scale. Joint significance tests for equality of all baseline characteristics use onlynonmissing data (n for joint tests: study 1 = 2,579, study 2 = 1,770). ∗ p < .10, ∗∗ p < .05, ∗∗∗ p < .01.
At least part of the difference in baseline schooling characteristicsacross studies may be due to general improvements in reportedschooling outcomes throughout CPS over time.14
14. For example, reported graduation rates have increased from 57% in 2010–11 to 70% for 2014–15, while the reported CPS 9th grade indicator for being “ontrack” for graduation (Allensworth and Easton 2005) increased from 69% to 84%over that period (see http://cps.edu/SchoolData/Pages/SchoolData.aspx).

FIELD EXPERIMENTS TO REDUCE CRIME AND DROPOUT 17
In both BAM studies about half of those randomized totreatment actually participated (defined as attending at leastone program session). This take-up rate is consistent withmany other social experiments despite the fact that we ran-domized (using administrative data) prior to seeking con-sent for program participation, in contrast to the more com-mon practice of consenting and then randomizing.15 We sus-pect participation rates for the after-school programming instudy 1 are understated because of record keeping issues; OnlineAppendix C and Table A.4 discuss how we handle this issue.Participants attended on average 13 sessions the first year ofstudy 1, and for study 2 an average of 17 and 21 sessions dur-ing the first and second years, respectively (see Online AppendixTable A.3). A small share of controls also received program ser-vices in both studies.
2. Data and Outcome Measures. Our main schooling out-comes come from longitudinal student-level CPS records. We havethese data through AY 2014–15, which for study 1 covers the pro-gram year plus five follow-up years, and for study 2 covers only thetwo program years. We create a summary index of three school-ing outcomes in Z-score form (GPA, days present, and enrollmentstatus at the end of the year), which we call “school engagement.”Use of an index reduces the number of hypothesis tests, which re-duces the risk of false positives (Westfall and Young 1993; Kling,Liebman, and Katz 2007; Anderson 2008), and improves statisti-cal power to detect effects for outcomes within a given “family” ofoutcomes that are expected to move in a similar direction. We im-pute group means for missing outcomes, which assumes data aremissing completely at random. Our results are similar when werelax this assumption and use multiple imputation or other ap-proaches to handling missing data (Online Appendix Table A.10).For study 1, where we have longer-term follow-up data, we arealso able to examine impacts on high school graduation rates.
To measure effects on criminal behavior, for study 1 we useelectronic arrest records (“rap sheets”) from the Illinois State Po-lice (ISP). For study 2 we use arrest data from the Chicago PoliceDepartment (CPD). Both datasets are linked to our samples usingprobabilistic matching on first and last name and date of birth.
15. Consent was for program participation only; outcome data are availablefor all youth who were randomized.

18 QUARTERLY JOURNAL OF ECONOMICS
Arrest records avoid the problem of under-reporting of criminalinvolvement in survey data (Kling, Liebman, and Katz 2007) butrequire the assumption that the intervention does not change thechances a crime results in arrest. Because intervention impactscan vary by crime type, we present results separately for violent,property, drug, and “other” crimes.16 We cannot distinguish “miss-ing data” from “no arrests,” so we cannot explore how the arrestimpacts change when we change how we handle missing data.
3. Estimation Approach. Given our randomized experimen-tal design, our analysis plan is quite straightforward. Let Yistdenote some post-program outcome for individual i at school sduring post-randomization period t, which is a function of treat-ment group assignment (Zis) and data from government recordsmeasured at or before baseline (Xis(t-1)) as in equation (1). Wecontrol for baseline characteristics to improve precision by ac-counting for residual variation in the outcomes (results with-out baseline covariates are similar).17 We also control for the“randomization block” with school (study 1) or school-by-grade(study 2) fixed effects (γ s). The intention to treat effect (ITT) cap-tures the effect of being offered the chance to participate in the pro-gram, and is given by the estimate of π1 in equation (1). We presentrobust standard errors but do not cluster by school, partly be-cause the fixed effects account for within-school or within-school-and-grade correlations across students in mean outcomes. As asensitivity analysis we also calculate p-values that come from apermutation test, which randomly reassigns the treatment-offerindicator Zis and does not rely on distributional assumptions orany asymptotic theory,18 as well as p-values that account for mul-tiple comparisons (discussed below).
(1) Yist = Zisπ1 + Xis(t−1)β1 + γ1s + ε1ist.
16. We exclude arrests for motor vehicle violations, but results are similarincluding them (Online Appendix Table A.12).
17. We control for: days present; number of in-school suspensions; number ofout-of-school suspensions; number of each type of grade received (A, B, C, D, F);dummies for ages 14–15, 15–16, and 17+; and indicators for having a learningdisability, being in 9th or 10th grades, being old-for-grade, being black, beingHispanic, and having one, two, or three and over arrests of each type. For missingbaseline covariates, we assign a value of zero and include an indicator that thevariable is missing.
18. See, for example, Young (2015) for how the use of re-randomization testscan matter in practice.

FIELD EXPERIMENTS TO REDUCE CRIME AND DROPOUT 19
In addition we present the effects of participating in the pro-gram (defined as having attended � 1 session) for those who par-ticipate, which we estimate using two-stage least squares withrandom assignment (Zis) as an instrumental variable (IV) for par-ticipation (Pist), as in equations (2) and (3) (Bloom 1984; Angrist,Imbens, and Rubin 1996). This assumes treatment assignmenthas no effect on the outcomes of youth who do not participate inthe intervention.
(2) Pist = Zisπ2 + Xis(t−1)β2 + γ2s + ε2ist,
(3) Yist = Pistπ3 + Xis(t−1)β3 + γ3s + ε3ist.
Since a small share of controls gets the program, π3 is tech-nically a local average treatment effect (LATE). But given the lowrate of crossover this should be close to the effect of treatment onthe treated (TOT). We benchmark the size of these effects withthe control complier mean (CCM) (see Katz, Kling, and Liebman2001), but given the treatment crossover we estimate this usingthe formula from Heller et al. (2013). If C indicates being a “com-plier” and Z indicates treatment assignment, we calculate this asCCM = E(Y|C = 1, Z = 1) – [E(Y|C = 1, Z = 1) – E(Y|C = 1,Z = 0)]. The term in brackets is our LATE estimate. However, wemust recover the first right-hand-side term, E(Y|C = 1, Z = 1),since what we observe in the data is the mean outcome for alltreatment group participants—a weighted average of the meanoutcomes for compliers and always-takers. Let P indicate actualparticipation and A be an indicator for always-takers. Then:
E(Y |Z = 1, P = 1) = E(Y |Z = 1, C = 1)(
1 − E(A|Z = 1)E(P|Z = 1)
)(4)
+ E(Y |Z = 1, A = 1)(
E(A|Z = 1)E(P|Z = 1)
)
To recover E(Y|Z = 1, C = 1), we can estimate the left-handside and E(P|Z = 1) directly from the data and use random as-signment to replace E(A|Z = 1) with E(A|Z = 0) and E(Y|Z =1, A = 1) with E(Y|Z = 0, A = 1). That is, we assume treatment-and control-group always-takers are equivalent on average. In ourcase, block randomization means these equalities should also beconditional on block. In practice, calculating them conditionallymakes a trivial difference.

20 QUARTERLY JOURNAL OF ECONOMICS
It is possible that there may be some spillover effects of theBAM treatment to other youth within the school, through peer in-fluences or other mechanisms. We have tried to learn more aboutthis using nonexperimental variation across schools in the shareof male youth who were randomized to treatment. But with rela-tively few schools in the study sample our statistical power is quitelimited. If peer spillovers from BAM lead to improved control-group outcomes (or if negative spillovers from interacting with“untreated” control youth undermine effects of the BAM treat-ment), then our estimates would understate the effects of offeringBAM at larger scale (e.g., to all youth within a school rather thanjust some youth).
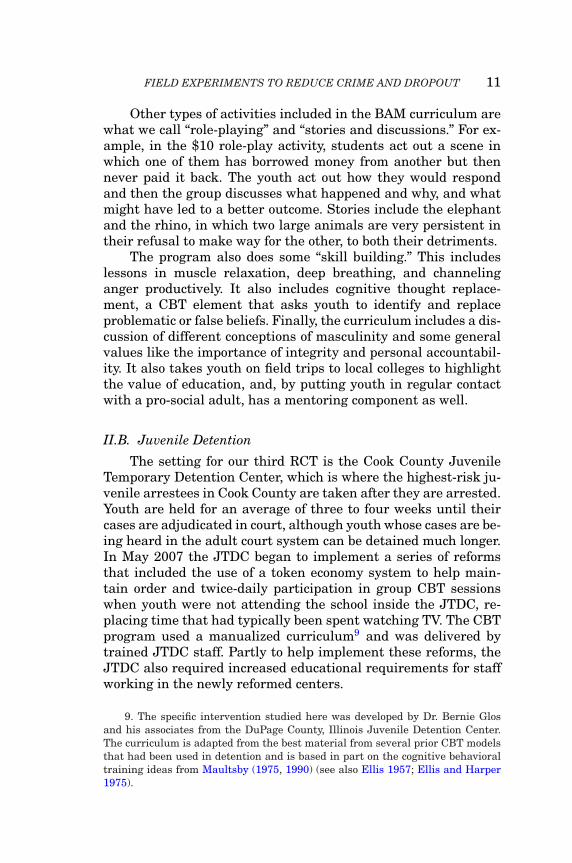
4. Results. Table IV shows that school engagement in-creased in both studies by the end of the program period. Instudy 1, where we have post-program data, the effect seems tohave persisted. We initially focus on showing as much of the dataas possible, focusing on separate estimates by study and programyear and simple pair-wise p-values without any adjustment formultiple comparisons, but return to these other issues below. Dur-ing the program year in study 1, participation in BAM improvedschooling outcomes by 0.14 std. dev., and by 0.19 std. dev. in thefollow-up year. In study 2 there was no statistically detectableimpact on school engagement in year one but an effect of about0.10 std. dev. in year two (which as a reminder, was a programyear in study 2). Permutation tests lead to qualitatively similarinferences for BAM study 1, although for study 2 the p-value forthe year two schooling effect is now p = .11 vs. p < .05 (see OnlineAppendix Table A.6).
Table IV shows impacts on arrests that look quite similaracross the two studies when measured at the end of the programperiod. By the end of the first (and only) program year in study1, participation reduced total arrests by 28% of the CCM, violent-crime arrests by 45%, and “other” arrests by 37% (with reducedweapons offenses, trespassing, and vandalism each accountingfor about one-quarter of the effect).19 By the end of the programperiod in study 2 (i.e., during year two), participation reducedtotal arrests by 35% of the CCM, violent-crime arrests by 50%,
19. Disorderly conduct and disobeying a police officer—the offenses wherewe might expect being able to interact constructively with police could have thebiggest effect on the chance of being arrested conditional on engaging in a givenbehavior—do not change in either study.

FIELD EXPERIMENTS TO REDUCE CRIME AND DROPOUT 21
TA
BL
EIV
BE
CO
MIN
GA
MA
NS
TU
DIE
S1
AN
D2
–E
FF
EC
TS
ON
YO
UT
HO
UT
CO
ME
S
Con
trol
mea
nIn
ten
tion
totr
eat
Eff
ect
ofpa
rtic
ipat
ion
(IV
)C
ontr
olco
mpl
ier
mea
n
BA
Mst
udy
1(P
rogr
amYe
ar20
09–1
0,n
=2,
740)
Year
1(p
rogr
amof
fere
d)S
choo
len
gage
men
tin
dex
00.
0569
∗∗∗
0.13
67∗∗
∗0.
222
(0.0
215)
(0.0
511)
Tot
alar
rest
spe
ryo
uth
per
year
0.69
9−0
.077
8∗−0
.186
9∗0.
672
(0.0
456)
(0.1
087)
Vio
len
t0.
167
−0.0
345∗
∗−0
.082
9∗∗
0.18
6(0
.016
5)(0
.039
4)P
rope
rty
0.07
70.
0048
0.01
160.
066
(0.0
127)
(0.0
303)
Dru
g0.
151
0.00
130.
0032
0.09
7(0
.017
7)(0
.042
2)O
ther
0.30
5−0
.049
5∗−0
.118
8∗0.
323
(0.0
272)
(0.0
648)
Year
2(p
rogr
amn
otof
fere
d)S
choo
len
gage
men
tin
dex
00.
0782
∗∗∗
0.18
78∗∗
∗0.
040
(0.0
215)
(0.0
514)
Tot
alar
rest
spe
ryo
uth
per
year
0.59
5−0
.064
3−0
.154
30.
606
(0.0
420)
(0.1
000)
Vio
len
t0.
110
0.00
060.
0013
0.09
2(0
.014
3)(0
.034
0)P
rope
rty
0.05
7−0
.003
4−0
.008
20.
052
(0.0
103)
(0.0
245)
Dru
g0.
164
−0.0
196
−0.0
471
0.17
3(0
.019
4)(0
.046
1)O
ther
0.26
4−0
.041
8−0
.100
40.
288
(0.0
259)
(0.0
617)
22 QUARTERLY JOURNAL OF ECONOMICST
AB
LE
IV( C
ON
TIN
UE
D)
Con
trol
mea
nIn
ten
tion
totr
eat
Eff
ect
ofpa
rtic
ipat
ion
(IV
)C
ontr
olco
mpl
ier
mea
n
BA
MS
tudy
2(P
rogr
amYe
ars
2013
–14
and
2014
–15,
n=
2,06
4)Ye
ar1
(pro
gram
offe
red)
Sch
oole
nga
gem
ent
inde
x0
0.00
580.
0117
0.22
1(0
.024
8)(0
.048
8)T
otal
arre
sts
per
you
thpe
rye
ar0.
591
−0.0
806
−0.1
614
0.63
0(0
.050
6)(0
.099
9)V
iole
nt
0.11
9−0
.018
0−0
.036
10.
121
(0.0
161)
(0.0
318)
Pro
pert
y0.
073
−0.0
078
−0.0
157
0.07
5(0
.012
9)(0
.025
3)D
rug
0.12
6−0
.015
3−0
.030
70.
168
(0.0
233)
(0.0
459)
Oth
er0.
273
−0.0
394
−0.0
789
0.26
6(0
.029
3)(0
.057
9)Ye
ar2
(pro
gram
offe
red)
Sch
oole
nga
gem
ent
inde
x0
0.05
01∗∗
0.09
93∗∗
0.08
1(0
.025
2)(0
.049
0)T
otal
arre
sts
per
you
thpe
rye
ar0.
383
−0.0
841∗∗
−0.1
670∗∗
0.47
1(0
.039
2)(0
.077
1)V
iole
nt
0.07
9−0
.027
6∗−0
.054
9∗0.
110
(0.0
155)
(0.0
303)
Pro
pert
y0.
046
−0.0
018
−0.0
036
0.06
2(0
.010
1)(0
.019
7)D
rug
0.09
4−0
.014
7−0
.029
20.
115
(0.0
171)
(0.0
335)
Oth
er0.
163
−0.0
400∗
−0.0
793∗
0.18
3(0
.022
1)(0
.043
4)
Not
es.B
asel
ine
cova
riat
esan
dra
ndo
miz
atio
nbl
ock
fixe
def
fect
sin
clu
ded
inal
lm
odel
spec
ifica
tion
s(s
eete
xt).
Het
eros
ceda
stic
ity-
robu
stst
anda
rder
rors
inpa
ren
thes
es.S
choo
len
gage
men
tin
dex
iseq
ual
toan
un
wei
ghte
dav
erag
eof
days
pres
ent,
GP
A,
and
enro
llm
ent
stat
us
aten
dof
sch
ool
year
,al
ln
orm
aliz
edto
Z-s
core
form
usi
ng
con
trol
grou
p’s
dist
ribu
tion
.Ye
ar1
arre
stda
tafr
omst
art
ofpr
ogra
msc
hoo
lye
aru
nti
lst
art
offo
llow
ing
sch
ool
year
for
both
stu
dies
.F
orst
udy
1,th
eye
ar2
arre
stda
taru
ns
thro
ugh
July
18(c
aptu
rin
ga
∼10
mon
thw
indo
w)
wh
ile
for
stu
dy2,
year
2ar
rest
data
run
thro
ugh
Mar
ch31
(∼8
mon
ths)
.∗p
<.1
0,∗∗
p<
.05,
∗∗∗
p<
.01.

FIELD EXPERIMENTS TO REDUCE CRIME AND DROPOUT 23
and other arrests by 43% (driven by reductions in reckless con-duct and trespassing). These effects translate into large numbersof arrests averted, given that the control groups’ rates of arrestswere 40 to 70 arrests per 100 youth per year. (The rate was some-what lower in year two of study 2 because those arrest data coveronly eight months). Some of these impacts are not very preciselyestimated and are sometimes not statistically significant evenwhen the effects are proportionally large. But the consistency inthe pattern of arrest impacts across the studies is striking.
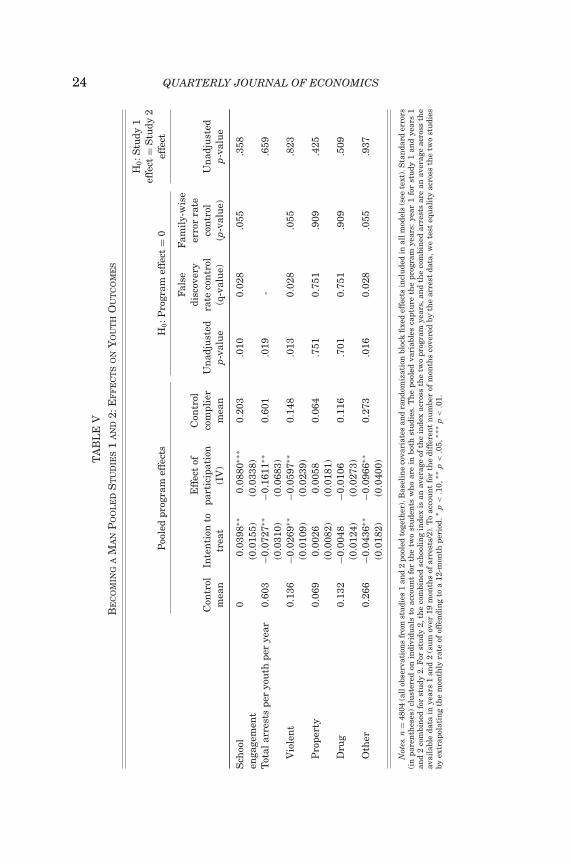
Table V reports the results of pooling together the data fromthe program periods in these two RCTs (year one for study 1 andyears one and two for study 2). The final column shows that wecannot reject the null hypothesis that the effects were the sameacross the two studies.20 In this case pooling data from the twostudies can also improve statistical power. The p-values for pair-wise treatment-control comparisons are statistically significant atthe 5% cutoff for school engagement, total arrests, and arrests forviolent and other crimes, calculated from either robust standarderrors or a permutation test. These results basically remain sta-tistically significant (p-values range from .010 to .055) when wecontrol for multiple comparisons—either the fairly conservativefamily-wise error rate, or FWER (defined as the chance that atleast one of our outcomes in the “family” of outcomes is signifi-cant when the null hypothesis of no effect is true),21 or the falsediscovery rate, or FDR (the share of significant estimates that areexpected to be false positives).22 In Table V we do not includetotal arrests in the “family” of outcomes since that is just a
20. Since the arrest data for year two of BAM study 2 do not cover a fullyear, we upweight these to 12-month equivalents for calculating the final column’sp-values for the test of comparability of study 1 and 2 effects. The point estimatesshown in the table come from summing the arrests over the 19-month periodcovered by study 2 years one and two and then dividing by two.
21. We use a bootstrap resampling technique that simulates data under thenull hypothesis (Westfall and Young 1993). Within each permutation, we randomlyreassign the treatment indicator with replacement and estimate program impactson all five of our main outcomes (the schooling index and our four arrest categories).By repeating this procedure 100,000 times, we create an empirical distributionof t-statistics that allows us to compare the actual set of t-statistics we find towhat we would have found by chance under the null; see Online Appendix C andTable A.5 for details.
22. We find the smallest FDR q-value at which we could reject the nullfor each outcome using the method from Benjamini and Hochberg (1995);Online Appendix Table A.5 shows similar results if we use the method fromBenjamini, Krieger, and Yekutieli (2006).
24 QUARTERLY JOURNAL OF ECONOMICST
AB
LE
VB
EC
OM
ING
AM
AN
PO
OL
ED
ST
UD
IES
1A
ND
2:E
FF
EC
TS
ON
YO
UT
HO
UT
CO
ME
S
Poo
led
prog
ram
effe
cts
H0:P
rogr
amef
fect
=0
H0:S
tudy
1ef
fect
=S
tudy
2ef
fect
Con
trol
mea
nIn
ten
tion
totr
eat
Eff
ect
ofpa
rtic
ipat
ion
(IV
)
Con
trol
com
plie
rm
ean
Un
adju
sted
p-va
lue
Fals
edi
scov
ery
rate
con
trol
(q-v
alu
e)
Fam
ily-
wis
eer
ror
rate
con
trol
(p-v
alu
e)U
nad
just
edp-
valu
e
Sch
ool
00.
0398
∗∗0.
0880
∗∗∗
0.20
3.0
100.
028
.055
.358
enga
gem
ent
(0.0
155)
(0.0
338)
Tot
alar
rest
spe
ryo
uth
per
year
0.60
3−0
.072
7∗∗−0
.161
1∗∗0.
601
.019
-.6
59(0
.031
0)(0
.068
3)V
iole
nt
0.13
6−0
.026
9∗∗−0
.059
7∗∗0.
148
.013
0.02
8.0
55.8
23(0
.010
9)(0
.023
9)P
rope
rty
0.06
90.
0026
0.00
580.
064
.751
0.75
1.9
09.4
25(0
.008
2)(0
.018
1)D
rug
0.13
2−0
.004
8−0
.010
60.
116
.701
0.75
1.9
09.5
09(0
.012
4)(0
.027
3)O
ther
0.26
6−0
.043
6∗∗−0
.096
6∗∗0.
273
.016
0.02
8.0
55.9
37(0
.018
2)(0
.040
0)
Not
es.n
=48
04(a
llob
serv
atio
ns
from
stu
dies
1an
d2
pool
edto
geth
er).
Bas
elin
eco
vari
ates
and
ran
dom
izat
ion
bloc
kfi
xed
effe
cts
incl
ude
din
allm
odel
s(s
eete
xt).
Sta
nda
rder
rors
(in
pare
nth
eses
)cl
ust
ered
onin
divi
dual
sto
acco
un
tfo
rth
etw
ost
ude
nts
wh
oar
ein
both
stu
dies
.T
he
pool
edva
riab
les
capt
ure
the
prog
ram
year
s:ye
ar1
for
stu
dy1
and
year
s1
and
2co
mbi
ned
for
stu
dy2.
For
stu
dy2,
the
com
bin
edsc
hoo
lin
gin
dex
isan
aver
age
ofth
ein
dex
acro
ssth
etw
opr
ogra
mye
ars,
and
the
com
bin
edar
rest
sar
ean
aver
age
acro
ssth
eav
aila
ble
data
inye
ars
1an
d2
(su
mov
er19
mon
ths
ofar
rest
s/2)
.To
acco
un
tfo
rth
edi
ffer
ent
nu
mbe
rof
mon
ths
cove
red
byth
ear
rest
data
,we
test
equ
alit
yac
ross
the
two
stu
dies
byex
trap
olat
ing
the
mon
thly
rate
ofof
fen
din
gto
a12
-mon
thpe
riod
.∗p
<.1
0,∗∗
p<
.05,
∗∗∗
p<
.01.

FIELD EXPERIMENTS TO REDUCE CRIME AND DROPOUT 25
TABLE VIBECOMING A MAN STUDY 1: EFFECTS ON HIGH SCHOOL GRADUATION
High school graduationmeasures
Controlmean
Intentionto treat
Effect ofparticipation
(IV)
Controlcomplier
mean
Graduated on time 0.339 0.0297∗ 0.0714∗ 0.382(0.0161) (0.0383)
Ever graduated 0.414 0.0240 0.0577 0.467(transfers = dropouts) (0.0167) (0.0397)
Ever graduated 0.582 0.0355∗∗ 0.0853∗∗ 0.587(transfers = graduates) (0.0170) (0.0406)
Notes. n = 2,740. Table measures graduation from Chicago Public Schools (CPS). First row counts gradua-tion as receipt of diploma on time relative to grade at time of randomization, second and third rows measuregraduation status by end of our study period (spring 2015), first assuming anyone who left the district didnot graduate (second row) then assuming all 474 verified out-of-district transfers did graduate (third row).Baseline covariates and randomization block fixed effects included in all models (see text). Heteroscedasticity-robust standard errors in parentheses. ∗ p < .10, ∗∗ p < .05, ∗∗∗ p < .01.
linear combination of the crime-specific measures (Online Ap-pendix Table A.5 shows the results from using different ways ofdefining “families” of outcomes).
The online appendix shows that the results are robust to ad-justing for the possibility of under-reporting of sports participationin the first BAM study (Online Appendix Table A.4), using multi-ple imputation or other methods to deal with missing values forschool outcomes (Online Appendix Table A.10), and using differ-ent thresholds for deciding what counts as a “match” to the arrestdata in our probabilistic matching algorithms (Online AppendixTable A.7).
Finally Table VI shows that there seem to have been gainsin high school graduation in the first BAM study (we do not yethave follow-up data for study 2). While the size and p-values ofthe estimated impacts vary somewhat depending on the gradua-tion measure, all estimates are in the direction of sizable gainsin graduation rates. The narrowest definition of graduation is ob-taining a diploma on time (no delays relative to the grade levelduring the program year), which BAM participation increased by7 percentage points (p < .10). Given a CCM of 38%, this is anincrease of 19%. The broadest definition is ever having received adiploma from CPS. This measure requires an assumption abouthow to treat youth who leave the school district, since for themwe do not observe graduation or dropout. The program effect wasslightly smaller (6 percentage points, versus a CCM of 47%, for

26 QUARTERLY JOURNAL OF ECONOMICS
a 12% increase) and not quite statistically significant if we counttransfers out of CPS as dropouts, but larger and statistically sig-nificant if transfers are counted as graduates (nearly 9 percentagepoints, p < .05, versus CCM of 59%, for a 15% increase). Increasedgraduation rates should lead to gains in lifetime earnings and im-proved health. We discuss this in the conclusion in the context ofour rough benefit-cost analysis.
III.B. Study 3: Cook County Juvenile TemporaryDetention Center
1. Sample and Randomization. Our third RCT capitalizeson a natural experiment resulting from the May 2007 take-overof the JTDC by a federal judge as the result of an ACLU lawsuit(Doe v. Cook County 2007). One of the first acts of Earl Dunlap, thetemporary administrator who was appointed by the federal courtto run the 500-bed facility, was to divide the facility into 10 essen-tially separate residential centers of around 50 beds each and toenact the reforms described in Section II in each of these centersone by one. The rollout of the reforms across centers was haltedhalfway through due to litigation initiated by the union represent-ing the JTDC staff. The result was that for an extended period,half the JTDC centers operated using the reforms (“treatmentcenters”) while the rest used the previous standard operating pro-cedures (“control centers”).
Our research team worked with the JTDC staff to implementa randomization algorithm that assigned all incoming male youthto treatment or control centers from November 10, 2009, throughMarch 2, 2011. The randomization ended when the litigation wasresolved, at which point the entire facility began implementing thenew reforms. (Girls were not randomized because all girls werehoused in a single residential center.) In our main analyses wefocus on the 2,693 male admissions to the JTDC during our studyperiod for which we have at least 18 months of follow-up data, sothat we have a balanced panel for the full follow-up period. Resultsfor all 5,728 male admissions to the JTDC during our study periodare in the Online Appendix (see Tables A.17 through A.20).
2. Estimation Approach. While random assignment was notbinding for some youth because of safety or operational reasons,

FIELD EXPERIMENTS TO REDUCE CRIME AND DROPOUT 27
or because they had been assigned to a treatment unit inside theJTDC previously (see Online Appendix B), randomization greatlyincreased the likelihood of placement in a treatment unit. The ITTeffect of random assignment on placement is about 25 percentagepoints (39.5% in spells where youth are assigned to treatment,14.4% for controls); the first stage F-statistic is 241. We thus havean “encouragement design,” where randomization is a valid in-strument for estimating the effect of participation on compliersas in equations (2) and (3) above. To avoid mis-measurement oftreatment caused by temporary relocation of small-group livingfacilities,23 we define participation as spending at least 5% of aJTDC stay in a treatment center. The first-stage ITT changes little(from 25 to 24 points) if participation is instead counted as “ever”in a treatment center in a given spell. In addition to controllingfor baseline characteristics, because randomization occurred foryouth by day of admission we also control for day-of-admit fixedeffects. These help control for any slight differences across daysin treatment assignment probabilities, and may also help withprecision (see Online Appendix C).
3. Data and Outcome Measures. The data we have on theseyouth include intake forms that provide basic demographics andaddresses; admissions logs, which the admissions staff use torecord who enters the facility each day; and the JTDC’s hous-ing roster, which captures the residential unit in which a youth islocated on each day and so lets us measure receipt of treatment.We have these data through December 2011. Our main resultsfocus on a common measure of recidivism—readmission into theJTDC facility itself. We have also linked these youth to the CPDand ISP arrest databases using the same probabilistic matchingalgorithms described above.
Table VII makes clear that this is a very criminally in-volved population: the average youth has been arrested eight
23. In general, we observe whether a youth participated in CBT by observingwhether he lived in an area of the JTDC that offered CBT at the time of hisstay. Occasionally, the youth and staff in a small-group living facility, or “pod,”temporarily moved to other areas of the building due to maintenance, cleaning, orother facility issues. We have imperfect records on these temporary moves, whichintroduces some error in our measurement of CBT receipt.

28 QUARTERLY JOURNAL OF ECONOMICS
TABLE VIIJUVENILE TEMPORARY DETENTION CENTER STUDY 3: BASELINE CHARACTERISTICS
Baseline characteristic Control Treatment
No. of spells = 1,322 No. of spells = 1,371Demographics
Age 16.13 16.15Black 0.83 0.84Hispanic 0.14 0.12White 0.03 0.03Other 0.01 0.01
No. of prior JTDC spells includingfocal spell
3.35 3.19
Reason for JTDC admissionViolent crime 0.17 0.18Property crime 0.10 0.09Drug crime 0.08 0.07Other crime 0.35 0.35Directly admitted (no police arrestrecorded)
0.30 0.30
Number of prior arrestsAll offenses 8.25 7.85∗
Violent offenses 2.11 2.00Property offenses 1.55 1.49Drug offenses 1.34 1.25Other offenses 3.22 3.08
Neighborhood characteristicsPercent adults 25+ with at least HSdiploma
72.80 72.75
Percent black 69.13 68.12Percent Hispanic 17.71 18.44Percent below poverty 34.54 34.58Unemployment rate 18.59 18.58
p-value on F-test of treatment-controlcomparison for all baselinecharacteristics
.65
Notes. Asterisks indicate statistical significance of pairwise treatment-control comparison for a given base-line characteristic, clustering standard errors on individual and clustering on census tract for the neighbor-hood characteristics. Neighborhood characteristics come from geocoding address information and linking totract level data from the American Community Survey. Joint significance test for equality of all baselinecharacteristics uses only nonmissing data (n = 2,643) and clusters standard errors on individual. ∗ p < .10,∗∗ p < .05, ∗∗∗ p < .01.
times in the past. The average JTDC spell in our sampleis the youth’s third entry into detention.24 Consistent with
24. Among the 1,862 individuals who make up these 2,693 spells, each visitsthe JTDC an average of 4.4 times before the end of our data (the maximum totalspells per individual over the 7 years of our housing roster data is 23).

FIELD EXPERIMENTS TO REDUCE CRIME AND DROPOUT 29
national patterns of incarceration, the large majority of de-tainees is black despite the fact that just one-quarter of thecounty’s population is black.25 As we would expect with success-ful randomization, we cannot reject the null hypothesis that thetreatment-control differences are jointly zero (F(24, 1835) = 0.87,p = .65).26
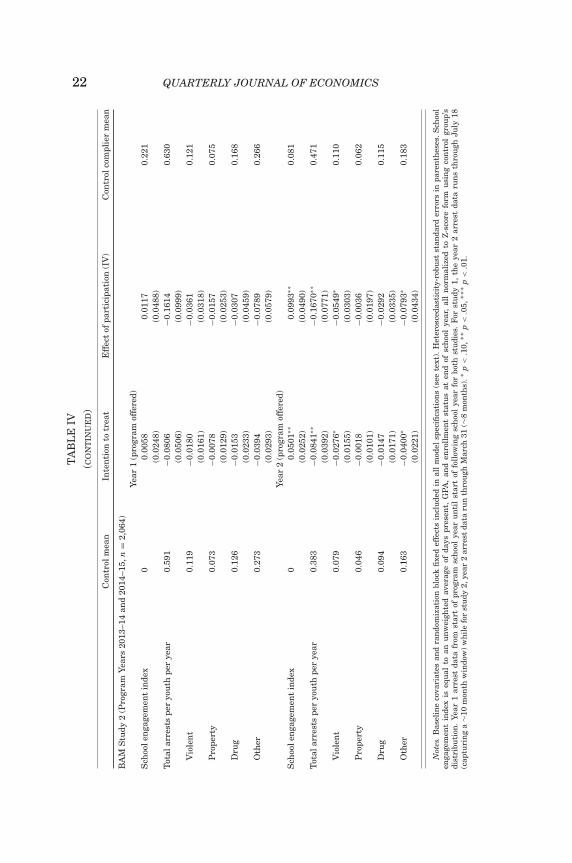
4. Results. Figure I shows the effect of being in a treatmentcenter on the probability of readmission to the JTDC.27 We mea-sure readmission at different points in time since release fromthe JTDC. The first panel shows that two months after release,the ITT effect was a decline in readmission rates of about threepercentage points. Through 18 months the effect was about 4 per-centage points. The figure also shows our estimates are not verysensitive to inclusion of day-of-JTDC-admission fixed effects.
The bottom panel of Figure I shows that the effect of beingin a treatment unit on the compliers (the local average treatmenteffect) was about 13 percentage points two months after releaseand grew slightly to 16 percentage points by 18 months followingexit from the JTDC (equal to 39% and 21% of the CCMs, respec-tively). A different way to gauge the size of this effect is to notethat about a fifth of the control compliers had not been readmit-ted to the JTDC within 18 months; the treatment increased thechances of avoiding readmission by fully 80%.
Table VIII shows results for the effect of receiving the inter-vention (LATE) on the re-admission outcome reported in Figure I
25. http://quickfacts.census.gov/qfd/states/17/17031.html26. Baseline covariates in the joint test are: spell number; age; number of
each type of baseline arrest (violent, property, drug, other); indicators for race(white, Hispanic, other); type of admitting offense (violent, property, drug, or otherarrest, or direct admission with no arrest); and neighborhood characteristics fromthe ACS (unemployment, median income, % below poverty, % white, % black, %Hispanic, % receiving SNAP, % owning their own home, % on welfare, and % withat least a high school degree). Only nonmissing covariates are used in the jointtest. For outcome regressions, we impute zeros for missing values and includeindicator variables for missing-ness. Outcome baseline covariates are: dummiesfor ages 14–15, 15–16, and over 17; race/ethnicity; having one, two, or three-plusprior arrests of each type; neighborhood characteristics (% with at least a highschool degree, % black, % unemployed); indicators for spell number (2, 3, 4, and5 or over); and admission reason (violent, property, drug, or other arrest, with noarrest as the left-out category).
27. Aizer and Doyle (2015) find large negative effects of a similar form ofjuvenile incarceration on high school completion and large positive effects on sub-sequent adult incarceration.

30 QUARTERLY JOURNAL OF ECONOMICS
FIGURE I
Effect of Treatment on Readmission, Study 3 (Juvenile Detention)
Sample consists of the N = 2,693 youth admitted to the Cook County JTDCduring period when random assignment was in effect, and for whom we haveat least 18 months of follow-up data. Since randomization occurred by day ofadmission, day-of-admit fixed effects help control for any slight differences acrossdays in treatment assignment probabilities. Graph shows effects conditional onbaseline covariates as described in text, and with versus without day-of-admissionfixed effects. Error bars represent 95% confidence intervals. CM is control mean;CCM indicates control complier mean.

FIELD EXPERIMENTS TO REDUCE CRIME AND DROPOUT 31
TA
BL
EV
III
JTD
CS
TU
DY
3–
TR
EA
TM
EN
TE
FF
EC
TO
NM
EA
SU
RE
SO
FR
EC
IDIV
ISM
WIT
HIN
GIV
EN
NU
MB
ER
OF
MO
NT
HS
SIN
CE
RE
LE
AS
E;S
AM
PL
EO
FY
OU
TH
WIT
HC
OM
PL
ET
E18
-MO
NT
HF
OL
LO
W-U
PD
AT
A
Mon
ths
sin
cere
leas
e2
46
810
1214
1618
Pan
elA
:Eff
ect
onpr
obab
ilit
yof
read
mis
sion
byX
mon
ths
Eff
ect
ofpa
rtic
ipat
ion
(IV
)−0
.134
2∗∗ −
0.18
93∗∗
∗ −0.
1984
∗∗∗ −
0.20
10∗∗
∗ −0.
1764
∗∗−0
.168
9∗∗ −
0.19
11∗∗
∗ −0.
1598
∗∗−0
.164
3∗∗
(0.0
682)
(0.0
734)
(0.0
735)
(0.0
722)
(0.0
704)
(0.0
690)
(0.0
683)
(0.0
673)
(0.0
669)
Con
trol
com
plie
rm
ean
0.34
50.
563
0.68
10.
738
0.73
30.
768
0.79
30.
790
0.79
5
Pan
elB
:Eff
ect
onn
um
ber
ofti
mes
you
thre
adm
itte
dw
ith
inX
mon
ths
Eff
ect
ofpa
rtic
ipat
ion
(IV
)−0
.163
3∗−0
.329
5∗∗∗
−0.3
411∗
∗−0
.473
9∗∗∗
−0.5
353∗
∗∗−0
.528
6∗∗ −
0.69
11∗∗
∗ −0.
7031
∗∗∗ −
0.70
45∗∗
∗(0
.083
5)(0
.123
5)(0
.149
3)(0
.174
6)(0
.195
6)(0
.214
8)(0
.233
1)(0
.246
4)(0
.252
2)C
ontr
olco
mpl
ier
mea
n0.
387
0.81
61.
041
1.38
61.
578
1.73
41.
995
2.11
72.
196
Pan
elC
:Eff
ect
onn
um
ber
ofti
mes
you
thre
adm
itte
dor
rear
rest
edw
ith
inX
mon
ths
Eff
ect
ofpa
rtic
ipat
ion
(IV
)−0
.181
9−0
.332
3∗−0
.265
6−0
.403
6−0
.543
4∗−0
.568
1−0
.675
7∗−0
.661
0−0
.659
5(0
.116
8)(0
.180
3)(0
.224
7)(0
.270
2)(0
.319
1)(0
.357
4)(0
.401
9)(0
.438
2)(0
.461
5)C
ontr
olco
mpl
ier
mea
n0.
653
1.34
61.
855
2.48
63.
063
3.49
73.
998
4.42
04.
803
Not
es.
n=
2,69
3.T
able
pres
ents
resu
lts
from
lin
ear
prob
abil
ity
mod
elw
ith
depe
nde
nt
vari
able
indi
cati
ng
wh
eth
eryo
uth
retu
rned
toJT
DC
wit
hin
Xm
onth
s,h
owm
any
tim
esth
eyre
turn
ed,
and
wh
eth
erth
eyre
turn
edor
wer
ere
arre
sted
wit
hin
Xm
onth
s;av
erag
em
argi
nal
effe
cts
from
prob
itm
odel
are
sim
ilar
.S
ome
indi
vidu
als
hav
em
ult
iple
spel
lsan
dpr
ovid
em
ult
iple
data
poin
tsin
the
sam
ple.
We
pres
ent
robu
stst
anda
rder
rors
clu
ster
edon
the
indi
vidu
al.
LA
TE
op-
erat
ion
aliz
espa
rtic
ipat
ion
assp
endi
ng
mor
eth
an5%
ofa
stay
ina
CB
Tu
nit
.A
llre
gres
sion
sin
clu
deba
seli
ne
cova
riat
esan
dda
y-of
-adm
issi
onfi
xed
effe
cts.
∗p
<.1
0,∗∗
p<
.05,
∗∗∗
p<
.01.

32 QUARTERLY JOURNAL OF ECONOMICS
and several other outcomes as well (ITT results are inOnline Appendix Tables A.13 through A.20). The second panelof the table shows that receipt of the JTDC intervention reducedthe number of readmissions through 18 months by 0.7 admissionsper youth, equal to 32% of the CCM. The bottom panel showsthat when we combine re-admissions and arrests as our outcome,the point estimate is of about the same magnitude (0.66), butless precisely estimated. The appendix presents various sensitiv-ity analyses, such as what happens when we use the full sample,not just those for whom we have a full 18 months of follow-up data(Online Appendix Tables A.17 through A.20).
While the outcome measures we have available are not per-fectly consistent across all three studies, to the extent to whichwe can pool data the impacts on the one outcome we can examinein all three RCTs (any criminal behavior) seem to be generallyconsistent. We find a statistically significant effect when averag-ing all three studies together and cannot reject the null hypoth-esis that the effects are the same across the three studies (seeOnline Appendix Table A.21).
IV. MECHANISMS
Why do these interventions have such large behavioral im-pacts? In this section we first discuss which specific componentsof the programs may be most important in generating behavioralresponses, and then turn to a discussion of what specific channelsor mechanisms the program components may be working throughto change youth outcomes. Existing theories of the determinants(beyond academic skills) of people’s life outcomes suggest a num-ber of candidate channels. Partly because these candidate mech-anisms map only imperfectly to the specific activities included inthe BAM and JTDC interventions, we also develop an alternativehypothesis (automaticity) for why these programs may changeyouth outcomes. While the data we have to test these mecha-nisms are not totally ideal, we find no positive evidence in supportof some commonly discussed determinants of youth behavior andsocial-program success. We do find some evidence to support ourautomaticity theory.
IV.A. Program Components
Because both the BAM and JTDC programs we study arebundled interventions, we begin by considering which elements of

FIELD EXPERIMENTS TO REDUCE CRIME AND DROPOUT 33
these interventions may be most important in changing youth out-comes. One natural question is whether these results are simplydriven by the after-school sports programming. Since some pro-grams try to reduce delinquency by keeping youth busy and offthe streets, to what degree are the impacts we observe here dueonly to “voluntary incapacitation” of youth during the after-schoolhours? We can rule out this sort of explanation by using exactdate of arrest in the rap sheet data we have; the estimated effectof BAM on arrests was not concentrated on days when after-schoolprogramming was held.28
In principle, the sports programming could change youth out-comes through other means, such as physical exercise, increasedself-discipline, or delivery of BAM principles in a different format(coaches were trained in BAM principles). But this seems veryunlikely to be the main driver behind our estimated program im-pacts. In the second BAM study, sports participation declined by80% from the first to second year of the program,29 while the im-pact on violent-crime arrests increased from year one to year twoby over 50%. Perhaps more telling, the JTDC study generated siz-able changes in behavior despite including no sports componentat all.
The JTDC intervention was a different bundle of services thatinvolved other program elements beyond CBT such as use of atoken economy inside the facility’s treatment units and exposureto staff with somewhat higher educational qualifications. Whilewe cannot cleanly distinguish between these elements, the factthat our behavioral impacts in the JTDC study are all measuredduring the time period after youth left the facility does not seemconsistent with the idea that changes in incentives inside thefacility (like the token economy) are driving our results.
IV.B. Candidate Mechanisms
1. Candidates from Existing Research. Table IX describesthe different candidate mechanisms through which the program-
28. In BAM study 1 the ITT effect on an indicator for any violent-crime arreston days when after-school programming was not offered was β = −0.0224 (std. err.= 0.0103), p = 0.030, CM = 0.094, versus on days when after-school programmingwas offered, β = −0.0061 (0.0076), p = 0.423, CM = 0.046). These estimates donot adjust for the larger number of non-programming days.
29. Controlling for randomization block effects in an ITT model of sport ses-sion attendance, the treatment-control difference in number of sessions attendeddecreased from 1.92 in year one to 0.35 in year two, a decline of 82%.

34 QUARTERLY JOURNAL OF ECONOMICS
TABLE IXSELECT BAM AND JTDC ACTIVITIES AND CANDIDATE THEORIES
Candidate theories for active mechanisms
Activity Example Self-control/ Social Socialcategory activities Automaticity grit skills values
Select BAM activitiesImmersive/experiential
The Fist X X
Plates XTrust Walk X XFocus Mitt Drill XHuman Knot X
Reflective/introspective
Check-ins X
Role-playing Our Story of WhatHappened
X
High School Day X X$10 Role-play X X
Skill-building Cognitive ThoughtReplacement
X
ManhoodQuestions andRites of Passage
X X
Positive AngerExpression
X X
Stories anddiscussion
Rudy X X
The Boy Who CriedWolf
X X
Miracle X
Select JTDC activitiesReflective/introspective
Self-talk X
Hot ButtonSituations
X
Camera Check XRational SelfAnalysis (RSA)
X
Skill-building Goal Setting X XGoals and Choices X XKeeping CoolWhen You GetAngry
X X

FIELD EXPERIMENTS TO REDUCE CRIME AND DROPOUT 35
TABLE IX(CONTINUED)
Candidate theories for active mechanisms
Activity Example Self-control/ Social Socialcategory activities Automaticity grit skills values
Me Mode and We XModeProblem Solving X
Stories anddiscussion
Thinking Patterns X
MoralDevelopmentGroups
X X
Other Drugs and Alcohol X
ming elements of BAM and the JTDC interventions may changeyouth behavior. For example, there is a large literature that doc-uments statistically significant correlations of behavioral out-comes with self-control, conscientiousness, and persistence or“grit” (Duckworth et al. 2007; Moffitt et al. 2011; Heckman andKautz 2013). These are distinct concepts in principle but yieldmeasures that are often highly correlated with one another inpractice.30 While the size of the correlations between these mech-anisms and outcomes like schooling can vary substantially acrossstudy samples,31 there is a growing sense that these and re-lated skills are important determinants of youth outcomes (Tough2013). BAM includes several activities that might help developthese skills, for example, the trust walk or the focus mitt drill.
Similarly, BAM activities like the human knot might helpdevelop improved emotional intelligence or social skills, whichhave been shown to be correlated with long-term outcomes likewages (e.g., Deming 2015). Some of the BAM stories could in
30. For example, Duckworth et al. (2007) found a correlation between grit andself-control of 0.63 to 0.66, and grit with conscientiousness of 0.77. In practice inour data set we have only a measure of grit and so cannot distinguish between thethree correlated mechanisms.
31. Duckworth et al. (2007) found a correlation between grit and GPA of 0.25in a sample of undergraduates and 0.06 in a sample of West Point students. Thecorrelation was 0.3 in a sample of middle-school students in Duckworth and Quinn(2009), while Duckworth and Seligman (2005) found a correlation of self-disciplinewith GPA in two separate samples of 8th graders to equal between 0.55 and 0.67.

36 QUARTERLY JOURNAL OF ECONOMICS
principle change social norms or moral values, which recent workby Seroczynski et al. (2015) among others suggests could be quiteimportant for youth outcomes. BAM took youth on a field trip toa local college, which might change perceptions of the returns toschooling. The possibility that youth growing up in high-povertyneighborhoods may lack role models who can demonstrate thereturns to schooling has been of long-standing concern to socialscientists (Wilson 1987; Manski 1993; Jensen 2010). All three ofour RCTs also involve an adult interacting with a group of youth.This could create a “mentoring” or “social capital” effect, whichhas been viewed, dating back to at least Coleman (1988), as animportant determinant of youth outcomes.
Despite the abundance of theories about the non-academicdeterminants of people’s life chances, it is noteworthy that manyof the activities in the programs we study do not seem to relateto any of these theories. For example, at the start of most BAMsessions the youth sit in a circle and do check-ins, which involvereflecting on what is going on in their lives and how they havehandled various situations. These account for a sizable share ofBAM program hours yet do not seem to be about building any-thing like self-control, grit, social skills, or moral values. The fistexercise described above might be teaching some social skills, butalso seems to be doing more than that. In any case, the fist ex-ercise does not seem to be doing much that could be interpretedas developing self-control or grit. In most BAM activities, coun-selors avoid telling youth what is the “right” and “wrong” thingto do, which is different from many moral values programs. Forthat matter, BAM never teaches youth not to get angry or eventhat they should never fight—because the program providers re-alize youth are growing up in difficult neighborhood environmentswhere they will be challenged and sometimes need to fight back.Providers tell youth “if you fight be sure it’s only when you haveto,” and report that while most youth wind up fighting less, somestand up to challenges more often due to BAM.
Another way to see how imperfectly existing theories seem tofully describe our programs is to note how many blank cells thereare in Table IX’s mapping between the program activities andtheories emphasized by so much of the previous research (the lastthree columns). This seems to be particularly true of the JTDCintervention. This apparent incompleteness of existing theoriesin helping us understand what the BAM and JTDC interventionsmight be doing helped motivate our new theory about a differenttype of mechanism, which we discuss below.

FIELD EXPERIMENTS TO REDUCE CRIME AND DROPOUT 37
2. Automaticity. In this section we develop our own hypoth-esis for why these programs change youth behavior: automaticity.This is essentially our theory for what the CBT components ofthese programs are doing to help change youth behavior. Our the-ory is based on previous research in psychology, which shows thatpeople often respond to situations automatically and without de-liberation (see, e.g., Kahneman 2011). These automatic responsesare often adaptive to situations that people commonly face. How-ever, problems can arise when people misconstrue their situationor deploy an inappropriate automatic response.
Consider two of the kinds of situations youth face: “schoollife” and (for lack of a better term) “street life.” In both situations,youth have to deal with assertions of authority. Teachers assertauthority in school life by asking them to sit down or be quiet.In street life, someone much larger than they are could assertauthority by demanding their money or their phone.
The adaptive response to an assertion of authority by theteacher in school is to comply. The youth should do what theteacher says. But street life is different. In places where formalsocial control is weak, it can be adaptive to develop a reputationas someone who will fight back when provoked to deter future vic-timization. For example, as (Papachristos 2009, p. 79) notes: “Oneof the street code’s most pervasive norms is that of retribution,a perversion of the ‘golden rule’ stipulating that personal attacks(verbal or physical) should be avenged. . . . Failure to act in—orwin—a given context not only diminishes one’s social standingvis-a-vis one’s opponent but also makes one appear weak, a po-tential target for future street interactions” (see also Anderson1999). Because school life and street life differ, youth have to con-sider whether the code of the street or the code of the classroomapplies to a given conflict. When the teacher asserts authority,youth have to think about whether that is a situation where it isimportant to develop a reputation as someone who will fight back,or whether the conflict does not involve a threat to reputation. Ifthey do not distinguish between these situations, then they willalways comply (and risk being terrorized on the street) or theywill always resist (and do poorly in school). Youth are often able tosuccessfully distinguish these situations, but not always. One ofthe key lessons from behavioral science is that people can miscon-strue what situation they are in and deploy the wrong automaticresponse (Griffin and Ross 1991; Nisbett and Ross 1991).

38 QUARTERLY JOURNAL OF ECONOMICS
This example illustrates our automaticity hypothesis. Auto-matic responses are effortless but not necessarily fine-tuned to aparticular situation if there is variability across similar-lookingsituations in what response is adaptive. And because the conse-quences of misconstruing the situation may be particularly severein highly violent, distressed urban areas, youth from disadvan-taged circumstances may face a high cost of getting an automaticassumption wrong.32
This explanation is intriguing because it has implications forintervention. It suggests that we may be able to improve the livesof youth in distressed urban areas simply by teaching them to beless automatic—a key component of both interventions we studyhere. Notice these interventions are not about uniformly chang-ing what the automatic responses are. Teaching youth to alwayscomply might help in school, but could lead to problems out ofschool. Instead the programs help youth learn when they shouldnot be automatic, and to identify situations (like when they feelanger) where they ought to slow down and consider whether theirinterpretations of the situation are correct and whether their au-tomatic assumptions and responses are useful.
For example, the BAM program does not tell youth that theyshould never fight but rather helps them learn to distinguish be-tween when they should versus should not fight. The programincludes a variety of exercises that teach youth how to carry outwhat CBT programs call behavioral experiments, designed to helpyouth test their beliefs or perceptions about the situation theyface. The fist exercise helps youth recognize that their assump-tions of the negative intentions of others are not always correct—there is more situational variability than they realize. The stickexercise helps youth recognize that situations with problems thatinitially look like they are driven by other people are sometimesdue to the youth’s own actions as well.
32. A similar idea in the field of linguistics refers to “code-switching” amongpeople who speak more than one language or language variety, where the languagethey use helps convey group membership in a given setting (see, e.g., Toribioand Bullock 2012). This requires speakers to devote more conscious attention toidentification of what social or linguistic setting they are in relative to what isrequired of monolingual speakers. Some evidence that this type of linguistic code-switching responds to changes in the social environment comes from Rickford et al.(2015). A sociological discussion of code-switching with respect to other behaviorsis in Anderson (1999).

FIELD EXPERIMENTS TO REDUCE CRIME AND DROPOUT 39
IV.C. Testing Mechanisms
1. Testing Existing Theories from the Literature. Table Xexplores the potential role of many commonly discussed theo-ries in explaining our observed intervention impacts. Our dataon these candidate mechanisms come from ongoing, bi-annualonline surveys conducted in all Chicago Public Schools by theConsortium on Chicago School Research (CCSR), designed to mea-sure students’ perceptions of themselves and their school environ-ments.33 We use CCSR survey data from spring 2011, the end ofthe year after the 2009–10 BAM intervention that we examinedin study 1 (CCSR did not do a spring 2010 survey). The responserate on this survey among our sample is not ideal and is a fewpercentage points higher for the treatment versus control groups(42% vs. 38%, p < .05).
The surveys capture measures relevant to several of the mostcommonly discussed theories from previous literature about non-academic determinants of life outcomes. These include social capi-tal, perceived importance of schooling for futures outcomes, socialskills or emotional intelligence, and two items from Duckworthand Quinn’s (2009) eight-item grit scale.34 However, as notedabove, measures of grit are highly correlated with self-control andconscientiousness, so we cannot disentangle the influence of thesedifferent factors.
The first column of results in Table X presents experimen-tal IV estimates of BAM participation’s effects on these different
33. The 30-minute survey is designed to address a number of questions regard-ing school culture and climate. In spring 2011, surveys were received from around146,000 students in the roughly 400,000 student school system, who respondedonline during school hours with each response registered on a Likert scale. CCSRused Rasch analysis on groups of survey items to create different aggregate mea-sures, but here for “grit” we use the average of two Likert-scale responses and forsocial capital we use a single Likert scale response. We standardized all of thesemeasures into standard deviation units based on the observed distribution withinthe control group.
34. The specific survey questions for each measure are: social capital (“I haveat least one teacher or other adult in this school I can talk to if I have a problem”);perceived returns to education (“My classes give me useful preparation for whatI plan to do in life,” “High school teaches me valuable skills,” “Working hardin high school matters for success in the work force,” and “What we learn inclass is necessary for success in the future”); social skills or emotional intelligence(“I can always find a way to help people end arguments,” “I am very good atworking with other students,” and “I am good at helping people”); and grit/self-control/conscientiousness (“I finish whatever I begin” and “I am a hard worker”).
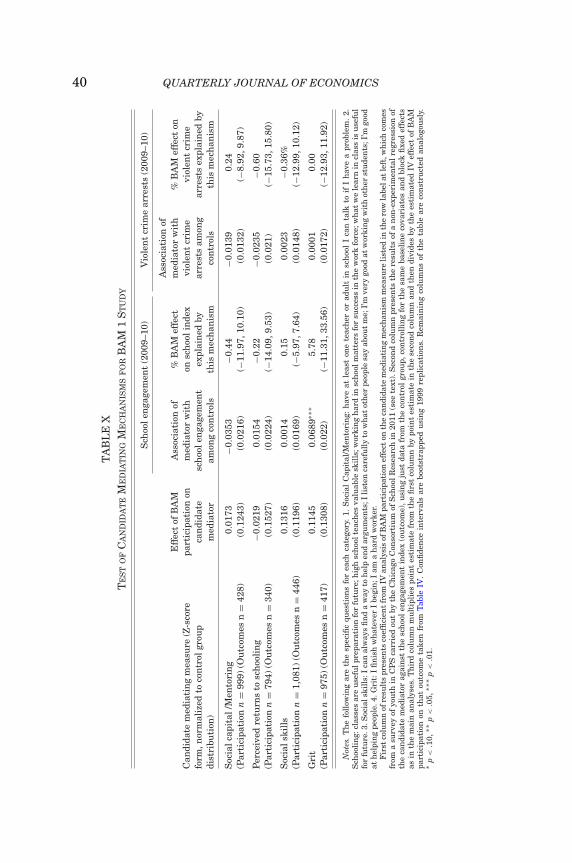
40 QUARTERLY JOURNAL OF ECONOMICS
TA
BL
EX
TE
ST
OF
CA
ND
IDA
TE
ME
DIA
TIN
GM
EC
HA
NIS
MS
FO
RB
AM
1S
TU
DY
Sch
oole
nga
gem
ent
(200
9–10
)V
iole
nt
crim
ear
rest
s(2
009–
10)
Can
dida
tem
edia
tin
gm
easu
re(Z
-sco
refo
rm,n
orm
aliz
edto
con
trol
grou
pdi
stri
buti
on)
Eff
ect
ofB
AM
part
icip
atio
non
can
dida
tem
edia
tor
Ass
ocia
tion
ofm
edia
tor
wit
hsc
hoo
len
gage
men
tam
ong
con
trol
s
%B
AM
effe
cton
sch
ooli
nde
xex
plai
ned
byth
ism
ech
anis
m
Ass
ocia
tion
ofm
edia
tor
wit
hvi
olen
tcr
ime
arre
sts
amon
gco
ntr
ols
%B
AM
effe
cton
viol
ent
crim
ear
rest
sex
plai
ned
byth
ism
ech
anis
m
Soc
ialc
apit
al/M
ento
rin
g0.
0173
−0.0
353
−0.4
4−0
.013
90.
24(P
arti
cipa
tion
n=
999)
(Ou
tcom
esn
=42
8)(0
.124
3)(0
.021
6)(−
11.9
7,10
.10)
(0.0
132)
(−8.
92,9
.87)
Per
ceiv
edre
turn
sto
sch
ooli
ng
−0.0
219
0.01
54−0
.22
−0.0
235
−0.6
0(P
arti
cipa
tion
n=
794)
(Ou
tcom
esn
=34
0)(0
.152
7)(0
.022
4)(−
14.0
9,9.
53)
(0.0
21)
(−15
.73,
15.8
0)
Soc
ials
kill
s0.
1316
0.00
140.
150.
0023
−0.3
6%(P
arti
cipa
tion
n=
1,08
1)(O
utc
omes
n=
446)
(0.1
196)
(0.0
169)
(−5.
97,7
.64)
(0.0
148)
(−12
.99,
10.1
2)
Gri
t0.
1145
0.06
89∗∗
∗5.
780.
0001
0.00
(Par
tici
pati
onn
=97
5)(O
utc
omes
n=
417)
(0.1
308)
(0.0
22)
(−11
.31,
33.5
6)(0
.017
2)(−
12.9
3,11
.92)
Not
es.
Th
efo
llow
ing
are
the
spec
ific
ques
tion
sfo
rea
chca
tego
ry.
1.S
ocia
lC
apit
al/M
ento
rin
g:h
ave
atle
ast
one
teac
her
orad
ult
insc
hoo
lI
can
talk
toif
Ih
ave
apr
oble
m.
2.S
choo
lin
g:cl
asse
sar
eu
sefu
lpre
para
tion
for
futu
re;h
igh
sch
oolt
each
esva
luab
lesk
ills
;wor
kin
gh
ard
insc
hoo
lmat
ters
for
succ
ess
inth
ew
ork
forc
e;w
hat
we
lear
nin
clas
sis
use
ful
for
futu
re.3
.Soc
ials
kill
s:I
can
alw
ays
fin
da
way
toh
elp
end
argu
men
ts;I
list
enca
refu
lly
tow
hat
oth
erpe
ople
say
abou
tm
e;I’
mve
rygo
odat
wor
kin
gw
ith
oth
erst
ude
nts
;I’m
good
ath
elpi
ng
peop
le.4
.Gri
t:I
fin
ish
wh
atev
erI
begi
n;I
ama
har
dw
orke
r.F
irst
colu
mn
ofre
sult
spr
esen
tsco
effi
cien
tfr
omIV
anal
ysis
ofB
AM
part
icip
atio
nef
fect
onth
eca
ndi
date
med
iati
ng
mec
han
ism
mea
sure
list
edin
the
row
labe
lat
left
,wh
ich
com
esfr
oma
surv
eyof
you
thin
CP
Sca
rrie
dou
tby
the
Ch
icag
oC
onso
rtiu
mof
Sch
oolR
esea
rch
in20
11(s
eete
xt).
Sec
ond
colu
mn
pres
ents
the
resu
lts
ofa
non
-exp
erim
enta
lreg
ress
ion
ofth
eca
ndi
date
med
iato
rag
ain
stth
esc
hoo
len
gage
men
tin
dex
(ou
tcom
e),u
sin
gju
stda
tafr
omth
eco
ntr
olgr
oup,
con
trol
lin
gfo
rth
esa
me
base
lin
eco
vari
ates
and
bloc
kfi
xed
effe
cts
asin
the
mai
nan
alys
es.T
hir
dco
lum
nm
ult
ipli
espo
int
esti
mat
efr
omth
efi
rst
colu
mn
bypo
int
esti
mat
ein
the
seco
nd
colu
mn
and
then
divi
des
byth
ees
tim
ated
IVef
fect
ofB
AM
part
icip
atio
non
that
outc
ome
take
nfr
omT
able
IV.
Con
fide
nce
inte
rval
sar
ebo
otst
rapp
edu
sin
g19
99re
plic
atio
ns.
Rem
ain
ing
colu
mn
sof
the
tabl
ear
eco
nst
ruct
edan
alog
ousl
y.∗
p<
.10,
∗∗p
<.0
5,∗∗
∗p
<.0
1.

FIELD EXPERIMENTS TO REDUCE CRIME AND DROPOUT 41
candidate mechanisms of action (M), given by π6 in equation (6).
(5) Pist = Zisπ5 + Xis(t−1)β5 + γs + εist5,
(6) Mist = Pistπ6 + Xis(t−1)β6 + γs + εist6.
The second column reports the coefficients from using datajust from the control group to run a non-experimental regressionof one of our outcomes, Y (the school engagement index measuredat the end of AY 2009–10) against each candidate mediator M inturn, controlling for the standard set of baseline covariates andschool fixed effects included in all previous models.
(7) Yist = Mistπ7 + Xis(t−1)β7 + γs + εist7 for all (i) with Zis = 0.
The third column reports the share of the total BAM partic-ipation effect on the schooling outcome that could be explainedby each candidate mechanism, which comes from multiplyingthe (experimentally estimated) BAM → M link reported in col-umn 1 (π6) by the (nonexperimentally estimated) M → Y link incolumn 2 (π7), and then dividing by the (experimentally esti-mated) BAM participation effect on the schooling outcome, BAM→ Y from Table IV (π3). We obtain confidence intervals by boot-strapping. We draw 1999 samples with replacement, estimateeach of our three key parameters, calculate the value (π6×π7)
π3and
then report the 2.5th and 97.5th percentiles of the distributionfrom these bootstrap replications.35 The last two columns of thetable repeat this exercise for our measure of violent-crime arrests,while results for additional outcomes are in Online AppendixTables A.22 and A.23.
The results presented in Table X suggest that these commonlydiscussed mechanisms are unlikely to explain much of the BAMimpact on behavior reported in study 1. BAM participation hasthe largest effects on our measures of social skills and grit, witheffect sizes of 0.13 and 0.11 std. dev. respectively, but neither isquite statistically significant. None of these estimates are very
35. We report percentiles of the distribution rather than the standard devia-tion of the distribution because our estimates of π3 can be close to zero in somereplications, which can cause the ratio of parameters to be very large in somecases. The percentile-based confidence interval is less susceptible to the influenceof a small number of replications like this.

42 QUARTERLY JOURNAL OF ECONOMICS
large, however, in the sense that at most a small share of theBAM → Y effect could be explained by the BAM → M → Y chainfor each candidate mechanism in Table X.
One might wonder about the strength of our measures forM: the nonexperimental associations between the mediators andoutcomes (M → Y) are modest in size, despite a growing litera-ture arguing for the importance of such skills. It is always pos-sible that these survey measures do not adequately capture thekey underlying constructs. Yet, in some cases we are using essen-tially the exact same measures that others have argued capturekey determinants of youth outcomes. For example, our grit mea-sure consists of two of the eight items in Duckworth and Quinn’s(2009) short grit scale. Using data from Cook et al. (2015), weregress our two-item grit measure against the eight-item grit scalefrom Duckworth and Quinn. The regression coefficient is 1.02 (thecorrelation is 0.74), suggesting our measure is very similar totheirs.36
Moreover, the sizes of the M → Y associations in Table X aresimilar to those reported in many other papers. The raw corre-lation in our study 1 sample between grit and GPA in 2010–11(one element of our schooling-outcomes index) equals about 0.20,versus 0.30 in Duckworth and Quinn’s (2009) analysis of a morediverse sample of youth (Table 7, p. 170). The modest relation-ship of social capital to outcomes in our sample of minority malesis consistent with the mixed treatment effects found in previousstudies of Big Brothers/Big Sisters mentoring.37
It is not obvious whether remaining measurement problemswould lead our estimates to overstate or understate the impor-tance of these mechanisms for explaining program impacts inour sample. On one hand, equation (7) is estimated using non-experimental (within-control-group) variation. The mechanism
36. CCSR also provides a four-item grit scale that includes two other items thatare not in the Duckworth and Quinn short grit scale; our results are qualitativelysimilar using that index.
37. The closest measure to violent-crime arrests in the RCT of BB/BS deliveredoutside of school (Grossman and Tierney 1998) is “number of times hit someone,”which showed no detectable effect in their sample of N = 326 minority males(the significant impact for the overall sample is driven entirely by white males).Nor did they find a detectable impact on academic outcomes for minority males(Table 7). A study of BB/BS delivered within (rather than outside of) school foundsmall impacts on school outcomes after 9 months, with no detectable impacts onout-of-school problem behaviors, and no significant impacts on any outcome after15 months (Herrera et al. 2011).

FIELD EXPERIMENTS TO REDUCE CRIME AND DROPOUT 43
measures are presumably correlated with other determinants ofyouth outcomes, leading to omitted variables bias in the directionof overstating the importance of these candidate mechanisms. Onthe other hand, classical measurement error would lead us tounderstate the impact of the mechanism. If we reproduce ourestimates averaging together social skills and grit to reduce mea-surement error, our conclusions are similar. Even if we inflatedour estimates to account for measurement error and ignore omit-ted variables bias, these mechanisms seem unlikely to account formuch of the BAM effect on outcomes.
2. Testing the Automaticity Hypothesis. Finally, we presentthe results of testing our automaticity hypothesis, which suggestthis mechanism may be an important determinant of BAM’s im-pacts on youth outcomes.38 From the sample of youth randomizedto BAM versus control in 2013–14 (study 2), we recruited 490 par-ticipants (266 who had been assigned to BAM, 224 assigned tocontrol) from nine schools in which 1551 youth (775 treatment,776 control) were eligible to participate. One reason for nonpar-ticipation was that many youth in study 2 never showed up atthe school CPS thought they would attend; the response rate foryouth attending study schools was 44%.
To examine how BAM changes decision making in confronta-tional situations where youth are provoked and retaliation is apossibility, and specifically whether BAM causes youth to “slowdown,” we had participants play a modified version of a real-stakesiterated dictator game. Students were informed during lunch peri-ods that a brief study would be conducted giving them the chanceto earn about $10. Because parental consent was required, con-sent forms were handed out and made available in the schoolseveral days before we began conducting the studies. Studentscould return the consent forms anytime during the duration ofthe study (approximately three weeks in each school). Studentswho returned consent forms could participate during their lunchperiod. Studies were conducted in available quiet spaces in theschools, such as hallways and empty classrooms. Youth were toldthat they would be playing with a “partner” who was anotherstudent in their school for multiple rounds (they were not toldhow many rounds). Participants were led through the study bya research assistant (RA) who was blinded to youth treatment
38. This experimental design was adapted from VanderMeer et al. (2015).

44 QUARTERLY JOURNAL OF ECONOMICS
status. RAs told participants that they would be communicatingover walkie-talkie with another RA who was standing with their“partner.” However, there was no partner; the other RA was actu-ally a confederate who followed a script.
Experimental economists normally, and understandably, seekto avoid use of deception in experiments. But the design of ourexperiment had to account for the context: public high schoolslocated in some of Chicago’s highest-crime areas. In discussionswith the CPS Research Review Board (RRB) one overarching con-cern was that we not contribute to antagonism between students,which might be easy to create. If we carried out the iterated dicta-tor game task with two actual students playing against each otherand taking money from each other, there would be the risk thatnot only would students ask their peers about who might haveparticipated in the study with them (“Who came out of the lunchroom with me?”), they might also brag about having taken moneyfrom fellow students (with those youth at the highest risk of vi-olence perhaps being the ones most eager to “prove something”).The first risk could have been mitigated with modifications to thedesign, but the second risk would have been difficult to mitigate.Given the RRB’s human subjects concerns, we decided with someregret that deception was necessary.
In the first round, participants were given $10 in $1 bills inan envelope. Their “partner” was given the chance to take somemoney away from the participant. The participants heard the con-federate say over the walkie-talkie that the “partner” was taking$6 from the participant. The participant was then asked how muchmoney they would like to take from their partner. (So for partici-pating in the decision-making exercise each participant received$4 from the first round plus whatever they took in the secondround.)
We expected that participants who had previously been as-signed to BAM would make slower, more deliberate decisions thanparticipants who had been assigned to the control conditions. Wewere also interested in testing whether actively trying to reduceautomaticity during the decision-making exercise itself could at-tenuate the BAM-control difference in decision making. So werandomized participants to four different versions of the task:
• A “no delay” condition, in which youth could say how muchthey wanted to take from their partner as soon as theywished after the partner’s take amount was announced.

FIELD EXPERIMENTS TO REDUCE CRIME AND DROPOUT 45
• A “distraction” condition, which was intended to get allyouth (including controls) to do part of what we believeBAM gets youth to initiate on their own—which is to slowdown. In this condition, after round 1 the participants weretold to first spend 30 seconds completing a word-searchpuzzle and to then state how much money they wished totake.
• A “reflection” condition, where they were told to first take30 seconds to rate their partner’s action on a scale from−5 (extremely selfish) to +5 (extremely generous) beforedeciding how much to take from the partner.
• A “rumination” condition that got youth to slow down butthen, instead of reflecting and taking a different perspec-tive on the event, they were given an exercise intended topromote unhelpful thinking (rumination). Specifically theywere told to take 30 seconds to read over a list of adjectivesand to circle the ones that represented their feelings inthat moment, with the word list including terms like rude,unfriendly, mean, and unkind.
Our automaticity hypothesis implies that under all condi-tions, BAM should get youth to slow down on their own and re-flect on what their optimal response would be. We should seethis most clearly in condition 1 (“no delay”). We expected to seea smaller BAM-control difference when we externally inducedboth groups to slow down (as in condition 2), and a still smallerdifference when we induced youth in both groups to both slowdown and reflect on the nature of their partner’s decision (as incondition 3). We also expected condition 4 to attenuate the BAM-control difference by prompting both groups to ruminate on howthey feel, which may divert the BAM youth from the tendency toreflect on the situation.
Unfortunately, randomization across conditions did not workquite as well as we had hoped, yielding some imbalance in base-line attributes. But within conditions there was baseline balancefor BAM versus control. So we can learn about the role of the con-ditions from the difference-in-difference (how outcomes for BAMversus control differed across conditions).
Table XI shows that BAM did indeed get youth to slow downbefore they made a decision. We had the RAs who were working

46 QUARTERLY JOURNAL OF ECONOMICS
TABLE XIEFFECT OF BAM PARTICIPATION ON DECISION-MAKING TIME AND RETALIATION IN
ITERATED DICTATOR GAME, BAM STUDY 2
Log time to makedecisions (seconds) Take amount ($)
Controlcomplier
mean
Effect ofBAM par-ticipation
Controlcomplier
mean
Effect ofBAM par-ticipation
All conditions pooled 0.969 0.3264∗∗ 7.080 0.2191(n = 490) (0.1338) (0.2209)
Condition 1 1.102 0.5955∗∗ 7.140 −0.3590No delay (n = 117) (0.2608) (0.4351)
Condition 2 0.860 0.1076 6.738 0.8866∗∗Delay (n = 126) (0.2239) (0.4099)
Condition 3 0.999 0.2063 7.034 0.2904Delay plus reflection(n = 120)
(0.2447) (0.4763)
Condition 4 0.669 0.3121 7.459 −0.0866Delay plus rumination(n = 127)
(0.2335) (0.4319)
Notes. Table presents results from administering iterated dictator game to subsample of youth in BAMstudy 2. Sample sizes listed for retaliation decision (take amount); decision time was measured for all youthin condition 1 but just for sub-sample of youth in conditions 2–4. Sample sizes for those conditions are 60,63, and 62, respectively. Baseline covariates and randomization block fixed effects included in all models.Heteroscedasticity-robust standard errors in parentheses. ∗ p < .10, ∗∗ p < .05, ∗∗∗ p < .01.
with participants subtly time how long it took youth to respond.39
The RAs were instructed to begin the timer immediately afterasking the participant how much of the $10 they would like totake from their partner and to stop the timer immediately afterthey declared an amount. The variable is very skewed, so we re-port results for the log of the time it took youth to respond (Online
39. The RAs had stopwatches that measured time to the hundredth of a secondand were asked in the data logs to write down all the digits that were displayed.RAs said to the participant, “Now, we’re giving the other player a new $10. Howmuch of that would you like to take?” The RA was instructed to start the stopwatchimmediately after they said the word “take?” and stop timing as soon as therespondent reported their preferred take amount. We have time data for 302 ofthe 493 total youth who participated in our decision-making exercise becauseduring the first phase of our field work the RAs were only timing youth who wererandomized to condition 1.

FIELD EXPERIMENTS TO REDUCE CRIME AND DROPOUT 47
Appendix Figure A.5 shows the full distributions for the treat-ment and control groups; Online Appendix Table A.25 presentsadditional results). The second row shows that in condition 1(where our automaticity theory makes a clean prediction thatBAM should generate more “slowing down” versus controls) theaverage control complier took 1.1 seconds to decide. The coeffi-cient on BAM in our log-linear specification is 0.60, which impliesa statistically significant increase of roughly 80% in the time thatyouth took to decide.
If our automaticity theory is correct, and CBT causes partici-pants to slow down their thinking and be more reflective, then inconditions 2–4 (which try to even out the difference in those ten-dencies between BAM and control groups) we should see smallerBAM effects on response times compared to what we see in thefirst condition. In fact, that is what we find—the effect of BAMwas about half as large in conditions 2–4 as in condition 1. Theother rows of the table show that by prompting all youth to dowhat we believe BAM gets youth to do on their own (slow downand reflect), the distraction, reflection, and even rumination con-ditions succeeded in narrowing the BAM-control difference in thetendency to slow down and be less automatic when deciding byhow much to retaliate.
One potential concern is the possibility that these results aresomehow an artifact of response rates that are substantially lessthan 100%, but in Online Appendix Figure A.6 we show that theschool-specific BAM effect on response times was not systemati-cally related to school-specific participation rates in our decision-making exercise (i.e., the effect was not driven by schools withparticularly low response rates or smaller in schools with higherresponse rates).
In addition, Figure II provides suggestive evidence that theschools and grades (randomization blocks) where BAM participa-tion was the highest may also be those where BAM had the largestbehavioral impacts and caused the most slowing down. We use in-teractions of treatment assignment with randomization block asinstruments to estimate the relationship between number of BAMsessions attended (“dose”) on total arrests, as in Panel a, and inPanel b on automaticity, or slowing down (see Kling, Liebman, andKatz 2007). While the estimates are somewhat imprecise, the fig-ure suggests that the schools and grades where treatment-groupyouth participated in the most BAM sessions are the same ones in

48 QUARTERLY JOURNAL OF ECONOMICS
FIGURE II
Treatment Effect on Arrests and Automaticity (Decision-Making Time) Study 2
Points in the graph are treatment and control group means for each ran-domization block, after subtracting off block mean (see Kling, Liebman, and Katz2007). Line in each graph is the partial regression plot fitted from an IV modelthat uses the interaction of treatment and randomization blocks as instrumentsfor number of BAM sessions attended. The size of each point is proportional to thenumber of observations in that cell.
which we saw the largest increase in slowing down and reductionin criminal behavior.
How much of the total BAM effect might be explained by auto-maticity? We can assess this as we did with the other mechanisms

FIELD EXPERIMENTS TO REDUCE CRIME AND DROPOUT 49
above, by calculating (π6×π7)π3
.40 Table XI reports that the program’seffect on the mechanism (π6) is 0.33. The coefficient on log decisiontime in a non-experimental regression using total arrests as theoutcome (with data only from our control group, controlling forblock fixed effects, baseline covariates, and decision-making con-dition), or π7, is −0.17 (with a 95% confidence interval of −0.37 to0.03). With an overall BAM effect on total arrests in year two of thestudy period equal to −0.17 (π3), our estimates suggest reducedautomaticity could account for a decline in arrests of ( 0.33×−0.17
−0.17 ),or about one third of the total effect, with a 95% confidence inter-val that allows for this mechanism to account for up to the entireBAM effect on arrests. This is much larger than any of the othercandidate mechanisms considered in Table X.
Our automaticity theory does not make any clear predictionabout whether BAM youth should actually retaliate less than con-trols in this iterated dictator game. BAM never tells youth notto fight or retaliate when provoked, since the program recognizesthat in the neighborhoods where these youth are growing up thereare indeed circumstances in which fighting and an aggressive re-sponse may be (unfortunately) necessary and adaptive. The focusof the program instead is to get youth to slow down and reflect onwhat sort of response is most adaptive for the circumstance theyare facing. Our sample thought they were playing with others intheir school and that they would play multiple rounds; it may wellbe they thought retaliation was adaptive.
Consistent with this focus of the program, Table XI shows thatwe found no evidence that BAM reduces the retaliation amount.Moreover the point estimates are generally much smaller as ashare of the CCMs compared to what we see for the estimatedBAM effect on the degree to which youth slow-down in theirdecision-making. And to the degree to which there are any statis-tically significant relationships, they are in the direction of BAMparticipants, if anything, perhaps retaliating more than controls(in condition 2). This finding would also seem to argue against anyexplanation for why BAM works that emphasizes a more general
40. The exercise here is slightly different due to the timing of our measure-ments. In study 1 we measured the mechanism at the end of the year after theprogram ended; in study 2 we measured the mechanism concurrent with the pro-gram (from April to October 2014, which spans part of each of the first and secondyear of BAM study 2 programming).

50 QUARTERLY JOURNAL OF ECONOMICS
or noncontingent shift toward more pro-social or “self-controlled”behavior.
V. CONCLUSION
This article presents results from three large-scale RCTs inChicago with economically disadvantaged male youth. While theexact sets of outcomes and patterns of results are not totally iden-tical across all three studies, each shows sizable behavioral re-sponses to fairly short-duration interventions that among otherthings get youth to slow down and behave less automatically inhigh-stakes situations. We also present some evidence suggestingthat reduced automaticity may be a key mechanism behind theseresults.
Our results tell us something about the effects of these spe-cific interventions and also raise the possibility that automaticitymight be an important explanation for elevated rates of dropoutand crime in distressed urban areas. Youth from such areas maynot be responding to the need for reduced automaticity demandedin their neighborhoods by (sufficiently) reducing automaticity ontheir own. It is possible that they would develop reduced auto-maticity as a natural by-product of aging, and that the interven-tions we study simply accelerate this process, or it could be thatyouth would never develop reduced automaticity absent the in-tervention. Our study cannot answer that question, but it is animportant one for future research.
As with all randomized experiments, there is always somequestion about the degree to which these impacts generalize toother samples and settings. Because each of our three studieswas carried out with large numbers of disadvantaged male youthfrom distressed areas of Chicago, they are closer to what medi-cal researchers call “effectiveness trials” (testing interventions atscale) than to “efficacy trials” of a model (or “hothouse”) program.Each intervention is manualized and so in principle can be scaledup further, although further research is needed to determine howmuch social context, particular staff qualities, or other factors thatmight be specific to these study settings matter.
The ratios of benefits to costs from these interventions alsoseem to be favorable for scaling up. The costs of these inter-ventions are modest; our best administrative cost estimates are$1,100 and $1,850 per participant per year in study 1 and 2,

FIELD EXPERIMENTS TO REDUCE CRIME AND DROPOUT 51
respectively, and about $60 per juvenile detention spell in study3 (all in 2010 dollars).41 We focus on calculating benefits for BAMstudy 1, where we have the most complete (and long-term) dataon outcomes. Online Appendix Table A.26 reports a range of IVestimates for the effects of BAM participation using the sum ofthe social costs of crime during the program year as the dependentvariable. The results imply benefit-cost ratios that range from 5-to-1 up to 30-to-1, depending on how we monetize the societalcosts of crime and what measure we use for program participa-tion. If the improvements in participants’ high school gradua-tion lead to other future benefits such as increased earnings orlonger life expectancies, these estimates may understate the fullvalue of the program’s social benefits (see Online Appendix C,Section V for more detailed discussion).
Traditionally, social policy interventions for youth have triedto improve outcomes by investing (often substantial) resources inimproving the academic or vocational skills of young people orchanging the long-term benefits or costs associated with crime orschooling, with impacts that have typically been quite limited. Bycomparison, the rate of return to investing in helping youth makebetter judgments and decisions in high-stakes moments seemspromising.
UNIVERSITY OF PENNSYLVANIA
UNIVERSITY OF CHICAGO
NORTHWESTERN UNIVERSITY AND NBERUNIVERSITY OF CHICAGO AND NBERHARVARD UNIVERSITY AND NBERUNIVERSITY OF CHICAGO
SUPPLEMENTARY MATERIAL
An Online Appendix for this article can be found at The Quar-terly Journal of Economics online.
41. The difference in the cost per youth for BAM in study 1 and study 2 isdriven by Youth Guidance’s efforts to provide additional training and supervisionof counselors to help with implementation fidelity. The JTDC curriculum is muchcheaper because the building, youth, and staff are already there; the only program-specific costs are for staff training and a small increase in salaries from hiringbetter educated staff (see Online Appendix B).

52 QUARTERLY JOURNAL OF ECONOMICS
REFERENCES
Aizer, Anna, and Joseph J. Doyle, “Juvenile Incarceration and Adult Outcomes:Evidence from Randomly Assigned Judgest,” Quarterly Journal of Economics,130 (2015), 759–803.
Allensworth, Elaine Marie, and John Q. Easton, The On-Track Indicator as aPredictor of High School Graduation (Chicago: Consortium on Chicago SchoolResearch, University of Chicago, 2005).
Anderson, Elijah, Code of the Street (New York: Norton, 1999).Anderson, Michael L., “Multiple Inference and Gender Differences in the Effects
of Early Intervention: A Reevaluation of the Abecedarian, Perry Preschool,and Early Training Projects,” Journal of the American Statistical Association,103 (2008), 1481–1495.
Angrist, Joshua D., Guido W. Imbens, and Donald B. Rubin, “Identification ofCausal Effects Using Instrumental Variables,” Journal of the American Sta-tistical Association, 91 (1996), 444–455.
Beck, Judith S., Cognitive Therapy: Basics and Beyond (New York: Guilford, 2011).Benjamini, Yoav, and Yosef Hochberg, “Controlling the False Discovery Rate: A
Practical and Powerful Approach to Multiple Testing,” Journal of the RoyalStatistical Society, Series B, Methodological, 57 (1995), 289–300.
Benjamini, Yoav, Abba M. Krieger, and Daniel Yekutieli, “Adaptive Linear Step-up Procedures That Control the False Discovery Rate,” Biometrika, 93 (2006),491–507.
Blattman, Christopher, Julian C. Jamison, and Margaret Sheridan, “ReducingCrime and Violence: Experimental Evidence on Adult Noncognitive Invest-ments in Liberia,” American Economic Review (forthcoming).
Bloom, Howard S., “Accounting for No-Shows in Experimental Evaluation De-signs,” Evaluation Review, 8 (1984), 225–246.
Coleman, James S., “Social Capital in the Creation of Human Capital,” AmericanJournal of Sociology, 94 (1988), S95–S120.
Cook, Philip J., Kenneth Dodge, George Farkas, Roland G. Fryer, JonathanGuryan, Jens Ludwig, and Susan Mayer, “Not Too Late: Improving AcademicOutcomes for Disadvantaged Youth,” Working Paper Series, NorthwesternUniversity Institute for Policy Research, 2015.
Cunningham, Tom, “Hierarchical Aggregation of Information and Decision-Making,” Unpublished Manuscript, Columbia University, 2015.
Deming, David J., “The Growing Importance of Social Skills in the Labor Market,”NBER Working Paper No. 21473, 2015.
Doe v. Cook County, No. 99 C 3945 (N.D. Ill.), 2007.Duckworth, Angela L., Christopher Peterson, Michael D. Matthews, and Dennis
R. Kelly, “Grit: Perseverance and Passion for Long-Term Goals,” Journal ofPersonality and Social Psychology, 92 (2007), 1087–1101.
Duckworth, Angela L., and Patrick D. Quinn, “Development and Validation ofthe Short Grit Scale (Grit–S),” Journal of Personality Assessment, 91 (2009),166–174.
Duckworth, Angela L., and Martin E. P. Seligman, “Self-Discipline Outdoes IQ inPredicting Academic Performance of Adolescents,” Psychological Science, 16(2005), 939–944.
Ellis, Albert, “Outcome of Employing Three Techniques of Psychotherapy,” Journalof Clinical Psychology, 13 (1957), 344–350.
Ellis, Albert, and Robert A. Harper, A New Guide to Rational Living (Upper SaddleRiver, NJ: Prentice Hall, 1975).
Fudenberg, Drew, and David K. Levine, “A Dual-Self Model of Impulse Control,”American Economic Review, 96 (2006), 1449–1476.
Griffin, Dale W., and Lee Ross, “Subjective Construal, Social Inference, and HumanMisunderstanding,” Advances in Experimental Social Psychology, 24 (1991),319–359.

FIELD EXPERIMENTS TO REDUCE CRIME AND DROPOUT 53
Grossman, Jean Baldwin, and Joseph P. Tierney, “Does Mentoring Work? An Im-pact Study of the Big Brothers Big Sisters Program,” Evaluation Review, 22(1998), 403–426.
Heckman, James J., and Tim Kautz, “Fostering and Measuring Skills: Interven-tions That Improve Character and Cognition,” NBER Working Paper No.19656, 2013.
Heller, Sara, Harold A. Pollack, Roseanna Ander, and Jens Ludwig, “PreventingYouth Violence and Dropout: A Randomized Field Experiment,” NBER Work-ing Paper No. 19014, 2013.
Herrera, Carla, Jean Baldwin Grossman, Tina J. Kauh, and Jennifer McMaken,“Mentoring in Schools: An Impact Study of Big Brothers Big Sisters SchoolBased Mentoring,” Child Development, 82 (2011), 346–361.
Jensen, Robert, “The (Perceived) Returns to Education and the Demand for School-ing,” Quarterly Journal of Economics, 125 (2010), 515–548.
Kahneman, Daniel, Thinking, Fast and Slow (London: Macmillan, 2011).Katz, Lawrence F., Jeffrey R. Kling, and Jeffrey B. Liebman, “Moving to Opportu-
nity in Boston: Early Results of a Randomized Mobility Experiment,” Quar-terly Journal of Economics, 116 (2001), 607–654.
Kling, Jeffrey R., Jeffrey B. Liebman, and Lawrence F. Katz, “Experimental Anal-ysis of Neighborhood Effects,” Econometrica, 75 (2007), 83–119.
Manski, Charles F., “Dynamic Choice in Social Settings: Learning from the Expe-riences of Others,” Journal of Econometrics, 58 (1993), 121–136.
Maultsby, Maxie C., Jr., Help Yourself to Happiness through Rational Self-Counseling (New York: Institute for Rational-Emotive Therapy, 1975).
———, Coping Better, Anytime, Anywhere: The Handbook of Rational Self-Counseling (Alexandria, VA: RBT Center, 1990).
Moffitt, Terrie E., Louise Arseneault, Daniel Belsky, Nigel Dickson, Robert J. Han-cox, HonaLee Harrington, Renate Houts, Richie Poulton, Brent W. Roberts,and Stephen Ross,“A Gradient of Childhood Self-Control Predicts Health,Wealth, and Public Safety,” Proceedings of the National Academy of Sciences,108 (2011), 2693–2698.
Nisbett, Richard E., and Lee Ross, The Person and the Situation (New York:McGraw-Hill, 1991).
Papachristos, Andrew V., “Murder by Structure: Dominance Relations and the So-cial Structure of Gang Homicide,” American Journal of Sociology, 115 (2009),74–128.
Rickford, John R., Greg J. Duncan, Lisa A. Gennetian, Ray Yun Gou, RebeccaGreene, Lawrence F. Katz, Ronald C. Kessler, Jeffrey R. Kling, Lisa Sanbon-matsu, Andres E. Sanchez-Ordonez, Matthew Sciandra, Ewart Thomas, andJens Ludwig, “Neighborhood Effects on Use of African-American VernacularEnglish,” Proceedings of the National Academy of Sciences, 112 (2015), 11817–11822.
Ross, Lee, and Richard E. Nisbett, The Person and the Situation: Perspectives ofSocial Psychology (London: Pinter & Martin, 2011).
Rush, Augustus J., Aaron T. Beck, Maria Kovacs, and Steven Hollon, “Compara-tive Efficacy of Cognitive Therapy and Pharmacotherapy in the Treatment ofDepressed Outpatients,” Cognitive Therapy and Research, 1 (1977), 17–37.
Seroczynski, A. D., William N. Evans, Amy D. Jobst, Luke Horvath, and GiulianaCarozza, “Reading for Life and Adolescent Re-Arrest: Evaluating a UniqueJuvenile Diversion Program,” in 2015 Fall Conference: The Golden Age ofEvidence-Based Policy (Miami: APPAM, 2015).
Toribio, Almeida Jacqueline, and Barbara E. Bullock, The Cambridge Handbook ofLinguistic Code-Switching (Cambridge: Cambridge University Press, 2012).
Tough, Paul, How Children Succeed (New York: Random House, 2013).VanderMeer, James, Christine Hosey, Nicholas Epley, and Boaz Keysar, “Striking
Back with a Heavier Hand: Reflexive Escalation in Negative Reciprocity,”Unpublished Manuscript, University of Chicago, 2015.

54 QUARTERLY JOURNAL OF ECONOMICS
Westfall, Peter H., and Stanley S. Young, Resampling-Based Multiple Testing:Examples and Methods for P-Value Adjustment (New York: John Wiley andSons, 1993).
Wilson, William Julius, The Truly Disadvantaged: The Inner City, the Underclass,and Public Policy (Chicago: University of Chicago Press, 1987).
Young, Alwyn, “Channeling Fisher: Randomization Tests and the Statistical In-significance of Seemingly Significant Experimental Results,” Working Paper,London School of Economics, 2015.