Embed Size (px)
Citation preview
Child Development, September/October 2001, Volume 72, Number 5, Pages 1347–1366
The Relations of Early Television Viewing to School Readiness and Vocabulary of Children from Low-Income Families:
The Early Window Project
John C. Wright, Aletha C. Huston, Kimberlee C. Murphy, Michelle St. Peters, Marites Piñon, Ronda Scantlin, and Jennifer Kotler
For two cohorts of children from low- to moderate-income families, time-use diaries of television viewing werecollected over 3 years (from ages 2–5 and 4–7 years, respectively), and tests of reading, math, receptive vocab-ulary, and school readiness were administered annually. Relations between viewing and performance weretested in path analyses with controls for home environment quality and primary language (English or Spanish).Viewing child-audience informative programs between ages 2 and 3 predicted high subsequent performanceon all four measures of academic skills. For both cohorts, frequent viewers of general-audience programs per-formed more poorly on subsequent tests than did infrequent viewers of such programs. Children’s skills alsopredicted later viewing, supporting a bidirectional model. Children with good skills at age 5 selected morechild-audience informative programs and fewer cartoons in their early elementary years. Children with lowerskills at age 3 shifted to viewing more general-audience programs by ages 4 and 5. The results affirm the con-clusion that the relations of television viewed to early academic skills depend primarily on the content of theprograms viewed.
INTRODUCTION
Television viewing is consistently blamed for a myr-iad of social and developmental problems, includingpoor school achievement. These sweeping condem-nations ignore the obvious fact that television con-tains an enormous variety of forms and content; itsimpacts on children’s development probably dependon the content and the degree to which programs aredesigned to convey that content effectively to devel-oping audiences. Educational programming has be-come a regular, if small, part of broadcast offerings. Itis widely assumed that children learn cognitive andsocial skills from such programs, but the evidencesupporting these beliefs is somewhat scattered.
The purpose of the 3-year longitudinal study de-scribed in this article was to investigate the relationsbetween young children’s television viewing experi-ences and their performance on tests of school readinessand vocabulary. The sample consisted of childrenfrom families with low-to-moderate incomes becausesuch families use television extensively (Huston &Wright, 1997) and because many educational pro-grams (e.g.,
Sesame Street
) are targeted at them. As aresult, they may experience both the positive andnegative effects of television more than do childrenfrom higher income families. We approached thistopic with two core assumptions. First, different typesof television programs can have correspondingly dif-ferent relations to children’s intellectual development.Second, such relations are probably reciprocal. Chil-
dren’s intellectual skills may be affected by viewing,and their acquired skills may affect subsequent view-ing choices.
Relations of Television Viewing to Achievement
Most investigations of television and school achieve-ment have been conducted with school-age children,and most have not distinguished among differenttypes of program content. Correlational studies showa small but consistent negative relation between con-current total television viewing and various indices ofschool achievement (e.g., language, cognitive skills),even with controls for confounding variables (Com-stock, 1995). A meta-analysis of 23 studies found thatthe average correlation of total viewing with schoolachievement was
�
.05; the overall relationship wascurvilinear, with students who watched about 10 hr aweek performing best in school (Williams, Haertel,Walberg, & Haertel, 1982).
In two longitudinal investigations, by contrast, fewrelations between viewing and later achievementwere found once appropriate confounding variableswere controlled. Children in the National Health Ex-amination were assessed twice (between ages 6 and11 and again between ages 12 and 16 years). Althoughtotal time watching television in each age range wasnegatively associated with performance on achieve-
© 2001 by the Society for Research in Child Development, Inc.All rights reserved. 0009-3920/2001/7205-0005
1348 Child Development
ment tests in adolescence, the relation dropped to zerowhen controls for grade-school test performance, re-gion, and family characteristics were included (Gort-maker, Salter, Walker, & Dietz, 1990). A study follow-ing three panels of children over 3 years (grades 1–3,3–5, and 6–8) showed temporal patterns that sup-ported the hypothesis that total television viewingcontributed to lowered reading skill over time amongthe oldest cohort of children studied (Ritchie, Price, &Roberts, 1987).
Some negative effects of total television viewing onreading acquisition in the early years were suggestedin a natural experiment in British Columbia. A cross-sectional comparison of towns that did and did notreceive television and an examination of changes afterthe introduction of television produced evidence ofweak negative effects of television viewing on read-ing skills in Grades 2 and 3. No effects were observedfor Grade 8 children (Corteen & Williams, 1986).
The relation between watching television and schoolachievement may vary for children living in differentenvironments and from different cultural contexts. Inone investigation, reading achievement was associ-ated with low viewing for children from high SESfamilies, but with high viewing for children from lowSES families (Searls, Mead, & Ward, 1985). Amongstudents with limited English proficiency, the amountof television viewed was positively associated withachievement in a large survey of California students(Comstock, 1991). Viewing may interfere with schoolachievement among more advantaged children, but itmay contribute to knowledge or language ability forless advantaged children, possibly because of the dif-ferences in alternative opportunities for learning thatare available in their homes and neighborhoods. Themixed results concerning the relations of televisionviewing and school performance may stem in partfrom the failure to consider the content of the programsviewed and from the wide range of ages included.
Relations of Television Content to Achievement
Educational programming for young children isbased on a straightforward assumption that well-designed television can convey academic and socialskills to viewers. Most of the research evaluating theimpact of educational programming on language andschool-related skills has been conducted with
SesameStreet.
It is a very popular program, and it emphasizeslinguistic and academic skills more than do mostother educational programs (Neapolitan & Huston,1994). During the first 2 years after its inception, multi-site field experiments were conducted to determineits effects on preacademic skills. Children whose par-
ents were encouraged by researchers to have themwatch
Sesame Street
improved more than a nonencour-aged control group on such academic and cognitiveskills as letter recognition, numerical skills, and clas-sification (Ball & Bogatz, 1970; Bogatz & Ball, 1971).Similarly, a summative evaluation of
The Electric Com-pany
showed that viewing the program at home fos-tered improved reading performance among childrenin Grades 1 through 4 (Ball & Bogatz, 1973). Surveyinformation collected in the 1990s indicated that
Ses-ame Street
viewers had better school-related skills inkindergarten than did nonviewers, but the data werebased on parent reports (Zill, Davies, & Daly, 1994).
Longitudinal methods have also been used to ex-amine the relations between viewing and languagedevelopment and school achievement. In one investi-gation, viewing
Sesame Street
between ages 3 and 5 pre-dicted improvements in receptive vocabulary at age 5(Rice, Huston, Truglio, & Wright, 1990). There wasalso a tendency for children who watched informa-tive programs designed for children and adults toperform better on letter recognition and reading skills(Truglio, Huston, & Wright, 1986). When these samechildren were studied as adolescents, preschool view-ers of child-audience informative programs had highergrades in high school than did nonviewers, even withcontrols for family characteristics (Anderson, Hus-ton, Schmitt, Linebarger, & Wright, 2001). Rosengrenand Windahl (1989) found that Swedish preschoolerswho watched programs specifically designed forthem had higher school test performance in Grade 1,which in turn predicted higher marks in Grade 6, com-pared with preschoolers who viewed other programs.
By contrast, viewing general-entertainment con-tent tends to be associated with lower achievement.Among Swedish preschoolers, watching fiction pro-grams in preschool predicted poor school marks atGrades 1 and 6 (Rosengren & Windahl, 1989). Theseinvestigators proposed that early viewing of pre-school educational programs starts a positive cyclepredicting viewing of informational programs andhigher grades, while early viewing of fiction starts anegative cycle predicting more fiction consumptionand lower grades.
In a longitudinal study of preschool and earlyschool-age children in the United States, exposure toadult entertainment television predicted poor letterrecognition at age 5, but was unrelated to later read-ing comprehension (Truglio et al., 1986). There was norelation between viewing cartoons or adult entertain-ment programs and vocabulary (Rice et al., 1990), butone 3-year longitudinal study in the Netherlandsshowed that viewing entertainment programmingwas negatively related to subsequent reading com-
Wright et al. 1349
prehension. There was a positive, although nonsignif-icant, effect for watching informational programs(Koolstra, van der Voort, & van der Kamp, 1997).Cross-sectional studies have shown that viewingsports, cartoons, and music videos predicted low schoolperformance (Neuman, 1988; Potter, 1987; Smyser,1981), but students who watched news performedbetter in school than nonviewers (Potter, 1987).
Taken together, these studies paint a picture suggest-ing positive effects of informative programming andsmall, but consistent negative effects of viewing enter-tainment programs on reading and academic achieve-ment. Nonetheless, there are gaps in our knowledge.Few investigations included careful separation oftelevision content or intended audiences. The earlyexperimental studies of
Sesame Street
were criticizedbecause the treatment included parental encourage-ment; hence, it was not clear that positive resultswould have ensued from viewing without adult in-tervention. In particular, the critics raised questionsabout the value of the program for children from eco-nomically disadvantaged families (Cook et al., 1975).Few investigations of entertainment programs in-clude preschool children, even though it could be ar-gued that television may be a more critical influencein the early years when children are not receivingmuch formal school instruction than it is after theyenter formal schooling.
Finally, if television does affect children’s intellec-tual development, little is known about the processesinvolved. Observational learning is one likely mecha-nism by which children learn the planned messagesin educational programs as well as the unplannedmessages in many other types of programming. Pro-grams such as
Sesame Street
and
Mister Rogers’ Neigh-borhood
have planned, age-specific curricula, and theycontain linguistic and production techniques designedto enhance learning (Huston & Wright, 1994; Rice,1984). Learning from television may also contributeto a reciprocal process through which children selecttheir television and play environments to furtherthe interests and motives acquired from television(Bandura, 1978). Long-term effects may come aboutas a result of entering school with readiness skills thatfacilitate success and teachers’ perceptions of goodschool ability (Entwisle, Alexander, & Olson, 1997;MacBeth, 1996).
Cartoons, by contrast, contain language and hu-mor that are beyond the comprehension abilities ofpreschool children (Rice, 1984), as well as high levelsof violence. According to one theory, the resulting ag-gression leads to low levels of academic performancebecause it interferes with the ability to sit still and at-tend to academic content (Huesmann & Miller, 1994).
Cartoons also have high rates of action, pacing, andvisual and auditory effects, all of which may lead toarousal and activity, which are incompatible with ac-quisition of language and academic skills (Singer,1980). There is some evidence that viewing violencein the early years predicts lowered academic perfor-mance in high school (Anderson et al., 2001).
Although the content of general-audience pro-gramming is highly variable, much of it is light enter-tainment that is not designed to convey educationalmessages. The level of vocabulary and required back-ground knowledge is, for the most part, not gearedtoward young children. Two processes have beenproposed to account for predicted negative influencesof entertainment television, including cartoons, on in-tellectual development: television displaces other, morevaluable ways to spend time and general-audiencetelevision does not engage the child’s intellectual effort.
According to the displacement hypothesis, televisionviewing displaces more intellectually valuable activ-ity, resulting in lowered levels of language and intel-lectual functioning. In another analysis of the datareported in this article, we examined displacementprocesses by analyzing differences among individualsin time allocation as well as individual changes overtime in relation to changes in the time spent in otheractivities. Both analyses provided support for the hy-pothesis that general-audience programming dis-places educational activities (including reading), socialinteraction, and video game play (Huston, Wright,Marquis, & Green, 1999; Wright & Huston, 1995).
For young children, in particular, general-audienceprogramming may displace or interfere with thechild’s opportunity to interact with adults. Childrenusually view general-audience programs in the com-pany of parents or other adults (St. Peters, Fitch, Huston,Wright, & Eakins, 1991). Adults watching televisionmay be unresponsive and inattentive to the child. As aresult, children may have fewer social and linguistic in-teractions with adults while deriving little from the tele-vision content that is occupying the adults’ attention.
The second hypothesis is that entertainment tele-vision does not engage the child’s mental effort. Themost common version of this hypothesis is that enter-tainment television makes few intellectual demandsand, as a result, creates habits of intellectual lazinessand disinterest in school (Koolstra & van der Voort,1996; Salomon, 1984). Some support for this hypothesisappeared in a longitudinal study of second- througheighth-grade Dutch children, which found that televi-sion viewing was associated with a subsequent de-crease in positive attitudes toward reading. Attitudestoward reading, in turn, predicted reading achievementand time spent reading (Koolstra & van der Voort, 1996).
1350 Child Development
But, for very young children, much of general-audience television may be difficult rather than easyto comprehend. Children are most likely to becomeactively engaged with television content that is nei-ther too easy nor too difficult to comprehend, thatis, content that provides some challenge, but also al-lows an attentive child to gain a sense of mastery(Rice, Huston, & Wright, 1982; Wright & Vlietstra, 1975).A child who spends a lot of time in the presence oftelevision that is not comprehensible may miss suchopportunities.
Methodological Issues
For the most part, correlational methods, both cross-sectional and longitudinal, are the only viable designsfor studying the relations of television viewing to ac-ademic and intellectual development, because trueexperiments are virtually impossible to mount. Al-though longitudinal methods provide some basis forinferring causal direction, two issues of interpretationare important. First, it is likely that correlations ofviewing with child outcomes may result from bidirec-tional or reciprocal effects; viewing may influenceacademic performance, and academic skills may in-fluence choices about television viewing. Analyses oflongitudinal data rarely have been designed to detectthese bidirectional patterns. Second, correlations ofviewing and achievement may be a function of otherfactors. The most well-established influences on bothviewing and achievement include a host of demo-graphic and family characteristics (e.g., education,income, and ethnic group), all of which probably rep-resent variations in children’s home environments(Clarke & Kurtz-Costes, 1997; Huston & Wright, 1997;Truglio, Murphy, Oppenheimer, Huston, & Wright,1996). Such characteristics can be statistically con-trolled, but it is always possible that unmeasuredvariables account for all or part of the associationsobserved.
Many studies are fraught with problems of mea-suring television viewing accurately. Viewing measuressometimes consist of one or a few questions with du-bious validity asking individuals how much timethey spend watching television. Written or oral view-ing diaries are far more accurate (Anderson, Field,Collins, Lorch, & Nathan, 1985), but few studies haveused them.
Purposes of the Present Study
The major purpose of the present study was to in-vestigate the relations of television viewing to school-related skills and receptive language development
during the preschool and early school years. Wechose to study an ethnically diverse sample repre-senting families with low to moderate incomes be-cause these groups have been underrepresented inmuch developmental research and because televisionmay play an especially important role in their lives.The study represents an advance over earlier longitu-dinal investigations because it began at age 2 to cap-ture very early viewing experience and because thehome environment was measured directly ratherthan relying solely on demographic indicators of fam-ily characteristics. Television viewing was assessed asit occurred naturally, thereby avoiding the problemscreated by “encouragement to view.” Finally, multi-ple 24-hour diaries of children’s time use in all activi-ties (not just television) were used to obtain viewinginformation across time and to provide specific infor-mation about programs watched, and other catego-ries of time use.
METHOD
Design
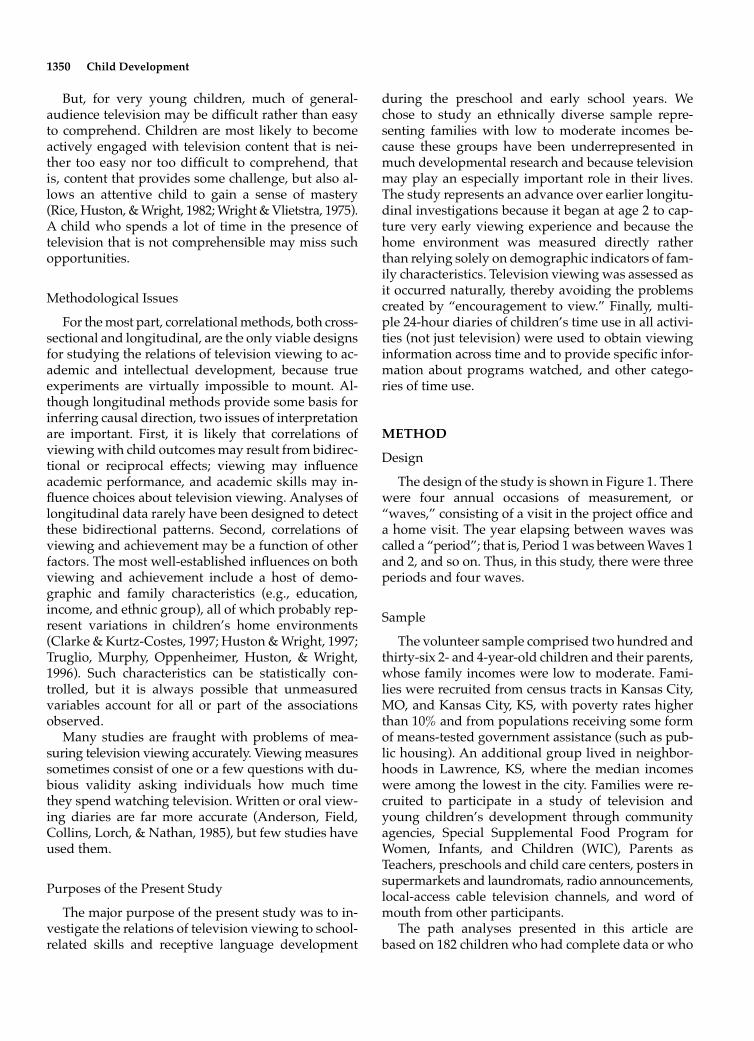
The design of the study is shown in Figure 1. Therewere four annual occasions of measurement, or“waves,” consisting of a visit in the project office anda home visit. The year elapsing between waves wascalled a “period”; that is, Period 1 was between Waves 1and 2, and so on. Thus, in this study, there were threeperiods and four waves.
Sample
The volunteer sample comprised two hundred andthirty-six 2- and 4-year-old children and their parents,whose family incomes were low to moderate. Fami-lies were recruited from census tracts in Kansas City,MO, and Kansas City, KS, with poverty rates higherthan 10% and from populations receiving some formof means-tested government assistance (such as pub-lic housing). An additional group lived in neighbor-hoods in Lawrence, KS, where the median incomeswere among the lowest in the city. Families were re-cruited to participate in a study of television andyoung children’s development through communityagencies, Special Supplemental Food Program forWomen, Infants, and Children (WIC), Parents asTeachers, preschools and child care centers, posters insupermarkets and laundromats, radio announcements,local-access cable television channels, and word ofmouth from other participants.
The path analyses presented in this article arebased on 182 children who had complete data or who
Wright et al. 1351
were missing only one test score, one assessment pe-riod, or one viewing period over the 3-year time span.These missing data were imputed by regressingscores for a particular wave or period on scores forthe same measure in the other waves or periods,using the sample for the cohort in which the child be-longed. Overall, 2.1% of the scores for the younger co-hort and 1.5% of the scores for the older cohort wereimputed values.
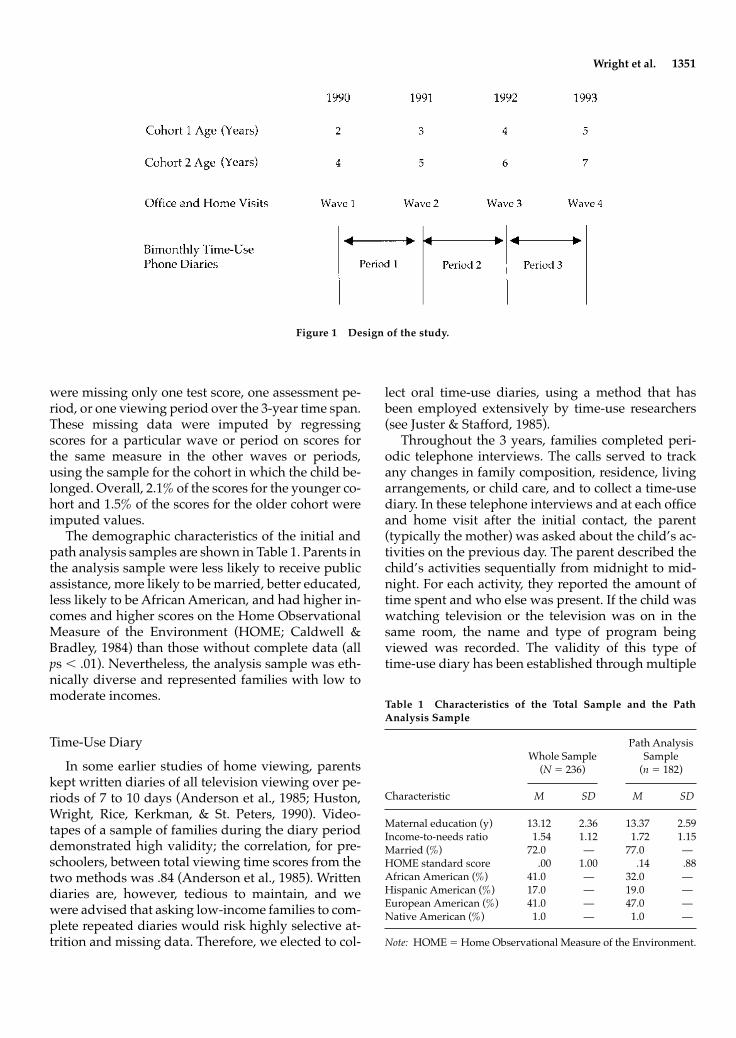
The demographic characteristics of the initial andpath analysis samples are shown in Table 1. Parents inthe analysis sample were less likely to receive publicassistance, more likely to be married, better educated,less likely to be African American, and had higher in-comes and higher scores on the Home ObservationalMeasure of the Environment (HOME; Caldwell &Bradley, 1984) than those without complete data (all
p
s
�
.01). Nevertheless, the analysis sample was eth-nically diverse and represented families with low tomoderate incomes.
Time-Use Diary
In some earlier studies of home viewing, parentskept written diaries of all television viewing over pe-riods of 7 to 10 days (Anderson et al., 1985; Huston,Wright, Rice, Kerkman, & St. Peters, 1990). Video-tapes of a sample of families during the diary perioddemonstrated high validity; the correlation, for pre-schoolers, between total viewing time scores from thetwo methods was .84 (Anderson et al., 1985). Writtendiaries are, however, tedious to maintain, and wewere advised that asking low-income families to com-plete repeated diaries would risk highly selective at-trition and missing data. Therefore, we elected to col-
lect oral time-use diaries, using a method that hasbeen employed extensively by time-use researchers(see Juster & Stafford, 1985).
Throughout the 3 years, families completed peri-odic telephone interviews. The calls served to trackany changes in family composition, residence, livingarrangements, or child care, and to collect a time-usediary. In these telephone interviews and at each officeand home visit after the initial contact, the parent(typically the mother) was asked about the child’s ac-tivities on the previous day. The parent described thechild’s activities sequentially from midnight to mid-night. For each activity, they reported the amount oftime spent and who else was present. If the child waswatching television or the television was on in thesame room, the name and type of program beingviewed was recorded. The validity of this type oftime-use diary has been established through multiple
Figure 1 Design of the study.
Table 1 Characteristics of the Total Sample and the PathAnalysis Sample
Characteristic
Whole Sample(
N
�
236)
Path AnalysisSample
(
n
�
182)
M SD M SD
Maternal education (y) 13.12 2.36 13.37 2.59Income-to-needs ratio 1.54 1.12 1.72 1.15Married (%) 72.0 — 77.0 —HOME standard score .00 1.00 .14 .88African American (%) 41.0 — 32.0 —Hispanic American (%) 17.0 — 19.0 —European American (%) 41.0 — 47.0 —Native American (%) 1.0 — 1.0 —
Note:
HOME
�
Home Observational Measure of the Environment.
1352 Child Development
informants (e.g., husband and wife) and multiple meth-ods (e.g., written and phone) (Juster & Stafford, 1985).This method has an added advantage over most mea-sures of television use; the person is reporting on allactivities rather than focusing solely on television. Inaddition, the report is recent and quite specific intime. Our goal was to obtain six diaries per year—one about every 2 months. In the early stages of thestudy, however, we had more difficulty reaching peopleand completing calls than expected, so staff time de-voted to calling was increased in the later stages of thestudy, resulting in a higher rate of completed calls.The average number of 24-hr diaries per child was 3.3in Period 1, 4.4 in Period 2, and 5.1 in Period 3.
The first activity named in a time interval was con-sidered the primary activity. If the child was simulta-neously doing something else, that activity was des-ignated “secondary.” For example, if the parent saidthe child was playing and also watching television, thenplay was recorded as primary, and television viewingas secondary. If the child was “watching televisionwhile she ate lunch,” then eating was the secondaryactivity. If children spent part or all of the day awayfrom the parent (e.g., in child care), the adult in chargewas also called to get time-use information for thatportion of the day.
Classification of Programs Viewed
All programs viewed were first classified by the in-tended audience (made for children or for general-adult audiences); child programs were further groupedby content type using a system developed from ear-lier studies (Center for Research on the Influences ofTelevision on Children, 1983). Four categories of pro-grams resulted: (1) child-audience, informative or ed-ucational programs (regardless of animation); (2)child-audience, fully animated cartoons with no in-formative purpose; (3) child-audience, other pro-grams (neither fully animated nor informative pur-pose); and (4) general-audience programs. Reliabilityaveraged 92% agreement, calculated by comparingcodes assigned by two or more independent raterswho were familiar with the program.
The average number of minutes of viewing wascalculated for each of the four categories of programs:child-audience informative, child-audience cartoons,child-audience other, and general audience. Viewingon weekdays and weekends was calculated sepa-rately, because the kinds of programs offered aredifferent. For each category of child-audience pro-grams, totals included primary and secondary view-ing of live broadcasts and videotapes. For general-audience programs, primary and secondary viewing
were separated for descriptive purposes, but com-bined in the path analysis. The number of minutesspent viewing each type of program was calculatedfor each 24-hour diary. The score for a 1-year periodwas the average of all weekday or weekend diariescollected during that year up to and including the of-fice visit for the next wave.
Home and Family Characteristics
The demographic characteristics of the families(parent education, occupation, family structure, pri-mary language) were ascertained during the parentinterviews at each annual wave. At each home visit,the HOME (Caldwell & Bradley, 1984) was collected.Using observation and unstructured questions, theinterviewer awarded points for a list of observed con-ditions, facilities, responses to questions, and socialand emotional features of the mother–child interac-tion. A large number of studies show that this instru-ment predicts IQ and school performance of childrenfrom a wide range of socioeconomic backgrounds, in-come levels, and ethnic groups (Bradley et al., 1989).The version for infants (ages 0–3) was used for the 2-year-olds; the preschool version was used for chil-dren who were 3 through 5 years of age; and the ele-mentary school version was used for children 6 andover. The Wave 1 HOME score for each child was en-tered as a control in the analyses reported here. Be-cause the infant and preschool versions have differentnumbers of items, standard scores for each versionwere calculated for the sample and used in the analyses.
All home visitors during Wave 1 were trained byan expert from the University of Arkansas at LittleRock, where the instrument was devised. Interob-server reliabilities were checked periodically by havingtwo interviewers attend the same visit. One inter-viewer conducted the visit, and both scored it inde-pendently. A minimum criterion of 80% agreementwas maintained.
Academic Skills and School Readiness
Reading and number skills.
Basic academic skills areat the center of the concept of school readiness. Thesewere measured by standardized tests administeredindividually during the office visit at Waves 2, 3, and4. Two subtests from the Woodcock-Johnson Tests ofAchievement were selected. This battery was stan-dardized on a large, nationally representative samplefrom age 2 through 79 (Woodcock & Mather, 1989).Both subtests have internal consistencies greater than.90 for children in the age range of 3 through 7. Read-ing and prereading skills were assessed by the letter-
Wright et al. 1353
word recognition subtest measuring recognition oficons, letters, and words. Math skills were assessedby the applied problems subtest, which involvescounting, inequalities, and simple arithmetic.
Vocabulary.
The Peabody Picture Vocabulary Test–Revised (PPVT-R) measures receptive English vocab-ulary. It requires the child to point to one of four pic-tures on a page that illustrates or exemplifies a spokenword. The words range from simple objects to com-plex concepts. The test was standardized on an ethni-cally diverse sample ranging from age 2
½
to 70, butone in which families with low occupational statuswere somewhat underrepresented. For children ages3 through 7, internal consistencies range from .70 to.83 (Dunn & Dunn, 1981).
School readiness.
General school readiness was as-sessed by the School Readiness Scale of the BrackenBasic Concepts Scales (Bracken, 1984). The test in-cludes knowledge of colors, shapes, letters, num-bers, and spatial and size relations. The standard-ization sample for the test included children frommultiple ethnic groups. The internal consistency ofthe School Readiness Scale is at least .90 for childrenin the age range of 3 through 5, and test–retest reli-ability is .98 (Bracken, 1984). It was administeredonly to the younger cohort, because pilot testing in-dicated that many of the older cohort were likely toreach its ceiling by the third or fourth wave of datacollection.
Standard scores based on the published test normsfor the child’s chronological age were used for allfour tests. The Woodcock-Johnson and Peabody Pic-ture Vocabulary tests have standard scores based ona mean of 100 and a standard deviation of 15. TheSchool Readiness Scale scores were transformed to adistribution with a mean of 100 and a standard devi-ation of 15 in order to achieve comparability with theother tests.
Examiners
Because the sample included children from differ-ent ethnic groups, it was important to have diversityamong the examiners. The examiners representedvarious ethnic groups and nationalities, includingAfrican American, European American, FilipinoAmerican, Mexican, Spanish, Mexican American,Israeli, Iranian, and Singapore Chinese. All spokefluent English. For children from families in whichthe primary language was English, there was noeffort to match the ethnicity of the examiner withthat of parents and children, so many combinationsoccurred.
For children from Spanish-speaking families, a
fully bilingual graduate student whose first lan-guage was Spanish administered all tests. Tests thatinvolved written or spoken English (i.e., reading andvocabulary) were presented in English. Writtentranslations of the instructions for the applied prob-lems subtest and some portions of the BrackenSchool Readiness Scale were prepared by a Mexicangraduate student (whose first language was Span-ish). If the child appeared more fluent in Spanishthan in English, or if the child stated a preference forspeaking Spanish when asked, the tester was al-lowed to use these translated instructions. Althoughthis procedure ran the risk of undermining the stan-dardization of the tests, it seemed the best option tomaximize children’s comprehension of the tasks.Norms and procedures standardized on Englishspeakers cannot be assumed to apply to childrenfrom other language groups in any case, so it seemedmost reasonable to attempt to obtain optimal levelsof performance for these multilingual children. Byage 4, virtually all of the children chose to speak En-glish during the tests.
Analysis Plan
Path analyses were used to determine the relationsof viewing at Periods 1, 2, and 3 to test scores atWaves 2, 3, and 4. The ideal approach would havebeen a latent-variable, structural equation modelinganalysis, but the small sample size rendered thistechnique inappropriate. The two cohorts were ana-lyzed separately. Path analysis permitted consolida-tion of all time periods in a single analysis for eachcombination of a viewing category with a dependentvariable, and it permitted tests of paths in twodirections—from earlier viewing to later test scores,and from earlier test scores to subsequent viewing.For the younger cohort, there were 12 analyses (fourtest scores
�
three viewing categories), and for theolder cohort, who did not receive the Bracken SchoolReadiness Scale, there were 9 (three test scores
�
three viewing categories). Because viewing frequen-cies were skewed, each viewing score was trans-formed to the square root of (number of minutes
�
1)to normalize the distributions and eliminate zeroesand values less than one. EQS was used for all anal-yses (Bentler, 1995).
Because of the sample sizes, it was important tolimit the number of variables in the path analysis.Two control variables were included: the HOMEscore from Wave 1 and the primary language spokenin the home (1
�
English, 2
�
Spanish). These wereselected on the basis of initial analyses designed todetermine which of approximately 20 demographic
1354 Child Development
variables, child characteristics, family attributes, pre-school experiences, and television technologies inthe home accounted for independent portions of thevariance in both the viewing patterns and the testscores. Parent education, income-to-needs ratio, andHOME scores accounted for overlapping variance.The HOME score was selected because it is a measureof the proximal quality of the child’s environmentand because it accounted for slightly more variancein test scores than did either of the other indicators.The primary language spoken in the home wasrelated to educational viewing and somewhat lessto viewing other types of television (children inSpanish-speaking families watched more educa-tional television than did children in English-speakingfamilies) and to some test scores. Primary languagewas statistically independent of HOME scores. In anearlier, unpublished report, ordinary least squares,calculated by regressing each test score in each waveof prior viewing in each television category, werepresented (Wright & Huston, 1995). These analysesincluded multiple controls for demographic vari-ables, child characteristics, child’s initial language,family attributes, preschool experiences, and televi-sion technologies in the home. The regression ap-proach involved a large number of equations, andaccordingly path analysis was chosen as a more par-simonious approach for the present report. It is note-worthy, however, that the results obtained by the twomethods were quite similar.
RESULTS
Description of Viewing
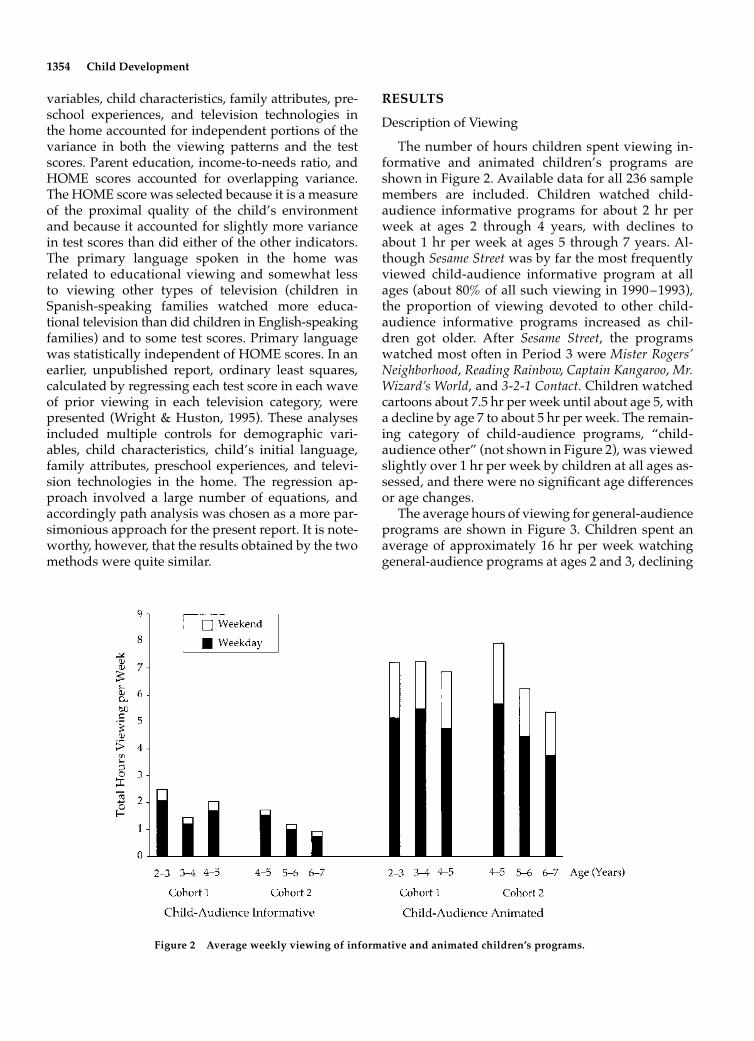
The number of hours children spent viewing in-formative and animated children’s programs areshown in Figure 2. Available data for all 236 samplemembers are included. Children watched child-audience informative programs for about 2 hr perweek at ages 2 through 4 years, with declines toabout 1 hr per week at ages 5 through 7 years. Al-though
Sesame Street
was by far the most frequentlyviewed child-audience informative program at allages (about 80% of all such viewing in 1990–1993),the proportion of viewing devoted to other child-audience informative programs increased as chil-dren got older. After
Sesame Street
, the programswatched most often in Period 3 were
Mister Rogers’Neighborhood
,
Reading Rainbow
,
Captain Kangaroo
,
Mr.Wizard’s World
, and
3-2-1 Contact.
Children watchedcartoons about 7.5 hr per week until about age 5, witha decline by age 7 to about 5 hr per week. The remain-ing category of child-audience programs, “child-audience other” (not shown in Figure 2), was viewedslightly over 1 hr per week by children at all ages as-sessed, and there were no significant age differencesor age changes.
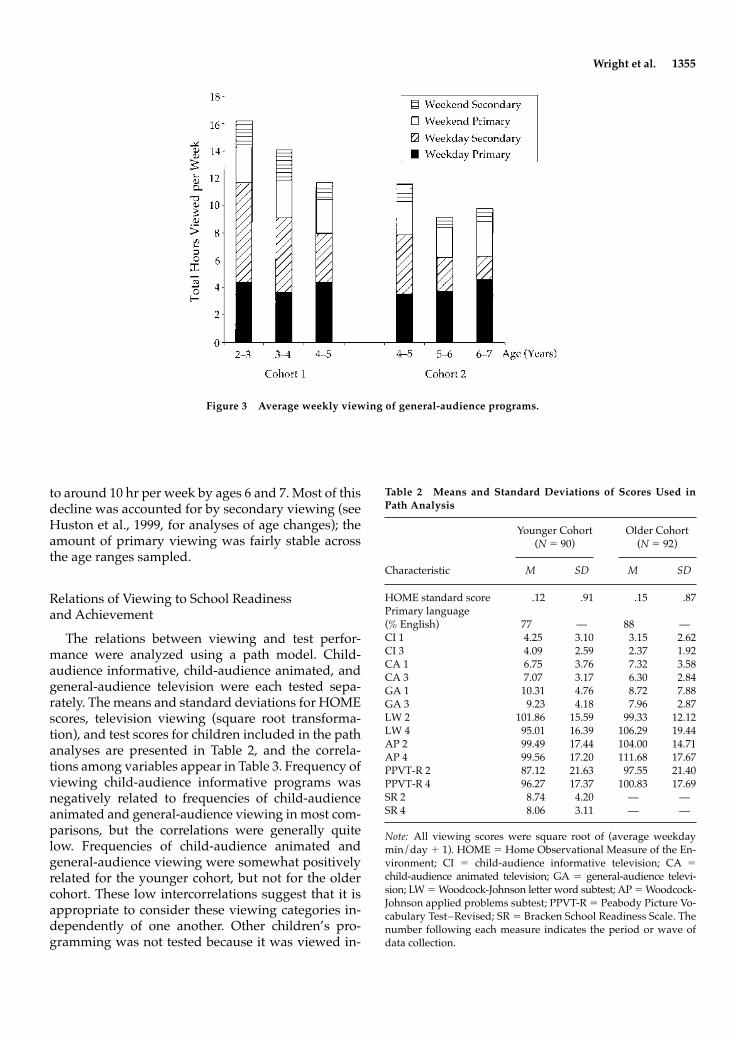
The average hours of viewing for general-audienceprograms are shown in Figure 3. Children spent anaverage of approximately 16 hr per week watchinggeneral-audience programs at ages 2 and 3, declining
Figure 2 Average weekly viewing of informative and animated children’s programs.
Wright et al. 1355
to around 10 hr per week by ages 6 and 7. Most of thisdecline was accounted for by secondary viewing (seeHuston et al., 1999, for analyses of age changes); theamount of primary viewing was fairly stable acrossthe age ranges sampled.
Relations of Viewing to School Readiness and Achievement
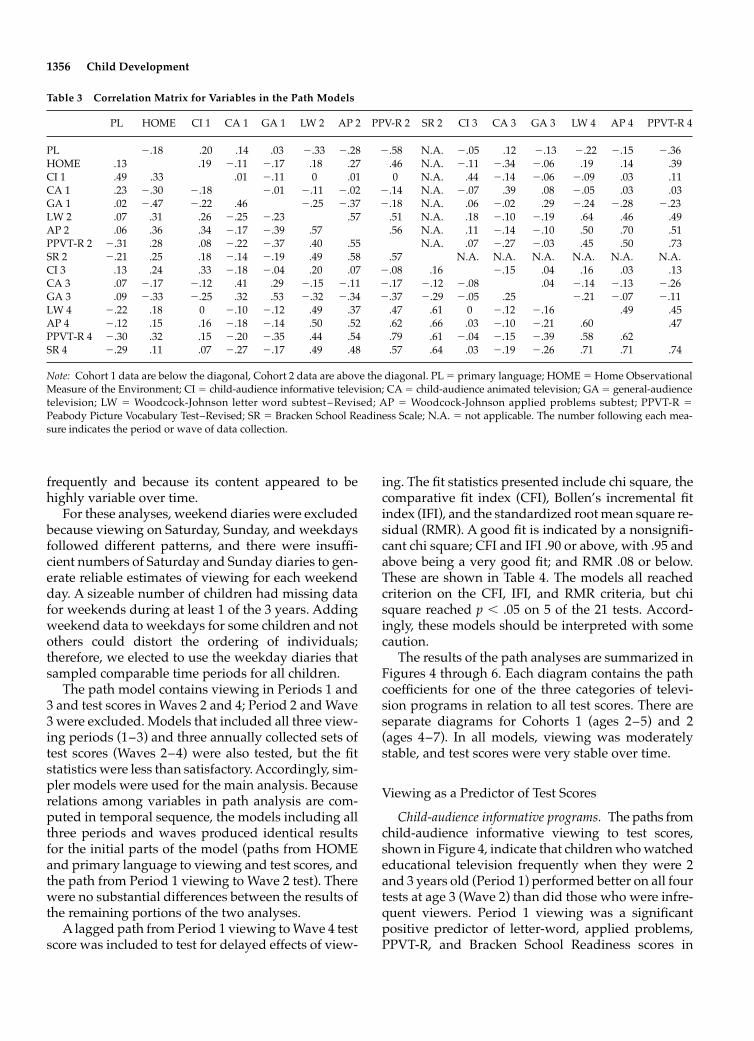
The relations between viewing and test perfor-mance were analyzed using a path model. Child-audience informative, child-audience animated, andgeneral-audience television were each tested sepa-rately. The means and standard deviations for HOMEscores, television viewing (square root transforma-tion), and test scores for children included in the pathanalyses are presented in Table 2, and the correla-tions among variables appear in Table 3. Frequency ofviewing child-audience informative programs wasnegatively related to frequencies of child-audienceanimated and general-audience viewing in most com-parisons, but the correlations were generally quitelow. Frequencies of child-audience animated andgeneral-audience viewing were somewhat positivelyrelated for the younger cohort, but not for the oldercohort. These low intercorrelations suggest that it isappropriate to consider these viewing categories in-dependently of one another. Other children’s pro-gramming was not tested because it was viewed in-
Figure 3 Average weekly viewing of general-audience programs.
Table 2 Means and Standard Deviations of Scores Used inPath Analysis
Characteristic
Younger Cohort(
N
�
90)Older Cohort
(
N
�
92)
M SD M SD
HOME standard score .12 .91 .15 .87Primary language (% English) 77 — 88 —CI 1 4.25 3.10 3.15 2.62CI 3 4.09 2.59 2.37 1.92CA 1 6.75 3.76 7.32 3.58CA 3 7.07 3.17 6.30 2.84GA 1 10.31 4.76 8.72 7.88GA 3 9.23 4.18 7.96 2.87LW 2 101.86 15.59 99.33 12.12LW 4 95.01 16.39 106.29 19.44AP 2 99.49 17.44 104.00 14.71AP 4 99.56 17.20 111.68 17.67PPVT-R 2 87.12 21.63 97.55 21.40PPVT-R 4 96.27 17.37 100.83 17.69SR 2 8.74 4.20 — —SR 4 8.06 3.11 — —
Note:
All viewing scores were square root of (average weekdaymin/day
�
1). HOME
�
Home Observational Measure of the En-vironment; CI
�
child-audience informative television; CA
�
child-audience animated television; GA
�
general-audience televi-sion; LW
�
Woodcock-Johnson letter word subtest; AP
�
Woodcock-Johnson applied problems subtest; PPVT-R
�
Peabody Picture Vo-cabulary Test–Revised; SR
�
Bracken School Readiness Scale. Thenumber following each measure indicates the period or wave ofdata collection.
1356 Child Development
frequently and because its content appeared to behighly variable over time.
For these analyses, weekend diaries were excludedbecause viewing on Saturday, Sunday, and weekdaysfollowed different patterns, and there were insuffi-cient numbers of Saturday and Sunday diaries to gen-erate reliable estimates of viewing for each weekendday. A sizeable number of children had missing datafor weekends during at least 1 of the 3 years. Addingweekend data to weekdays for some children and notothers could distort the ordering of individuals;therefore, we elected to use the weekday diaries thatsampled comparable time periods for all children.
The path model contains viewing in Periods 1 and3 and test scores in Waves 2 and 4; Period 2 and Wave3 were excluded. Models that included all three view-ing periods (1–3) and three annually collected sets oftest scores (Waves 2–4) were also tested, but the fitstatistics were less than satisfactory. Accordingly, sim-pler models were used for the main analysis. Becauserelations among variables in path analysis are com-puted in temporal sequence, the models including allthree periods and waves produced identical resultsfor the initial parts of the model (paths from HOMEand primary language to viewing and test scores, andthe path from Period 1 viewing to Wave 2 test). Therewere no substantial differences between the results ofthe remaining portions of the two analyses.
A lagged path from Period 1 viewing to Wave 4 testscore was included to test for delayed effects of view-
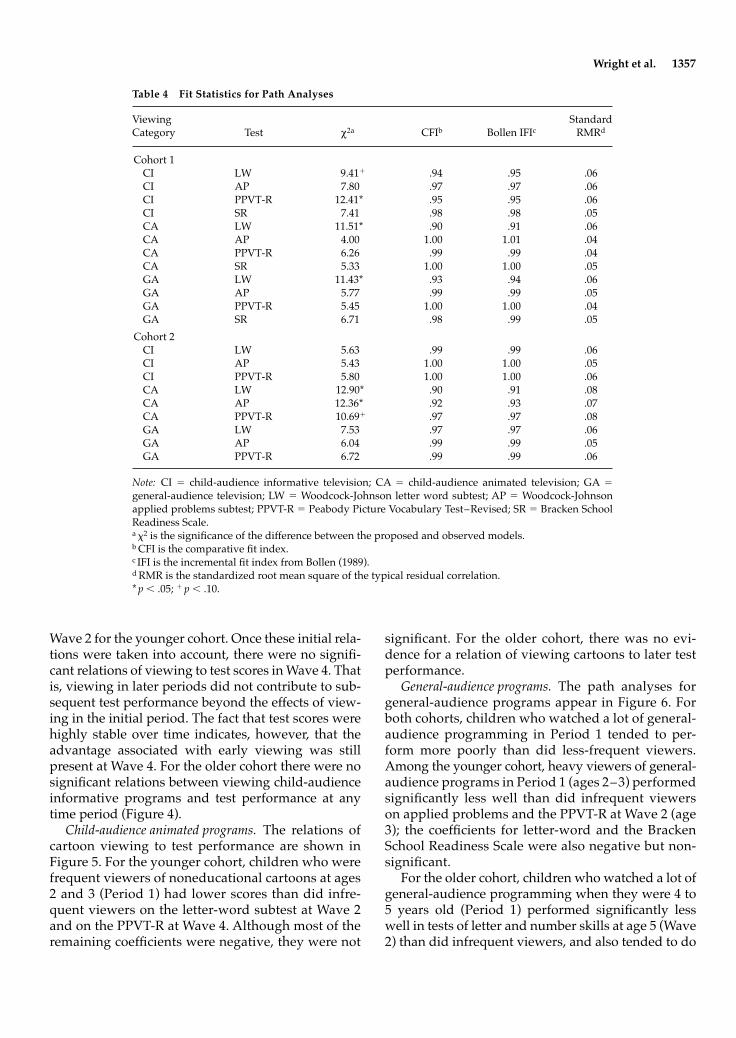
ing. The fit statistics presented include chi square, thecomparative fit index (CFI), Bollen’s incremental fitindex (IFI), and the standardized root mean square re-sidual (RMR). A good fit is indicated by a nonsignifi-cant chi square; CFI and IFI .90 or above, with .95 andabove being a very good fit; and RMR .08 or below.These are shown in Table 4. The models all reachedcriterion on the CFI, IFI, and RMR criteria, but chisquare reached
p
�
.05 on 5 of the 21 tests. Accord-ingly, these models should be interpreted with somecaution.
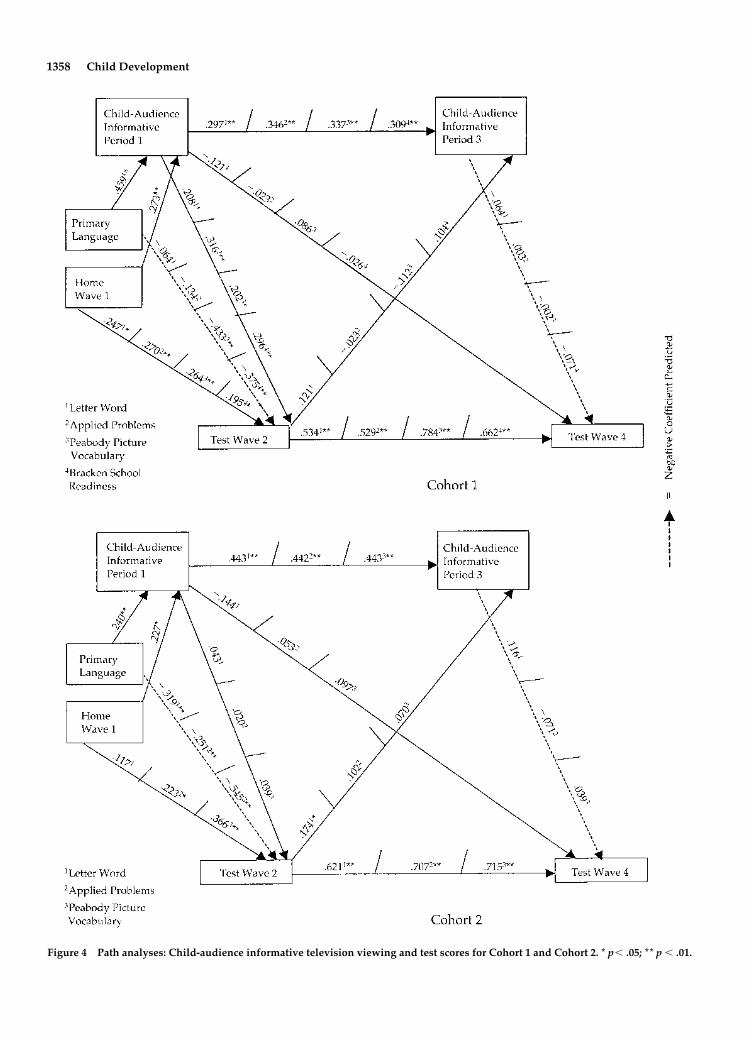
The results of the path analyses are summarized inFigures 4 through 6. Each diagram contains the pathcoefficients for one of the three categories of televi-sion programs in relation to all test scores. There areseparate diagrams for Cohorts 1 (ages 2–5) and 2(ages 4–7). In all models, viewing was moderatelystable, and test scores were very stable over time.
Viewing as a Predictor of Test Scores
Child-audience informative programs.
The paths fromchild-audience informative viewing to test scores,shown in Figure 4, indicate that children who watchededucational television frequently when they were 2and 3 years old (Period 1) performed better on all fourtests at age 3 (Wave 2) than did those who were infre-quent viewers. Period 1 viewing was a significantpositive predictor of letter-word, applied problems,PPVT-R, and Bracken School Readiness scores in
Table 3 Correlation Matrix for Variables in the Path Models
PL HOME CI 1 CA 1 GA 1 LW 2 AP 2 PPV-R 2 SR 2 CI 3 CA 3 GA 3 LW 4 AP 4 PPVT-R 4
PL
�
.18 .20 .14 .03
�
.33
�
.28
�
.58 N.A.
�
.05 .12
�
.13
�
.22
�
.15
�
.36HOME .13 .19
�
.11
�
.17 .18 .27 .46 N.A.
�
.11
�
.34
�
.06 .19 .14 .39CI 1 .49 .33 .01
�
.11 0 .01 0 N.A. .44
�
.14
�
.06
�
.09 .03 .11CA 1 .23
�
.30
�
.18
�
.01
�
.11
�
.02
�
.14 N.A.
�
.07 .39 .08
�
.05 .03 .03GA 1 .02
�
.47
�
.22 .46
�
.25
�
.37
�
.18 N.A. .06
�
.02 .29
�
.24
�
.28
�
.23LW 2 .07 .31 .26
�
.25
�
.23 .57 .51 N.A. .18
�
.10
�
.19 .64 .46 .49AP 2 .06 .36 .34
�
.17
�
.39 .57 .56 N.A. .11
�
.14
�
.10 .50 .70 .51PPVT-R 2
�
.31 .28 .08
�
.22
�
.37 .40 .55 N.A. .07
�
.27
�
.03 .45 .50 .73SR 2
�
.21 .25 .18
�
.14
�
.19 .49 .58 .57 N.A. N.A. N.A. N.A. N.A. N.A.CI 3 .13 .24 .33
�
.18
�
.04 .20 .07
�
.08 .16
�
.15 .04 .16 .03 .13CA 3 .07
�
.17
�
.12 .41 .29
�
.15
�
.11
�
.17
�
.12
�
.08 .04
�
.14
�
.13
�
.26GA 3 .09
�.33 �.25 .32 .53 �.32 �.34 �.37 �.29 �.05 .25 �.21 �.07 �.11LW 4 �.22 .18 0 �.10 �.12 .49 .37 .47 .61 0 �.12 �.16 .49 .45AP 4 �.12 .15 .16 �.18 �.14 .50 .52 .62 .66 .03 �.10 �.21 .60 .47PPVT-R 4 �.30 .32 .15 �.20 �.35 .44 .54 .79 .61 �.04 �.15 �.39 .58 .62SR 4 �.29 .11 .07 �.27 �.17 .49 .48 .57 .64 .03 �.19 �.26 .71 .71 .74
Note: Cohort 1 data are below the diagonal, Cohort 2 data are above the diagonal. PL � primary language; HOME � Home ObservationalMeasure of the Environment; CI � child-audience informative television; CA � child-audience animated television; GA � general-audiencetelevision; LW � Woodcock-Johnson letter word subtest–Revised; AP � Woodcock-Johnson applied problems subtest; PPVT-R �Peabody Picture Vocabulary Test–Revised; SR � Bracken School Readiness Scale; N.A. � not applicable. The number following each mea-sure indicates the period or wave of data collection.
Wright et al. 1357
Wave 2 for the younger cohort. Once these initial rela-tions were taken into account, there were no signifi-cant relations of viewing to test scores in Wave 4. Thatis, viewing in later periods did not contribute to sub-sequent test performance beyond the effects of view-ing in the initial period. The fact that test scores werehighly stable over time indicates, however, that theadvantage associated with early viewing was stillpresent at Wave 4. For the older cohort there were nosignificant relations between viewing child-audienceinformative programs and test performance at anytime period (Figure 4).
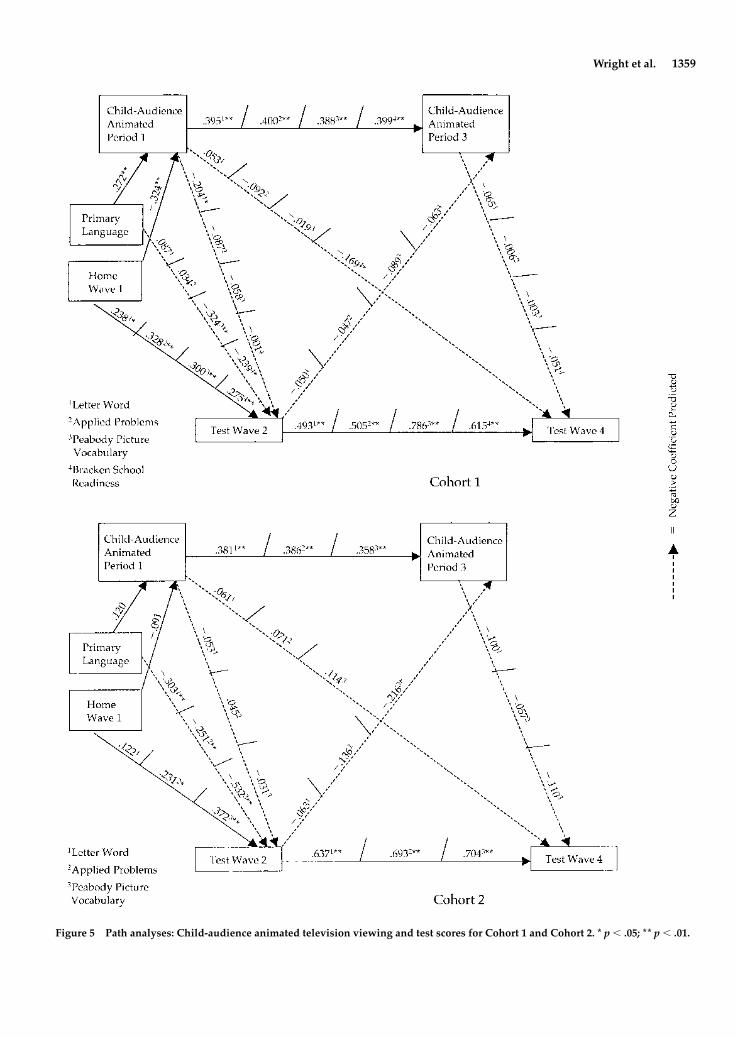
Child-audience animated programs. The relations ofcartoon viewing to test performance are shown inFigure 5. For the younger cohort, children who werefrequent viewers of noneducational cartoons at ages2 and 3 (Period 1) had lower scores than did infre-quent viewers on the letter-word subtest at Wave 2and on the PPVT-R at Wave 4. Although most of theremaining coefficients were negative, they were not
significant. For the older cohort, there was no evi-dence for a relation of viewing cartoons to later testperformance.
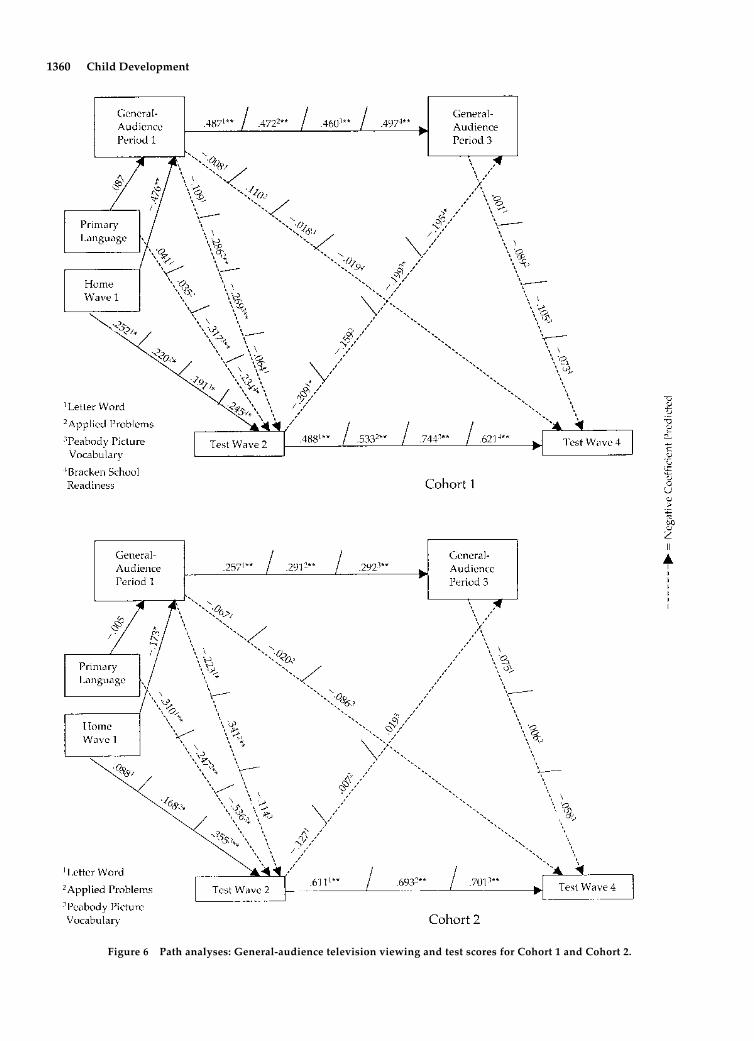
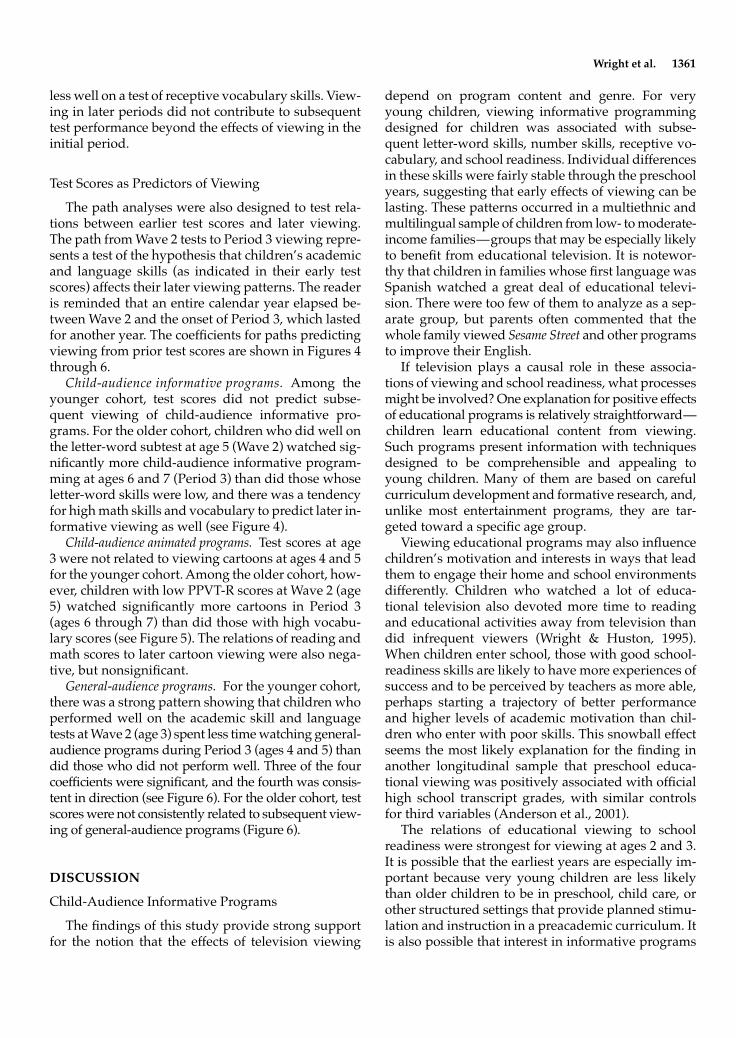
General-audience programs. The path analyses forgeneral-audience programs appear in Figure 6. Forboth cohorts, children who watched a lot of general-audience programming in Period 1 tended to per-form more poorly than did less-frequent viewers.Among the younger cohort, heavy viewers of general-audience programs in Period 1 (ages 2–3) performedsignificantly less well than did infrequent viewerson applied problems and the PPVT-R at Wave 2 (age3); the coefficients for letter-word and the BrackenSchool Readiness Scale were also negative but non-significant.
For the older cohort, children who watched a lot ofgeneral-audience programming when they were 4 to5 years old (Period 1) performed significantly lesswell in tests of letter and number skills at age 5 (Wave2) than did infrequent viewers, and also tended to do
Table 4 Fit Statistics for Path Analyses
ViewingCategory Test χ2a CFIb Bollen IFIc
StandardRMRd
Cohort 1CI LW 9.41� .94 .95 .06CI AP 7.80 .97 .97 .06CI PPVT-R 12.41* .95 .95 .06CI SR 7.41 .98 .98 .05CA LW 11.51* .90 .91 .06CA AP 4.00 1.00 1.01 .04CA PPVT-R 6.26 .99 .99 .04CA SR 5.33 1.00 1.00 .05GA LW 11.43* .93 .94 .06GA AP 5.77 .99 .99 .05GA PPVT-R 5.45 1.00 1.00 .04GA SR 6.71 .98 .99 .05
Cohort 2CI LW 5.63 .99 .99 .06CI AP 5.43 1.00 1.00 .05CI PPVT-R 5.80 1.00 1.00 .06CA LW 12.90* .90 .91 .08CA AP 12.36* .92 .93 .07CA PPVT-R 10.69� .97 .97 .08GA LW 7.53 .97 .97 .06GA AP 6.04 .99 .99 .05GA PPVT-R 6.72 .99 .99 .06
Note: CI � child-audience informative television; CA � child-audience animated television; GA �
general-audience television; LW � Woodcock-Johnson letter word subtest; AP � Woodcock-Johnsonapplied problems subtest; PPVT-R � Peabody Picture Vocabulary Test–Revised; SR � Bracken SchoolReadiness Scale.a �2 is the significance of the difference between the proposed and observed models.b CFI is the comparative fit index.c IFI is the incremental fit index from Bollen (1989).d RMR is the standardized root mean square of the typical residual correlation.* p � .05; � p � .10.
1358 Child Development
Figure 4 Path analyses: Child-audience informative television viewing and test scores for Cohort 1 and Cohort 2. * p� .05; ** p � .01.
Wright et al. 1359
Figure 5 Path analyses: Child-audience animated television viewing and test scores for Cohort 1 and Cohort 2. * p � .05; ** p � .01.
1360 Child Development
Figure 6 Path analyses: General-audience television viewing and test scores for Cohort 1 and Cohort 2.
Wright et al. 1361
less well on a test of receptive vocabulary skills. View-ing in later periods did not contribute to subsequenttest performance beyond the effects of viewing in theinitial period.
Test Scores as Predictors of Viewing
The path analyses were also designed to test rela-tions between earlier test scores and later viewing.The path from Wave 2 tests to Period 3 viewing repre-sents a test of the hypothesis that children’s academicand language skills (as indicated in their early testscores) affects their later viewing patterns. The readeris reminded that an entire calendar year elapsed be-tween Wave 2 and the onset of Period 3, which lastedfor another year. The coefficients for paths predictingviewing from prior test scores are shown in Figures 4through 6.
Child-audience informative programs. Among theyounger cohort, test scores did not predict subse-quent viewing of child-audience informative pro-grams. For the older cohort, children who did well onthe letter-word subtest at age 5 (Wave 2) watched sig-nificantly more child-audience informative program-ming at ages 6 and 7 (Period 3) than did those whoseletter-word skills were low, and there was a tendencyfor high math skills and vocabulary to predict later in-formative viewing as well (see Figure 4).
Child-audience animated programs. Test scores at age3 were not related to viewing cartoons at ages 4 and 5for the younger cohort. Among the older cohort, how-ever, children with low PPVT-R scores at Wave 2 (age5) watched significantly more cartoons in Period 3(ages 6 through 7) than did those with high vocabu-lary scores (see Figure 5). The relations of reading andmath scores to later cartoon viewing were also nega-tive, but nonsignificant.
General-audience programs. For the younger cohort,there was a strong pattern showing that children whoperformed well on the academic skill and languagetests at Wave 2 (age 3) spent less time watching general-audience programs during Period 3 (ages 4 and 5) thandid those who did not perform well. Three of the fourcoefficients were significant, and the fourth was consis-tent in direction (see Figure 6). For the older cohort, testscores were not consistently related to subsequent view-ing of general-audience programs (Figure 6).
DISCUSSION
Child-Audience Informative Programs
The findings of this study provide strong supportfor the notion that the effects of television viewing
depend on program content and genre. For veryyoung children, viewing informative programmingdesigned for children was associated with subse-quent letter-word skills, number skills, receptive vo-cabulary, and school readiness. Individual differencesin these skills were fairly stable through the preschoolyears, suggesting that early effects of viewing can belasting. These patterns occurred in a multiethnic andmultilingual sample of children from low- to moderate-income families—groups that may be especially likelyto benefit from educational television. It is notewor-thy that children in families whose first language wasSpanish watched a great deal of educational televi-sion. There were too few of them to analyze as a sep-arate group, but parents often commented that thewhole family viewed Sesame Street and other programsto improve their English.
If television plays a causal role in these associa-tions of viewing and school readiness, what processesmight be involved? One explanation for positive effectsof educational programs is relatively straightforward—children learn educational content from viewing.Such programs present information with techniquesdesigned to be comprehensible and appealing toyoung children. Many of them are based on carefulcurriculum development and formative research, and,unlike most entertainment programs, they are tar-geted toward a specific age group.
Viewing educational programs may also influencechildren’s motivation and interests in ways that leadthem to engage their home and school environmentsdifferently. Children who watched a lot of educa-tional television also devoted more time to readingand educational activities away from television thandid infrequent viewers (Wright & Huston, 1995).When children enter school, those with good school-readiness skills are likely to have more experiences ofsuccess and to be perceived by teachers as more able,perhaps starting a trajectory of better performanceand higher levels of academic motivation than chil-dren who enter with poor skills. This snowball effectseems the most likely explanation for the finding inanother longitudinal sample that preschool educa-tional viewing was positively associated with officialhigh school transcript grades, with similar controlsfor third variables (Anderson et al., 2001).
The relations of educational viewing to schoolreadiness were strongest for viewing at ages 2 and 3.It is possible that the earliest years are especially im-portant because very young children are less likelythan older children to be in preschool, child care, orother structured settings that provide planned stimu-lation and instruction in a preacademic curriculum. Itis also possible that interest in informative programs

1362 Child Development
declines during the preschool and early school years.Certainly, viewing time devoted to informative pro-grams drops with age. Both the drop in viewing andthe absence of effects for school-age children, how-ever, may be due to the lack of age-appropriate edu-cational programs, particularly in the early 1990swhen these data were collected, rather than to devel-opmental change in interest in informative televi-sion per se. Moreover, we measured only one categoryof outcomes—academic skills. Children of differentages may learn a wide range of information about sci-ence, society, and the social world from educationalprograms.
Early viewing may also have lasting effects, inpart, because it influences subsequent viewingchoices indirectly. Children’s test scores did not pre-dict changes in viewing child-audience informativeprograms in the preschool years, but children withgood skills at age 5 tended to view more child-audience informative programs and fewer cartoonsin their early elementary years than did those withpoorer skills.
General-Audience Programs
This study’s findings also support hypotheses drawnfrom several theories predicting that extensive view-ing of entertainment programming may be a negativecontributor to intellectual development. Althoughcartoon viewing at age 2 and 3 was associated withlower scores on some measures, the patterns weremuch stronger for general-audience programs. Forboth cohorts, those who were frequent viewers of gen-eral-audience programs performed less well on tests ofschool-related skills and/or receptive language thandid less frequent viewers. Again, the high individualconsistency of test performance over time means thatinitial effects of viewing tended to be lasting. Oncethese initial effects were controlled, there were rela-tively few additional effects. One exception was car-toon viewing for the younger cohort; viewing at age 2and 3 was associated with lowered school readinessat age 5, even though it did not predict school readi-ness at age 3.
Two processes have been proposed by which general-entertainment programming might lead to loweredintellectual development. The first is displacement.Our other analyses of these data provided some sup-port for the notion that viewing general-audience en-tertainment programs displaces time in educationalactivities and social interaction. Children who watcheda lot of general-audience entertainment programsspent less time using print media than did less-frequent viewers (Wright & Huston, 1995). Moreover,
individual patterns of change in viewing over the 3years were associated with changes in time spent inreading, other educational activities, and social inter-action. When general-audience viewing increased,the time spent in educational activities and social in-teraction decreased, and, conversely, when general-audience viewing declined, children increased the timethey spent in educational activities and social inter-action (Huston et al., 1999).
The related hypothesis—that for very young chil-dren, general-audience programming interferes withopportunities for verbal and social interactions with par-ents, child-care providers, and other adults becausethe adults are watching the television—also foundsome support in these data. Among the 2- to 4-year-oldsin this study, a great deal of general-audience pro-gram viewing was “secondary.” In many instances, itis likely that the child was playing, eating, or doingsomething else while the television was on in theroom. Although parents are usually present whenyoung children watch general-audience programs(St. Peters, Oppenheimer, Eakins, Wright, & Huston,1991), they may be attending to the program and beunavailable for conversation or interaction with theyoung child.
The second hypothesis—that entertainment tele-vision may not engage children in effortful mentalactivity—may also account for the findings. It seemsunlikely that general-audience content was easily un-derstood by such young children. In fact, both car-toons and general-audience programs may pose chal-lenges to comprehension for them, and much of thisprogramming may be beyond their level of under-standing. When children perceive programs as in-comprehensible, their attention drops and they arelikely to pursue other activities (Anderson & Burns,1991). Moreover, a child with prolonged exposure tosuch content may have few experiences of engagingsuccessfully with the material, solving a problem, andgetting a sense of mastery. Once children compre-hend some of the general-audience programmingavailable, they tend to watch situation comedies andother light entertainment that may indeed foster apreference for material that makes few intellectualdemands.
Early viewing may also have indirect effects onlater viewing patterns. Early exposure predictedlower skills at age 3; children with low skills at age 3increased their viewing by ages 4 and 5; and, in the oldercohort, viewing at ages 4 and 5 predicted lower per-formance at age 5. These patterns could reflect the con-tinuing role of home environment as an influence onboth viewing and intellectual development, but it mayalso indicate that more advanced preschool children
Wright et al. 1363
seek out activities other than television. This pattern didnot appear to continue when children entered school.
Selection Issues
The fact that most of the significant relations oc-curred for the first viewing period may mean thatearly patterns of viewing are established in a stableway that has early effects, but it could also indicatethat selection variables affected the initial relationsof viewing to test scores. Controlling for the qualityof home environment by using the HOME Scale as-sured that there was not a large confound with cog-nitive stimulation and support in the home environ-ment. Controlling for primary language assured thatthe results were not an artifact of English fluency.Analyses not shown here also excluded a number ofother variables including parent education, occupa-tional status, family structure (single or two parents),child-care experience, birth order, parent regulationand encouragement of television viewing, and thechild’s initial language ability as explanations of the re-lations between viewing and children’s performance.It is not logically possible to exclude all possible un-measured variables that might account for the rela-tions between viewing and children’s performance,but these results are quite robust in the face of con-trols for many likely explanatory variables (seeWright & Huston, 1995).
Although establishing the independent contribu-tion of television to the outcomes is important, it isnot theoretically reasonable to assume that any aspectof a child’s experience operates independently of theoverall context in which it occurs. It may be that expo-sure to different types of television occurs in differenthome and child-care contexts. If that is the case, wewould not conclude that television has no indepen-dent effects, but that the television content forms asignificant part of those varied contexts.
Integrated Model
We stress the importance of content over totalamount of viewing because child-audience informativeviewing and other types of viewing are associatedwith opposite patterns of language and school-relatedskills. Content and hours in front of the television,however, are confounded in the world. In this sample,the average child watched between 1 and 3 hr a weekof educational programming; in an earlier study, the av-erages ranged from 3 to 5 hr a week. Our samplewatched 10 to 16 hr a week of general-audience pro-grams plus another 5 to 8 hr of cartoons. The issue ofcontent versus total time can be addressed in two
ways. Would there be negative effects if childrenspent 15 to 25 hours a week watching only child-audience informative programs? The data did notpermit an answer because almost no child did so, andwe cannot infer a linear increase in benefits with ex-tremely high amounts of exposure. The cumulativebenefits or hazards of viewing would probably de-pend on many factors, including the richness and va-riety of educational content viewed, its appropriate-ness for the child’s age and interests, and whether theactivities displaced by viewing were more or lessvaluable for intellectual development than the con-tent of the television programs.
If total viewing time rather than content were crit-ical, then might one expect positive effects from 3 hr aweek of watching entertainment programs? Is theresome benefit to small amounts of television, regardlessof content? No theory or data suggest that sitting in frontof the television per se promotes intellectual develop-ment. Positive outcomes might occur, however, if thetime spent watching television provided opportunitiesto learn language or social information (for example,immigrants sometimes use television to learn a newlanguage) or if it displaced time in harmful activities.
Similarly, most theories that predict negative ef-fects of viewing general entertainment suggest thatharm is a function of the amount of time devoted to it.One exception may be the “mental effort” hypothesis.If the critical variable is the lack of intellectual de-mands in the content of entertainment programs,then even small amounts of exposure might create ataste for such content, which would, in turn, be car-ried over to other parts of the child’s life.
Real children watch both child-audience informa-tive and entertainment programs. How might expo-sure to the two types of programming combine to in-fluence school readiness? We propose that each effectoperates relatively independently, and that they areadditive. That is, learning content and interests fromchild-audience informative programs is a functionof viewing those programs, relatively independentlyof the time spent viewing other types of programs.Time with general-audience programs interferes withpracticing and acquiring school-related skills throughseveral mechanisms that may be relatively indepen-dent of child-audience informative viewing. In anearlier longitudinal study, we performed “viewingdiet” analyses, in which child-audience informativeand general-entertainment viewing were consideredjointly as predictors. The associations of each viewingcategory with high school grades in these diet analy-ses were similar to those found using single viewingcategories as predictors (Anderson et al., 2001). In thepresent study, the number of cases did not permit
1364 Child Development
considering viewing diet in the path analysis, but thelow correlations among the different types of viewingsuggest that the results would be quite similar tothose reported for single viewing categories.
These results support the conclusion that, contraryto Marshall McLuhan’s (1964) famous dictum, it is themessage, not the medium, that matters. Watching ed-ucational programming, at least in small amounts, isassociated with high levels of school-related and lan-guage skills, and watching a lot of general-audienceprogramming is associated with low levels of thesame skills. These results occurred for children asyoung as age 2 in low-income families from a range ofethnic identities.
As a society, we are making choices about the pro-gramming offered to children that have consequencesfor what they derive from it. Public policy in recentyears has been designed to require broadcasters toserve the educational and informational needs of chil-dren (Kunkel, 1998). Good educational programs canprovide lasting benefits to children at many ages, butit may be especially important to provide such farefor very young children because they are less likelythan older children to be exposed to formal preschoolinstruction, and because stable habits of viewing maybe formed in the first few years of life. At the sametime, there is a continuing need for age-specific pro-gramming that will interest and teach children be-yond the preschool years.
ACKNOWLEDGMENTS
This research was supported by a grant to the twosenior authors from the Children’s Television Work-shop, using funds awarded by the John D. andKatherine T. MacArthur Foundation. The conclusionsare those of the authors and do not necessarily reflectthose of the granting agencies. The authors wish toexpress their appreciation for the skilled, diligent,and committed efforts of the staff of the Early Win-dow Project: Seanna Donley, Angeles Dowd, DarwinEakins, Jocelyn Freeman, Cydney Generoux, CurtisGilyard, Lori Goser, Vicky Hamlin, Paul Jefferson,Janice Jones, Kulkanok Kanoksakharin, JenniferKlein, Carrie Lamble, Ora Myers, Maria Elena Novak,Sabrina Oppenheimer, Rebeca Perez, Joanne Pickar,Vicki Rawdon, Jane Schneider, Tina Siribodhi, RaymondSoh, Jan Anderson Talley, Rosemarie Truglio, JackyWatson-Jolly, and Laurel Wheeler.
ADDRESSES AND AFFILIATIONS
Corresponding author: Aletha C. Huston, Departmentof Human Ecology A2700, University of Texas at Aus-
tin, Austin, TX 78712-1097; e-mail: [email protected]. John C. Wright was also at the Universityof Texas at Austin; Kimberlee C. Murphy is at the Uni-versity of Kansas, Lawrence, KS; Michelle St. Peters isat the University of Denver, Denver, CO; MaritesPiñon is at Psychological Corporation, San Antonio,TX; Ronda Scantlin is at the University of Pennsylva-nia, Philadelphia, PA; and Jennifer Kotler is at George-town University, Washington, DC.
REFERENCES
Anderson, D. R., & Burns, J. (1991). Paying attention to tele-vision. In J. Bryant & D. Zillmann (Eds.), Responding tothe screen: Reception and reaction processes (pp. 3–25).Hillsdale, NJ: Erlbaum.
Anderson, D. R., Field, D. E., Collins, P. A., Lorch, E. P., &Nathan, J. G. (1985). Estimates of young children’s timewith television: A methodological comparison of parentreports with time-lapse video home observation. ChildDevelopment, 56, 1345–1357.
Anderson, D. R., Huston, A. C., Schmitt, K. L., Linebarger,D. L., & Wright, J. C. (2001). Early childhood televisionviewing and adolescent behavior. Monographs of the Societyfor Research in Child Development, 66(Serial No. 264).
Ball, S. J., & Bogatz, G.A. (1970). The first year of Sesame Street:An evaluation. Princeton, NJ: Educational Testing Service.
Ball, S. J., & Bogatz, G. A. (1973). Reading with television: Anevaluation of the Electric Company. Princeton, NJ: Educa-tional Testing Service.
Bandura, A. (1978). The self system in reciprocal determin-ism. American Psychologist, 33, 344–358.
Bentler, P. M. (1995). EQS structural equations program man-ual. Encino, CA: Multivariate Software, Inc.
Bogatz, G. A., & Ball, S. J. (1971). The second year of SesameStreet: A continuing evaluation. Princeton, NJ: EducationalTesting Service .
Bracken, B. A. (1984). Bracken Basic Concept Scales. San Anto-nio, TX: Psychological Corporation.
Bradley, R. H., Caldwell, B. M., Rock, S. L., Ramey, C. T.,Barnard, K. E., Gray, C., Hammond, M. A., Mitchell, S.,Gottfried, A. W., Siegel, L., & Johnson, D. L. (1989).Home environment and cognitive development in thefirst 3 years of life: A collaborative study involving sixsites and three ethnic groups in North America. Develop-mental Psychology, 25, 217–235.
Caldwell, B. M., & Bradley, R. H. (1984). Home observation forthe measurement of the environment (Rev. ed.). Little Rock,AR: University of Arkansas.
Center for Research on the Influences of Television on Chil-dren. (1983). CRITC program categorization system codingmanual. Lawrence, KS: University of Kansas.
Clarke, A. T., & Kurtz-Costes, B. (1997). Television viewing,educational quality of the home environment, and schoolreadiness. Journal of Educational Research, 90, 279–285.
Comstock, G. (1991). Television and the American child. Or-lando, FL: Academic.
Wright et al. 1365
Comstock, G. A. (1995). Television and the American child. InC. N. Hedley & P. Antonacci (Eds.), Thinking and literacy:The mind at work (pp. 101–123). Hillsdale, NJ: Erlbaum.
Cook, T. D., Appleton, H., Conner, R. F., Shaffer, A., Tamkin,G., & Weber, S. J. (1975). “Sesame Street” revisited: A studyin evaluation research. New York: Russell Sage.
Corteen, R. S., & Williams, T. M. (1986). Television and read-ing skills. In T. M. Williams (Ed.), The impact of television:A natural experiment in three communities (pp. 39–85).Orlando, FL: Academic Press.
Dunn, L. M., & Dunn, L. M. (1981). Peabody Picture Vocabu-lary Test. Circle Pines, MN: American Guidance Services.
Entwisle, D. R., Alexander, K. L., & Olson, L. S. (1997). Chil-dren, schools, and inequality. Boulder CO: Westview.
Gortmaker, S. L., Salter, C. A., Walker, D. K., & Dietz, W. H.(1990). The impact of television viewing on mental apti-tude and achievement: A longitudinal study. PublicOpinion Quarterly, 54, 594–604.
Huesmann, L. R., & Miller, L. S. (1994). Long-term effects ofrepeated exposure to media violence in childhood. InL. R. Huesmann (Ed.), Aggressive behavior: Current per-spectives (pp. 153–186). New York: Plenum.
Huston, A. C., & Wright, J. C. (1994). Educating childrenwith television: The forms of the medium. In D. Zill-mann, J. Bryant, & A. C. Huston (Eds.), Media, family, andchildren: Social scientific, psychodynamic, and clinical per-spectives (pp. 73–84). Hillsdale, NJ: Erlbaum.
Huston, A. C., & Wright, J. C. (1997). Mass media and chil-dren’s development. In I. Sigel & K. A. Renninger (Eds.),W. Damon (Series Ed.), Handbook of child psychology: Vol. 4.Child psychology in practice (5th ed., pp. 999–1058). New York:Wiley.
Huston, A. C., Wright, J. C., Marquis, J., & Green, S. B. (1999).How young children spend their time: Television andother activities. Developmental Psychology, 35, 912–925.
Huston, A. C., Wright, J. C., Rice, M. L., Kerkman, D., &St. Peters, M. (1990). The development of televisionviewing patterns in early childhood: A longitudinal in-vestigation. Developmental Psychology, 26, 409–420.
Juster, F. T., & Stafford, F. P. (1985). Time, goods, and well-being.Ann Arbor, MI: Survey Research Center.
Koolstra, C., & van der Voort, T. (1996). Longitudinal effectsof television on children’s leisure-time reading: A test ofthree explanatory models. Human Communication Re-search, 23, 4–35.
Koolstra, C. M., van der Voort, T. H. A., & van der Kamp, L. J. T.(1997). Television’s impact on children’s reading com-prehension and decoding skills: A 3-year panel study.Reading Research Quarterly, 32, 128–152.
Kunkel, D. (1998). Policy battles over defining children’seducational television. Annals of the American Academy ofPolitical and Social Science, 558, 39–53.
MacBeth, T. M. (1996). Indirect effects of television: Creativ-ity, persistence, school achievement, and participation inother activities. In T. M. MacBeth (Ed.), Tuning in toyoung viewers: Social science perspectives on television (pp.149–219). Thousand Oaks, CA: Sage.
McLuhan, H. M. (1964). Understanding media: The extensionsof man. New York: McGraw-Hill.
Neapolitan, D. M., & Huston, A. C. (1994). Educational con-tent of children’s programs on public and commercial televi-sion. Lawrence, KS: Center for Research on the Influ-ences of Television on Children.
Neuman, S. B. (1988). The displacement effect: Assessingthe relation between television viewing and reading per-formance. Reading Research Quarterly, 23, 414–440.
Potter, W. I. (1987). Does television viewing hinder aca-demic achievement among adolescents? Human Commu-nication Research, 14, 27–46.
Rice, M. L. (1984). The words of children’s television. Jour-nal of Broadcasting, 28, 445–461.
Rice, M. L., Huston, A. C., Truglio, R., & Wright, J. C. (1990).Words from Sesame Street: Learning vocabulary whileviewing. Developmental Psychology, 26, 421–428.
Rice, M. L., Huston, A. C., & Wright, J. C. (1982). The formsand codes of television: Effects on children’s attention,comprehension and social behavior. In D. Pearl, L.Bouthilet, & J. B. Lazar (Eds.), Television and behavior: Tenyears of scientific progress and implications for the 80’s (Vol.II). Washington, DC: Government Printing Office.
Ritchie, D., Price, V., & Roberts, D. F. (1987). Television,reading, and reading achievement. Communication Re-search, 14, 292–315.
Rosengren, K. E., & Windahl, S. (1989). Media matter: TV usein childhood and adolescence. Norwood, NJ: Ablex.
Salomon, G. (1984). Television is “easy” and print is“tough”: The differential investment of mental effort inlearning as a function of perceptions and attributions.Journal of Educational Psychology, 76, 647–658.
Searls, D. T., Mead, N. A., & Ward, B. (1985). The relationshipof students’ reading skills to TV watching, leisure timereading, and homework. Journal of Reading, 29, 158–162.
Singer, J. L. (1980). The power and limits of television: Acognitive-affective analysis. In P. Tannenbaum (Ed.), Theentertainment function of television. Hillsdale, NJ: Erlbaum.
Smyser, S. O. (1981). A study of the relationship betweentelevision viewing habits and early reading achieve-ment. Dissertation Abstracts International, 41(12-A, Pt. 1),4972–4973.
St. Peters, M., Fitch, M., Huston, A. C., Wright, J. C., &Eakins, D. (1991). Television and families: What doyoung children watch with their parents? Child Develop-ment, 62, 1409–1423.
St. Peters, M., Oppenheimer, S., Eakins, D. J., Wright, J. C., &Huston, A. C. (1991, April). Media use among preschoolchildren as a function of income and media options. Paperpresented at the meeting of the Society for Research inChild Development, Seattle, WA.
Truglio, R. T., Huston, A. C., & Wright, J. C. (1986, March).The relation of children’s print and television use to early read-ing skills: A longitudinal study. Paper presented at theSouthwestern Society for Research in Human Develop-ment, San Antonio, TX.
Truglio, R. T., Murphy, K. C., Oppenheimer, S., Huston,A. C., & Wright, J. C. (1996). Predictors of children’s en-tertainment television viewing: Why are they tuningin? Journal of Applied Developmental Psychology, 17, 474–494.

1366 Child Development
Williams, P. A., Haertel, E. H., Walberg, H. J., & Haertel, G. D.(1982). The impact of leisure-time television on schoollearning: A research synthesis. American Educational Re-search Journal, 19, 19–50.
Woodcock, R. W., & Mather, N. (1989). Woodcock-JohnsonTest of Achievement. Allen, TX: DLM Teaching Resources.
Wright, J. C., & Huston, A. C. (1995). Effects of educational TVviewing of lower income preschoolers on academic skills,school readiness, and school adjustment one to three years
later. Lawrence, KS: Center for Research on the Influ-ences of Television on Children.
Wright, J. C., & Vlietstra, A. G. (1975). The developmentof selective attention: From perceptual exploration to log-ical search. In H. Reese (Ed.), Advances in child developmentand behavior (Vol. 10, pp. 195–239). New York: Academic.
Zill, N., Davies, E., & Daly, M. (1994). Viewing of SesameStreet by preschool children in the United States and its rela-tion to school readiness. Rockville, MD: Westat, Inc.