Embed Size (px)
Citation preview
THE RELATIONSHIP BETWEEN CAPITAL STRUCTURE AND
AGENCY COSTS OF FIRMS LISTED AT THE NAIROBI
SECURITIES EXCHANGE
BY GEORGE PETER ONSOMU
D61/60653/2013
A RESEARCH PROJECT SUBMITTED IN PARTIAL FULFILMENT
OF THE REQUIREMENT FOR THE AWARD OF THE DEGREE OF
MASTER OF BUSINESS ADMINISTRATION, SCHOOL OF
BUSINESS, UNIVERSITY OF NAIROBI
OCTOBER 2014
ii
DECLARATION
I declare that this research project is my original work and has not been presented for the
award of any degree in any university.
Signed Date
George Peter Onsomu
D61/60653/2013
This research project has been submitted for the examination with my approval as the
University Supervisor.
Signed Date
Mr. Herick Ondigo
Lecturer
Department of Finance and Accounting
School of Business
University of Nairobi

iii
ACKNOWLEDGEMENTS
This study is as a result of hard work in which I have been accompanied and supported
by many people to whom I am happy to express my gratitude. In particular, I would like
to express my sincere appreciation to my supervisors Mr. Herick Ondigo for his valuable
guidance and inspiration throughout the study.
I would also like to acknowledge the assistance provided by the staff at the resource
centre of the Nairobi Security Exchange in securing the data.
Finally, I would like to thank my family and friends for sharing with me the difficulties
encountered during the process of finalizing this study.
I wish you all peace and God’s abundant blessings.

iv
DEDICATION
I dedicate this research report to my family and colleagues for being supportive during
my studies.
v
TABLE OF CONTENTS DECLARATION ...................................................................................................................... ii
ACKNOWLEDGEMENTS ..................................................................................................... iii
DEDICATION ......................................................................................................................... iv
LIST OF TABLES .................................................................................................................. vii
LIST OF ABBREVIATIONS ................................................................................................ viii
ABSTRACT ............................................................................................................................. ix
CHAPTER ONE: INTRODUCTION ...................................................................................... 1
1.1 Background of the Study ....................................................................................................... 1
1.1.1 Agency Cost ................................................................................................................... 2
1.1.2 Capital Structure ............................................................................................................. 3
1.1.3 Effect of Agency costs and Capital Structure ................................................................... 4
1.1.4 Firms Listed at the Nairobi Securities Exchange.............................................................. 5
1.2 Research Problem ................................................................................................................ 7
1.3 Objective of the Study .......................................................................................................... 8
1.4 Value of the Study ................................................................................................................ 8
CHAPTER TWO: LITERATURE REVIEW ....................................................................... 10
2.1 Introduction ........................................................................................................................ 10
2.2 Theoretical Review ............................................................................................................. 10
2.2.1 Agency Theory ............................................................................................................. 10
2.2.2 A Basic Principal Agent Model ..................................................................................... 11
2.2.3 Stakeholders Theory ..................................................................................................... 11
2.2.4 The Principal Agent Problem Theory ............................................................................ 12
2.2.5 Information Asymmetry and Agency Theory ................................................................ 12
2.3 Determinants of Agency Costs ............................................................................................ 13
2.3.1 Managerial Ownership .................................................................................................. 13
2.3.2 Ownership Concentration .............................................................................................. 14
2.3.3 Board of Directors......................................................................................................... 15
2.3.4 Debt Contracts .............................................................................................................. 16
2.3.5 Managerial Compensation ............................................................................................. 16
2.3.6 Growth Opportunities.................................................................................................... 17
vi
2.3.7 Information Asymmetry ................................................................................................ 18
2.3.8 Debt Financing.............................................................................................................. 19
2.4 Review of Empirical Studies ............................................................................................... 20
2.4.1 International Evidence .................................................................................................. 20
2.4.2 Local Evidence ............................................................................................................. 22
2.5 Summary of Literature Review ........................................................................................... 23
CHAPTER THREE: RESEARCH METHODOLOGY ....................................................... 25
3.1 Introduction ........................................................................................................................ 25
3.2 Research Design ................................................................................................................. 25
3.3 Population .......................................................................................................................... 25
3.4 Data Collection ................................................................................................................... 26
3.5 Data Analysis ..................................................................................................................... 26
3.5.2 Test of Significance ...................................................................................................... 27
CHAPTER FOUR: DATA ANALYSIS, RESULTS AND FINDINGS ................................ 29
4.1 Introduction ........................................................................................................................ 29
4.2 Descriptive Statistics ........................................................................................................... 29
4.3 Inferential Statistics ............................................................................................................ 30
4.3.1 Regression Analysis ...................................................................................................... 30
4.3.2 Correlation Analysis ..................................................................................................... 31
4.4 Interpretation of the Findings .............................................................................................. 32
CHAPTER FIVE: SUMMARY, CONCLUSION AND RECOMMENDATIONS .............. 34
5.1. Introduction ....................................................................................................................... 34
5.2 Summary ............................................................................................................................ 34
5.3 Conclusion .......................................................................................................................... 34
5.4 Recommendations for Policy .............................................................................................. 35
5.5 Limitations of the Study ...................................................................................................... 35
5.6. Areas for Further Research ................................................................................................ 36
REFERENCES ....................................................................................................................... 37
APPENDIX I: LIST OF FIRMS QUOTED AT THE NSE AS AT 31ST DECEMBER
2013 ......................................................................................................................................... 44
APPENDIX II: RAW DATA .................................................................................................. 47

vii
LIST OF TABLES
Table 4.1: Descriptive statistics of key variables ....................................................................... 29
Table 4.2: The Coefficients of the Model .................................................................................. 30
Table 4.3: Correlation Analysis ................................................................................................ 31
viii
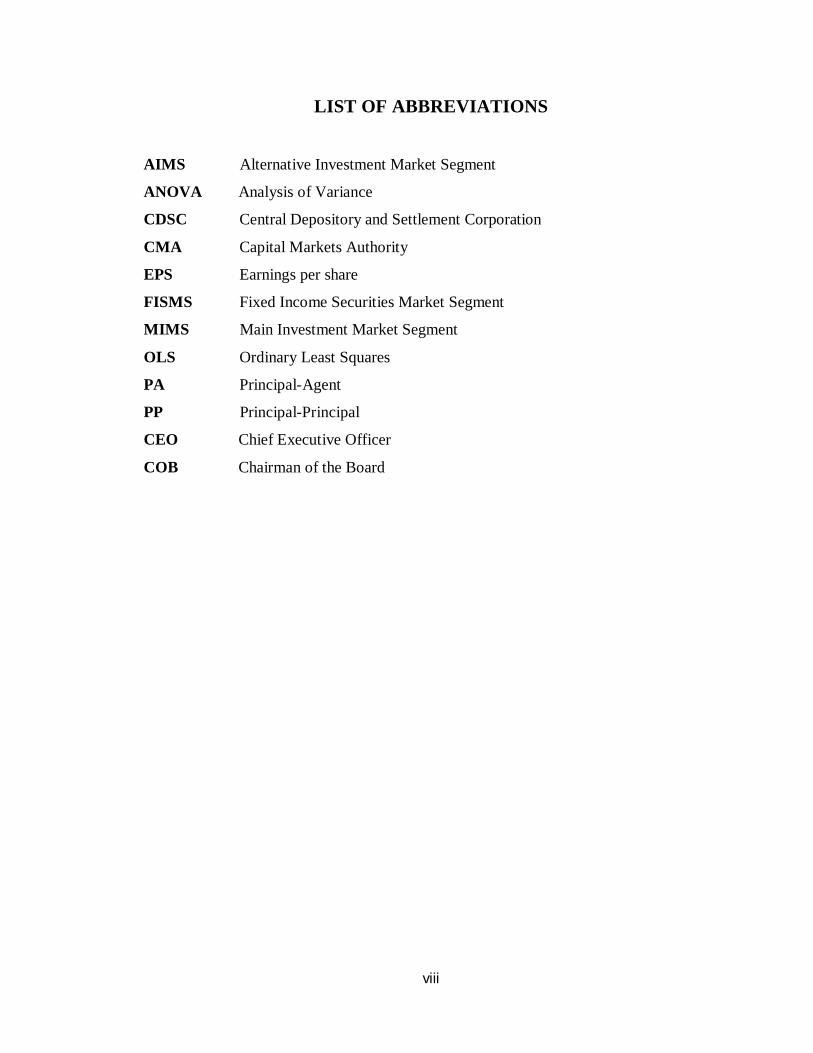
LIST OF ABBREVIATIONS
AIMS Alternative Investment Market Segment
ANOVA Analysis of Variance
CDSC Central Depository and Settlement Corporation
CMA Capital Markets Authority
EPS Earnings per share
FISMS Fixed Income Securities Market Segment
MIMS Main Investment Market Segment
OLS Ordinary Least Squares
PA Principal-Agent
PP Principal-Principal
CEO Chief Executive Officer
COB Chairman of the Board
ix
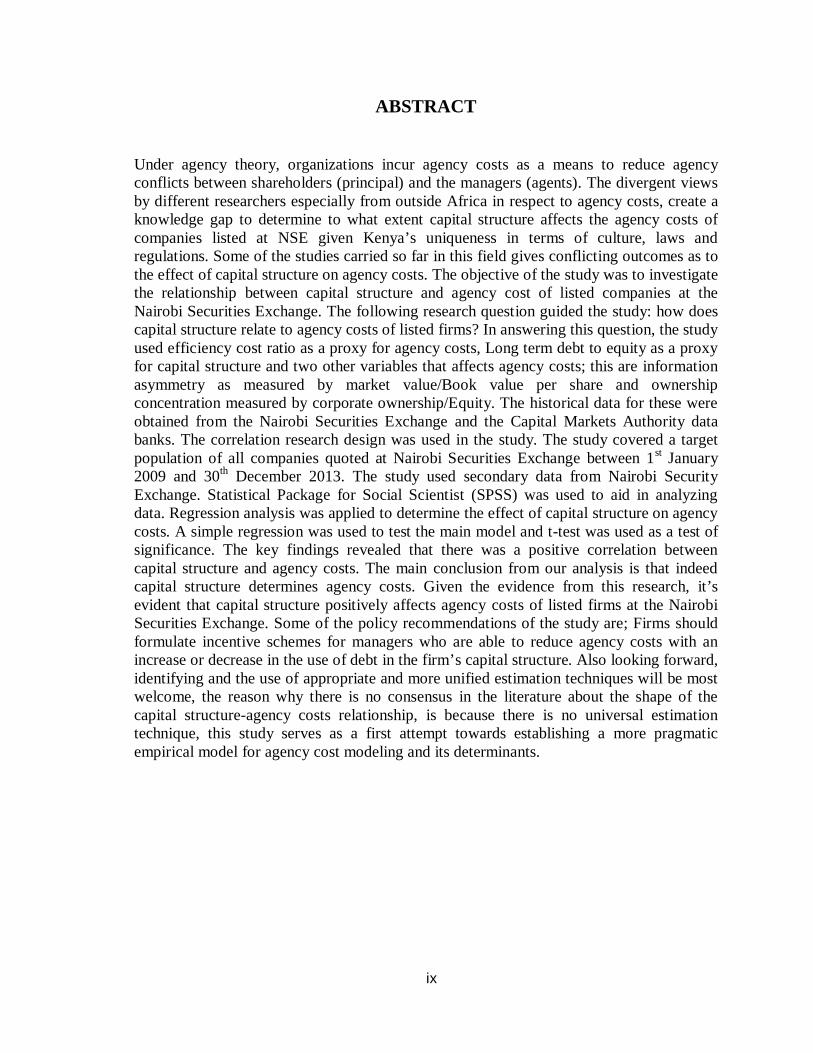
ABSTRACT
Under agency theory, organizations incur agency costs as a means to reduce agency conflicts between shareholders (principal) and the managers (agents). The divergent views by different researchers especially from outside Africa in respect to agency costs, create a knowledge gap to determine to what extent capital structure affects the agency costs of companies listed at NSE given Kenya’s uniqueness in terms of culture, laws and regulations. Some of the studies carried so far in this field gives conflicting outcomes as to the effect of capital structure on agency costs. The objective of the study was to investigate the relationship between capital structure and agency cost of listed companies at the Nairobi Securities Exchange. The following research question guided the study: how does capital structure relate to agency costs of listed firms? In answering this question, the study used efficiency cost ratio as a proxy for agency costs, Long term debt to equity as a proxy for capital structure and two other variables that affects agency costs; this are information asymmetry as measured by market value/Book value per share and ownership concentration measured by corporate ownership/Equity. The historical data for these were obtained from the Nairobi Securities Exchange and the Capital Markets Authority data banks. The correlation research design was used in the study. The study covered a target population of all companies quoted at Nairobi Securities Exchange between 1st January 2009 and 30th December 2013. The study used secondary data from Nairobi Security Exchange. Statistical Package for Social Scientist (SPSS) was used to aid in analyzing data. Regression analysis was applied to determine the effect of capital structure on agency costs. A simple regression was used to test the main model and t-test was used as a test of significance. The key findings revealed that there was a positive correlation between capital structure and agency costs. The main conclusion from our analysis is that indeed capital structure determines agency costs. Given the evidence from this research, it’s evident that capital structure positively affects agency costs of listed firms at the Nairobi Securities Exchange. Some of the policy recommendations of the study are; Firms should formulate incentive schemes for managers who are able to reduce agency costs with an increase or decrease in the use of debt in the firm’s capital structure. Also looking forward, identifying and the use of appropriate and more unified estimation techniques will be most welcome, the reason why there is no consensus in the literature about the shape of the capital structure-agency costs relationship, is because there is no universal estimation technique, this study serves as a first attempt towards establishing a more pragmatic empirical model for agency cost modeling and its determinants.
1
CHAPTER ONE
INTRODUCTION
1.1 Background of the Study
The distinguishing characteristic of public quoted companies is the separation of
ownership of assets from the control of assets. While ownership of these assets is vested
in the shareholders of the firm, control of these assets is in the hands of professional
managers (Brealey and Meyers, 2003). A number of researchers have provided insights
of the problems known as agency costs which may arise as a result of this separation
(Brealey and Myers, 2003; Baker and Powell, 2005). Whereas shareholders have an
interest in increasing the firms’ value, managers may want to pursue selfish goals of
increasing perquisites, company size and markets value. The question asked by many is
how the shareholders can mitigate the selfish interests of managers.
On the other hand, managers are employed to use their skills, judgment or experience on
behalf of shareholders. In order to do, so they need a significant element of discretion and
relative freedom of actions. Such freedom can often be abused if they are not called to
account for their actions. Given the information asymmetry between the shareholders and
managers, where managers know more about the firm, we do not expect a firm to operate
as well as it would have if all information were costlessly shared. Berle and Means
(1932) in their study of modern corporations found that even though the state seek to
regulate corporations, the cooperation’s are becoming more powerful and make every
effort to avoid such regulations. Jensen (1986) argues that agency problems are more
likely to prevail in large companies.
Corporate literature suggests several techniques by which agency conflicts can be
reduced. The techniques can be distinguished between internal and external mechanisms.
Internal mechanisms include compensation contracts, bonding and monitoring activities
within the firm, whereas external mechanisms include monitoring activities by the capital
markets and legislators. However perfect control is extremely costly thus out of question
(Vasiliou, Eritios & Daskalakis, 2005). For this reason agency problems can never be
2
perfectly solved and managers may never act totally in the best interest of shareholders.
As a result, shareholders experience loss in wealth due to divergent behavior of managers
especially when there is free cash flows in firms with low growth opportunities.
When managers objective differ from those of shareholders, the presence of internally
generated cash flow in excess of the required to maintain existing assets in place, creates
the potential for those funds to be squandered (Richardson, 2005). Agency cost is more
severe in low growth free cash flow firms where the economic interests of shareholders
and managers diverge substantially, and information sharing is costly. Jensen (1986)
argues that managers in firms with large free cash flows have incentives to waste original
resources on the negative Net present value projects and financing their perquisites rather
than payout cash to shareholders through dividends or share purchase schemes. The
impact of free cash flows on organizational inefficiencies is more pronounced in low
growth firms because such firms have few positive net present value projects. Berle and
Means (1932) believed that not all managerial objectives are self-serving, they believed
that rather that furthering their own interests, or even those of shareholders, the
management may act in the interest of society as a whole.
1.1.1 Agency Cost
Agency costs emanate from agency relationships that arise because of separation of
ownership and management. Agency costs refer to the sum of the costs of designing,
implementing, and maintaining the appropriate control system within organizations and
the residual loss resulting from the difficulty of solving control problems completely
(Jensen and Meckling, 1992). In other words, these are costs incurred by the owners of
the firm to monitor the activities of agents who may pursue divergent interest from that of
the principals or owners of the firm. These costs include costs of internal audit, external
auditors and non-executive directors (Mustapha and Ahmed, 2011). In essence, these
costs are part of the mechanisms employed by the shareholders to protect their
investments while at the same time guaranteeing the success and the going concern of the
firm. Ang et al. (2000) claims that the magnitude of these costs is limited by how well the
owners and delegated third parties, such as banks, monitor the actions of the outside
3
managers. Because banks generally require a firm’s managers to report result honestly
and to run business efficiently with profit, bank monitoring complements shareholder
monitoring of managers, indirectly reducing owner-manager agency costs. That is, by
incurring monitoring costs to safeguard their loans, banks lead firms to operate more
efficiently by better utilizing assets and moderating perquisites consumption in order to
improve the firm’s reported financial performance to the bank. Thus, lower priority
claimants, such as outside shareholders, should realize a positive externality from bank
monitoring, in the form of lower agency costs.
1.1.2 Capital Structure
Kochhar (1997) defines capital structure as a mixture of financial liabilities (debt and
equity) that is used to finance firm operations. A firm’s capital structure refers to the mix
of its financial liabilities. As financial capital is an uncertain but critical resource for all
firms, suppliers of finance are able to exert control over firms Debt and equity are the two
major classes of liabilities, with debt holders and equity holders representing the two
types of investors in the firm. Each of these is associated with different levels of risk,
benefits, and control. While debt holders exert lower control, they earn a fixed rate of
return and are protected by contractual obligations with respect to their investment.
Equity holders are the residual claimants, bearing most of the risks, and, correspondingly,
have greater control over decisions.
Capital structure has also been defined as mix of a company's long-term debt, specific
short-term debt, common equity and preferred equity, it is how a firm finances its overall
operations and growth by using different sources of funds. Debt comes in the form of
bond issues or long-term notes payable while equity is classified as common stock,
preferred stock or retained earnings. Short-term debt such as working capital
requirements is also considered to be part of the capital structure.
(http://www.businessdictionary.com).
4
1.1.3 Effect of Agency Costs and Capital Structure
Jensen and Meckling (1976) argue that the existence of the debt reduces the amount of
equity and enables a higher level of insider ownership. Jensen (1986) also argues that the
existence of the debt in the firm’s capital structure acts as a bonding mechanism for
company managers. By issuing debt, rather than paying dividends, managers
contractually bind themselves to payout future cash flows in away unachievable through
dividends. Easterbrook (1984) in the study of agency cost expectation of dividends,
argues that external capital market monitoring brought to companies by debt financing,
forces managers in value maximizing strategies, rather than personal utility
maximization. The bankruptcy costs of debt and the personal embarrassment arising from
bankruptcy acts as an effective incentive mechanism to encourage managers to be more
efficient.
This gives three different reasons that could lead to managerial efficiency due to use of
debt in a firm. Firstly the debt decreases the firm’s free cash flows which reduce the
manager’s ability to use corporate resources for empire building purposes (Jensen, 1986).
Secondly the managers increase efficiency in order to meet debt payment objectives to
avoid bankruptcy, in the process managers’ act in the best interest of shareholders
(Grossman and Hart, 1882). Thirdly, an increase in debt could increase monitoring by
lenders (Papa, 2007). Lenders incur monitoring costs to safeguard their money. This
makes firms operate more efficiently by utilizing and moderating perquisite consumption
so as to improve performance reported to the lenders (Ang, Cole and Lin, 2000).
Payout of cash to shareholders creates conflict between managers and shareholders. The
payout reduces resources under the managers’ control and thereby reducing their power.
On the other hand, managers have a tendency to cause their firms grow beyond their
optimal size. The higher the growth of resources, the higher the manager’s power, which
can also lead to increase in manager compensation. Conflict between shareholders and
managers over payout policies are more severe when the firm generates substantial free
cash flows with low payout ratio, the managers are tempted to invest in projects with low
returns and engage in organizational inefficiencies (Jensen, 1986).
5
Large cash balances provide firms with the flexibility in investment decisions while
shielding them from capital market discipline imposed when issuing securities. This
reduced market supervision leads to agency theory to predict that cash rich firms will
over invest at the expense of shareholders (Mahar, 1998). Jensen (1986) study of the
benefits of debt in disgorging these excesses cash in the hands of managers and
substitution of debt for dividends gives insight of how shareholders, manager conflict can
be resolved. The use of debt, bonds managers to repay capital and interest in the future.
Failure to meet the obligation, creditors can take the firm into bankruptcy court.
Therefore, debt reduces agency costs by reducing cash available for spending at the
discretion of managers. The control of debt is more important in organs that generate
large cash flows but have low growth prospects. In this organizations, the pressure to
waste cash flows by investing them in economic projects is most serious.
1.1.4 Firms Listed at the Nairobi Securities Exchange
Nairobi Security Exchange is a market for securities, licensed and regulated by the
Capital Markets Authority. It was constituted in 1954 as a voluntary association of
stockbrokers and registered under the societies Act. It has the mandate of providing a
trading platform for listed securities and overseeing its member firms. The Central
Depository and Settlement Corporation (CDSC) provide clearing, delivery and settlement
services for securities traded at the Nairobi Securities Exchange. It oversees the conduct
of the Central Depository Agents comprised of stockbrokers and investment banks which
are members of NSE and custodians. Some of the securities traded in NSE include
ordinary shares, preference shares and debentures. The membership of NSE has grown
over the years from one brokerage firm at initiation to the current membership of 19
firms and 61 listed companies.
NSE is guided by rules and regulations. For instance for a company to be listed at NSE it
has to meet the listing requirements which include: minimum capital requirements,
prospectus showing accounts for the last five years, disclosure requirement, minimum
share issue requirement, minimum number of shareholders and filing accounts every year
with Capital Markets Authority (CMA).On 11th September 2006, NSE implemented live
6
trading on the automated trading system as part of its modernization strategy. The
Nairobi Stock Exchange (NSE) was established in 1954. NSE is a market that deals in the
exchange of securities issued by publicly quoted companies and the Government. A
major role that the stock exchange has played and continues to play in the Kenyan
economy is that it promotes a culture of thrift, or saving. The very fact that institutions
exist where savers can safely invest their money and in addition earn a return is an
incentive to people to consume less and save more (NSE, 2005). The market has evolved
over the years and currently boosted of an Electronic Trading System.
NSE is divided into three market segments; Main Investment Market Segment (MIMS),
Alternative Investment Market Segment (AIMS) and Fixed Income Securities Market
Segment (FISMS). MIMS is the major segment of the market. The minimum eligibility
conditions and listing requirements for this segment include but not limited to the fact
that the company must have a minimum authorized, issued and fully paid up share capital
of Kshs 50 million and net assets of Kshs 100 million before the public offering of shares
(NSE, 2005). It is important to further note that the firms in this segment are further
segmented according to the nature of the industry into Agricultural, Commercial and
Services, Finance and Investment, and lastly Industrial and Allied.
AIMS are a smaller segment compared to MIMS. The minimum eligibility conditions
and listing requirements for this segment include but not limited to the fact that the
company must have a minimum authorized, issued and fully paid up share capital of Kshs
10 million and net assets of Kshs 20 million before the public offering of shares (NSE,
2005).FISMS is a debt capital market segment whereby Companies intending to list their
commercial papers or corporate bonds in the fixed income securities must satisfy the
eligibility requirements similar to those of MIMS. At NSE, this segment is still
underdeveloped, currently with only the 4% and 7% Kenya Power & Lighting Preference
shares.
7
1.2 Research Problem
Managers act as agents of the providers of capital in any organization. However, more
often than not the relationship between management as agents and shareholders as
principals is punctuated with conflicts of interest with the resultant agency costs. Agency
costs constitute the summation of the monitoring expenditures by the principal, the
bonding expenditures by the agent and the residual loss (Jensen & Meckling, 1976).
Agency costs manifest in various forms such as executive perks, drops in productivity,
free cash flow inefficiencies, as well as loss of firm value.
Managerial actions and interest may, therefore, not be aligned with shareholders.
Consequently, free cash flow can pose a challenge especially when the monitoring and
accountability mechanisms are not sufficient enough to guarantee that excess cash is
returned to stockholders. Once management has fulfilled their contractual obligations
may misappropriate excess funds financially to align their pockets instead of
maximization of share wealth (Baker& Anderson, 2010).Wealth maximization requires
that managers undertake investments whose return on investment exceed the cost of
financing and maximize share value. Unfortunately, this may not be the case. The
managers’ personal financial interests may override stockholder interests with free cash
flows available. This is the basis of agency conflicts and their resultant costs (Meckling,
1976). As a solution, more debt in the capital structure of the firm decreases the agency
cost. This binds managers to focus on repaying the principal and interest to avoid
financial distress and bankruptcy through effective resource utilization (Zhang and Li,
2008).
In Kenya, there are many instances of NSE listed firms that have in the recent past been
placed under receivership, liquidated or delisted partially due to issues of financial
impropriety associated with the agency problem. Firms such as National bank,
Commercial Bank and Uchumi supermarkets top the list. Some studies have been carried
out at world stage with a core concentration on the relationship between agency cost and
capital structure. Hang (2009) did a study on the role of capital structure and managerial
incentive compensation in controlling the free cash flow agency problem. His findings
8
indicate that a negative correlation exists between the capital structure and free cash flow.
On the other hand, Lingling (2004) looked at the impact of ownership structure on the
capital financing in relation to agency costs free cash flow problem and capital structure.
He found out that the nature of capital structure of a firm especially high capital structure
reduces the free cash flow problem and thus agency costs.
Much of this literature has, therefore, presented a case whereby firms with adequate free
cash flow, usually, face agency conflicts and costs between stockholders and
management. However, much of this literature is alien to the Kenyan business context in
general and specifically when dealing with firms listed in the NSE. There is no known
research that has been conducted on the relationship between agency costs and capital
structure of NSE listed firms, in Kenya. This leaves a knowledge which needs to be
addressed by this study. The study will, therefore, seek to answer the following question;
what is the relationship between agency cost and capital structure of firms listed at the
NSE?
1.3 Objective of the Study
To determine the relationship between agency costs and capital structure of firms listed at
the Nairobi Securities Exchange.
1.4 Value of the Study
The study contributes to the literature of the relationship between agency costs and
capital structure of companies listed in the NSE. It is hoped that findings of this study are
valuable to academician who may find useful research gaps that may stimulate interest in
future research in this area of capital structure and agency costs. Also, sometimes
managers fail to make certain disclosures of important information to the market. This is
coupled with the separation of ownership and management, investors are not able to
make fair judgments when investing. The study provides insights on the relationship
between agency costs and capital structure which may help investors gather more
information regards to their investment and therefore make better decisions. They are,

9
therefore, more enlightened when it comes to voting for vital decisions which affects
them as regards to the firm’s performance.
10
CHAPTER TWO
LITERATURE REVIEW
2.1 Introduction
This chapter reviews the relevant literature of the study under the following sections;
theoretical framework, review of empirical studies and chapter summary.
2.2 Theoretical Review
The study will review some the recognized theories in relation to agency theory and
capital structure. Some of this theories are; agency theory, basic principal agent model,
stakeholders theory, principal agent problem, theory information asymmetry and agency
theory.
2.2.1 Agency Theory
Jensen and Meckling (1976) define agency relationship as a contract under which one
party, the principal engages another party, the agent to perform some services on their
behalf. The principal delegates some decision-making authority to an agent. The
delegations of decision making by the principal and resulting decision of labor are helpful
in promoting efficiency and productivity. The principal hires or retains the agent because
of the agent’s specific talents, knowledge and capabilities to increase the value of assets.
All or some of the principal decision rights over assets is transferred to the agent
(Moldoveanu & Martin, 2001).Such delegation means the principal have to place trust on
the agent. Agency theory looks at the conflicts of interest, which may arise between the
principal and the agent when the motive of the agents are questionable, and trust no
longer exists. The principal seeks to gain information by inspection or evaluation and
designing systems to ensure agent's acts in the principal interests (Barle and Mean, 1932).
11
2.2.2 A Basic Principal Agent Model
In Hoque (2006) the simplest form of the agency model can be viewed to comprise two
parties: the principal &agent. The principal is expected to supply capital, bear the risk and
construct incentives while the agent is required to complete tasks, make decisions on the
principal behalf and to bear the risk.
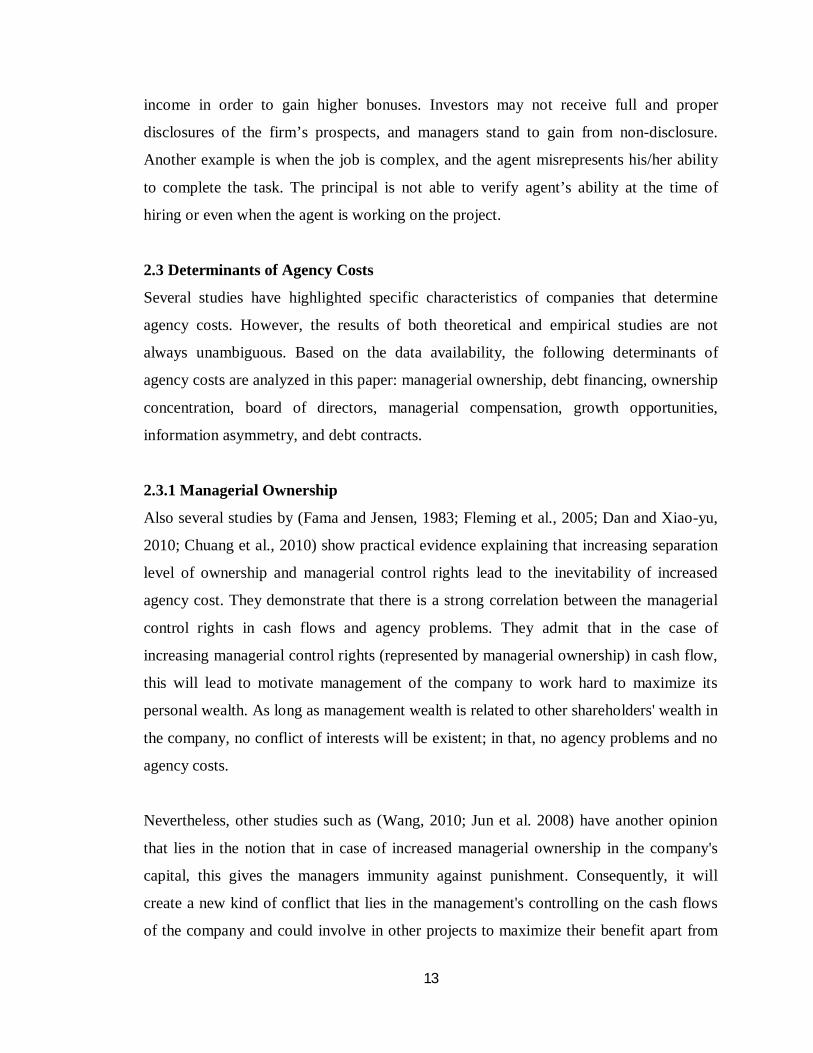
The normal sequence of events over a single time period may be viewed as follows:
The sequence begins with a compensation contract between principal and agent
specifying the performance measures upon which the agent compensation will be
assessed. Let the compensation function be denoted by ‘S’ and ‘X’ as the outcome of the
firm and ‘Y’ as the vector of performance measures used in the contract, choose a vector
of actions, which include operating decisions, financing decisions or investment
decisions. The agent actions along the exogenous factors (generally modeled as random
variables) influence the realization of performance measures and the outcome of the firm
as well. After the performance measures are jointly observed, the agent is paid according
to the terms of the contract.
Key assumptions in the overall sequence of events are: First the outcome of the firm, l.e
X can be measured in monetary terms and relate to a single period e.g. as end of period
cash flow or the liquidating dividends of the firm gross of the compensation paid to the
agent. Another assumption is that the agent chooses an action and the principal is not able
to fully observe this choice, and there is a stochastic term attached to the agent's output.
Thus, both the agent and principal assumes a certain amount of risk and in general, the
greater the risk assumed, the higher the agent compensation.
2.2.3 Stakeholders Theory
Fontrodona and Sison (2006) argued against the common belief that the shareholders are
the sole owners of the firm. They claimed that the firm has a number of
actors/stakeholders whose interest must be protected. For example, managers and
12
employees take risks by committing their labor to the company just as investors take risks
by entrusting their capital to the firm. With different actors claiming ownership of the
company, there can be no justification that owner managed firms reduce agency costs.
Rather, there are multiple relationships among the owners of different factors of
production. For this reason, stakeholder theory, which takes into account the different
actors, offers a more comprehensive view of the firm than shareholder theory.
2.2.4 The Principal Agent Problem Theory
The basic principal agent problem is confronted by fundamental issues. The principal and
agent are utility maximisers, whereby both parties seek to maximize their returns.
Secondly, not always that those interests of the principal and agent are aligned (Berle and
Mean 1932, Jensen and Meckling, 1976).The agent may not act to the best interest of the
principal e.g the principal and agent may differ in their risk preference resulting in the
agents action being different from that expected by the principal, unless the risk
preferences are known and made clear between the parties, that’s prior to the contract
formation and factored into the compensation, the agency problem is likely to increase.
2.2.5 Information Asymmetry and Agency Theory
Further, the agency problem is seen to exacerbate under conditions of information
asymmetry, in that one party has more information than the other (Jensen and Meckling,
1976). It’s actually an agent who is seen to possess information advantage over the
principal. Information asymmetry may in turn lead to two types of the agency problem,
moral hazard and adverse selection. Moral hazard, at times, referred to as hidden costs,
relates to the lack of effort by managers. The principal is restricted to assess the agent’s
action directly. In such situations, the manager may be tempted to consume perquisites in
excess of what was agreed or take ease on the jobs as the principal is not able to observe
managers’ action.
Adverse selection; arise even when the principal is able to observe managers behavior but
is unable to ascertain if the effort extended by the agent is the most appropriate behavior.
For example, the manager may choose an accounting policy that maximizes reported net
13
income in order to gain higher bonuses. Investors may not receive full and proper
disclosures of the firm’s prospects, and managers stand to gain from non-disclosure.
Another example is when the job is complex, and the agent misrepresents his/her ability
to complete the task. The principal is not able to verify agent’s ability at the time of
hiring or even when the agent is working on the project.
2.3 Determinants of Agency Costs
Several studies have highlighted specific characteristics of companies that determine
agency costs. However, the results of both theoretical and empirical studies are not
always unambiguous. Based on the data availability, the following determinants of
agency costs are analyzed in this paper: managerial ownership, debt financing, ownership
concentration, board of directors, managerial compensation, growth opportunities,
information asymmetry, and debt contracts.
2.3.1 Managerial Ownership
Also several studies by (Fama and Jensen, 1983; Fleming et al., 2005; Dan and Xiao-yu,
2010; Chuang et al., 2010) show practical evidence explaining that increasing separation
level of ownership and managerial control rights lead to the inevitability of increased
agency cost. They demonstrate that there is a strong correlation between the managerial
control rights in cash flows and agency problems. They admit that in the case of
increasing managerial control rights (represented by managerial ownership) in cash flow,
this will lead to motivate management of the company to work hard to maximize its
personal wealth. As long as management wealth is related to other shareholders' wealth in
the company, no conflict of interests will be existent; in that, no agency problems and no
agency costs.
Nevertheless, other studies such as (Wang, 2010; Jun et al. 2008) have another opinion
that lies in the notion that in case of increased managerial ownership in the company's
capital, this gives the managers immunity against punishment. Consequently, it will
create a new kind of conflict that lies in the management's controlling on the cash flows
of the company and could involve in other projects to maximize their benefit apart from
14
shareholders' benefit. On the other hand, to own a part of the company's capital is not
harmful or not useful; several studies admitted such a notion by explaining the important
role of managerial ownership which has the motivation role to make the managers keen
to maximize profitability of the company and reduce agency cost of its ownership
(Margaritis and Maria, 2010; Chen et al., 2006). As a result, managerial ownership is a
double-edged sword. One edge is represented by shared benefits which arise from the fact
that a manager having a stake in the capital is logically seeking to maximize both his
wealth and that of others as well. The other edge is the negative side represented by the
managers' bad intention to direct company's resources for their personal benefit which
eventually affects shareholders' wealth.
2.3.2 Ownership Concentration
Another alternative for alleviating agency problems is through concentrated ownership.
Theoretically, shareholders could take themselves an active role in monitoring
management. However, given that the monitoring benefits for shareholders are
proportionate to their equity stakes (Grossman and Hart, 1988), a small or average
shareholder has little or no incentives to exert monitoring behaviour. In contrast,
shareholders with substantial stakes have more incentives to supervise the management
and can do so more effectively (Shleifer and Vishny, 1986; Shleifer and Vishny, 1997
and Friend and Lang, 1988). In general, the higher the amount of shares that investors
hold, the stronger their incentives to monitor and, hence, protect their investment.
Although large shareholders may help in the reduction of agency problems associated
with managers, they may also harm the firm by causing conflicts between large and
minority shareholders. The problem, usually, arises when large shareholders gain nearly
full control of a corporation and engage themselves in self-dealing expropriation
procedures at the expense of minority shareholders (Shleifer and Vishny, 1997). Also, as
Gomez (2000) points out, these expropriation incentives are stronger when corporate
governance of public companies insulates large shareholders from takeover threats or
monitoring and the legal system does not protect minority shareholders because either of
poor laws or poor enforcement of laws. Furthermore, the existence of concentrated
15
holdings may decrease diversification, market liquidation and stock’s ability to grow and,
therefore, increase the incentives of large shareholders to expropriate firm’s resources.
2.3.3 Board of Directors
Corporate governance research recognizes the essential role performed by the board of
directors in monitoring management (Fama and Jensen, 1983; Weisbach, 1988 and
Jensen, 1993). The effectiveness of the board as a corporate governance mechanism
depends on its size and composition. Large boards are, usually, more powerful than small
boards and hence, considered necessary for organizational effectiveness. For instance, as
Pearce and Zahra (1991) point out, large powerful boards help in strengthening the link
between corporations and their environments, provide counsel and advice regarding
strategic options for the firm and play crucial role in creating corporate identity. Other
studies, though, suggest that large boards are less effective than large boards. The
underlying notion is that large boards make coordination, communication and decision-
making more cumbersome than it is in smaller groups. Recent studies by Yermack, 1996;
Eisenberg et al., 1998 and Bender et al., 2004 support such a view empirically.
The composition of the board is also important. There are two components that
characterize the independence of the board, the proportion of non-executive directors and
the separated or not roles of chief executive officer (CEO) and chairman of the board
(COB). Boards with a significant proportion of non-executive directors can limit the
exercise of managerial discretion by exploiting their monitoring ability and protecting
their reputations as effective and independent decision makers. Consistent with that view,
Byrd and Hickman (1992) and Rosenstein and Wyatt (1990) propose a positive
relationship between the percentage of non-executive directors on the board and
corporate performance. Lin et al. (2003) also propose a positive share price reaction to
the appointment of outside directors, especially when board ownership is low, and the
appointee possesses strong ex-ante monitoring incentives. Along a slightly different
dimension, Dahya et al. (2002) find that top-manager turnover increases as the fraction of
outside directors increases. Other studies find exactly the opposite results. They argue
that non-executive directors are usually characterized by lack of information about the
16
firm, do not bring the requisite skills to the job and, hence, prefer to play a less
confrontational role rather than a more critical monitoring one (see, for example, Agrawal
and Knoeker, 1996; Herman 10 and Weisbach, 1991, and Franks et al., 2001).
2.3.4 Debt Contracts
Lenders seek in most cases to make contracts between them and company's management
whereby they determine some restrictions to limit making further decisions from the
management side, where such decisions may negatively affect company's ability to
accomplish its obligations, such as reducing the issuance of new debt or specify a
maximum of dividends and set a minimum limit for liquidity and debts (Shi and Xiao –
Zhong, 2011). These contracts are considered among the main determinants of managers'
behavior in the emergence of agency cost of ownership; this is taken from two angles.
Firstly, the management is subject to strong control by capital market members
represented by investors, creditors, banks, etc. secondly , making debt contracts leads to
increasing company's financial risk, which may lead to motivate managers to reduce
agency cost to keep on the financial ability of the company to meet debt and burdens on
time (Harvey et al.,2004).
2.3.5 Managerial Compensation
Another important component of corporate governance is the compensation package that
is provided to firm management. Recent studies by Core et al. (2001) and Murphy (1999)
suggest, among others, that compensation contracts, whose use has been increased
dramatically during the 90’s, can motivate managers to take actions that maximize
shareholders’ wealth. In particular, as Core et al. (2001) point out, if shareholders could
directly observe the firm’s growth opportunities and executives’ actions no incentives
would be necessary. However, due to asymmetric information between managers and
shareholders, both equity and compensation related incentives are required. For example,
an increase in managerial compensation may reduce managerial agency costs in the sense
that satisfied managers will be less likely, ceteris paribus, to utilize insufficient effort,
perform expropriation behaviour and, hence, risk the loss of their job. Despite the central
importance of the issue, only a few empirical studies examine the impact of managerial
17
compensation components on corporate performance. For example, Jensen and Murthy
(1990) find a statistically significant relationship between the level of pay and
performance. Murphy (1995), finds that the form, rather than the level, of compensation,
is what motivates managers to increase firm value. In particulars, he argues that firm
performance is positively related to the percentage of executive compensation that is
equity based.
More recently, Hutchinson and Gul (2004) analyze whether or not managers’
compensation can moderate the negative association between growth opportunities and
firm value. The results of this study indicate that corporate governance mechanisms such
as managerial remuneration, managerial ownership and non-executive possibly affect the
linkages between organizational, environmental factors (e.g. growth opportunities) and
firm performance. Finally, Chen (2003) analyzes the relationship between equity value
and employees’ bonus. He finds that the annual stock bonus is strongly associated with
the firm’s contemporaneous but not future performance.
Despite its potentially positive impact on firm value, compensation may also work as
“infectious greed” which creates an environment ripe for abuse, especially at significantly
high levels. For instance, remuneration packages, usually, include extreme benefits for
managers such as the use of private jet, golf club membership, entertainment and other
expenses, apartment purchase, etc. Benefits of this sort, usually, cause severe agency
conflicts between managers and shareholders. Therefore, it is possible that the
relationship between compensation and agency costs is non-monotonic.
2.3.6 Growth Opportunities
The magnitude of agency costs related to underinvestment, asset substitution and free
cash flow differ significantly across high-growth and low-growth firms. In the under
investment problem, managers may decide to pass up positive net present value projects
since the benefits would mainly accrue to debt-holders. This is more severe for firms with
more growth-options (Myers, 1977). Asset substitution problems, which occur when
managers opportunistically substitute higher variance assets for low variance assets, are

18
also more prevalent in high-growth firms due to information asymmetry between
investors and borrowers (Jensen and Meckling, 1976). High-growth firms, though, face
lower free cash flow problems, which occur when firms have substantial cash reserves
and a tendency to undertake risky and usually negative NPV investment projects (Jensen,
1986).
Given the different magnitude and types of agency costs between high-growth and low-
growth firms, we expect the effectiveness of corporate governance mechanisms to vary
with growth opportunities. In particular, if agency problems are associated with greater
underinvestment or information asymmetry (a common problem in high-growth firms),
we expect corporate governance mechanisms that mitigate these kinds of problems to be
more effective in high-growth firms (Smith and Watts, 1992; Gaver and Gaver, 1993).
However, if, as argued by Jensen (1986), agency problems are associated with conflicts
over the use of free cash flow (a common problem in low-growth firms), we expect
governance mechanisms that mitigate such problems to play a more important role in
low-growth firms (Jensen, 1986). Also, Lasfer (2002) points out that the high-growth
firm (low-growth firms) rely more on managerial ownership (board structure) to mitigate
agency problems. Finally, Chen (2003) finds that the positive relationship between
annual stock bonus and equity value is stronger for firms with greater growth
opportunities.
2.3.7 Information Asymmetry
The nonconforming information is another source of the problems of agency conflicts.
Managers provide information in their reports when readers expect that this information
reflects a good situation of work progress, while managers utilize this information to
achieve performance and decisions leading to achieve their own interests and create
negative impacts on shareholders' interest. In support for this idea, Harris and Raviv
(2010) admit that the information would never be fully revealed on the part of the
managers due to agency problems.
19
The early beginnings of addressing information asymmetry were made by the economist
Hayek (1945) who emphasized the importance of knowledge and how knowledge and its
distribution have an active role in contributing to economic development. That was when
he dealt with the nature of the economic problem in society in his article titled "The use
of knowledge in society”. Hayek demonstrated that the organization's good performance
depends on the importance of knowledge possessed by a decision maker; but
unfortunately, he did not deal with the cost of knowledge transfer to the decision maker;
so he was criticized by Jensen and Meckling (1995) as they manifested that it was
necessary to take into account the cost associated to knowledge transfer. They, however,
praised the great role played by Hayek in demonstrating the importance and role of what
is called "information asymmetry" which occupied a wide scope in the literature on
agency conflict.
2.3.8 Debt Financing
Problems within a firm are, usually, related to free cash-flow and asymmetric information
problems (Jensen, 1986; Myers and Majluf, 1984). Debt obligations help to the reduction
of agency problems caused by these factors. Debt is an important influence on agency
costs. Bank debt provides significant signaling characteristics that can mitigate
informational asymmetry conflicts between managers and outside investors (Jensen,
1986; Stulz, 1990; and Ross, 1977). Berlin and Mester (1992) argue that the renegotiation
of the loan is easier because banks are well informed and typically small in number. The
bank’s willingness to renegotiate and renew a loan indicates the existence of a good
relationship between the borrower and the creditor, and that is a further good signal about
the quality of the firm. Fama (1985) argues that banks have a comparative advantage as
lenders in minimizing information costs and can get access to information not otherwise
publicly available. In addition to debt source, the maturity structure of debt may matter.
Short-term debt may be more useful than long-term debt in reducing agency problems
related to free cash-flow and in signaling high quality to outsiders. Myers (1977) suggests
that the short-term debt could alleviate agency conflicts between managers and
shareholders such as the underinvestment problem. Flannery (1986) argues that firms
with large potential information asymmetries are likely to issue short-term debt because
20
of the larger information costs associated with long-term debt. Also, short-term debt can
be advantageous especially for high-quality companies due to its low refinancing risk
(Diamond, 1991). If yield curve is downward sloping, issuing short-term debt increases
firm value (Brick and Ravid, 1985).
2.4 Review of Empirical Studies
The study will review empirical studies on both international and local fonts to find out what others have done and the outcome of their findings in respect to the relationship between capital structure and agency costs.
2.4.1 International Evidence
In a global perspective, MengMeng (2013). In his empirical study also set out to find the
relationship between capital structure and agency costs of Chinese listed firms, the
population of the study was from all listed companies at Shangai and Shenzhen stock
markets. A sample of 775 listed companies from Shanghai and Shenzhen stock markets
was selected during three years period 2010 to 2012 , the study centered on the
relationship between agency cost and capital structure, the researcher used two
econometrics methods which are ordinary least squares (OLS) and panel data
respectively. Capital structure was calculated by debt-to-asset ratio and long-term
liability rate while agency cost was measured by overhead expenses rate and asset
turnover rate. The result showed that agency cost has a slightly negative correlation to
debt-to-asset ratio, and there is a positive and insignificant correlation relationship
between long-term liability rate and agency cost.
Nirosha and Stuart (2012) in their study, set out to investigate agency costs and
ownership structure in unlisted small businesses in New Zealand. The study used panel
data to investigate agency costs, both principal-agent (PA) and principal-principal (PP),
in 240 small businesses not listed on the New Zealand Stock Exchange between, 1998-
2008 inclusive. Results showed that both forms of agency cost vary according to
industry, the life of the business and size. The results indicated the degree of owner
involvement in the business firm PA and PP agency costs. Moreover, the study found
21
nonlinear relationship between agency costs and ownership structure align with
convergence of interest hypothesis and managerial entrenchment hypothesis. It is noted
that the distortion between equity returns and debt returns gives rise to a preference for
quasi equity and distorts the productive base and effective pricing of risk. The analysis
indicated that there is considerable variability in the burden of agency cost and that this
raises the potential for regulatory and policy reforms that may enhance the productivity
and growth in the sector.
Results indicated firm’s debt has a significant impact on firms PA and PP agency costs.
However, the debt issues for smaller businesses were found to be problematic. First, the
provision of finance from banks is likely to be mechanical, requiring personal guarantees
and mortgage of family home as collateral. Second, to avoid the lower ranking equity in
case of failure, owners exhibit performance for quasi-equity. This distorts the productive
base and effective pricing of risk. This finding showed that the increase of availability
and accessibility of small firm finance can have the benefit of low PA and PP agency
conflicts.
Zhang (2009) investigated the role of capital structure and managerial incentive
compensation in controlling the free cash flow agency problem. The result of the study
suggested that debt and executives can act as substitutes in reducing the free cash flow
problem. He also pointed out that the free cash flow problem is more in the firms with
low growth prospects and mature. The usage of debt was more beneficial as a monitoring
device, and there was a negative relationship between the capital structure and free cash
flow. The study also suggested that there was a more pronounced effect in firms that had
more severe agency problem.
McKnight and Weir (2009) sought to examine the relationship between corporate
governance; ownership structure and agency cost in UK publicly traded firms. They used
three proxies to measure the agency cost which included; the ratio of sales to total assets,
the free cash flow and the firm growth prospect. The analysis showed a significant
negative relationship between the free cash flow and the debt. The result was consistent
22
with the free cash flow theory given by Jensen in 1986. According to the results, an
increase in debt reduced the free cash available to a firm and consequently reduced the
agency cost.
Lingling (2004) sought to investigate the impact of ownership structure on the debt
financing in the context of free cash flow problem on Japanese firms. In his study, he
investigated the implications of free cash flow theory in capital structure policy of listed
Japanese firms. The study focused primarily on relations between capital structure and
free cash flow. The results of the study showed that there is a negative relationship
between the free cash flow and debt, and the results was more significant for low growth
firms than the higher growth firms. The results of the study showed that the capital
structure has a disciplinary role in reducing free cash flow problem.
Tian (2002) in his study of Chinese listed firms showed that most banks having
government shared ownership had a positive relationship between capital structure and
size of managerial perquisites. These findings suggest that the role of debt on government
shared ownership does not function in China.
2.4.2 Local Evidence
In the local perspective, Chomba (2013) studied the effect of capital structure on the
corporate governance of companies listed at the Nairobi securities exchange. Results
from the study indicate that most firms in the NSE use more debt or long term liability as
a source of financing than equity capital from shareholders.
At the same time Emenyi (2013) undertook a research to establish a relationship between
agency cost and capital structure for companies listed at the Nairobi Securities Exchange.
The study found the p-value of the F test to be less than alpha (0 < .05) hence concluded
that there was a significant relationship between agency cost and capital structure.
Also, Pamba, (2013) did a study on the effect of ownership Structure and corporate
governance on capital structure decisions of firms listed on the Nairobi securities
exchange. The study found out that firms with larger board size, more independent
23
directors and managerial shareholding have a negative relationship between debts to
equity ratio. This is because, as the board size, percentage of independent director and
managerial shareholding increases they tend to bring down a firms debt to reduce risk and
bankruptcy cost.
Marietta (2012) also did research on the influence of capital structure on firms’
performance, a case of selected firms’ listed in Nairobi securities exchange, Kenya The
result of the research explains a significantly positive relationship between Equity and
return on equity and return on assets as measures of firm performance, while Debt and
firms age has a negative correlation with return on equity and return on asset.
Chelangat (2012) looked at the relationship between managerial discretion and the capital
structure of firms listed at the Nairobi Securities Exchange. The study established that
managerial discretion is indeed an important factor when it comes to long term financing
decisions. It established that managers with high discretion tended to issue more equity
than debt. According to the study, there is strong evidence that managerial discretion
does influence the capital structure of firms.
2.5 Summary of Literature Review
The literature review has shown that there exist adequate theoretical and empirical studies
that inform the agency problem; which arise because of information asymmetry and
competing interest between the principals and agents. One school of thought suggest that
the way of solving the agency problem is by increasing debt in the capital structure. This
is because these firms have to abide by the borrowing agreements of paying the principal
and interest or else they risk legal action or being declared bankrupt. Also, the lenders,
usually, monitor the activity of this organizations to ensure that their loaned funds are
well utilized and not wasted, this effect reduces agency costs incurred by shareholders.
The other school of thought holds that increasing debt does not reduce agency cost, rather
it increases agency costs. Much of the above literature, in actual fact, has a higher
concentration on firms outside Africa in general and not those in the listing at NSE.
24
Therefore, the divergent views by different researchers especially from outside Africa in
respect to agency costs, creates a knowledge gap to determine to what extent capital
structure affects the agency costs of companies listed at NSE given Kenya’s uniqueness
in terms of culture, laws and regulations. Such research will help Kenyan firms to
institute appropriate mechanisms to cushion themselves from the effect of conflict of
interests between managers and shareholders.
25
CHAPTER THREE
RESEARCH METHODOLOGY
3.1 Introduction
This chapter specifies the methods and procedures that were employed in this study. It
ensures that data collected related to the objectives of the study and that data analysis
yielded results that answered the research questions.
3.2 Research Design
This research utilized a descriptive design in its methodology. The design was used to
establish a relationship between agency costs and capital structure of firms listed in the
NSE. The research design is a plan, structure and strategy of investigation so conceived
as to obtain answers to research questions or problems (Kumar, 2005).
A research design is an understanding of conditions for collection and analysis of data in
a way that combines their relationships with the research to the economy of procedures
(Chandran, 2004). This study used a correlation design. A correlation design is used to
examine the relationship between two or more variables (William, 2011). Given that the
study was seeking to assess the relationship between agency costs and capital structure of
firms listed in the NSE in Kenya, a descriptive design was selected for the study.
3.3 Population
For the purpose of this study, the population was from all the 61 companies quoted at the
Nairobi securities exchange as at 31st December 2013, (appendix 1). The period of
research was year 2009-2013 inclusive. The study was limited to companies listed at the
NSE because of greater availability, accessibility and reliability of data than those of
private companies, unlisted companies and parastatals.
26
3.4 Data Collection
For the purpose of this study, secondary data was utilized; data was extracted from
financial annual reports of all companies listed at the NSE for the period under study. The
financial reports were obtained from the NSE data bank. The following reports were
extracted for each company in the sample; Annual sales, Total annual overheads
expenses, Total long term liabilities at end of each year, Total assets at end of each year.
3.5 Data Analysis
Statistical Package for Social Scientist (SPSS version 14) was used to aid in analyzing
data. The F-test was used to measure the association between the dependent and
independent variables while regression analysis was applied to determine the effect of
capital structure on the agency costs. A simple regression was used to test the main model
and t-test used as a test of significance.
According to Baker and Powell (2005), there are two types of agency costs, direct and
indirect agency costs. Shareholders incur direct costs in order to reduce potential conflicts
with managers. This is bonus stocks options plans; audit fees, managerial incentives and
infrastructure put in place to control the behavior of managers. Indirect costs results from
managers failure to make profitable investments due to risk aversion, managers exerting
insufficient work efforts, poor investment decisions, choosing inputs and outputs that suit
their preferences, executive perquisites. The risk that agents will use organizational
resources for their own benefits.
3.5.1 Analytical Model
The analysis of data was achieved through the use of Statistical Package for Social
Scientists (SPSS). This was to answer the research questions and explain the
associations and dependencies between the variables of the study. Multivariate
regression analysis resulted in a prediction equation that describes the relationship
between a dependent variable and independent variables (Gujarati, 2000).
27
The model is as explained below:
Y= β0 + β1ΧI+β2Χ2++ β3Χ3+ ε
Where:
Y = is the agency cost measured using indirect costs, that’ is the value lost by
shareholders due to managers exerting insufficient effort and making decisions that suit
their own selfish interests. The cost will be determined by using efficiency ratio.
Efficiency ratio = Annual overhead expenses/Annual sales.
β0 = the intercept and the constant to the equation reflecting agency cost that doesn’t
depend on the company structure.
ΧI, = Capital structure measured by long term debt to equity ratio = Long term
debt/Equity.
Χ2, = Information asymmetry as measured by Market value of shares/Book value of
shares.
Χ3, = Ownership concentration as measured by percentage of large scale shareholders.
Percentage of large scale shareholders = Large investor (institutional investors)
shareholding/Total equity.
βi = The sensitive coefficient that show the change in the agency cost due to a unit
change in the independent variables.
ε = Is the error term of the model and captures the estimation errors and errors due to
omission of other variables that affect agency cost apart from the capital structure.
3.5.2 Test of Significance
The study used Pearson correlation coefficient (r), analysis of variance (ANOVA) and F-
test to test for significance. The Pearson correlation co-efficient (r) is a measure the
strength and direction of the linear relationship between two variables, describing the
direction and degree to which one variable is linearly related to another. Its value ranges
28
between +1 and −1 inclusive, where 1 is total positive correlation, 0 is no correlation, and
−1 is total negative correlation.
The F-test is used to test if the variances of two populations are equal which can be two-
tailed test or a one-tailed test and the appropriateness of the multiple regression models.
A significant F indicates a linear relationship between Y and at least one of the X's. It is
used when the sample size is small i.e. n < 30.The ANOVA test is used to determine the
impact independent variables have on the dependent variable in a regression analysis.
29
CHAPTER FOUR
DATA ANALYSIS, RESULTS AND FINDINGS
4.1 Introduction
This chapter presents data analysis and interpretation of the research findings. The
chapter examines, categorizes, and tabulates the evidence so as to address the study’s
objective. The study sought to establish the relationship between capital structure and
agency costs for firms listed at the Nairobi Securities Exchange. The sample comprised
of all the firms listed at the Nairobi Securities Exchange in the period 1st January 2009
31st December 2013.The analysis of regressions, results and the findings of the study are
respectively discussed.
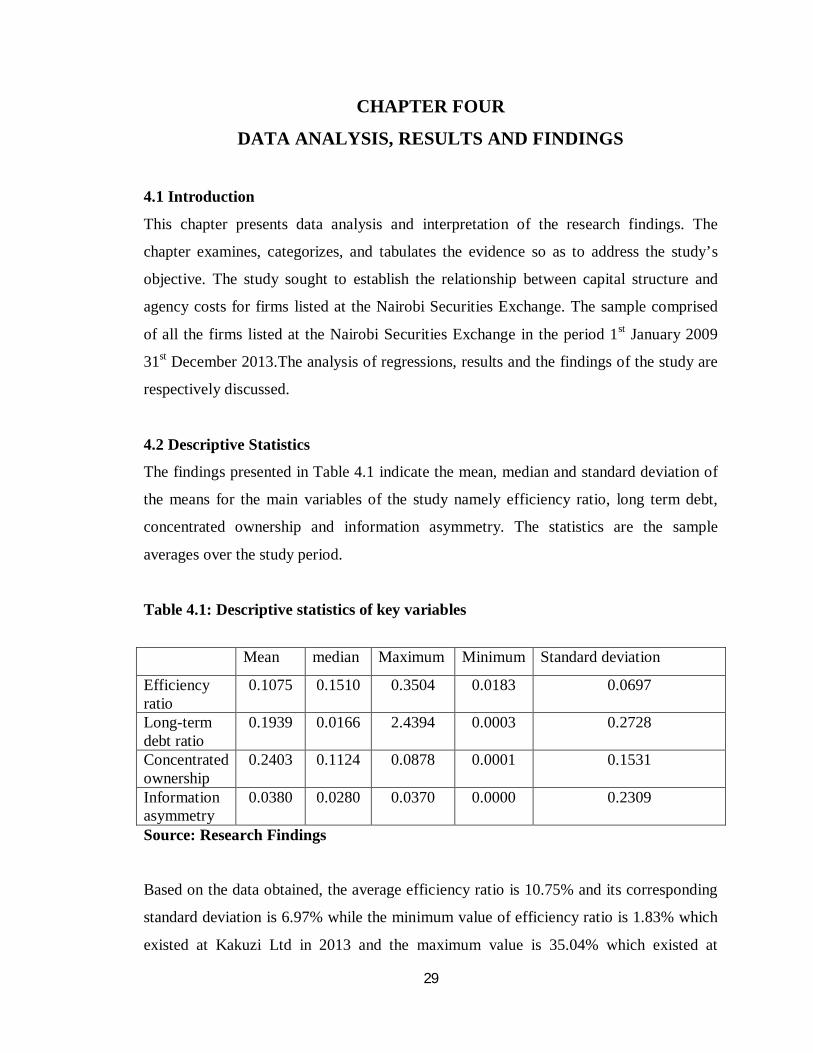
4.2 Descriptive Statistics
The findings presented in Table 4.1 indicate the mean, median and standard deviation of
the means for the main variables of the study namely efficiency ratio, long term debt,
concentrated ownership and information asymmetry. The statistics are the sample
averages over the study period.
Table 4.1: Descriptive statistics of key variables
Mean median Maximum Minimum Standard deviation
Efficiency ratio
0.1075 0.1510 0.3504 0.0183 0.0697
Long-term debt ratio
0.1939 0.0166 2.4394 0.0003 0.2728
Concentrated ownership
0.2403 0.1124 0.0878 0.0001 0.1531
Information asymmetry
0.0380 0.0280 0.0370 0.0000 0.2309
Source: Research Findings
Based on the data obtained, the average efficiency ratio is 10.75% and its corresponding
standard deviation is 6.97% while the minimum value of efficiency ratio is 1.83% which
existed at Kakuzi Ltd in 2013 and the maximum value is 35.04% which existed at
30
Safaricom limited in 2009.The long term debt is arrived at in an average of 19.39% and a
standard deviation of 27.28% while the maximum value of the long term debt ratio is
0.03% that existed at Longhorn Kenya Ltd in 2013 and a maximum value of 243.9% that
existed at East African Breweries Ltd in 2009.
4.3 Inferential Statistics
The findings of both regression analysis to test the existence a relationship between the
variables and correlation analysis to test the direction and strength of the relationships
between agency costs, capital structure, ownership concentration and information
asymmetry are hereby as discussed below.
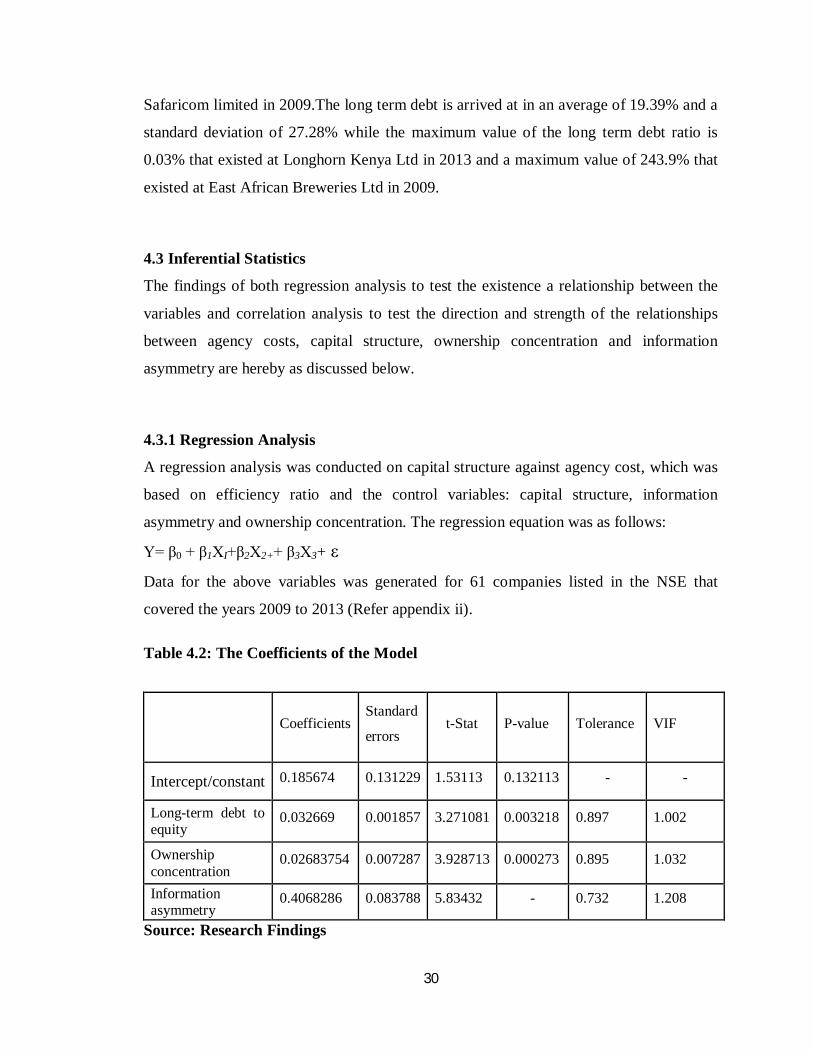
4.3.1 Regression Analysis
A regression analysis was conducted on capital structure against agency cost, which was
based on efficiency ratio and the control variables: capital structure, information
asymmetry and ownership concentration. The regression equation was as follows:
Y= β0 + β1ΧI+β2Χ2++ β3Χ3+ ε
Data for the above variables was generated for 61 companies listed in the NSE that
covered the years 2009 to 2013 (Refer appendix ii).
Table 4.2: The Coefficients of the Model
Coefficients Standard
errors t-Stat P-value Tolerance VIF
Intercept/constant 0.185674 0.131229 1.53113 0.132113 - -
Long-term debt to equity
0.032669 0.001857 3.271081 0.003218 0.897 1.002
Ownership concentration
0.02683754 0.007287 3.928713 0.000273 0.895 1.032
Information asymmetry
0.4068286 0.083788 5.83432 - 0.732 1.208
Source: Research Findings
31
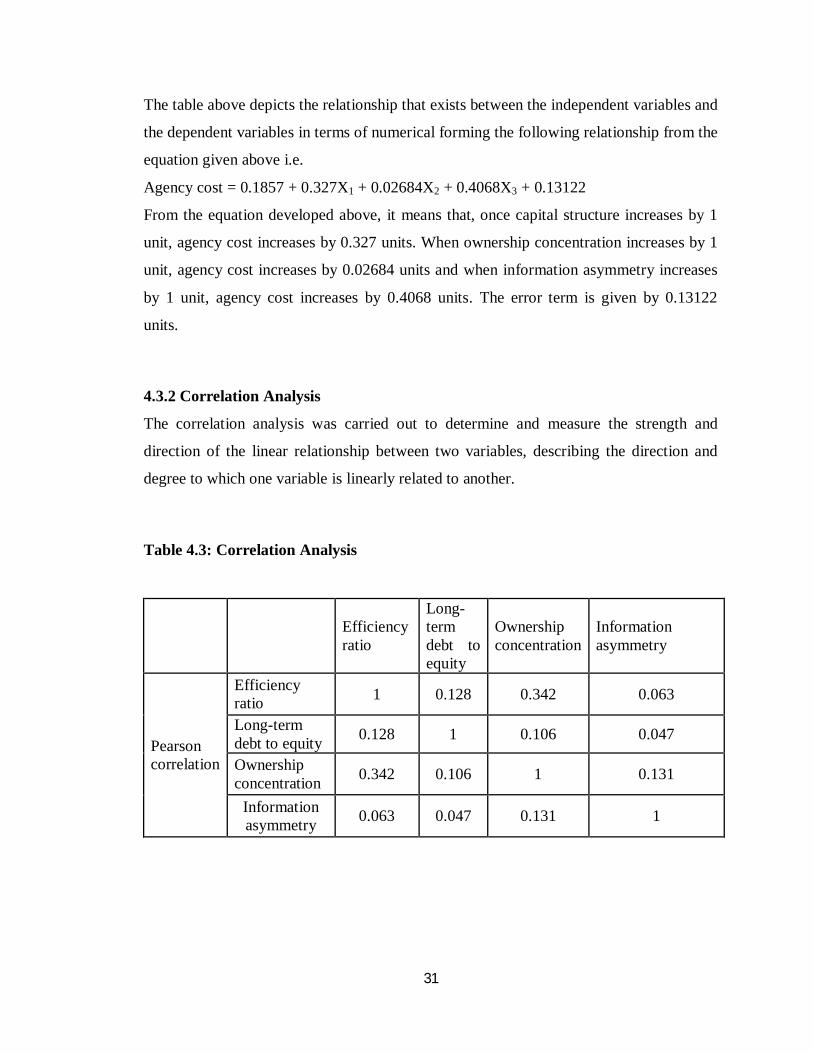
The table above depicts the relationship that exists between the independent variables and
the dependent variables in terms of numerical forming the following relationship from the
equation given above i.e.
Agency cost = 0.1857 + 0.327X1 + 0.02684X2 + 0.4068X3 + 0.13122
From the equation developed above, it means that, once capital structure increases by 1
unit, agency cost increases by 0.327 units. When ownership concentration increases by 1
unit, agency cost increases by 0.02684 units and when information asymmetry increases
by 1 unit, agency cost increases by 0.4068 units. The error term is given by 0.13122
units.
4.3.2 Correlation Analysis
The correlation analysis was carried out to determine and measure the strength and
direction of the linear relationship between two variables, describing the direction and
degree to which one variable is linearly related to another.
Table 4.3: Correlation Analysis
Efficiency ratio
Long-term debt to equity
Ownership concentration
Information asymmetry
Pearson correlation
Efficiency ratio 1 0.128 0.342 0.063
Long-term debt to equity 0.128 1 0.106 0.047
Ownership concentration 0.342 0.106 1 0.131
Information asymmetry 0.063 0.047 0.131 1
32
Efficiency ratio
Long-term debt to equity
Ownership concentration
Information asymmetry
P value
Efficiency ratio 1 0.078 0.011 0.328
Long-term debt to equity 0.078 1 0.169 0.226
Ownership concentration 0.011 0.169 1 0.078
Information asymmetry 0.328 0.226 0.078 1
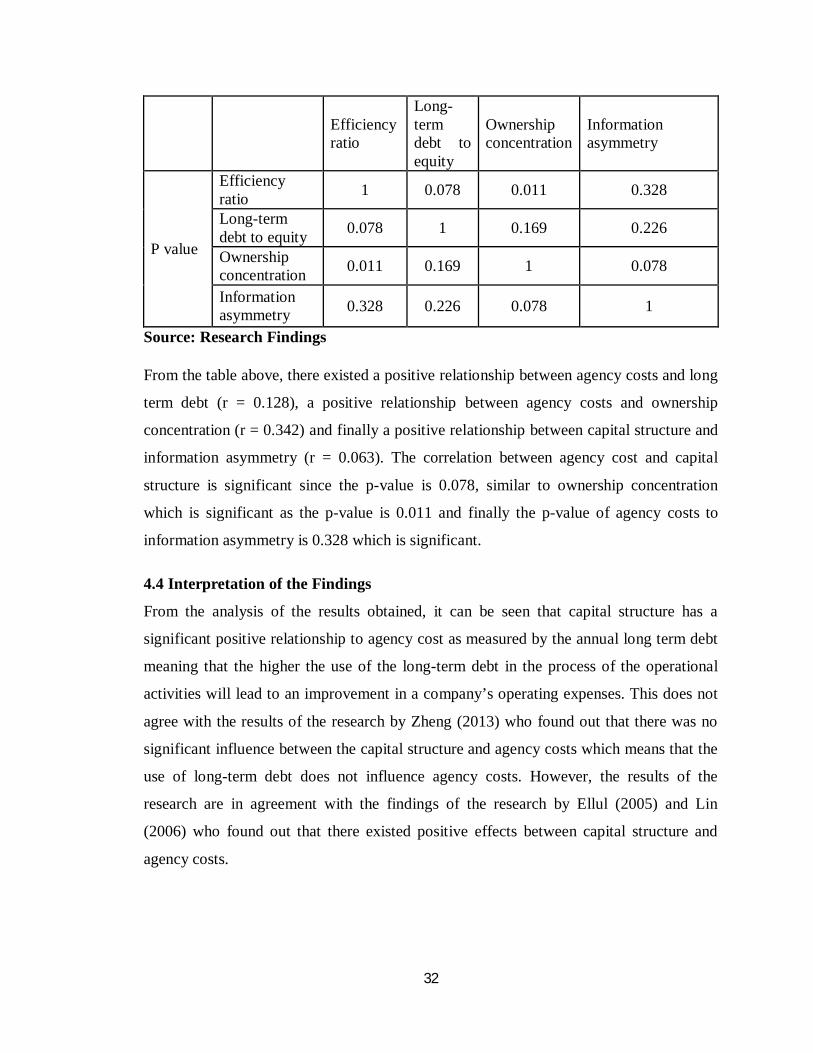
Source: Research Findings
From the table above, there existed a positive relationship between agency costs and long
term debt (r = 0.128), a positive relationship between agency costs and ownership
concentration (r = 0.342) and finally a positive relationship between capital structure and
information asymmetry (r = 0.063). The correlation between agency cost and capital
structure is significant since the p-value is 0.078, similar to ownership concentration
which is significant as the p-value is 0.011 and finally the p-value of agency costs to
information asymmetry is 0.328 which is significant.
4.4 Interpretation of the Findings
From the analysis of the results obtained, it can be seen that capital structure has a
significant positive relationship to agency cost as measured by the annual long term debt
meaning that the higher the use of the long-term debt in the process of the operational
activities will lead to an improvement in a company’s operating expenses. This does not
agree with the results of the research by Zheng (2013) who found out that there was no
significant influence between the capital structure and agency costs which means that the
use of long-term debt does not influence agency costs. However, the results of the
research are in agreement with the findings of the research by Ellul (2005) and Lin
(2006) who found out that there existed positive effects between capital structure and
agency costs.
33
The use of long-term debt allows the managers of various companies to manage the funds
as the operations of the companies or investment activities in the future due to the
overdue refunds provided long enough. This means that with an increase in the
operational activities of the company, the cost of operation will also increase. The use of
long-term debt provides an opportunity for the managers to do much beyond the
providers of the funds that are used in the unilateral benefit without the consent of the
owners (Zheng 2013). The use of long term debt will make the managers of various
companies manage the funds effectively and hence play in debts righteously.
34
CHAPTER FIVE
SUMMARY, CONCLUSION AND RECOMMENDATIONS
5.1. Introduction
This chapter presents the summary, conclusions and recommendations derived from the
findings of the study. The chapter presents a brief summary of the study; conclusions;
limitations of the study; and recommendations.
5.2 Summary
The objective of the study was to investigate the relationship between capital structure
and agency cost of listed companies at the Nairobi Securities Exchange. The following
research question guided the study: how does the capital structure relate to agency costs
of listed firms? In answering this question, the study applied historical data to get the
efficiency ratio, long term debt ratio, information asymmetry and ownership
concentration ratios, the historical data of all these ratios were obtained from the Nairobi
Securities Exchange and the Capital Markets Authority data banks. The key findings
revealed that there positive correlation between capital structure and agency costs
5.3 Conclusion
This paper selects all the 61 listed companies from the Nairobi Securities exchange
during the five-year period from 2009 to 2013, studies the relationship between the
capital structure and the agency cost. Capital structure is calculated by the long-term debt
to equity ratio while the agency cost is measured by the efficiency ratio which is obtained
from the annual overhead expenses to the sales ratio. The hypothesis is used in
establishing the multiple regression models (Analytical model), which is then used in
carrying out an empirical analysis. The results show that, long-term debt to equity ratio
has significant and positive effect on the on the agency cost which is measured by the
efficiency ratio. Wang (2010) capital structure has the most effect on the agency cost
measured by the efficiency ratio. The increase in the debt of the company so as to fund its
operations or to expand its operation will lead to the production of a load of operations in
any firm. Coupled with the increased operations of the company, the need for monitoring
35
so that an increase in the costs that are incurred for the increased operational activities
will be allocated efficiently.
5.4 Recommendations for Policy
From the analysis carried out and the discussion obtained, there are suggestions that can
be given for further research. By applying this suggestion, future research on the
relationship between capital structure and agency costs will be relative. Given that it is
now evident that capital structure positively affects agency costs of listed firms at the
Nairobi Securities Exchange, firms should formulate incentive schemes for managers to
reduce agency costs with an increase in the use of debt in the firms capital structure.
Looking forward, by identifying the use of inappropriate estimation techniques as an
important reason why there is no consensus in the literature about the shape of the capital
structure-agency costs relationship, this study serves as a first attempt towards
establishing a more pragmatic empirical model for agency cost modeling and its
determinants. However, there is still scope for further methodological improvements on
agency cost modeling.
5.5 Limitations of the Study
There are factors that impede satisfactory results to be obtained. The study was conducted
on 61 listed companies only. This makes the sample size too low, and it will not reflect
the private sector as the companies researched are only public companies. Also the period
of research from 2009 until 2013 is another limiting factor. The five year period covered
is not enough period to provide conclusive results as to the effect of capital structure on
agency costs. The other limiting factor is the number of independent variables that were
used in the model that affects the agency costs, in this study capital structure, information
asymmetry and ownership concentration variables were used, these variables can be
expounded to include other key variables apart from the once used to show how they
also affect agency costs. The other limitation is how to measure agency costs, there is no
universally accepted way of measuring agency costs, this is because agency costs can be
measured either directly or indirectly.
36
5.6. Areas for Further Research
A promising avenue for research is to consider potential interrelations between the
alternative mechanisms of agency cost controls available to firms as well as interactions
between capital structure and environmental or other internal organizational factors. A
fruitful area for future research would also be to examine the effect of other variables
apart from information asymmetry and concentration ownership that were used in this
research, to find out how these other variables affects agency costs. Also another area of
research will be to examine the effect of capital structure of firms not listed at the Nairobi
Securities Exchange, this will include private businesses and parastatals which were
beyond the scope of this study and can hence be left to further research.
37
REFERENCES
Ang, S. J., Cole, R. A., & Lin, J. W. (2000). Agency costs and ownership structure. The
Journal of Finance, 55(1), 81-106.
Baker, H. K., & Anderson, R. (2010). Corporate governance: a synthesis of theory,
research and practice. John Wiley and Sons, Hoboken, New Jersey.
Baker, K., & Powell, G. (2005). Understanding financial management. Business and
economics. PP, 4.
Barclay, M. J., & Clifford, G. H. (1991). Negotiated block trades and corporate control,
Journal of Finance, 46, 861-878.
Beiner, S., Drobetz, W., Schmid, F., & Zimmermann, H. (2004). An Integrated
Framework of Corporate Governance and Firm Valuation: Evidence from
Switzerland, ECGI paper 34/2004.
Berger, A. L., & Patti, E. B. (2003). Capital structure and firm performance: A new
approach to testing agency theory & an application to the banking industry.
Finance and economic discussion series 2002-54.
Berle, A. A. & Means, G. (1932). The modern corporation and private properly. New
York: Macmillan.
Booth, L., Aivazian, V., Demirguc-Kunt, A., & Maksmivoc, V. (2001). Capital structures
in developing countries, Journal of Finance, 56, 87-130.
Brealey, R. A., & Meyers, S. C. (2003). Principals of corporate finance, 7th edition: Burr
Ridge IL: Irwin MC Graw-Hill 2-34.
38
Byrd, J. & Hickman, K. (1992). Do outside directors monitor managers. Evidence from
takeover bids. Journal of Financial Economics, 32, 195–221.
Chelangat, M. L. (2012). The relationship between managerial discretion and the capital
structure of firms listed at the Nairobi Securities Exchange; Unpublished research
Project Report, University of Nairobi.
Chen, C. (2003). Investment Opportunities and the Relation between Equity Value and
Employees' Bonus. Journal of Business Finance and Accounting, 30, 941-974.
Chen, C. R., Guo, W., & Mande, V. (2006). Corporate value, managerial stockholdings
and investments of Japanese firms. Journal of International Financial
Management & Accounting, 17(1), 29-51.
Chomba, C. (2013). Effect of capital structure on the corporate governance of companies
listed at the Nairobi securities exchange; Unpublished research Project Report,
University of Nairobi.
Core, J. E., Guay, W., & Larcker, D. (2001). Executive equity compensation and
incentives: a survey. Working paper, University of Pennsylvania.
De Angelo, H., & Masulis, R. W. (1980). Optimal capital structure under corporate and
personal taxation. Journal of Financial Economics, 8, 3-29.
Diamond, D. (1991). Monitoring and Reputation: The Choice between Bank Loans and
Directly Placed Debt. Journal of Political Economy, 99, 689-721.
Douglas, A. (2002). Capital structure and the control of managerial incentives. Journal of
corporate finance, 8 (2), 287-311.
39
Eisenberg, T., Sundgren, S., & Wells, T. (1998). Larger board size and decreasing firm
Value in small firms. Journal of Financial Economics, 48, 35-54.
Emenyi, C. A. (2013).Relationship between agency cost and capital structure for
companies listed at the Nairobi Securities Exchange; Unpublished research
Project Report, University of Nairobi.
Esterbrook, F. (1984). Two agency cost explanation of dividends. American economic
review. 74:650-659.
Fama, E. F., & Jensen, M. (1983). Separation of ownership and control. Journal of Law
and Economics, 88, 301-325.
Fontrodonona, J., & Sison, A. J. (2006). The nature of the firm, agency theory and
shareholder theory: a critique from philosophical anthropology. Journal of
Business Ethics, 66(1), 33-42.
Gomes, A. (2000). Going Public without Governance: Managerial Reputation Effects.
Journal of Finance 55, 615-646.
Grossman, J., & Hart, O. (1988). One share-one vote and the market for corporate
control. Journal of Financial Economics, 20, 175–202.
Grossman, S., & Olivier, H. (1982). Corporate financial structure & managerial
incentives. The economics of information & uncertainty. 123-155.
Gui, F., & Tsui, J. (2001). Free cash flow, debt, monitoring and audit pricing: Further
evidence on the role of director equity ownership. Auditing. A journal of practice
and theory, 20 (2).
40
Harris, M., & Raviv, A. (1991). The theory of capital structure. Journal of Finance, 49,
297-355.
Hermalin, B., & Weisbach, M. (1991). The effects of board composition and direct
incentives on firm performance. Financial Management, 20, 101-12.
Hoque, Z. (2006). Methodological issues in accounting Research: Theories and methods.
Spiramus press Ltd, 2006.
Hortlund, P. (2005). The long term relationship between capital & earnings in the
banking industry. Working paper series in economics and finance. 611.
Jensen, M. C., & Meckling, W. H. (1976). Theory of the firms: managerial behavior,
agency costs and ownership structure. Journal of Financial Economics, 3, 881-
880.
Jensen, M. (1986). Agency cost of free cash flow. Corporate finance takeovers. America
economic review 76:323-330.
Jensen, M. C., & Meckling, W. H. (1992). Specific and general knowledge, and
organization structure. Journal of Applied Corporate finance, 8(2), 4-18.
Johan, W. (2002). Ownership & Agency costs. School of economics & commercial law.
Goteborg.
Kochhar, R. (1997). Strategic asset: capital structure and firm performance. Journal of
Financial & strategic decisions, 10(3).
Li, H. & Cui, L. (2003). Empirical study of capital structure and agency cost of Chinese
41
listed firms. Nature and science, 1(1).
Lin, S., Pope, P. & Young, S. (2003). Stock market reaction to the appointment of outside
directors. Journal of Business Finance and Accounting, 30, 351-382.
Lingling, W. (2004). The impact of ownership structure on debt financing of Japanese
firms with the agency cost of free cash flow. EFMA 2004 Basel Meetings Paper,
1-56.
Mahar, J. (1998). Identification and investigation of high cash firms. Pennsylvania State
University, Pennsylvania.
McColgan, P. (2001).The simultaneous determination of managerial ownership,
corporate performance and financial analysis coverage in the UK, University of
Strathcyde. Glasgow UK.
McKnight, P. J., & Weir, C. (2009). Agency costs, corporate governance mechanisms
and ownership structure in large UK publicly quoted companies: A panel data
analysis. The Quarterly Review of Economics and Finance, 49, 139-158.
Marietta, M. S. (2012).The influence of capital structure on firms’ performance: a case of
selected firms’ listed in Nairobi securities exchange, Kenya; Unpublished
research Project Report, University of Nairobi.
Mengmeng, Z. (2013). Empirical research of the impact of capital structure on agency
Costs of Chinese Listed companies, Journal of economics and finance, 5(10),
118-125.
Moldoveanu, M., & Martin, R. (2001).Agency theory and design of efficient governance
mechanisms. Working Paper. Rotman School of business.
42
Nairobi Stock Exchange website (https://www.nse.co.ke).
Nirosha, H. W., & Stuart, L. (2013). An empirical investigation of agency costs and
ownership structure of unlisted businesses. Journal of applied business research,
10(2), 38-48.
Papa, G., & Speciale, B. (2007). An inverted u relationship between financial capital
structure and managerial compensation University college of London.
Pearce, J. A., & Zahra, S. A. (1991). The relative power of CEOs and boards of directors:
associations with corporate performance. Strategic Management Journal, 12, 135
53.
Richardson, S. (2005). Over investment of free cash flows. Cream University of
Pennsylvania. Philadelphia.
Rosenstein, S., & Wyatt, J. C. (1990). Outside directors, board effectiveness and
shareholder wealth. Journal of Financial Economics, 26, 175-191.
Ross, S. A. (1977). The determination of financial structure: the incentive signaling
approach. Bell Journal of Economics and Management Science, 8, 23-40.
Shi, H., & Song, X. (2011). Overview and analysis of capital structure and output
markets competition using agency costs theory. Paper presented at the Artificial
Intelligence, Management Science and Electronic Commerce (AIMSEC), 2nd
International Conference on (pp. 3160-3163).
Shleifer, A., & Vishny, R. W. (1997). A survey of corporate governance. Journal of
Finance, 52, 737-784.
Smith, C. W., & Watts, L. (1992). The investment opportunity set and corporate
43
financing, dividend and compensation policies. Journal of Financial Economics,
32, 263-292.
Stulz, R. (1990). Managerial Discretion and Optimal Financing Policies. Journal of
Financial Economics, 26, 3-28.
Tian et al. (2007). Capital Structure and Corporate Performance Genetics. A model of
corporate financing decisions. 177(2), 1173-1192.
Vasiliou, D., Eritrios, N. & Daskalakis, N. (2005). The determinants of capital structure:
Evidence from the Greek Market.
Wang, G. Y. (2010). The Impacts of Free Cash Flows and Agency Costs on Firm
Performance. Journal of Service Science and Management, 3(4), 408-418.
Weisbach, M. (1988). Outside directors and CEO turnover. Journal of Financial
Economics, 20, 431-60.
Westphalem, M. (2002). Optimal capital structure with Agency cost of free cash flow.
University of Lausanne & Fame.
Zhang, Y. (2009). Are debt and incentive compensation substitutes in controlling the free
cash flow agency problem? Financial Management, 38(3), 507-541.
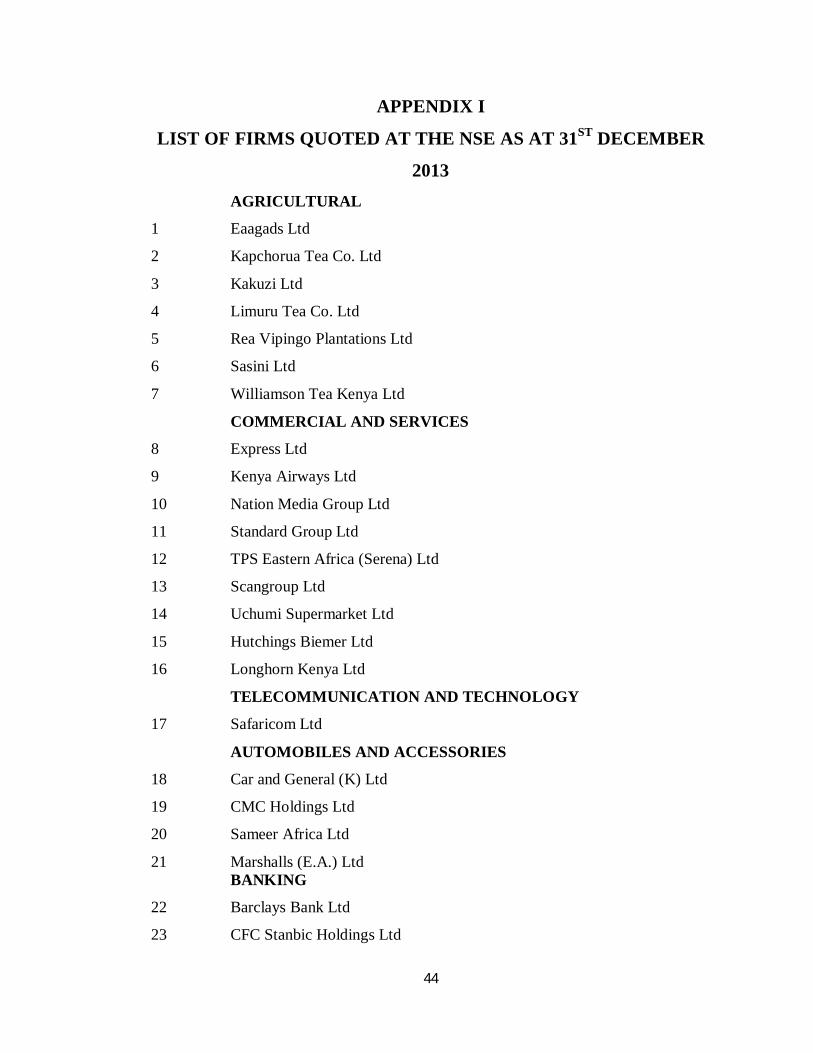
44
APPENDIX I
LIST OF FIRMS QUOTED AT THE NSE AS AT 31ST DECEMBER
2013 AGRICULTURAL
1 Eaagads Ltd
2 Kapchorua Tea Co. Ltd
3 Kakuzi Ltd
4 Limuru Tea Co. Ltd
5 Rea Vipingo Plantations Ltd
6 Sasini Ltd
7 Williamson Tea Kenya Ltd
COMMERCIAL AND SERVICES
8 Express Ltd
9 Kenya Airways Ltd
10 Nation Media Group Ltd
11 Standard Group Ltd
12 TPS Eastern Africa (Serena) Ltd
13 Scangroup Ltd
14 Uchumi Supermarket Ltd
15 Hutchings Biemer Ltd
16 Longhorn Kenya Ltd
TELECOMMUNICATION AND TECHNOLOGY
17 Safaricom Ltd
AUTOMOBILES AND ACCESSORIES
18 Car and General (K) Ltd
19 CMC Holdings Ltd
20 Sameer Africa Ltd
21 Marshalls (E.A.) Ltd BANKING
22 Barclays Bank Ltd
23 CFC Stanbic Holdings Ltd
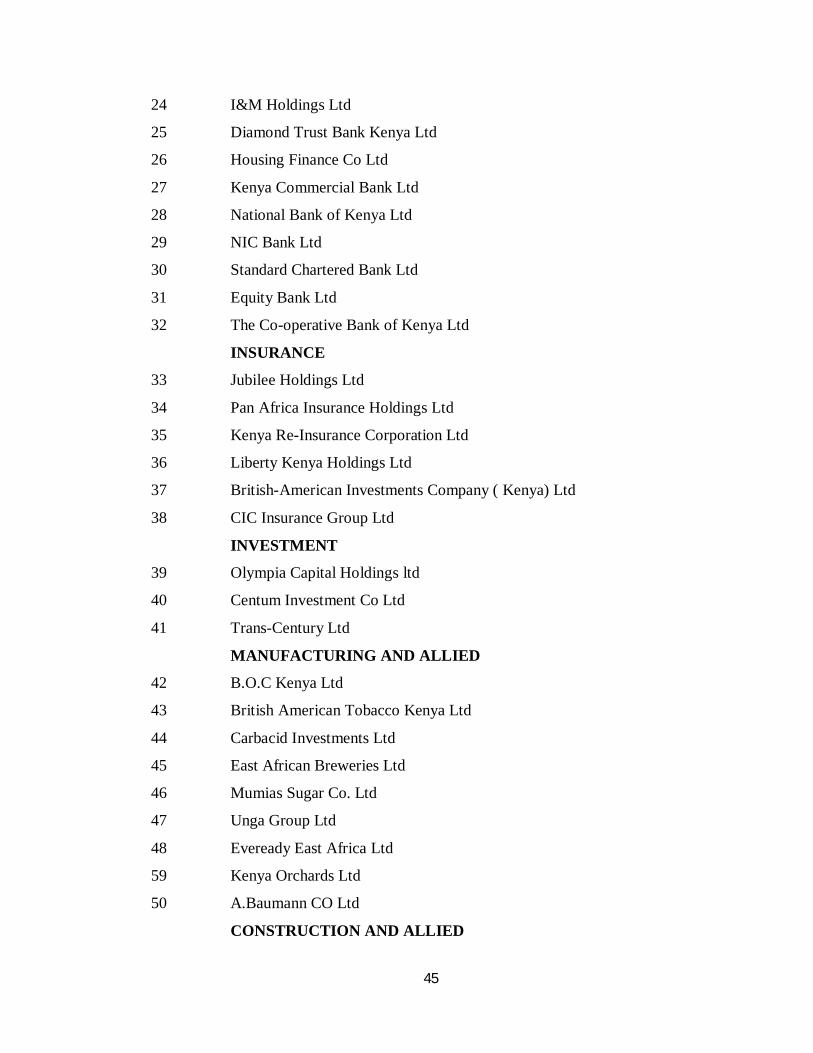
45
24 I&M Holdings Ltd
25 Diamond Trust Bank Kenya Ltd
26 Housing Finance Co Ltd
27 Kenya Commercial Bank Ltd
28 National Bank of Kenya Ltd
29 NIC Bank Ltd
30 Standard Chartered Bank Ltd
31 Equity Bank Ltd
32 The Co-operative Bank of Kenya Ltd
INSURANCE
33 Jubilee Holdings Ltd
34 Pan Africa Insurance Holdings Ltd
35 Kenya Re-Insurance Corporation Ltd
36 Liberty Kenya Holdings Ltd
37 British-American Investments Company ( Kenya) Ltd
38 CIC Insurance Group Ltd
INVESTMENT
39 Olympia Capital Holdings ltd
40 Centum Investment Co Ltd
41 Trans-Century Ltd
MANUFACTURING AND ALLIED
42 B.O.C Kenya Ltd
43 British American Tobacco Kenya Ltd
44 Carbacid Investments Ltd
45 East African Breweries Ltd
46 Mumias Sugar Co. Ltd
47 Unga Group Ltd
48 Eveready East Africa Ltd
59 Kenya Orchards Ltd
50 A.Baumann CO Ltd
CONSTRUCTION AND ALLIED
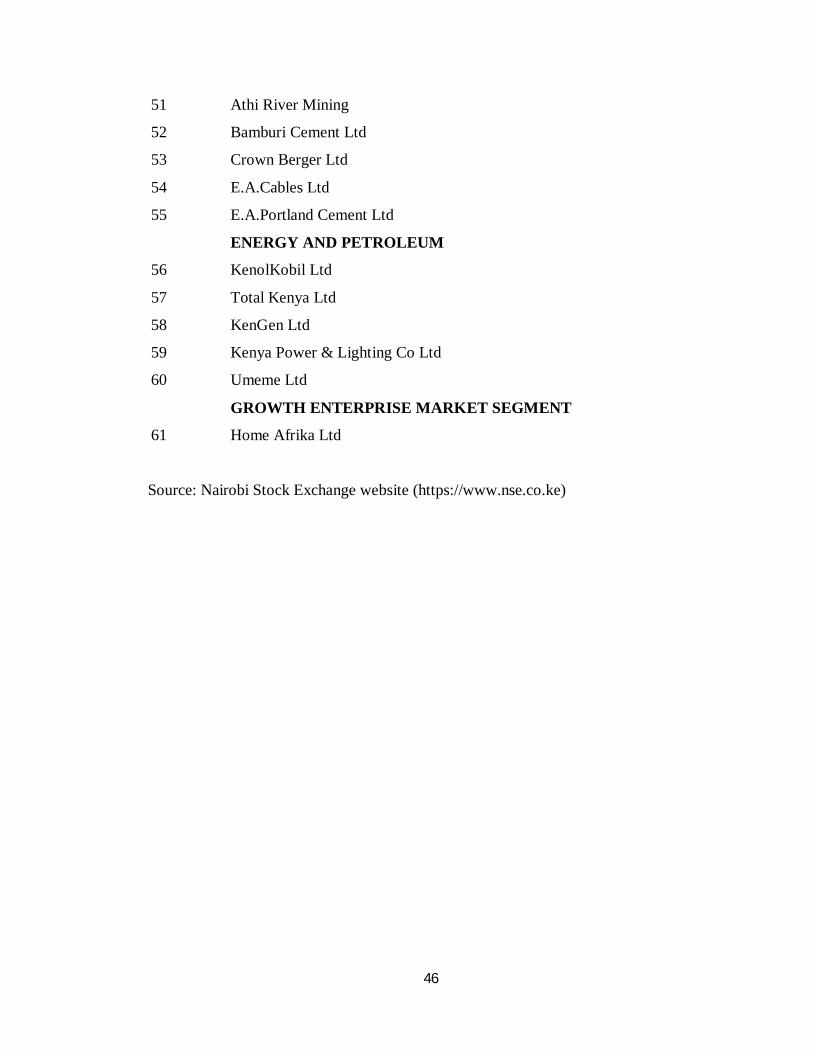
46
51 Athi River Mining
52 Bamburi Cement Ltd
53 Crown Berger Ltd
54 E.A.Cables Ltd
55 E.A.Portland Cement Ltd
ENERGY AND PETROLEUM
56 KenolKobil Ltd
57 Total Kenya Ltd
58 KenGen Ltd
59 Kenya Power & Lighting Co Ltd
60 Umeme Ltd
GROWTH ENTERPRISE MARKET SEGMENT
61 Home Afrika Ltd
Source: Nairobi Stock Exchange website (https://www.nse.co.ke)
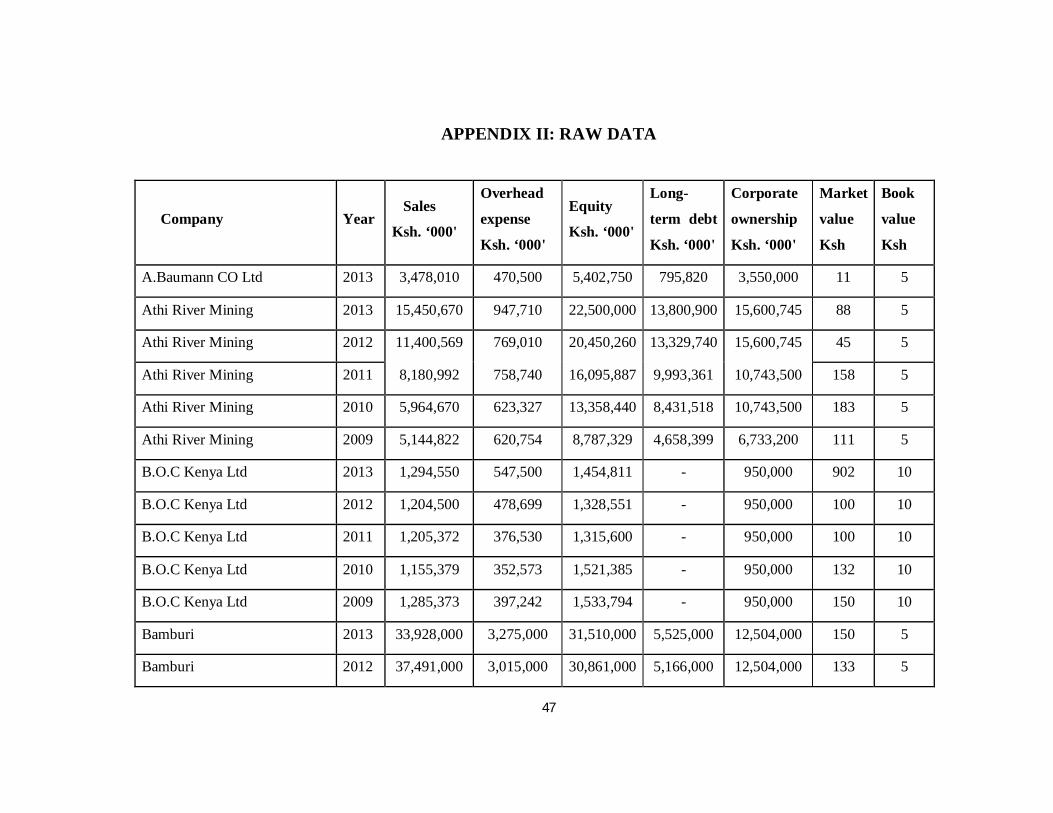
47
APPENDIX II: RAW DATA
Company Year Sales
Ksh. ‘000'
Overhead
expense
Ksh. ‘000'
Equity
Ksh. ‘000'
Long-
term debt
Ksh. ‘000'
Corporate
ownership
Ksh. ‘000'
Market
value
Ksh
Book
value
Ksh
A.Baumann CO Ltd 2013 3,478,010 470,500 5,402,750 795,820 3,550,000 11 5
Athi River Mining 2013 15,450,670 947,710 22,500,000 13,800,900 15,600,745 88 5
Athi River Mining 2012 11,400,569 769,010 20,450,260 13,329,740 15,600,745 45 5
Athi River Mining 2011 8,180,992 758,740 16,095,887 9,993,361 10,743,500 158 5
Athi River Mining 2010 5,964,670 623,327 13,358,440 8,431,518 10,743,500 183 5
Athi River Mining 2009 5,144,822 620,754 8,787,329 4,658,399 6,733,200 111 5
B.O.C Kenya Ltd 2013 1,294,550 547,500 1,454,811 - 950,000 902 10
B.O.C Kenya Ltd 2012 1,204,500 478,699 1,328,551 - 950,000 100 10
B.O.C Kenya Ltd 2011 1,205,372 376,530 1,315,600 - 950,000 100 10
B.O.C Kenya Ltd 2010 1,155,379 352,573 1,521,385 - 950,000 132 10
B.O.C Kenya Ltd 2009 1,285,373 397,242 1,533,794 - 950,000 150 10
Bamburi 2013 33,928,000 3,275,000 31,510,000 5,525,000 12,504,000 150 5
Bamburi 2012 37,491,000 3,015,000 30,861,000 5,166,000 12,504,000 133 5
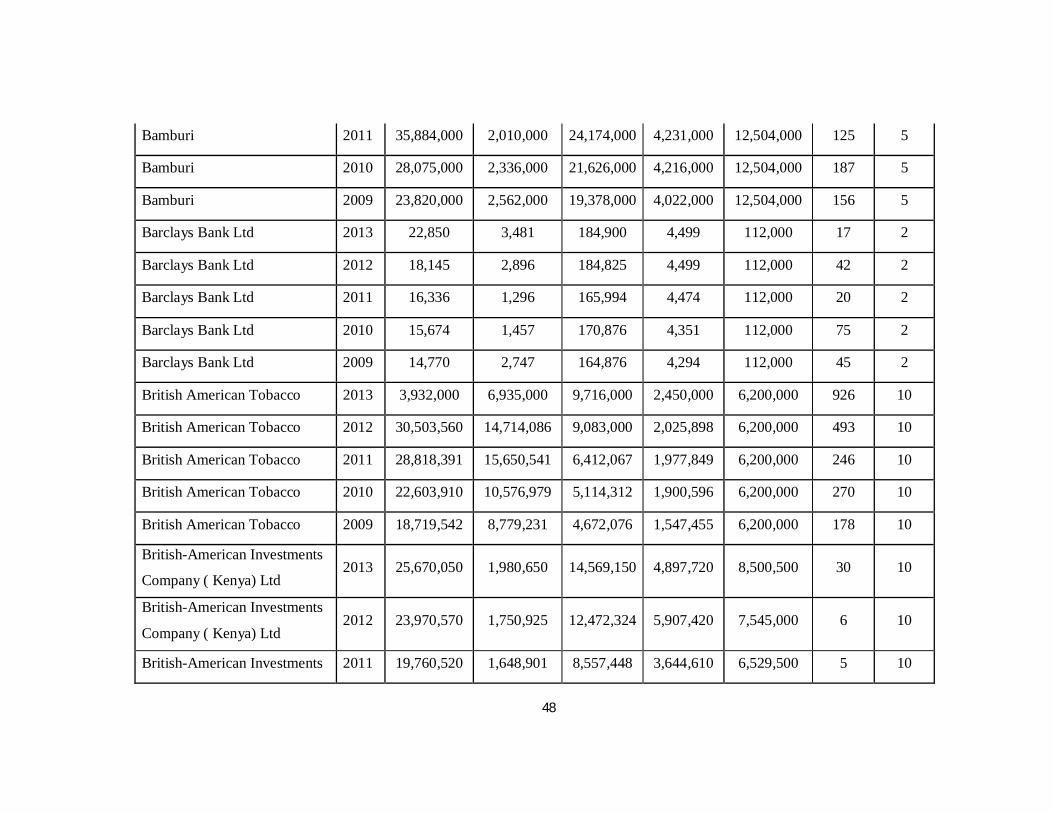
48
Bamburi 2011 35,884,000 2,010,000 24,174,000 4,231,000 12,504,000 125 5
Bamburi 2010 28,075,000 2,336,000 21,626,000 4,216,000 12,504,000 187 5
Bamburi 2009 23,820,000 2,562,000 19,378,000 4,022,000 12,504,000 156 5
Barclays Bank Ltd 2013 22,850 3,481 184,900 4,499 112,000 17 2
Barclays Bank Ltd 2012 18,145 2,896 184,825 4,499 112,000 42 2
Barclays Bank Ltd 2011 16,336 1,296 165,994 4,474 112,000 20 2
Barclays Bank Ltd 2010 15,674 1,457 170,876 4,351 112,000 75 2
Barclays Bank Ltd 2009 14,770 2,747 164,876 4,294 112,000 45 2
British American Tobacco 2013 3,932,000 6,935,000 9,716,000 2,450,000 6,200,000 926 10
British American Tobacco 2012 30,503,560 14,714,086 9,083,000 2,025,898 6,200,000 493 10
British American Tobacco 2011 28,818,391 15,650,541 6,412,067 1,977,849 6,200,000 246 10
British American Tobacco 2010 22,603,910 10,576,979 5,114,312 1,900,596 6,200,000 270 10
British American Tobacco 2009 18,719,542 8,779,231 4,672,076 1,547,455 6,200,000 178 10
British-American Investments
Company ( Kenya) Ltd 2013 25,670,050 1,980,650 14,569,150 4,897,720 8,500,500 30 10
British-American Investments
Company ( Kenya) Ltd 2012 23,970,570 1,750,925 12,472,324 5,907,420 7,545,000 6 10
British-American Investments 2011 19,760,520 1,648,901 8,557,448 3,644,610 6,529,500 5 10
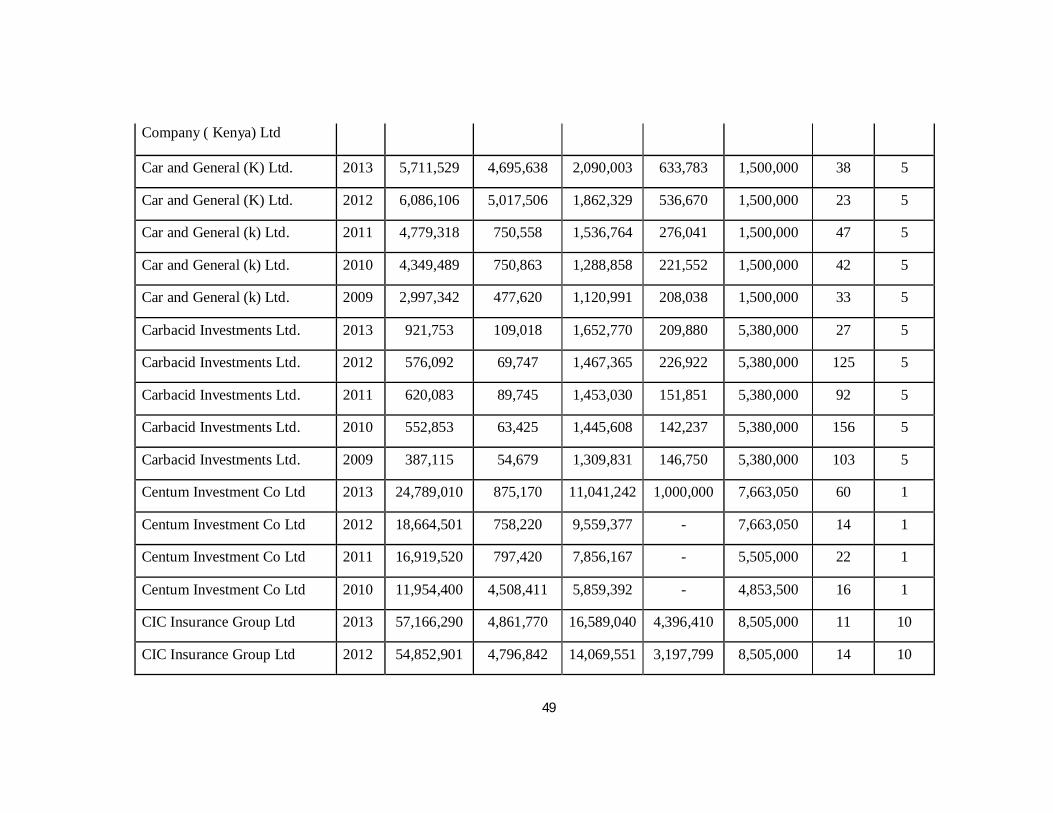
49
Company ( Kenya) Ltd
Car and General (K) Ltd. 2013 5,711,529 4,695,638 2,090,003 633,783 1,500,000 38 5
Car and General (K) Ltd. 2012 6,086,106 5,017,506 1,862,329 536,670 1,500,000 23 5
Car and General (k) Ltd. 2011 4,779,318 750,558 1,536,764 276,041 1,500,000 47 5
Car and General (k) Ltd. 2010 4,349,489 750,863 1,288,858 221,552 1,500,000 42 5
Car and General (k) Ltd. 2009 2,997,342 477,620 1,120,991 208,038 1,500,000 33 5
Carbacid Investments Ltd. 2013 921,753 109,018 1,652,770 209,880 5,380,000 27 5
Carbacid Investments Ltd. 2012 576,092 69,747 1,467,365 226,922 5,380,000 125 5
Carbacid Investments Ltd. 2011 620,083 89,745 1,453,030 151,851 5,380,000 92 5
Carbacid Investments Ltd. 2010 552,853 63,425 1,445,608 142,237 5,380,000 156 5
Carbacid Investments Ltd. 2009 387,115 54,679 1,309,831 146,750 5,380,000 103 5
Centum Investment Co Ltd 2013 24,789,010 875,170 11,041,242 1,000,000 7,663,050 60 1
Centum Investment Co Ltd 2012 18,664,501 758,220 9,559,377 - 7,663,050 14 1
Centum Investment Co Ltd 2011 16,919,520 797,420 7,856,167 - 5,505,000 22 1
Centum Investment Co Ltd 2010 11,954,400 4,508,411 5,859,392 - 4,853,500 16 1
CIC Insurance Group Ltd 2013 57,166,290 4,861,770 16,589,040 4,396,410 8,505,000 11 10
CIC Insurance Group Ltd 2012 54,852,901 4,796,842 14,069,551 3,197,799 8,505,000 14 10
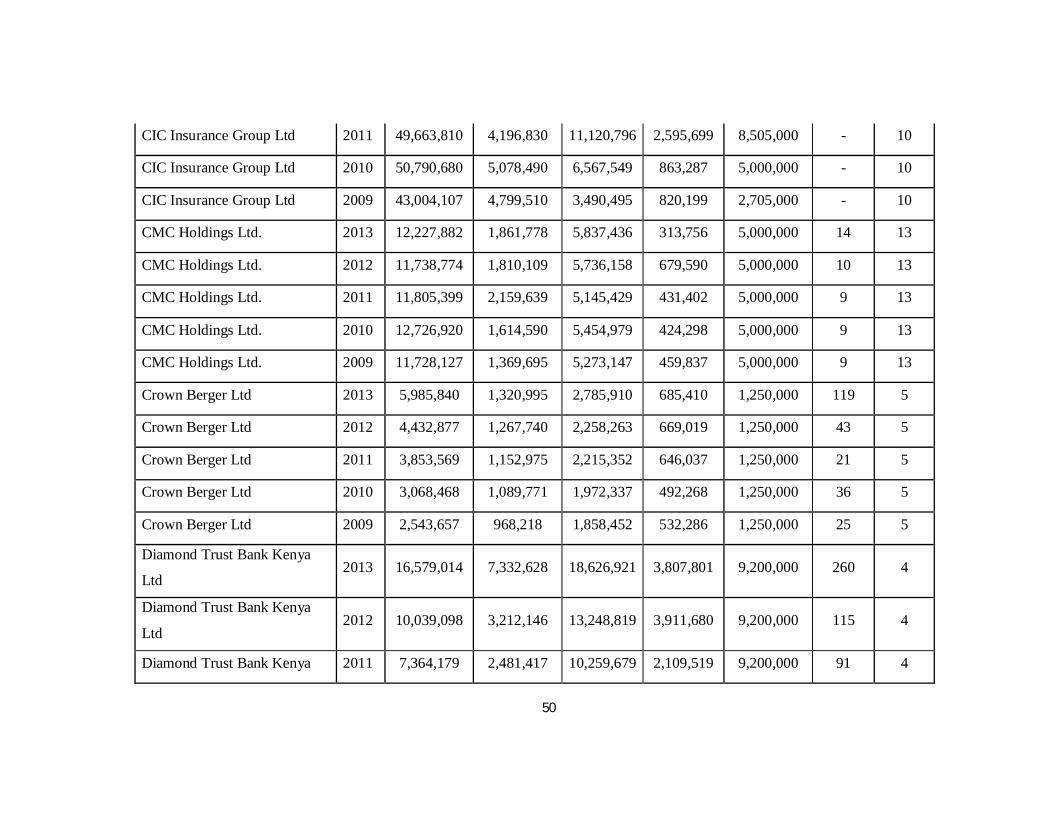
50
CIC Insurance Group Ltd 2011 49,663,810 4,196,830 11,120,796 2,595,699 8,505,000 - 10
CIC Insurance Group Ltd 2010 50,790,680 5,078,490 6,567,549 863,287 5,000,000 - 10
CIC Insurance Group Ltd 2009 43,004,107 4,799,510 3,490,495 820,199 2,705,000 - 10
CMC Holdings Ltd. 2013 12,227,882 1,861,778 5,837,436 313,756 5,000,000 14 13
CMC Holdings Ltd. 2012 11,738,774 1,810,109 5,736,158 679,590 5,000,000 10 13
CMC Holdings Ltd. 2011 11,805,399 2,159,639 5,145,429 431,402 5,000,000 9 13
CMC Holdings Ltd. 2010 12,726,920 1,614,590 5,454,979 424,298 5,000,000 9 13
CMC Holdings Ltd. 2009 11,728,127 1,369,695 5,273,147 459,837 5,000,000 9 13
Crown Berger Ltd 2013 5,985,840 1,320,995 2,785,910 685,410 1,250,000 119 5
Crown Berger Ltd 2012 4,432,877 1,267,740 2,258,263 669,019 1,250,000 43 5
Crown Berger Ltd 2011 3,853,569 1,152,975 2,215,352 646,037 1,250,000 21 5
Crown Berger Ltd 2010 3,068,468 1,089,771 1,972,337 492,268 1,250,000 36 5
Crown Berger Ltd 2009 2,543,657 968,218 1,858,452 532,286 1,250,000 25 5
Diamond Trust Bank Kenya
Ltd 2013 16,579,014 7,332,628 18,626,921 3,807,801 9,200,000 260 4
Diamond Trust Bank Kenya
Ltd 2012 10,039,098 3,212,146 13,248,819 3,911,680 9,200,000 115 4
Diamond Trust Bank Kenya 2011 7,364,179 2,481,417 10,259,679 2,109,519 9,200,000 91 4
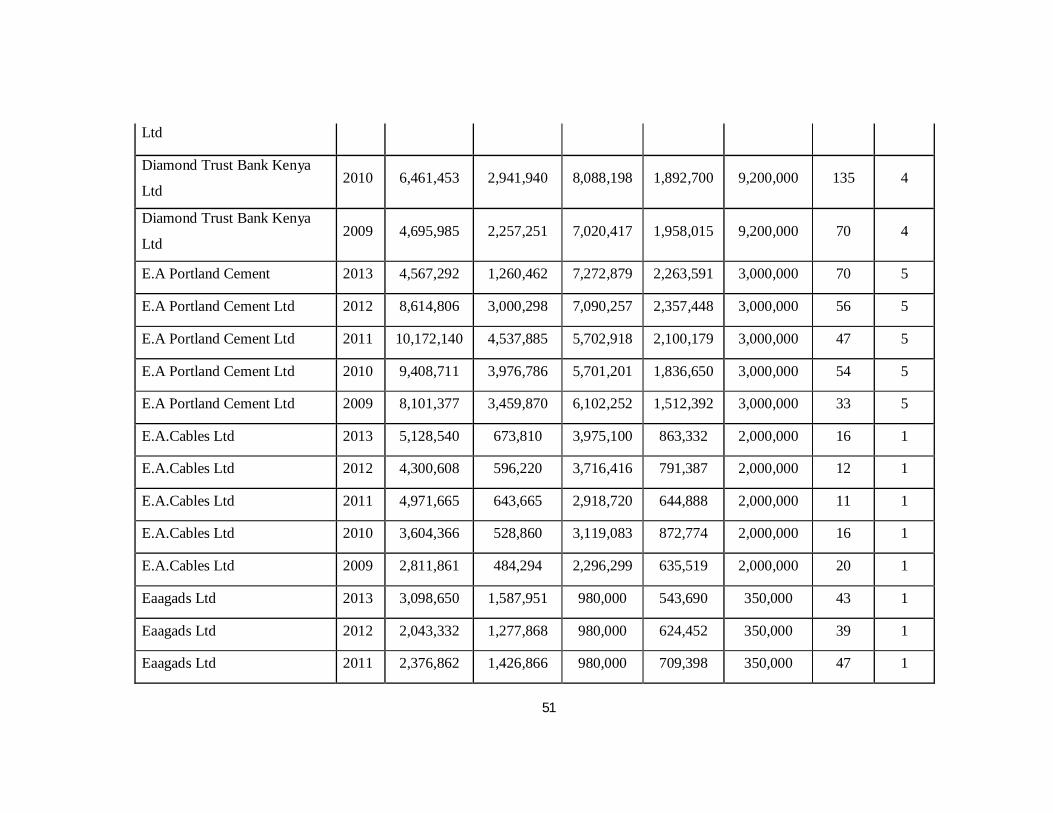
51
Ltd
Diamond Trust Bank Kenya
Ltd 2010 6,461,453 2,941,940 8,088,198 1,892,700 9,200,000 135 4
Diamond Trust Bank Kenya
Ltd 2009 4,695,985 2,257,251 7,020,417 1,958,015 9,200,000 70 4
E.A Portland Cement 2013 4,567,292 1,260,462 7,272,879 2,263,591 3,000,000 70 5
E.A Portland Cement Ltd 2012 8,614,806 3,000,298 7,090,257 2,357,448 3,000,000 56 5
E.A Portland Cement Ltd 2011 10,172,140 4,537,885 5,702,918 2,100,179 3,000,000 47 5
E.A Portland Cement Ltd 2010 9,408,711 3,976,786 5,701,201 1,836,650 3,000,000 54 5
E.A Portland Cement Ltd 2009 8,101,377 3,459,870 6,102,252 1,512,392 3,000,000 33 5
E.A.Cables Ltd 2013 5,128,540 673,810 3,975,100 863,332 2,000,000 16 1
E.A.Cables Ltd 2012 4,300,608 596,220 3,716,416 791,387 2,000,000 12 1
E.A.Cables Ltd 2011 4,971,665 643,665 2,918,720 644,888 2,000,000 11 1
E.A.Cables Ltd 2010 3,604,366 528,860 3,119,083 872,774 2,000,000 16 1
E.A.Cables Ltd 2009 2,811,861 484,294 2,296,299 635,519 2,000,000 20 1
Eaagads Ltd 2013 3,098,650 1,587,951 980,000 543,690 350,000 43 1
Eaagads Ltd 2012 2,043,332 1,277,868 980,000 624,452 350,000 39 1
Eaagads Ltd 2011 2,376,862 1,426,866 980,000 709,398 350,000 47 1
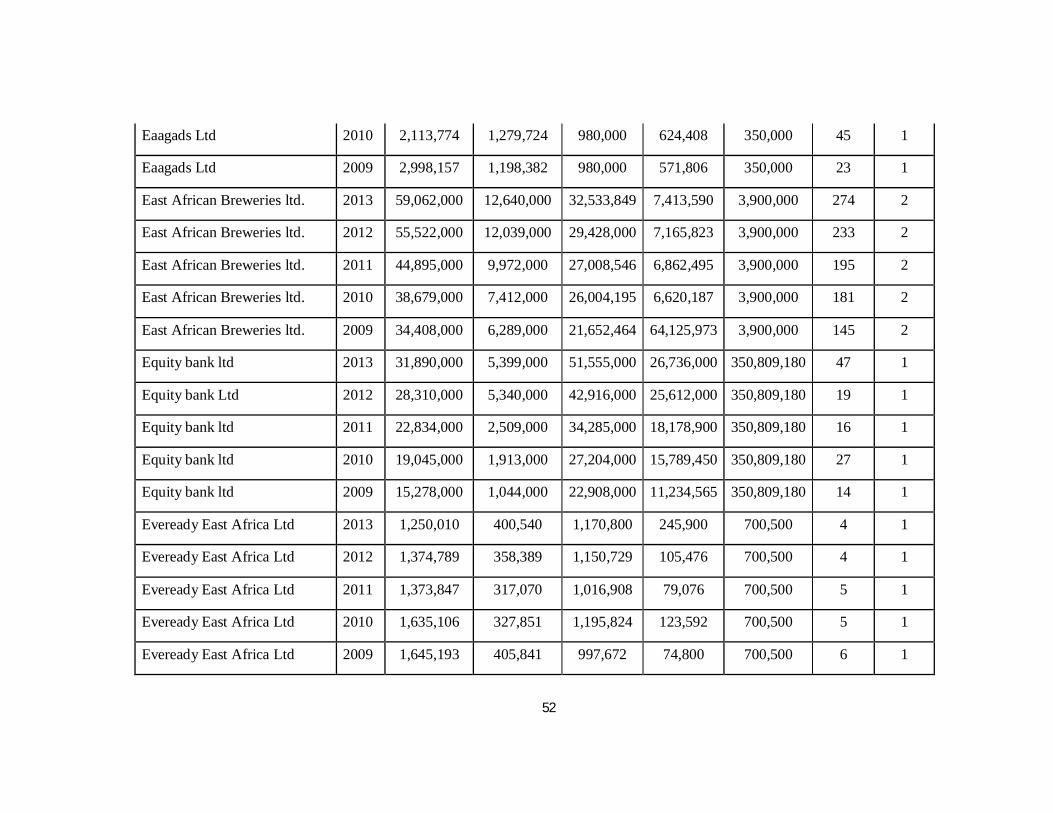
52
Eaagads Ltd 2010 2,113,774 1,279,724 980,000 624,408 350,000 45 1
Eaagads Ltd 2009 2,998,157 1,198,382 980,000 571,806 350,000 23 1
East African Breweries ltd. 2013 59,062,000 12,640,000 32,533,849 7,413,590 3,900,000 274 2
East African Breweries ltd. 2012 55,522,000 12,039,000 29,428,000 7,165,823 3,900,000 233 2
East African Breweries ltd. 2011 44,895,000 9,972,000 27,008,546 6,862,495 3,900,000 195 2
East African Breweries ltd. 2010 38,679,000 7,412,000 26,004,195 6,620,187 3,900,000 181 2
East African Breweries ltd. 2009 34,408,000 6,289,000 21,652,464 64,125,973 3,900,000 145 2
Equity bank ltd 2013 31,890,000 5,399,000 51,555,000 26,736,000 350,809,180 47 1
Equity bank Ltd 2012 28,310,000 5,340,000 42,916,000 25,612,000 350,809,180 19 1
Equity bank ltd 2011 22,834,000 2,509,000 34,285,000 18,178,900 350,809,180 16 1
Equity bank ltd 2010 19,045,000 1,913,000 27,204,000 15,789,450 350,809,180 27 1
Equity bank ltd 2009 15,278,000 1,044,000 22,908,000 11,234,565 350,809,180 14 1
Eveready East Africa Ltd 2013 1,250,010 400,540 1,170,800 245,900 700,500 4 1
Eveready East Africa Ltd 2012 1,374,789 358,389 1,150,729 105,476 700,500 4 1
Eveready East Africa Ltd 2011 1,373,847 317,070 1,016,908 79,076 700,500 5 1
Eveready East Africa Ltd 2010 1,635,106 327,851 1,195,824 123,592 700,500 5 1
Eveready East Africa Ltd 2009 1,645,193 405,841 997,672 74,800 700,500 6 1
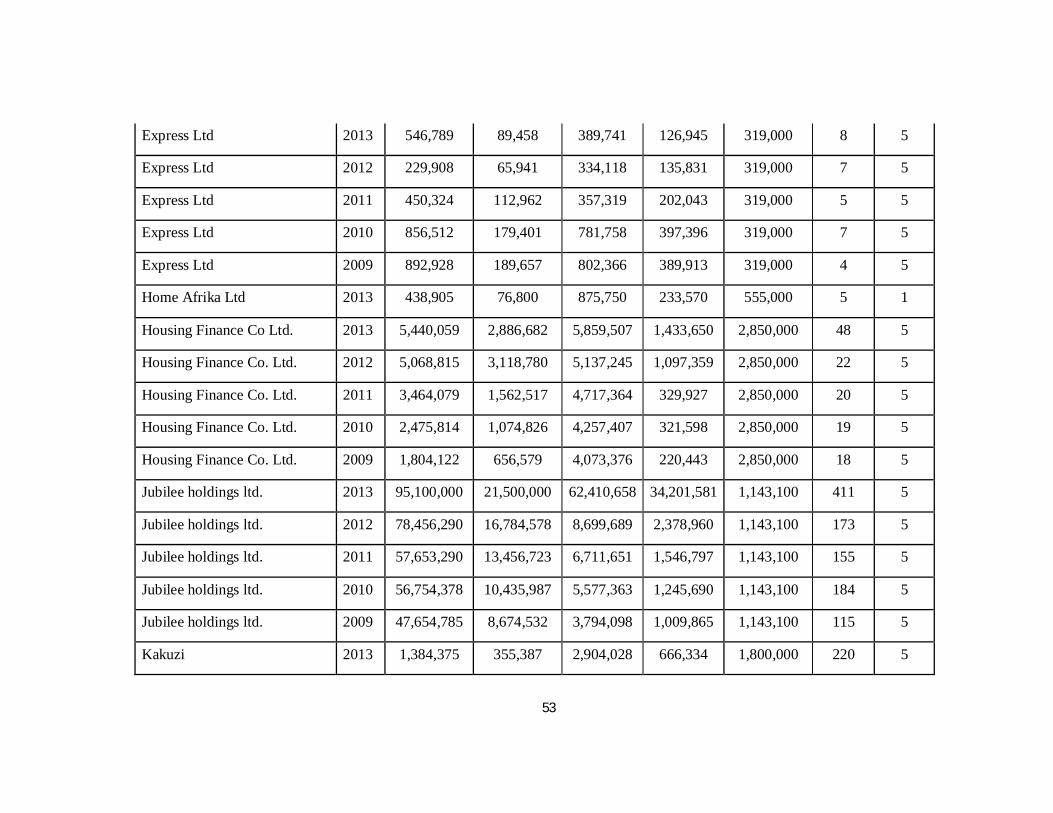
53
Express Ltd 2013 546,789 89,458 389,741 126,945 319,000 8 5
Express Ltd 2012 229,908 65,941 334,118 135,831 319,000 7 5
Express Ltd 2011 450,324 112,962 357,319 202,043 319,000 5 5
Express Ltd 2010 856,512 179,401 781,758 397,396 319,000 7 5
Express Ltd 2009 892,928 189,657 802,366 389,913 319,000 4 5
Home Afrika Ltd 2013 438,905 76,800 875,750 233,570 555,000 5 1
Housing Finance Co Ltd. 2013 5,440,059 2,886,682 5,859,507 1,433,650 2,850,000 48 5
Housing Finance Co. Ltd. 2012 5,068,815 3,118,780 5,137,245 1,097,359 2,850,000 22 5
Housing Finance Co. Ltd. 2011 3,464,079 1,562,517 4,717,364 329,927 2,850,000 20 5
Housing Finance Co. Ltd. 2010 2,475,814 1,074,826 4,257,407 321,598 2,850,000 19 5
Housing Finance Co. Ltd. 2009 1,804,122 656,579 4,073,376 220,443 2,850,000 18 5
Jubilee holdings ltd. 2013 95,100,000 21,500,000 62,410,658 34,201,581 1,143,100 411 5
Jubilee holdings ltd. 2012 78,456,290 16,784,578 8,699,689 2,378,960 1,143,100 173 5
Jubilee holdings ltd. 2011 57,653,290 13,456,723 6,711,651 1,546,797 1,143,100 155 5
Jubilee holdings ltd. 2010 56,754,378 10,435,987 5,577,363 1,245,690 1,143,100 184 5
Jubilee holdings ltd. 2009 47,654,785 8,674,532 3,794,098 1,009,865 1,143,100 115 5
Kakuzi 2013 1,384,375 355,387 2,904,028 666,334 1,800,000 220 5
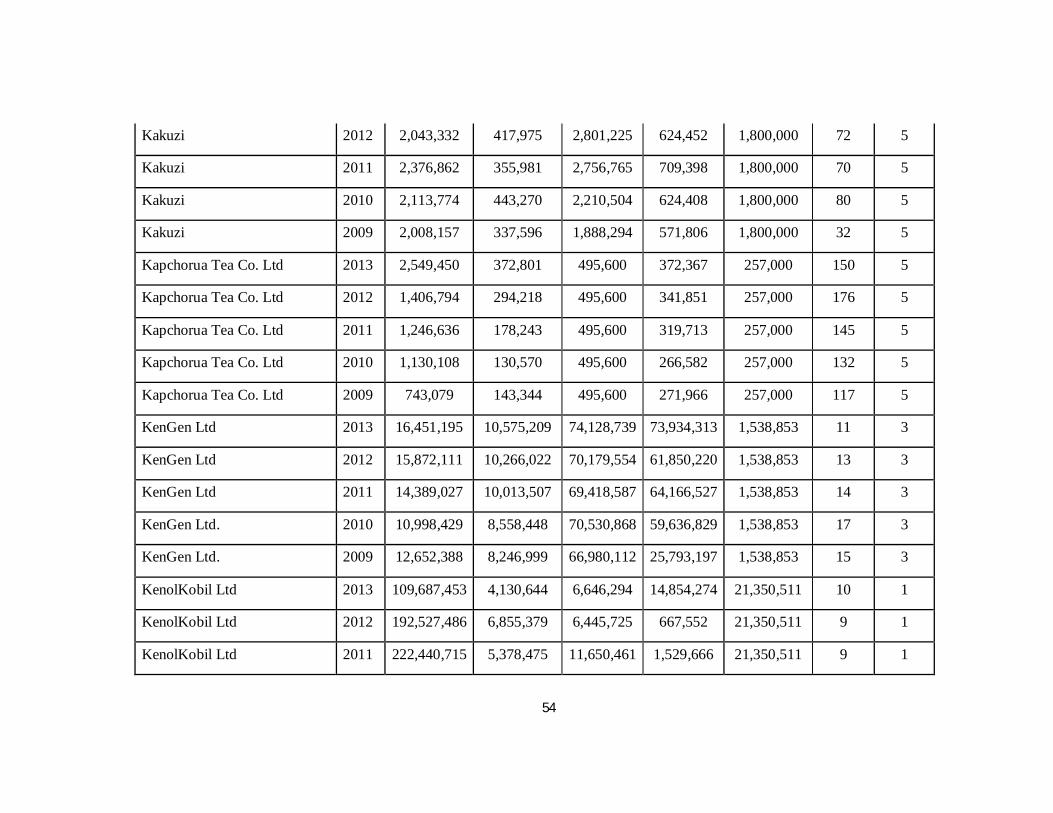
54
Kakuzi 2012 2,043,332 417,975 2,801,225 624,452 1,800,000 72 5
Kakuzi 2011 2,376,862 355,981 2,756,765 709,398 1,800,000 70 5
Kakuzi 2010 2,113,774 443,270 2,210,504 624,408 1,800,000 80 5
Kakuzi 2009 2,008,157 337,596 1,888,294 571,806 1,800,000 32 5
Kapchorua Tea Co. Ltd 2013 2,549,450 372,801 495,600 372,367 257,000 150 5
Kapchorua Tea Co. Ltd 2012 1,406,794 294,218 495,600 341,851 257,000 176 5
Kapchorua Tea Co. Ltd 2011 1,246,636 178,243 495,600 319,713 257,000 145 5
Kapchorua Tea Co. Ltd 2010 1,130,108 130,570 495,600 266,582 257,000 132 5
Kapchorua Tea Co. Ltd 2009 743,079 143,344 495,600 271,966 257,000 117 5
KenGen Ltd 2013 16,451,195 10,575,209 74,128,739 73,934,313 1,538,853 11 3
KenGen Ltd 2012 15,872,111 10,266,022 70,179,554 61,850,220 1,538,853 13 3
KenGen Ltd 2011 14,389,027 10,013,507 69,418,587 64,166,527 1,538,853 14 3
KenGen Ltd. 2010 10,998,429 8,558,448 70,530,868 59,636,829 1,538,853 17 3
KenGen Ltd. 2009 12,652,388 8,246,999 66,980,112 25,793,197 1,538,853 15 3
KenolKobil Ltd 2013 109,687,453 4,130,644 6,646,294 14,854,274 21,350,511 10 1
KenolKobil Ltd 2012 192,527,486 6,855,379 6,445,725 667,552 21,350,511 9 1
KenolKobil Ltd 2011 222,440,715 5,378,475 11,650,461 1,529,666 21,350,511 9 1
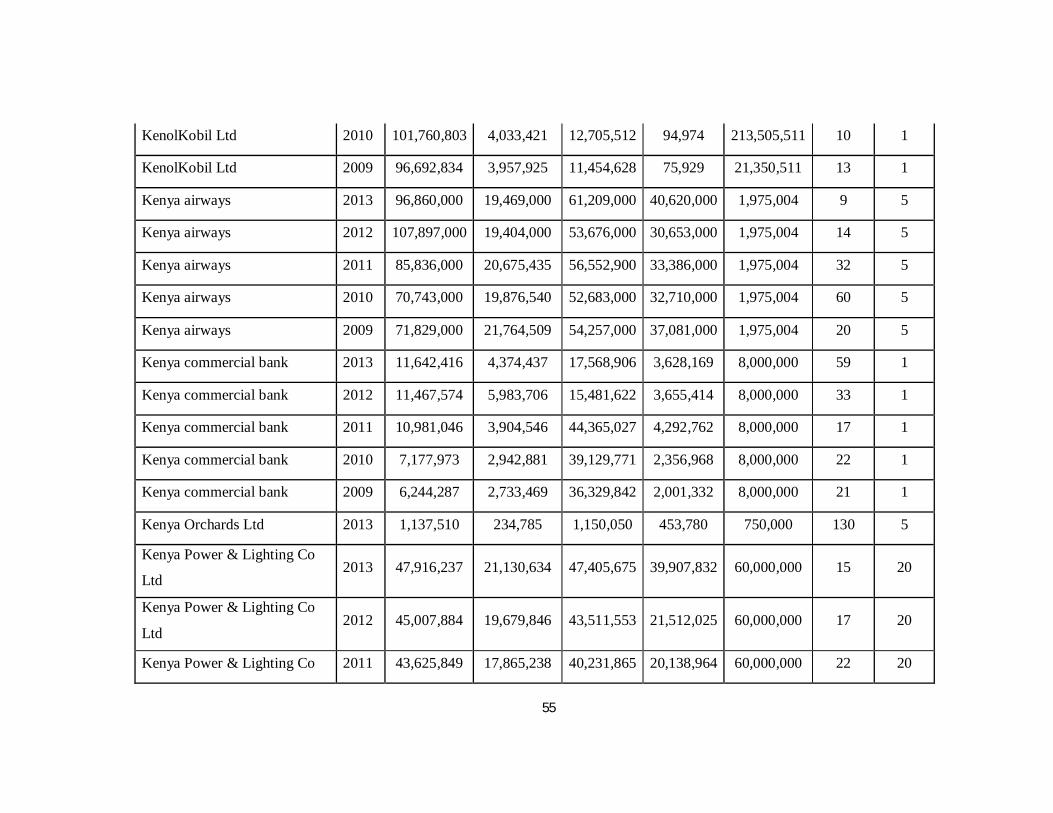
55
KenolKobil Ltd 2010 101,760,803 4,033,421 12,705,512 94,974 213,505,511 10 1
KenolKobil Ltd 2009 96,692,834 3,957,925 11,454,628 75,929 21,350,511 13 1
Kenya airways 2013 96,860,000 19,469,000 61,209,000 40,620,000 1,975,004 9 5
Kenya airways 2012 107,897,000 19,404,000 53,676,000 30,653,000 1,975,004 14 5
Kenya airways 2011 85,836,000 20,675,435 56,552,900 33,386,000 1,975,004 32 5
Kenya airways 2010 70,743,000 19,876,540 52,683,000 32,710,000 1,975,004 60 5
Kenya airways 2009 71,829,000 21,764,509 54,257,000 37,081,000 1,975,004 20 5
Kenya commercial bank 2013 11,642,416 4,374,437 17,568,906 3,628,169 8,000,000 59 1
Kenya commercial bank 2012 11,467,574 5,983,706 15,481,622 3,655,414 8,000,000 33 1
Kenya commercial bank 2011 10,981,046 3,904,546 44,365,027 4,292,762 8,000,000 17 1
Kenya commercial bank 2010 7,177,973 2,942,881 39,129,771 2,356,968 8,000,000 22 1
Kenya commercial bank 2009 6,244,287 2,733,469 36,329,842 2,001,332 8,000,000 21 1
Kenya Orchards Ltd 2013 1,137,510 234,785 1,150,050 453,780 750,000 130 5
Kenya Power & Lighting Co
Ltd 2013 47,916,237 21,130,634 47,405,675 39,907,832 60,000,000 15 20
Kenya Power & Lighting Co
Ltd 2012 45,007,884 19,679,846 43,511,553 21,512,025 60,000,000 17 20
Kenya Power & Lighting Co 2011 43,625,849 17,865,238 40,231,865 20,138,964 60,000,000 22 20
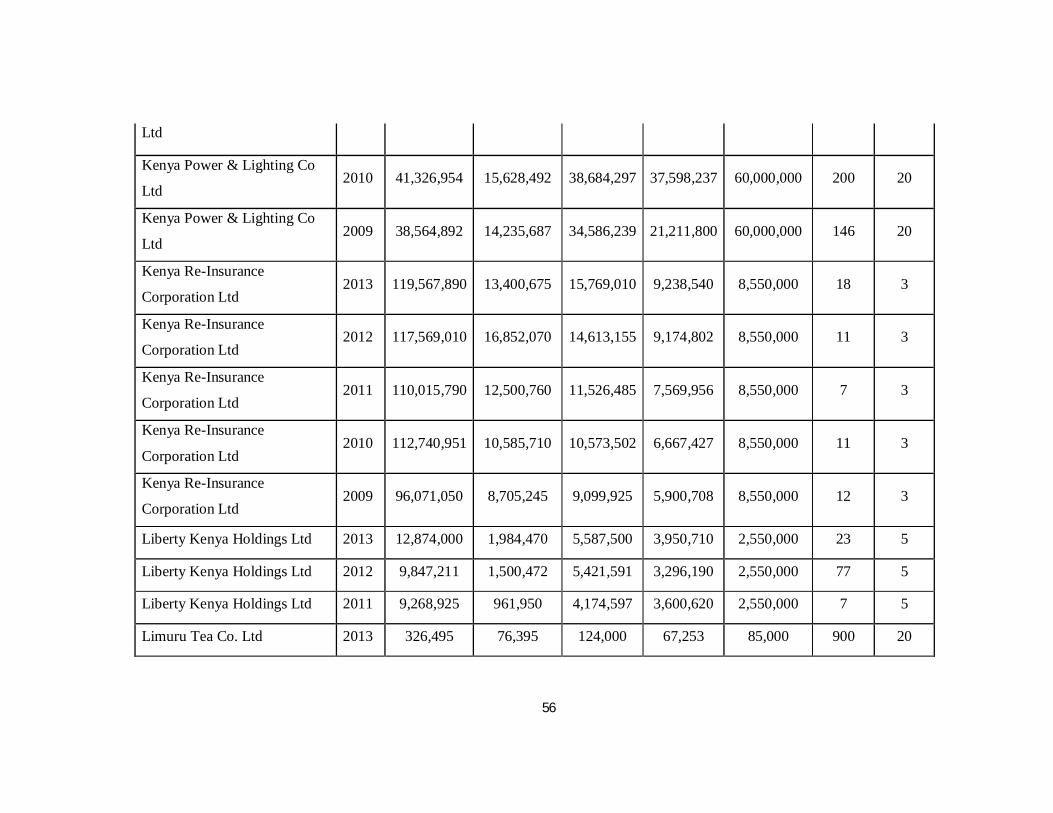
56
Ltd
Kenya Power & Lighting Co
Ltd 2010 41,326,954 15,628,492 38,684,297 37,598,237 60,000,000 200 20
Kenya Power & Lighting Co
Ltd 2009 38,564,892 14,235,687 34,586,239 21,211,800 60,000,000 146 20
Kenya Re-Insurance
Corporation Ltd 2013 119,567,890 13,400,675 15,769,010 9,238,540 8,550,000 18 3
Kenya Re-Insurance
Corporation Ltd 2012 117,569,010 16,852,070 14,613,155 9,174,802 8,550,000 11 3
Kenya Re-Insurance
Corporation Ltd 2011 110,015,790 12,500,760 11,526,485 7,569,956 8,550,000 7 3
Kenya Re-Insurance
Corporation Ltd 2010 112,740,951 10,585,710 10,573,502 6,667,427 8,550,000 11 3
Kenya Re-Insurance
Corporation Ltd 2009 96,071,050 8,705,245 9,099,925 5,900,708 8,550,000 12 3
Liberty Kenya Holdings Ltd 2013 12,874,000 1,984,470 5,587,500 3,950,710 2,550,000 23 5
Liberty Kenya Holdings Ltd 2012 9,847,211 1,500,472 5,421,591 3,296,190 2,550,000 77 5
Liberty Kenya Holdings Ltd 2011 9,268,925 961,950 4,174,597 3,600,620 2,550,000 7 5
Limuru Tea Co. Ltd 2013 326,495 76,395 124,000 67,253 85,000 900 20
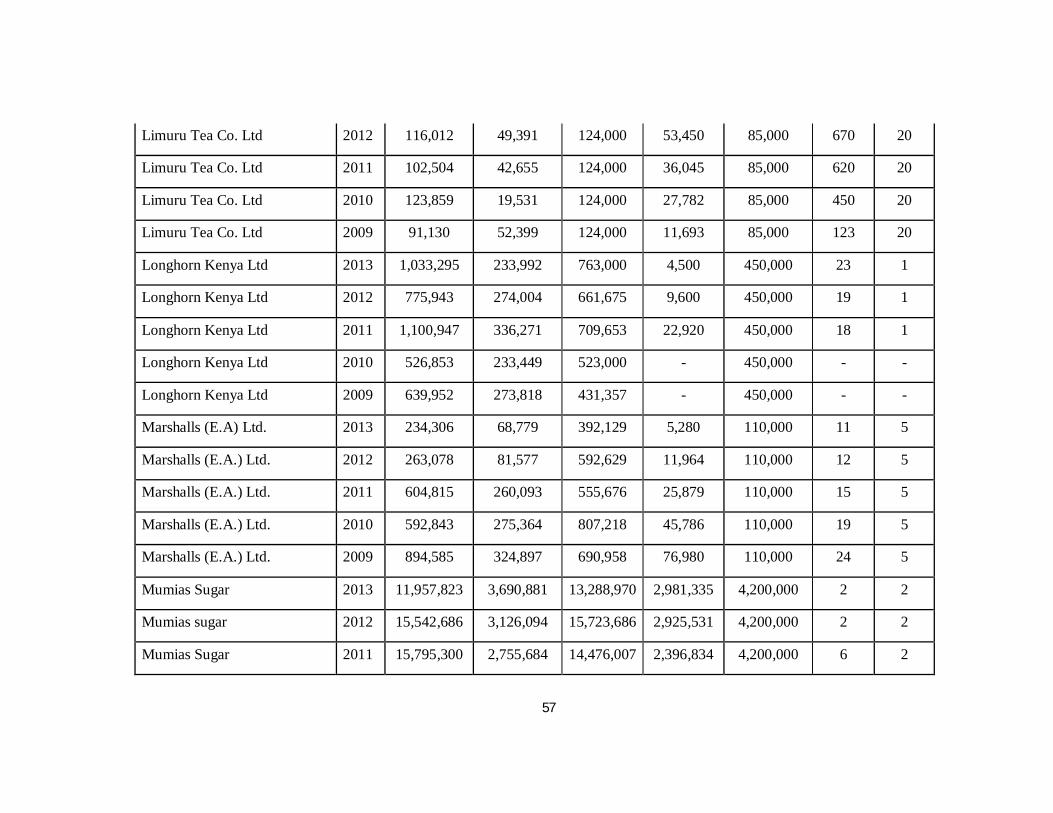
57
Limuru Tea Co. Ltd 2012 116,012 49,391 124,000 53,450 85,000 670 20
Limuru Tea Co. Ltd 2011 102,504 42,655 124,000 36,045 85,000 620 20
Limuru Tea Co. Ltd 2010 123,859 19,531 124,000 27,782 85,000 450 20
Limuru Tea Co. Ltd 2009 91,130 52,399 124,000 11,693 85,000 123 20
Longhorn Kenya Ltd 2013 1,033,295 233,992 763,000 4,500 450,000 23 1
Longhorn Kenya Ltd 2012 775,943 274,004 661,675 9,600 450,000 19 1
Longhorn Kenya Ltd 2011 1,100,947 336,271 709,653 22,920 450,000 18 1
Longhorn Kenya Ltd 2010 526,853 233,449 523,000 - 450,000 - -
Longhorn Kenya Ltd 2009 639,952 273,818 431,357 - 450,000 - -
Marshalls (E.A) Ltd. 2013 234,306 68,779 392,129 5,280 110,000 11 5
Marshalls (E.A.) Ltd. 2012 263,078 81,577 592,629 11,964 110,000 12 5
Marshalls (E.A.) Ltd. 2011 604,815 260,093 555,676 25,879 110,000 15 5
Marshalls (E.A.) Ltd. 2010 592,843 275,364 807,218 45,786 110,000 19 5
Marshalls (E.A.) Ltd. 2009 894,585 324,897 690,958 76,980 110,000 24 5
Mumias Sugar 2013 11,957,823 3,690,881 13,288,970 2,981,335 4,200,000 2 2
Mumias sugar 2012 15,542,686 3,126,094 15,723,686 2,925,531 4,200,000 2 2
Mumias Sugar 2011 15,795,300 2,755,684 14,476,007 2,396,834 4,200,000 6 2
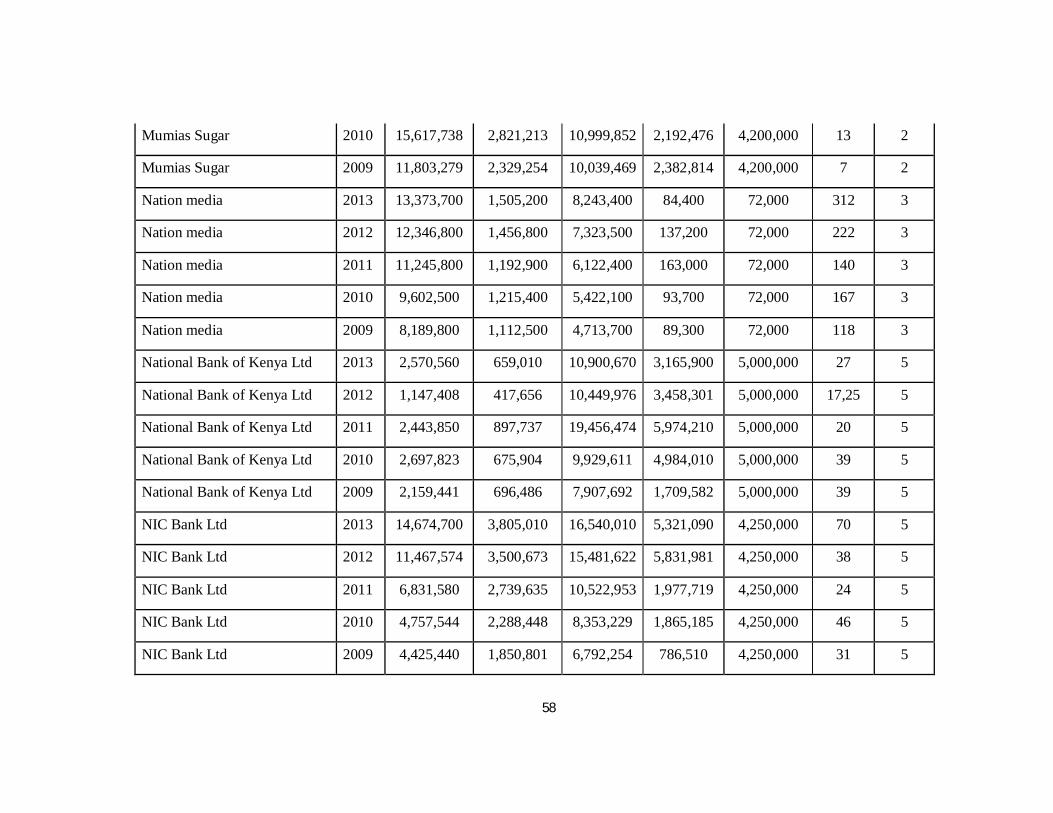
58
Mumias Sugar 2010 15,617,738 2,821,213 10,999,852 2,192,476 4,200,000 13 2
Mumias Sugar 2009 11,803,279 2,329,254 10,039,469 2,382,814 4,200,000 7 2
Nation media 2013 13,373,700 1,505,200 8,243,400 84,400 72,000 312 3
Nation media 2012 12,346,800 1,456,800 7,323,500 137,200 72,000 222 3
Nation media 2011 11,245,800 1,192,900 6,122,400 163,000 72,000 140 3
Nation media 2010 9,602,500 1,215,400 5,422,100 93,700 72,000 167 3
Nation media 2009 8,189,800 1,112,500 4,713,700 89,300 72,000 118 3
National Bank of Kenya Ltd 2013 2,570,560 659,010 10,900,670 3,165,900 5,000,000 27 5
National Bank of Kenya Ltd 2012 1,147,408 417,656 10,449,976 3,458,301 5,000,000 17,25 5
National Bank of Kenya Ltd 2011 2,443,850 897,737 19,456,474 5,974,210 5,000,000 20 5
National Bank of Kenya Ltd 2010 2,697,823 675,904 9,929,611 4,984,010 5,000,000 39 5
National Bank of Kenya Ltd 2009 2,159,441 696,486 7,907,692 1,709,582 5,000,000 39 5
NIC Bank Ltd 2013 14,674,700 3,805,010 16,540,010 5,321,090 4,250,000 70 5
NIC Bank Ltd 2012 11,467,574 3,500,673 15,481,622 5,831,981 4,250,000 38 5
NIC Bank Ltd 2011 6,831,580 2,739,635 10,522,953 1,977,719 4,250,000 24 5
NIC Bank Ltd 2010 4,757,544 2,288,448 8,353,229 1,865,185 4,250,000 46 5
NIC Bank Ltd 2009 4,425,440 1,850,801 6,792,254 786,510 4,250,000 31 5
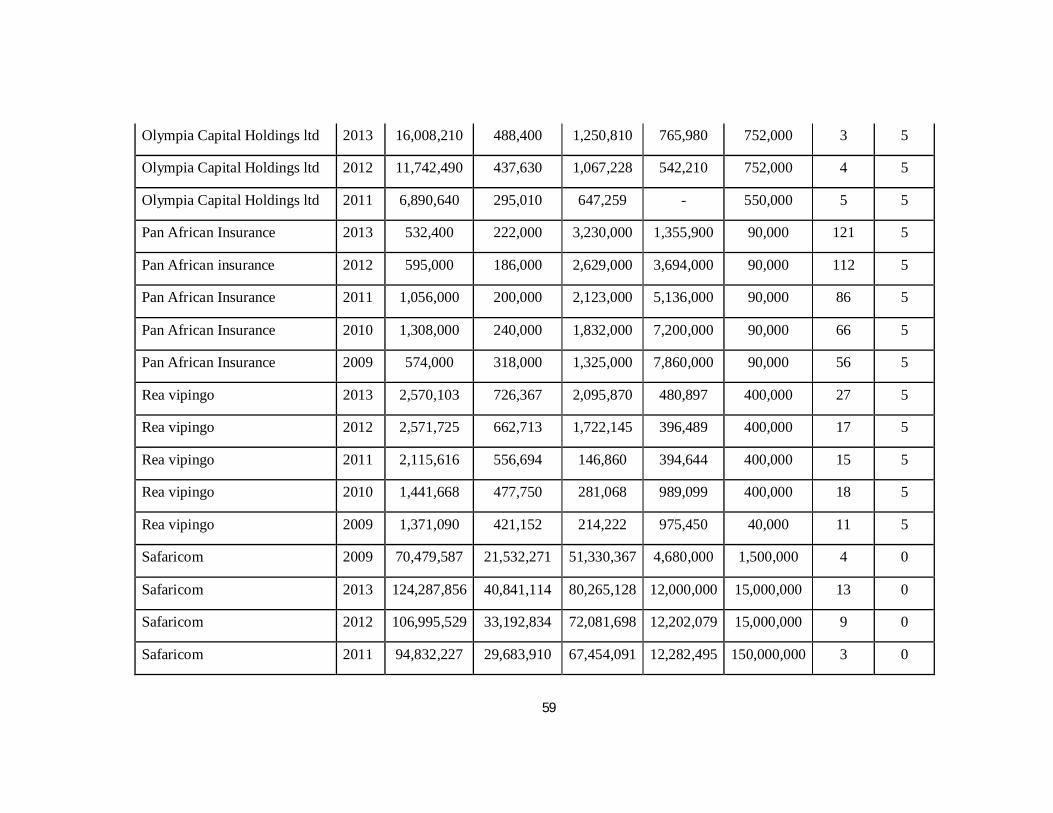
59
Olympia Capital Holdings ltd 2013 16,008,210 488,400 1,250,810 765,980 752,000 3 5
Olympia Capital Holdings ltd 2012 11,742,490 437,630 1,067,228 542,210 752,000 4 5
Olympia Capital Holdings ltd 2011 6,890,640 295,010 647,259 - 550,000 5 5
Pan African Insurance 2013 532,400 222,000 3,230,000 1,355,900 90,000 121 5
Pan African insurance 2012 595,000 186,000 2,629,000 3,694,000 90,000 112 5
Pan African Insurance 2011 1,056,000 200,000 2,123,000 5,136,000 90,000 86 5
Pan African Insurance 2010 1,308,000 240,000 1,832,000 7,200,000 90,000 66 5
Pan African Insurance 2009 574,000 318,000 1,325,000 7,860,000 90,000 56 5
Rea vipingo 2013 2,570,103 726,367 2,095,870 480,897 400,000 27 5
Rea vipingo 2012 2,571,725 662,713 1,722,145 396,489 400,000 17 5
Rea vipingo 2011 2,115,616 556,694 146,860 394,644 400,000 15 5
Rea vipingo 2010 1,441,668 477,750 281,068 989,099 400,000 18 5
Rea vipingo 2009 1,371,090 421,152 214,222 975,450 40,000 11 5
Safaricom 2009 70,479,587 21,532,271 51,330,367 4,680,000 1,500,000 4 0
Safaricom 2013 124,287,856 40,841,114 80,265,128 12,000,000 15,000,000 13 0
Safaricom 2012 106,995,529 33,192,834 72,081,698 12,202,079 15,000,000 9 0
Safaricom 2011 94,832,227 29,683,910 67,454,091 12,282,495 150,000,000 3 0
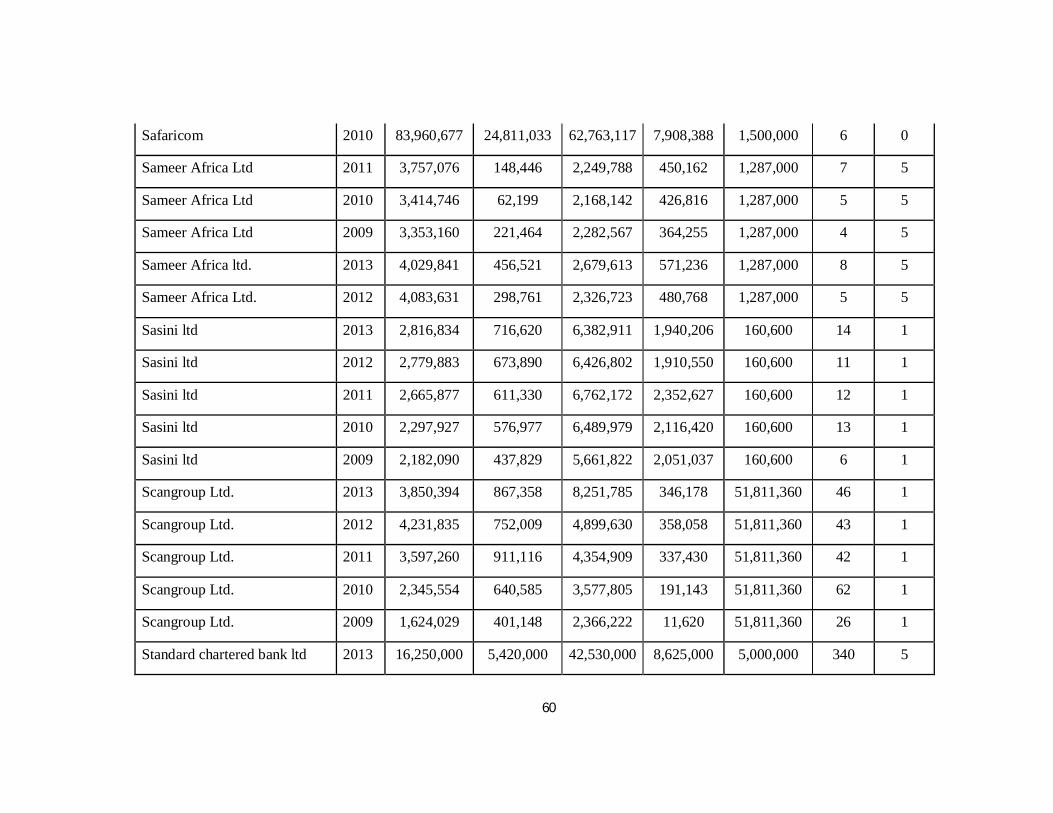
60
Safaricom 2010 83,960,677 24,811,033 62,763,117 7,908,388 1,500,000 6 0
Sameer Africa Ltd 2011 3,757,076 148,446 2,249,788 450,162 1,287,000 7 5
Sameer Africa Ltd 2010 3,414,746 62,199 2,168,142 426,816 1,287,000 5 5
Sameer Africa Ltd 2009 3,353,160 221,464 2,282,567 364,255 1,287,000 4 5
Sameer Africa ltd. 2013 4,029,841 456,521 2,679,613 571,236 1,287,000 8 5
Sameer Africa Ltd. 2012 4,083,631 298,761 2,326,723 480,768 1,287,000 5 5
Sasini ltd 2013 2,816,834 716,620 6,382,911 1,940,206 160,600 14 1
Sasini ltd 2012 2,779,883 673,890 6,426,802 1,910,550 160,600 11 1
Sasini ltd 2011 2,665,877 611,330 6,762,172 2,352,627 160,600 12 1
Sasini ltd 2010 2,297,927 576,977 6,489,979 2,116,420 160,600 13 1
Sasini ltd 2009 2,182,090 437,829 5,661,822 2,051,037 160,600 6 1
Scangroup Ltd. 2013 3,850,394 867,358 8,251,785 346,178 51,811,360 46 1
Scangroup Ltd. 2012 4,231,835 752,009 4,899,630 358,058 51,811,360 43 1
Scangroup Ltd. 2011 3,597,260 911,116 4,354,909 337,430 51,811,360 42 1
Scangroup Ltd. 2010 2,345,554 640,585 3,577,805 191,143 51,811,360 62 1
Scangroup Ltd. 2009 1,624,029 401,148 2,366,222 11,620 51,811,360 26 1
Standard chartered bank ltd 2013 16,250,000 5,420,000 42,530,000 8,625,000 5,000,000 340 5
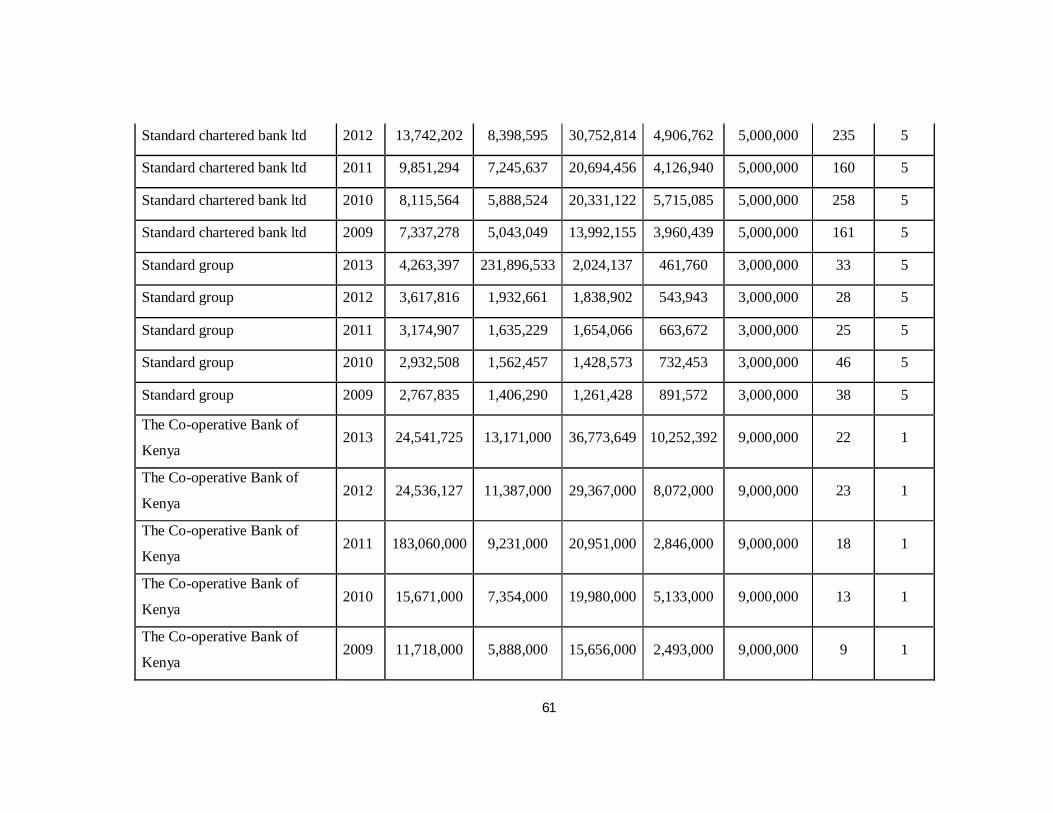
61
Standard chartered bank ltd 2012 13,742,202 8,398,595 30,752,814 4,906,762 5,000,000 235 5
Standard chartered bank ltd 2011 9,851,294 7,245,637 20,694,456 4,126,940 5,000,000 160 5
Standard chartered bank ltd 2010 8,115,564 5,888,524 20,331,122 5,715,085 5,000,000 258 5
Standard chartered bank ltd 2009 7,337,278 5,043,049 13,992,155 3,960,439 5,000,000 161 5
Standard group 2013 4,263,397 231,896,533 2,024,137 461,760 3,000,000 33 5
Standard group 2012 3,617,816 1,932,661 1,838,902 543,943 3,000,000 28 5
Standard group 2011 3,174,907 1,635,229 1,654,066 663,672 3,000,000 25 5
Standard group 2010 2,932,508 1,562,457 1,428,573 732,453 3,000,000 46 5
Standard group 2009 2,767,835 1,406,290 1,261,428 891,572 3,000,000 38 5
The Co-operative Bank of
Kenya 2013 24,541,725 13,171,000 36,773,649 10,252,392 9,000,000 22 1
The Co-operative Bank of
Kenya 2012 24,536,127 11,387,000 29,367,000 8,072,000 9,000,000 23 1
The Co-operative Bank of
Kenya 2011 183,060,000 9,231,000 20,951,000 2,846,000 9,000,000 18 1
The Co-operative Bank of
Kenya 2010 15,671,000 7,354,000 19,980,000 5,133,000 9,000,000 13 1
The Co-operative Bank of
Kenya 2009 11,718,000 5,888,000 15,656,000 2,493,000 9,000,000 9 1
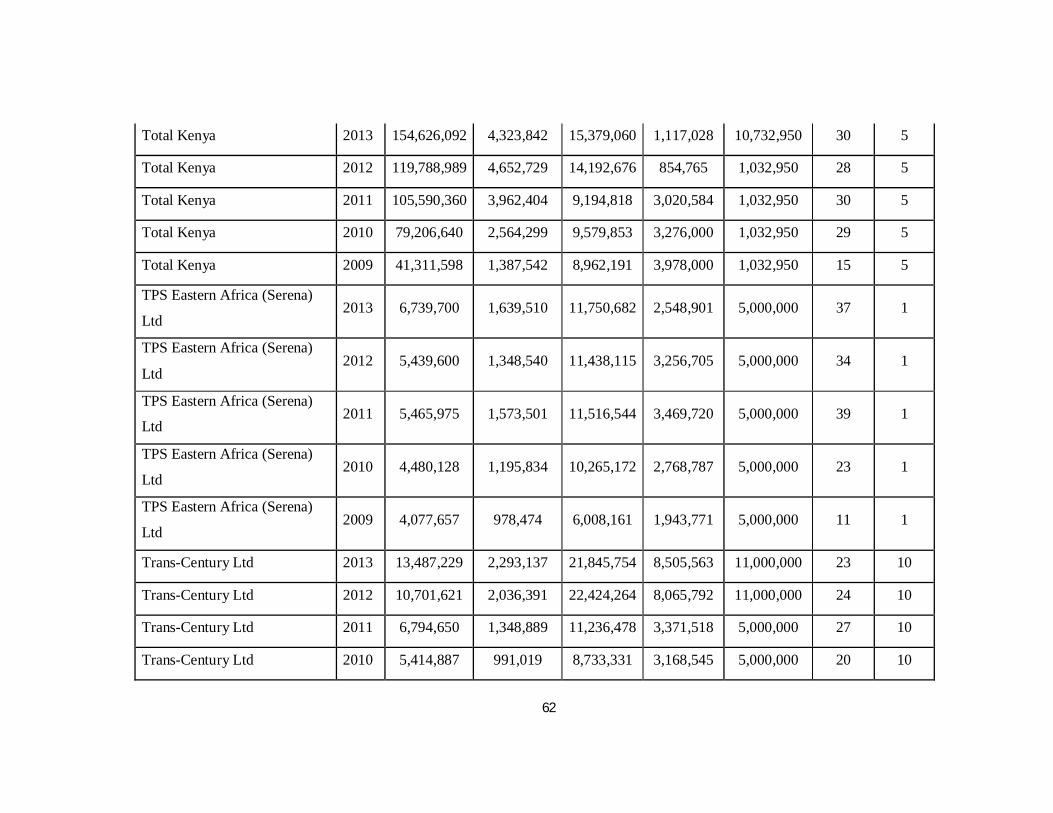
62
Total Kenya 2013 154,626,092 4,323,842 15,379,060 1,117,028 10,732,950 30 5
Total Kenya 2012 119,788,989 4,652,729 14,192,676 854,765 1,032,950 28 5
Total Kenya 2011 105,590,360 3,962,404 9,194,818 3,020,584 1,032,950 30 5
Total Kenya 2010 79,206,640 2,564,299 9,579,853 3,276,000 1,032,950 29 5
Total Kenya 2009 41,311,598 1,387,542 8,962,191 3,978,000 1,032,950 15 5
TPS Eastern Africa (Serena)
Ltd 2013 6,739,700 1,639,510 11,750,682 2,548,901 5,000,000 37 1
TPS Eastern Africa (Serena)
Ltd 2012 5,439,600 1,348,540 11,438,115 3,256,705 5,000,000 34 1
TPS Eastern Africa (Serena)
Ltd 2011 5,465,975 1,573,501 11,516,544 3,469,720 5,000,000 39 1
TPS Eastern Africa (Serena)
Ltd 2010 4,480,128 1,195,834 10,265,172 2,768,787 5,000,000 23 1
TPS Eastern Africa (Serena)
Ltd 2009 4,077,657 978,474 6,008,161 1,943,771 5,000,000 11 1
Trans-Century Ltd 2013 13,487,229 2,293,137 21,845,754 8,505,563 11,000,000 23 10
Trans-Century Ltd 2012 10,701,621 2,036,391 22,424,264 8,065,792 11,000,000 24 10
Trans-Century Ltd 2011 6,794,650 1,348,889 11,236,478 3,371,518 5,000,000 27 10
Trans-Century Ltd 2010 5,414,887 991,019 8,733,331 3,168,545 5,000,000 20 10
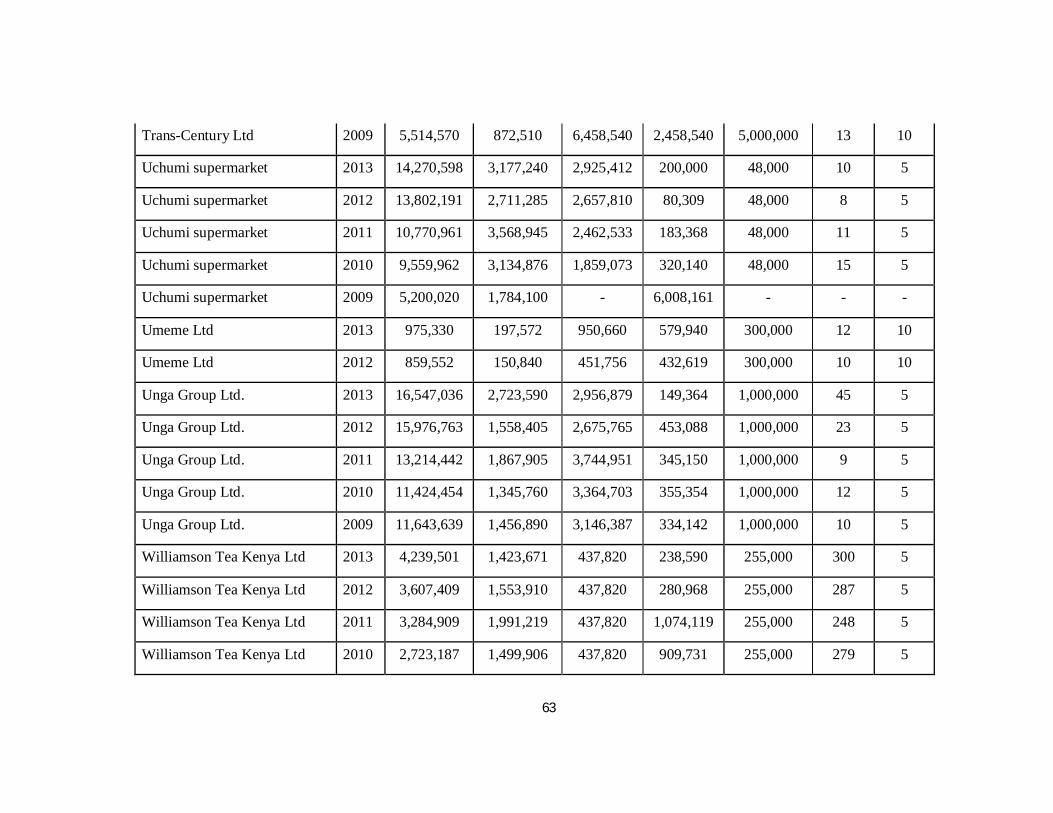
63
Trans-Century Ltd 2009 5,514,570 872,510 6,458,540 2,458,540 5,000,000 13 10
Uchumi supermarket 2013 14,270,598 3,177,240 2,925,412 200,000 48,000 10 5
Uchumi supermarket 2012 13,802,191 2,711,285 2,657,810 80,309 48,000 8 5
Uchumi supermarket 2011 10,770,961 3,568,945 2,462,533 183,368 48,000 11 5
Uchumi supermarket 2010 9,559,962 3,134,876 1,859,073 320,140 48,000 15 5
Uchumi supermarket 2009 5,200,020 1,784,100 - 6,008,161 - - -
Umeme Ltd 2013 975,330 197,572 950,660 579,940 300,000 12 10
Umeme Ltd 2012 859,552 150,840 451,756 432,619 300,000 10 10
Unga Group Ltd. 2013 16,547,036 2,723,590 2,956,879 149,364 1,000,000 45 5
Unga Group Ltd. 2012 15,976,763 1,558,405 2,675,765 453,088 1,000,000 23 5
Unga Group Ltd. 2011 13,214,442 1,867,905 3,744,951 345,150 1,000,000 9 5
Unga Group Ltd. 2010 11,424,454 1,345,760 3,364,703 355,354 1,000,000 12 5
Unga Group Ltd. 2009 11,643,639 1,456,890 3,146,387 334,142 1,000,000 10 5
Williamson Tea Kenya Ltd 2013 4,239,501 1,423,671 437,820 238,590 255,000 300 5
Williamson Tea Kenya Ltd 2012 3,607,409 1,553,910 437,820 280,968 255,000 287 5
Williamson Tea Kenya Ltd 2011 3,284,909 1,991,219 437,820 1,074,119 255,000 248 5
Williamson Tea Kenya Ltd 2010 2,723,187 1,499,906 437,820 909,731 255,000 279 5
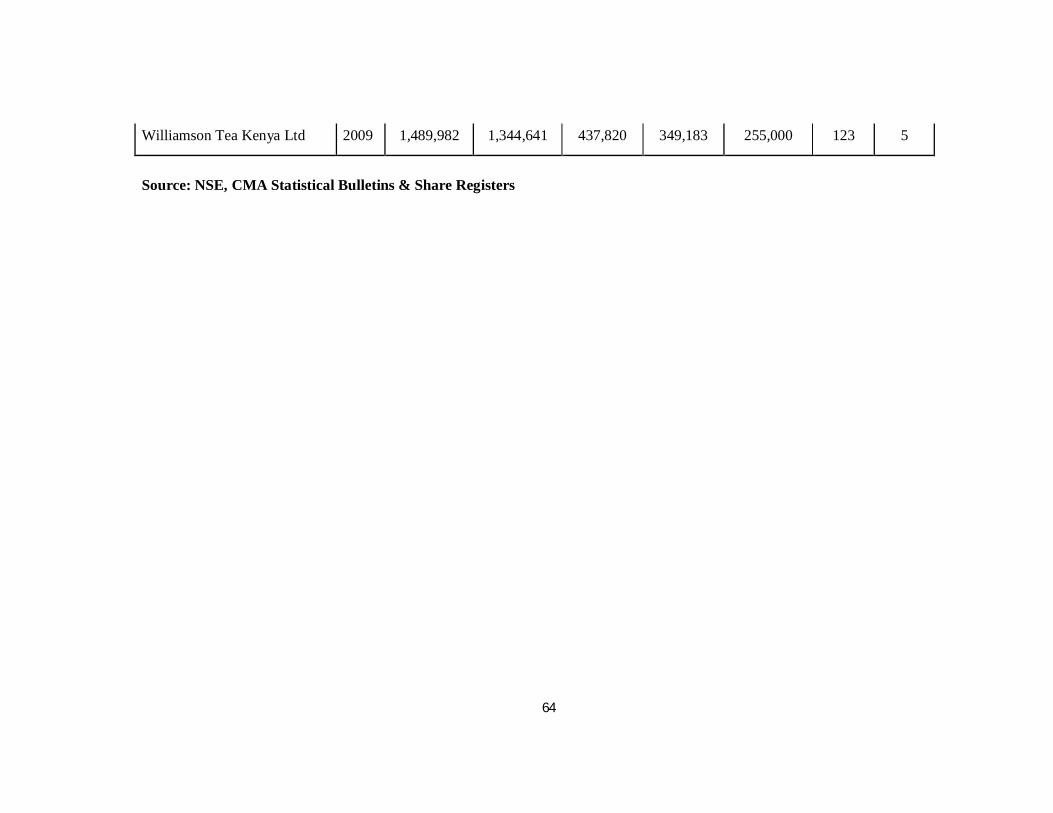
64
Williamson Tea Kenya Ltd 2009 1,489,982 1,344,641 437,820 349,183 255,000 123 5
Source: NSE, CMA Statistical Bulletins & Share Registers