Embed Size (px)
Citation preview
International Journal of Academic Research in Accounting , Finance and Management S ciences Vol. 3, No.3, July 2013, pp. 198–210
ISSN: 2225-8329 © 2013 HRMARS
www.hrmars.com
The Relationship between Changes in the Financial Leverage and the Values of the Tehran Listed Firms
Darioush DAMOURI1 Jamal Barzegari KHANAGHA2
Mahin KAFFASH3
1,2
Department of Economic, Faculty of Economic, Management and Accounting, Yazd University, Yazd, Iran, Safaieeh, daneshgah Road, Pajouhesh street, Yazd, Iran
Tel: (++98)351-8210250; (++98)351-8211670 1Email: [email protected],
2Email: [email protected]
3Department of Accounting, Yazd Branch, Islamic Azad University, Yazd, Iran
Safaieeh, Shoahadegomnam Road, Zip code: 89195/155, Yazd, Iran Tel: (++98)351-8211391; Fax: (++98)351-8214810
3Email: [email protected]
Abstract The financial management seeks to maximize the shareholders’ wealth. That is why the financial
leverage should be evaluated for its influence on the firm value. The main objective of this paper is to
examine the relationship between the changes in the financial leverage, stock returns and firm value. To achieve this goal, the association between the financial leverage and some variables such
as stock returns, expected future return, future investment, and future operational performance on the firm value has been tested. In this regard, financial leverage has been evaluated with the two measures of book value or market value. Using the multivariate regressions and the data of 98
selected firms listed on the Tehran Stock Exchange during 2001 to 2010, the relationships between the variables have been analyzed. The findings of the study indicate that the variations in the financial leverage and stock return are positively associated. However, it was found that there is no significant relationship between the changes in the financial leverage and expected future returns. It was also shown that the relationship between the changes in the financial leverage and future investment and future operating performance are different in terms of either market value or book value. Perceiving the type of the relationship between the changes in the financial leverage and
assets’ returns might be an indicator to select an optimal compound of debts used as the finance methods which lead to increasing return on assets and finally firm value.
Key words Changes in the Financial Leverage, Stock Return, Future Expected Return, Future Investment, Future
Operational Performance
DOI: 10.6007/IJARAFMS/v3-i3/130 URL: http://dx.doi.org/10.6007/IJARAFMS/v3-i3/130
1. Introduction
Capital budgeting and finance decisions are the main fields of the decision making process confronted by the financial directors of the publicly held corporations. Using the prior literatures and studies concerning financial management, it is observed that the most important reason for the underperformance of the companies is the inefficiency of the proper investment and finance. The companies prefer to use debts instead of stock issuance since there are difficulties in finance expenditures. In doing so, declining the operational performance shows itself by increasing the debts or financial leverage. Therefore, the existing weaknesses might cause the improper investments which threaten the persistency and life cycle of the companies (Casser, 2005). Furthermore, the inappropriate capital structure of each company impacts the whole fields related to the operations and might have some consequences such as inefficiency in marketing products, inability in proper application of human resources and similar topics. Therefore, board of directors
International Journal of Academic Research in Accounting , Finance and Management S ciences Vol. 3 (3), pp. 198–210, © 2013 HRMARS
199
or the top executive financial position of the company should establish an optimal capital structure by which the cost of equity is minimized and the highest profitability is achieved.
Establishing an optimal capital structure lies in analyzing and balancing the total factors affecting capital structure in a suitable manner. Consequently, the financial manager tries to determine the optimal capital structure of the firms along with following a joint objective of the management among all stakeholders which mainly seek to maximize their firm value in the long run (Hampton et al, 2003). The concept of leverage is very essential in planning the capital structure. Financial leverage is using the financial resources with a fixed cost like debts and preferred stocks instead of common stocks. The higher utilization of the debts and preferred stocks in a company, the more is the application of the financial leverage. Changes in the financial leverage might affect the finance capacity, risk taking, cost of capital, investment, strategic decisions and shareholders’ wealth (Cai and Zhang, 2011).
Followed by Modigiliani & Miller (1958), many theorists endeavored to select the capital structure of the firms and its relationship with the other organizational characteristics. Many studies concentrated on the market reflections to the changes in the capital structures caused by stock issuance or stock redemption. Additionally, using leverages might be impacted by various factors such as using commercial credit, paying dividends and so on (Cai and Zhang, 2011). As a result, the effects of financial leverage on the stock return has been examined after controlling some characteristics such as size, beta, book value to the market value and performance evaluation. This paper aims at examining the association of financial leverage changes and stock returns. Financial leverage might be related to the expected stock returns, investments and operational performance. Accordingly, the scholars seeks to find an answer to this question whether there is a significant relationship between the changes in the financial leverage and stock returns, future stock returns, future operating performance and future investments.
2. Literature Review
2.1. Finance Methods
The required resources of an institute might be financed through the owners’ equity or borrowing. Financing by the owners’ equity usually is shown in terms of increase in the current equity or receiving new or current shareholders’ capital. This is performed in the corporations by issuing common and preferred stocks. Borrowing based finance takes place by borrowing in form of recei ving loans from the individuals and monetary institutes, issuing securities or using business brands. Selecting any of these items differently influences the earnings of the owners and is disclosed in terms of earnings per share. This is one of the factors affecting the increase or decrease of the firm value in the market. Since the firms intend to maximize the shareholders’ wealth, the finance decisions are directly oriented to achieve the goals and this is the reason of their significance.
2.2. Cost of Equity
The financial manager evaluates the different finance methods whenever confronted with the need to supply funds. Consequently, those resources maximizing the firm value are considered to achieve the optimal capital structure. Making decisions about capital structure is very essential and is critically considered by the directors. Selecting each capital structure option holds some expenses for the company. Its guideline is concentrated on minimizing the costs which would naturally maximize the firm value (Hampton et al, 2003). Debts play key roles in finance decisions. Jensen (1986) believes that it is an efficient instrument by which the agency costs of the capital might be declined. Kraus & Litzenberger indicated that optimal capital structure includes finance through borrowing. Ross (1977) and Leland & Pyle (1977) take debts as an instrument for showing the useful value of the firms (Myers, 1984).
Cost of equity is the cost paid by the company in return for using financial resources. In other words, cost of equity is the minimum expected return of capital projects by which the stock prices become constant. Cost of equity is an indicator to measure the resources of finance and evaluate the investment facility. If the financial leverage affects the firm value, the managers look for the capital structure by which the cost of equity is minimized and the firm value is maximized. Considering the cost of equity, the least expensive resource should be selected among the different options of debts, preferred stocks and common stocks.
International Journal of Academic Research in Accounting , Finance and Management S ciences Vol. 3 (3), pp. 198–210, © 2013 HRMARS
200
2.3. Financial Leverage
Leverage ratios contribute in measuring the risk of using equity costs. There are various measures known for the capital structure among which the most important are book value based measures, market value based measures and semi market value based measures (adjusted market value).
Rajan and Zingales (1995) developed the measures of book value and information content. They believe that selection of a measure should be based on the research objectives. For instance, the ratio of debts to the total assets might be considered as an index for what remains after the shareholders are liquated. However, it is not an appropriate index about default risk in future. Since total debts include balance sheet items such as accounts payable which mostly is associated with the transactional objectives of the companies, the application level of financial leverage might be exaggerated. They argue that the accounts payable can be deducted from the debts amounts. However, they are still concerned about whether the other debts (such as pension debts) also exist which are not associated with the finance decisions. As a result, they think that the optimal index is the ratio of total debts to total resources in which the debts are re lated to finance goals.
2.4. Returns
Shareholders’ wealth depends on the two factors of risk and return. The future returns are not precisely determinable and shareholders take risks at investment stage. Investors intend to predict stock returns in order to maximize their benefits.
Financial theorists developed two conflicting visions about the influence of debt instrument on the future stock return. On one hand, some researchers such as Jnesen (1986) believe that using debts in those companies with much free cash flows and without profitable investment opportunities reduce the free cash flows available to the directors and increase stock returns. Brick and Ravid (1991) also declare debts and dividends as the equal information instruments and they argue that these two ones provide equality in financial position and future earnings of the company. They argue that the higher the dividend or debts, the better the financial position and results of the current and expected operations (Maria and Garcia, 2006). O n the other hand, some researchers believe that increasing financial leverage would finally lead to increase in bankruptcy costs. Furthermore, in those companies with high growth and profitable investment projects without free cash flows, the impacts of controlling debts is not of significant importance. This is because these companies mainly rely on capital markets to finance their investment projects and the market has enough opportunity to evaluate the firm performance along with the operations of the di rectors and investment projects. This would reduce agency costs too much extent (Jensen, 1986).
2.5. Operational Performance
Operational performance is a measure to evaluate the achievement level to the organizational objectives. The directors choose different finance methods to provide enough funds for the capital expenditures and operations. Some theories investigated the reason the companies select special finance methods and how this selection is reflected in the past and future performance (Casser and Gavin, 2005).
Increases in the debt level of the companies underscore the importance of examining the relationship between capital structure and firm performance. The power of the directors and shareholders are different and the specific impacts of debt policy on the performance should be recognized (Ibrahim El-Sayad, 2009). In addition, the finance methods are very effective in continuous operations and implementation of the profitable projects in the growth process. On the other hand, determining the impact of debt policies on the performance might contribute the investors and financial analysts to examine the performance in relation to the debts. Specifically, firm performance is the base of decision making and finance.
3. Research Background
Modigiliani & Miller (1985) found that increasing financial leverage increases stock risk and expected returns. Myers (1977) predicts that higher leverage increases the possibility of debt load excessively. As a result, those projects with the positive NPV are ignored by the company and this would finally decrease firm value. M.C Konnel (1995) examined the relationship between firm value, financial leverage and stocks’ ownership. He disclosed that there is a negative relationship between the firm value and financial leverage in
International Journal of Academic Research in Accounting , Finance and Management S ciences Vol. 3 (3), pp. 198–210, © 2013 HRMARS
201
those companies with low growth. They also indicated that assigning the ownership of the stocks between the insiders, institutional and shareholders highly affect the low growth firms rather than the high growth firms. Glissen and Machor (2000) argued that capital structure and return on assets (ROA) and sales growth are negatively associated. Kortov (2004) found results inconsistent with the findings of Modigiliani and Miller (1985) and they showed an inverse relationship between financial leverage and beta of the stocks.
The results of Ivazinia et al (2005) examined the impacts of financial leverage on the investment decisions and found that this is a negative relationship. This type of relationship is much more important for those companies with low growth than those with higher opportunities growth. In another study, Anna et al (2006) found that the negative impact of financial leverage on the investment in the unimportant sectors is much important than the key sectors. Furthermore, those companies with higher financial leverage impose limitations on the investment opportunities. The higher debt level leads to less investment in capital assets.
Tiyan and Zaytun (2007) found that the ratios of short-term debts to total assets, long-term assets to total assets, total debts to total assets and debts to total owners’ equity are significantly linked to ROA. In another study conducted in 2008, the relationship between financial leverage and ROA is examined. The authors concluded that the financial leverage, ROA and gross margin, as a performance measure, are significantly associated.
Adami et al (2010) used the impact of financial leverage on the stock return to estimate the abnormal returns of stocks from the three models of Fama and French (1993) , Sharp and Littner (1964) and Cohart (1997). They asserted that the stock return negatively associates with the financial leverage in all three models. Additionally, the high impact of financial leverage on the abnormal simultaneous returns disappears by considering some variables such as effective interest tax and industry concentration. However, the association of financial leverage and abnormal returns remains insignificant. Mora and Marchika (2010) examine the companies with the excessive capacity and found that those conservative policies of financial leverage which tend to maintain financial flexibility might increase the investments. Clearly, those companies with lower leverages have more investments. Mattsa (2011) also documented that larger markets prefer to invest in more profitable projects after increasing low financial leverage.
Results of Youmatelo (2012) show that financial leverage negatively affects the investment decisions and those companies with higher debts are less eager to invest in the capital assets. Cai and Zhang (2011) examined the changes in the ratio of financial leverage of some of the companies in the USA and indicated that these changes are negatively related to the stock returns. Moreover, the conclusions disclose that increasing leverage decreases future investments and finally decreases firm value.
4. Variable Measurement
4.1. Type of Variables and Operating Them
Financial Leverage
Leverage is an essential concept underscored in planning capital structure. Financial leverage deals with using financial resources for a fixed cost such as debts and preferred stocks in comparison with the common stocks. Financial leverage describes using financial debts. Capital gathered through debts is not a strong resource of finance and is more risky. Financial leverage might be used based on the book value or firm value (Cai and Zhang, 2011).
Leverage Level
Different variables might affect the selection of the financial leverage. Determining the capital structure is not the main objective of this study and all variables are not included consequently. In turn, the leverage level is regarded in order to capture the accumulative impacts these variables could have on the leverage (Cai and Zhang, 2011).
Stock Returns
Stock return is classified into two types of recognized return and expected return. The former is the return which is actually earned. Expected return is the estimated return of an asset which is expected by the investors to be earned in the future period. In this study, real return has been used as the dependent variable computed by the following formula:
International Journal of Academic Research in Accounting , Finance and Management S ciences Vol. 3 (3), pp. 198–210, © 2013 HRMARS
202
1t
ps1tt
iP
D)P(PR
(1)
In the above equation, Rt is the stock return and Dps is the annual dividends paid regularly in a
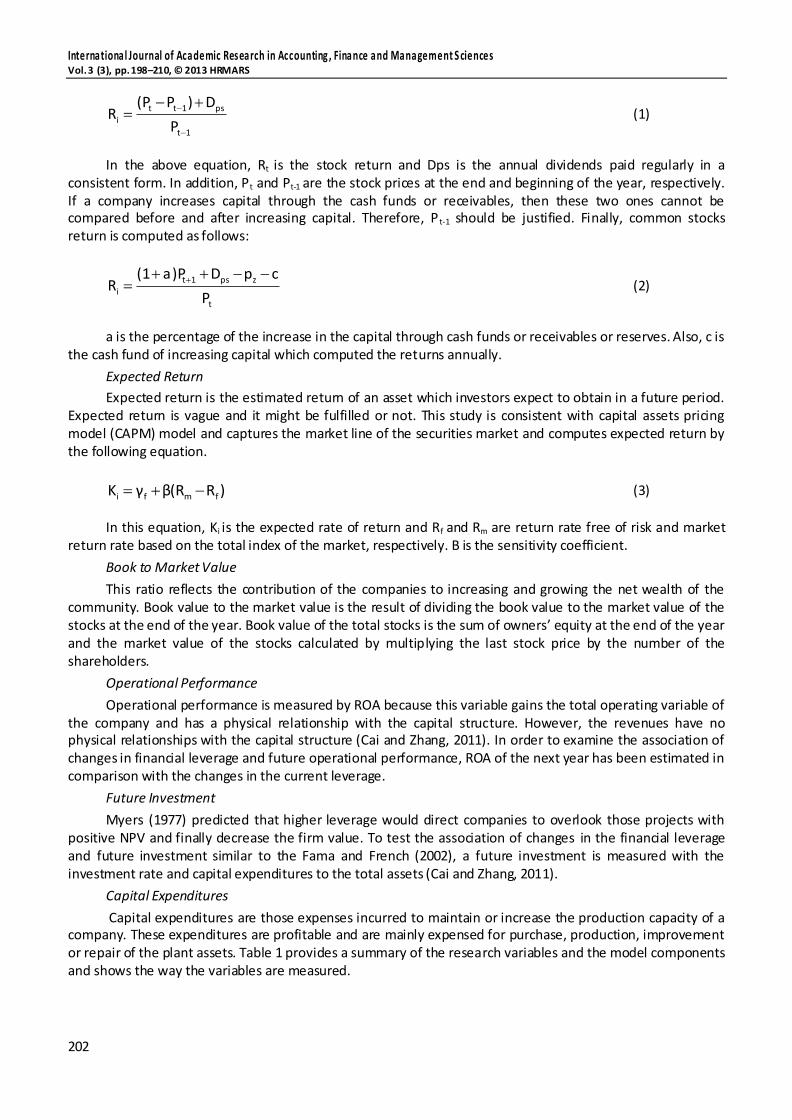
consistent form. In addition, Pt and Pt-1 are the stock prices at the end and beginning of the year, respectively. If a company increases capital through the cash funds or receivables, then these two ones cannot be compared before and after increasing capital. Therefore, P t-1 should be justified. Finally, common stocks return is computed as follows:
t
zps1t
iP
cpDa)P(1R
(2)
a is the percentage of the increase in the capital through cash funds or receivables or reserves. Also, c is
the cash fund of increasing capital which computed the returns annually.
Expected Return
Expected return is the estimated return of an asset which investors expect to obtain in a future period. Expected return is vague and it might be fulfilled or not. This study is consistent with capital assets pricing model (CAPM) model and captures the market line of the securities market and computes expected return by the following equation.
)Rβ(RγK fmfi (3)
In this equation, Ki is the expected rate of return and Rf and Rm are return rate free of risk and market
return rate based on the total index of the market, respectively. B is the sensitivity coefficient.
Book to Market Value
This ratio reflects the contribution of the companies to increasing and growing the net wealth of the community. Book value to the market value is the result of dividing the book value to the market value of the stocks at the end of the year. Book value of the total stocks is the sum of owners’ equity at the end of the year and the market value of the stocks calculated by multiplying the last stock price by the number of the shareholders.
Operational Performance
Operational performance is measured by ROA because this variable gains the total operating variable of the company and has a physical relationship with the capital structure. However, the revenues have no physical relationships with the capital structure (Cai and Zhang, 2011). In order to examine the association of changes in financial leverage and future operational performance, ROA of the next year has been estimated in comparison with the changes in the current leverage.
Future Investment
Myers (1977) predicted that higher leverage would direct companies to overlook those projects with positive NPV and finally decrease the firm value. To test the association of changes in the financial leverage and future investment similar to the Fama and French (2002), a future investment is measured with the investment rate and capital expenditures to the total assets (Cai and Zhang, 2011).
Capital Expenditures
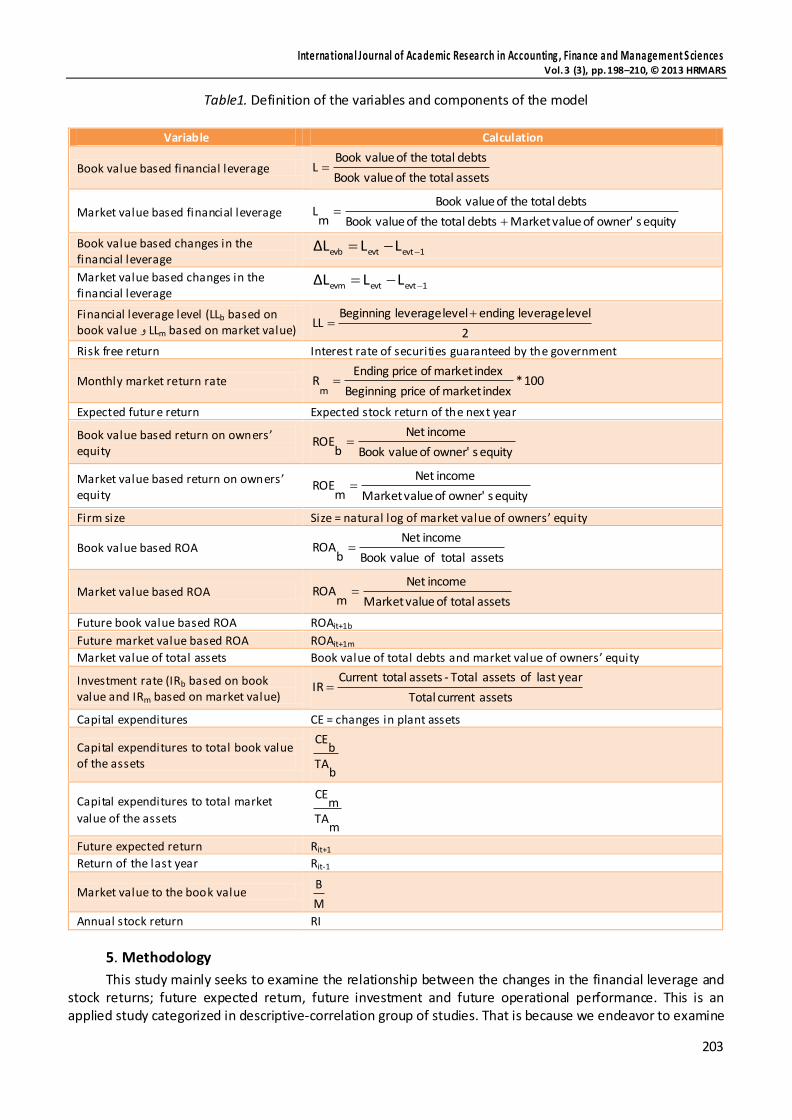
Capital expenditures are those expenses incurred to maintain or increase the production capacity of a company. These expenditures are profitable and are mainly expensed for purchase, production, improvement or repair of the plant assets. Table 1 provides a summary of the research variables and the model components and shows the way the variables are measured.
International Journal of Academic Research in Accounting , Finance and Management S ciences Vol. 3 (3), pp. 198–210, © 2013 HRMARS
203
Table1. Definition of the variables and components of the model
Variable Calculation
Book value based financial leverage assetstotaltheofvalueBook
debtstotaltheofvalueBookL
Market value based financial leverage equitysowner'ofvalueMarketdebtstotaltheofvalueBook
debtstotaltheofvalueBook
mL
Book value based changes in the financial leverage
1evtevtevb LLΔL
Market value based changes in the financial leverage
1evtevtevm LLΔL
Financial leverage level (LLb based on book value و LLm based on market value) 2
levelleverageending levelleverageBeginningLL
Risk free return Interest rate of securities guaranteed by the government
Monthly market return rate 100*indexmarketofpriceBeginning
indexmarketofprice EndingR
m
Expected future return Expected stock return of the next year
Book value based return on owners’ equity equitysowner'ofvalueBook
incomeNet
bROE
Market value based return on owners’ equity equitysowner'ofvalueMarket
incomeNet
mROE
Firm size Size = natural log of market value of owners’ equity
Book value based ROA assetstotalofvalueBook
incomeNet
bROA
Market value based ROA assetstotalofvalueMarket
incomeNet
mROA
Future book value based ROA ROAit+1b
Future market value based ROA ROAit+1m
Market value of total assets Book value of total debts and market value of owners’ equity
Investment rate (IRb based on book value and IRm based on market value) assetscurrentTotal
yearlastofassetsTotal -assetstotalCurrentIR
Capital expenditures CE = changes in plant assets
Capital expenditures to total book value of the assets
bTA
bCE
Capital expenditures to total market
value of the assets m
TAm
CE
Future expected return Rit+1
Return of the last year Rit-1
Market value to the book value M
B
Annual stock return RI
5. Methodology
This study mainly seeks to examine the relationship between the changes in the financial leverage and stock returns; future expected return, future investment and future operational performance. This is an applied study categorized in descriptive-correlation group of studies. That is because we endeavor to examine
International Journal of Academic Research in Accounting , Finance and Management S ciences Vol. 3 (3), pp. 198–210, © 2013 HRMARS
204
the association of different variables. To satisfy the major objective of the study, the main hypotheses are considered and tested:
H1: There is a significant relationship between book value based changes in the financial leverage and stock return.
H2: There is a significant relationship between market value based changes in the financial leverage and stock return.
H3: There is a significant relationship between book value based changes in the financial leverage and future expected stock return.
H4: There is a significant relationship between market value based changes in the financial leverage and future expected stock return.
H5: There is a significant relationship between book value based changes in the financial leverage and future investment.
H5a: There is a significant relationship between the book value based changes in the financial leverage and future investments examined by the investment rate.
H5b: There is a significant relationship between the book value based changes in the financial leverage and future investments examined by the capital expenditures.
H6: There is a significant relationship between the market value based changes in the financial leverage and future investment.
H6a: There is a significant relationship between the market value based changes in the financial leverage and future investments examined by the investment rate.
H6b: There is a significant relationship between the market value based changes in the financial leverage and future investments examined by the capital expenditures.
H7: There is a significant relationship between the book value based changes and future operational performance.
H8: There is a significant relationship between the market value based changes and future operational performance.
The population is constituted of those firms listed on the Tehran Stock Exchange for a ten year period over 2001 to 2010. The sample is also composed of 98 firms selected by filtering technique. Therefore, those companies selected as the sample should have the following characteristics:
1. The information of these companies is available and they have continuously been listed on the Tehran Stock Exchange.
2. Their end of fiscal year is consistent with the calendar year and they have not changed their fiscal year since 2001 to 2010.
3. Their equities are not negative over these years. This is because these firms might have a debt ratio which is higher than one and this might distort the results.
4. They are not classified as the banks or financial institutions (including holdings, investment companies and leasing).
Using the verified software and databases, the related data and variables are collected. EXCEL software and SPSS have been also used to test the research hypotheses. To analyze the data, the multivariate regression has been employed. The hypotheses are tested by fisher and t-student tests.
6. Testing Hypotheses and Empirical Findings
Testing the first hypothesis
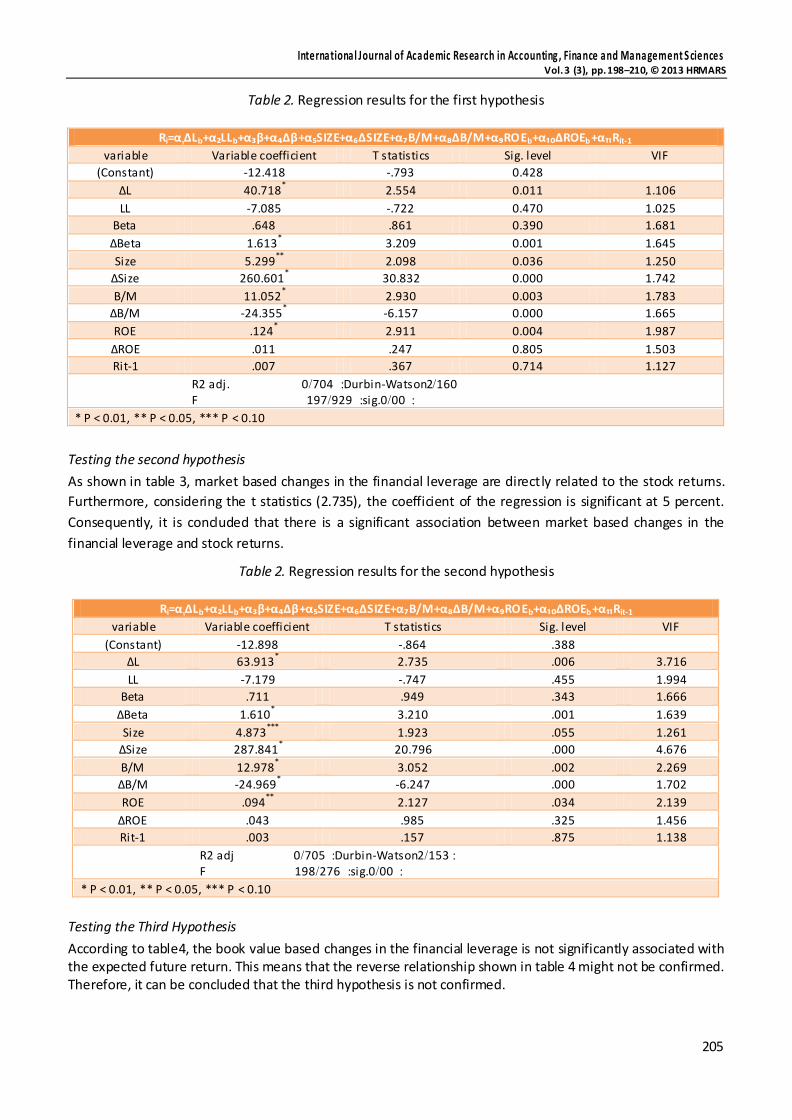
The coefficients of the model and the type of the relations are analyzed by implementing the regression model. The findings are disclosed in tables 2 and 3. Consistent with table 2, after implementing the multivariate regression model, the results of the above hypothesis show that book value changes in the financial leverage are directly associated with the stock returns. Based on the t statistics (2.554), the regression coefficient of this variable is significant at 5 percent. Therefore, the first hypothesis is confirmed by 95 percent of confidence and asserts that there is a significant relationship between book value based changes of financial leverage and stock returns.
International Journal of Academic Research in Accounting , Finance and Management S ciences Vol. 3 (3), pp. 198–210, © 2013 HRMARS
205
Table 2. Regression results for the first hypothesis
Ri=α₁∆Lb+α₂LLb+α₃β+α₄∆β+α₅SIZE+α₆∆SIZE+α₇Β/M+α₈∆Β/M+α₉ROEb+α₁₀∆ROEb+α₁₁Rit-1
variable Variable coefficient T statistics Sig. level VIF
(Constant) -12.418
-.793 0.428
∆L 40.718*
2.554 0.011 1.106
LL -7.085 -.722 0.470 1.025
Beta .648 .861 0.390 1.681
∆Beta 1.613*
3.209 0.001 1.645
Size 5.299**
2.098 0.036 1.250
∆Size 260.601*
30.832 0.000 1.742
B/M 11.052*
2.930 0.003 1.783
∆B/M -24.355*
-6.157 0.000 1.665
ROE .124*
2.911 0.004 1.987
∆ROE .011 .247 0.805 1.503
Rit-1 .007 .367 0.714 1.127
R2 adj. :407/0 Durbin-Watson 160/2
F :929/194 sig. :00/0
* P < 0.01, ** P < 0.05, *** P < 0.10
Testing the second hypothesis
As shown in table 3, market based changes in the financial leverage are directly related to the stock returns.
Furthermore, considering the t statistics (2.735), the coefficient of the regression is significant at 5 percent.
Consequently, it is concluded that there is a significant association between market based changes in the
financial leverage and stock returns.
Table 2. Regression results for the second hypothesis
Ri=α₁∆Lb+α₂LLb+α₃β+α₄∆β+α₅SIZE+α₆∆SIZE+α₇Β/M+α₈∆Β/M+α₉ROEb+α₁₀∆ROEb+α₁₁Rit-1
variable Variable coefficient T statistics Sig. level VIF
(Constant) -12.898 -.864 .388
∆L 63.913*
2.735 .006 3.716
LL -7.179 -.747 .455 1.994
Beta .711 .949 .343 1.666
∆Beta 1.610*
3.210 .001 1.639
Size 4.873***
1.923 .055 1.261
∆Size 287.841*
20.796 .000 4.676
B/M 12.978*
3.052 .002 2.269
∆B/M -24.969*
-6.247 .000 1.702
ROE .094**
2.127 .034 2.139
∆ROE .043 .985 .325 1.456
Rit-1 .003 .157 .875 1.138
R2 adj :405/0 Durbin-Watson :151/2
F :246/191 sig. :00/0
* P < 0.01, ** P < 0.05, *** P < 0.10
Testing the Third Hypothesis
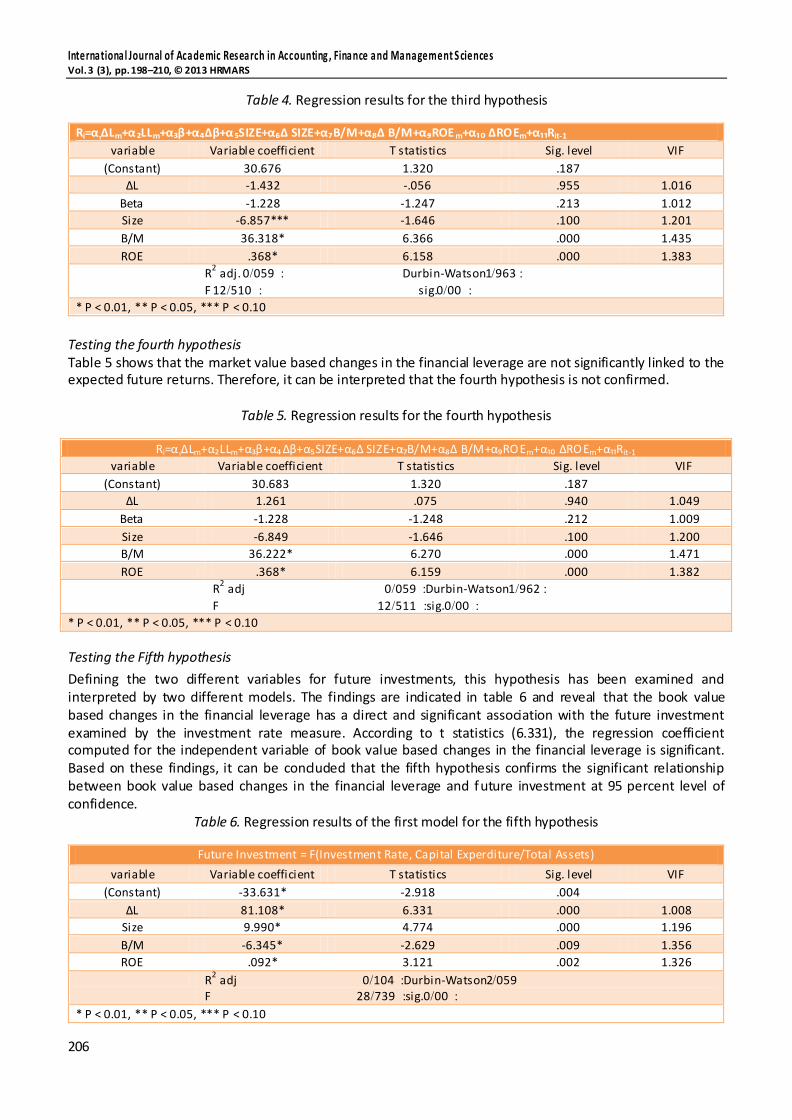
According to table4, the book value based changes in the financial leverage is not significantly associated with the expected future return. This means that the reverse relationship shown in table 4 might not be confirmed. Therefore, it can be concluded that the third hypothesis is not confirmed.
International Journal of Academic Research in Accounting , Finance and Management S ciences Vol. 3 (3), pp. 198–210, © 2013 HRMARS
206
Table 4. Regression results for the third hypothesis
Ri=α₁∆Lm+α₂LLm+α₃β+α₄∆β+α₅SIZE+α₆∆ SIZE+α₇Β/M+α₈∆ Β/M+α₉ROE m+α₁₀ ∆ROEm+α₁₁Rit-1
variable Variable coefficient T statistics Sig. level VIF
(Constant) 30.676 1.320 .187
∆L -1.432 -.056 .955 1.016
Beta -1.228 -1.247 .213 1.012
Size -6.857*** -1.646 .100 1.201
B/M 36.318* 6.366 .000 1.435
ROE .368* 6.158 .000 1.383
R2 adj. :059/0 Durbin-Watson :961/1
F :510/12 sig. :00/0
* P < 0.01, ** P < 0.05, *** P < 0.10
Testing the fourth hypothesis Table 5 shows that the market value based changes in the financial leverage are not significantly linked to the expected future returns. Therefore, it can be interpreted that the fourth hypothesis is not confirmed.
Table 5. Regression results for the fourth hypothesis
Ri=α ₁∆Lm+α₂LLm+α₃β+α₄∆β+α₅SIZE+α₆∆ SIZE+α₇Β/M+α₈∆ Β/M+α₉ROEm+α₁₀ ∆ROEm+α₁₁Rit-1
variable Variable coefficient T statistics Sig. level VIF
(Constant) 30.683 1.320 .187
∆L 1.261 .075 .940 1.049
Beta -1.228 -1.248 .212 1.009
Size -6.849 -1.646 .100 1.200
B/M 36.222* 6.270 .000 1.471
ROE .368* 6.159 .000 1.382 R
2 adj :059/0 Durbin-Watson :962/1
F :511/12 sig. :00/0
* P < 0.01, ** P < 0.05, *** P < 0.10
Testing the Fifth hypothesis
Defining the two different variables for future investments, this hypothesis has been examined and interpreted by two different models. The findings are indicated in table 6 and reveal that the book value based changes in the financial leverage has a direct and significant association with the future investment examined by the investment rate measure. According to t statistics (6.331), the regression coefficient computed for the independent variable of book value based changes in the financial leverage is significant. Based on these findings, it can be concluded that the fifth hypothesis confirms the significant relationship between book value based changes in the financial leverage and future investment at 95 percent level of confidence.
Table 6. Regression results of the first model for the fifth hypothesis
Future Investment = F(Investment Rate, Capital Experditure/Total Assets)
variable Variable coefficient T statistics Sig. level VIF
(Constant) -33.631* -2.918 .004
∆L 81.108* 6.331 .000 1.008
Size 9.990* 4.774 .000 1.196
B/M -6.345* -2.629 .009 1.356
ROE .092* 3.121 .002 1.326
R2 adj :107/0 Durbin-Watson 059/2
F :419/21 sig. :00/0
* P < 0.01, ** P < 0.05, *** P < 0.10

International Journal of Academic Research in Accounting , Finance and Management S ciences Vol. 3 (3), pp. 198–210, © 2013 HRMARS
207
The second model for testing the fifth hypothesis is so that the ratio of capital expenditures to the total assets is applied for the dependent variable of future investment. The replication of this hypothesis comes to the same as table 7. According to the findings, the book value change in the financial leverage is significantly related to the future investment examined by the capital expenditures measure. However, this significance has not been confirmed. Additionally, t statistics (1.813) and regression coefficient is computed for the independent variable of book value changes in the financial leverage which is not significant at 95 percent level of significance. Accordingly, it can be concluded that the fifth hypothesis is not confirmed at this level of significance.
Table 7. Regression result of the second model for the fifth hypothesis
Investment Rateb= α0+ α₁∆Lb +α2 SIZE + α3Β/M+ α4ROEb
variable Variable coefficient T statistics Sig. level VIF
(Constant) -.043 -.831 .406
∆L .105*** 1.813 .070 1.008
Size .015 1.572 .116 1.196
B/M -.011 -.963 .336 1.356
ROE .000** 2.501 .013 1.326
R2 adj :019/0 Durbin-Watson :159/1
F :515/5 sig. :00/0
* P < 0.01, ** P < 0.05, *** P < 0.10
Testing the Sixth Hypothesis This hypothesis defines two different variables for future investments and two different regression models are accordingly examined. The findings of the first model are provided in table 8. This confirms that the market value change in the financial leverage is significantly in an inverse relationship with the future investments measured by the investment rate measure. Based on these findings, the sixth hypothesis is confirmed at 95 percent level of significance.
Table 8. Regression results of the first model for the sixth hypothesis
(CE/TA)b= α0+ α₁∆Lb +α2 SIZE + α3Β/M+ α4ROEb
variable Variable coefficient T statistics Sig. level VIF
(Constant) -29.194*** -1.693 .091
∆L -276.710* -22.404 .000 1.046
Size 8.948* 2.859 .004 1.195
B/M -1.339 -.366 .715 1.394
ROE .187* 4.247 .000 1.326
R2 adj :111/0 Durbin-Watson 129/2
F :401/152 sig :00/0
* P < 0.01, ** P < 0.05, *** P < 0.10
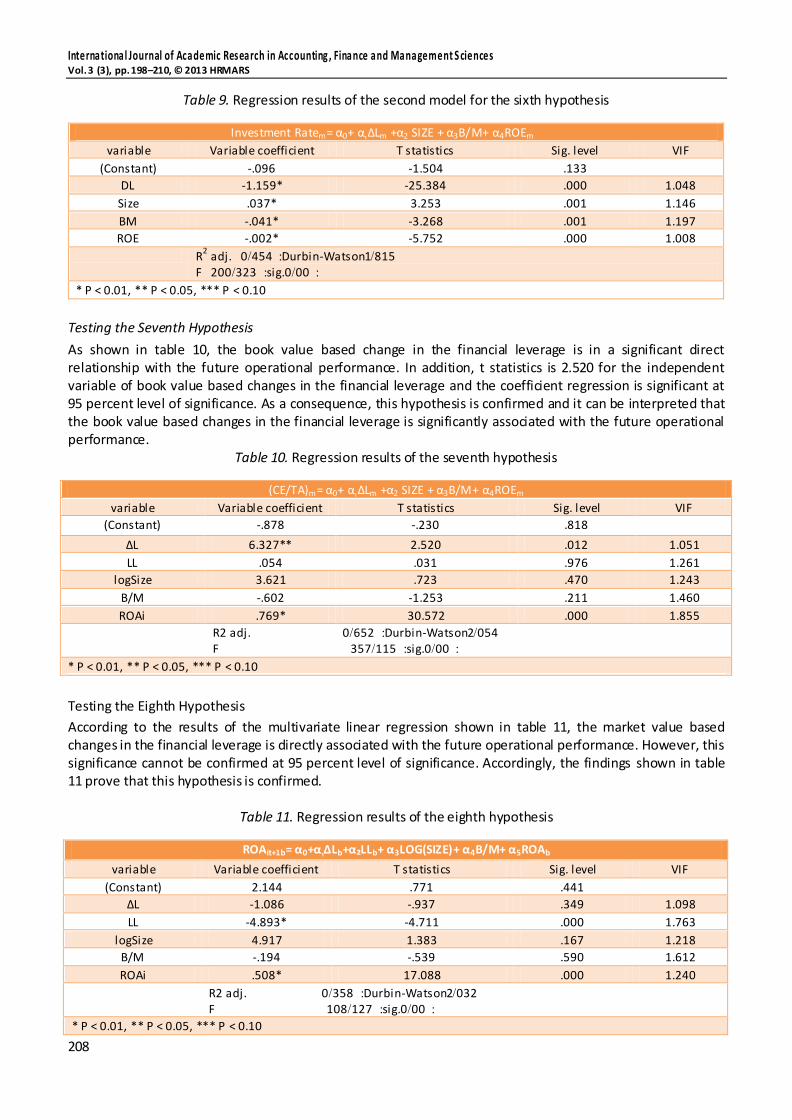
The second model of this hypothesis considers the ratio of capital expenditures to the total assets as the dependent variables of future investment. The replication results of this hypothesis in model 1 are shown in table 9. Consistent with these results, the market value based changes in the financial leverage is inversely related to the future investment examined by the investment expenditures. Furthermore, t statistics is -25.384 and the regression coefficient of this variable is significant at 95 percent level of significance. Consequently, this hypothesis is confirmed and shows that there is a significant relationship between market value based changes in the financial leverage and future investment.
International Journal of Academic Research in Accounting , Finance and Management S ciences Vol. 3 (3), pp. 198–210, © 2013 HRMARS
208
Table 9. Regression results of the second model for the sixth hypothesis
Investment Ratem= α0+ α₁∆Lm +α2 SIZE + α3Β/M+ α4ROEm
variable Variable coefficient T statistics Sig. level VIF
(Constant) -.096 -1.504 .133
DL -1.159* -25.384 .000 1.048
Size .037* 3.253 .001 1.146
BM -.041* -3.268 .001 1.197
ROE -.002* -5.752 .000 1.008
R2 adj. :757/0 Durbin-Watson 115/1
F :121/200 sig. :00/0
* P < 0.01, ** P < 0.05, *** P < 0.10
Testing the Seventh Hypothesis
As shown in table 10, the book value based change in the financial leverage is in a significant direct relationship with the future operational performance. In addition, t statistics is 2.520 for the independent variable of book value based changes in the financial leverage and the coefficient regression is significant at 95 percent level of significance. As a consequence, this hypothesis is confirmed and it can be interpreted that the book value based changes in the financial leverage is significantly associated with the future operational performance.
Table 10. Regression results of the seventh hypothesis
(CE/TA)m= α0+ α₁∆Lm +α2 SIZE + α3Β/M+ α4ROEm
variable Variable coefficient T statistics Sig. level VIF
(Constant) -.878 -.230 .818
∆L 6.327** 2.520 .012 1.051
LL .054 .031 .976 1.261
logSize 3.621 .723 .470 1.243
B/M -.602 -1.253 .211 1.460
ROAi .769* 30.572 .000 1.855 R2 adj. :652/0 Durbin-Watson 057/2
F :115/154 sig. :00/0
* P < 0.01, ** P < 0.05, *** P < 0.10
Testing the Eighth Hypothesis
According to the results of the multivariate linear regression shown in table 11, the market value based changes in the financial leverage is directly associated with the future operational performance. However, this significance cannot be confirmed at 95 percent level of significance. Accordingly, the findings shown in table 11 prove that this hypothesis is confirmed.
Table 11. Regression results of the eighth hypothesis
ROAit+1b= α0+α₁∆Lb+α₂LLb+ α3LOG(SIZE)+ α4Β/M+ α5ROAb
variable Variable coefficient T statistics Sig. level VIF
(Constant) 2.144 .771 .441
∆L -1.086 -.937 .349 1.098
LL -4.893* -4.711 .000 1.763
logSize 4.917 1.383 .167 1.218
B/M -.194 -.539 .590 1.612
ROAi .508* 17.088 .000 1.240
R2 adj. :151/0 Durbin-Watson 012/2
F :124/101 sig. :00/0
* P < 0.01, ** P < 0.05, *** P < 0.10
International Journal of Academic Research in Accounting , Finance and Management S ciences Vol. 3 (3), pp. 198–210, © 2013 HRMARS
209
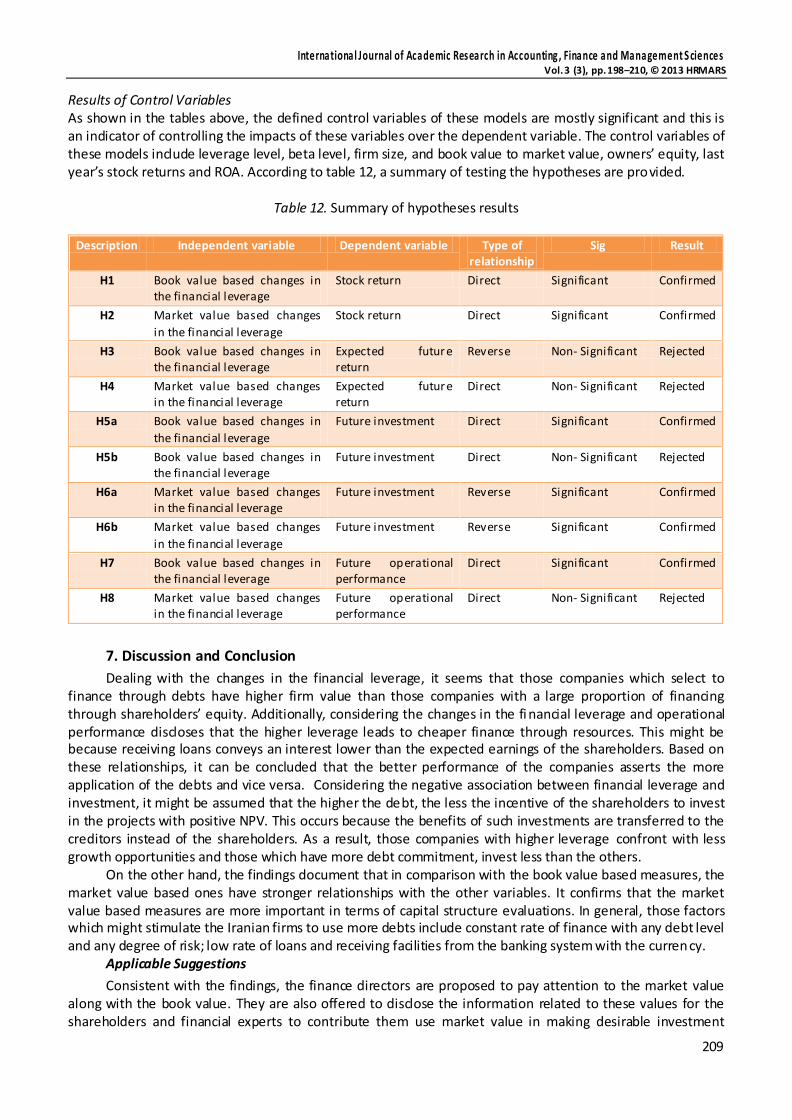
Results of Control Variables As shown in the tables above, the defined control variables of these models are mostly significant and this is an indicator of controlling the impacts of these variables over the dependent variable. The control variables of these models include leverage level, beta level, firm size, and book value to market value, owners’ equity, last year’s stock returns and ROA. According to table 12, a summary of testing the hypotheses are provided.
Table 12. Summary of hypotheses results
Description Independent variable Dependent variable Type of relationship
Sig Result
H1 Book value based changes in the financial leverage
Stock return Direct Significant Confirmed
H2 Market value based changes
in the financial leverage
Stock return Direct Significant Confirmed
H3 Book value based changes in the financial leverage
Expected future return
Reverse Non- Significant Rejected
H4 Market value based changes in the financial leverage
Expected future return
Direct Non- Significant Rejected
H5a Book value based changes in
the financial leverage
Future investment Direct Significant Confirmed
H5b Book value based changes in the financial leverage
Future investment Direct Non- Significant Rejected
H6a Market value based changes in the financial leverage
Future investment Reverse Significant Confirmed
H6b Market value based changes
in the financial leverage
Future investment Reverse Significant Confirmed
H7 Book value based changes in the financial leverage
Future operational performance
Direct Significant Confirmed
H8 Market value based changes in the financial leverage
Future operational performance
Direct Non- Significant Rejected
7. Discussion and Conclusion
Dealing with the changes in the financial leverage, it seems that those companies which select to finance through debts have higher firm value than those companies with a large proportion of financing through shareholders’ equity. Additionally, considering the changes in the fi nancial leverage and operational performance discloses that the higher leverage leads to cheaper finance through resources. This might be because receiving loans conveys an interest lower than the expected earnings of the shareholders. Based on these relationships, it can be concluded that the better performance of the companies asserts the more application of the debts and vice versa. Considering the negative association between financial leverage and investment, it might be assumed that the higher the debt, the less the incentive of the shareholders to invest in the projects with positive NPV. This occurs because the benefits of such investments are transferred to the creditors instead of the shareholders. As a result, those companies with higher leverage confront with less growth opportunities and those which have more debt commitment, invest less than the others.
On the other hand, the findings document that in comparison with the book value based measures, the market value based ones have stronger relationships with the other variables. It confirms that the market value based measures are more important in terms of capital structure evaluations. In general, those factors which might stimulate the Iranian firms to use more debts include constant rate of finance with any debt level and any degree of risk; low rate of loans and receiving facilities from the banking system with the currency.
Applicable Suggestions
Consistent with the findings, the finance directors are proposed to pay attention to the market value along with the book value. They are also offered to disclose the information related to these values for the shareholders and financial experts to contribute them use market value in making desirable investment
International Journal of Academic Research in Accounting , Finance and Management S ciences Vol. 3 (3), pp. 198–210, © 2013 HRMARS
210
decisions. Findings the type of the direct relationship between changes in the financial leverage and ROA, it can be used as a guidance to determine the optimum compound of debts as the finance methods which will finally increase ROA and firm value. Furthermore, the auditors try to analyze the market value in order to opine about the continuity of the company.
Finally, it is clear that financial leverage and using debts in the capital structure are directly associated with some performance measures such as ROA and stock returns. Therefore, it is obvious that those companies and managers who are very conservative and are afraid of borrowings avoid the debts and this leads them to revise their opinions.
References
1. Adamia, Roberta, Goughb, Orla, r Muradogluc, Gulnu, Sivaprasad, Sheeja, (2010), return and leverage, Oxford Business & Economics Conference Program
2. Ahna, Seoungpi, Denis, David J, Denis, Diane K, (2006), Leverage and investment in diversified firms, Journal of Financial Economics 79 , 317–337
3. Aivaziana, Varouj A , Geb, Ying , Qiu, Jiaping, (2005), The impact of leverage on firm investment: Canadian evidence, Journal of Corporate Finance 11 , 277– 291
4. Cai, Jie, Zhang, Zhe, (2011), Leverage change, debt overhang, and stock prices, Journal of Corporate Finance 17 , 391–402
5. Casser, Gavin John, (2005), External financing and firm operating performance working paper, University of California, Berkeley.
6. Cole, Rebel A., (2008), What Do We Know about the Capital Structure of Privately Held Firms? 7. Crnigoj M, &Mramor D, (2009), determinants of capital structure in emerging European economies
evidence from Slovenian firms” Emerging market finance & trade , 75(1):42-89 8. Hampton, john j. financial Dicision Making: Concept, problems and casws , 4 th ed. Prentice – Hall
international , Inc . Englewood Cliffs,(2003). 9. Ibrahim El- Sayed Ebaid, (2009), The impact of capital structure choice on firm perfamance:
empirical evidence from Egypt, The jornal of risk finance, VOL.10.NO.5, PP.477-487 10. Jensen, C. M. (1986), Agency Cost Of Free Cash Flow, Corporate Finance, and Takeovers. American
Economic Review, 76 (2): 71-92
11. Korteweg, A., (2004), Financial leverage and expected stock returns: evidence from pure exchange offers. Working Paper. Graduate School of Business, Stanford University http://ssrn.com/abstract=597922.
12. Maria, T. and Garcia, M., (2006), Capital Structure and Debt Maturity:Evidence from Emerging Markets, 13th Annual Conference of the Multinational Finance Society, June 25-27, - Edinburgh, UK
13. Matsa, D., (2011), Running on empty? Financial leverage and product quality in the supermarket industry. Amer. Econon. J. Microecon. 3, 137–173.
14. McConnell, John J, Servaesb, Henri, (1995), Equity ownership and the two faces of debt, Journal of Financial Economics 39 : 131-157
15. Modigliani, F., Miller, M.H., (1958). The cost of capital, corporation finance, and the theory of investment. Am. Econ. Rev. 48, 261–297.
16. Muradoglu, Gulnur, Sivaprasad, Sheeja, (1973), Using Firm Level Leverage as an Investment Strategy, Electronic copy available at: http://ssrn.com/abstract=1031198
17. Mura, R., Marchica, M., (2010). Financial flexibility, and investment ability and firm value: Evidence from firms with spare debt capacity. Finan. Manage. 39, 1339–1365.
18. Myers, S.C., (1977). Determinants of corporate borrowing. J. Financ. Econ. 5, 147–175. 19. Rajan,R.G.& zingales, l.(1995).”What do we know about capital structure? Some evidence from
international data” journal of finance 50 (5) .pp .1421-1460. 20. Tian, G.G,.Zeitun, R., (2007), Capital Structure and Corporate Performance, Australasian Accounting
Business and Finance Jurnal, N 4, P 40. Evidence from the Surveys of Small Business Finance
21. Umutlu, M, (2010), Firm leverage and investment decision in an emerging market www.ssrn.com