Embed Size (px)
Citation preview
THE RELATIONSHIP BETWEEN FINANCIAL MANAGEMENT
PRACTICES AND FINANCIAL PERFORMANCE OF SMES IN
NAIROBI CENTRAL BUSINESS DISTRICT KENYA
JANET WANJIKU KANYUGA
D61/79967/2015
A RESEARCH PROJECT SUBMITTED IN PARTIAL
FULFILLMENT OF THE REQUIREMENTS FOR THE AWARD
OF MASTER OF BUSINESS ADMINISTRATION DEGREE OF
UNIVERSITY OF NAIROBI
2017
ii
DECLARATION
This research project report is my original work and has not been submitted to any other
University for examination purpose.
Janet Wanjiku Kanyuga
D61/79967/2015
Signature ………………… Date …………….……
This research project has been submitted with my approval as the University supervisor
Mr. Mohamed N Mwachiti
Department of Finance and Accounting
School of business
Signature ………………… Date: ………………

iii
ACKNOWLEDGEMENT
First, I am indebted to GOD for seeing me through the entire. To my supervisor Mr.
Mwachiti, I extend my deepest thanks for the patience, guidance, recommendations and
your valuable time throughout the period of this research project
I thank my MBA colleagues and the staff of the school of business, University of
Nairobi who contributed to the achievement of this project. I thank all my mum and my
brother for the contributions they have contributed towards the success.
All small and medium enterprises that participate in my research for providing time and
information, without their help this research project could not have been successfully
written.

iv
DEDICATION
This research project is dedicated to parents and my siblings for their sacrifice and
motivation towards pursuing and completion of this course. Without them it would not
be possible.
To all of you I say thank you.
v
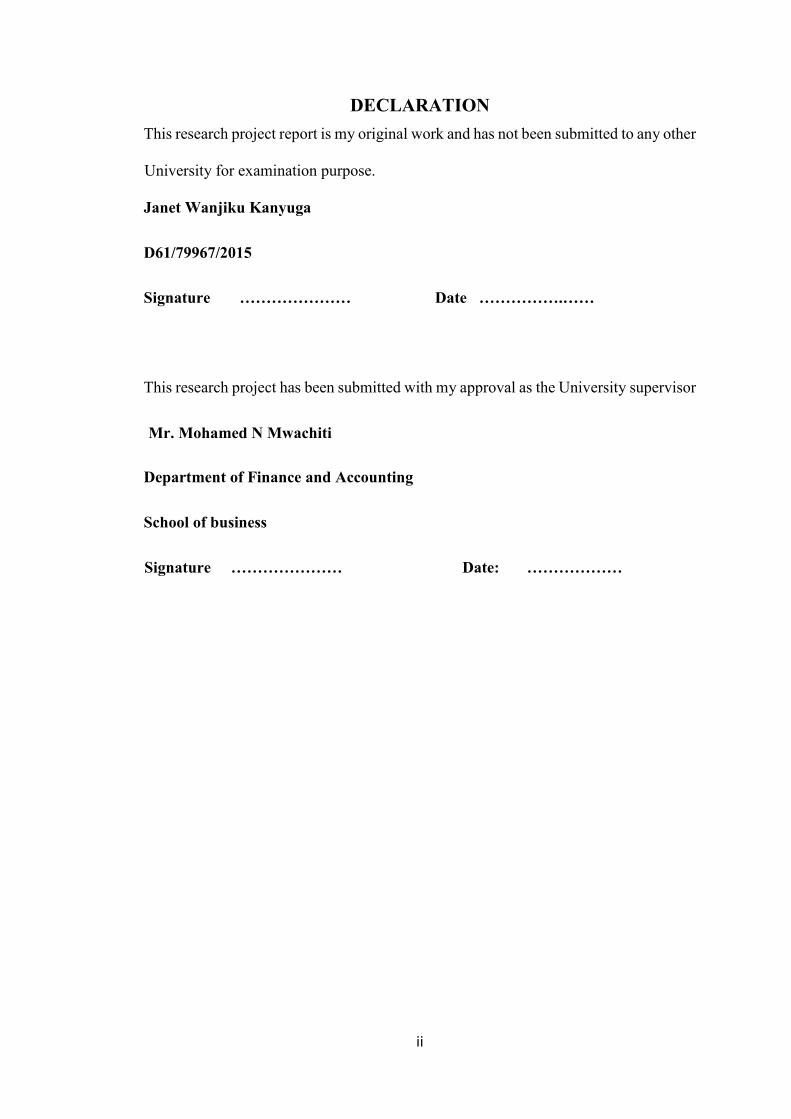
ABSTRACT
The objective of the study is to establish the relationship between financial management
practices and financial performance of small and medium enterprises in Nairobi central
business district. The financial management practices are said to be the functions
conducted by the accountants, chief financial officer and directors in the department of
budgeting, procurement, asset management and control.The researcher does not known
any study that has been done determine the degree to which the SMEs have embraced
financial management practices and how these practices have impacted on their
performance. The research design used in the study was a cross-sectional research
design and the secondary information and data was used to collect the data. The target
population of this study was 398 SMEs operating in the Nairobi CBD the sample was
100. Data collected was collected using secondary data and analysis statistically using
the regression and ANOVA.The analysis tool that was used is the SPSS. This statistic
is significant level of 0.000confidence level with p = 0.000.The researcher studied
financial performance of SMEs for five years starting from 2012 to 2015 financial years
to establish the relationship between financial management practices and financial
performance. The study four used aspects of financial management practices which
were ratios that were derived from the financial statement namely; current ratio, asset
turnover, debt to equity ratio size which is the natural log of sales.

vi
TABLE OF CONTENT
DECLARATION......................................................................................................... ii
ACKNOWLEDGEMENT ......................................................................................... iii
DEDICATION............................................................................................................ iv
ABSTRACT ..................................................................................................................v
LIST OF ABBREVIATION...................................................................................... ix
LIST OF TABLES .......................................................................................................x
CHAPTER ONE ..........................................................................................................1
INTRODUCTION........................................................................................................1
1.1 Background ............................................................................................................1
1.1.1 Financial Management Practices .......................................................................... 2
1.1.2 Financial Performance .......................................................................................... 4
1.1.3 Relationship between Financial Management Practices on Performance ............ 6
1.1.4 Small and Medium Enterprises in Kenya ............................................................. 7
1.2 Research Problem .................................................................................................... 8
1.3Objectives of the Study ........................................................................................... 10
1.4 Value of the Study ................................................................................................. 10
CHAPTER TWO .......................................................................................................11
LITERATURE REVIEW .........................................................................................11
2.1 Introduction ............................................................................................................ 11
2.2 Theoretical Review ................................................................................................ 11
2.2.1 Proprietary Theory .............................................................................................. 11
2.2.2 Residual Equity Theory ...................................................................................... 12
2.2.3 The Pecking-Order Theory ................................................................................. 13
vii
2.3 Financial Performance Practices ............................................................................ 13
2.3.1 Liquidity .............................................................................................................. 14
2.3.2 Solvency .............................................................................................................. 14
2.3.3 Profitability ......................................................................................................... 15
2.3.4 Repayment Capacity ........................................................................................... 16
2.3.5 Financial Efficiency ............................................................................................ 16
2.4 Empirical Review................................................................................................... 17
2.5 Summary of Literature Review .............................................................................. 19
CHAPTER THREE ...................................................................................................21
RESEARCH METHODOLOGY .............................................................................21
3.1 Introduction ............................................................................................................ 21
3.2 Research Design..................................................................................................... 21
3.3 Population .............................................................................................................. 21
3.4 Sampling ................................................................................................................ 21
3.5 Data Collection ...................................................................................................... 22
3.6 Data Presentation and Analysis ............................................................................. 22
3.7 Data Validity and Reliability ................................................................................. 23
CHAPTER FOUR ......................................................................................................25
DATA ANALYSIS, RESULTS AND DISCUSSIONS ...........................................25
4.1 Introduction ............................................................................................................25
4.2 Data Collection ......................................................................................................25
4.3 Data Validity ..........................................................................................................25
4.4 Descriptive Statistics .............................................................................................. 25
4.5 Regression Analysis ...............................................................................................26
viii
4.6.1 Analysis of Variance (ANOVA) ......................................................................... 27
4.6.2 Statistical Significance of Independent Variables .............................................. 27
4.7 Discussion of Findings ........................................................................................... 28
CHAPTER FIVE .......................................................................................................30
SUMMARY, CONCLUSION AND RECOMMENDATION ................................30
5.1 Introduction ............................................................................................................30
5.2 Summary of Findings .............................................................................................30
5.3 Conclusions ............................................................................................................ 31
5.4 Policy Recommendations....................................................................................... 32
5.4.1 Recommendations for further studies ................................................................. 33
5.5 Limitation of the study ........................................................................................... 33
REFERENCES ...........................................................................................................34
Appendix 1. Secondary Data ....................................................................................... i
Appendix 2: List of SMEs in Nairobi ........................................................................ ii
ix
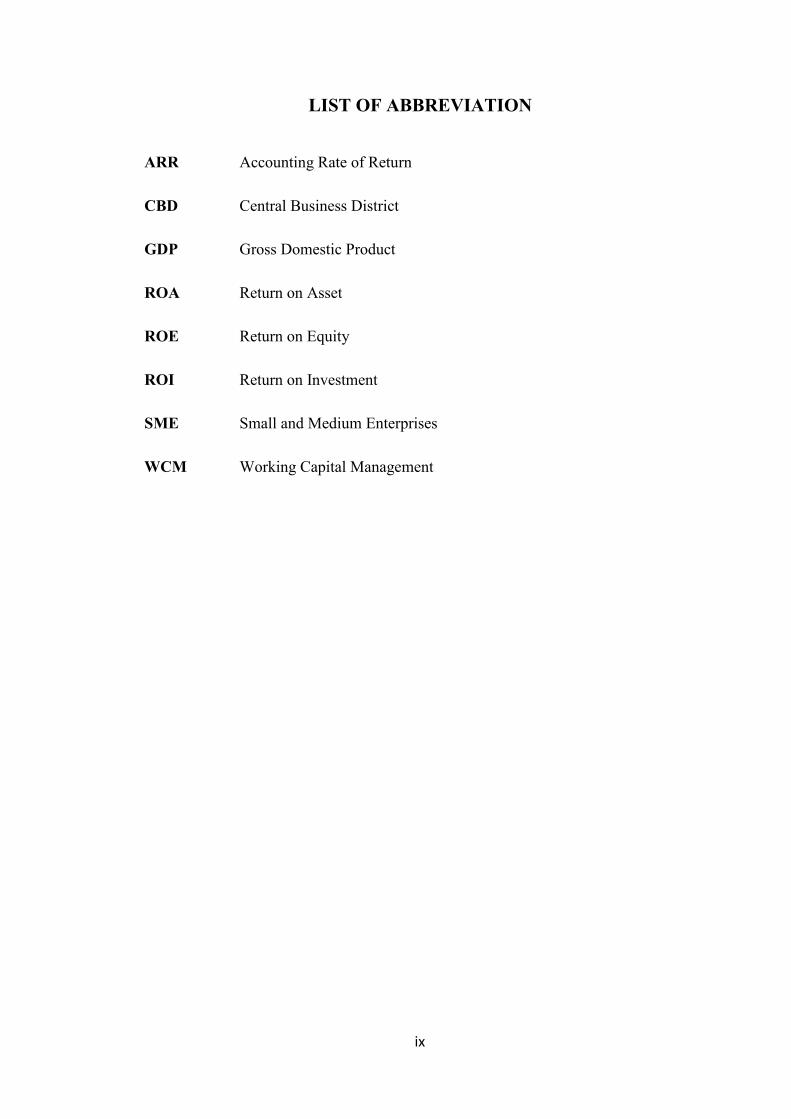
LIST OF ABBREVIATION
ARR Accounting Rate of Return
CBD Central Business District
GDP Gross Domestic Product
ROA Return on Asset
ROE Return on Equity
ROI Return on Investment
SME Small and Medium Enterprises
WCM Working Capital Management

x
LIST OF TABLES
Table 4.1: Descriptive statistics. ..................................................................................25
Table 4.2:Model Summary ..........................................................................................26
Table 4.3:Analysis of variance ....................................................................................27
Table 4.4: Regression coefficient. ...............................................................................28
1
CHAPTER ONE
INTRODUCTION
1.1Background
Small and medium enterprises have contributed to development of economy of the third
world countries. Most of the SMEs that operate are local organizations which are also
small in size, a percentage of thesealways do have prospective to progress and become
large companies on condition that the initiators and the business oriented persons of
those firms (Nichter &Goldmark, 2009). Although there is evidence in regard to the
positive associationin amidof financial management techniques bySME entrepreneurs
and the performance, the vitalresponsibilities among the two are not so farmade clear.
The aim of this study is to identify some relationship between the financial management
practices and SME performance.
Financial Management determines the organizational decisions that institutions make
they are tools used to analysis and make the decisions. The lasting and
temporaryresolutions models share similarobjective of improving worth of company by
making sure that gains from capital is higher than the cost of capital, while not taking
much economic risks (Pandey, 2010). Financial management practices applied the
models of money, time and risk and the way they are relates to each other (Gitman,
2011). Financial management is the act of ensuring that financial resources together
with dealing decisions in regardto accounting, financial reporting and budgeting,
capital budgeting decisions are also dealt with. The concerns that are dealt with are like
lease or buy property, and whether to use debt financing method or equity technique.
This is a function in the organization that has a grant determinant of success in small
2
businesses(Meredith, 1986) with the main objective of ensure the financial intentions
are met.
Contemporary approach of financial management emphasizes on the utilization of the
funds effectively. According to this methodology financial management can be sub-
divided into three distinct choices which include financing, investment, and dividend
choices (Brealey & Myers, 2007). Investing in fixed assets as capital budgeting along
with investing on current assets in place of working capital management is the
investment decision. Financing decisions aims at increasing income from various
resources depending on resolutionmade by the management on nature of source, length
charges of financing and the returns that would be yield. Dividend decisions involve
conclusions on the sharing of profits to the shareholders and to be retained (Brealey &
Myers, 2007).Sound statement of financial position and improved profit of the
organization is elaborated when the practices of financial management are
comprehensive.
1.1.1Financial Management Practices
In regard to Moore and Reichert (1989), financial management techniques were
purported to be the techniques executed by the accountants andor other directors’
specialists in the department of budgeting or any other related department. The
techniques can also be done by an entrepreneur while also gaining the knowledge from
the specialist. These financial management techniques like use of accounting
information system and asset management and ability to pay their obligations as they
fall due can be done by the SME owner while the rest can be done by the specialists.
3
Accounting Information System points out an assimilatedstructure within an enterprise
that engagestangible resources to convert economic facts into financial information to
the range of users in need. The organization to administer its knowledge effectively
through the use of technological antics that collaboration of human understanding and
technology. (Bhatt, 2001; Thomas & Kleiner, 1995). Firm’s current assets are
considered to be working management which is defined differently. Working capital is
said to be company’s total investment from current assets, they are the assets that a
firmsconverts them into cash within a period of less than a year (Keown; Martin; Petty;
& Scott, 2005). Investment in working capital comprises of shortage and carrying costs
which are the current liabilities which aids the firms to discover the balance between
the two. Capital structure is known as the relative of debt-to-equity ratio determined to
invest in an organization. It is the pertinent summation of perpetual short-range and
long-range obligations, preference shares and common sharesapplied in order to
finance a corporation. Stated differently financial structure is asum of total current
obligations, long term obligations, preference shares and common equity used to
finance the organization. Thus according to (Boateng, A 2004) capital structure is a
subset of financial structure, these are consequentlyoriginators of enterprise financing
which are permanent.
Accounting information provided by the financial statements areanalyzed by the use of
accounting information systems. Romney (2009) argued computer-centered accounting
information systems automatically streamlines the final information which is one of the
advantage of the system. As for Financial Reporting Analysis (FRA), the traditional
activities in accounting does not realize the goal of the enterprise until it is analyzed for
the purpose of managerial decisions (Gitman, 2011). WCM are decisions by
management in regard to working capital and short term financing (Garrison, 1999).

4
The linkamongst a current assets and current liabilities are taken care by this practice.
Non-current assets management defined to be a departmental function thattries to have
the record of fixed assets in order to practice the financial accounting, deterioration
maintenance and insurance against theft (Garrison, 1999). (Romney, 2009). Capital
structure of an organization can be defined as the determination andarrangement of
different wellsprings of financing which are either the equity financing or the debt
financing.
1.1.2Financial Performance
McMahon (1995) defines the financialperformance as an independent determinant of
how well a company uses its assets for its principal reason of business which is to create
and increase income. In the bigger picture, financial performance indicates the extent
to which financial objectives has been achieved. It is the gradual activities by the firm
to establish the outcomes of the organization’sstrategies and also the firms operations
in terms of money. The performance were used as theoverall determinants of a
business’seconomic health for a predetermined period, and can also be used to matchthe
similarity between companies in the same industry or to do a comparison test of
industries or sectors in aggregate(Padachi, 2006).
Enterprises can determine the financial performance by using of accounting
information and the values from the security market in a setting of financial
management methods. Managers determines the level of performance attained by using
the company stock market values. Investor maybe concerned withexamining the
modification in the value of the market. Firm achievement is examined over timeby
adjusting the average stock marketannually. The value is regularlyacquired
throughcomputing the changes of share price per annum. Management effectiveness is
5
dictated by high performance and efficiency in making use of enterprises resources
which therefore contributing to the nation’s economy(Naser and Mokhtar, 2004).The
financial performance of organizations are generallydeterminedby means of a mixture
of financial ratios scrutiny, benchmarking, measuring performance compared to budget
or a mixture of these methods.
According to Resseeuw(1997) the study has shown availablelink between the size and
the performance. Yoon (2004) concluded that performance of a company can diminish
if the size of the business growspast the most favorable level. If the managers and
owners of the businesses find it hard to control the managerial actions due to the size
then theperformance will be a negative (Pi and Timme 1993; Goddard et al. 2005).
Small and medium enterprises have a less rigid organizational structure, therefore easy
to realize growth opportunities. SMEs may be in a better position to adjust to the
continuous innovation together with networking with others. The size the business
maybe measured by the total asset, the total sales and the number of employees
Liquidity determines the ability the firm hasto pay its debt as they falldue, without
interfering with the dailybusinesses organization has. It is calculated from the statement
of financial position where itevaluates of the relations in between assets and company’s
obligations and operational liquidity known as the cash flow measures. Solvency brings
in light to the indication of the business that is able tosurvive in adverse situations by
relaying information about the operation capability to carry on with itsdaily operations
after a period of financial difficulty (Harrington & Wilson, 1989). It is the capital of
borrowed by the entrepreneur in relation to the amount that the owner hascapital
invested for the business

6
Profitability measures the magnitude of which a firmis able to generate its earnings.
The analysis concentrations on how revenue is related to expenses and the level on
which profits are in relation to the magnitude of investment in the firm. Profitability of
a particular institution is determined by theROA, ROE, operating and net profit
(Hansen & Mowen, 2005). Return on assets is an impression of how the enterprise is
making profit in with the use of its total assets. It shows how the enterprise efficient
and effectively manages and utilizes their assets to generate income.This iscomputed
by dividing a business’s profits gained annually by the total assets and it is shown as a
percent.
1.1.3Relationship between Financial Management Practices on
Performance
The eventual aim of financial management is to increase the wealth of the company’s
shareholders. Financial management techniques are critical to the accomplishments of
the organization for financial planning, controlling of working capital, control and
analysis, accounting information, management accounting and capital budgeting.
Accounting systems are the sources of data thatproprietors and managers of
company’srequire while operations carry on in any industry for they are used to
measure the financial performance. It isfor that reasonvital that the accounting practices
of organizations convey full and important financial information requiredenhancing
progressfinancial decisions made by entrepreneurs. Profitability management is
involved with maintaining andensuring the earnings are sufficient and surplus through
control to cost, putting attention to pricing policy, volume of sales, inventory
management and capital expenditures. Liquidity management ensures that the business
obligations are met when they fall due.McMahon (1995) also observed growth as
additionalconcern of financial management in relation to liquidity, growth and

7
profitability. Financial management has an objective of ensuring maximum share price
of securities in the market also ensuringfuture value of the firm.
1.1.4Small and Medium Enterprises in Kenya
Governments and Non-government institutions have recognized the significantof the
SMEs they are playing for the development of the nation. Consequently, mostlegal
policies are created in favor of backing up SME sector progressionby
introducingvariousplans that variesfrom tax incentives to technologicalsupport, from
regulatory requirements to ruleintervention, education and other forms ofcommerce
development services (Kagiri,1995).SMEs throughout the sectors industries in the
Kenyan economy and offers some of the most productive sources of recruitment and
are the backbone of large industries which are vitaltothe current economy. Currently
small and medium enterprises are found across the country and holds a hugeprospective
to generatemany of the employments, and to improve the country’s economic benefits.
The Kenya Government Baseline Survey (1999) definessmall and medium enterprises
as cooperationof skilled and unskilledsegments recruiting 10 to 100 employees’
with11-50 employees for a Small-scale enterprises.
The GDP contribution by the SMEs is higher than other and creating more jobs for both
skilled and unskilled personnel (Republic of Kenya, 2006). Approximations of 2005
indicated that, the SME sector hadhiredroughly 5 million persons which has been
gradually increasing (Migiro, & Wallis 2006). It is recognized that SMEs plays a
fundamentaltask in the Kenyan private sector. The SMEtook part in the general
investment, be itmanufacture of goods, provision of services, they have also been
involved in risky investmentchances and in increasing businesses in the market. In
Kenyan SMEshave contributed much in the engagement of pricing signals inthe
8
different segment such as garbage collection, delivering urban service; urban transport,
water supply and manufacturingvarious products both for home and money-
makingapplications (ILO, 1972). The importance of small and mediumbusinesses
activity in Kenya havegrown continuously as from the inception of year 1972. In
Kenya, it is currentlyextensivelyrenowned that the advancement of the SME sector is a
feasible and vibrantplan ofaccomplishing national objectives, as well asgeneration of
employment and the stablegrowthamongst sectors and sub-sectors. The
conclusionsyear 2003 SME Baseline Survey highlighted that the imperative role of
national’s development progression thatSMEs has participated in, predominantly in the
perspective of creating jobs to the society and improvingincome opportunities for most
of deprived people all over the nation. To be sure, the SME sector offerssignificantly
high employment the formal sector than does (Central Bureau of Statistics, 2002).
1.2Research Problem
Financial management techniques are decisive to the continued existence and
efficiency of most business enterprises of all natures. Research to find the reasons of
business failure shows that financial management contributes to it if poorly or
carelessly done may be cause of failure major (Berryman & Peacock, 1991).Financial
management techniquesapproved by corporations are assumed to increase the
shareholders wealth when they have contributedpositively toward the business
performance. Under the hypothesis of economic reasonable, comprehensive financial
management practices can be looked upon as a methodthrough which a businessapplies
in the view ofaccomplishing its purposes. SMEs in Kenya have played a significant
role of improving the GDP in the economy. SMEs in the manufacturing sector are said
to be enterprises with permanentworkers not beyond 100 and or sales turnover don’t
exceeding Ksh 150 million per annum.

9
Small and medium enterprises have beenimperative to the development process and
that it would have factors that benefit African countries to alleviate SMEs for further
growth. The small and medium enterprises have a paramount function to participate in
economic development, lessening poverty and creation ofemployment in third world
countries(Hallberg, 2000). Through proper management and capitalizing on the
investment the small and medium enterprises have the ability to grow and able to bridge
the gap in the society. Studies on how the financial management practices relates to
financial performance have brought about mixed results.
The associationamong capital budgeting practices and the financial performance in US
shows noconstantassociation irrespective of methods the growing adoption of capital
budgeting Klammer (1973). In their studies of company performance and application
of contemporary analytical methods and financial methods studying 500 firms in
US(Moore J and Reichert A 1989)discovered that organizationsusingthe refined capital
budgeting techniques are ensured ofenhanced financial performance than average.
More precisely, companies using recent inventory controlling procedures and Internal
Rate of Return (IRR) conveyedgreater financial performance, unlike those
corporationsapplyingapproaches such as Payback technique and Accounting Rate of
Return (ARR), (Raheman and Nasr, 2007).
Most of the researches that has been has associated other factors to financial
performance in different industries for example (Kitonga, 2013) conduced a research
to establish the linkamongst financial management techniques and the financial
performance in the Kenyanshipping industries. Other studies are from different context
Wanyugu (2001) did a research of financial management practices of SMEs in Kibera,
Kenya.The SMEs in Nairobi and in Kenya has practices that aim at ensuring that it
10
survives in the industries. Atieno M J (2013) conducted a research on the relationship
between financial planning and the financial performance of the SMEs in Kenya. There
is no study that has been conducted to relate the performances with the financial
management practices. Therefore this research aims at bringing more light how the
financial management techniques relates to the performance of SMEs.The research
aims at addressing the question:What are the relationship between the financial
management practices and the financial performance of the SMEs?
1.3 Objective of the Study
This objectivestudy was to determine the relationship between financial management
practices and financial performance of SME in NairobiCBD.
1.4Value of the Study
This study provides someunderstanding for finance personnel on the financial
management practices and how they are related with organizational performance. It
wouldas well provide crucial information to business firms mostly in to the
entrepreneurs on the mannerin which it willtake full advantage of the usage of financial
policies and performance. By considering the most fundamental financial practices that
may be applied, the enterprises are able strategize themselves to ensure success.
This study also acts as a reference point to other researchers as it relates the
existingattention in justifiable financial management practices in different industries.
11
CHAPTER TWO
LITERATURE REVIEW
2.1 Introduction
This chapter aimed at looking at the theoretical review, financial performance measures
and empirical review.
2.2Theoretical Review
2.2.1 Proprietary Theory
According to this theory, a business owned by a person or group of people with a center
of interest and is called the proprietor. Accounting serves the proprietors’ interests and
the in the financial statements contents are stated to be understood by stockholder. The
notion of proprietorship initiallyoriginates from the logic of the exposition of double-
entry bookkeeping: the equation for it can be interpreted that assets are for the
proprietor and the liabilities are their obligations. Thus, revenues received by the SMEs
increases of the proprietor’s wealth while the liabilities decreases of the proprietors’
wealth Hendriksen & Breda (2001). It is therefore important to make sure that capital
assets are used efficient in order to increase the profit. Interest, taxes, and other
deductions are expenses since they decrease the proprietorships and the net income is
dividend which is paid to the stockholders.
Husband (1954) favors the proprietary theory due to the fact that it provides logic and
consistency in accounting putting into account that stockholders bear the ultimate risk.
Proprietary theory best for sole proprietorship like SMEs but complex when the
businesses are bigger. However, accounting practices are still affected by this theory
implying that retained earnings are the net wealth of the stockholders and the business
12
owners. The owners of the SMEs will use the retained earnings to expand its businesses
and also to invest. The comprehensive income, which includes all items affecting the
net wealth, is one of the accounting practices that reflect the influence of the proprietary
theory (Hendriksen & Breda, 2001)
2.2.2 Residual Equity Theory
The deviations in asset valuation, profits and in residual income and concern of other
shareholders are the retained earnings of the common shareholders. The particular
equities are the obligations to the creditors and the others of preference shareholders
whereby in the statement of financial position formula is denoted as assets less
particular equities are equivalent to retained earnings. The equity of the shareholders in
the statement of financial position ought to be open separately from the equities of ideal
shareholders and additional particular equity holders. According to Hendriksen (1982),
the residual earnings is viewed as a perception where between the proprietary theories
in addition to the entity theory
The aim of the residual equity draws near to convey useful information toward general
stockholders in support of investment resolutions. In a going concern condition, the
recent value of common share mainly relies on the expectation of upcoming dividend
payables. Expected dividends are reliant on the expectations of total income with a
reduction of precise contractual debts, payment to precise share holders, and investing
back to the firm. Subsequently financial statement do not commonly prepared on the
origin of a guaranteed liquidation, the information supplied concerning the retained
equity should be functional forecasting probable expected dividends to common
shareholders together with liquidation dividends (Hendricksen, 1982). Revenues are
increase in the entrepreneurship and operating cost are reductions. Therefore net profit
13
accrues straight to the entrepreneur, to be precise; it represents a boost in the
possessions of the proprietor. The enterperneurship is measured by the net value of the
trade to the proprietor which is the richest idea (Hendricksen, 1982).
2.2.3 The Pecking-Order Theory
The management in this theory would prefer to finance first from retained equity, then
the debt, followed by other forms of finance like convertible loans, and last of all by
using externally issued equity. Theinsolvency, agency cost, and information asymmetry
playssubsequently small role inthe effectof the capital structure policy. Managers of the
SMEs mostly prefer investing where there is likely to increase the earnings. They make
their decision on the financial structure from the most priority to least priority the
pecking order theory (Norton 1991). Holmes et al. (1991) this theory is mostly used by
small business because the owner do not want to reduce their ownership and share it
with others. SMEs have restrictedin accessing capital and money markets and
consequentlyexperience much from undercapitalization which is therefore likely to
have expensive funds which act as a brake on their economic. Largecompanies use
higher levels of debt financing compared to small businesses.According to the pecking
order theory, the small businesses finds some limitations when it comes to equity
funding McMahon et al. (1995). Small enterprises normally do not have the alternatives
of issuing additional shares to the public and also the entrepreneurs always oppose the
dilution of their ownership.
2.3 Financial Performance Practices
Financial performance intends to assist the owners and managers of businesses examine
their operations from a financial point and provision ofimportant information
requiredforgood managerial decisions. It is impossible to manage or foresee all the
14
factors that affect the final outcome of any company’s decision. It is also impossible to
have obtain all of the information that would be required to make decision. Through
the effective financial management analysis the decision making can be enhanced
through using accessible information. Crane, (2010) approve the following measures
for financial analysis which was stated in five broad groups: liquidity, solvency,
profitability, repayment capacity and financial efficiency.
2.3.1 Liquidity
Liquidity determines the capability the business hasto meetobligations without
interrupting the normal business operations. It can be measured by financial position
which gives the link between assets and liabilities. Liquidity problem occurs when the
debt payable becomes due before the firm has not converted assets to equivalent cash
to settle. The suggested methods of determining liquidity are the current ratio and the
working capital (Crane 2010). The current ratio determines the relative affiliation
between the current asset and liabilities. Working capital consequently measures of
total cash accessible to buy inventory aftersellingall current assets and paying all
current liabilities. Working capital is conveyed in absolute monetary units; hence, it
determines the size of the business.
2.3.2 Solvency
Solvency is use to determine the borrowed capital by the company in relation to the
owner’s equity used to invest in the business. It provides the capability of the firm to
pay back all debts if all the assets were sold and also tells whether the business has the
capacity to endure risks by providing information about the ongoing concern of the
operations. Solvency determines what would happen in the event of all assets were sold
and that cash used to pay all the liabilities. The appropriateness of equity depends on
15
the size of business, making assessmentshard without using ratios for SMEs. According
to Crane 2010 the financial ratios mostly used to determine the solvency are the debt-
to-asset ratio, the equity-to-asset ratio and the leverage ratio also known as debt to
equity ratio. The debt to asset ratio is used to express total business liabilities as a
proportion of total business assets. The equity-to-asset ratio expresses the percentage
of total assets financed using owner’s equity. The SMEs mostly uses the debt to equity
to reflect the total amount contributed by the owner as the equity of the business and
the extent to the business has debt capital.
2.3.3 Profitability
Profitability measures the degree to which a business uses the factors of production to
generate profit. It is the determined by the sales and expenses and the level of profits is
related to the size of investment in the business. Most common measures are return on
assets (ROA) and of return on equity (ROE), operating profit margin and net income.
ROI is the cost of investment is deducted from the gains from the investment and the
difference is divided by the investment cost. The gain obtained by the investment is the
profits attained from sale of the investment or interest gained. ROI is actually a
widespread determinant for the reason that its adaptability and it is easy to use. If an
investment gains a negative return on investment, or else if there exists an alternative
opportunities with a higher ROI, then the investment ought not to be undertaken.
It evaluates the profit of an organization in relation to its total assets. ROA provides
some impressions for the management as to how effective the assets are exploited to
create earnings. It is computed by dividing the profits with the total assets and expressed
as a percent. ROA aids at determining the earnings that have been generated by
investing in the capital assets. ROA for public corporations can differ considerably and
16
will extremely be depending on the industry. The ROA measures the efficiency of all
assets to generate profit and is mostly used as an overall index of profitability, the
higher the value, the more businessis profitable. The ROE measures the rate at which
the owner’s equity employed is bringing profit in the business.
2.3.4 Repayment Capacity
Repayment capacity is firms’ ability to pay debts from both business income and non-
business income. Unprofitable business survives in the long-term due to inclusions of
income from non-business sources to compensation business losses. They are
commonly determined by the debt term, term debt repayment margin, capital lease
coverage ratio and capital replacement. The term debt and capital lease coverage ratio
is used to determine the capacitya borrower has to pay all required term debt and capital
lease payments. With a ratio over 1:1, then the borrower has greater the margin to cover
the payments.
2.3.5 Financial Efficiency
Financial efficiency determines the level that the business uses its assets to create
revenue and efficiency of production process. The financial efficiency is determined
using asset turnover ratio, operating expense ratio, depreciation ratio, interest ratio and
net income ratio. SMEs mostly use the asset turnover ratio to determine how efficiently
the assets generate revenue. If the ratio is high then the assets efficiently the used to
generate income. The net income ratio show the percentage of the total revenue that the
SME will remain with after all the expenses has been deducted.
17
2.4 Empirical Review
Klammer (1973) in his study concluded that, despite the increasingly use of the capital
budgeting techniques the link available in the financial performance and capital
budgeting techniques was irregular. In their multivariate study Moore and Reichert
(1989) found out that organizations that implement these sophisticated capital
budgeting methods are assumed to perform superior compared to average firm financial
performance. These therefore was an indication that the use of financial management
effectively would automatically lead to skyrocketing performance and therefore the
firm would be able to maximize the shareholders wealth.
According to Kazooba (2006), Uganda is fast in starting SMEs in Africa. It is also in
the highest inthe number of SMEs that performs poorly SMEs and highclosure of
SMEs. However, the study conducted didn’t indicate the relationship between financial
management and business efficiency of SMEs. Most enterprises fail due to incapability
of owners to organize and manageappropriately the current assets and current liabilities
(Mbaguta, 2002).
D’Amboise and Gasse (1980) researched on the use of financial statement analysis by
small manufacturers in Quebec, Canada, they discovered that small manufacturers in
shoe and plastic industries and made some conclusions from the financial statements
and the findings that manufacturing company’s managerial decisions are based on the
prepared financial reports. The research conducted by DeThomas and Fredenberger
(1985) observed that 81% of the small businesses often obtained summary of financial
information most of it being from the traditional statements and the bank
reconciliations. The study further discovered that 61 percent of respondents felt the
financial statements presented the information that isnecessary for planning and

18
decision-making and 11% of respondents used the financial statement information for
planning and evaluation. 2 percent of businesses exploited the financial ratio analysis,
and few tried to have simple historical comparisons.
According to Blocks (1997) survey of 232 small businesses in the USA pointed out that
payback technique is the most common model of investment selection for the small
businesses, while large organizations extensively integrates discounted cash flow
techniques in financial analysis of capital investment proposals (Proctor and Canada,
1992). This does not indicateany complexity simply because it is anexpression of
financial pressures being on the SMEs owner by banks. Payback period evaluated
capital project by 51 percent of respondents, while 30% stated use of some deviation
of accounting rate of return. Only 10 percent described use of discount cash flow
methods such as 5% for net present value and 2% internal rate of return. This finding
is steadyaccording to Soldofsky (1964), the trend of using easy and
sophisticatedtechniques for evaluating the project for the investment.
Small and medium businesses take on particularapplication, in the circumstance of the
European Union in general and in the case of Portugal in specifically. Portuguese SMEs
represents 99.8% of businesses according to National Institute of Statistics 2004, this
leads to jobformation and growth of the Portuguese economy. Taking into account the
compatibility of SMEs in the context of the Portuguese economy, the likely positive
manipulation of size to performance can contribute towards continued company’s
growth, which would be of advantage to the country’s economy. In this context,
Russeeuw (1997), researched on small firms and identified a positive relationship
between size and performance. However, he concluded that the positive effect of size
19
on performance this continues until when the size increases the performancewould start
to decrease.
In Kenya, Mundu (1997) pursued to that small enterprises in Kenya evaluate assorted
financial management techniquesand approved that 66 percent of the respondents did
not practice monetary budgeting, 70 percent of the business proprietors retained excess
cash in the business and over 56% of the business owners viewed cash as the security
to their wealth. Credit sales were made to the regular clients by about 70% of the
respondents. More than 80% prepares a business strategy with the most common
purpose of accessing finances. These conclude that the existence of SMEs
comprehensively depends on the good exercise of prescribed and informal financial
management.
2.5 Summary of Literature Review
The situation has continually been discussed that fimanacial management is used and
is connected to the financial performance. Studies indicate some existence of
complicated capital budgeting procedure like net present value and interest rate of
return shows some affirmative affiliation within return on asset whereas the
conventionaltechnique exhibited an inconsequential association. Nevertheless,
undesirable affiliation of capital budgeting methods with the financial performance has
been reported by some studies. This designate that implementation of a variety of
investigative tools are don’tadequately take along with them high performance and that
existence of factors for instance promotion, product advancement, staffing and training
that have a superior influence on profitability.
Local studies mainly makes the use of the capital budgeting method in the large
corporations and similarly in the banking industry. Their conclusionshowed that

20
discounted cash flow processes was not comprehensivelyput in place to assess
investment decisions. The report in the banking industry predominantly established the
irresistible use of the traditional techniques of capital budgeting. Thus assumed these
contradictory conclusions search sought to explore the affiliation of the financial
management techniques on financial performance of the small and medium enterprises
in Nairobi CBD.
21
CHAPTER THREE
RESEARCH METHODOLOGY
3.1Introduction
This chapter covered the design of the study, the target population, sampling and data
collection method, measurement of variables and data analysis techniques.
3.2 Research Design
Research design is a plan that is generated with an objective to get answers to the study
problem. Kothari (2003) said an understanding of circumstances for the collection and
scrutiny of data in an approach that aims at combining importance research purpose.
This study made use of the descriptive research design due to the fact that that SMEs
ventures in different businesses. Cross-sectional survey research is vivid in nature and
as defined by Glass & Hopkins (1984), vivid study design involves gathering data,
organizing and tabulating to give the information. The study sought to find the
relationship between financial management practices and performance of SMEs in
Nairobi CBD.
3.3 Population
The population of the study consisted of the SMEs Nairobi Central Business District.
There are 398 SMEs according to listed in the Kenya Businessof period ended June
2017.
3.4 Sampling
A sample is stratified sampling method. The stratification is based on the split of the
total population. The method intended at coming at section that would be the
representation of the whole population. Mugenda and Mugenda (2003) arguedsaying
22
that at least 30 respondents is a good sample representing a population that is not
beyond 10,000 respondents. They also claimed that 10% of the population is enough to
be used as the sample. The study will use 25% which is as compared to the 10% with a
sample of 100 SMEs.The phase of study covered 5 years from 2012 to 2016.
3.5 Data Collection
Secondary data collection method was used. The data wasobtained from the available
financial statements of SMEs.
3.6 Data Presentation and Analysis
The collected data wasedited for correctness, reliability and comprehensiveness which
will then be approved for coding and tabulation for ultimate scrutiny. Itwas then be
analyzed to produce vivid statistics such as percentages, means and deviations. The
data was presented using tables, and cross tabulations.
The linear regression model was put in place to test the link between the variables of
financial managementpractices as the independent variables and financial performance
as the dependent variable.
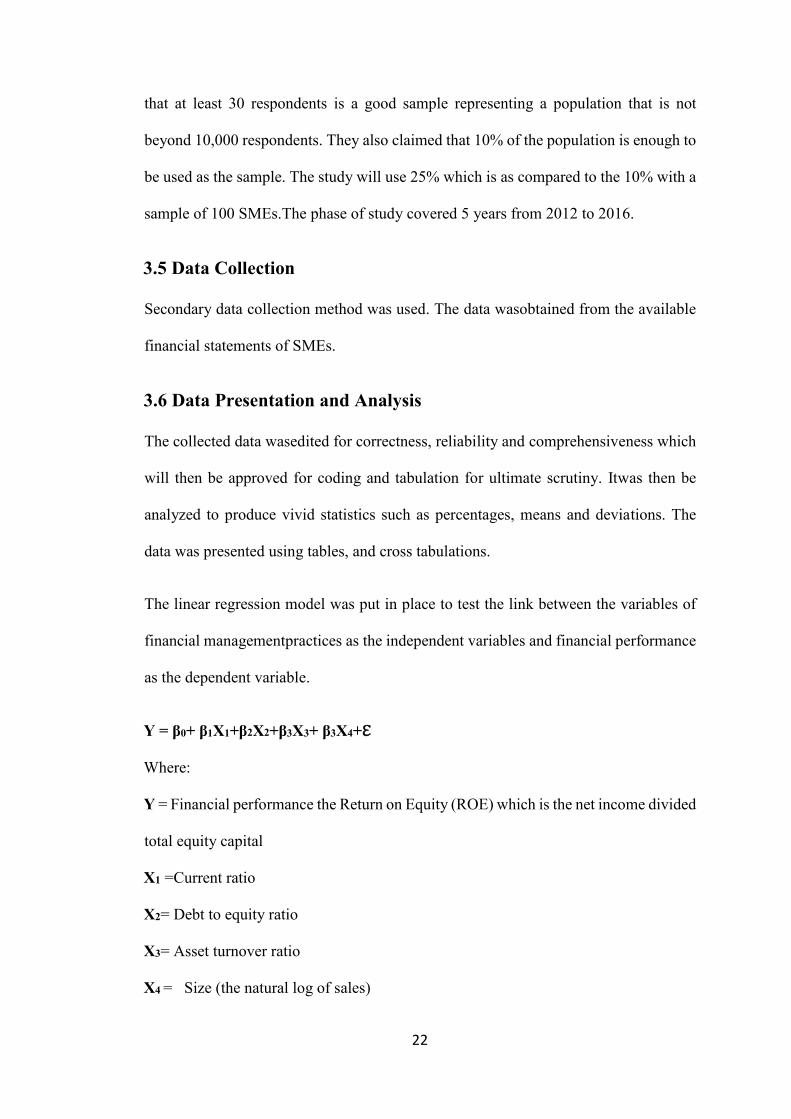
Y = β0+ β1X1+β2X2+β3X3+ β3X4+ℇ
Where:
Y = Financial performance the Return on Equity (ROE) which is the net income divided
total equity capital
X1 =Current ratio
X2= Debt to equity ratio
X3= Asset turnover ratio
X4 = Size (the natural log of sales)

23
β0 = Constant and β1,β2, andβ3β4are regression coefficients
ℇ= Error term
The error is the difference between the computed dependent variable value and the
actual value.
Financial performance is usually indicated in ratios form and they cover a number of
modelswhich are clustered as firms’ ability to make profit, efficient use of assets and
investment. Financial performance in this study is the dependent variable was measured
by the ratio of net profitsto the total assets. The study made the use of the profits that
are accrued by the SMEs in a period within which the study was conducted to measure
the financial performance. Moreover, financial performance was also measured using
mean and standard deviation to study the aspects related to financial performance. The
independent variable are the financial management practices are the asset turnover, the
size of the business, the debt to equity ratio the liquidity ratio and the current ratio
The coefficient of determination, R squared, tested the meaning of the regression model
in elaborating the link between financial management practices and financial
performance. R squared calculated showed the percentage variance in the dependent
variable that is explained by the independent variable(s). If theR squared high then the
model used is good. The analysis of variance(ANOVA) statistics wasused for
presentation of the regression model significance.
3.7Data Validity and Reliability
Describes to how well the result of a study can offer reliable results to the study question
(Remenyi et al, 1998). To make surethere is validity, the information from earlier
researches and different literatures which cover all the sections of the research will be
used. Theoretical framework is a recap of earlier studies that have been conducted.

24

25
CHAPTER FOUR
DATA ANALYSIS, RESULTS AND DISCUSSIONS
4.1 Introduction
This chapter aimed at discussingthe data analysis, findings and summary of significant
findings in the study.
4.2 Data Collection
This study examined the financial management practices and the financial performance
of the SMEs in Nairobi Central Business District. The population of study consisted of
398 SMEs. Data was collected from a sample of 100 small and medium enterprises the
data was obtained from 70 businesses that has the financial statements prepared in a
period of five years. This was a 70% response. Rahman and Ramos (2013) noted that a
fifty percent response rate of was good for analysis and for reporting and a 70% rate
and over was excellent.
4.3 Data Validity
The data which was sought on the financial statements that were available, in complete
form as needed. This data includes debt, current assets, noncurrent assets, noncurrent
liability current liability, sales and expenses to come up with the net profit for the
particular years and was adopted for this study.
4.4 Descriptive Statistics
Table1 provides the results of the descriptive measures the study used. They include
the mean and the standard deviation.

26
Table 1: Descriptive Statistics
Mean Std. Deviation N
ROA 0.9830 .2339 350
Size 0.2155 .39518 350
CurrentRatio 0.6805 .98469 350
DebttoEquity 0.6250 .67834 350
AssetTurnover 0.3892 .78294 350
The results in table 1 show that ROA has a mean 0.9830 a deviation of 0.2339 and of
Size has a mean of 0.2155 and a deviation of 0.39518 current ratio has a mean and a
deviation of 0.06805 0.98469 respectively. Debt to equity ratio has a mean and a
deviation of 0.625 0.67834 respectively. Asset turnover ratio has a mean of 0.3892 and
a deviation of 0.78294. Current ratio has a less relation to the performance with 0.98469
deviations as compared to size with 0.3952 deviation
4.5 Regression Analysis
The below regression analysis was used to define the relationship between the
dependent and independent variables.
Table 2: Model Summary
Mode
l
R R
Square
Adjusted R
Square
Std. Error of the
Estimate
Change Statistics
R Square
Change
F
Change
df1
1 .794
a .630 .597 .39573 .630 19.148 4
Source: Research Data
The table above R 0.794 representing a correlation coefficient between dependent
variable (ROA) and the independent variables (i.e size, current ratio, debt to equity ratio
and asset turnover ratio) indicating it’s a strong correlation. Hence it’s a strong indicator
that the predictor can explain the variation in the ROA upto to 79.4%.Even with the
correlation of determination of 59.7% also clearly explain the how well the model can
explain the relationship.
27
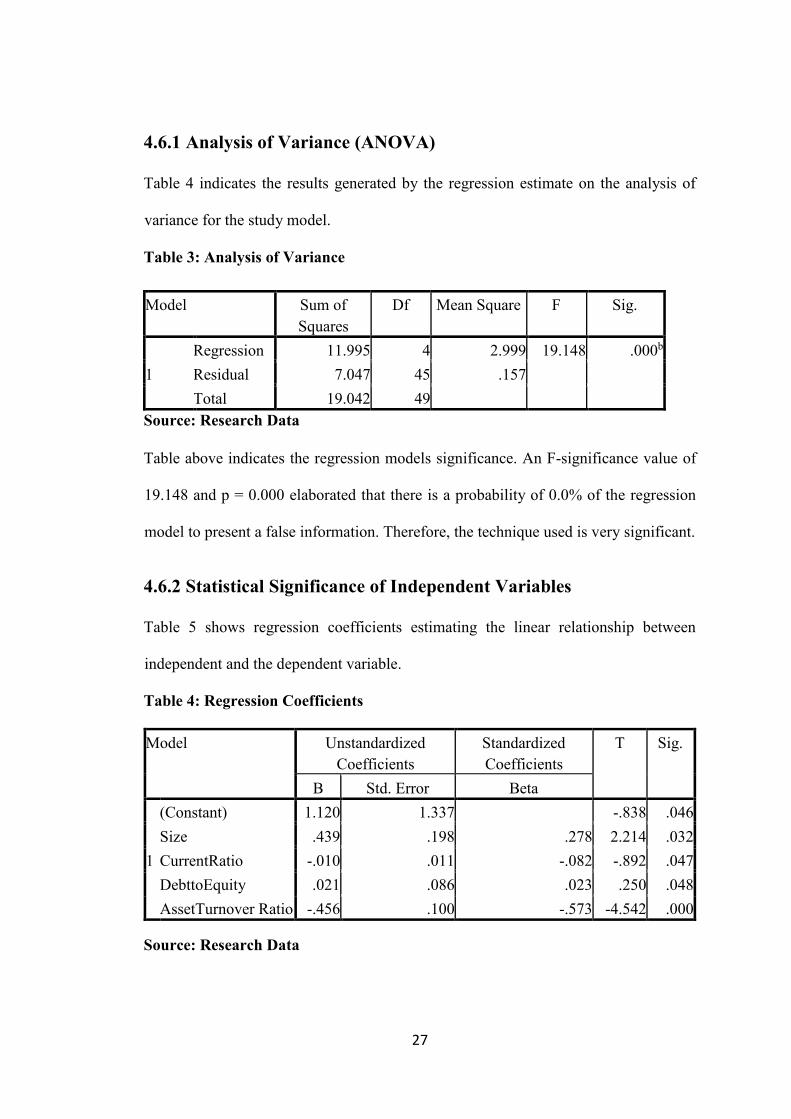
4.6.1 Analysis of Variance (ANOVA)
Table 4 indicates the results generated by the regression estimate on the analysis of
variance for the study model.
Table 3: Analysis of Variance
Model Sum of
Squares
Df Mean Square F Sig.
1
Regression 11.995 4 2.999 19.148 .000b
Residual 7.047 45 .157
Total 19.042 49
Source: Research Data
Table above indicates the regression models significance. An F-significance value of
19.148 and p = 0.000 elaborated that there is a probability of 0.0% of the regression
model to present a false information. Therefore, the technique used is very significant.
4.6.2 Statistical Significance of Independent Variables
Table 5 shows regression coefficients estimating the linear relationship between
independent and the dependent variable.
Table 4: Regression Coefficients
Model Unstandardized
Coefficients
Standardized
Coefficients
T Sig.
B Std. Error Beta
1
(Constant) 1.120 1.337 -.838 .046
Size .439 .198 .278 2.214 .032
CurrentRatio -.010 .011 -.082 -.892 .047
DebttoEquity .021 .086 .023 .250 .048
AssetTurnover Ratio -.456 .100 -.573 -4.542 .000
Source: Research Data

28
The table above shows that the constant is would be 1.120. The size, current ratio, debt
to equity ratio and asset turnover ratio has a beta value of 0.439, -0.1, 0.021, -0.456
respectively.
This explains that the regression constant shows that when the independent variable
(the size, current ratio, debt to equity ratio and asset turnover ratio) are zero the financial
performance (ROA) is 1.12. This indicates that without the financial management
practices the financial would be negative. The performance is increased by size by the
factor of 0.439 with a p value of 0.032, debt to equity increase by a factor of 0.021 and
a p value of 0.048 holding other factor constant. However current ratio and asset
turnover ratio decreases the financial performance (ROA) by a factor -0.10 and -0.456
and p value of 0.047 and 0.000 respectively holding other factors constant.
ROA=1.12-0.01X1+0.012X2-0.456X3+0.439X4+ε
4.7 Discussion of Findings
The core objective of the study was to establish the relationship between financial
management techniques and financial performance small and medium enterprises in
Nairobi CBD. Financial performance was the dependent where return on assets was
used to. Financial management practices were the independent variables where current
ratio, debt to equity ratio, asset turnover ratio and size were used. Size was measured
using the natural log of the sales.
The research findings established that the financial management practices used as the
independent variables can determine the financial performance the SMEs. These
variables could explain 79.4% of the variations in profits of SMEs. This indicated that
the regression model had power as all the variables could be explained by the model.
29
Mean represents either a value about which the data tend to center. The mean for ROA,
current ratio, debt to equity ratio, asset turnover ratio and size were 0.9830, 0.6805,
0.625, 0.3892 and 0.2155 respectively.
As indicated in the model summary, Table 3 the findings indicated a statistically
significant connection between Return on Assets and the independent variables. Table
4 indicated that the results are on the goodness of fit of the standard linear regression
with the Return on Assets and the independent variables. The F significance value of p
is less than 0.05 demonstrating that the model has a probability of less than 5%
prediction and it was reliable to draw conclusions. The results in Table 5 shows the
model coefficients and it indicates that all the indicators of Return on Assets were
significant
From the study, outcomes indicate that the relationship between the return on asset as
the performance and the current ratio, debt to equity ratio, asset turnover ratio and sizeas
the management techniques are significant with a p<0.005.
The main suggestion for the study was that there exists a statistical significant relation
involving Return on Assets and the financial management practices. The result of the
study therefore does not the null hypothesis. There exists a relationship between the
financial management practices in the small and medium enterprise in Nairobi CBD.

30
CHAPTER FIVE
SUMMARY, CONCLUSION AND RECOMMENDATION
5.1 Introduction
The objective of the study was to determine the relationship between financial
management practices and financial performance of small and medium enterprises in
Nairobi CBD. This chapter is a synopsis of the discussions and findings stated from the
previous chapters. Significant findings are summarized, conclusions drawn,
recommendations made to policy makers in addition to further recommendations on
opportunities for future research.
5.2 Summary of Findings
Financial management goes beyond the activities ofbookkeeping records. It is the vital
division of business organization and can’t be regardedas a differentfunction to be left
to finance staff or the group treasurer. Successfully managing financial resources is
significant in developing as well as expanding businesses;therefore the management
should ensure that there is thorough development and implementation financial plans
to ensure the organization achievesits ultimate goal. From the findings, the study found
that lack of financial management practices by the SMEs would lead to poor financial
performance holding all other factors constant.
The research findings presented intense information of the variables used in the data
scrutiny. These variables were the Return on Assets, size, current ratio, debt ratio and
asset turnover ratio. The results of the study concluded that there was an existing
connection withinthe performance computed using ROA and of financial management
practice as calculated using the ratios

31
The study also shows that not all the SMEs practice the financial management practice
and for those that practice not all comply with the simple accounting standards. This
led to a decrease of the data collected of 70 from a sample of 100. From the regression
model a positive is observed correlation of return on assets and size and also current
ratio. However there exists a negative relation with the asset turnover and the current
ratio. Analysis of variance (ANOVA) results show that the regression has a sum of
squares 0.11995 with a residual of 7.047 compared to a mean square of 0.2999 with a
residual of 0.157. The results produced an F-significance value of p< 0.021 which is
below 0.05.
5.3 Conclusions
The study sought to determine available link between financial management practices
and financial performance of the SMEs in Nairobi CBD. The research findings
portrayed that there was a weak relation that exists among the financial management
techniques and financial performance of SMEs. The debt to equity ratio current ratio
asset turnover ratio and size represented the financial management practices while
return on assets represented financial performance. The ratio is of benefit to investors
for it helps them to recognize the rate of risk for firms and the effectiveness of the
operations therefore making investment decisions. In their study, Saeedi and
Mahmoodi (2011) noted that financial leverage was positively associated with financial
performance as measured by return on assets (ROA). The findings of this study
contradicts with the conclusion made by Saeedi and Mahmoodi.
Assets are usually used as collateral for borrowing debt by firms. When Assets are used
as collateral considers the liquidity level of the asset in terms of it being converted to
cash because assets with high liquidity assets increase a firm’s availability to debt
financing. Debt to equity ratio determine the amount invested by the owner and the
32
amount borrowed from financial. The size is the determinant of how the sales are made
by the business. The asset turnover ratio determines the effective the business uses its
assets to generate profit. This in turn the earnings from this income generating asset
may be ploughed back in the firm investments leading to improved performance.
However, a firm may use this income generating as collateral for debt financing on the
basis of their liquidity.
The return on asset will assist the management to properly advise the managers on ways
to enhance their investment portfolio, in addition to accessing the required loans, and
also provide a competitive edge within the industry
5.4 Policy Recommendations
The study found that some of the SMEs has adopted financial management practices in
their businesses which makes their business prone to expected business risks and some
inefficiency. It is recommended that awareness be created by policy makers to the
SMEs on the importance of the financial management in business operations. The
accounting and finance professions should ensure that the entrepreneurs have the basic
knowledge of financial statement preparation in order to assess their financial activities.
The study established that most of the SMEs do not prepare financial statements and
less that prepare do not adhere to the standards. This has rendered the enterprises unable
to determine their progress and also to monitor their cost expenses. It is recommended
that SMEs adopt the culture financial statements and creation.
The study found that financial statement and financial management pactices in most of
the SMEs is not automated. This exposes the business to human errors and inaccuracies
which would have been avoided if technology was used. The study recommends use of
technology in financial statement for ease pf financial management processes.
33
5.4.1 Recommendations for further studies
The study collected data from the SMEs which are operating in Nairobi CBD the
research could be done to compare with other towns. The study can also be done to
relate the financial management and financial performance from case study or industry
The study proposes that similar research to be done on the effect of the financial
planning practices on other indicators of business performance such as sustainability,
market share and customer retention.
The study recommends that the same kind of study be done on the large enterprises
which have different practices and use different strategies to determine their
achievements.
5.5 Limitation of the study
The study was able to identify following limitations as below:
The study was limited to SMEs that are surviving as at the time of the study thus failing
enterprises were not considered.
Secondly, the study findings are difficult to compare due to differences in the SMEs in
terms of enterprise type, industry or time in operation. Therefore it would be motivating
to examine whether there are differences in the degree of financial management with
regard to industry affiliation.
Lastly, the time frame of 5 years within which study was based and therefore the results
may not be comprehensive and conclusive enough if SMEs that have operated for more
than 5 years or less than 5 years were studied.
34
REFERENCES
Axelsson, H., Jakovicka, J. &Kheddache, M. (2002). Capital budgeting sophistication and
performance – a puzzling relationship. Unpublished Doctoral Thesis Graduate
Business School, Goteborg University.
Atieno, M. J. (2013). The Relationship between financial Planing ang financial Performance
in Nairobi.
Bhattacharya, H. (2006). Working Capital Management: Strategies and Techniques. New
Delhi, Prentice Hall.
Berryman, J. and Peacock (1991).Small Business Financial Management Practices. A review
journal of small business management.
Block, S, 1997, Capital budgeting techniques used by small business firms in the 1990s. The
Engineering Economist.
Brealey, R.A. and S.C. Myers. Principles of Corporate Finance. 2000, 6th Edition, McGraw
Hill, New York, NY.
Brigham, E. F, 1995. Fundamental of Financial Management, 7th edition, Dryden Press, Forth
Worth.M.
Boateng, A., (2004). Determinants of Capital Structure. Evidence From International Joint
Ventures in Ghana. International Journal of Social Economics.
Crane, (2010b): Small firm bankruptcy. Journal of Small Business Management
Collins, J. & Jarvis, R. (2000).How Owner-Managers use accounts. Centre for Business
Performance. London, ICAEW.

35
Cosh, A. and Hughes, A.(1994), “Size, Financial Structure and Profitability,” in A. Hughes,
and D.J. Storey, D.J, (eds) Finance and the Small Firm, London: Routledge.
Coy, D., Dixon, K., Buchanan, and J. & Tower, G. (1997) .Recipients of public sector annual
reports: Theory and an empirical study compared. The British Accounting Review.
D’Amboise, G. Gasse, Y, 1980, Performance in small firms and utilization of formal
management techniques, Proceeding of the Joint National meeting TIMS/ORSA,
Washington
Edward, J., Robert, T. &Anandi, P. (2001).The association between the use of sophisticated
capital budgeting practices and corporate performance. The Engineering Economist.
Gilbert, E. (2005). Capital Budgeting: A case study analysis of the role of formal evaluation
techniques in the decision making process. Graduate School of Business, University of
Cape Town.
Gitman, L. (2011). Principles of Managerial Finance.10th Ed., Addison, Wesley Publishing,
2003, ISBN 0-201-78479-3.
Haka, Gordon & Pinches (1985).The Accounting Review; Vol. 60, No. 4, pp. 651-669.
Hallberg K (1999).Small Business Enterprises: A framework for intervention. Small Enterprise
Unit, Private Sector Development Department, The World Bank.
Hansen, J., Holthausen, J., & Mowen, D. (2005). Corporate governance, chief executive officer
compensation and firm performance. Journal of Financial Economics.
IASB (2007).Exposure Draft of a Proposed IFRS for Small and Medium-sized entities.
London, IASB.
36
ILO.(1972). ‘Employment, income and Equity: A strategy for increasing productive
employment in Kenya‟, Gevena International Labour Office
Kadondi, E.A. (2002). A survey of Capital Budgeting Techniques used by Companies listed at
the NSE. Unpublished MBA project University of Nairobi, Kenya.
Kitonga, K. G. (2013). The relationship between Financial Management Practices and
Financial Performance in the Shipping Industry in Kenya.
Kothari, C.R., Quantitative Techniques, 2nd ed., New Delhi: Vikas Publishing House Pvt. Ltd.,
1984
Keown, A.J. Martin, J.D. Petty, J.W and Scott, D.E (2005).Financial Management: Principles
and Applications (10th Ed.) New Jersey: Pearson Prentice Hall.
Khakasa, E. (2009). Evaluating Information Technology Investments – A Survey of Kenyan
Commercial Banks. Unpublished MBA project, Strathmore University, Kenya.
Klammer, T. (1973).The Association of Capital Budgeting Techniques with Firm Performance.
The Accounting Review.
Lin, W. & Raman, W. (1998).The Housing value-relevance of governmental accounting
information. Journal of Accounting and Public Policy; Vol. 17.
Laforet S, Tann J (2006). Innovative Characteristics of Small Manufacturing Firms. J. Small
Bus. Enterprise. Development
Mooi, S. & Mustapha, M. (2001).Firm Performance and Degree of Sophistication of Capital
Budgeting Practice. Some Malaysian Evidence; Proceedings of the Asia Pacific
Management Conference.
37
Moore, J. & Reichert, A. (1989).A Multivariate Study of Firm Performance and the Use of
Modern Analytical Tools and Financial Techniques. Interfaces; Vol. 19, No.3.
Myers, M., Gordon, L. & Hammer, M. (1991). Post-auditing Capital Assets and Firm
Performance: An Empirical Investigation, Managerial and Decision
Economics,Vol.12.
Myers, S. (1984). Finance Theory and Financial Strategy. Interfaces 14 (No. 1), 126137.
Mundu, S. N. (1997) Selected Financial Management Practices by Small Enterprises in Kenya:
The Case of K.I.E Kenya Industries Estates Wanes.
Mugenda,A. and Mugenda,O.(.2003). Research methods; quantitative and qualitative
approaches. Africa Center for Technology (ACTS), Nairobi Kenya
Murphy, B. (1978), Financial control in the small firm, Certified Accountant.
Nayak, A. & Greenfield, S. (1994). The Use of Management Accounting Information for
Managing Micro Businesses, Finance and the Small Firm. London, Routledge.
Nichter, S, Goldmark, L. 2009. Small Firm Growth in Developing Countries. World
Development
Nguyen, K.M. (2001). Financial Management Practices and Profitability of Small and
Medium Enterprises. Australia
Nyongesa, M.N. (2011). An Examination of the Relationship between Financial Performance
and Financial Management Practices of Insurance Companies in Kenya. Unpublished
MBA project University of Nairobi, Kenya
38
Olawale, F., Olumuyiwa, O. & George, H. (2010).An investigation into the Impact of
Investment Appraisal Techniques on the Profitability of Manufacturing Firms in the
Nelson Mandela Bay Metropolitan Area, South Africa. African Journal of Business
Management, Vol. 4 (7).
Olum, C.D. (1976). Capital Investment Appraisal Techniques and Publicity Finances
Investment Project in the Private Sector. Unpublished MBA project University of
Nairobi, Kenya.
Padachi K (2006). Trends in working capital management and its impact on firms' performance
Pandey, I. M. (2010).Financial Management. New Delhi: Vikas Publishing House PVT Ltd.
Peacock, R. W. (1985): Finding the causes of small business failure, management forum, 11(2).
Pi, L., & Timme, S. (1993). Corporate control and bank efficiency. Journal of Banking and
Finance, 17.
Pike, R.H. (1986). Sophisticated Capital Budgeting Systems and their Association with
Corporate Performance. Managerial and Decision Economics; Vol. 5, No.2
Raheman, A. and Nasr, M. (2007). Working Capital Management and Profitability: Case of
Pakistani Firms. International Review of Business Research Papers, 3, 279-300.
Ray, G.H. and Hutchinson, P.J. (1983), The Financing and Financial Control of Small
Enterprise Development, Aldershot: Gower
Remenyi D, Williams B. M., Arthur S. (1998). Doing Research in Business and Management.
An Introduction to Process and Method. London: Sage.
39
Russeeuw, P. (1997). Estimating the determinants of financial performance of very small
service firms. Conference Proceedings of USASBE—United States Association for
Small Business and Entrepreneurship, San Francisco, California
Romney et al, (2009).Accounting Information Systems, Upper Saddle River. New Jersey:
Pearson Prentice Hall.
Scott M. and R. Bruce (1987). 5 Stages of Growth in SMEs’, Long Range Planning 20, 3, 45,
22– 52.
Schall, L. &Sundem, G. (1980).Capital Budgeting Methods and Risk. A Further Analysis,
Financial Management. Spring.
Siba M. A, (2012). Relationship Between Financial Risk Management Practices and Financial
Performance of Commercial Banks in Kenya. Unpublished MBA report. University of
Nairobi. Kenya.
Saeedi, A. & Mahmoodi, I. (2011). Capital Structure and Firm Performance: Evidence from
Iranian Companies. International Research Journal of Finance and Economics, 70, 20-
29
Spackman, M. (2002).Multi-Year Perspective in Budgeting and Public Investment
Planning.Draft background paper for discussion at session III, 1 of the OECD Global
Forum on Sustainable Development (Paris: OECD).
Soldofsky, R. M, 1964, Capital budgeting practices in small manufacturing companies, in
studies in the factor market for small business firms, Iowa State University, Ames,
Iowa.
40
Tushabonwe- Kazooba, C. (2006). Causes of Small Business Failure in Uganda: A Case Study
from Bushenyi and Mbarara Towns
Wanyangu, D.M. (2001). Financial Management Practices of Micro and Small Enterprises in
Kenya.The Case of Kibera, Nairobi.
Watson GEH (2004). A situational analysis of entrepreneurship mentors in South Africa
University of South Africa

i
APPENDIX 1. SECONDARY DATA
Variables
Business
Current
Asset
Non-
current
Asset
Current
Liability
Non-
current
Liability
Deb
t
Equit
y
Sales Expenditure
1
2
3
4
5
6
7
8
9
10
“
“
“
100
ii
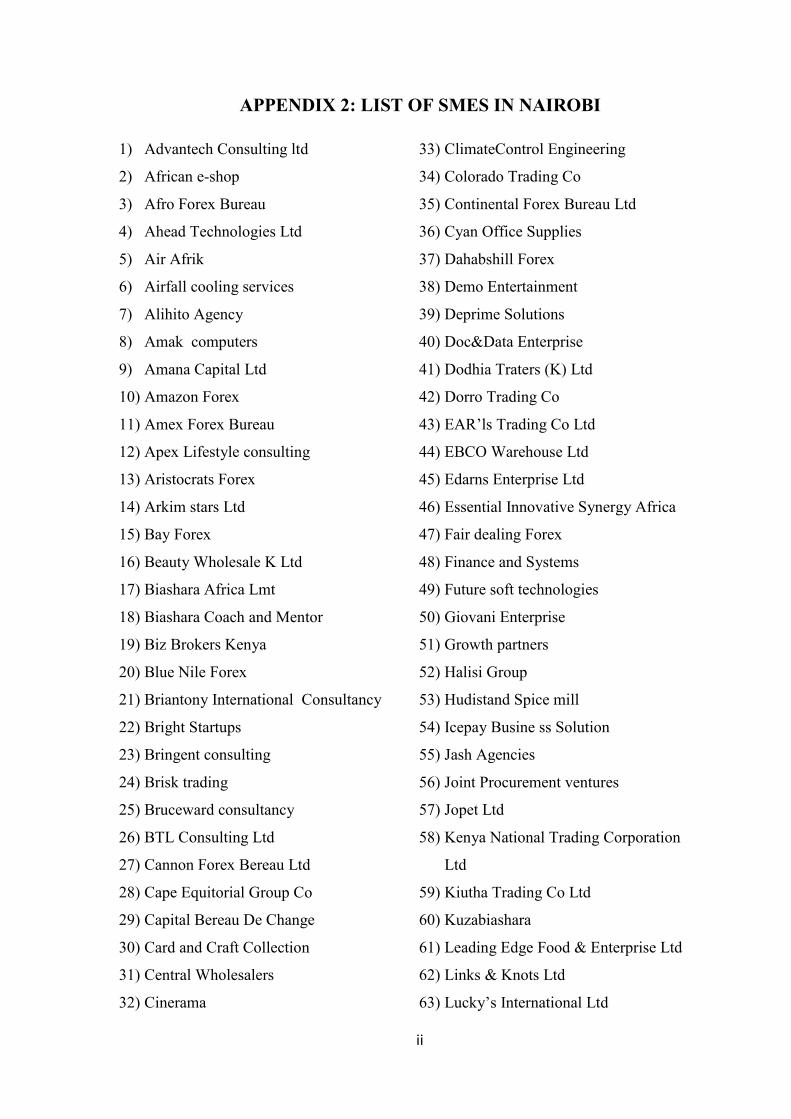
APPENDIX 2: LIST OF SMES IN NAIROBI
1) Advantech Consulting ltd
2) African e-shop
3) Afro Forex Bureau
4) Ahead Technologies Ltd
5) Air Afrik
6) Airfall cooling services
7) Alihito Agency
8) Amak computers
9) Amana Capital Ltd
10) Amazon Forex
11) Amex Forex Bureau
12) Apex Lifestyle consulting
13) Aristocrats Forex
14) Arkim stars Ltd
15) Bay Forex
16) Beauty Wholesale K Ltd
17) Biashara Africa Lmt
18) Biashara Coach and Mentor
19) Biz Brokers Kenya
20) Blue Nile Forex
21) Briantony International Consultancy
22) Bright Startups
23) Bringent consulting
24) Brisk trading
25) Bruceward consultancy
26) BTL Consulting Ltd
27) Cannon Forex Bereau Ltd
28) Cape Equitorial Group Co
29) Capital Bereau De Change
30) Card and Craft Collection
31) Central Wholesalers
32) Cinerama
33) ClimateControl Engineering
34) Colorado Trading Co
35) Continental Forex Bureau Ltd
36) Cyan Office Supplies
37) Dahabshill Forex
38) Demo Entertainment
39) Deprime Solutions
40) Doc&Data Enterprise
41) Dodhia Traters (K) Ltd
42) Dorro Trading Co
43) EAR’ls Trading Co Ltd
44) EBCO Warehouse Ltd
45) Edarns Enterprise Ltd
46) Essential Innovative Synergy Africa
47) Fair dealing Forex
48) Finance and Systems
49) Future soft technologies
50) Giovani Enterprise
51) Growth partners
52) Halisi Group
53) Hudistand Spice mill
54) Icepay Busine ss Solution
55) Jash Agencies
56) Joint Procurement ventures
57) Jopet Ltd
58) Kenya National Trading Corporation
Ltd
59) Kiutha Trading Co Ltd
60) Kuzabiashara
61) Leading Edge Food & Enterprise Ltd
62) Links & Knots Ltd
63) Lucky’s International Ltd

iii
64) Mansikh Trading Co
65) Mitsui & Co Ltd
66) Moneypoint Forex Bureau Ltd
67) Nelson Ngethe & Son
68) Nikohapa Ventures
69) Offshore Forex Bureau Ltd
70) Ohala Classified
71) Old MarkSoap Factory Ltd
72) OneSource Financial Services Ltd
73) Pacific Firm Ltd
74) Pacific Forex Bureau Ltd
75) Pinnacle Forex Bureau Ltd
76) Planet Connection Ltd
77) Power Brands Limited
78) Rahito Trading Co
79) Razfar Investment Ltd
80) Savislinks technologies
81) Savvy Concepts
82) Sky Forex Bureau
83) SME Kenya
84) Socio Trading Co Ltd
85) Soko huru
86) Southlink Trading Co Ltd
87) Speedy Exchange Buraeu
88) Sterling Forex Bureau Ltd
89) Taylorea
90) Tender Base Ltd
91) Tentel Trade & Supplies Ltd
92) T-Lynk Enterprise
93) Tomen Corp
94) Top Rank Trading Co
95) Triple EPE Foundation
96) Unique Slim Point & SPA
97) Urban Propreties Consultants
Developers Ltd
98) Viffa consult ltd
99) Wallpaper Kenya
100) Wellspa Ltd
Source: Kenya Business List
iv
Map of Nairobi CBD