Embed Size (px)
Citation preview
The relationship between primary medical qualification region and nationality at the time of registration Working paper 2 – March 2017
2
Contents Executivesummary............................................................................................................................................................3
Introduction.......................................................................................................................................................................4
Statementofproblem........................................................................................................................................................5
PMQregion....................................................................................................................................................................5Nationalitygroupatthetimeofregistration.................................................................................................................5
Method...............................................................................................................................................................................7
Developinganestimationmodel...................................................................................................................................7Informationusedinthemodelling.................................................................................................................................7
Testingtheestimationmodel........................................................................................................................................8
Results................................................................................................................................................................................9Countsofdoctors...........................................................................................................................................................9
Proportionsoftheworkforce.......................................................................................................................................10
Discussion.........................................................................................................................................................................12
Limitationsoftheanalysis............................................................................................................................................12Conclusions..................................................................................................................................................................12
Furtherinformation......................................................................................................................................................12
AnnexA-estimationmodeldesignandtesting...............................................................................................................13Modeldesign................................................................................................................................................................13
Modeltesting...............................................................................................................................................................21
3
Executive summary This working paper reports the results of an analysis of how the regions in which doctors gained their primary medical qualifications (PMQs) relate to their nationalities at the time that they joined the register. By regions, we mean here UK, European Economic Area (EEA), and international medical graduate (IMG).
Of about 232,000 licensed doctors, almost 67,000 doctors who joined the register before 2004 have no nationality information recorded. However, these missing data about nationality at the time of registration may be imputed from other information on the register with a reasonable degree of accuracy.
Having imputed the missing nationality data, the counts of EEA national doctors are compared with those for EEA qualified doctors practising in each country of the UK. The counts of non-EEA national doctors are compared with those for IMGs.
The paper concludes that:
n EEA region PMQ is not a reliable indicator for counting doctors who were of EEA nationality at the time of their registration - therefore in considering the workforce implications of Brexit, it will be important to have regard to the fact that EEA region PMQ data under-estimates the number of EEA nationals;
n Counting IMG doctors may produce a reasonably accurate surrogate measure for the numbers of doctors who were of non-EEA nationality at the time of their registration.
4
Introduction The referendum vote to leave the European Union (EU) has generated interest in the GMC's data about the nationalities of the doctors practising in the UK. This is our second working paper on the topic. The first describes, in detail, the characteristics of doctors who are licensed to practise in the UK and have a primary medical qualification (PMQ) from the European Economic Area (EEA).1 We refer to these as EEA graduate doctors.
We have produced this second working paper to make our data as useful as possible to those who want to understand more about the composition of the medical workforce. It reports the results of an analysis of how the regions in which doctors gained their PMQs relate to their nationalities at the time that they joined the register.
The relationship between PMQ region - where we have precise information for each and every licensed doctor - and nationality at time of registration - where significant amounts of missing data have to be imputed or estimated - is not a simple one. The estimates in this second working paper are, we believe, robust at a high level of aggregation (by UK country), but are not suitable for more detailed analyses, such as by medical specialty. For these more detailed breakdowns, we refer readers to our first working paper on EEA graduate doctors.
1 Our data about doctors with a European primary medical qualification; Working paper 1 - February 2017, available at www.gmc-uk.org/publications/30409.asp
5
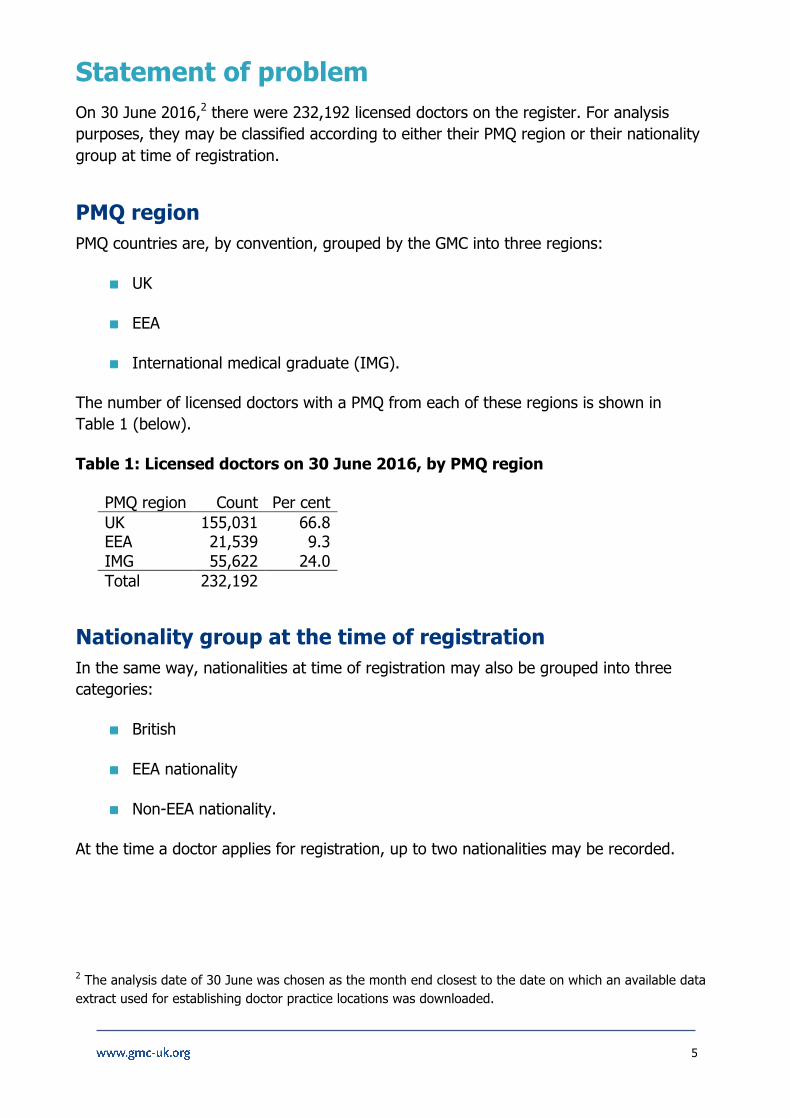
Statement of problem On 30 June 2016,2 there were 232,192 licensed doctors on the register. For analysis purposes, they may be classified according to either their PMQ region or their nationality group at time of registration.
PMQ region PMQ countries are, by convention, grouped by the GMC into three regions:
n UK
n EEA
n International medical graduate (IMG).
The number of licensed doctors with a PMQ from each of these regions is shown in Table 1 (below).
Table 1: Licensed doctors on 30 June 2016, by PMQ region
PMQ region Count Per cent UK 155,031 66.8 EEA 21,539 9.3 IMG 55,622 24.0 Total 232,192
Nationality group at the time of registration In the same way, nationalities at time of registration may also be grouped into three categories:
n British
n EEA nationality
n Non-EEA nationality.
At the time a doctor applies for registration, up to two nationalities may be recorded.
2 The analysis date of 30 June was chosen as the month end closest to the date on which an available data extract used for establishing doctor practice locations was downloaded.
6
British
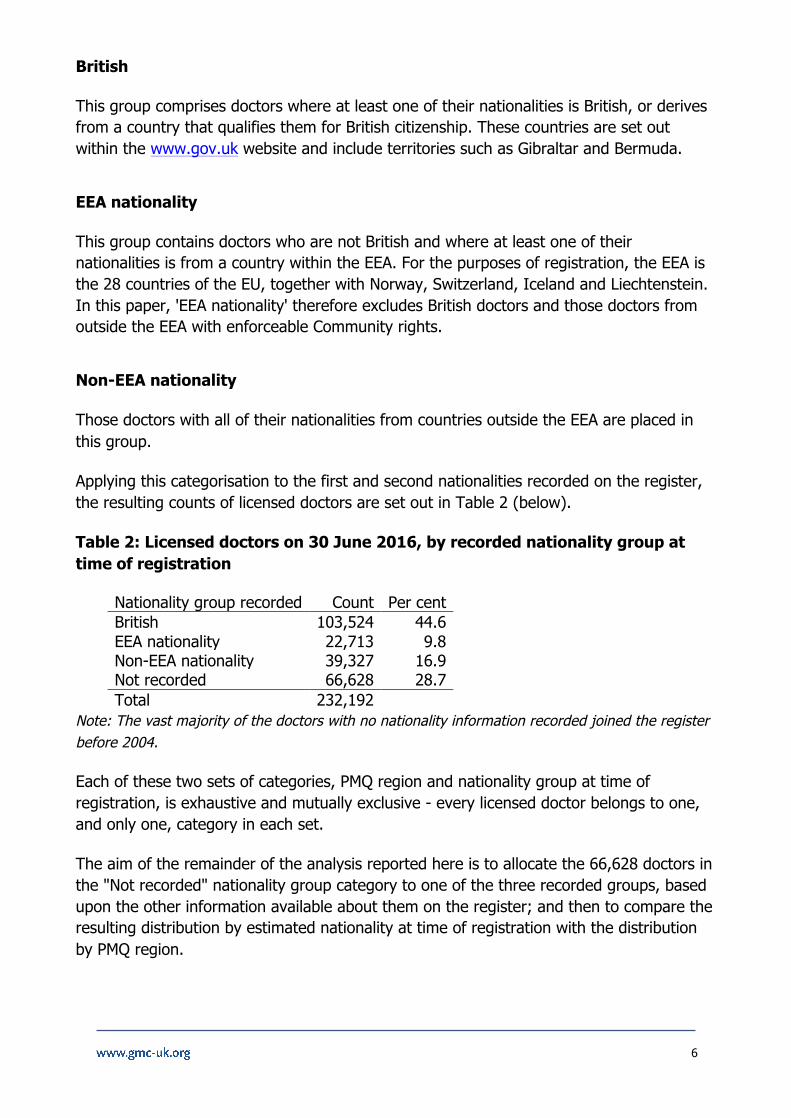
This group comprises doctors where at least one of their nationalities is British, or derives from a country that qualifies them for British citizenship. These countries are set out within the www.gov.uk website and include territories such as Gibraltar and Bermuda.
EEA nationality
This group contains doctors who are not British and where at least one of their nationalities is from a country within the EEA. For the purposes of registration, the EEA is the 28 countries of the EU, together with Norway, Switzerland, Iceland and Liechtenstein. In this paper, 'EEA nationality' therefore excludes British doctors and those doctors from outside the EEA with enforceable Community rights.
Non-EEA nationality
Those doctors with all of their nationalities from countries outside the EEA are placed in this group.
Applying this categorisation to the first and second nationalities recorded on the register, the resulting counts of licensed doctors are set out in Table 2 (below).
Table 2: Licensed doctors on 30 June 2016, by recorded nationality group at time of registration
Nationality group recorded Count Per cent British 103,524 44.6 EEA nationality 22,713 9.8 Non-EEA nationality 39,327 16.9 Not recorded 66,628 28.7 Total 232,192
Note: The vast majority of the doctors with no nationality information recorded joined the register before 2004.
Each of these two sets of categories, PMQ region and nationality group at time of registration, is exhaustive and mutually exclusive - every licensed doctor belongs to one, and only one, category in each set.
The aim of the remainder of the analysis reported here is to allocate the 66,628 doctors in the "Not recorded" nationality group category to one of the three recorded groups, based upon the other information available about them on the register; and then to compare the resulting distribution by estimated nationality at time of registration with the distribution by PMQ region.
7
Method
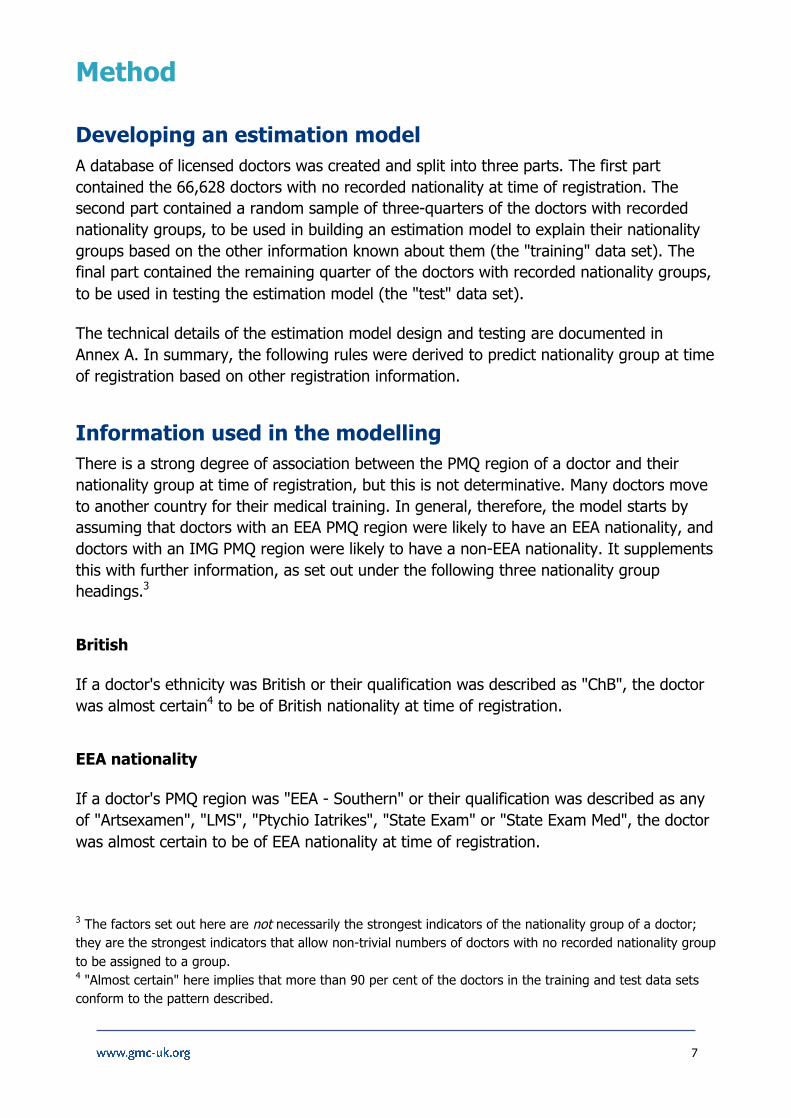
Developing an estimation model A database of licensed doctors was created and split into three parts. The first part contained the 66,628 doctors with no recorded nationality at time of registration. The second part contained a random sample of three-quarters of the doctors with recorded nationality groups, to be used in building an estimation model to explain their nationality groups based on the other information known about them (the "training" data set). The final part contained the remaining quarter of the doctors with recorded nationality groups, to be used in testing the estimation model (the "test" data set).
The technical details of the estimation model design and testing are documented in Annex A. In summary, the following rules were derived to predict nationality group at time of registration based on other registration information.
Information used in the modelling There is a strong degree of association between the PMQ region of a doctor and their nationality group at time of registration, but this is not determinative. Many doctors move to another country for their medical training. In general, therefore, the model starts by assuming that doctors with an EEA PMQ region were likely to have an EEA nationality, and doctors with an IMG PMQ region were likely to have a non-EEA nationality. It supplements this with further information, as set out under the following three nationality group headings.3
British
If a doctor's ethnicity was British or their qualification was described as "ChB", the doctor was almost certain4 to be of British nationality at time of registration.
EEA nationality
If a doctor's PMQ region was "EEA - Southern" or their qualification was described as any of "Artsexamen", "LMS", "Ptychio Iatrikes", "State Exam" or "State Exam Med", the doctor was almost certain to be of EEA nationality at time of registration.
3 The factors set out here are not necessarily the strongest indicators of the nationality group of a doctor; they are the strongest indicators that allow non-trivial numbers of doctors with no recorded nationality group to be assigned to a group. 4 "Almost certain" here implies that more than 90 per cent of the doctors in the training and test data sets conform to the pattern described.
8
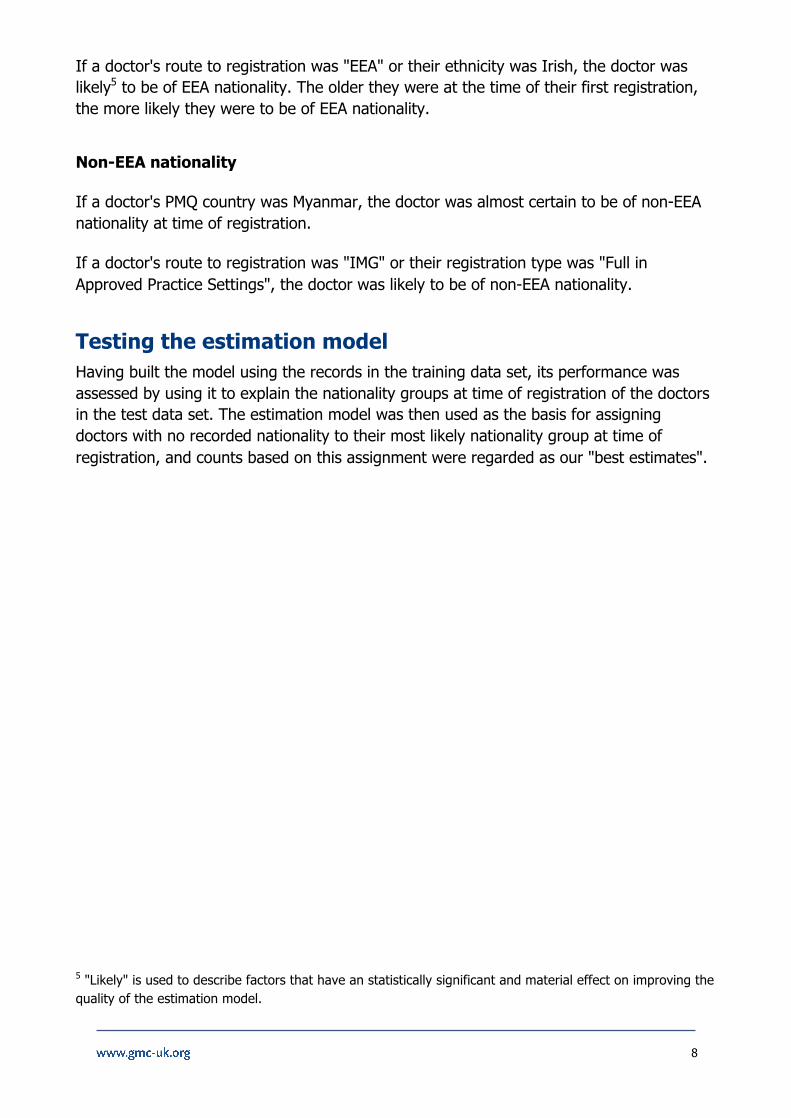
If a doctor's route to registration was "EEA" or their ethnicity was Irish, the doctor was likely5 to be of EEA nationality. The older they were at the time of their first registration, the more likely they were to be of EEA nationality.
Non-EEA nationality
If a doctor's PMQ country was Myanmar, the doctor was almost certain to be of non-EEA nationality at time of registration.
If a doctor's route to registration was "IMG" or their registration type was "Full in Approved Practice Settings", the doctor was likely to be of non-EEA nationality.
Testing the estimation model Having built the model using the records in the training data set, its performance was assessed by using it to explain the nationality groups at time of registration of the doctors in the test data set. The estimation model was then used as the basis for assigning doctors with no recorded nationality to their most likely nationality group at time of registration, and counts based on this assignment were regarded as our "best estimates".
5 "Likely" is used to describe factors that have an statistically significant and material effect on improving the quality of the estimation model.
9
Results
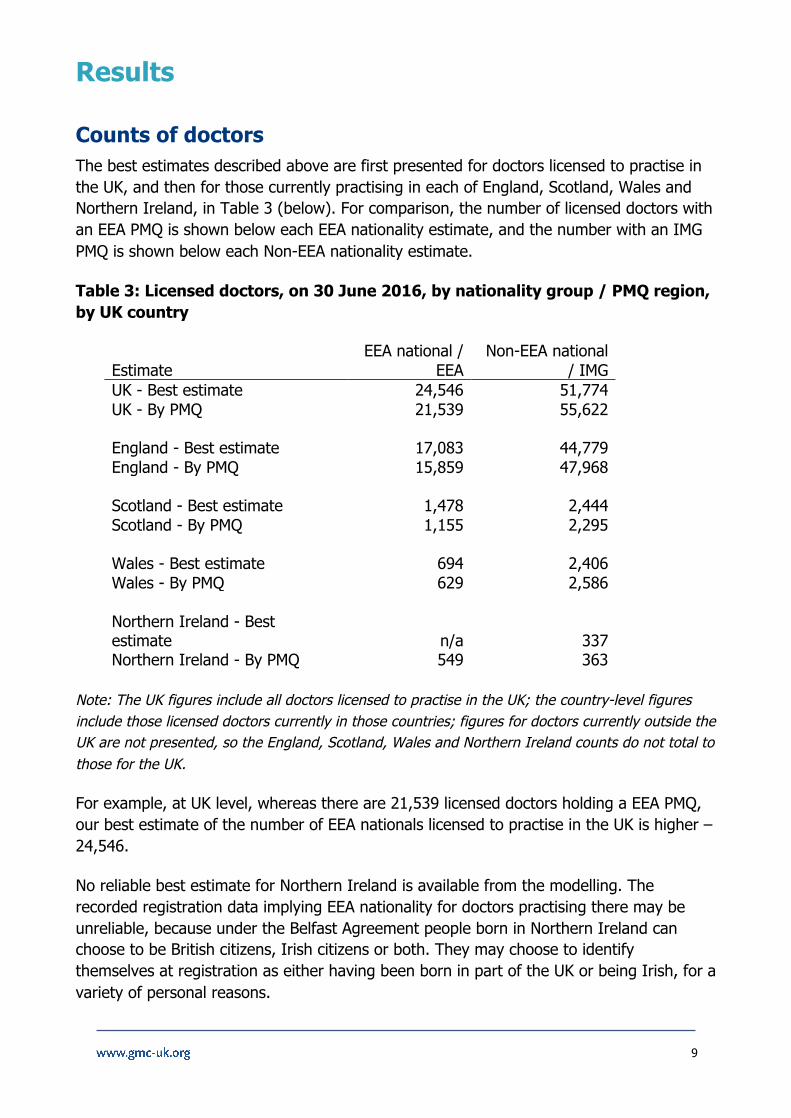
Counts of doctors The best estimates described above are first presented for doctors licensed to practise in the UK, and then for those currently practising in each of England, Scotland, Wales and Northern Ireland, in Table 3 (below). For comparison, the number of licensed doctors with an EEA PMQ is shown below each EEA nationality estimate, and the number with an IMG PMQ is shown below each Non-EEA nationality estimate.
Table 3: Licensed doctors, on 30 June 2016, by nationality group / PMQ region, by UK country
Estimate EEA national /
EEA Non-EEA national
/ IMG UK - Best estimate 24,546 51,774 UK - By PMQ 21,539 55,622
England - Best estimate 17,083 44,779 England - By PMQ 15,859 47,968
Scotland - Best estimate 1,478 2,444 Scotland - By PMQ 1,155 2,295
Wales - Best estimate 694 2,406 Wales - By PMQ 629 2,586
Northern Ireland - Best estimate n/a 337 Northern Ireland - By PMQ 549 363
Note: The UK figures include all doctors licensed to practise in the UK; the country-level figures include those licensed doctors currently in those countries; figures for doctors currently outside the UK are not presented, so the England, Scotland, Wales and Northern Ireland counts do not total to those for the UK.
For example, at UK level, whereas there are 21,539 licensed doctors holding a EEA PMQ, our best estimate of the number of EEA nationals licensed to practise in the UK is higher – 24,546.
No reliable best estimate for Northern Ireland is available from the modelling. The recorded registration data implying EEA nationality for doctors practising there may be unreliable, because under the Belfast Agreement people born in Northern Ireland can choose to be British citizens, Irish citizens or both. They may choose to identify themselves at registration as either having been born in part of the UK or being Irish, for a variety of personal reasons.
10
9.0 8.4
7.5 5.8
7.2 6.5
n/a
8.9
0
5
10
15
20
25
30
England - EEA
nationality
England - EEA PMQ
Scotland - EEA
nationality
Scotland - EEA PMQ
Wales - EEA
nationality
Wales - EEA PMQ
Northern Ireland -
EEA nationality
Northern Ireland - EEA PMQ
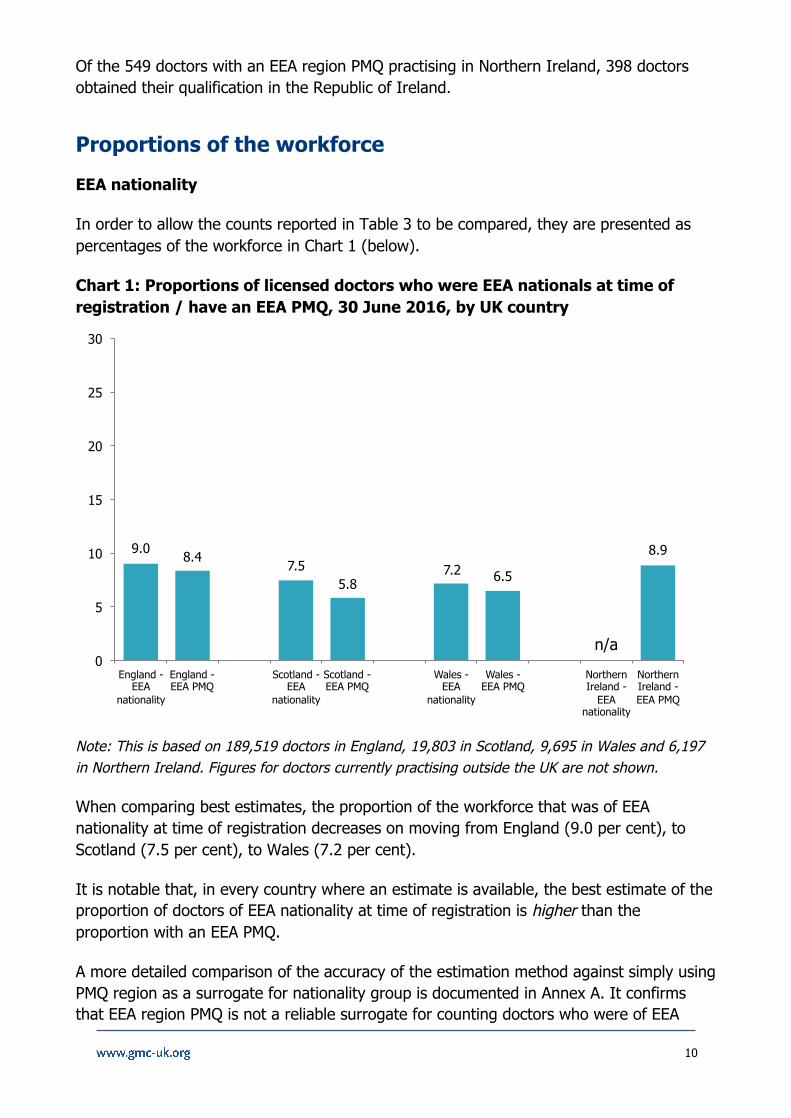
Of the 549 doctors with an EEA region PMQ practising in Northern Ireland, 398 doctors obtained their qualification in the Republic of Ireland.
Proportions of the workforce
EEA nationality
In order to allow the counts reported in Table 3 to be compared, they are presented as percentages of the workforce in Chart 1 (below).
Chart 1: Proportions of licensed doctors who were EEA nationals at time of registration / have an EEA PMQ, 30 June 2016, by UK country
Note: This is based on 189,519 doctors in England, 19,803 in Scotland, 9,695 in Wales and 6,197 in Northern Ireland. Figures for doctors currently practising outside the UK are not shown.
When comparing best estimates, the proportion of the workforce that was of EEA nationality at time of registration decreases on moving from England (9.0 per cent), to Scotland (7.5 per cent), to Wales (7.2 per cent).
It is notable that, in every country where an estimate is available, the best estimate of the proportion of doctors of EEA nationality at time of registration is higher than the proportion with an EEA PMQ.
A more detailed comparison of the accuracy of the estimation method against simply using PMQ region as a surrogate for nationality group is documented in Annex A. It confirms that EEA region PMQ is not a reliable surrogate for counting doctors who were of EEA
11
23.6 25.3
12.3 11.6
24.8
26.7
5.4 5.9
0
5
10
15
20
25
30
England - Non-EEA
nationality
England - IMG PMQ
Scotland - Non-EEA
nationality
Scotland - IMG PMQ
Wales - Non-EEA
nationality
Wales - IMG PMQ
Northern Ireland - Non-EEA
nationality
Northern Ireland - IMG PMQ
nationality at time of registration. In particular, see Table A4 for a cross tabulation of PMQ region against estimated nationality and Table A11 for the results of the comparison.
Non-EEA nationality
Similar percentages for doctors in the non-EEA nationality group at time of registration are presented in Chart 2 (below).
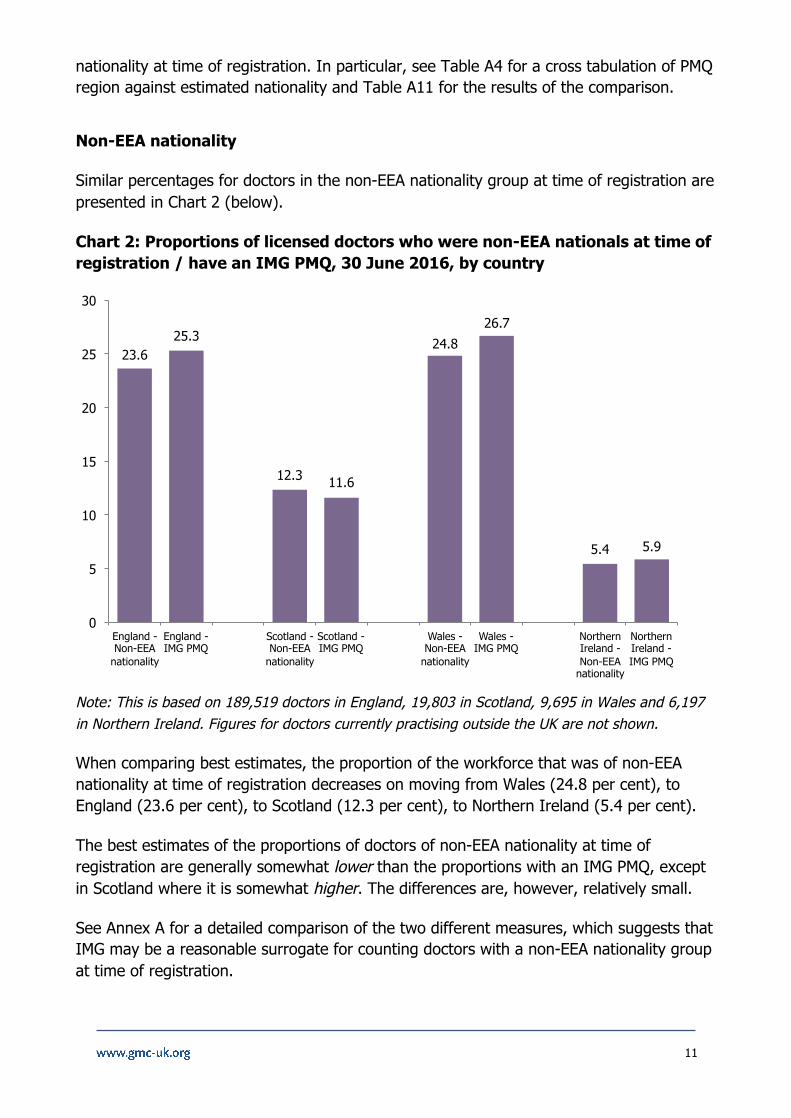
Chart 2: Proportions of licensed doctors who were non-EEA nationals at time of registration / have an IMG PMQ, 30 June 2016, by country
Note: This is based on 189,519 doctors in England, 19,803 in Scotland, 9,695 in Wales and 6,197 in Northern Ireland. Figures for doctors currently practising outside the UK are not shown.
When comparing best estimates, the proportion of the workforce that was of non-EEA nationality at time of registration decreases on moving from Wales (24.8 per cent), to England (23.6 per cent), to Scotland (12.3 per cent), to Northern Ireland (5.4 per cent).
The best estimates of the proportions of doctors of non-EEA nationality at time of registration are generally somewhat lower than the proportions with an IMG PMQ, except in Scotland where it is somewhat higher. The differences are, however, relatively small.
See Annex A for a detailed comparison of the two different measures, which suggests that IMG may be a reasonable surrogate for counting doctors with a non-EEA nationality group at time of registration.
12
Discussion
Limitations of the analysis It must be kept in mind that the nationality information recorded by the GMC is mainly6 that at the time of registration and, for some doctors, this may have changed since. The analysis therefore has little to say about the relationship between PMQ region and current nationality.
The modelling approach assumes that the underlying relationships between registration information and nationality at time of registration operate consistently over time, and this is un-tested. Furthermore, the two stage approach identifies about 900 doctors with no nationality recorded as likely to be in the non-EEA group in the first stage, then as likely to be in the EEA group in the second stage. The final estimates of numbers thus depend somewhat on the ordering of the stages in the analysis.
The estimation methods used here are not reliable for use in the particular circumstances of Northern Ireland. To investigate nationality in Northern Ireland further, it is likely that primary research (that is, contacting doctors for further information) would be needed.
Conclusions The analysis described in this paper suggests that, in each of England, Scotland, Wales and Northern Ireland:
n EEA region PMQ is not a reliable indicator for counting doctors who were of EEA nationality at the time of their registration - therefore in considering the workforce implications of Brexit, it will be important to have regard to the fact that EEA region PMQ data under-estimates the number of EEA nationals
n Counting IMG doctors may produce a reasonable accurate surrogate measure for the numbers of doctors who were of non-EEA nationality at the time of their registration.
Further information Further detail about this project is available from Tom Franklin at [email protected].
6 "Mainly", because the GMC has from time to time undertaken projects to update the information held about doctors' nationality on the register.
13
Annex A - Estimation model design and testing
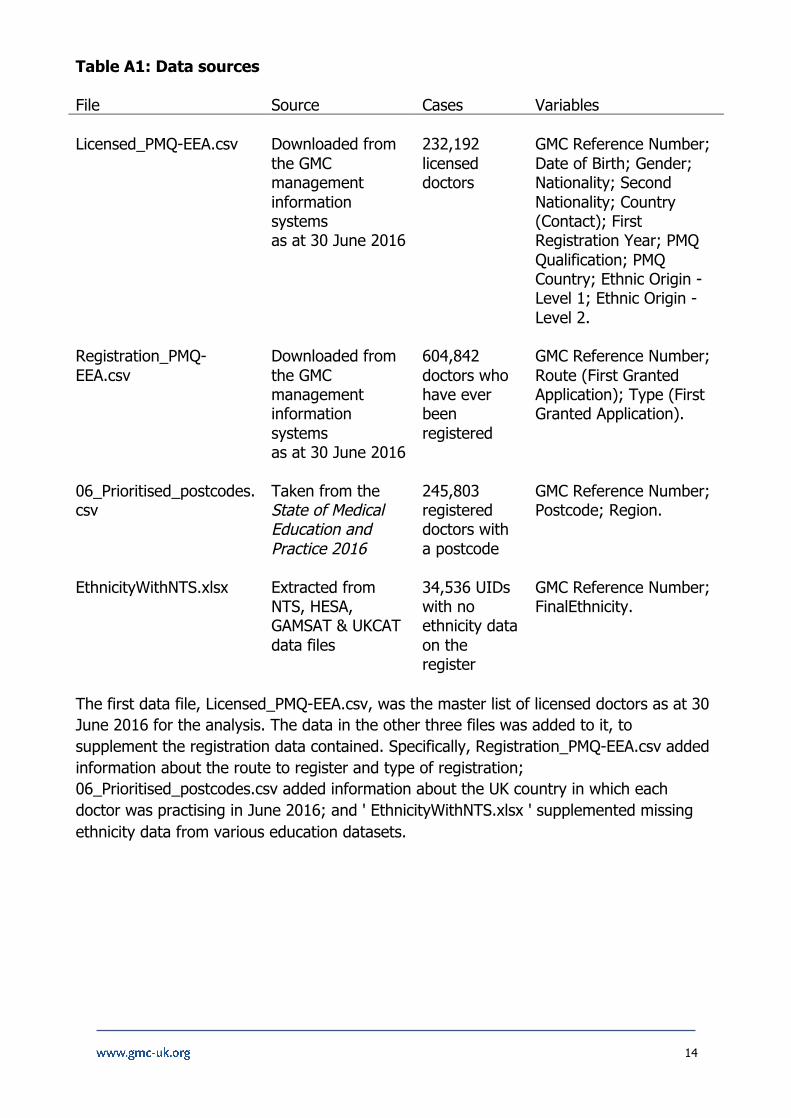
Model design The work to derive a best estimate nationality group for each of the 66,628 licensed doctors with no recorded nationality proceeded in three stages:
n First, imputations of a British, EEA or non-EEA nationality group were made, based on register variables that have a very strong (90 per cent or more) association with one group;
n Then, a first logistic regression model was developed to identify those of the remaining doctors who were more likely to be non-EEA nationals than not;
n Finally, a second logistic regression model was developed to identify those of the last remaining doctors who were more likely to be EEA nationals than not.
Source data
The following four sources of data were used for the analysis.
14
Table A1: Data sources
File Source Cases Variables Licensed_PMQ-EEA.csv
Downloaded from the GMC management information systems as at 30 June 2016
232,192 licensed doctors
GMC Reference Number; Date of Birth; Gender; Nationality; Second Nationality; Country (Contact); First Registration Year; PMQ Qualification; PMQ Country; Ethnic Origin - Level 1; Ethnic Origin - Level 2.
Registration_PMQ-EEA.csv
Downloaded from the GMC management information systems as at 30 June 2016
604,842 doctors who have ever been registered
GMC Reference Number; Route (First Granted Application); Type (First Granted Application).
06_Prioritised_postcodes.csv
Taken from the State of Medical Education and Practice 2016
245,803 registered doctors with a postcode
GMC Reference Number; Postcode; Region.
EthnicityWithNTS.xlsx Extracted from NTS, HESA, GAMSAT & UKCAT data files
34,536 UIDs with no ethnicity data on the register
GMC Reference Number; FinalEthnicity.
The first data file, Licensed_PMQ-EEA.csv, was the master list of licensed doctors as at 30 June 2016 for the analysis. The data in the other three files was added to it, to supplement the registration data contained. Specifically, Registration_PMQ-EEA.csv added information about the route to register and type of registration; 06_Prioritised_postcodes.csv added information about the UK country in which each doctor was practising in June 2016; and ' EthnicityWithNTS.xlsx ' supplemented missing ethnicity data from various education datasets.
15
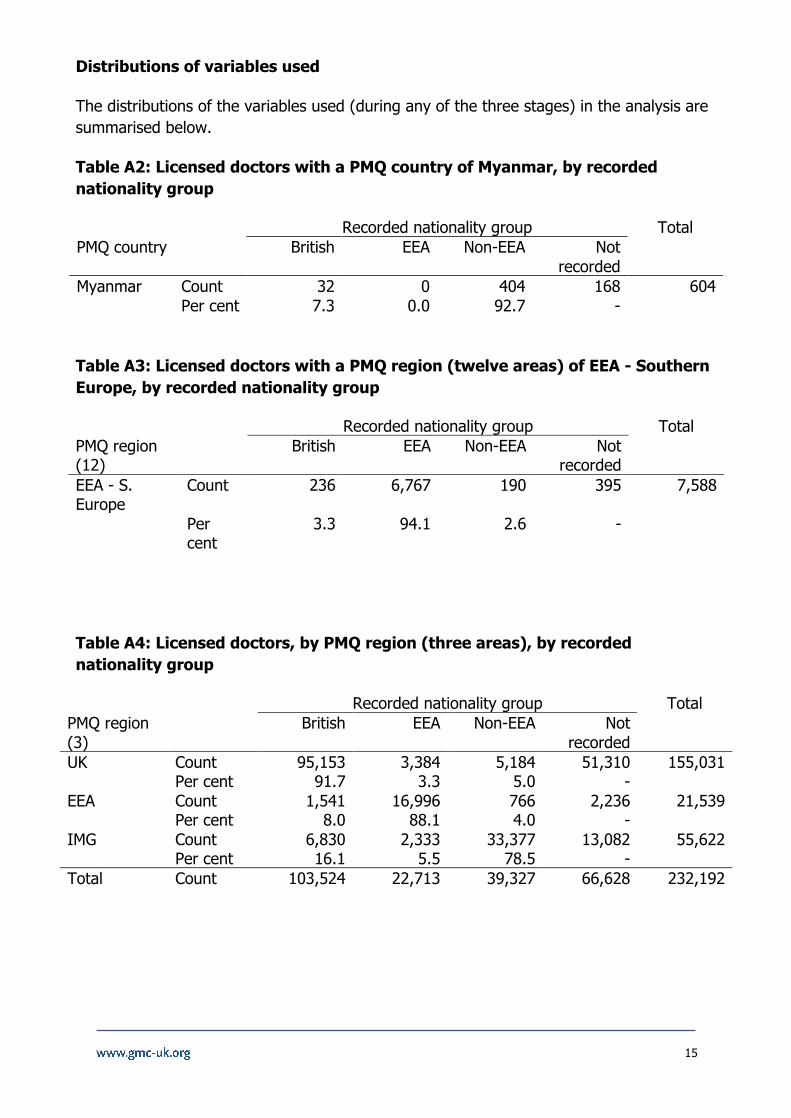
Distributions of variables used
The distributions of the variables used (during any of the three stages) in the analysis are summarised below.
Table A2: Licensed doctors with a PMQ country of Myanmar, by recorded nationality group
Recorded nationality group Total PMQ country British EEA Non-EEA Not
recorded Myanmar Count 32 0 404 168 604 Per cent 7.3 0.0 92.7 -
Table A3: Licensed doctors with a PMQ region (twelve areas) of EEA - Southern Europe, by recorded nationality group
Recorded nationality group Total PMQ region (12)
British EEA Non-EEA Not recorded
EEA - S. Europe
Count 236 6,767 190 395 7,588
Per cent
3.3 94.1 2.6 -
Table A4: Licensed doctors, by PMQ region (three areas), by recorded nationality group
Recorded nationality group Total PMQ region (3)
British EEA Non-EEA Not recorded
UK Count 95,153 3,384 5,184 51,310 155,031 Per cent 91.7 3.3 5.0 - EEA Count 1,541 16,996 766 2,236 21,539 Per cent 8.0 88.1 4.0 - IMG Count 6,830 2,333 33,377 13,082 55,622 Per cent 16.1 5.5 78.5 - Total Count 103,524 22,713 39,327 66,628 232,192
16
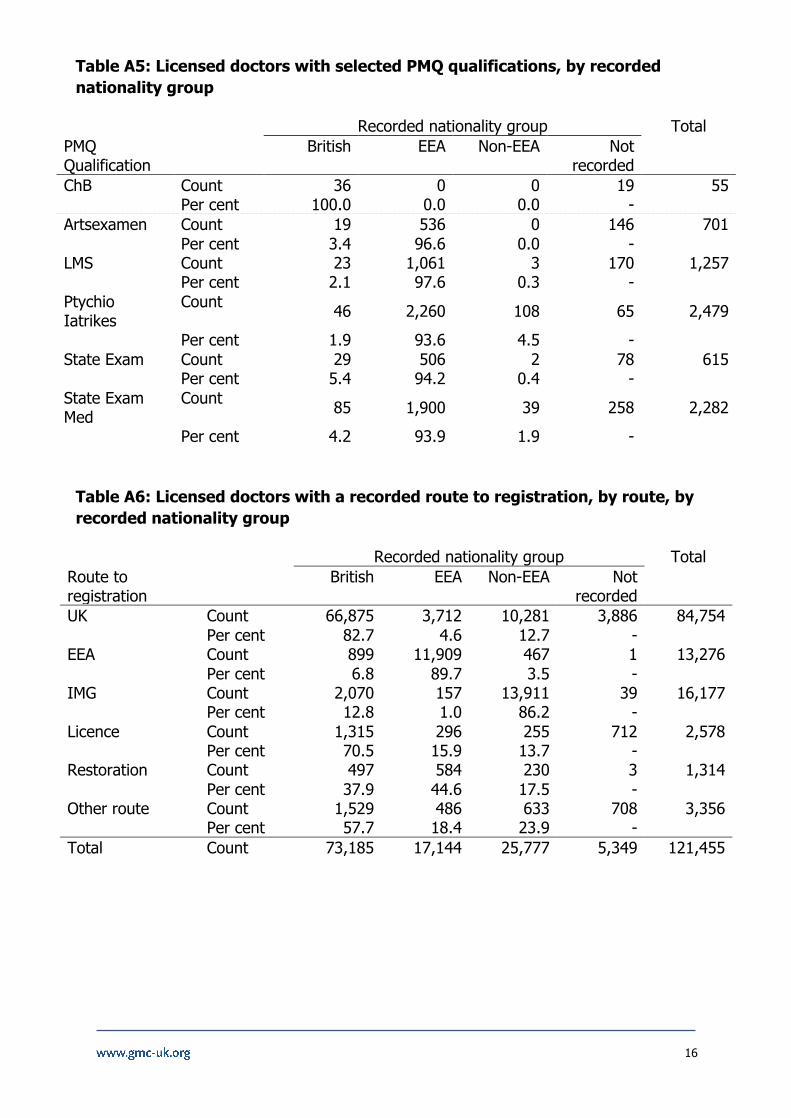
Table A5: Licensed doctors with selected PMQ qualifications, by recorded nationality group
Recorded nationality group Total PMQ Qualification
British EEA Non-EEA Not recorded
ChB Count 36 0 0 19 55 Per cent 100.0 0.0 0.0 - Artsexamen Count 19 536 0 146 701 Per cent 3.4 96.6 0.0 - LMS Count 23 1,061 3 170 1,257 Per cent 2.1 97.6 0.3 - Ptychio Iatrikes
Count 46 2,260 108 65 2,479
Per cent 1.9 93.6 4.5 - State Exam Count 29 506 2 78 615 Per cent 5.4 94.2 0.4 - State Exam Med
Count 85 1,900 39 258 2,282
Per cent 4.2 93.9 1.9 -
Table A6: Licensed doctors with a recorded route to registration, by route, by recorded nationality group
Recorded nationality group Total Route to registration
British EEA Non-EEA Not recorded
UK Count 66,875 3,712 10,281 3,886 84,754 Per cent 82.7 4.6 12.7 - EEA Count 899 11,909 467 1 13,276 Per cent 6.8 89.7 3.5 - IMG Count 2,070 157 13,911 39 16,177 Per cent 12.8 1.0 86.2 - Licence Count 1,315 296 255 712 2,578 Per cent 70.5 15.9 13.7 - Restoration Count 497 584 230 3 1,314 Per cent 37.9 44.6 17.5 - Other route Count 1,529 486 633 708 3,356 Per cent 57.7 18.4 23.9 - Total Count 73,185 17,144 25,777 5,349 121,455
17
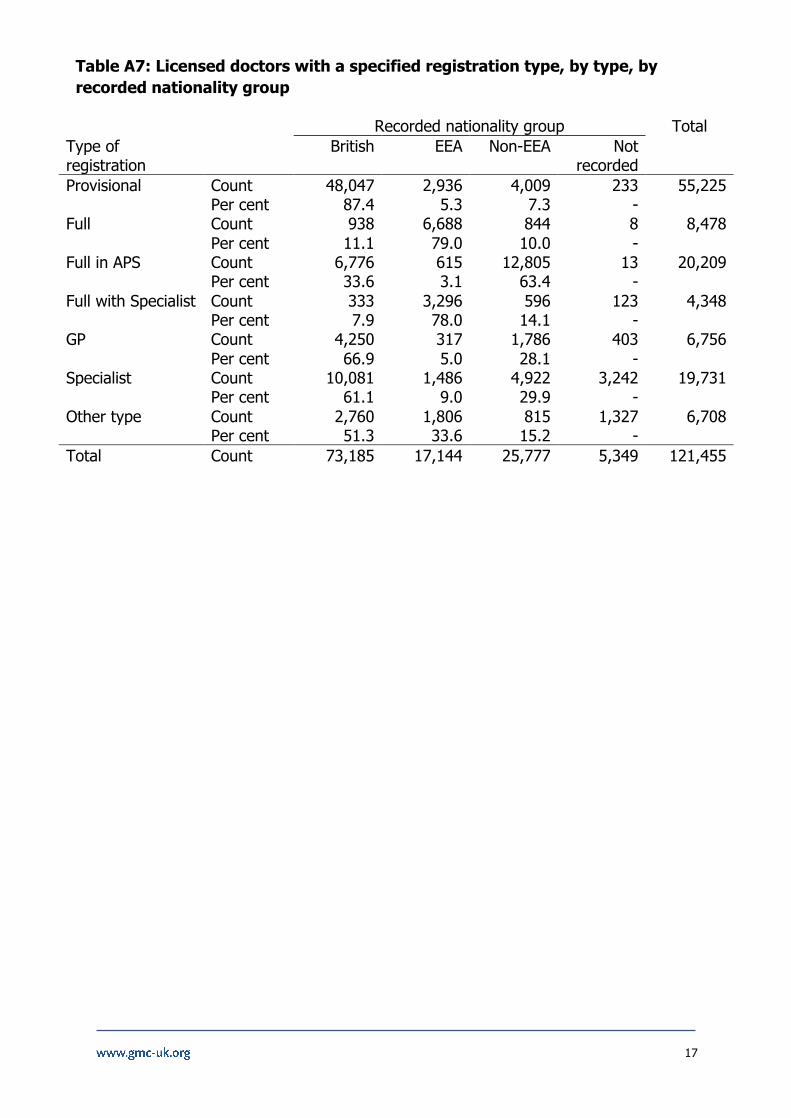
Table A7: Licensed doctors with a specified registration type, by type, by recorded nationality group
Recorded nationality group Total Type of registration
British EEA Non-EEA Not recorded
Provisional Count 48,047 2,936 4,009 233 55,225 Per cent 87.4 5.3 7.3 - Full Count 938 6,688 844 8 8,478 Per cent 11.1 79.0 10.0 - Full in APS Count 6,776 615 12,805 13 20,209 Per cent 33.6 3.1 63.4 - Full with Specialist Count 333 3,296 596 123 4,348 Per cent 7.9 78.0 14.1 - GP Count 4,250 317 1,786 403 6,756 Per cent 66.9 5.0 28.1 - Specialist Count 10,081 1,486 4,922 3,242 19,731 Per cent 61.1 9.0 29.9 - Other type Count 2,760 1,806 815 1,327 6,708 Per cent 51.3 33.6 15.2 - Total Count 73,185 17,144 25,777 5,349 121,455
18
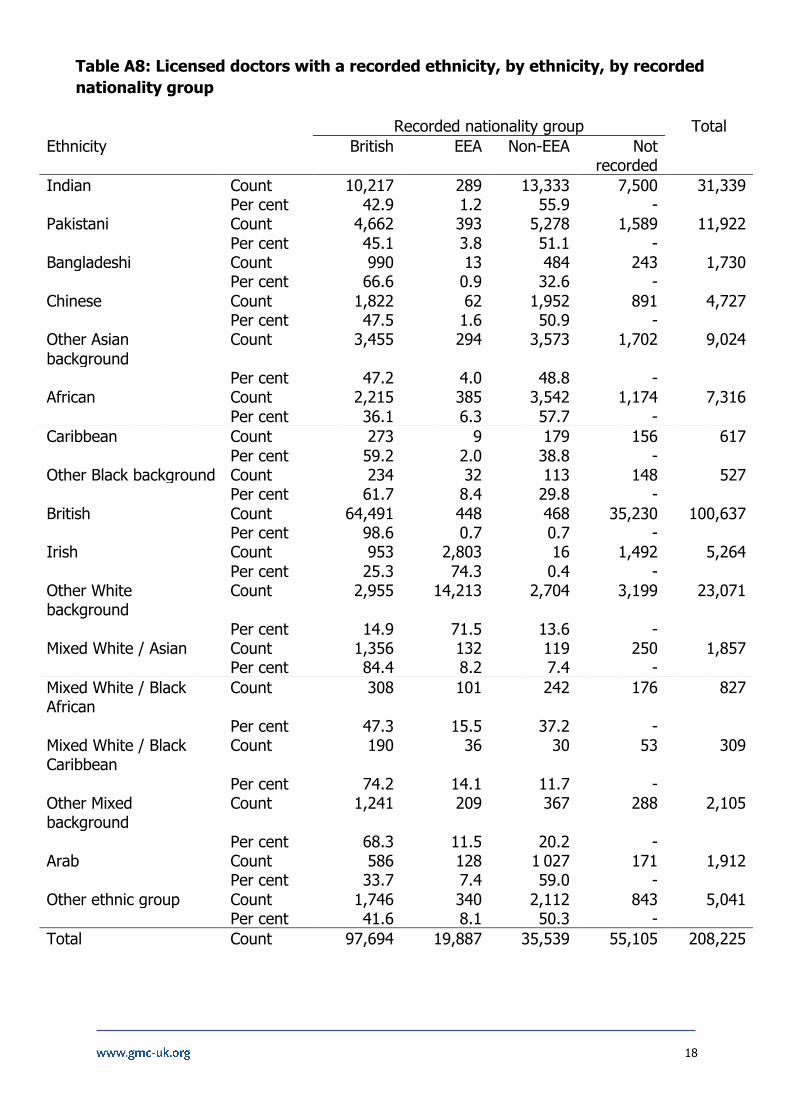
Table A8: Licensed doctors with a recorded ethnicity, by ethnicity, by recorded nationality group
Recorded nationality group Total Ethnicity British EEA Non-EEA Not
recorded Indian Count 10,217 289 13,333 7,500 31,339 Per cent 42.9 1.2 55.9 - Pakistani Count 4,662 393 5,278 1,589 11,922 Per cent 45.1 3.8 51.1 - Bangladeshi Count 990 13 484 243 1,730 Per cent 66.6 0.9 32.6 - Chinese Count 1,822 62 1,952 891 4,727 Per cent 47.5 1.6 50.9 - Other Asian background
Count 3,455 294 3,573 1,702 9,024
Per cent 47.2 4.0 48.8 - African Count 2,215 385 3,542 1,174 7,316 Per cent 36.1 6.3 57.7 - Caribbean Count 273 9 179 156 617 Per cent 59.2 2.0 38.8 - Other Black background Count 234 32 113 148 527 Per cent 61.7 8.4 29.8 - British Count 64,491 448 468 35,230 100,637 Per cent 98.6 0.7 0.7 - Irish Count 953 2,803 16 1,492 5,264 Per cent 25.3 74.3 0.4 - Other White background
Count 2,955 14,213 2,704 3,199 23,071
Per cent 14.9 71.5 13.6 - Mixed White / Asian Count 1,356 132 119 250 1,857 Per cent 84.4 8.2 7.4 - Mixed White / Black African
Count 308 101 242 176 827
Per cent 47.3 15.5 37.2 - Mixed White / Black Caribbean
Count 190 36 30 53 309
Per cent 74.2 14.1 11.7 - Other Mixed background
Count 1,241 209 367 288 2,105
Per cent 68.3 11.5 20.2 - Arab Count 586 128 1 027 171 1,912 Per cent 33.7 7.4 59.0 - Other ethnic group Count 1,746 340 2,112 843 5,041 Per cent 41.6 8.1 50.3 - Total Count 97,694 19,887 35,539 55,105 208,225
19
2030
4050
60
Ageatfirstregistratio
n
British EEA Non-EEA Notrecorded
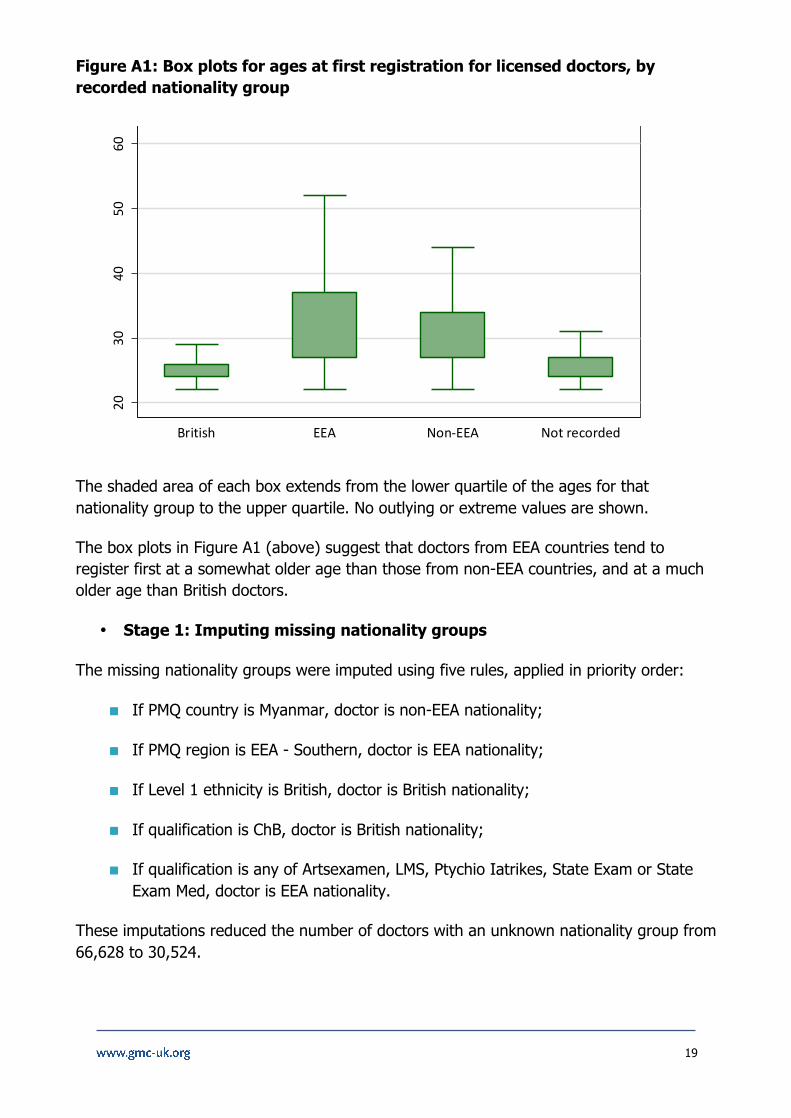
Figure A1: Box plots for ages at first registration for licensed doctors, by recorded nationality group
The shaded area of each box extends from the lower quartile of the ages for that nationality group to the upper quartile. No outlying or extreme values are shown.
The box plots in Figure A1 (above) suggest that doctors from EEA countries tend to register first at a somewhat older age than those from non-EEA countries, and at a much older age than British doctors.
• Stage 1: Imputing missing nationality groups
The missing nationality groups were imputed using five rules, applied in priority order:
n If PMQ country is Myanmar, doctor is non-EEA nationality;
n If PMQ region is EEA - Southern, doctor is EEA nationality;
n If Level 1 ethnicity is British, doctor is British nationality;
n If qualification is ChB, doctor is British nationality;
n If qualification is any of Artsexamen, LMS, Ptychio Iatrikes, State Exam or State Exam Med, doctor is EEA nationality.
These imputations reduced the number of doctors with an unknown nationality group from 66,628 to 30,524.
20
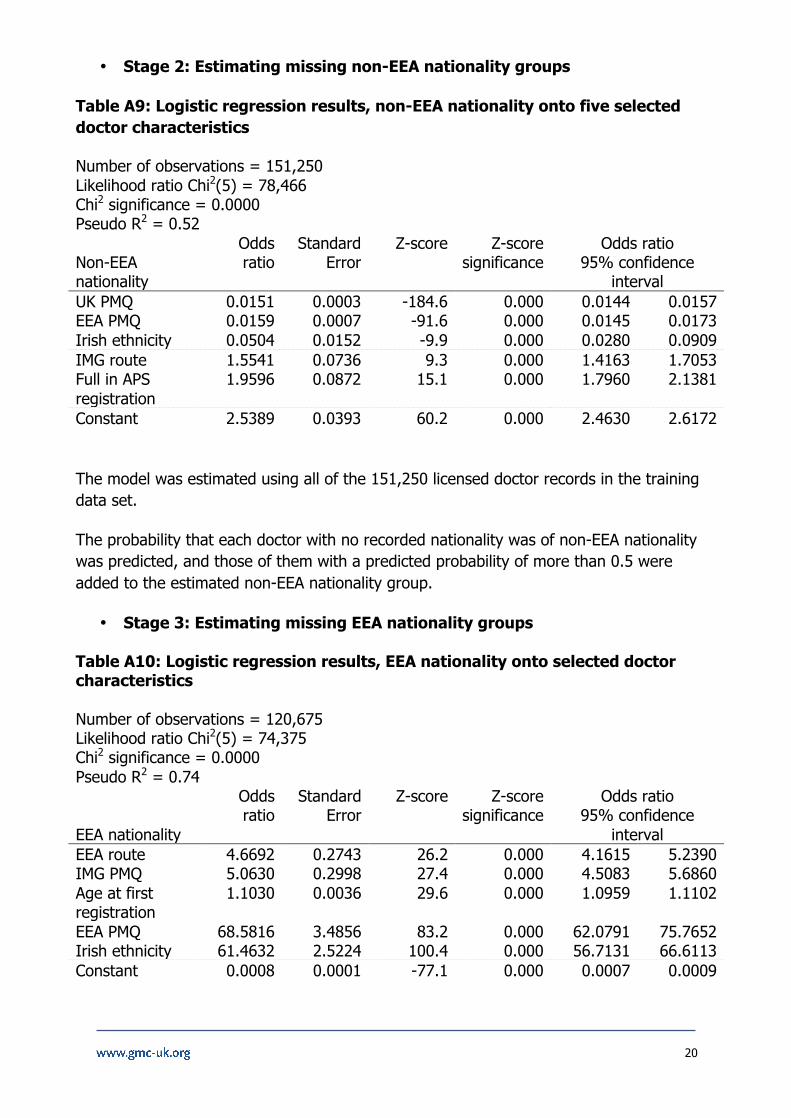
• Stage 2: Estimating missing non-EEA nationality groups
Table A9: Logistic regression results, non-EEA nationality onto five selected doctor characteristics
Number of observations = 151,250 Likelihood ratio Chi2(5) = 78,466 Chi2 significance = 0.0000 Pseudo R2 = 0.52
Non-EEA nationality
Odds ratio
Standard Error
Z-score Z-score significance
Odds ratio 95% confidence
interval UK PMQ 0.0151 0.0003 -184.6 0.000 0.0144 0.0157 EEA PMQ 0.0159 0.0007 -91.6 0.000 0.0145 0.0173 Irish ethnicity 0.0504 0.0152 -9.9 0.000 0.0280 0.0909 IMG route 1.5541 0.0736 9.3 0.000 1.4163 1.7053 Full in APS registration
1.9596 0.0872 15.1 0.000 1.7960 2.1381
Constant 2.5389 0.0393 60.2 0.000 2.4630 2.6172
The model was estimated using all of the 151,250 licensed doctor records in the training data set.
The probability that each doctor with no recorded nationality was of non-EEA nationality was predicted, and those of them with a predicted probability of more than 0.5 were added to the estimated non-EEA nationality group.
• Stage 3: Estimating missing EEA nationality groups
Table A10: Logistic regression results, EEA nationality onto selected doctor characteristics Number of observations = 120,675 Likelihood ratio Chi2(5) = 74,375 Chi2 significance = 0.0000 Pseudo R2 = 0.74
EEA nationality
Odds ratio
Standard Error
Z-score Z-score significance
Odds ratio 95% confidence
interval EEA route 4.6692 0.2743 26.2 0.000 4.1615 5.2390 IMG PMQ 5.0630 0.2998 27.4 0.000 4.5083 5.6860 Age at first registration
1.1030 0.0036 29.6 0.000 1.0959 1.1102
EEA PMQ 68.5816 3.4856 83.2 0.000 62.0791 75.7652 Irish ethnicity 61.4632 2.5224 100.4 0.000 56.7131 66.6113 Constant 0.0008 0.0001 -77.1 0.000 0.0007 0.0009
21
The model was estimated using the 120,675 licensed doctor records in the training data set that had an imputed nationality group of British or EEA and data present for their age at first registration. 954 doctors were excluded from the model building because they had no age at first registration recorded.
The probability that each doctor with no recorded nationality was of EEA nationality was predicted7, and those of them with a predicted probability of more than 0.5 were added to the estimated EEA nationality group. The remaining doctors with no recorded nationality were estimated to be British.
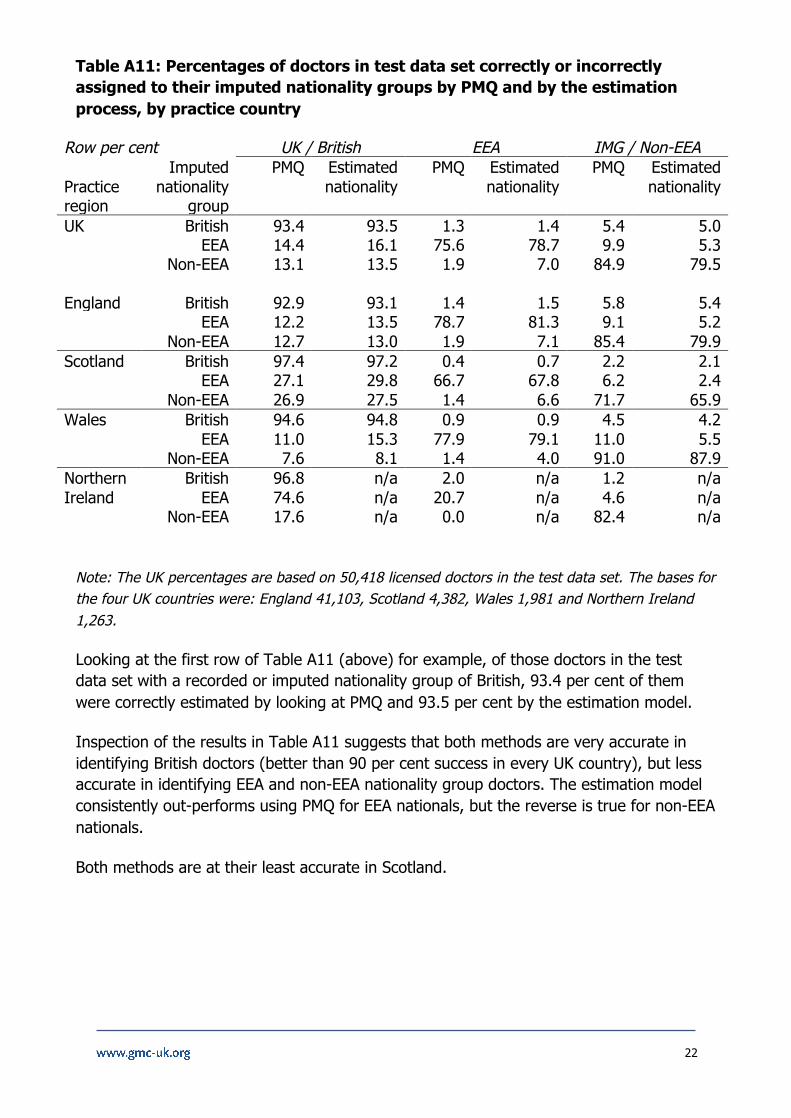
Model testing Using the test data set, the results of applying the estimations described above were assessed, by testing them against the imputed nationality groups - that is, the groups for those doctors that had been either recorded on the register or imputed in Stage 1. The results of this testing are tabulated in the columns headed "Estimated nationality" in Table A11 (below). For comparison, the results of simply using the PMQ region to estimate nationality group are shown alongside, in the columns headed "PMQ".
The analysis has been repeated for the UK and each of the four UK countries.
7 For those doctors with no age at first registration recorded, the sample mean value of 27 years was used to support a probability prediction.
22
Table A11: Percentages of doctors in test data set correctly or incorrectly assigned to their imputed nationality groups by PMQ and by the estimation process, by practice country
Row per cent UK / British EEA IMG / Non-EEA
Practice region
Imputed nationality
group
PMQ Estimated nationality
PMQ Estimated nationality
PMQ Estimated nationality
UK British 93.4 93.5 1.3 1.4 5.4 5.0 EEA 14.4 16.1 75.6 78.7 9.9 5.3 Non-EEA 13.1 13.5 1.9 7.0 84.9 79.5 England British 92.9 93.1 1.4 1.5 5.8 5.4 EEA 12.2 13.5 78.7 81.3 9.1 5.2 Non-EEA 12.7 13.0 1.9 7.1 85.4 79.9 Scotland British 97.4 97.2 0.4 0.7 2.2 2.1 EEA 27.1 29.8 66.7 67.8 6.2 2.4 Non-EEA 26.9 27.5 1.4 6.6 71.7 65.9 Wales British 94.6 94.8 0.9 0.9 4.5 4.2 EEA 11.0 15.3 77.9 79.1 11.0 5.5 Non-EEA 7.6 8.1 1.4 4.0 91.0 87.9 Northern British 96.8 n/a 2.0 n/a 1.2 n/a Ireland EEA 74.6 n/a 20.7 n/a 4.6 n/a Non-EEA 17.6 n/a 0.0 n/a 82.4 n/a
Note: The UK percentages are based on 50,418 licensed doctors in the test data set. The bases for the four UK countries were: England 41,103, Scotland 4,382, Wales 1,981 and Northern Ireland 1,263.
Looking at the first row of Table A11 (above) for example, of those doctors in the test data set with a recorded or imputed nationality group of British, 93.4 per cent of them were correctly estimated by looking at PMQ and 93.5 per cent by the estimation model.
Inspection of the results in Table A11 suggests that both methods are very accurate in identifying British doctors (better than 90 per cent success in every UK country), but less accurate in identifying EEA and non-EEA nationality group doctors. The estimation model consistently out-performs using PMQ for EEA nationals, but the reverse is true for non-EEA nationals.
Both methods are at their least accurate in Scotland.

Email: [email protected]: www.gmc-uk.orgTelephone: 0161 923 6602General Medical Council, 3 Hardman Street, Manchester M3 3AW
Textphone: please dial the prefix 18001 then 0161 923 6602 to use the Text Relay service
Join the conversation @gmcuk facebook.com/gmcuk
linkd.in/gmcuk youtube.com/gmcuktv
This information can be made available in alternative formatsor languages. To request an alternative format, please call us on 0161 923 6602 or email us at [email protected].
Published March 2017
© 2017 General Medical Council
The text of this document may be reproduced free of charge in any format
or medium providing it is reproduced accurately and not in a misleading context.
The material must be acknowledged as GMC copyright and the document
title specified.
The GMC is a charity registered in England and Wales (1089278)
and Scotland (SC037750)
Code: GMC/PMQ&N/0317