Embed Size (px)
Citation preview

Issues in Political Economy, Vol. 12, August 2003
THE RELATIVE EFFECTIVENESS OF TAX POLICY WHEN CONSIDERING MITIGATING FACTORS INFLUENCING TOBACCO CONSUMPTION OF AMERICAN YOUTH Kristen E. Collett, Bellarmine University
The statistics are startling regarding tobacco consumption and cigarette use in the United
States. In 1995, 46.5 million adults in the United States were smokers (“Targeting Tobacco Use: The Nation’s Leading Cause of Death,” 2002). Despite the fact that as early as 1956 the Surgeon General determined that there was a causal relationship between excessive cigarette smoking and lung cancer (Historical Fact Sheet, 2000), tobacco use is higher than ever before. Unfortunately, the younger population appears not to have realized the negative impact that tobacco is having on their lives, as cigarette smoking among youth rose sharply in the 1990’s and still continues to rise today.
Due to the fact that 34.8 percent of high school students were smokers in 1995 (“Targeting Tobacco Use: The Nation’s Leading Cause of Death,” 2002), it is becoming extremely important to determine what efforts can be made to successfully reduce and eliminate tobacco use by minors. Previous research on this topic shows that increasing the excise tax of cigarettes is the most successful policy in reducing tobacco consumption of all ages, especially youth. Past studies have also determined that anti-tobacco advertising, as well as state restrictions on tobacco advertising, may also influence how many minors decide to use tobacco products. This study attempts to determine whether or not these factors have affected smokers in the 18-24 years old segment of the population, as well as if other factors, such as tobacco-growing states, government policies regarding smoking, and consumption of other age groups, influence tobacco consumption. This research may help future policy makers decide not only how to reduce consumption, but also how to prevent younger generations from using tobacco products from the beginning in order to avoid addiction at a young age.
I. LITERATURE REVIEW
Over the past few years, significant concern has been raised over the number of youth who smoke and develop an addiction to tobacco. In 1995, the Center for Disease Control reported that 24.8 percent of 18-24 year olds consume tobacco. What is even more significant is that 36.4 percent of youth, grades nine through twelve, also smoke. The exceptionally high number of youth who smoke could mean that a large group of smokers 18-24 years old may have been addicted to tobacco since the young age of 14 years old. These statistics are startling, as an average of 13.4 years of potential life were lost for each death related to smoking in 1994 (State and National Tobacco Control Highlights, 1997).
Research shows that smokers are becoming addicted to tobacco at a younger age than ever before. In 1997, the World Health Organization reported that almost 80 percent of smokers begin to smoke regularly at the age of 16 years or younger. In 2000, the Surgeon General’s report established that youth smoking was indeed a problem, and set out to reduce the prevalence of teen smoking by one-half (Prevalence of Cigarette Smoking Among Adults, 2000). In order to achieve the Surgeon General’s objective, numerous studies have made it their goal to determine what specific factors will deter youth from smoking, or at least reduce tobacco consumption by minors.
The 2000 Surgeon General’s report outlined five specific approaches to reducing tobacco use: educational, clinical, regulatory, economic, and comprehensive. It cites that economic,
Issues in Political Economy, Vol. 12, August 2003
regulatory, and comprehensive measures are most likely to have the greatest long-term, population impact, while educational and clinical measures are of greater importance in helping an individual resist or abandon the use of tobacco. Of the measures mentioned by the Surgeon General’s report, regulation of advertising and promotion, an optimal level of excise taxation on tobacco products, and state tobacco control programs and policies are the most popular among other researchers. Aside from the aforementioned measures that will be explored at length in this study, other factors that may influence youth tobacco consumption are clean air regulations, educational strategies, and pharmacologic treatment of nicotine addiction (Prevalence of Cigarette Smoking Among Adults, 2000).
Much of the research on the reduction of tobacco consumption of any age group has determined that an excise tax on cigarettes is the most effective way to curb the problem of tobacco consumption (Tobacco Taxation Fact Sheet, 2000). In 2000, the Center for Disease Control determined that higher cigarette prices resulted in lower overall tobacco consumption. A study conducted by Farrelly, Bray, Pechnack, and Woollery says that an 100 percent increase in the price of cigarettes will lead to a decrease in total consumption of tobacco by 28 percent, as dictated by –0.28 total price elasticity (Farrelly, Bray, Pechnack, and Woollery, 2001). Research indicates that an increase in cigarette excise taxes is an effective tool in deterring smoking initiation among youth, prompting smoking cessation among adults, and reducing the average cigarette consumption among continuing smokers. The most significant reason why the tobacco consumption of youth will be influenced by an excise tax on cigarettes is because youth, as well as minorities and low-income smokers, are two to three times more likely to quit or smoke less than other smokers in response to a price increase (Tobacco Taxation Fact Sheet, 2000). Just recently, a study conducted by Grossman and Chaloupka argued that prices have a larger effect on youth because they are more present-oriented, and thus have a higher discount rate (Grossman and Chaloupka, 2001).
Numerous international and domestic groups, whether they are political or health groups, have joined the fight against youth smoking. Of the many other groups attempting to reduce tobacco consumption among youth, the President’s Commission on Improving Economic Opportunity in Communities Dependent on Tobacco Production While Improving Public Health recommends a 17-cent increase in the federal excise tax on cigarettes. The commission determined that revenues from such an increase would benefit farmers and their communities – a segment of the population affected by decreased tobacco consumption – for the first five years, and be used for public health efforts in the second five-year period (President’s Commission on Improving Economic Opportunity to Communities Dependent on Tobacco Production While Practicing Public Heath, 2001). In 2000, The World Health Organization’s report, “Tobacco and Health: A Global Status Report for United States of America” said, “this research shows that the economic measure of a tax increase is the single most important intervention by the government to curb tobacco consumption.” The World Health Organization predicts that a 10 percent increase in cigarette prices would motivate about 42 million people to stop smoking, and government revenues will increase by an average of seven percent (Tobacco or Health: A Global Status Report for United States of America, 2000). The fact that excise tax also has the possibility of raising government revenue will most likely motivate the government to support an increase in the excise tax on cigarettes.
Currently, all states prohibit the sale and distribution of tobacco to minors, and as of 1994, each state is required to actively enforce their access laws (Tobacco or Health: A Global Status Report for United States of America, 1997). While the Surgeon General’s report noted

Issues in Political Economy, Vol. 12, August 2003
that State control policies and programs should have a significant effect on teen smoking, a study conducted by Czart, Liccardo, Chaloupka, and Wechsler showed that state and local restrictions on smoking have small and rather ambiguous effects on college-age smoking. Furthermore, the study determined that local and state tobacco control policies did not significantly influence the level of smoking or smoking participation among college students (Czart, Liccardo, Chaloupka, and Wechsler, 2001). Another study noted that limits on youth access to tobacco products appear to have little impact on youth cigarette smoking (Grossman and Chaloupka, 1996). It was determined that this data was a result of relatively weak enforcement of laws regarding youth availability to tobacco (Chaloupka, 1998).
The Center for Disease Control reports that regulation of advertising and promotion, particularly the type directed at young people, is also very likely to reduce both the prevalence and initiation of smoking. Children and teenagers have proven to constitute the majority of all new smokers, and the industry’s advertising and promotion campaigns have special appeal to these young people (Tobacco Advertising and Promotion, 2000). Therefore, anti-smoking advertisements, or even the slow decrease in the appearance of such friendly faces as Joe Camel in advertisements, may encourage youth to reduce their consumption of cigarettes and tobacco products.
Although research has not been conducted on this factor, whether or not a state is one that grows tobacco as a cash crop may have an effect on the tobacco consumption of youth. This is due to the fact that some of the states with the lowest excise taxes have proven to be tobacco-growing states. For example, Kentucky, one of the nation’s most prominent tobacco-growing states, has an excise tax of three cents. In 2000, the Center for Disease Control reported that Kentucky, Nevada, Missouri, Indiana, Ohio, West Virginia, North Carolina, Tennessee, New Hampshire, Alabama, Arkansas, and Alaska were the twelve states with the highest prevalence of smoking. Of these twelve states, six are in the top ten states with the lowest excise taxes, which were all under 18-cents (Cigarette Excise Tax by State, 1998). Of the twelve states with the highest prevalence of smoking, eight are tobacco-growing states (National Center for Tobacco-Free Kids, 2000).
Research of these important influences on tobacco consumption will hopefully lead to new and beneficial information that will improve the health of the American youth population. In 2000, the Surgeon General warned that although knowledge regarding the dangers of tobacco use is still imperfect, enough knowledge exists to know that something must be done immediately about this escalating problem (Prevalence of Cigarette Smoking Among Adults, 2000). II. THEORY
After evaluating all of the research on the factors that influence youth consumption of cigarettes and tobacco products, I used econometric techniques to determine if youth smoking is affected by excise taxes, whether or not states grow tobacco, limits on youth access to tobacco products, state restrictions on tobacco advertising, and the tobacco consumption of other age groups. I chose to test the variable of whether states grow tobacco because it is not a prevalently tested variable in other studies on the tobacco consumption of youth. Tobacco consumption of youth should be higher in states that grow tobacco because excise tax tends to be lower in states that grow tobacco. The other variables of excise tax, limits on youth access to tobacco, advertising restrictions, and tobacco consumption of other age groups were chosen to see if they affected tobacco consumption of youth as previous research said they did. A higher excise tax
Issues in Political Economy, Vol. 12, August 2003
should lead to a decease in tobacco consumption of youth because of the law of demand, stronger state control policies and advertising restrictions should reduce tobacco consumption of youth because they reduce the availability and attractiveness of cigarettes, and the tobacco consumption of other age groups should dictate the tobacco consumption of youth because of role modeling, parenting, and possibly even peer pressure. Thus, I hypothesized that tobacco consumption of youth will be lower in states that (i) do not grow tobacco, (ii) have a higher excise tax, (iii) have strong advertising policies, and (iv) have lower consumption of older age groups.
III. METHODOLOGY
In order to determine the statistics and policies regarding tobacco use for the 51 states, I used data from the State Tobacco Activities Tracking and Evaluation (STATE) System. The STATE System is an electronic data warehouse containing up-to-date and historical state-level data on tobacco use prevention and control that was designed by the Centers for Disease Control and Prevention in the Office on Smoking and Health. Availability to this information allowed me to obtain cross-sectional data for each state’s consumption by the 18-24, 25-44, 45-64, and 65+ years old age groups, excise tax, whether it is illegal for minors to purchase cigarettes, and if the state has any sort of restrictions on tobacco advertisements. Consumption of smokers was measured in percentages, excise taxes were measured per dollar, and whether it is illegal to purchase cigarettes1 and advertisement restrictions for all age groups were dummy variables, answered with a “yes” or “no.” Each state was either designated a “1” for “Yes,” or “2” for “No.” All data was collected from 1997.
Information on whether or not each state is a tobacco growing state was obtained from the National Center for Tobacco-Free Kids. Whether or not the state grew tobacco as a cash crop was also a dummy variable, and was measured with a “yes” or “no.” Each state was either designated a “1” for “Yes,” or a “2” for “No.” IV. THE ORIGINAL MODEL SPECIFICATION
The model for this study, showing expected correlations between consumption of 18-24 year olds and each of the seven variables, is listed below: (1) Y = β0 – β1X1 – β2X2 + β3X3 + β4X4 + β5X5 + β6X6 + β7X7 where Y = CONSUMPTION of 18-24 year olds, X1 = TOBACCO-GROWING STATES, X2 = EXCISE TAX, X3 = STATE CONTROL POLICIES, X4 = ADVERTISING RESTRICTIONS, X5 = CONSUMPTION of 25-44 year olds, X6 = CONSUMPTION of 45-64 year olds, and X7 = CONSUMPTION of 65+ years old.
The first regression that I ran was the CONSUMPTION of 18-24 year olds on TOBACCO-GROWING STATES, EXCISE TAX, STATE CONTROL POLICIES, ADVERTISING RESTRICTIONS, and the CONSUMPTION of 25-44 year olds, 45-64 year olds, and 65+ year olds. The result of this regression is listed below: (2) Y = 8.30 – 0.81 X1 + 3.93 X2 – 1.22 X3+ 1.17 X4 + 0.91 X5– 0.18 X6– 0.06 X7
After running the regression, I was able to determine the correlations that exist between
the dependent variable and the seven independent variables. The correlation between
Issues in Political Economy, Vol. 12, August 2003
CONSUMPTION of 18-24 year olds and TOBACCO-GROWING STATES was negative, as expected, meaning that consumption is higher in states that grow tobacco. There was a positive correlation between the tobacco consumption of youth and EXCISE TAX, which was unexpected. This positive correlation implies that consumption is higher in states with a higher excise tax, which contradicts the law of demand. This is likely due to multicollinearity between the two variables. There is an unexpected correlation between CONSUMPTION of 18-24 year olds and STATE CONTROL POLICIES, meaning that consumption is higher in states where it is illegal for minors to purchase tobacco. This result is most likely due to the fact that most states do not strictly follow these policies, and because of the “perceived benefit” of smoking to minors when purchasing cigarettes is illegal. There is a positive correlation between the dependent variable and both ADVERTISING RESTRICTIONS and CONSUMPTION of 25-44 year olds, meaning that consumption is higher in states that do not have advertising restrictions and when there is higher tobacco consumption by an older age group. This correlation was expected. Finally, there were unexpected negative correlations between CONSUMPTION of 18-24 year olds and the CONSUMPTION of 45-64 year olds and 65+ year olds. This correlation means that the consumption of youth is larger in states where the consumption of much older age group is lower, which can be explained by the influence that older smokers have on youth.
After determining the individual correlations contained in the original regression, I next performed an ordinary least squares analysis. While many of the statistics contained in this analysis have importance, the two numbers on which I focused were the R-square and the adjusted R-square, which are listed in Table 1 below. In this case, the R-square is 0.37, meaning that TOBACCO-GROWING STATES, EXCISE TAX, STATE CONTROL POLICIES, ADVERTISING RESTRICTIONS, and the CONSUMPTION of 25-44 year olds, 45-64 year olds, and 65+ year olds explain approximately 37 percent of the tobacco consumption of 18-24 year olds. In other words, 63 percent of the consumption of 18-24 year olds is explained by some other variables (or some other combination of variables) that were not tested in this study.
TABLE 1: OLS Analysis for Original Regression Containing all 7 Explanatory Variables
Regression Statistics Multiple R 0.609906803 R-square 0.371986308 Adjusted R-square 0.269751521 Standard Error 4.567734188 Observations 51
A. Test for Multicollinearity Before testing for which explanatory variables should be omitted from my specification
in order to create the best line of fit, I tested for multicollinearity. Theory dictates that the most obvious case of multicollinearity may occur between the variables of TOBACCO-GROWING STATES and EXCISE TAX. However, it is also possible that any of the other variables, especially the consumption of the older age groups, could also be positively or negatively correlated with each other. In order test for multicollinearity, I conducted two separate tests using a correlation matrix and variance inflation factors. The first test for multicollinearity I ran was to produce a correlation matrix of R-square values for each pair-wise regression (Table 2). The results showed that most of the variables had little correlation, except for the CONSUMPTION

Issues in Political Economy, Vol. 12, August 2003
of 25-44 year olds and CONSUMPTION of 45-64 year olds, which had a correlation of approximately 0.70. While this could be inconclusive, I decided to rely upon variance inflation factors to definitively determine if there truly was a correlation between the consumption of these two age groups.
TABLE 2: Correlation Matrix of R Square Values for Each Pair wise Regression TG State E Tax Ill to Pur Ad Restrict 25-44 45-64 65+ TG State 1 E Tax 0.182 1 Ill to Pur 0.003 0.035 1 Ad Restric 2.925E-05 0.005 0.007 1 25-44 0.122 0.105 0.010 0.005 1 45-64 0.028 0.241 0.017 0.032 0.461 1 65+ 0.006 0.009 0.087 0.002 0.073 0.169 1
After each explanatory variable was regressed on all of the other explanatory variables
and the regressions were run, I determined the variance inflation factor, or VIF, for each regression. The VIF for each of the explanatory variables are listed in Table 3. As you can see from Table 3, multicollinearity does not appear to be a problem with these explanatory variables because the VIF are all below 5. This also suggests multicollinearity between the CONSUMPTION of 25-44 year olds and 45-64 year olds, which had a somewhat high correlation. TABLE 3: Variance Inflation Factors from Regressing Each Explanatory Variable on the Other Seven Variables
VIFTG STATES 1.58 VIFE TAX 1.55
VIFILL. TO PUR 1.57 VIFAD RESTRIC 1.57
VIF25-44 1.18 VIF45-64 1.58 VIF65+ 1.59
B. Test for Significant Variables
Next, I chose which variables should be omitted from the specification in order to find a better line of fit. In doing so, I evaluated three separate statistics found in the ordinary least squares analysis and AVONA analysis from the original regression. The following hypothesis was tested: (3) Ho: Bi equals 0
In this study, all of the variables’ p-values were greater than 0.025 except for
CONSUMPTION of 24-45 year olds. This was my first indication that the six other variables were insignificant in explaining the dependent variable, and could be omitted from the original specification. The specific p-value for each of the seven variables is listed in Table 2.
Issues in Political Economy, Vol. 12, August 2003
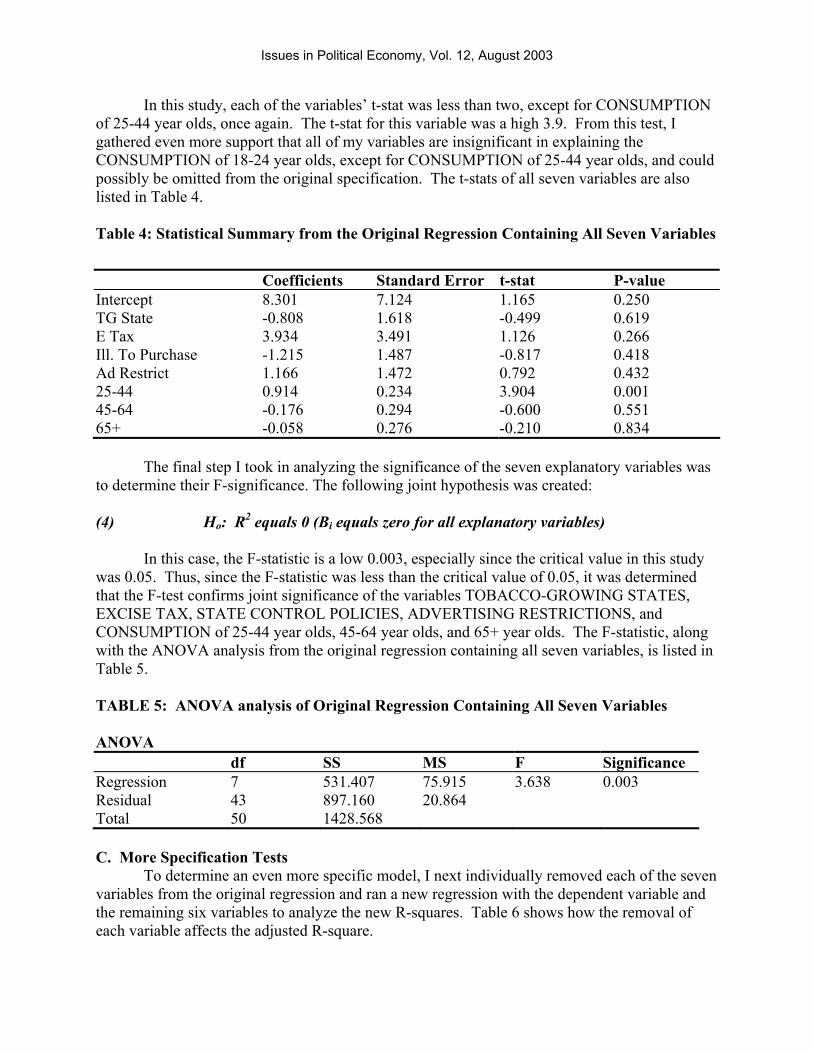
In this study, each of the variables’ t-stat was less than two, except for CONSUMPTION of 25-44 year olds, once again. The t-stat for this variable was a high 3.9. From this test, I gathered even more support that all of my variables are insignificant in explaining the CONSUMPTION of 18-24 year olds, except for CONSUMPTION of 25-44 year olds, and could possibly be omitted from the original specification. The t-stats of all seven variables are also listed in Table 4.
Table 4: Statistical Summary from the Original Regression Containing All Seven Variables
Coefficients Standard Error t-stat P-value Intercept 8.301 7.124 1.165 0.250 TG State -0.808 1.618 -0.499 0.619 E Tax 3.934 3.491 1.126 0.266 Ill. To Purchase -1.215 1.487 -0.817 0.418 Ad Restrict 1.166 1.472 0.792 0.432 25-44 0.914 0.234 3.904 0.001 45-64 -0.176 0.294 -0.600 0.551 65+ -0.058 0.276 -0.210 0.834
The final step I took in analyzing the significance of the seven explanatory variables was to determine their F-significance. The following joint hypothesis was created: (4) Ho: R2 equals 0 (Bi equals zero for all explanatory variables)
In this case, the F-statistic is a low 0.003, especially since the critical value in this study was 0.05. Thus, since the F-statistic was less than the critical value of 0.05, it was determined that the F-test confirms joint significance of the variables TOBACCO-GROWING STATES, EXCISE TAX, STATE CONTROL POLICIES, ADVERTISING RESTRICTIONS, and CONSUMPTION of 25-44 year olds, 45-64 year olds, and 65+ year olds. The F-statistic, along with the ANOVA analysis from the original regression containing all seven variables, is listed in Table 5. TABLE 5: ANOVA analysis of Original Regression Containing All Seven Variables
ANOVA df SS MS F Significance Regression 7 531.407 75.915 3.638 0.003 Residual 43 897.160 20.864 Total 50 1428.568
C. More Specification Tests
To determine an even more specific model, I next individually removed each of the seven variables from the original regression and ran a new regression with the dependent variable and the remaining six variables to analyze the new R-squares. Table 6 shows how the removal of each variable affects the adjusted R-square.
Issues in Political Economy, Vol. 12, August 2003
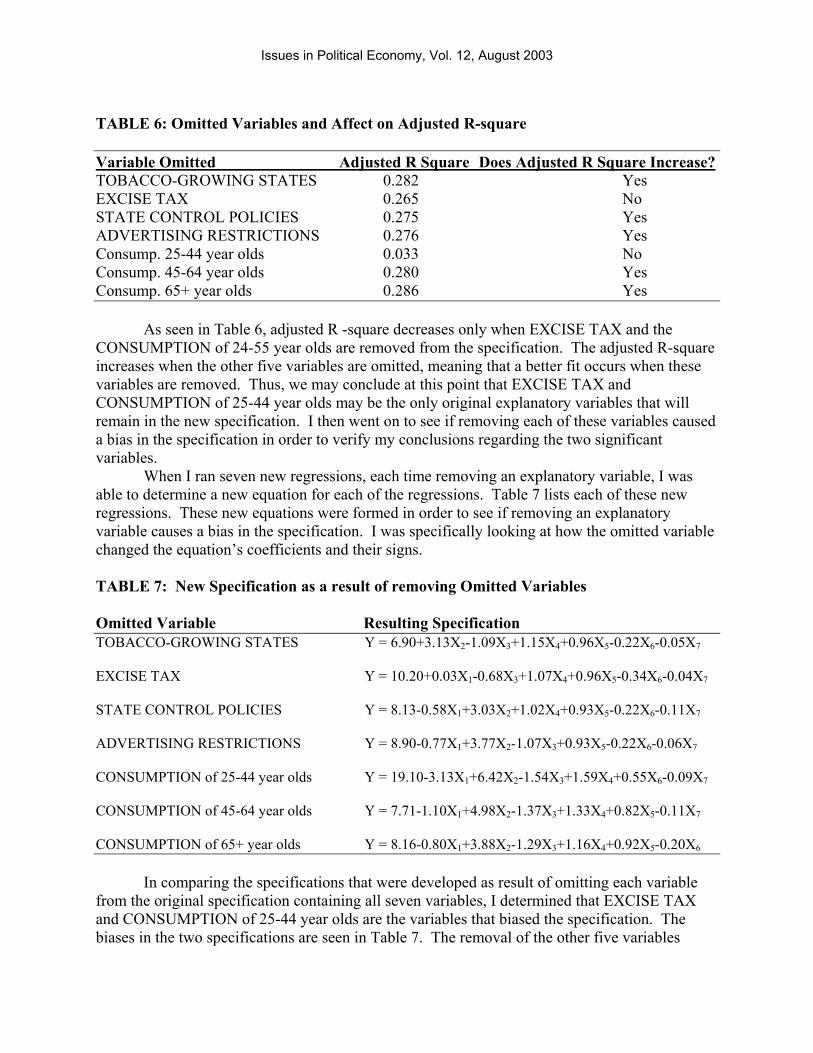
TABLE 6: Omitted Variables and Affect on Adjusted R-square
Variable Omitted Adjusted R Square Does Adjusted R Square Increase? TOBACCO-GROWING STATES 0.282 Yes EXCISE TAX 0.265 No STATE CONTROL POLICIES 0.275 Yes ADVERTISING RESTRICTIONS 0.276 Yes Consump. 25-44 year olds 0.033 No Consump. 45-64 year olds 0.280 Yes Consump. 65+ year olds 0.286 Yes
As seen in Table 6, adjusted R -square decreases only when EXCISE TAX and the CONSUMPTION of 24-55 year olds are removed from the specification. The adjusted R-square increases when the other five variables are omitted, meaning that a better fit occurs when these variables are removed. Thus, we may conclude at this point that EXCISE TAX and CONSUMPTION of 25-44 year olds may be the only original explanatory variables that will remain in the new specification. I then went on to see if removing each of these variables caused a bias in the specification in order to verify my conclusions regarding the two significant variables.
When I ran seven new regressions, each time removing an explanatory variable, I was able to determine a new equation for each of the regressions. Table 7 lists each of these new regressions. These new equations were formed in order to see if removing an explanatory variable causes a bias in the specification. I was specifically looking at how the omitted variable changed the equation’s coefficients and their signs.
TABLE 7: New Specification as a result of removing Omitted Variables Omitted Variable Resulting Specification TOBACCO-GROWING STATES Y = 6.90+3.13X2-1.09X3+1.15X4+0.96X5-0.22X6-0.05X7
EXCISE TAX Y = 10.20+0.03X1-0.68X3+1.07X4+0.96X5-0.34X6-0.04X7
STATE CONTROL POLICIES Y = 8.13-0.58X1+3.03X2+1.02X4+0.93X5-0.22X6-0.11X7 ADVERTISING RESTRICTIONS Y = 8.90-0.77X1+3.77X2-1.07X3+0.93X5-0.22X6-0.06X7 CONSUMPTION of 25-44 year olds Y = 19.10-3.13X1+6.42X2-1.54X3+1.59X4+0.55X6-0.09X7 CONSUMPTION of 45-64 year olds Y = 7.71-1.10X1+4.98X2-1.37X3+1.33X4+0.82X5-0.11X7 CONSUMPTION of 65+ year olds Y = 8.16-0.80X1+3.88X2-1.29X3+1.16X4+0.92X5-0.20X6
In comparing the specifications that were developed as result of omitting each variable from the original specification containing all seven variables, I determined that EXCISE TAX and CONSUMPTION of 25-44 year olds are the variables that biased the specification. The biases in the two specifications are seen in Table 7. The removal of the other five variables

Issues in Political Economy, Vol. 12, August 2003
caused the coefficients and the signs to change minimally in each equation. From these determinations, I was able to come to a conclusion as to which variable should be omitted from the specification.
Due to the fact that TOBACCO-GROWING STATES, STATE CONTROL POLICIES, ADVERTISING RESTRICTIONS, and the CONSUMPTION of 45-64 year olds and 65+ year olds all caused the adjusted R-square to decrease when removed from the specification, did not have a bias, and were not statistically significant, I decided to omit them from my specification. Furthermore, individually removing all the variables from the equation barely changes the standard error of the equation, except when removing the CONSUMPTION of 25-44 year olds. Thus, EXCISE TAX and CONSUMPTION of 25-44 year olds are the only two explanatory variables that remain. Although most of the explanatory variables that were omitted had theoretical justification for remaining in the specification, the evidence gathered from the many tests that I performed was more than overwhelming in supporting their removal from the specification. V. THE NEW MODEL SPECIFICATION
After performing the aforementioned tests in order to identify a new specification with a better line of fit, I ran a new regression using the new variables that I decided to leave in the specification. In this new regression, CONSUMPTION of 18-24 year olds was regressed on EXCISE TAX and CONSUMPTION of 25-44 year olds. The specification is listed below as (5) Y = 5.80 + 3.74 X1 + 0.80 X2 where Y = CONSUMPTION of 18-24 year olds, X1 = EXCISE TAX, and X2 = CONSUMPTION of 25-44 year olds.
The R-square of the new regression was 0.33, meaning that the two variables of EXCISE TAX and CONSUMPTION of 25-44 year olds explain approximately 33 percent of the CONSUMPTION of 18-24 year olds. This is a fairly decent outcome, as the first regression showed that all seven variables tested only explained approximately 37 percent of youth consumption. The t-stat and p-values showed that CONSUMPTION of 25-44 year olds was still the only significant variable at the 5 percent level. However, they also show that while EXCISE TAX is not significant at a 5 percent level, EXCISE TAX is significant at the 17 percent level. In other words, I am 95 percent confident that CONSUMPTION of 25-44 year olds is statistically significant, and 83 percent that EXCISE TAX is statistically significant. The F-statistic was still lower than the critical value (0.05), thus meaning that these two variables are jointly significant in affecting tobacco consumption of youth.
With a new specification determined, the final step of my study was to test for heteroscedasticity or autocorrelation. As my study contains cross-sectional data, a test for heteroscedasticity would be more relevant than a test for autocorrelation.
A. Test for Heteroscedasticity
To begin the test for heteroscedasticity, I stated a joint hypothesis, putting the bias towards the null hypothesis. The joint hypothesis required to test for heteroscedasticity is:
(6) Ho: B1 equals zero (Homoscedastic)

Issues in Political Economy, Vol. 12, August 2003
After establishing the joint hypothesis, I then ran the Park Test. The results of these tests are in Table 8: Table 8: Result of Regressing Natural Log of Squared Error Terms on the Natural Log of Each Individual Explanatory Variable
Ln (ei2) = 2.93 + 1.30 lnEtaxi
Ln (ei2) = 21.75 – 6.19 ln25-44i
In looking at the statistical summaries of each of the regressions run, it is clear that in the
first regression, which was the natural log of the squared residuals on the natural log of EXCISE TAX, the natural log of EXCISE TAX appears to be significant. The t-stat and p-value for this regression can be seen in Table 9. Thus, I may conclude that EXCISE TAX is heteroscedastic at the critical value of 0.05, as I rejected the null hypothesis that EXCISE TAX is homescedastic.
The statistical summary of the second regression, which was the natural log of the squared error terms on the natural log of CONSUMPTION of 25-44 year olds, showed that the CONSUMPTION of 25-44 year olds is also significant. I was able to once again reject the null hypothesis and declare heteroscedasticity. The t-stat and p-values for this regression can also be found in Table 9. TABLE 9A: Regression of Natural Log of CONSUMPTION of 18-24 year olds on Natural Log of EXCISE TAX (Park Test)
Coefficients Standard Error t-stat P-value Intercept 2.931 0.698 4.197 0.001 E Tax 1.302 0.478 2.720 0.009
Table 9b: Regression of Natural Log of CONSUMPTION of 18-24 year olds on Natural Log of CONSUMPTION of 25-44 year olds (Park Test) Coefficients Standard Error t-stat p-value Intercept 21.750 8.539 2.546 0.014 LN(25-44) -6.185 2.587 -2.390 0.020
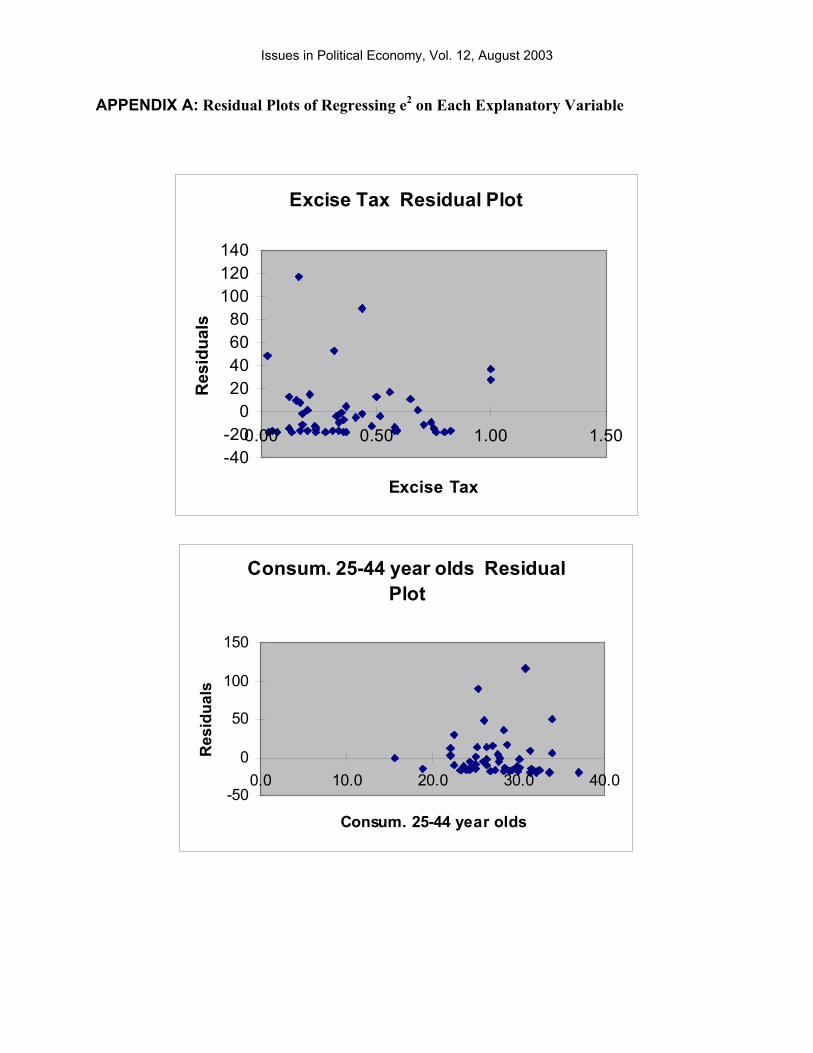
Residual plots of for EXCISE TAX and CONSUMPTION of 25-44 year olds did not show any obvious pattern between the error terms. These residual plots can be found in the appendix. However, because the Park Test suggested heteroscedasticity with the two explanatory variables, I attempted to remedy this situation through using the weighted least squares method.2
The weighted least squares method, the method that I mentioned earlier, is to re-estimate the specification by dividing all of the variables in the equation by an explanatory variable. Typically, the variable that is divided into each of the variables is the one that has heteroscedasticity. In this case, since both the Park and Tests confirmed that EXCISE TAX has

Issues in Political Economy, Vol. 12, August 2003
heteroscedasticity, I divided this variable through the equation and ran a new regression. The results of reformulating the equation is listed below as (7) Y = -5.32 + 1.10 X1 where Y = CONSUMPTION of 18-24 year olds / EXCISE TAX and X1 = CONSUMPTION of 25-44 year olds / EXCISE TAX.
In analyzing the new specification, it was clear that it proved to be the best line of fit in the study. The R-square was an extremely high 0.96, meaning that the new explanatory variable of CONSUMPTION of 25-44 year olds / EXCISE TAX explains approximately 96 percent of the CONSUMPTION of 18-24 year olds. The t-stat value was less than two, the p-value was less than 0.025, and the F-statistic was less than 0.05, all showing that the explanatory variable is significant. The ordinary least squares and ANOVA analyses for this regression can be found in Table 10. EXCISE TAX would be the best variable to use as the proportionality factor because when CONSUMPTION of 25-44 year olds is used, the new regression produces an extremely low adjusted R-square and the new variable is insignificant. Thus, this regression is the final specification for this study. TABLE 10: Result of Regression of CONSUMPTION of 18-24 year olds / EXCISE TAX on CONSUMPTION of 25-44 year olds / EXCISE TAX
Regression Statistics Multiple R 0.980 R Square 0.961 Adjusted R Square 0.960 Standard Error 50.557 Observations 51
Coefficients Standard Error t-stat P-value
Intercept -5.322 8.503 -0.625 0.534 25-44/E Tax 1.100 0.031 35.050 2.325 E-36
VI. DISCUSSION As the occurrence of smoking by younger segments of the population is an increasing
problem in the United States, this experiment takes progressive steps in determining what factors influence the CONSUMPTION of tobacco by smokers 18-24 years old. Data from this study did not support the hypothesis that was made at the start of this experiment, which was that tobacco CONSUMPTION of 18-24 year olds will be higher in states that grow tobacco, have a lower EXCISE TAX, where it is legal for minors to purchase cigarettes, do not restrict advertising, and have higher CONSUMPTION of older age groups.
Furthermore, this study does not completely support the previous research on tobacco consumption. Data shows that five of the seven independent variables employed in this study, TOBACCO-GROWING STATES, STATE CONTROL POLICIES, ADVERTISING

Issues in Political Economy, Vol. 12, August 2003
RESTRICTION, and the CONSUMPTION of 45-64 year olds and 65+ year olds, were statistically insignificant. The only variable that proved to be clearly statistically significant was the CONSUMPTION of 25-44 year olds. This finding is important because for youth ages 18-24, many of their role models and parents fall into the age group of 25-44 year olds. This suggests that perhaps whether or not a parent or older sibling consumes tobacco has a significant influence on the choice of 18-24 year olds to use tobacco products. Another interesting finding in this study was that the variable EXCISE TAX was only slightly significant. While this variable was only slightly significant, it remained in the specification because of its theoretical importance dictated by the law of demand. It was surprising to see that EXCISE TAX has such a small influence on tobacco consumption, especially since the Surgeon General believes that raising the excise tax on tobacco is one of the most effective tactics in reducing the youth consumption of tobacco. This study suggests that other variables, such as addiction and the income of the 18-24 age group, may influence the significance of EXCISE TAX. Due to the problem of heteroscedasticity, the final specification that had the best line of fit only included a ratio of EXCISE TAX and CONSUMPTION by 25-44 year olds.
While this research fails to support numerous well-established studies and previous research on tobacco consumption of the youth population, it could be important to other researchers because it rules out most of the options for decreasing tobacco consumption. However, there are many limitations to this study. First of all, the other variables that previous research has established as significant factors in reducing tobacco consumption could have been tested. For example, it would have been helpful to determine if each state’s clean air policies in public places had any effect on tobacco consumption of 18-24 year olds, as research shows that they do indeed have an effect. Other influences that could have been explored are whether or not college control policies, educational strategies, and pharmacological treatment influence tobacco consumption of youth. However, this data was not readily and completely available for each state. Secondly, some of the data used in this experiment may not be specific enough to arrive at accurate conclusions. For example, restrictions on advertising were specified with a “yes” or “no,” but the specific type of restriction in each state was not noted. Each state clearly has different variations of restrictions, and there were ways that one could have distinguished between each state’s restrictions. Furthermore, data on the EXCISE TAX, TOBACCO-GROWING STATES, and CONSUMPTION of 18-24, 25-44, 45-64, and 65+ year olds was only as recent as 1997. Results and conclusions of this study may have been more accurate if more recent data was employed. For example, to more accurately study the habits and consumption of youth, statistics from younger age groups, such as the statistics on the consumption of high school students, should have been used.
Even though this study did not come to a finite conclusion as to what factors will actually reduce tobacco consumption of 18-24 year olds, it encourages other experimenters not only to look for other ways to reduce consumption, but to see if the factors employed in this experiment may have increased in significance over the years. In fact, if used in combination with a variety of other factors not tested in this experiment, the variables used in this study may actually become relevant. It is clear that something must be done about the epidemic of teen smoking in America. Tobacco use will remain the leading cause of preventable illness and death in the nation until tobacco prevention efforts are proportionate with the harm caused by tobacco use (Prevalence of Cigarette Smoking Among Adults, 2000).
Issues in Political Economy, Vol. 12, August 2003
APPENDIX A: Residual Plots of Regressing e2 on Each Explanatory Variable
Excise Tax Residual Plot
-40-20
020406080
100120140
0.00 0.50 1.00 1.50
Excise Tax
Res
idua
ls
Consum. 25-44 year olds Residual Plot
-50
0
50
100
150
0.0 10.0 20.0 30.0 40.0
Consum. 25-44 year olds
Res
idua
ls

Issues in Political Economy, Vol. 12, August 2003
REFERENCES
Bardsley, Peter and Nilss Olekalns, “Cigarette and Tobacco Consumption: Have Anti- Smoking Policies Made a Difference?” Economic Record, 75, 1999, 225-240. Center for Disease Control. Targeting Tobacco Use: The Nation’s Leading Cause of Death, 2002. Chaloupka, Frank J., Limiting Youth Access to Tobacco: The Early Impact of the Synar Amendment on Youth Smoking, 1998. Chaloupka, Frank J. and Michael Grossman, “Price, Tobacco Control Policies, and Youth moking,” NBER Working Paper. September, 1996. Czart, Christina, Rosalie Liccardo, Frank Chaloupka, and Henry Wechsler. “The Impact of Prices and Control Policies on Cigarette Smoking Among College Students,” Contemporary Economic Policy, 19, 2001, 135-149. Department of Health and Human Services, Reducing Tobacco Use: A Report of the Surgeon General. Prevalence of Cigarette Smoking Among Adults. Washington, 2000. Department of Health and Human Services, Reducing Tobacco Use: A Report of the Surgeon General. Historical Fact Sheet. Washington, 2000. Department of Health and Human Services, Reducing Tobacco Use: A Report of the Surgeon General. Tobacco Taxation Fact Sheet. Washington, 2000. Department of Health and Human Services, Reducing Tobacco Use: A Report of the Surgeon General. Tobacco Advertising and Promotion. Washington, 2000. Department of Health and Human Services, State-Specific Prevelance of Cigarette Smoking Among Adults and Cigarette Smoking in 99 Metropolitan Areas- United States, 2000. Washington, 2000. Farrelly, Matthew C., Jeremy W. Bray, Terry Pechacek, and Trevor Woollery, “Response by Adults to Increases in Cigarette Prices by Sociodemographic Characteristics,” Southern Economic Journal, 68, 2001, 156-165. National Center for Tobacco-Free Kids. Campaign for Tobacco-Free Kids. Tobacco Growing States in the U.S.A. Washington, D.C. November, 2000. State Tobacco Activities Tracking and Evaluation System. Office on Smoking and Health. Centers for Disease Control and Prevention. Cigarette Excise Taxes by State. Washington, 1998. State Tobacco Activities Tracking and Evaluation System: Office on Smoking and
Issues in Political Economy, Vol. 12, August 2003
Health. Centers for Disease Control and Prevention. Smokeless Tobacco Excise Taxes by State. Washington: September, 1998. State Tobacco Activities Tracking and Evaluation System: Office on Smoking and Health. Centers for Disease Control and Prevention. Tobacco Behavior, Economics, and Health Cost of Each State in United States. Washington, 1999. State Tobacco Activities Tracking and Evaluation System: Office on Smoking and Health. Centers for Disease Control and Prevention. State and National Tobacco Control Highlights. Washington, 1997. Tobacco Commission: President’s Commission on Improving Economic Opportunity to Communities Dependent on Tobacco Production while Protecting Public Health. Washington, 2001. Tobacco Information and Prevention Source (TIPS). National Center for Chronic Disease Prevention and Health Promotion. State and National Tobacco Control Highlights for the United States. Washington, 1995. Tobacco Information and Prevention Source (TIPS). National Center for Disease Prevention and Health Promotion. Investment in Tobacco Control State Highlights. Washington, 2001. World Health Organization: Tobacco or Health Programme. Tobacco or Health: A Global Status Report for United States of America. Washington, 1997. ENDNOTES
1 The variable of whether it is legal for minors to purchase tobacco products will also be called STATE CONTROL POLICIES in this study. 2 Another way to remedy for Heteroscedasticity would be to search for an omitted variable and see if including it in the specification would eliminate Heteroscedasticity. However, since the other variables used in this study are irrelevant and were also ruled omitted variables, I decided to use the Weighted Least Squares Method.


![[Collett] Modelling Survival Data in Medical Research](https://img.pdfslide.net/doc/110x75/545d9f30af7959c8098b4d7d/collett-modelling-survival-data-in-medical-research.jpg)