Embed Size (px)
Citation preview
The remarkable underlyingground states of cupratesuperconductors
Cyril Proust1,2 and Louis Taillefer2,3
1Laboratoire National des Champs Magnetiques Intenses (CNRS, EMFL, INSA,
UJF, UPS), Toulouse 31400, France; email: [email protected] Institute for Advanced Research, Toronto, Ontario M5G 1Z8, Canada3Institut quantique, Departement de physique & RQMP, Universite de
Sherbrooke, Sherbrooke, Quebec J1K 2R1, Canada; email:
Xxxx. Xxx. Xxx. Xxx. 2018. 10:1–21
https://doi.org/10.1146/((please add
article doi))
Copyright c© 2018 by Annual Reviews.
All rights reserved
Keywords
cuprates, high-temperature superconductors, high magnetic fields,
pseudogap phase, quantum critical point, Planckian dissipation
Abstract
Cuprates exhibit exceptionally strong superconductivity. To under-
stand why, it is essential to elucidate the nature of the electronic inter-
actions that cause pairing. Superconductivity occurs on the backdrop
of several underlying electronic phases, including a doped Mott insu-
lator at low doping, a strange metal at high doping, and an enigmatic
pseudogap phase in between – inside which a phase of charge-density-
wave order appears. In this Article, we aim to shed light on the nature
of these remarkable phases by focusing on the limit as T → 0, where ex-
perimental signatures and theoretical statements become sharper. We
therefore survey the ground state properties of cuprates once supercon-
ductivity has been removed by the application of a magnetic field, and
distill their key universal features.
1
arX
iv:1
807.
0507
4v1
[co
nd-m
at.s
upr-
con]
13
Jul 2
018
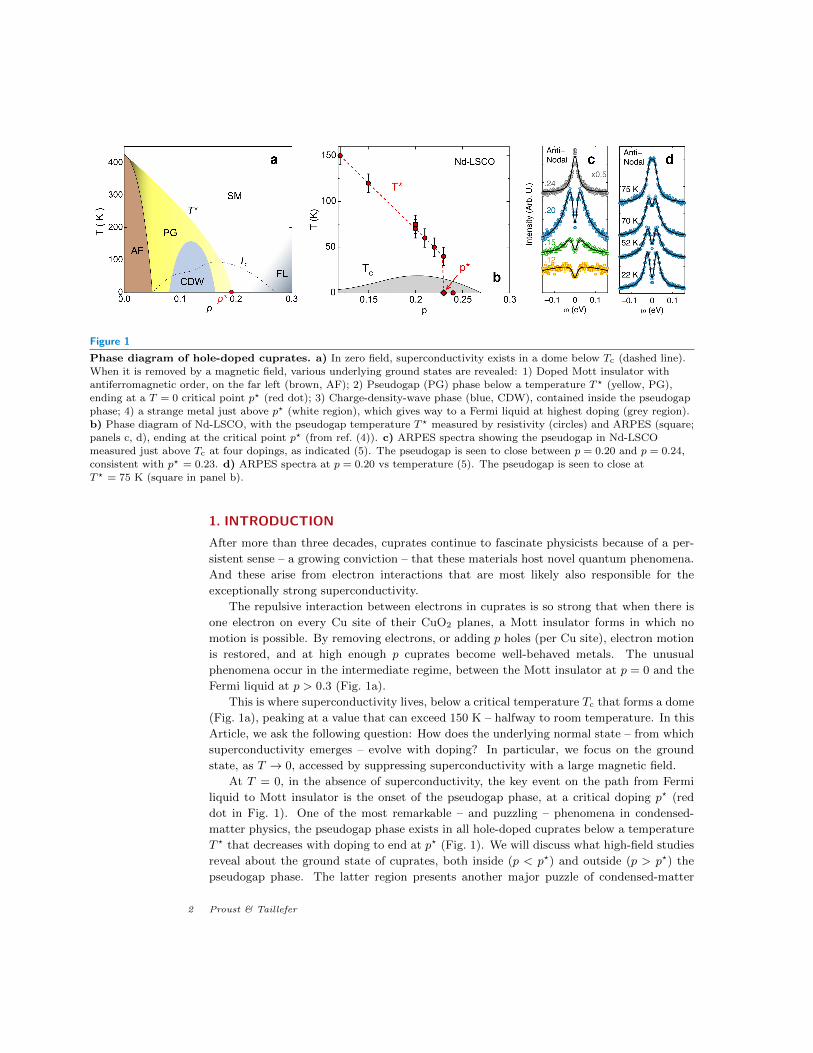
Figure 1
Phase diagram of hole-doped cuprates. a) In zero field, superconductivity exists in a dome below Tc (dashed line).When it is removed by a magnetic field, various underlying ground states are revealed: 1) Doped Mott insulator with
antiferromagnetic order, on the far left (brown, AF); 2) Pseudogap (PG) phase below a temperature T ? (yellow, PG),
ending at a T = 0 critical point p? (red dot); 3) Charge-density-wave phase (blue, CDW), contained inside the pseudogapphase; 4) a strange metal just above p? (white region), which gives way to a Fermi liquid at highest doping (grey region).
b) Phase diagram of Nd-LSCO, with the pseudogap temperature T ? measured by resistivity (circles) and ARPES (square;
panels c, d), ending at the critical point p? (from ref. (4)). c) ARPES spectra showing the pseudogap in Nd-LSCOmeasured just above Tc at four dopings, as indicated (5). The pseudogap is seen to close between p = 0.20 and p = 0.24,
consistent with p? = 0.23. d) ARPES spectra at p = 0.20 vs temperature (5). The pseudogap is seen to close at
T ? = 75 K (square in panel b).
1. INTRODUCTION
After more than three decades, cuprates continue to fascinate physicists because of a per-
sistent sense – a growing conviction – that these materials host novel quantum phenomena.
And these arise from electron interactions that are most likely also responsible for the
exceptionally strong superconductivity.
The repulsive interaction between electrons in cuprates is so strong that when there is
one electron on every Cu site of their CuO2 planes, a Mott insulator forms in which no
motion is possible. By removing electrons, or adding p holes (per Cu site), electron motion
is restored, and at high enough p cuprates become well-behaved metals. The unusual
phenomena occur in the intermediate regime, between the Mott insulator at p = 0 and the
Fermi liquid at p > 0.3 (Fig. 1a).
This is where superconductivity lives, below a critical temperature Tc that forms a dome
(Fig. 1a), peaking at a value that can exceed 150 K – halfway to room temperature. In this
Article, we ask the following question: How does the underlying normal state – from which
superconductivity emerges – evolve with doping? In particular, we focus on the ground
state, as T → 0, accessed by suppressing superconductivity with a large magnetic field.
At T = 0, in the absence of superconductivity, the key event on the path from Fermi
liquid to Mott insulator is the onset of the pseudogap phase, at a critical doping p? (red
dot in Fig. 1). One of the most remarkable – and puzzling – phenomena in condensed-
matter physics, the pseudogap phase exists in all hole-doped cuprates below a temperature
T ? that decreases with doping to end at p? (Fig. 1). We will discuss what high-field studies
reveal about the ground state of cuprates, both inside (p < p?) and outside (p > p?) the
pseudogap phase. The latter region presents another major puzzle of condensed-matter
2 Proust & Taillefer
ELECTRON-DOPED CUPRATES
Electron-doped cuprates are consistent with the paradigm of an AF QCP – with AF order, FS reconstruction
and T -linear resistivity all organized around a quantum critical point at x?, in NCCO, PCCO and LCCO
(6). With decreasing electron doping x, at T = 0, the AF correlation length increases rapidly below x? (7),
the critical doping where the Fermi surface undergoes a sharp transition from a large cylinder containing
n = 1 − x holes, as seen in RH (8), QOs (9) and ARPES (10, 11), to small closed pockets (seen in QOs),
and eventually to a small anti-nodal electron pocket (seen in ARPES), consistent with n ' −x (from RH).
ARPES shows that the reconstruction is consistent with an AF Brillouin zone with ordering wavevector
Q = (π, π) (11). T -linear resistivity is observed as T → 0, at and slightly above x? (12, 13, 14). At x x?,
ρ ∼ T 2 (13); at x < x?, upturns appear in ρ(T ) at low T (14, 15). Unlike in hole-doped cuprates, the
’pseudogap’ observed by ARPES in NCCO is clearly associated with the AF order (11): as a function of
angle around the FS, it is maximal at the ’hot spots’ where the FS intersects the AF zone boundary; as
a function of x, its spectral weight decreases in tandem with the AF correlation length; as a function of
decreasing T , it forms below the same temperature T ? where optics sees a ’pseudogap’ open, which is where
the AF correlation length exceeds the thermal de Broglie wavelength (16).
physics: a perfectly T -linear dependence of resistivity as T → 0. While not unique to
cuprates, this is where this remarkable phenomenon is strongest.
Before we begin, it is important to mention that the phase diagram of Fig. 1, with
its Tc dome straddling a critical point, is reminiscent of that found in several families of
materials, all part of the same general paradigm – the paradigm of an antiferromagnetic
quantum critical point (QCP) (1, 2). These include heavy-fermion metals, iron-based su-
perconductors and quasi-1D organic conductors. The latter are a good archetype, because
of their simple Fermi surface, and their key properties include :
1. AF phase ends at a QCP, located at X*
2. d-wave superconductivity forms a dome surrounding X*
3. Fermi surface is reconstructed (by AF order) below X*
4. T -linear resistivity at X = X*
5. Fermi-liquid T 2 resistivity at X X*
where X is the tuning parameter, e.g. pressure. In materials like (TMTSF)2PF6, there
is little doubt that AF spin fluctuations, measured by NMR, are responsible for d-wave
pairing and T -linear scattering (3).
When cuprates are doped with electrons rather than holes, their properties are also
consistent with the AF QCP paradigm (see Sidebar). In what ways, then, are hole-doped
cuprates different? First, a quantitive difference: their electron interactions are stronger,
as measured by their higher Tc and their higher effective mass m?, for example. Secondly,
a qualitative difference: they have a pseudogap phase, for which there is no real equivalent
in electron-doped cuprates (6).
AF:antiferromagnetic
PG: pseudogap
CDW: chargedensity wave
SDW: spin density
wave
Tc: superconducting
transitiontemperature in zerofield
T ?: pseudogap
temperature
p?: pseudogap
critical point
QCP: quantumcritical point
NCCO:Nd2−xCexCuO4
PCCO:Pr2−xCexCuO4
LCCO:La2−xCexCuO4
www.annualreviews.org • The remarkable underlying ground states of cuprate superconductors 3
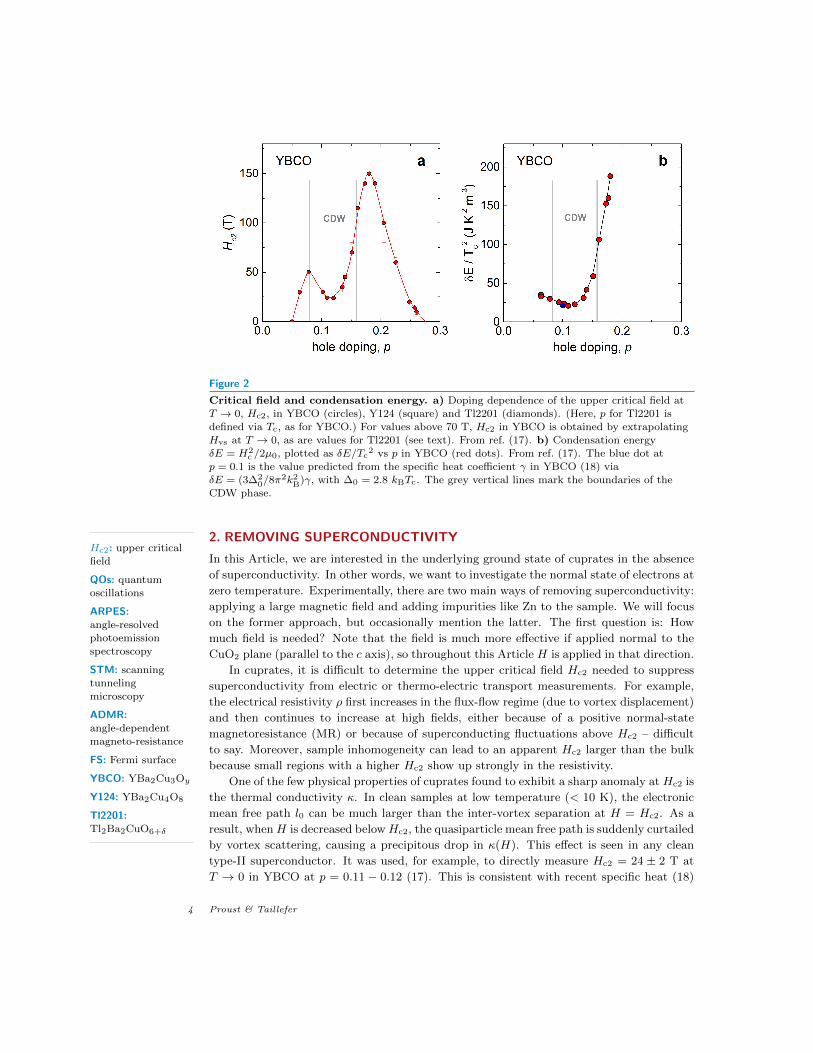
Figure 2
Critical field and condensation energy. a) Doping dependence of the upper critical field atT → 0, Hc2, in YBCO (circles), Y124 (square) and Tl2201 (diamonds). (Here, p for Tl2201 is
defined via Tc, as for YBCO.) For values above 70 T, Hc2 in YBCO is obtained by extrapolating
Hvs at T → 0, as are values for Tl2201 (see text). From ref. (17). b) Condensation energyδE = H2
c /2µ0, plotted as δE/Tc2 vs p in YBCO (red dots). From ref. (17). The blue dot at
p = 0.1 is the value predicted from the specific heat coefficient γ in YBCO (18) via
δE = (3∆20/8π
2k2B)γ, with ∆0 = 2.8 kBTc. The grey vertical lines mark the boundaries of theCDW phase.
2. REMOVING SUPERCONDUCTIVITY
In this Article, we are interested in the underlying ground state of cuprates in the absence
of superconductivity. In other words, we want to investigate the normal state of electrons at
zero temperature. Experimentally, there are two main ways of removing superconductivity:
applying a large magnetic field and adding impurities like Zn to the sample. We will focus
on the former approach, but occasionally mention the latter. The first question is: How
much field is needed? Note that the field is much more effective if applied normal to the
CuO2 plane (parallel to the c axis), so throughout this Article H is applied in that direction.
In cuprates, it is difficult to determine the upper critical field Hc2 needed to suppress
superconductivity from electric or thermo-electric transport measurements. For example,
the electrical resistivity ρ first increases in the flux-flow regime (due to vortex displacement)
and then continues to increase at high fields, either because of a positive normal-state
magnetoresistance (MR) or because of superconducting fluctuations above Hc2 – difficult
to say. Moreover, sample inhomogeneity can lead to an apparent Hc2 larger than the bulk
because small regions with a higher Hc2 show up strongly in the resistivity.
Hc2: upper criticalfield
QOs: quantum
oscillations
ARPES:angle-resolved
photoemissionspectroscopy
STM: scanning
tunnelingmicroscopy
ADMR:angle-dependentmagneto-resistance
FS: Fermi surface
YBCO: YBa2Cu3Oy
Y124: YBa2Cu4O8
Tl2201:Tl2Ba2CuO6+δ
One of the few physical properties of cuprates found to exhibit a sharp anomaly at Hc2 is
the thermal conductivity κ. In clean samples at low temperature (< 10 K), the electronic
mean free path l0 can be much larger than the inter-vortex separation at H = Hc2. As a
result, whenH is decreased belowHc2, the quasiparticle mean free path is suddenly curtailed
by vortex scattering, causing a precipitous drop in κ(H). This effect is seen in any clean
type-II superconductor. It was used, for example, to directly measure Hc2 = 24 ± 2 T at
T → 0 in YBCO at p = 0.11 − 0.12 (17). This is consistent with recent specific heat (18)
4 Proust & Taillefer
a b c d
pp*
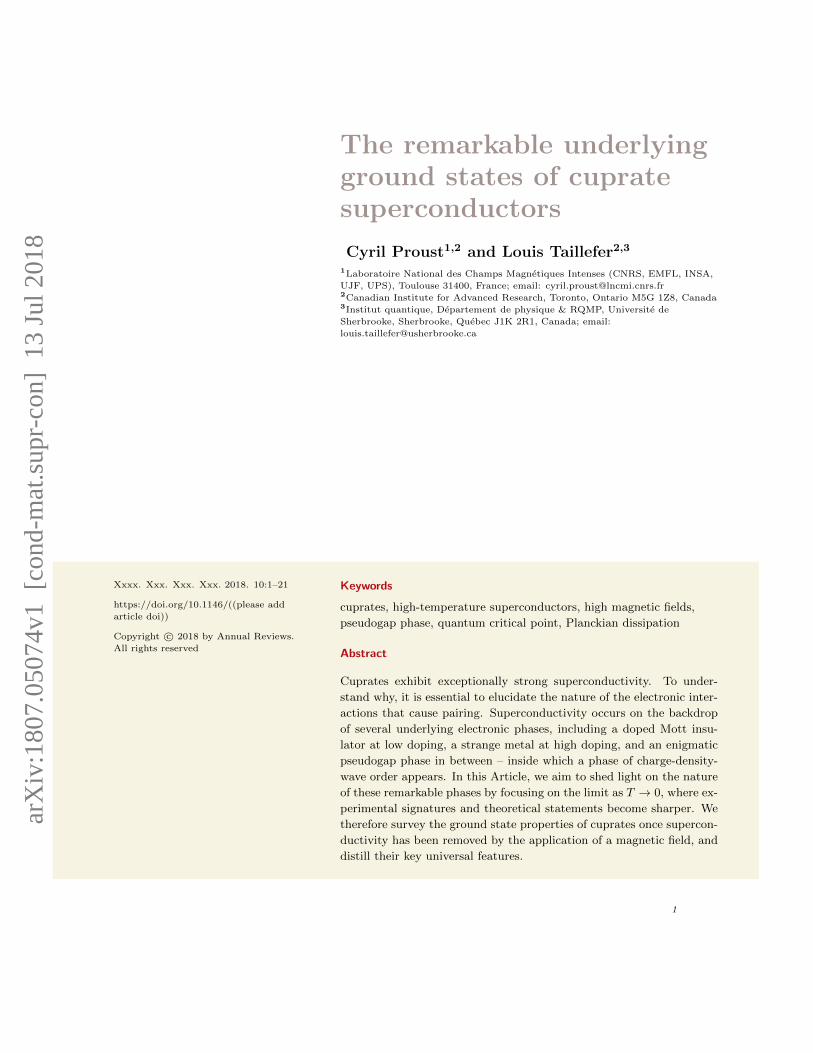
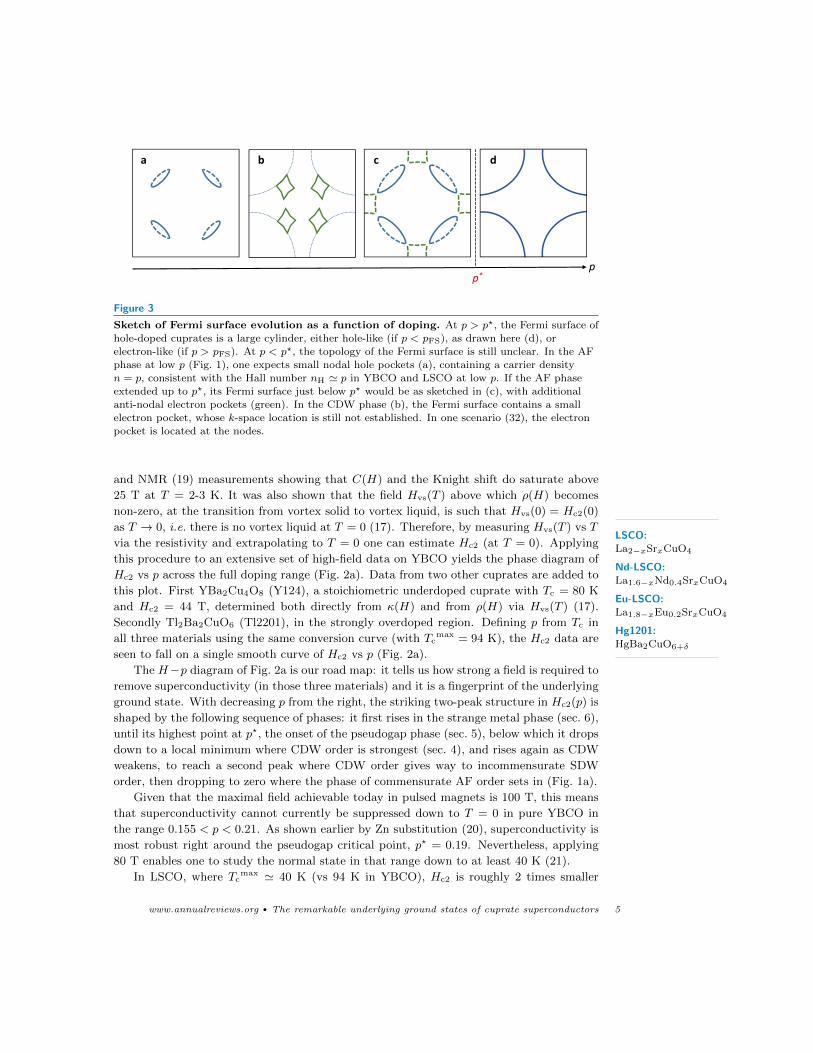
Figure 3
Sketch of Fermi surface evolution as a function of doping. At p > p?, the Fermi surface ofhole-doped cuprates is a large cylinder, either hole-like (if p < pFS), as drawn here (d), or
electron-like (if p > pFS). At p < p?, the topology of the Fermi surface is still unclear. In the AF
phase at low p (Fig. 1), one expects small nodal hole pockets (a), containing a carrier densityn = p, consistent with the Hall number nH ' p in YBCO and LSCO at low p. If the AF phase
extended up to p?, its Fermi surface just below p? would be as sketched in (c), with additional
anti-nodal electron pockets (green). In the CDW phase (b), the Fermi surface contains a smallelectron pocket, whose k-space location is still not established. In one scenario (32), the electron
pocket is located at the nodes.
and NMR (19) measurements showing that C(H) and the Knight shift do saturate above
25 T at T = 2-3 K. It was also shown that the field Hvs(T ) above which ρ(H) becomes
non-zero, at the transition from vortex solid to vortex liquid, is such that Hvs(0) = Hc2(0)
as T → 0, i.e. there is no vortex liquid at T = 0 (17). Therefore, by measuring Hvs(T ) vs T
via the resistivity and extrapolating to T = 0 one can estimate Hc2 (at T = 0). Applying
this procedure to an extensive set of high-field data on YBCO yields the phase diagram of
Hc2 vs p across the full doping range (Fig. 2a). Data from two other cuprates are added to
this plot. First YBa2Cu4O8 (Y124), a stoichiometric underdoped cuprate with Tc = 80 K
and Hc2 = 44 T, determined both directly from κ(H) and from ρ(H) via Hvs(T ) (17).
Secondly Tl2Ba2CuO6 (Tl2201), in the strongly overdoped region. Defining p from Tc in
all three materials using the same conversion curve (with Tcmax = 94 K), the Hc2 data are
seen to fall on a single smooth curve of Hc2 vs p (Fig. 2a).
LSCO:La2−xSrxCuO4
Nd-LSCO:La1.6−xNd0.4SrxCuO4
Eu-LSCO:La1.8−xEu0.2SrxCuO4
Hg1201:HgBa2CuO6+δ
The H−p diagram of Fig. 2a is our road map: it tells us how strong a field is required to
remove superconductivity (in those three materials) and it is a fingerprint of the underlying
ground state. With decreasing p from the right, the striking two-peak structure in Hc2(p) is
shaped by the following sequence of phases: it first rises in the strange metal phase (sec. 6),
until its highest point at p?, the onset of the pseudogap phase (sec. 5), below which it drops
down to a local minimum where CDW order is strongest (sec. 4), and rises again as CDW
weakens, to reach a second peak where CDW order gives way to incommensurate SDW
order, then dropping to zero where the phase of commensurate AF order sets in (Fig. 1a).
Given that the maximal field achievable today in pulsed magnets is 100 T, this means
that superconductivity cannot currently be suppressed down to T = 0 in pure YBCO in
the range 0.155 < p < 0.21. As shown earlier by Zn substitution (20), superconductivity is
most robust right around the pseudogap critical point, p? = 0.19. Nevertheless, applying
80 T enables one to study the normal state in that range down to at least 40 K (21).
In LSCO, where Tcmax ' 40 K (vs 94 K in YBCO), Hc2 is roughly 2 times smaller
www.annualreviews.org • The remarkable underlying ground states of cuprate superconductors 5
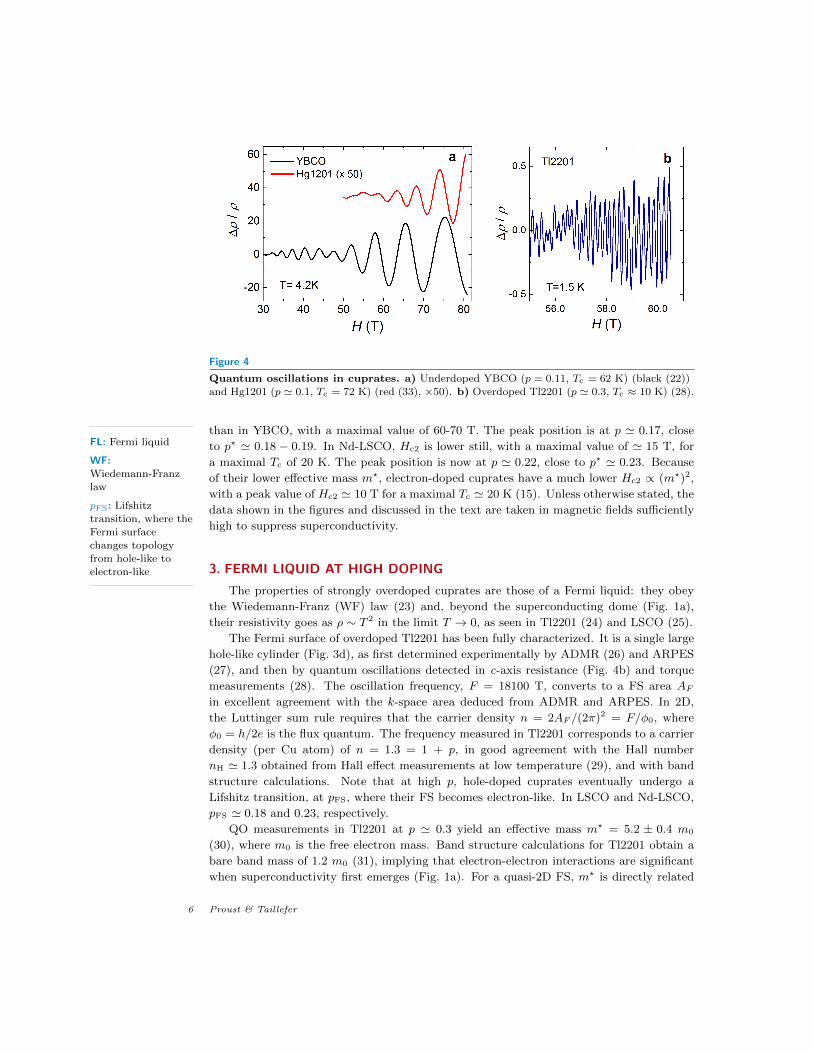
Figure 4
Quantum oscillations in cuprates. a) Underdoped YBCO (p = 0.11, Tc = 62 K) (black (22))
and Hg1201 (p ' 0.1, Tc = 72 K) (red (33), ×50). b) Overdoped Tl2201 (p ' 0.3, Tc ≈ 10 K) (28).
than in YBCO, with a maximal value of 60-70 T. The peak position is at p ' 0.17, close
to p? ' 0.18 − 0.19. In Nd-LSCO, Hc2 is lower still, with a maximal value of ' 15 T, for
a maximal Tc of 20 K. The peak position is now at p ' 0.22, close to p? ' 0.23. Because
of their lower effective mass m?, electron-doped cuprates have a much lower Hc2 ∝ (m?)2,
with a peak value of Hc2 ' 10 T for a maximal Tc ' 20 K (15). Unless otherwise stated, the
data shown in the figures and discussed in the text are taken in magnetic fields sufficiently
high to suppress superconductivity.
3. FERMI LIQUID AT HIGH DOPING
FL: Fermi liquid
WF:Wiedemann-Franz
law
pFS: Lifshitz
transition, where the
Fermi surfacechanges topology
from hole-like to
electron-like
The properties of strongly overdoped cuprates are those of a Fermi liquid: they obey
the Wiedemann-Franz (WF) law (23) and, beyond the superconducting dome (Fig. 1a),
their resistivity goes as ρ ∼ T 2 in the limit T → 0, as seen in Tl2201 (24) and LSCO (25).
The Fermi surface of overdoped Tl2201 has been fully characterized. It is a single large
hole-like cylinder (Fig. 3d), as first determined experimentally by ADMR (26) and ARPES
(27), and then by quantum oscillations detected in c-axis resistance (Fig. 4b) and torque
measurements (28). The oscillation frequency, F = 18100 T, converts to a FS area AFin excellent agreement with the k-space area deduced from ADMR and ARPES. In 2D,
the Luttinger sum rule requires that the carrier density n = 2AF /(2π)2 = F/φ0, where
φ0 = h/2e is the flux quantum. The frequency measured in Tl2201 corresponds to a carrier
density (per Cu atom) of n = 1.3 = 1 + p, in good agreement with the Hall number
nH ' 1.3 obtained from Hall effect measurements at low temperature (29), and with band
structure calculations. Note that at high p, hole-doped cuprates eventually undergo a
Lifshitz transition, at pFS, where their FS becomes electron-like. In LSCO and Nd-LSCO,
pFS ' 0.18 and 0.23, respectively.
QO measurements in Tl2201 at p ' 0.3 yield an effective mass m? = 5.2 ± 0.4 m0
(30), where m0 is the free electron mass. Band structure calculations for Tl2201 obtain a
bare band mass of 1.2 m0 (31), implying that electron-electron interactions are significant
when superconductivity first emerges (Fig. 1a). For a quasi-2D FS, m? is directly related
6 Proust & Taillefer
to the electronic specific heat coefficient γ, via γ = (πNAk2Ba
2/3h2) m?, where kB is the
Boltzmann constant, NA is Avogadro’s number, and a is the in-plane lattice constant. In
Tl2201 at p ' 0.3, m? deduced from QOs yields γ = 7.6±0.6 mJ/K2 mol, in good agreement
with γ = 6.6± 1 mJ/K2 mol measured directly in polycrystalline Tl2201 (30). In LSCO at
p = 0.33, γ = 6.9 ± 1 mJ/K2 mol (25). The fact that two very different cuprates, Tl2201
and LSCO, have the same value of γ at p ' 0.3 strongly suggests that this value is generic
to hole-doped cuprates in the FL phase at high doping.
4. CHARGE-DENSITY-WAVE PHASE
Since the discovery of ’stripe order’ – intertwined charge and spin modulations – in Nd-
LSCO by neutron diffraction (35), followed by the discovery of charge modulations by
STM in Bi2212 (36), Ca2CuO2Cl2 (37) and Bi2201 (38), it has been found that charge
order is a generic property of underdoped cuprates. The first clue for some density wave
order in YBCO came from quantum oscillations at p ' 0.1 (39) (Fig. 4a), in combination
with a negative Hall coefficient at low temperature (40) (Fig. 5a). First detected in the
resistance, QOs in YBCO have since been observed in the magnetization (41), Nernst and
Seebeck coefficients (42, 43), specific heat (44), and thermal conductivity (17). The main
frequency F ≈ 530 T (Fig. 4a) corresponds to an extremal area AF only 2 % of the first
Brillouin zone, while the large orbit in overdoped Tl2201 represents 65 % (Fig. 4b). Fig. 5b
shows the normal-state Hall coefficient in YBCO. At low T , RH is deeply negative in the
doping interval 0.08 < p < 0.16 (34, 40), precisely where QOs have been observed (45, 46).
The combination of QOs and a negative RH is a strong indication for the presence of a
small closed electron pocket in the Fermi surface, also consistent with the magnitude and
negative sign of the Seebeck coefficient (42, 47). The most natural interpretation for the
presence of a small electron pocket is a FS reconstruction induced by some density wave
that breaks translational symmetry. High-field NMR experiments in YBCO later showed
that this broken symmetry comes from a long-range CDW order (48), in the absence of
SDW modulations – thereby distinct from the previously known ’stripe order’.
Bi2212:Bi2Sr2CaCu2O8+δ
Bi2201:Bi2Sr2CuO6−δ
Two distinct charge orders are detected in YBCO by X-ray diffraction. First, a 2D short-
range (but static) bidirectional CDW appears well above Tc in the doping range 0.08 < p <
0.16 (49, 50). Charge modulations are incommensurate with an in-plane correlation length
of at most 20 lattice constants. The second CDW, originally detected using high field
NMR, appears below Tc and above a threshold field that is doping dependent, as shown
by high-field sound velocity measurements (51). Recent X-ray measurements in high field
(52, 53) have shown that it is a 3D ordered state with in-plane CDW modulations along
the b direction only (but with the same period as the 2D CDW). Compared to the 2D
short range CDW, the in-plane and c-axis correlation lengths are greatly enhanced and the
former extends to ' 60 lattice constants. Both CDWs coexist at low temperature in the
exact same doping range (51).
Although with a much shorter correlation length than in YBCO, bidirectional CDW
order has also been detected by X-ray diffraction in several other cuprates, namely Hg1201
(54), LSCO (55, 56), Bi2212 (57) and Bi2201 (58) – demonstrating that CDW order is a
universal tendency of hole-doped cuprates. And it has an unusual d-wave form factor (59).
Note that low-frequency quantum oscillations (F ≈ 840 T) (33) (Fig. 4a) and negative
Hall and Seebeck coefficients (60) are also observed in Hg1201 despite the much shorter
correlation length and the lack (so far) of a field-induced 3D CDW.
www.annualreviews.org • The remarkable underlying ground states of cuprate superconductors 7
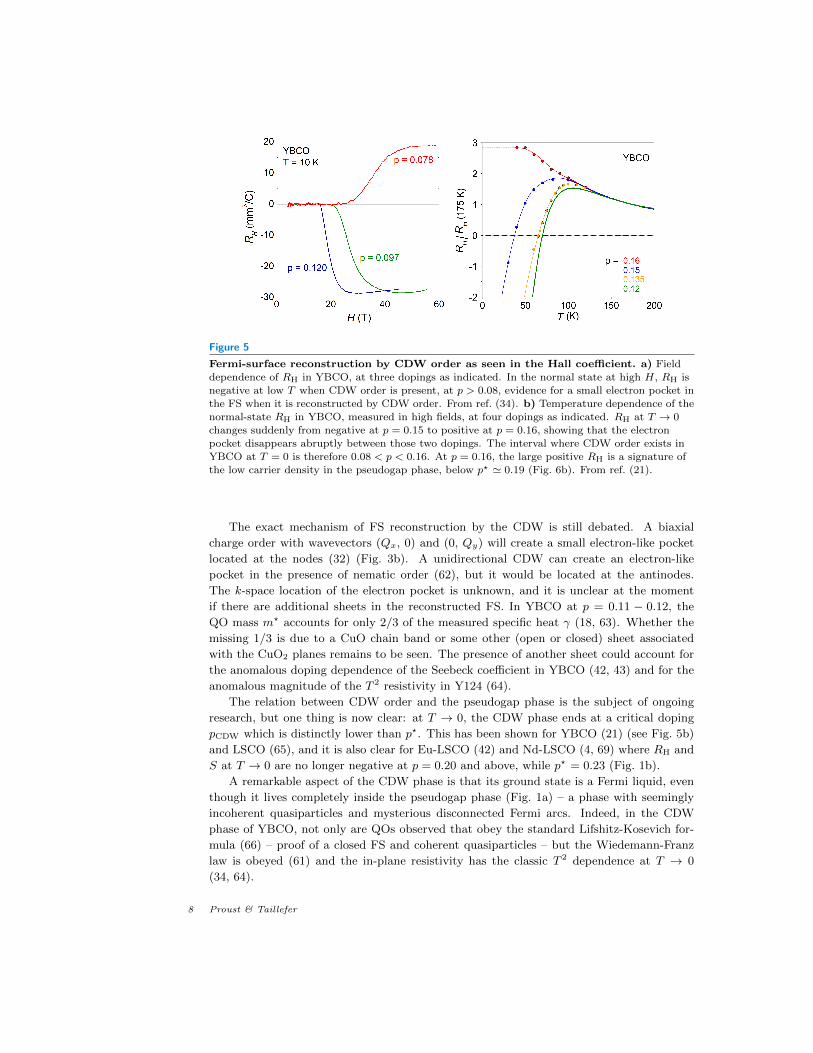
Figure 5
Fermi-surface reconstruction by CDW order as seen in the Hall coefficient. a) Field
dependence of RH in YBCO, at three dopings as indicated. In the normal state at high H, RH is
negative at low T when CDW order is present, at p > 0.08, evidence for a small electron pocket inthe FS when it is reconstructed by CDW order. From ref. (34). b) Temperature dependence of the
normal-state RH in YBCO, measured in high fields, at four dopings as indicated. RH at T → 0changes suddenly from negative at p = 0.15 to positive at p = 0.16, showing that the electron
pocket disappears abruptly between those two dopings. The interval where CDW order exists in
YBCO at T = 0 is therefore 0.08 < p < 0.16. At p = 0.16, the large positive RH is a signature ofthe low carrier density in the pseudogap phase, below p? ' 0.19 (Fig. 6b). From ref. (21).
The exact mechanism of FS reconstruction by the CDW is still debated. A biaxial
charge order with wavevectors (Qx, 0) and (0, Qy) will create a small electron-like pocket
located at the nodes (32) (Fig. 3b). A unidirectional CDW can create an electron-like
pocket in the presence of nematic order (62), but it would be located at the antinodes.
The k-space location of the electron pocket is unknown, and it is unclear at the moment
if there are additional sheets in the reconstructed FS. In YBCO at p = 0.11 − 0.12, the
QO mass m? accounts for only 2/3 of the measured specific heat γ (18, 63). Whether the
missing 1/3 is due to a CuO chain band or some other (open or closed) sheet associated
with the CuO2 planes remains to be seen. The presence of another sheet could account for
the anomalous doping dependence of the Seebeck coefficient in YBCO (42, 43) and for the
anomalous magnitude of the T 2 resistivity in Y124 (64).
The relation between CDW order and the pseudogap phase is the subject of ongoing
research, but one thing is now clear: at T → 0, the CDW phase ends at a critical doping
pCDW which is distinctly lower than p?. This has been shown for YBCO (21) (see Fig. 5b)
and LSCO (65), and it is also clear for Eu-LSCO (42) and Nd-LSCO (4, 69) where RH and
S at T → 0 are no longer negative at p = 0.20 and above, while p? = 0.23 (Fig. 1b).
A remarkable aspect of the CDW phase is that its ground state is a Fermi liquid, even
though it lives completely inside the pseudogap phase (Fig. 1a) – a phase with seemingly
incoherent quasiparticles and mysterious disconnected Fermi arcs. Indeed, in the CDW
phase of YBCO, not only are QOs observed that obey the standard Lifshitz-Kosevich for-
mula (66) – proof of a closed FS and coherent quasiparticles – but the Wiedemann-Franz
law is obeyed (61) and the in-plane resistivity has the classic T 2 dependence at T → 0
(34, 64).
8 Proust & Taillefer
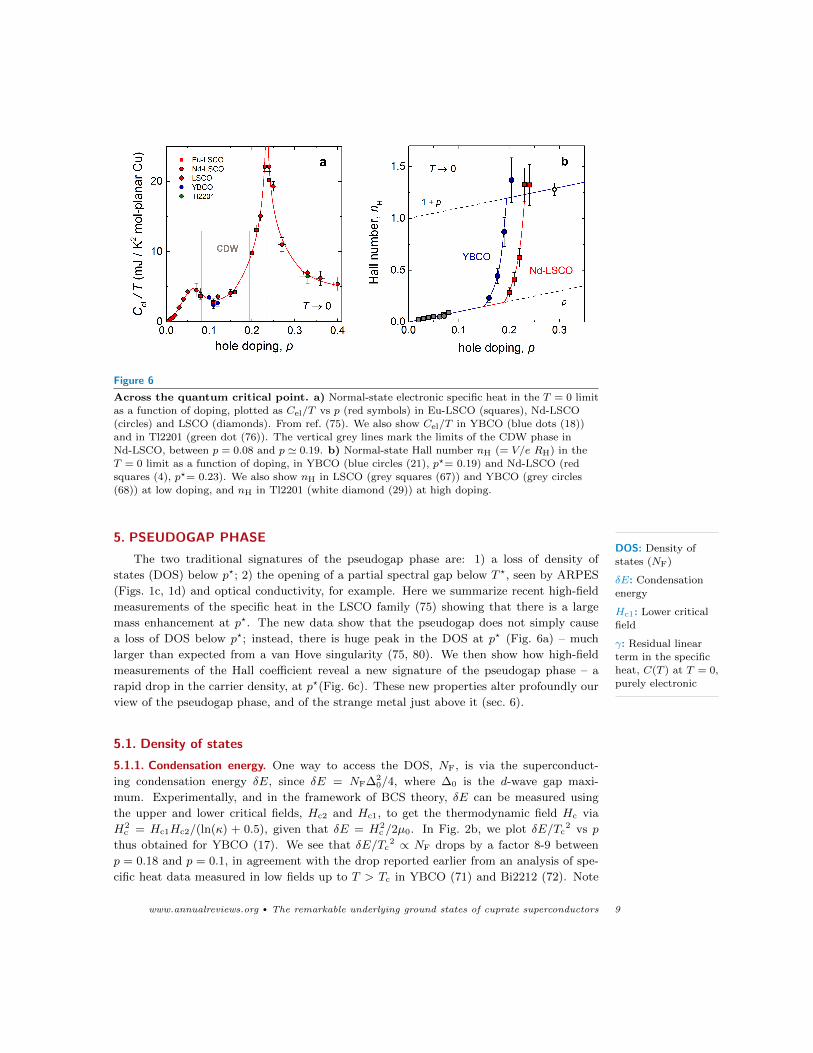
Figure 6
Across the quantum critical point. a) Normal-state electronic specific heat in the T = 0 limitas a function of doping, plotted as Cel/T vs p (red symbols) in Eu-LSCO (squares), Nd-LSCO
(circles) and LSCO (diamonds). From ref. (75). We also show Cel/T in YBCO (blue dots (18))
and in Tl2201 (green dot (76)). The vertical grey lines mark the limits of the CDW phase inNd-LSCO, between p = 0.08 and p ' 0.19. b) Normal-state Hall number nH (= V/e RH) in the
T = 0 limit as a function of doping, in YBCO (blue circles (21), p?= 0.19) and Nd-LSCO (red
squares (4), p?= 0.23). We also show nH in LSCO (grey squares (67)) and YBCO (grey circles(68)) at low doping, and nH in Tl2201 (white diamond (29)) at high doping.
5. PSEUDOGAP PHASEDOS: Density of
states (NF)
δE: Condensation
energy
Hc1: Lower criticalfield
γ: Residual linear
term in the specificheat, C(T ) at T = 0,purely electronic
The two traditional signatures of the pseudogap phase are: 1) a loss of density of
states (DOS) below p?; 2) the opening of a partial spectral gap below T ?, seen by ARPES
(Figs. 1c, 1d) and optical conductivity, for example. Here we summarize recent high-field
measurements of the specific heat in the LSCO family (75) showing that there is a large
mass enhancement at p?. The new data show that the pseudogap does not simply cause
a loss of DOS below p?; instead, there is huge peak in the DOS at p? (Fig. 6a) – much
larger than expected from a van Hove singularity (75, 80). We then show how high-field
measurements of the Hall coefficient reveal a new signature of the pseudogap phase – a
rapid drop in the carrier density, at p?(Fig. 6c). These new properties alter profoundly our
view of the pseudogap phase, and of the strange metal just above it (sec. 6).
5.1. Density of states
5.1.1. Condensation energy. One way to access the DOS, NF, is via the superconduct-
ing condensation energy δE, since δE = NF∆20/4, where ∆0 is the d-wave gap maxi-
mum. Experimentally, and in the framework of BCS theory, δE can be measured using
the upper and lower critical fields, Hc2 and Hc1, to get the thermodynamic field Hc via
H2c = Hc1Hc2/(ln(κ) + 0.5), given that δE = H2
c /2µ0. In Fig. 2b, we plot δE/Tc2 vs p
thus obtained for YBCO (17). We see that δE/Tc2 ∝ NF drops by a factor 8-9 between
p = 0.18 and p = 0.1, in agreement with the drop reported earlier from an analysis of spe-
cific heat data measured in low fields up to T > Tc in YBCO (71) and Bi2212 (72). Note
www.annualreviews.org • The remarkable underlying ground states of cuprate superconductors 9
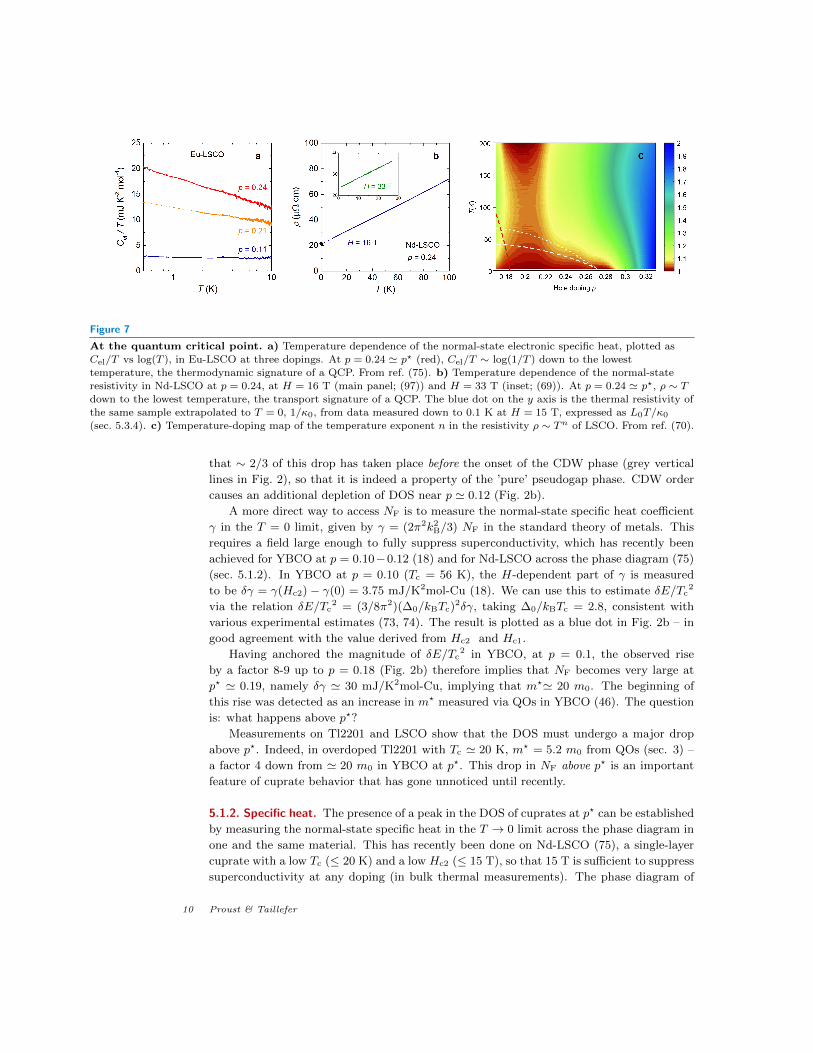
Figure 7
At the quantum critical point. a) Temperature dependence of the normal-state electronic specific heat, plotted as
Cel/T vs log(T ), in Eu-LSCO at three dopings. At p = 0.24 ' p? (red), Cel/T ∼ log(1/T ) down to the lowest
temperature, the thermodynamic signature of a QCP. From ref. (75). b) Temperature dependence of the normal-stateresistivity in Nd-LSCO at p = 0.24, at H = 16 T (main panel; (97)) and H = 33 T (inset; (69)). At p = 0.24 ' p?, ρ ∼ Tdown to the lowest temperature, the transport signature of a QCP. The blue dot on the y axis is the thermal resistivity of
the same sample extrapolated to T = 0, 1/κ0, from data measured down to 0.1 K at H = 15 T, expressed as L0T/κ0(sec. 5.3.4). c) Temperature-doping map of the temperature exponent n in the resistivity ρ ∼ Tn of LSCO. From ref. (70).
that ∼ 2/3 of this drop has taken place before the onset of the CDW phase (grey vertical
lines in Fig. 2), so that it is indeed a property of the ’pure’ pseudogap phase. CDW order
causes an additional depletion of DOS near p ' 0.12 (Fig. 2b).
A more direct way to access NF is to measure the normal-state specific heat coefficient
γ in the T = 0 limit, given by γ = (2π2k2B/3) NF in the standard theory of metals. This
requires a field large enough to fully suppress superconductivity, which has recently been
achieved for YBCO at p = 0.10−0.12 (18) and for Nd-LSCO across the phase diagram (75)
(sec. 5.1.2). In YBCO at p = 0.10 (Tc = 56 K), the H-dependent part of γ is measured
to be δγ = γ(Hc2)− γ(0) = 3.75 mJ/K2mol-Cu (18). We can use this to estimate δE/Tc2
via the relation δE/Tc2 = (3/8π2)(∆0/kBTc)
2δγ, taking ∆0/kBTc = 2.8, consistent with
various experimental estimates (73, 74). The result is plotted as a blue dot in Fig. 2b – in
good agreement with the value derived from Hc2 and Hc1.
Having anchored the magnitude of δE/Tc2 in YBCO, at p = 0.1, the observed rise
by a factor 8-9 up to p = 0.18 (Fig. 2b) therefore implies that NF becomes very large at
p? ' 0.19, namely δγ ' 30 mJ/K2mol-Cu, implying that m?' 20 m0. The beginning of
this rise was detected as an increase in m? measured via QOs in YBCO (46). The question
is: what happens above p??
Measurements on Tl2201 and LSCO show that the DOS must undergo a major drop
above p?. Indeed, in overdoped Tl2201 with Tc ' 20 K, m? = 5.2 m0 from QOs (sec. 3) –
a factor 4 down from ' 20 m0 in YBCO at p?. This drop in NF above p? is an important
feature of cuprate behavior that has gone unnoticed until recently.
5.1.2. Specific heat. The presence of a peak in the DOS of cuprates at p? can be established
by measuring the normal-state specific heat in the T → 0 limit across the phase diagram in
one and the same material. This has recently been done on Nd-LSCO (75), a single-layer
cuprate with a low Tc (≤ 20 K) and a low Hc2 (≤ 15 T), so that 15 T is sufficient to suppress
superconductivity at any doping (in bulk thermal measurements). The phase diagram of
10 Proust & Taillefer
Nd-LSCO is shown in Fig. 1b, with the boundary T ?(p) of its pseudogap phase delineated
by both transport (4, 69) and ARPES (5) measurements. The critical doping at which the
pseudogap phase ends is p? = 0.23± 0.01.
In Fig. 6a, the normal-state electronic specific heat Cel of Nd-LSCO is plotted as
Cel/T vs p, at T = 0.5 K (red circles, (75)), along with corresponding data taken on
Eu-LSCO (squares, (75)) and LSCO (diamonds, (78, 25)). The agreement amongst the
three cuprates is excellent. The red curve gives us the detailed evolution of Cel/T in the
T = 0 limit across the entire phase diagram, from the Mott insulator at p = 0 all the way
to the Fermi liquid up to p = 0.4. The dominant feature is a huge peak at p?.
This establishes, by raw data from a measurement that directly gives the DOS, taken on
three materials (LSCO, Eu-LSCO and Nd-LSCO), the presence of a large peak in the DOS
of cuprates that we inferred from our piecemeal construction based on two other materials
(YBCO and Tl2201). The comparison can be anchored quantitatively by adding the specific
heat data for YBCO (blue dots) and Tl2201 (green dot) in Fig. 6a. We see that the values
of γ = Cel/Tper CuO2 plane are similar in YBCO, Nd-LSCO and Eu-LSCO at p ' 0.12
and again in LSCO, Nd-LSCO and Tl2201 at p ' 0.3, showing that the DOS is essentially
the same in all cuprates to the left and right of p?. Importantly, γ has the same magnitude
at p ' 0.07 and at p = 0.4, so that the pseudogap phase is not characterized by a loss of
DOS relative to the overdoped FL, but by a peak in the DOS at p?.
Early specific heat measurements on polycrystalline samples of LSCO in which Zn im-
purities were added to suppress superconductivity had already revealed a peak in γ vs p,
centered at p ' 0.2 (79), a broadened version of the peak seen in pure samples of Nd-LSCO
(Fig. 6a). This peak was attributed to the van Hove singularity in the band structure of
LSCO, at pFS ' 0.2, but calculations now contradict this interpretation (for both LSCO
(80) and Nd-LSCO (75)), as the heavy disorder and strong 3D dispersion completely flatten
the singularity in the DOS.
5.2. Quantum critical point
The sharp peak in Cel/T vs p (Fig. 6a) is a classic thermodynamic signature of a
QCP. Indeed, a very similar peak has been observed in the iron-based superconductor
BaFe2(As1−xPx)2, at the QCP where its AF order vanishes vs x (81). A second thermo-
dynamic signature of a QCP is a logarithmic divergence of Cel/T as T → 0, as observed in
the heavy-fermion metal CeCu6−xAux at the QCP where its AF order vanishes vs x (82).
As seen in Fig. 7a, this is indeed the behavior measured in Eu-LSCO at p?, and also in
Nd-LSCO (75). The third classic signature of a QCP is a T -linear resistivity as T → 0,
found in both BaFe2(As1−xPx)2 and CeCu6−xAux at their QCP, and indeed in Nd-LSCO
at p? (Fig. 7b). The striking T -linear resistivity of overdoped cuprates is discussed in sec. 6.
All this is compelling empirical evidence that the pseudogap critical point is a QCP. But
what is missing so far is the detection of a diverging length scale associated with quantum
criticality in hole-doped cuprates. In sec. 5.4, we examine the obvious question: What order
ends at that quantum phase transition, if any?
5.3. Carrier density
Having established how the DOS in the ground state of cuprates evolves from Fermi liquid
at p > 0.3 to Mott insulator at p = 0, we now look at a separate yet equally important
property of a metal, its carrier density, n.
www.annualreviews.org • The remarkable underlying ground states of cuprate superconductors 11
5.3.1. Hall coefficient. The carrier density can be accessed by measuring the Hall coefficient
RH. In the following, we assume that the Hall number nH gives the carrier density n in
the T = 0 limit. This is the case in Tl2201 at p ' 0.3, RH in the T = 0 limit is such that
nH ' 1 + p, consistent with n = 1 + p measured by QOs, ADMR and ARPES (Sec. 3).
At the other end of the phase diagram, Hall measurements in YBCO (68) and LSCO (67)
give nH ' p at low T up to p ' 0.08 (Fig. 6c). A carrier density n = p is what is required
by the Luttinger rule in the presence of commensurate AF order with a wavevector (π, π),
since the AF Brillouin zone contains one fewer electron (Fig. 3a). Since commensurate AF
order prevails in YBCO up to p = 0.05 (Fig. 1a) and in LSCO up to p ' 0.02, followed by
incommensurate SDW order up to p ' 0.08 and p ' 0.12, respectively, the fact that nH ' pup to p ' 0.08 is perhaps understandable. The question is : how exactly does the ground
state evolve, with decreasing p, from a metal with n = 1 + p to another metal with n = p?
This question was answered by two recent high-field measurements of RH, summarized
in Fig. 6b. In both YBCO (21) and Nd-LSCO (4) with decreasing p, a rapid drop in
nH starts in tandem with the opening of the pseudogap (p? ' 0.19 in YBCO and p? ' 0.23
in Nd-LSCO). The drop in nH is equally rapid and deep in the two very different materials,
showing that it must reflect a generic underlying property of hole-doped cuprates. (Note
that earlier high-field studies of RH in Bi2201 (83) and LSCO (84) do not show as clean a
drop in nH. We attribute this to the contaminating effect of CDW order, which produces a
drop in RH, and therefore an apparent increase in nH, at low T . Also, in Bi2201, the Hall
study does not extend up to p?.)
The simplest interpretation of the Hall data in YBCO and Nd-LSCO is a transition at
p? that causes the carrier density to go from n = 1 + p above p? to n = p below, consistent
with AF order with Q = (π, π), for example (87). However, it is in principle possible that
RH could increase because of a change in FS curvature rather than a change in FS volume,
as in the case of a nematic transition (88). To confirm that carriers are indeed lost below
p?, we turn to three other transport properties.
5.3.2. Thermopower. In the T = 0 limit, the Seebeck coefficient S of a metal is equal to the
entropy per carrier, given by the simple relation S/T ∼ γ/n, validated in many different
families of materials (89). The Seebeck coefficient of Nd-LSCO was measured at low T
above and below p? (77). In going from p = 0.24 > p? to p = 0.20 < p?, S/T at low T
(≤ 10 K) increases by a factor 4-5 (77). Given that γ drops, this necessarily implies that n
must decrease significantly below p?. We conclude that there is definitely a drop in carrier
density upon entering the pseudogap phase.
5.3.3. Resistivity. In Fig. 8a, we show what happens to the resistivity ρ(T ) of Nd-LSCO
upon entering the pseudogap phase. At p = 0.24, just above p?= 0.23, ρ(T ) is perfectly
linear, from 80 K or so down to T → 0 (Fig. 7b). At p = 0.22, just below p?, ρ(T ) exhibits
a large upturn at low T but saturates to a finite value in the T = 0 limit. The upward
deviation from the T -linear behaviour at high T starts at T ?' 50 K (Fig. 1b). The increase
in the normal-state resistivity at T = 0 corresponds to a 5-fold drop in conductivity.
It has recently been demonstrated that a pressure of 2 GPa lowers p? in Nd-LSCO below
p = 0.22 (90). As a result, 2 GPa applied to a sample with p = 0.22 eliminates the upturn
completely, and ρ(T ) then becomes perfectly T -linear (Fig. 8b). We see again that ρ(0) at
T = 0 changes by a factor ' 5. This large drop in conductivity below p? is consistent with
a loss of carrier density.
12 Proust & Taillefer
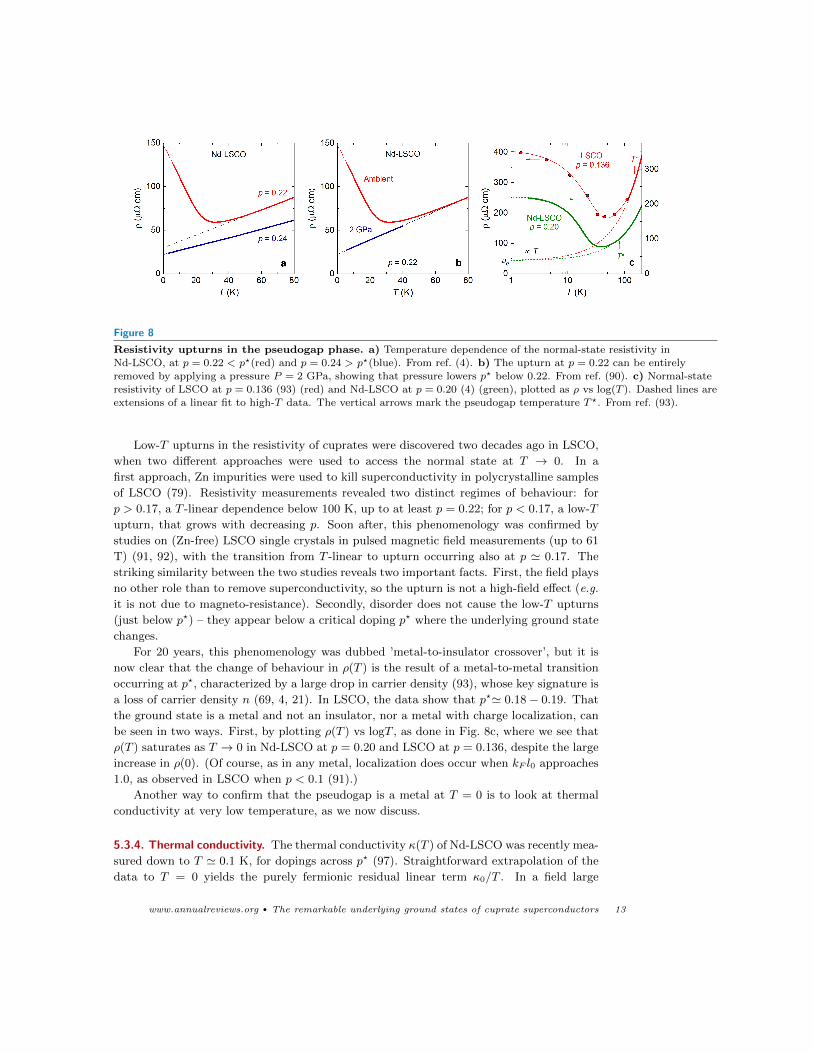
Figure 8
Resistivity upturns in the pseudogap phase. a) Temperature dependence of the normal-state resistivity inNd-LSCO, at p = 0.22 < p?(red) and p = 0.24 > p?(blue). From ref. (4). b) The upturn at p = 0.22 can be entirely
removed by applying a pressure P = 2 GPa, showing that pressure lowers p? below 0.22. From ref. (90). c) Normal-state
resistivity of LSCO at p = 0.136 (93) (red) and Nd-LSCO at p = 0.20 (4) (green), plotted as ρ vs log(T ). Dashed lines areextensions of a linear fit to high-T data. The vertical arrows mark the pseudogap temperature T ?. From ref. (93).
Low-T upturns in the resistivity of cuprates were discovered two decades ago in LSCO,
when two different approaches were used to access the normal state at T → 0. In a
first approach, Zn impurities were used to kill superconductivity in polycrystalline samples
of LSCO (79). Resistivity measurements revealed two distinct regimes of behaviour: for
p > 0.17, a T -linear dependence below 100 K, up to at least p = 0.22; for p < 0.17, a low-T
upturn, that grows with decreasing p. Soon after, this phenomenology was confirmed by
studies on (Zn-free) LSCO single crystals in pulsed magnetic field measurements (up to 61
T) (91, 92), with the transition from T -linear to upturn occurring also at p ' 0.17. The
striking similarity between the two studies reveals two important facts. First, the field plays
no other role than to remove superconductivity, so the upturn is not a high-field effect (e.g.
it is not due to magneto-resistance). Secondly, disorder does not cause the low-T upturns
(just below p?) – they appear below a critical doping p? where the underlying ground state
changes.
For 20 years, this phenomenology was dubbed ’metal-to-insulator crossover’, but it is
now clear that the change of behaviour in ρ(T ) is the result of a metal-to-metal transition
occurring at p?, characterized by a large drop in carrier density (93), whose key signature is
a loss of carrier density n (69, 4, 21). In LSCO, the data show that p?' 0.18− 0.19. That
the ground state is a metal and not an insulator, nor a metal with charge localization, can
be seen in two ways. First, by plotting ρ(T ) vs logT , as done in Fig. 8c, where we see that
ρ(T ) saturates as T → 0 in Nd-LSCO at p = 0.20 and LSCO at p = 0.136, despite the large
increase in ρ(0). (Of course, as in any metal, localization does occur when kF l0 approaches
1.0, as observed in LSCO when p < 0.1 (91).)
Another way to confirm that the pseudogap is a metal at T = 0 is to look at thermal
conductivity at very low temperature, as we now discuss.
5.3.4. Thermal conductivity. The thermal conductivity κ(T ) of Nd-LSCO was recently mea-
sured down to T ' 0.1 K, for dopings across p? (97). Straightforward extrapolation of the
data to T = 0 yields the purely fermionic residual linear term κ0/T . In a field large
www.annualreviews.org • The remarkable underlying ground states of cuprate superconductors 13
enough to fully suppress superconductivity, this then gives the thermal conductivity of the
underlying ground state of this cuprate, above and below p?. The data is found to accu-
rately obey the Wiedemann-Franz (WF) law. Indeed, at p = 0.24, κ0/T = L0/ρ(0), where
L0 ≡ (π2/3)(kB/e)2, within an error bar of only a few percent (97). Here, ρ(0) is obtained
by a linear extrapolation of ρ(T ) to T = 0, as shown in Fig. 7b.
The WF law is also obeyed when p < p? (97), showing that the pseudogap ground
state, truly at T = 0, is indeed a metal. The fermionic quasiparticles of that state are
charged and they carry heat just as normal electrons do. The 5-fold drop in κ0/T between
p = 0.24 and p = 0.22 is therefore perfectly consistent with the 5-fold increase in ρ(0)
(Fig. 8a), confirming it is a property of the ground state. Moreover, the same measurements
performed in zero field, and so inside the superconducting state, find a similarly large drop
in thermal conductivity across p?, showing that the transport signatures interpreted as a
drop in n are not induced by the applied magnetic field and the pseudogap phase is not
affected by such fields (97).
5.4. Scenarios for the pseudogap phase
To summarize, we can list the following properties of the pseudogap phase at T = 0, in the
absence of either superconductivity or CDW order:
1. Anti-nodal spectral gap opens below p? (Fig. 1c)
2. Density of states decreases below p? (Figs. 2b, 6a)
3. Carrier density drops below p?, from n ' 1 + p to n ' p (Fig. 6b)
4. Wiedemann-Franz law is obeyed (Fig. 7b)
5. Transition vs p (at p?, T = 0), crossover vs T (at T ?, p < p?)
6. Signatures of quantum criticality at p?, with Cel ∼ T logT and ρ ∼ T (Figs. 7a, 7b)
5.4.1. AF scenario. At the empirical level, these signatures are reminiscent of a scenario of
AF order in 2D for the pseudogap phase of hole-doped cuprates. By analogy with organic
conductors, heavy-fermion metals and iron-based superconductors, but also with electron-
doped cuprates. Indeed, the phenomenology of electron-doped cuprates (see Sidebar) is
essentially the same as what we have listed here for hole-doped cuprates, and in the former
there is little doubt that a scenario of AF order and QCP is appropriate. The reason why
this is immediately reasonable in that case is this: the AF correlation length measured by
neutrons (7) is found to increase rapidly just below the QCP detected in transport (8) and
ARPES (11). Conversely, the reason why an AF QCP scenario is not immediately reason-
able for hole-doped cuprates is because no long AF correlation length has been universally
detected in this case.
A fundamental question remains open today: are AF spin fluctuations / correlations
generically present in the pseudogap phase of cuprates at T = 0 when superconductivity
and CDW order are removed?
Two other empirical features suggest that AF spin fluctuations / correlations are in-
volved in the formation of the pseudogap phase. The first is that d-wave pairing in cuprates
is most likely caused by AF spin fluctuations (102), in both electron-doped and hole-doped,
and so it is likely that those are the fluctuations associated with the QCP located inside
the Tc dome – as is indeed the case for most other unconventional superconductors with a
Tc dome. The second feature is the recently proposed constraint that p? ≤ pFS (90, 103).
In Nd-LSCO, the inequality p? ≤ pFS was inferred from the fact that pressure lowers pFS
14 Proust & Taillefer
and p? by the same amount, as detected by the lowering of RH and the disappearance of
the upturn in ρ(T ) (Fig. 8b), respectively (90). This would also explain why p? is signif-
icantly lower in LSCO vs Nd-LSCO, given that pFS also is, in spite of their having the
same T ? boundary at low doping (104). The simplest intuitive way to understand why the
pseudogap does not open when the Fermi surface is electron-like is to associate the pseudo-
gap with hot spots on the FS where it intersects the AF zone boundary. When the Fermi
surface becomes electron-like, those hot spots disappear, as no intersection is possible. The
central role of the AF zone boundary as the k-space organizing principle for the pseudogap
and the associated transformation of the Fermi surface, from large circle above p? to small
arcs below, is vividly seen in STM data on Bi2212 (105). Indeed, the Fermi arcs seen by
STM end precisely on the AF boundary.
5.4.2. Theoretical models. The Hubbard model, with a repulsion U between electrons on
the same Cu site and an energy t for hopping between sites, captures many of the exper-
imental properties of cuprates. On the electron-doped side, the Hubbard model with a
moderate repulsion, U ' 6t near optimal doping, accounts for the phase diagram – with
AF order at low x and d-wave superconductivity at higher x – and for the Fermi-surface
reconstruction by AF order, with hot spots on the AF zone boundary (16). In two dimen-
sions, with decreasing temperature, it accounts for the opening of a ’pseudogap’ below the
temperature where the AF correlation length exceeds the thermal de Broglie wavelength of
the electrons, i.e. when each electron sees its local environment as having AF order (106).
It seems that here there is no fundamental mystery – except perhaps the mechanism for
T -linear resistivity at x? (sec. 6)
Applying the Hubbard model to hole-doped cuprates by increasing U/t leads to a qual-
itative change. Indeed, when U/t exceeds a critical value of 6 or so, then a pseudogap
phase forms at T = 0 (107). At T = 0, it onsets as a transition with decreasing p, perhaps
first-order (108), but as a crossover with decreasing T . Recent calculations find that the
inequality p? ≤ pFS holds within the Hubbard model (109, 110), in agreement with experi-
ment (103, 90). The pseudogap leads to a partial loss of DOS, but it is not clear yet what
its signature is in the Hall coefficient or the Seebeck coefficient. This pseudogap comes
from short-range AF correlations (spin singlets), not the long-range correlations central to
the electron-doped phenomenology. It is not yet clear what is the Fermi surface inside this
pseudogap phase, whether arcs or closed nodal hole pockets containing p carriers (Fig. 3a).
Given that broken translational symmetry has not been detected so far, pockets containing
p holes would violate the Luttinger rule, which can be reconciled by having a state with
topological order (111).
In summary, both the empirical route and the theoretical route so far lead us to a fork
in the road: either hole-doped cuprates are in essence like electron-doped cuprates, but
with much shorter AF correlations, or they have topological order (or some other order?).
In either case, this is a remarkable ground state with no prior analog.
5.4.3. Broken symmetries. Apart from short-range AF or SDW order that could break
translational symmetry over a limited length scale, we have not discussed broken symmetries
so far in connection with the pseudogap phase of hole-doped cuprates. (CDW order breaks
translational symmetry, but it is a separate phase.) There is substantial (but not yet
definitive) experimental evidence that two symmetries are broken below T ?: time-reversal
symmetry – detected as Q = 0 magnetism via neutrons (112) – and rotational symmetry
www.annualreviews.org • The remarkable underlying ground states of cuprate superconductors 15
– detected as an extra in-plane anisotropy in the magnetic susceptibility (113). These
broken symmetries have been associated with current loop order (114) and nematic order
(115), respectively. The trouble with such orders is that neither can cause a gap to open
or the carrier density to drop. Therefore, they cannot be the driving mechanism for the
pseudogap phase, but are perhaps accompanying instabilities, a bit like CDW order. If so,
the question are: What role does current-loop or nematic order play in the pairing? In the
T -linear resistivity? In the mass enhancement above p??
6. STRANGE METAL
We call ’strange metal’ the region of the phase diagram immediately above p?, extending
up to the end of the Tc dome (Fig. 1a). In other words, the metal above p? is a strange
metal up until it becomes a normal metal, or Fermi liquid (sec. 3). At high temperature,
this strange metal is characterized by a non-saturating resistivity that exceeds the Ioffe-
Mott-Regel limit. At low temperature, it is characterized by an anomalous T dependence
of the resistivity, deviating from the standard T 2 behavior. This is illustrated in Fig. 7c,
where the exponent of the T dependence in ρ(T ) for LSCO is mapped as a function of p
and T (70). We see that the exponent is 2.0 at p = 0.33, and it evolves gradually towards
1.0 as p→ p? ' 0.18−0.19. The evolution can also be described as a sum of two terms, i.e.
ρ ∼ T +T 2, very similar to what is observed in the organic superconductor (TMTSF)2PF6
above its AF QCP (116). Tl2201 exhibits a similar evolution (24, 29, 23, 117), showing that
this is likely to be a generic behavior in hole-doped cuprates. ADMR data in Tl2201 have
been modelled with two scattering rates: a T 2 rate which is isotropic around the FS, and
an anisotropic T -linear rate that is maximal in the antinodal directions (118). The latter
term increases linearly with Tc (118).
Focusing at low temperature, two aspects are striking. First, the fact that supercon-
ductivity emerges in tandem with the deviation from T 2 behavior, both starting below the
same doping, in close analogy with (TMTSF)2PF6. This links d-wave pairing with T -linear
scattering (2). Secondly, below a certain doping, p ' 0.27 in LSCO, ρ(T ) becomes perfectly
T -linear at low T . In Nd-LSCO, this perfect linearity is observed at p = 0.24 (Fig. 7b). It
was recently observed in Bi2212 (119), and it is also seen in the electron-doped cuprates
PCCO (12) and LCCO (14, 13), albeit limited to lower temperatures. The T -linear resis-
tivity as T → 0 is thus a generic property of cuprates and it is robust against changes in
the shape, topology and multiplicity of the FS.
While no compelling explanation for the T -linear resistivity as T → 0 has yet been found,
it was observed empirically that the strength of the T -linear resistivity for several metals
is approximately given by a scattering rate that has a universal value, namely h/τ = kBT
(120, 121). This observation suggests that a T -linear regime will be observed whenever 1/τ
reaches its Planckian limit, kBT/h, irrespective of the underlying mechanism for inelastic
scattering. Assuming that the connection between ρ and τ is given by the Drude formula,
the linear coefficient of the resistivity ρ = ρ0 + A1T is given (per CuO2 plane) by: A∗1 =
A1/d = (h/2e2)(1/TF ), where TF = (πh2/kB)(nd/m∗) is the Fermi temperature. In the
overdoped region (p >p?), the full FS is restored and the carrier density does not vary
much with doping. This implies that A∗1 ∼ m?. Given the effective mass deduced from
quantum oscillations or the electronic specific heat, the estimation of A∗1 for both hole-
doped and electron-doped cuprates reveals that the scattering rate responsible for the T -
linear resistivity has the universal value given by the Planckian limit, within error bars
16 Proust & Taillefer
(119). This explains why the slope of the T -linear resistivity is ∼ 5 times larger in hole-
doped cuprates (i.e. A∗1 = 8 Ω/K in Nd-LSCO at p = 0.24 and Bi2212 at p = 0.23) than
in electron-doped cuprates (i.e. A∗1 = 1.7 Ω/K in PCCO and LCCO at p = 0.17), since the
effective mass is ∼ 5 times higher in the former (119). It also explains why A1 increases
in LSCO when going from p = 0.26 to p = 0.21 (70), since m? rises with decreasing p, as
seen from specific heat data (119). Moreover, a Planckian limit on scattering provides an
explanation for the anomalously broad range in doping over which ρ ∼ A1T is observed in
LSCO (70). As doping decreases below p = 0.33, A∗1 increases steadily until p? ' 0.18− 19,
but the scattering rate 1/τ cannot exceed the Planckian limit, reached at p ' 0.26. So
between p = 0.26 and p = p?, ρ(T) is linear and 1/τ is constant. However, m? continues
to increase until p?, so that A∗1 ∼ m∗ in the range p? < p < 0.26. Understanding the inner
workings of the Planckian principle will be a fascinating theoretical challenge. All the more
important since in cuprates there is a clear link between T -linear scattering and pairing (2).
7. CONCLUSION
We have surveyed the ground state properties of hole-doped cuprates, at T → 0, once
superconductivity is removed by the application of a magnetic field. The central feature is
the critical point p? at which the pseudogap phase onsets. Two of its key signatures have
recently been unveiled. First, a drop in carrier density, signalling a transformation of the
large Fermi surface above p? into small hole-like pockets or arcs below p?. Second, a sharp
peak in the electronic specific heat at p?, interpreted as a strong mass enhancement above
p? followed by a gap opening below p?. These signatures are reminiscent of what happens
at an antiferromagnetic quantum critical point, the scenario relevant for electron-doped
cuprates. The remarkable aspect of hole-doped materials is that no long-range order is
seen just below p?, raising the possibility of a novel state without broken translational
symmetry, perhaps with topological order. What does break translational symmetry is
CDW order, but only at dopings distinctly below p?. In the CDW phase, the Fermi surface
is reconstructed and electron-like, and, remarkably, its carriers obey Fermi-liquid theory
even if ensconced inside the pseudogap phase. Above p?, charge carriers display a fascinat-
ing property: the electrical resistivity shows a perfectly linear temperature dependence as
T → 0. The recent finding that its slope is set by an inelastic scattering rate at the Planck-
ian limit opens a new perspective on the origin of this archetypal non-Fermi-liquid behavior.
SUMMARY POINTS
1. The organizing principle of electron-doped cuprates is an antiferromagnetic QCP
where long-range AF correlations disappear, at which T -linear resistivity is found,
below which the Fermi surface is reconstructed, and around which d-wave super-
conductivity forms.
2. The thermodynamic signature of the pseudogap critical point p? is a peak in the
electronic specific heat at low T , with a T logT variation as T → 0 at p?. These are
the classic signatures of a QCP – but a diverging length scale is still missing...
3. The key transport signature of the pseudogap phase is a drop in the carrier density
from n ' 1 + p at p > p? to n ' p at p < p?.
www.annualreviews.org • The remarkable underlying ground states of cuprate superconductors 17
4. The remarkable aspect of the pseudogap ground state is that the Fermi surface is
transformed and the carrier density reduced without long-range order to break the
translational symmetry. A possible explanation is a state with topological order.
5. The CDW order that forms generically in hole-doped cuprates at p ' 0.12 produces
a Fermi-liquid ground state inside the pseudogap phase, with a reconstructed Fermi
surface that contains a small electron-like pocket.
6. As doping increases beyond p = 0.12, the CDW phase weakens and disappears
distinctly before the critical doping p? at which the pseudogap phase ends, thus
creating an interval in which the ground state has a pseudogap and a low carrier
density without CDW order.
7. The T -linear resistivity observed in cuprates at low temperature as p approaches
p? from above is controlled by a universal Planckian limit on the scattering rate.
8. Superconductivity springs from the Fermi-liquid ground state at high doping, and it
emerges in tandem with the inelastic scattering process responsible for the T -linear
resistivity of the normal state. Pairing and scattering appear to be linked.
FUTURE ISSUES
1. Is the QCP in hole-doped cuprates associated with AF (or SDW) correlations (per-
haps short-ranged)? Or does it differ fundamentally from the QCP in electron-
doped cuprates?
2. Is SDW order (perhaps short-ranged) generically present in the pseudogap phase of
cuprates at T = 0 when superconductivity (and CDW order) is removed?
3. What is the Fermi surface in the pure pseudogap phase? Arcs or closed nodal hole
pockets with n = p?
4. Is there topological order in the pseudogap phase? How can it be detected?
5. Why is CDW order peaked at p ' 1/8?
6. How does the Planckian limit on inelastic scattering work?
7. Are AF spin fluctuations responsible for d-wave pairing? For T -linear scattering?
For mass enhancement above p??
ACKNOWLEDGMENTS
We are thankful for the many stimulating discussions with our colleagues at the workshop
on cuprates in Jouvence, Canada in May 2017, sponsored by the Institut Quantique of
Universite de Sherbrooke, the Canadian Institute for Advanced Research and the EPiQS
initiative of the Gordon and Betty Moore Foundation, namely: N.P. Armitage, W. Atkin-
son, C. Bourbonnais, P. Bourges, J. Chang, A.V. Chubukov, J.C. Davis, N. Doiron-Leyraud,
P. Fournier. R.L. Greene, A. Georges, N.E. Hussey, M.-H. Julien , A. Kaminski, S.A. Kivel-
son, G. Kotliar, B. Keimer, D.-H. Lee, A.J. Millis, B.J. Ramshaw, M. Randeria, T.M. Rice,
S. Sachdev, D.J. Scalapino, J. Schmalian, S.E. Sebastian, D. Senechal, G. Sordi, J.L. Tal-
lon, J. Tranquada, A.-M.S. Tremblay, D. van der Marel. We also thank our numerous
collaborators on high-field experiments around the world, with whom it was a privilege
and a pleasure to discover and explore the ground-state properties of non-superconducting
18 Proust & Taillefer
cuprates. We acknowledge the kind support and hospitality of the Institut Quantique in
Sherbrooke (C.P.) and the Labex NEXT and LNCMI in Toulouse (L.T.) while this article
was written.
LITERATURE CITED
1. Monthoux P, Pines D, Lonzarich GG. 2007. Nature 450:1177-1183
2. Taillefer L. 2010. Annu. Rev. Condens. Matter Phys. 1:51-70
3. ”Physics of Organic Superconductors and Conductors”, edited by A. G. Lebed, Vol. 110,
Springer Series in Materials Science (Springer, Heidelberg, 2008)
4. Collignon C, et al. 2017. Phys. Rev. B 95:224517
5. Matt C, et al. 2015. Phys. Rev. B 92:134524
6. Armitage NP, Fournier P, Greene RL. 2010. Rev. Mod. Phys. 82:2421-2487
7. Motoyama EM, et al. 2007. Nature 445:186–189
8. Dagan Y, et al. 2004. Phys. Rev. Lett. 92:167001
9. Helm T, et al. 2009. Phys. Rev. Lett. 103:157002
10. Armitage NP, et al. 2002. Phys. Rev. Lett. 88:257001
11. Matsui H, et al. 2007. Phys. Rev. B 75:224514
12. Fournier P, et al. 1998. Phys. Rev. Lett. 81:4720
13. Jin K, et al. 2011. Nature 476:73–75
14. Sarkar T, et al. 2017. Phys. Rev. B 96:155449
15. Tafti FF, et al. 2014. Phys. Rev. B 90:024519
16. Kyung B, et al. 2004. Phys. Rev. Lett. 93:147004
17. Grissonnanche G, et al. 2014. Nat. Commun. 5:3280
18. Kacmarcik J, et al. 2018. arXiv:1805.06853
19. Zhou R, et al. 2017. PNAS 114:13148–13153
20. Tallon JL, et al. 1997. Phys. Rev. Lett. 79:5294–5297
21. Badoux S, et al. 2016. Nature 531:201–214
22. Vignolle B, et al. 2013. C. R. Physique 14:39–52
23. Proust C, et al. 2002. Phys. Rev. Lett. 89:147003
24. Manako T, et al. 1992. Phys. Rev. B 46:11019–11024
25. Nakamae S, et al. 2003. Phys. Rev. B 68:100502
26. Hussey NE, et al. 2003. Nature 425:814–817
27. Plate M, et al. 2005. Phys. Rev. Lett. 95:077001
28. Vignolle B, et al. 2008. Nature 455:952–955
29. Mackenzie AP, et al. 1996. Phys. Rev. B 53:5848–5855
30. Bangura AF, et al. 2010. Phys. Rev. B 82:140501
31. Singh DJ, Pickett WE. 1992. Physica C 203:193–199
32. Harrison N, Sebastian SE. 2012. New J. Phys. 14:095023
33. Barisic N, et al. 2013. Nat. Phys. 9:761–764
34. LeBoeuf D, et al. 2011. Phys. Rev. B 83:054506
35. Tranquada JM, et al. 1995. Nature 375:561–563
36. Hoffman JE, et al. 2002. Science 295:466–469
37. Hanaguri T, et al. 2004. Nature 430:1001–1005
38. Wise WD, et al. 2008. Nat. Physics 4:696–699
39. Doiron-Leyraud N, et al. 2007. Nature 447:565–569
40. LeBoeuf D, et al. 2007. Nature 450:533–537
41. Jaudet C, et al. 2008. Phys. Rev. Lett. 100:187005
42. Laliberte F, et al. 2011. Nature Commun. 2:432
43. Doiron-Leyraud N, et al. 2015. Nature Commun. 6:6034
44. Riggs SC, et al. 2011. Nature Phys. 7:332–335
www.annualreviews.org • The remarkable underlying ground states of cuprate superconductors 19
45. Sebastian SE, et al. 2010. Natl Acad. Sci. USA 107:6175–6179
46. Ramshaw BJ, et al. 2015. Science 348:317–320
47. Chang J, et al. 2010. Phys. Rev. Lett. 104:057005
48. Wu T, et al. 2011. Nature 477:191-194
49. Blanco-Canosa S, et al. 2014.Phys. Rev. B 90:054513
50. Hucker M, et al. 2014. Phys. Rev. B 90:054514
51. Laliberte F, et al. 2018. Nature Quantum Materials 3:11
52. Gerber S, et al. 2015. Science 350:949
53. Chang J, et al. 2016. Nat. Commun. 7:11494
54. Tabis W, et al. 2014. Nat. Commun. 5:5875
55. Croft T, et al. 2014. Phys. Rev. B 89:224513
56. Thampy V, et al. 2014. Phys. Rev. B 90:100510
57. da Silva Neto E, et al. 2014. Science 343:393–396
58. Comin R, et al. 2014. Science 343:390–392
59. Comin R, et al. 2015. Nat. Mater. 14:796–800
60. Doiron-Leyraud N, et al. 2013. Phys. Rev. X 3:021019
61. Grissonnanche G, et al. 2016. Phys. Rev. B 93:064513
62. Yao H, et al. 2011. Phys. Rev. B 84:012507
63. Marcenat C, et al. 2016. Nature Commun. 6:7927
64. Proust C, et al. 2016. Natl Acad. Sci. USA 113:13654–13659
65. Badoux S, et al. 2016. Phys. Rev. X 6:021004
66. Sebastian SE, et al. 2010. Phys. Rev. B 81:140505
67. Ando Y, et al. 2004. Phys. Rev. Lett. 92:197001
68. Segawa K, et al. 2004. Phys. Rev. B 69:104521
69. Daou R, et al. 2009. Nat. Phys. 5:31–34
70. Cooper RA, et al. 2009. Science 323:603–607
71. Luo JL, et al. 2000. Physica C 341–348: 1837–1840
72. Loram JW, et al. 2000. Physica C 341-348:831–834
73. Hufner S, et al. 2008. Rep. Prog. Phys. 71:062501
74. Peets DC, et al. 2007. New Journal of Physics 9:28
75. Michon B, et al. 2018. arXiv:1804.08502
76. Wade JM, et al. 1994. J. Supercon. 7, 261–264
77. Daou R, et al. 2009. Phys. Rev. B 79:180505
78. Komiya S, Tsukada S. 2009. J. Phys. Conf. Series 150:052118
79. Momono N, et al. 1994. Physica C 233:395–401
80. Horio M, et al. 2018. arXiv:1804.08019
81. Walmsley P, et al. 2013. Phys. Rev. Lett. 110:257002
82. Lohneysen H. v., et al. 1994. Phys. Rev. Lett. 72:3262–3265
83. Balakirev FF, et al. 2003. Nature 424:912–915
84. Balakirev FF, et al. 2009. Phys. Rev. Lett. 102:017004
85. Kawasaki S, et al. 2010. Phys. Rev. Lett. 105:137002
86. Kondo T, et al. 2010. Nature Physics 7:21–25
87. Storey J, et al. 2016. Europhys. Lett. 113:27003
88. Maharaj AV, et al. 2017. Phys. Rev. B 96:045132
89. Behnia K, et al. 2004 J. Phys.: Condens. Matter 16:5187–5198
90. Doiron-Leyraud N, et al. 2017. Nature Commun. 8:2044
91. Boebinger GS, et al. 1996. Phys. Rev. Lett. 77:5417–5420
92. Ando Y, et al. 1995. Phys. Rev. Lett. 75:4662–4665
93. Laliberte F, et al. 2016. arXiv 1606.04491
94. Komiya S, Ando Y. 2004. Phys. Rev. B 70:060503
95. Tranquada JM, et al. 1997. Phys. Rev. Lett. 78:338–341
20 Proust & Taillefer
96. Panagopoulos C, et al. 2002. Phys. Rev. B 66:064501
97. Michon B, et al. 2018. arXiv:1805.04589
98. Nachumi B, et al. 1998. Phys. Rev. Lett. 58:8760–8763
99. Hunt AW, et al. 2001. Phys. Rev. B 64:134525
100. Chang J, et al. 2008. Phys. Rev. B 78:104525
101. Chang J, et al. 2009. Phys. Rev. Lett. 102:177006
102. Scalapino DJ, et al. 2012. Rev. Mod. Phys. 84:1383
103. Benhabib S, et al. 2015. Phys. Rev. Lett. 114:147001
104. Cyr-Choiniere O, et al. 2018. Phys. Rev. B 97:064502
105. Fujita K, et al. 2014. Science 344:612–616
106. Vilk YM, et al. 1997. J. Phys. I France 7:1309–1368
107. Gull E, et al. 2010. Phys. Rev. B 82:155101
108. Sordi G, et al. 2012. Scientific reports 2:547
109. Wu W, et al. 2017. arXiv 1707.06602
110. Braganca H, et al. 2018. Phys. Rev. Lett. 120:067002
111. Scheurer M, et al. 2017. PNAS 115:E3665
112. Fauque B, et al. 2006. Phys. Rev. Lett. 96:197001
113. Sato Y, et al. 2017. Nature Physics 13:1074–1078
114. Varma C. 2016. Rep. Prog. Phys. 79:082501
115. Nie L, et al. 2014. Natl Acad. Sci. USA 111:7980–7985
116. Doiron-Leyraud N, et al. 2009. Phys. Rev. B 80:214531
117. Hussey NE, et al. 2013 J. Phys.: Conf. Ser. 449:012004
118. Abdel-Jawad M, et al. 2007. Phys. Rev. Lett. 99:107002
119. Legros A, et al. 2018. arXiv:1805.02512
120. Zaanen J. 2004. Nature 430:512–513
121. Bruin JAN, et al. 2013. Science 339:804–807
www.annualreviews.org • The remarkable underlying ground states of cuprate superconductors 21