Embed Size (px)
Citation preview

i
Realizing the Millennium Development Goals through socially inclusive macroeconomic policies
Country Study
Assessing Development Strategies to Achieve the MDGs in
The Republic of Uganda
John Mary Matovu, Evarist Twimukye Economic Policy Research Center
Albert Musisi
Ministry of Finance, Planning and Economic Development
Sebastian Levine
UNDP Uganda
United Nations Department for Social and Economic Affairs
March 2011

ii
This (unedited) report was elaborated as part of the capacity-development project “Realizing the Millennium Development Goals through socially-inclusive macroeconomic policies”, which was implemented by the Development Policy an Analysis Division of the United Nations Department of Economic and Social Affairs (DPAD/UN-DESA), in close collaboration with the World Bank and the United Nations Development Programme in Uganda.
The overall objective of the project was to strengthen the capacity of policymakers to formulate and evaluate socially-inclusive macroeconomic policies aimed at facilitating the achievement of the MDGs through the adaptation of an integrated modelling framework to country-specific conditions. The methodological framework is based on the adaptation of the economy-wide model system, known as Maquette for MDGs Simulation (MAMS) – a dynamic computable general equilibrium (CGE) model that includes a special module for the “production” of services associated with the Millennium Development Goals (MDGs). It also compromises methodologies at the micro level to identify determinants of MDG achievement, on the one hand, and to quantify effects on poverty and inequality, on the other. The views and opinions expressed herein are those of the authors and do not necessarily reflect those of the United Nations and the World Bank or their member states. © "Realizing the Millennium Development Goals through socially inclusive macroeconomic policies" Project (http://www.un.org/en/development/desa/policy/capacity_building.html).

iii
CONTENTS
1. Introduction......................................................................................................................... 3
2. Progress towards the MDGs ................................................................................................ 4
2.1. MDG 1: Eradicate extreme poverty and hunger ................................................................... 5 2.2. MDG 2: Achieve universal primary education ..................................................................... 6
2.3. MDG 3: Promote gender equality and empower women...................................................... 6
2.4. MDG 4: Reduce child mortality........................................................................................... 7 2.5. MDG 5: Improve maternal health ........................................................................................ 7
2.6. MDG 6: Combat HIV/AIDS, malaria and other diseases...................................................... 8 2.7. MDG 7: Ensure environmental sustainability....................................................................... 8
2.8. MDG 8: Develop a global partnership for development ....................................................... 9
2.9. Inequality and regional disparities ....................................................................................... 9
3. Economic performance and challenges .............................................................................. 11
3.1. Uganda’s economic reform programme............................................................................. 11 3.2. Drivers of growth .............................................................................................................. 14
3.3. Has growth been pro-poor?................................................................................................ 15
3.4. Vulnerabilities and economic constraints........................................................................... 17
4. Social policies ................................................................................................................... 22
4.1. Social policy during the period 1990-2008......................................................................... 22 4.2. Social policy and pro-poor outcomes................................................................................. 24
5. Sector analysis of MDG determinants................................................................................ 26
5.1. Determinants of entry and enrolment in education ............................................................. 26 5.1.1. Introduction....................................................................................................................... 26 5.1.2. Methodology and data ....................................................................................................... 26 5.1.3. Results .............................................................................................................................. 28 5.1.4. Conclusion ........................................................................................................................ 30 5.2. Determinants of child mortality ......................................................................................... 30
5.2.1. Introduction....................................................................................................................... 30 5.2.2. Methodology and data ....................................................................................................... 30 5.2.3. Results .............................................................................................................................. 31 5.2.4. Conclusion ........................................................................................................................ 31
5.3. Determinants of access to water and sanitation.................................................................. 32 5.3.1. Introduction....................................................................................................................... 32 5.3.2. Methodology and data ....................................................................................................... 32 5.3.3. Results .............................................................................................................................. 32 5.3.4. Conclusion ........................................................................................................................ 33
6. Calibration of MAMS with country-specific data............................................................... 33
7. MAMS scenario analysis ................................................................................................... 36
7.1. Baseline Scenario .............................................................................................................. 36 7.2. MDG Simulations.............................................................................................................. 39
7.3. Targeting MDG 2-Universal Primary Education................................................................ 39

iv
7.4. Targeting MDG45-Reduced Under Five Mortality and Maternal Mortality........................ 41
7.5. Increased Access to Water and Sanitation.......................................................................... 42
7.6. Targeting all MDGs simultaneously .................................................................................. 43 7.7. Efficient Utilization of Resources ...................................................................................... 43
7.8. Domestic Resource Mobilization ....................................................................................... 44
8. Analysis of micro simulation results for MDG 1 and inequality.........................................45
9. Conclusions and policy implications.................................................................................. 45
10. Appendices........................................................................................................................ 48
11. References......................................................................................................................... 82
TABLES
Table 1: Progress towards MDG targets .......................................................................................... 4 Table 2: MDG Status and Trends for Uganda.................................................................................. 5 Table 3: Selected Macroeconomic Indicators (1998/1999-2008/2009)........................................... 13 Table 4: GDP by expenditure growth rates.................................................................................... 15 Table 5: Decomposition of changes in poverty incidence .............................................................. 16 Table 6: Functional analysis for Uganda recurrent expenditure...................................................... 21 Table 7: School enrolment by education cycle, 2005/2006 ............................................................ 27 Table 8: Probit estimates for entry and enrolment into primary education...................................... 29 Table 9: Probit estimates for entry and enrolment into secondary education .................................. 29 Table 10: Probit estimates for entry and enrolment in tertiary education........................................ 29 Table 11: Probit estimates for infant and under-5 mortality ........................................................... 31 Table 12: Probit estimates for access to safe water and improved sanitation .................................. 33 Table 13: Social Accounting Matrix.............................................................................................. 34 Table 14: Elasticities used in the MAMS specification for Uganda................................................ 35 Table 15: Scenarios in MAMS ...................................................................................................... 39
FIGURES
Figure 1: Share of population living in households below the national poverty line ......................... 6 Figure 2: Primary Net enrolment ratios and completion rates .......................................................... 8 Figure 3: Under-five mortality (per 1,000 live births) ...................................................................... 8 Figure 4: Maternal mortality (per 100,000 births)............................................................................ 8 Figure 5: New HIV infections ......................................................................................................... 8 Figure 6: Under-five and infant mortality (per 1000 live births), 2005/2006 .................................... 9 Figure 7: Primary completion rates by sex....................................................................................... 9 Figure 8: HIV prevalence by sex and age group, 2004/2005.......................................................... 10 Figure 9: Poverty incidence by region ........................................................................................... 10 Figure 10: Gini-coefficients .......................................................................................................... 10 Figure 11: Chronic and transient poverty in the NUSAF areas....................................................... 11 Figure 12: Recent economic trends................................................................................................ 13 Figure 13: GDP by Sector in 2008/09............................................................................................ 14 Figure 14: Growth incidence curves (1992/1993-2005/2006) ........................................................ 16 Figure 15: Growth incidence curves (1992/1993-1999/2000) ........................................................ 16 Figure 16: Growth incidence curves (1999/2000-2002/2003) ........................................................ 17 Figure 17: Growth incidence curves (2002/2003-2005/2006) ........................................................ 17 Figure 18: Budget deficit 1998-2008 (per cent of GDP) ................................................................ 18

v
Figure 19: Stock of Total External Debt (percentage of GDP) and Debt Service (percentage of Exports of Goods and Services) .................................................................................................... 18 Figure 20: Remittances Received (US$ Millions).......................................................................... 19 Figure 21: Aid (per cent of GDP) and Net official development assistance, 1990-2007 (per cent of GNI) ............................................................................................................................................. 21 Figure 22: Net attendance rates for primary education by wealth quintile ...................................... 25 Figure 23: Net attendance rates secondary education by wealth quintile ........................................ 25 Figure 24: Under-five mortality rate by wealth quintile ................................................................. 25 Figure 25: Infant mortality rate by wealth quintile......................................................................... 25 Figure 26: Total fertility rates in Uganda by wealth quintile .......................................................... 25 Figure 27: Share of deliveries attended by skilled provider* by household wealth quintile ............ 25 Figure 28: Baseline MDG Outcomes and Targets.......................................................................... 37 Figure 29: Baseline Unemployment Rate by Factors of Production ............................................... 38 Figure 30: Baseline Wage Rates by Factors of Production............................................................. 39 Figure 31: Recurrent Spending on Primary Education ................................................................... 40 Figure 32: Capital Spending on Primary Education ....................................................................... 40 Figure 33: Recurrent Spending on Health Services........................................................................ 41 Figure 33: Capital Spending on Health Services............................................................................ 42 Figure 34: Required Spending under Various Financing Scenarios................................................ 44

3
1. Introduction
In June 2010 Uganda published its first five-year National Development Plan (NDP) for the period 2010/2011-2014/2015. The Plan is the first in a series of six five-year instalments that seek to transform Uganda from a peasant society to a modern and prosperous country within a 30-year vision. It replaces the Poverty Eradication Action Programme (PEAP), in place since 1997, as the country’s predominant planning instrument and thus seeking to expand the focus to cover more comprehensively both economic and social sectors. Priorities for the public investment programme include physical infrastructure, human resources development and access to basic services, expanding the productive capacity of the economy and promoting science, technology and innovation. To be implemented within the overall context of Uganda’s hallmark macro-economic stability, the Plan is expected to generate economic growth rates in excess of 7 percent, a fifty percent increase in public investments compared to the PEAP period, and 550,000 new jobs annually throughout the plan period. However, when it comes to the social development targets such as those covered by the Millennium Development Goals (MDGs), the expected progress is mixed. Key goals related to poverty reduction are projected to be met and even to exceed those implied by the MDGs. However, other key goals such as those related to primary school completion for all boys and girls and reduction in child and maternal mortality are expected to be missed. According to the NDP this is a reflection that the required provision of public services, per capita consumption, the necessary physical infrastructure and other key MDG determinants are deemed inadequate in the Plan (NPA, 2010:61).
This paper has two main objectives. The first is to assess whether all or some of the MDGs will be attained under the current economic climate and under prevailing trends. The second objective is to assess the role of public policy, including the cost implications, of accelerating progress to ensure that the MDG targets would be met. The analysis is based on a dynamic-recursive Computable General Equilibrium (CGE) model known as Maquette for MDG Simulations (MAMS) as applied with a dataset for Uganda, which has a module that specifies the production technology for MDG-related services such as education, health, and water and sanitation (Lofgren and Diaz-Bonilla 2006). This economy-wide framework provides labour-market results that are combined with a micro-simulation methodology that uses household survey data to determine impacts on poverty (MDG1) and inequality (Vos and Sánchez 2010). The CGE framework is particularly useful for examining the effects and financial costs of public policy alternatives, which are likely to have economy-wide ramifications. The MAMS module and the micro-simulations create the crucial links between the macro-economy and household level welfare and the MDGs.
The paper is divided into 9 sections. Section 2 examines in further detail the progress made in Uganda towards the MDG targets and highlights some of the key challenges faced by Uganda in terms of accelerating progress. In Section 3 we review the role of macro-economic policies in driving economic growth, development and transformation in Uganda over the past two decades and we highlight the key challenges faced by the economy if Uganda is to sustain growth and ensure that it is pro-poor. This is followed by an assessment in Section 4 of social policies in the country, which includes a description of the evolution and structure of public spending, and a consideration as to whether social policy reforms have produced outcomes that have favoured MDG attainment. In section 5 we present findings from the micro-econometric work on determinants of MDGs 2, 3 and 7, which are modelled directly into MAMS, and in Section 6 the model itself is introduced with a description of the Social Accounting Matrix that was updated specifically for this paper’ s modelling exercise and the other data inputs. In Section 7 we discuss the results from various policy scenarios and in Section 8 we present the findings from the micro-simulations on household welfare with and emphasis on changes in poverty and inequality. Finally, in Section 9 we conclude and provide some policy recommendations.

4
2. Progress towards the MDGs
Over the past decades Uganda has made important progress towards many of the MDG targets. Of the 19 targets covered in the 2010 MDG Country Report (MOFPED 2010), for 7 targets the recent progress was found to be sufficient to ensure the 2015 target would be achieved (see Table 1). In 8 cases progress was registered but it was deemed too slow for attainment of the target. In two cases there was outright reversal and in another two cases no assessment could be made due to an absence of measurable targets. This section briefly surveys the progress towards each of the goals drawing on the MDG report as well as additional data sources.
Table 1: Progress towards MDG targets
Achieved/on track Slow/Stagnant Reversal No target
Number of targets 7 8 2 2
List of targets Target 1.A: Halve, between 1990 and 2015, the proportion of people whose income is less than one dollar a day
Target 1.C: Halve, between 1990 and 2015, the proportion of people who suffer from hunger
Target 3.A: Eliminate gender disparity in primary and secondary education, preferably by 2005, and in all levels of education no later than 2015
Target 6.B: Achieve, by 2010, universal access to treatment for HIV/AIDS for all those who need it
Target 7.C: Halve, by 2015, the proportion of people without sustainable access to safe drinking water and basic sanitation
Target 8.D: Deal comprehensively with the debt problems of developing countries through national and international measures in order to make debt sustainable in the long term
Target 8.F: In cooperation with the private sector, make available the benefits of new technologies, especially information and communications
Target 2.A: Ensure that, by 2015, children everywhere, boys and girls alike, will be able to complete a full course of primary schooling
Target 4.A: Reduce by two-thirds, between 1990 and 2015, the under-five mortality rate
Target 5.A: Reduce by three quarters, between 1990 and 2015, the maternal mortality ratio
Target 5.B: Achieve, by 2015, universal access to reproductive health
Target 6.C: Have halted by 2015 and begun to reverse the incidence of malaria and other major diseases
Target 7.A: Integrate the principles of sustainable development into country policies and programmes and reverse the loss of environmental resources
Target 7.B: Reduce biodiversity loss, achieving, by 2010, a significant reduction in the rate of loss
Target 8.E: In cooperation with pharmaceutical companies, provide access to affordable essential drugs in developing countries
Target 6.A: Have halted by 2015 and begun to reverse the spread of HIV/AIDS
Target 8.B: Address the special needs of the least developed countries
Target 1.B: Achieve full and productive employment and decent work for all, including women and young people
Target 7.D: By 2020, to have achieved a significant improvement in the lives of at least 100 million slum dwellers
Source: MOFPED (2010).

5
Table 2: MDG Status and Trends for Uganda
MDG Indicator Baseline Current status 2015 target
1.1 Proportion of population below national poverty line
56% (1992/3)
23% (2009/10)
25%
1.2 Poverty gap 21
(1992/3) 9
(2005/6) No target
1: Eradicate extreme
poverty and hunger
1.3 Prevalence of underweight children under-
five years of age (percentage below -2
standard deviations of weight for age)
26%
(1995)
16% (2005/6)
10%
2.1 Net enrolment ratio in primary education (all 2000)
86% (all 2009)
93%
100%
Boys 89% 96% 100%
Girls 82% 90% 100%
2.2 Primary completion rate (2001) 63%
(all 2009) 52%
100%
Boys n/a 55% 100% Girls n/a 48% 100%
2: Achieve universal
primary education
2.3 Literacy rate of 15-24 year-olds (all 2002/3)
81% (all 2008)
88% No target
3.1 Ratios of girls to boys in primary/secondary/tertiary education
(all 2000) 0.93/0.79/0.58
(all 2009) 1.00/0.84/0.79
1.00/1.00/1.00 3: Promote gender
equality and empower
women 3.3 Proportion of seats held by women in national parliament
18% (2000)
30% (2006)
No target
4.1 Under-five mortality rate (per 1,000 live births)
156 (1995)
137 (2005/6)
56
4.2 Infant mortality rate (per 1,000 live births) 81
(1995) 76
(2005/6) 31
4: Reduce child mortality
4.3 Proportion of 1 year-old children immunised against measles
82% 81%
(2009) No target
5.1 Maternal mortality ratio (per 100,000 births)
506 (1995)
435 (2005/6)
131
5.2 Proportion of births attended by skilled health personnel
38% (1995)
42% (2005/6)
100%
5: Improve maternal
health
5.6 Unmet need for family planning 29% 41% No target
6.2 Condom use at last high-risk sex, female/male
39%/61% (2000/1)
35%/57% (2005/6)
70%/73% (2012)
6.5 Proportion of population with advanced HIV infection with access to antiretroviral drugs
44% (2008)
54% (2009)
80% (2012)
6.6 Proportion of children under 5 sleeping under insecticide-treated bed nets
8% (2003)
50% (2010) No target
Goal 6: Combat
HIV/AIDS, malaria and
other diseases
6.8 Prevalence rates associated with tuberculosis:
652 (2003)
350 (2008)
103
7.8 Proportion of population using an improved drinking water source, urban/rural
87%/51% (1999/2000)
87%/64% (2005/6)
100%/70% (2014/5)
7: Ensure environmental
sustainability 7.9 Proportion of population using an improved sanitation facility, urban/rural
n/a 74%/62% (2007/8)
100%/77% (2014/5)
8.4 ODA to GDP ratio 8.6%
(2005/6) 5.2%
(2009/10) 3.7%
(2014/5)
8.12 Stock-outs of tracer drugs 67%
(2002/3) 65%
(2006/7) 20%
(2009/10)
Goal 8: Develop a global
partnership for
development
8.14 Cellular subscribers per 100 population 4.5
(2004) 28.9
(2008) No target
Source: MOFPED (2010).
2.1. MDG 1: Eradicate extreme poverty and hunger
Over the past two and a half decades, Uganda has made great progress in poverty reduction. The poverty headcount (i.e. the share of people living in households with income below the poverty line) has declined from 56 percent in 1992/1993 to 23 percent in 2009/2010 even if the level of poverty increased somewhat in the middle of the period (Figure 1). The implication is that Uganda as met the 2015 global target of cutting in half poverty and already exceed the NDP target of 25 percent in 2014/2015. In both urban and rural areas have the poverty rates been more than halved. The country is even on track to achieve the original PEAP target of 10 percent in 2017 (Levine 2010). The poverty gap, a measure of how far the poor are below the poverty line, has also narrowed. This is an indication of improvements in monetary welfare even among those who have remained poor.

6
Figure 1: Share of population living in households below the national poverty line
Source: UBOS/EPRC.
Note: * Estimates for 1999/2000 exclude the districts of Bundibugyo, Kitgum, Gulu, Pader and Kasese, which were not covered in the survey that year due to instability.
Though job creation remains a major challenge in Uganda and the share of employed in the population has remained stagnant at 78 percent and 80 percent in 2003/2003 and 2005/2006, respectively. Nevertheless, the share of employed people living below the poverty line and the share of workers considered particularly vulnerable, has improved somewhat over the period. Indicators of nutritional status have improved somewhat in Uganda in recent years. On the hunger target there has also been progress for Uganda even if food security remains an issue especially in the eastern parts of the country. The share of children less than five years of age with a weight too low for their age declined from a national average of 26 percent in 1995 to 16 percent in 2005/2006.
2.2. MDG 2: Achieve universal primary education
Since the introduction of Universal Primary Education (UPE) in 1997, the total number of students enrolled in primary education increased from 2.7 million in 1996 to 8.2 million in 2009. The Net enrolment ratio (NER), which is a key MDG indicator and measures the share of children in school going age who are in school, has hovered above 90 percent in recent years, close to the 100 percent needed to meet the MDG. However, the other key MDG indicator, the proportion of pupils starting grade 1 who reach the last grade of primary, referred to as the completion rate, remains low and has actually deteriorated in recent years. According to the National Development Plan (NPA 2010) the fall in the completion rate is a result of a rise in class repetition and in the number of school drop-outs. Another reason is that, with the introduction of UPE in 1997, the number of children enrolled increased considerably. This led to very large classes and poorer education. Consequently, a significant percentage of the cohort entering under UPE in 1997 did not complete primary school, which affected completion rates, particularly around 2004/2005.The assessment by Government is progress over the period has been too slow for the MDG2 to be attained if current trends continued. A key aspect of the analysis presented later in this paper will be to explore the options for accelerating progress towards MDG2 and assess the wider economic impacts and costs.
2.3. MDG 3: Promote gender equality and empower women
There has been some progress on the indicators used to measure MDG2. Notably the ratio of girls to boys has reached parity for primary education and recent increases in the ratio for tertiary education mean that this indicator too is on track to reach parity by 2015. Slower progress is noted at secondary levels of education where the ratio stood at 0.84 in 2009 compared to 0.79 in 2000. The

7
share of women in wage employment in the non-agricultural sector, another key indicator of women’s empowerment, seems to be declining, falling from 39 percent in 2002/2003 to 28 percent in 2005/2006. The share of women in the National Parliament has increased from 18 percent in 2000 to 30 percent in the current 8th Parliament. This is mainly a result of Uganda’s policies on affirmative action which have led to a steady increase in the share of women that take part in political decision-making at all levels of society. Unfortunately, access to information regarding the allocation of seats in local government bodies is not readily available. Despite overall progress, the National Development Plan recognizes that gender inequality remains a challenge especially when it comes to stemming gender-based violence (NPA 2010). Forty percent of women compared to 11 percent of men have experienced sexual violence in their lifetime and 25 percent of girls report that their first sexual experience was associated with the use of force (MOH 2006).
2.4. MDG 4: Reduce child mortality
Indicators of child health and mortality show mixed progress over the past decades and the overall assessment of progress towards MDG number 4 to reduce child mortality is that it is too slow to reach the target of a two-thirds reduction. The under-five mortality rate has fallen from 156 per 1,000 live births in 1995 to 152 in 2001 and further to 137 in 2006. The infant mortality rate, which measures deaths among children less than 1 year of age, rose between 1995 and 2001, from 81 to 88 per 1,000 live births, and fell again to 76 in 2006. Moreover, in 2009, the measles immunisation rate was 81 percent, which is below the 90 percent national target.
2.5. MDG 5: Improve maternal health
The maternal mortality ratio stagnated at 506 per 100,000 births in 1995 and 505 in 2001, but has since fallen to 435 in 2006. In spite of progress in recent years Uganda is not on track to meet MDG4 of reducing the maternal mortality ratio by three quarters between 1990 and 2015. Moreover, in the decade after 1995 the share of births that were attended by skilled health personnel only increased from 35 percent to 44 percent. The Government has prioritized four key interventions in the area of maternal health: 1) Emergency obstetric care which addresses the major direct causes of maternal death. 2) Skilled attendance at birth helps to detect and manage complications. 3) Family planning prevents unintended pregnancies and enables women to have pregnancies neither too early, too late nor too frequently. 4) Effective antenatal care can prevent, detect, and treat problems such as malaria, anaemia, HIV/AIDS and other infections, which frequently are indirect causes of maternal deaths. However as outlined in the 2010 MDG report, which carries a special thematic section on maternal health, bottlenecks in the financing, delivery and utilisation of maternal health services impede the effective implementation of these interventions. In financing, there are pressures to increase resources for health; which also calls for sufficient prioritization of key interventions, inadequate public accountability, and incomplete harmonization and alignment of development partners’ funds and programs with government priorities further aggravate this. In the delivery of services, the infrastructure and equipment for the supply of maternal health services still needs further improvement. Insufficient supplies and commodities, as well as limitations in transport and communication for referral, are also key bottlenecks in the supply of maternal health services. In utilisation, there is high unmet need for, yet low use of the four above-mentioned priority interventions. Physical access, especially transportation for skilled attendance and emergency obstetric care, is a particular constraint here. Other bottlenecks affecting utilisation and demand for maternal health services include indirect financial costs, such as those associated with the transportation of and access to drugs (despite the abolition of user-fees), as well as cultural norms and social influences.

8
Figure 2: Primary Net enrolment ratios and completion rates
Figure 3: Under-five mortality (per 1,000 live births)
Figure 4: Maternal mortality (per 100,000 births)
Figure 5: New HIV infections
Source: MOFPED (2010)
2.6. MDG 6: Combat HIV/AIDS, malaria and other diseases
According to epidemiological modelling data the HIV epidemic is on the rise again in Uganda. The epidemic peaked in the early 1990s with 200,000 new infections annually, and then it fell markedly in the years thereafter. However, since the late 1990s the data shows a worrying upward trend in the number of new infections. In 2010 it is estimated that more than 130,000 people have been infected with HIV. Uganda is thus experiencing a second reversal of the epidemic, and this time the reversal is in the wrong direction. The other major disease covered under MDG6 is malaria, which is responsible for more illness and death than any other single disease in Uganda. In 2008 more than 110,000 malaria cases were reported corresponding to 37 per 10,000 in the population. While recent trends have stabilised, rates are significantly higher than in the 1990s when the number of reported cases hovered around 7-14 per 10,000 in the population. Tuberculosis is another major disease included in the MDG framework and one for which some achievements have been made in recent years. The prevalence of TB has been reduced from 652 per 100,000 in the population in 2003 to 350 in 2008. Over the same period incidence has also dropped from 411 per 100,000 in the population to 310. If the current speed of progress continues Uganda will attain the 2015 goal of a prevalence of 103 per 100,000 in the population. However, TB death rates have stagnated for most of the last decade and so the one-third reduction targeted for 2015 looks unrealistic.
2.7. MDG 7: Ensure environmental sustainability
The share of individuals with access to safe water has increased from 57% in 1999/2000 to 68% in 2005/2006, which means that Uganda is on course to meet its target of 89% access in 2014/2015, which is considered a much more ambitious target than the implied under the MDGs. Even if the

9
share of the population in rural areas with access to safe water is lower than in urban areas, access to improved rural water supply has trebled since from 21% in 1991 to 63% in 2007. Moreover, 21% of urban residents and 9% of rural residents had access to improved sanitation but progress in access to improved sanitation is hard to gauge given data limitations.
2.8. MDG 8: Develop a global partnership for development
ODA as a share of GDP has declined over the past PEAP periods. Moreover, during the implementation of the NDP, ODA is expected to fall further: from 5.6 percent in 2011/12 to 3.7 percent in 2014/15. The share of bilateral ODA is in a steady decline, having fallen from 53.8 percent in 2006/2007 to 40.2 percent in 2009/2010. This reflects the combined effect of donors to channelling their lower levels of assistance through multi-lateral institutions. In 2000, Uganda became the first country to qualify for debt relief under the Highly Indebted Poor Countries initiative. Debt-relief savings over the period 2005/2006 and 2009/2010 amounted to an annual average USD118 million.
In the MAMS modelling exercise presented below, focus will be on assessing continued progress towards the MDGs. Specific focus will be on those MDGs where progress is lacking, notably MDG 2, 4, 5 and 7b. We are not able to model MDG6 directly, a separate exercise will be devoted to that, but the effects of major diseases such as HIV/AIDS and malaria are estimated indirectly through their impacts on child mortality and household morbidity. Issues related to financing and international development assistance that are pertinent under MDG8 will also be assessed in the modelling exercise as part of the discussion on policy options for covering the costs of attaining the MDGs.
2.9. Inequality and regional disparities
Even if there has been overall progress towards many of the MDGs, there is unevenness in how the benefits have been shared. Health indicators such as those related to child mortality, maternal mortality and malaria show distinct geographical patterns, with the rural least-serviced areas suffering the most (Figure 6). Moreover, primary completion rates remain higher for boys than for girls (Figure 7) and the numbers on HIV prevalence show that young women are particularly vulnerable (Figure 8).
Figure 6: Under-five and infant mortality (per 1000 live births), 2005/2006
Figure 7: Primary completion rates by sex

10
Figure 8: HIV prevalence by sex and age group, 2004/2005
Figure 9: Poverty incidence by region
Source: Authors’ computations based on UDHS, EMIS, UAIS and UBOS/EPRC data.
There is also great variation in both the levels of poverty and the degree of poverty reduction in the different geographical zones and regions of the country (Figure 9). Levels of the poverty headcount are much higher in rural areas compared to urban areas. In the rural areas of the Northern region of Uganda the incidence of poverty is 49 percent compared to less than 3 percent in the urban areas of the Western region. The rural areas of Northern Uganda are home to almost 40 percent all the poor people in Uganda. It is also clear that even if poverty has fallen throughout the country in some areas the poverty reduction has been faster than others. In all areas, expect the rural Northern regions have the poverty rate fallen by 50% or more, the rate of poverty reduction that needs to take place in order to achieve the first target under the Millennium Development Goals.
The reduction in poverty in Uganda has been accompanied by a slight increase in inequality. Inequality in household consumption as measured by the Gini coefficient increased from 0.37 in 1992/93 to 0.43 in 2002/3 and to 0.42 in the most recent 2009/2010 survey. As will be explored further below a central part of the reason for why poverty has fallen so fast in Uganda, despite the edging up of inequality over the period, has to do with the rapid growth in household incomes.
Figure 10: Gini-coefficients
Source: UBOS/EPRC.
Note: * Estimates for 1999/2000 exclude the districts of Bundibugyo, Kitgum, Gulu, Pader and Kasese, which were not covered in the survey that year due to instability.

11
According to recent ‘panel’ data (i.e. the same households are interviewed over two or more time periods) from the Northern Uganda Social Action Fund (NUSAF), poverty reduction is taking place in the north after the cessation of hostilities. Nearly a quarter of the population moved out of poverty while 12 percent slipped into poverty between 2004 and 2008. Still, a total of 40 percent of individuals were living in poor households in both survey periods and thus deemed “chronic poor”. Less than a quarter of the population was classified as not living in poverty in one or the other survey. While district level data is not available from NUSAF, Karamoja is shown to be the sub-region which had the highest share of chronic poor and where less than 10 percent were not poor in either of the two periods. The share of chronic poor was more than twice as high in the rural areas of the North compared to urban areas.
Figure 11: Chronic and transient poverty in the NUSAF areas
Source: EPRC and Cornell University.
3. Economic performance and challenges
Uganda’s macro-economic reform programme is generally viewed as having supported economic growth well beyond what could be expected from the recovery and reconstruction process (World Bank 2007). These reforms, often considered among the most comprehensive in Africa, have reduced barriers to trade and liberalised prices and markets previously subject to state control. Improved management of monetary and fiscal policy has produced stability and has brought down the triple-digit inflation rate of the late 1980s. In this section we briefly survey the main policies and reforms that have been driving growth and development in Uganda, as well point to some of the key challenges ahead.
3.1. Uganda’s economic reform programme
In 1987, Government launched an Economic Recovery Programme followed by a series of other reforms aimed at restoring macroeconomic stability to provide a favourable environment for economic growth and private sector development. The key reforms included a currency reform and 30 per cent tax and instituting prudent fiscal regime geared to improving revenues and restraining expansion in government expenditures, while maintaining a strong focus on economic recovery and growth.
The next set of reforms involved the adoption of the structural adjustment programme that was meant to free up markets and create price incentives, stimulate private investment, and encourage competition. Reforms under this programme included the abolition of marketing boards, privatization and abolition of public enterprises and the establishment of the Uganda Investment Authority.
This period was characterized by sustained macro-economic stabilization, adjustment and structural reform efforts that affected almost all sectors of the economy. These mainly involved macro-

12
economic stabilization process, price liberalization, public enterprises reform, financial sector liberalization and reform and civil service reform. Macro-economic stabilisation and re-orientation of the pricing and marketing policies, re-starting of economic growth and strengthening institutional framework constituted the major cornerstones of the program in addition to stabilising and changing the structure of the economy. The ERP focused on macroeconomic stability, liberalisation of the foreign exchange system, trade, price, and marketing systems, improving the incentive structure and business climate to promote savings mobilisation and investment, and rehabilitating the country’s economic, social and institutional infrastructure.
With the economy back on its footing, the government in 1997 embarked on poverty eradication, introducing the Poverty Eradication Action Plan (PEAP), a multi-sectoral program aimed at reducing poverty. Some of the specific policies in this program included the Plan for the Modernization of Agriculture (PMA) and Universal Primary Education (UPE). UPE is a program that started in 1997 and aimed at giving universal education to all primary age children. It resulted in a dramatic increase in primary school enrolment from about 3 million children before the program to about 7 million after implementation of the program.
PMA on the other hand aimed at addressing agricultural constraints to production and turning agriculture commercial. The program targeted relaxation of marketing infrastructure constraints, technology generation and dissemination, removal of financial constraints, land tenure and policy, formation of farmers’ organizations, addressing human resource and information constraints, promotion of on-farm and off-farm storage, stopping environmental degradation, and mitigating the effects of HIV infection and AIDS.
Other sectoral reforms that contributed to the liberalization and stabilization of the economy included the Medium-Term Competitive Strategy for the Private Sector (MTCS), the Strategic Export Programme (STRATEX), and the Strategic Export Intervention Programme (SEIP). These policies were accompanied by important institutional reforms, such as decentralisation efforts, abolishing of state-owned marketing boards, and a restructuring of the public administration.
These reforms appear to have worked very well because the 1990s saw a substantial reversal in the decline of the economy that had characterized the 1970s and early 1980s. Confidence in the economy was restored and as a result there was substantial aid and foreign direct investment inflows and return of flight capital that supported the country’s recovery programme. Most of the economic indicators rebounded from their earlier declines, and by 1996 the economy had recovered to its nominal 1971 $US per capita GDP (World Bank 2007).
The period 1990-2008 involved two phases of growth one 1990-1999 and the other 2000-2008. The 1990 to 1999 phase was characterized by sustained positive growth rates far above the Sub-Saharan average. At an average of 3.6 per cent, Uganda’s per capita income (measured in 1985 international prices) recovered from the low of US $ 504 of 1986 and had reached US $ 697 by 1997.
Similarly, the period 2000-2008 was very impressive. For example, estimates by the Uganda Bureau of Statistics show that average GDP growth rate (at factor prices) for the five years (2003/2004-2007/2008) was as high as 7.9 per cent, with the economy posting a growth rate of 8.7 per cent for the year 2007/2008. But the economy slowed down to 6.5 per cent in 2008 due to the turmoil in the world economy and regional instability. Other challenges to the economy included the post-election violence in Kenya at the end of 2007 which disrupted the trade link with Mombasa port, the run-up of world oil prices in the first half of 2008 and recently the worsening global slump. The global recession has impacted the economy through (i) reduction in foreign financial inflows including aid, grants, foreign direct investment and remittances; (ii) depreciation of the exchange rate (as a result of (i)); (iii) changes in exports to the region, and; (iv) changes in exports of goods that are exported beyond the region.
Uganda’s main economic recovery is attributed to two major factors. First, is largely due to peace dividend which is prevailing in most parts of the country except the Northern region. Second the

13
persistent growth rates can also be attributed to the stable macroeconomic environment that has prevailed over the past two decades. For over a decade, inflation which is a key indicator for macroeconomic stability has been kept within single digits. However, the increase in inflation during the most recent years is attributed to supply constraints and external factors including world increase in food and fuel prices.
Figure 12: Recent economic trends
Source: Uganda Bureau of Statistics
As shown in Table 3, over the years Uganda has made some fiscal consolidation with a fiscal deficit (excluding grants) declining from 14.9 percent to 5.1 percent of GDP. Albeit this performance, this has been largely achieved by reducing spending which have declined from 26.7 percent to 17.9 percent of GDP. On the revenue front, Uganda has made very minimal progress to increase its tax revenues which have stagnated at 13 percent of GDP and with an increase of only 1 percent of GDP over the ten year period. This has led to the budget being largely financed by grants.
On the external front, the current account has continued to register a deficit although it has declined over the years from 14.7 to 6.2 percent of GDP. The current account deficit is partly due to the fluctuating terms of trade in Uganda of which between the period 2000-2003 terms of trade deteriorated by an average of 20 percent per year. This is also reflected in the low import cover which has remained at 6 percent months of imports.
Table 3: Selected Macroeconomic Indicators (1998/1999-2008/2009)
Source: Uganda Bureau of Statistics
1998/99 1999/00 2000/01 2001/02 2002/03 2003/04 2004/05 2005/06 2006/07 2007/08
Real GDP Growth 3.6 8.3 5.3 4.8 6.9 4.5 5.8 10.8 8.6 8.7Inflation Rate-Annual -0.9 5.3 1.9 5.9 -2.5 10.2 0.9 5.2 4.4 12.5
Overall Fiscal BalanceIncluding Grants -1.1 -2.7 -9.1 -2.7 -5.3 -4.3 -1.8 0.1 -1.1 -2.4Excluding Grants -6.3 -7.7 -14.9 -10.6 -12.3 -10.8 -11.1 -5.3 -5.6 -5.1Tax Revenues 10.6 11.6 11.9 11.3 12.2 12.2 12.7 12.5 12.6 12.8Expenditures 16.9 19.3 26.7 21.9 24.5 23 23.8 17.8 18.2 17.9
Current Account (Excluding Official Transfers) -13.3 -14.7 -13.3 -13.4 -13.7 -14 -12 -8.1 -6.7 -6.2Terms of Trade (Percent Change) -5.8 5.5 -21.3 -20.5 -18.1 9.2 8 18.2 5.5 -1.1Gross Official Reserves (Months Import Cover) 6.2 6.6 6.2 5.7 6.3 6.2 6.1 4.8 5.3 5.9
(Percentage Increase)
(Percent of GDP)

14
3.2. Drivers of growth
Uganda’s strong economic growth since 1992 has been driven mainly by the services, manufacturing and construction sectors. In 2008/2009, the share of value added contributed by the services sector was almost half of total gross domestic product (GDP) from about 32 per cent in 1990 and that of agriculture diminished steadily from 50.3 per cent to about 15.2 per cent in the same period. The recent decline in agriculture partly reflected the effects of floods in Eastern Uganda and the persistent decline in the stock of fish due to chronic overfishing, especially Nile Perch in Lake Victoria, resulting in a decline in fishing output of 5.9 per cent in 2007. But other structural problems, including the use of inferior inputs and lack of value addition to raw materials that have limited productivity and profitability of the sector, are also to blame.
The industry sector (manufacturing, construction and mining) share in GDP has increased from about 1 per cent in 1990 to about 24.2 per cent in 2008/2009. However, its growth was slowed down in 2008/09 by the effect of the global economic crisis, growing only by 3.8 per cent compared to 9.1 per cent the previous fiscal year (MOFPED 2009). This was mainly due to the increase in imported inputs arising from the depreciation of the Uganda shilling.
Figure 13: GDP by Sector in 2008/09
Source: UBOS, 2009
During the period 2000-2008 growth was mainly due to private consumption, with more than 80 per cent share of GDP. The average growth rate of private consumption is 7 percent during the period 2000-2008 which is consistent with the overall GDP growth rate (Table 4). Investment growth has continued to be strong, with private investments increasing annually by 13 percent. Private investment growth has recently been led by construction (AfDB 2009). Moreover, economic growth has been export-led with an increase in exports registered at 19 percent on average during the period. The increase in exports is partly due to the growth in new export markets with the region and diversification of exported commodities from traditional exports (like coffee, cotton and tea) to flowers and manufactured goods for the region.

15
Table 4: GDP by expenditure growth rates
2001 2002 2003 2004 2005 2006 2007 2008 2009
Investment
Public 3.9 8.5 3.9 2.7 5.2 11.1 8.1 0.8 10.2
Private 2.3 8.3 3.6 2.5 5.5 5.2 5.5 1.1 12.1
Consumption
Public 12.5 9.6 5.1 3.7 4.1 4.9 0.9 -1.3 -0.4
Private 3.9 6.5 13.5 10.6 12.5 20.4 15.9 6 9.6
External sector
Exports 29.1 16.7 3.3 23.7 14.8 7.8 12.1 84.4 16.2
Imports 7.1 9.4 0.5 1.3 12.6 19.5 16.4 17.4 25.2 Source: World Development Indicators, 2010
3.3. Has growth been pro-poor?
The fast reduction of poverty in Uganda is a result of a combination of factors. According to a 2008 evaluation of the Poverty Eradication Action Plan overall growth in GDP per capita in the period from 1992-1997 seems to have been particularly effective in fuelling growth in per capita consumption (Oxford Policy Management 2008). Moreover, since 1997 the PEAP prioritised expenditure towards enhancing personal security and improving access to primary education, health care and water, which alongside continued robust economic growth, are likely to have had a positive impact on poverty reduction. However, the evaluation also finds that the PEAP could have had a stronger effect on poverty reduction if it had maintained a stronger focus on agriculture (especially research and development) and family planning. Sustained poverty reduction throughout the NDP planning period is expected to be generated from a combination of policy initiatives to: boost household incomes and the equality with which these are distributed; increase agricultural production and productivity; improve access to gainful employment in high-tech and industrial production; and strengthen the country’s physical and economic infrastructure.
While it is clear that the process of growth in Uganda over the past two and a half decades has been associated with steep reduction in poverty. From that simple perspective growth has been pro-poor in as much as it has benefited the poor in an absolute sense. However, if a more stringent criteria for pro-poorness of the growth process is applied, that growth should benefit the poor relatively more that the non-poor, the answer requires further investigation. We decomposed the changes in poverty levels according to whether the contribution to those changes emanates from growth in welfare or redistribution of that welfare.1 Results are presented in Table 5, which shows that the change in poverty between 1992/1999 and 2005/2006 was a negative 25.3 percentage points. The effect from growth in welfare alone was to reduce the poverty incidence by even more; 30 percentage points. However, redistribution over the period, as reflected in the increase in the level of inequality, worked against the growth effect and led to a net rise in poverty incidence of 5.4 percentage points. This points to a process of poverty reduction that is very dependent on growth and where rising inequality works as a brake on reducing poverty. This is particularly the case when urban areas where the redistribution component as a share of the growth component is much higher than in the rural areas. In terms of changes within the period it is particularly interesting to note that between 1990/2000 and 2002/2003 when the incidence of poverty went up by 5 percentage points, this increase in poverty was mainly attributable to redistribution and thus linked to the worsening of inequality in that period. The growth component makes up a negligible 0.1 percentage points of the overall worsening in poverty. In other words, the evidence suggests that when poverty has increased in Uganda it has been a result of changes in the distribution of welfare. Conversely, when poverty has fallen in Uganda it has been a result of increases in welfare across the distribution. Moreover, it
1 We follow the Shapely-approach outlined in Duclos and Araar (2007).

16
is also clear that poverty could have fallen more in these periods if it had not been for redistribution effects associated with rising levels of inequality.
Table 5: Decomposition of changes in poverty incidence
Uganda Rural Urban Uganda Rural Urban
Poverty incidence 1992/1993 (%)
0.564 0.603 0.288 Poverty incidence 1999/2000 (%)
0.338 0.374 0.096
Poverty incidence 2005/2006 (%)
0.311 0.342 0.137 Poverty incidence 2002/2003 (%)
0.388 0.427 0.144
Difference (%-points) -0.253 -0.261 -0.151 Difference (%-points) 0.050 0.053 0.047
Growth (%-points) -0.307 -0.307 -0.202 Growth (%-points) 0.001 0.009 0.002
Redistribution (%-points) 0.054 0.045 0.052 Redistribution (%-points) 0.049 0.044 0.045
Uganda Rural Urban Uganda Rural Urban
Poverty incidence 1992/1993 (%)
0.564 0.603 0.288 Poverty incidence 2002/2003 (%)
0.388 0.427 0.144
Poverty incidence 1999/2000 (%)
0.338 0.374 0.096 Poverty incidence 2005/2006 (%)
0.311 0.342 0.137
Difference (%-points) -0.226 -0.229 -0.192 Difference (%-points) -0.077 -0.085 -0.006
Growth (%-points) -0.261 -0.236 -0.235 Growth (%-points) -0.067 -0.093 0.011
Redistribution (%-points) 0.035 0.007 0.044 Redistribution (%-points) -0.010 0.008 -0.018
Source: Authors’ computations based on UNHS data.
Another useful way of exploring whether the changes in household welfare have been ‘pro-poor’, in the sense that the poor benefited more from growth in household consumption than the better off, is to use growth incidence curves (GIC) following Ravallion and Chen (2003). Comparing two periods, the GIC plots the cumulative share of household consumption of the population against the income growth rate of each percentile when individuals are ranked in ascending order of their household welfare. GICs for the four periods in Uganda are given on Figure 14 through Figure 17. The first GIC covers the whole period from 1992/1993 to 2005/2006 and it is generally flat and everywhere above zero. This indicates that at all levels of the income distribution there has been positive growth in consumption over the period and that the growth has been rather uniform in its distribution. In this sense growth has been pro-poor in the less stringent interpretation of pro-poorness referring to absolute increases in the welfare of the poor, but not in the more stringent version whereby we require higher relative improvements in welfare for the poorer groups compared to the better off. On this criterion it appears that growth been less pro-poor in urban areas compared to rural ones. This is the case when viewed over the whole period but especially over the period 1999/2000-2002/2003.
Figure 14: Growth incidence curves (1992/1993-2005/2006)
Figure 15: Growth incidence curves (1992/1993-1999/2000)

17
Figure 16: Growth incidence curves (1999/2000-2002/2003)
Figure 17: Growth incidence curves (2002/2003-2005/2006)
Source: Authors’ computations based on UNHS data.
Note: The growth incidence curves show the change in household consumption (vertical axis) between the surveys, from the poorest 1% of the population to the richest 1% (horizontal axis). The curves are drawn using household consumption per adult equivalent.
3.4. Vulnerabilities and economic constraints
Government and/or non-financial public sector accounts
Due to the turbulences that characterized most of post-independence Uganda, tax collections have historically been low. For example, the tax to GDP ratio that stood at 12.6 per cent in 1970-71, had declined to a dismal 6.5 per cent by 1989/90, leading to large deficits and a budget mainly funded by external financing (Ayoki et.al. 2004). Revenue performance has since improved, peaking at a tax to GDP ratio of 15.8 per cent in 2006/07 before declining slightly to 13.1 per cent in 2008/2009. This is still below the Sub-Saharan Africa average of about 20 per cent and is lower than that of its neighbours. In Tanzania, tax revenue was about 17 per cent of GDP and about 27per cent in Kenya for the same period.
The contrast between revenue and expenditure highlights a serious financing problem for the country that necessitates the use of external financing to cover the resultant budget deficit (Figure 18). For example whereas in 2007/08, the share of total government expenditure to GDP was 17.1 per cent, that of revenue to GDP was just 13.5 per cent. Consequently, the fiscal deficit including grants is estimated at 3.5 per cent of GDP in 2008/09. But this fiscal deficit is actually an improvement from about 6.5 per cent in 2001/02 due mainly to the various debt forgiveness initiatives and the commitment of the government to finance most of the budget by domestic revenues.
Domestic borrowing and debt
After the diminishing concerns over external debt due to the various debt forgiveness initiatives including HIPC and MDRI, concern has been rising about the level of domestic debt which according to the Bank of Uganda, had increased to US$ 1.1 billion by June 2007 from about 177 million in June 2000. The main reason for this high domestic debt is its use as an instrument for providing resources for monetary policy management to maintain macroeconomic stability, but which has put a high fiscal cost on the treasury. In response, the government has come up with specific debt sustainability benchmarks that will guide its domestic borrowing, some of which include limiting both domestic debt stock to GDP and domestic interest cost to total domestic revenue (excluding grants) ratios to less than 15 per cent, domestic debt stock to total private credit at less than 100 per cent, and to make sure the borrowing does not jeopardise the country’s efforts at improving its sovereign rating to above the B+ that the country is now enjoying.

18
Figure 18: Budget deficit 1998-2008 (per cent of GDP)
Source: World Development Indicators
External borrowing and debt
On external financing, the government has been trying to limit the share of the budget financed by donors, either through grants or procurement of more debt. Consequently in spite of the increase in the overall budget, the per cent of the budget financed by external resources has decreased from about 72 per cent in 1999 to 33 per cent in 2008. The percentage of debt to GDP has consistently declined from a high of about 63.7 per cent in 2003 to an estimated 12.5 per cent in 2008. The government at the end of the year 2007 put in place a new debt strategy that broadens the one that had been in operation since 1995, by including domestic arrears and public domestic borrowing. Under the external debt strategy, the government has decided to give grants priority over loans, and to strictly adhere to concessional terms, limit borrowing to only five priority areas especially in infrastructure, and to set a 5-year borrowing cap. In addition the government decided that debt is aligned with absorptive capacity and availability of government counter-funding. Since the government has a Medium Term Expenditure Frame Work (MTEF), the intention is to make sure that all the borrowing is within the MTEF limits and that there is enough absorption capacity for the resources.
Figure 19: Stock of Total External Debt (percentage of GDP) and Debt Service (percentage of Exports of Goods and Services)

19
Source: World Development Indicators
But as noted above, due to a number of debt forgiveness initiatives, the country’s debt obligations have recently gone down. Consequently, the percentage of Debt to GDP has reduced from about 61 per cent in 2002 to about 12 per cent in 2008 (Figure 19)
Current account and the external debt
The current account has largely remained in deficit amounting to an average of 11 percent during the period 2001-08. Despite the high deficit in the current account during the period, it has been declining reducing from 14.7 percent in 2000 to 6.2 percent in 2008 (Table 3). The reduction is largely on account of the growth in exports which on average has been increasing by 19 percent over the period 2001-08. In addition the current account has been declining owing to the private transfers from Ugandan’s working abroad.
Uganda has received a large amount of private transfer inflows in the last eight years with the largest portion in form of migrant’s remittances. Remittances have registered an increase on annual basis, with the peak inflows in 2006/07 when migrant’s remittances worth US$845 million were realized (Fig. 20). Inflows of migrant’s remittances are the second largest contributor the country’s foreign exchange inflows after exports of goods and have contributed significantly towards offsetting the large deficit on the trade balance. The large inflows of migrants remittances have made up for the large growth in private sector imports of general merchandise which has grown in leaps and bounds over the same period by providing the much needed foreign exchange to meet some of the countries import requirements.
Figure 20: Remittances Received (US$ Millions)
Source: Bank of Uganda
In 2008, capital inflows, largely of foreign direct investment (and loans), more than financed the current account deficit, entailing a surplus in the balance of payment, and raising the stock of international reserves to about 5 months of imports of goods and services by the end of 2008. Foreign Direct Investment is estimated to have increased from US$432.6 million (2.5 per cent of GDP) in 2007 to US$536.6 million in 2008 (2.7 per cent). On the debt situation , Uganda borrows largely from multilateral organizations (80.4 per cent of total debt owed in 2006/07) with the three main lenders owed, being the International Development Agency (IDA) of the World Bank (50.4 per cent of total debt), the African Development Bank (8.4 per cent), and the European Investment Bank (7.6 per cent), in that order. “Non-traditional Donors” that are becoming important as sources of ODA for Uganda include India (1.7 per cent of total debt in 2006/07) and China (1.3 per cent).

20
Debt obligations to the Paris Club have sharply declined since the country was forgiven most of the debt owed to the club in 2000 under the extended HIPC. In addition to the traditional lenders, the country receives a large amount of transfers from other donors like the NGOs, and other project funds that often are hard for the BOU to follow and quantify. To go around this, the country recently established the so-called Basket Fund in which all the donors channel their donations in order to be sure that they are covered by MTEF and that they do not destabilize the macro-economy of the country.
Tax structure and scope for raising more taxes
Currently, the tax system is comprised of excise duties, import duties, VAT, income taxes, and a number of taxes with small yields e.g fees and licences, drivers’ permits, airport tax, and freight charges. Uganda relies mostly on indirect taxes for its revenue, particularly those inclined to international trade. This dependence on indirect taxes is mainly due to the fact that income taxes are limited by administrative and other constraints. Part of the reason why Uganda’s tax base is low is because a large section of the economy is untaxed, especially the informal and the commercial agricultural sectors, which complicates efforts to widen the tax base and increase domestic revenue.
Consequently, the tax burden has for long been falling on only a small section of the population that is either in formal employment or own businesses for which tax assessment is easier. It is estimated that the top 35 highest tax payers in the country alone account for about 50 per cent of all the tax revenue, an indication of how narrow the tax base is in the country. This narrow tax base is also aggravated by the high levels of tax evasion and corruption in the tax administration system. The aggregate outcome of these shortcomings is a low growth in domestic revenue compared to the expenditure needs of the growing Ugandan economy.
Records from URA show that a small number of taxes still dominate the tax structure. The tax base can be expanded in two ways. First, the government can target the sectors that are currently untaxed especially the informal sector. This can be implemented for example, by introducing presumptive taxes based on the activities of these sectors. To the extent that the informal sector is where the bulk of the poor are employed, this choice has to be implemented while minimizing the regressive and distortionary effects on the sector. The second alternative is to minimize tax evasion. This would however require a concerted effort to improve on tax administration in order to address tax evasion which is exacerbated by high level of corruption within the Uganda Revenue Authority.
From the basic analysis it’s been found that Uganda still lags way behind in its tax collections at the domestic level. For most of the commodities the tax collection effort is not more than 5 per cent relative to the statutory rate of 18 per cent. This results into a situation where the government has to rely a lot on foreign financing. Therefore, there is room for a lot of improvement where URA can be able to increase its tax effort. This could be achieved by targeting commodities that are under-taxed and excluding food items for equity purposes. Increasing domestic tax collection would also result into less overreliance on taxing a few commodities especially fuel which is interlinked with a lot of other sectors and could indeed harm growth in the long-run.
There is also much room for improvement by the URA as far as income tax is concerned. The bulk of this tax is being paid by Kampala residents. In essence, with the abolition of the graduated income tax (which was a poll tax for every Ugandan), the taxes now financing the local governments come just from Kampala and surrounding areas. While there are arguments that this is where richer households and bigger enterprises are located, an effort should be made to expand the tax base beyond Kampala. Using the schedules of the presumptive tax which is provided for in the tax code, Ssenoga et al. (2009) estimate the potential tax that can be collected under this category amounts to US$ 23 million.

21
Table 6: Functional analysis for Uganda recurrent expenditure
Function classification 2001/02 2002/03 2003/04 2004/05 2005/06 2006/07 2007/08 2008/09
General public administration 25.2 18.1 10.3 17.4 25.2 39.2 36.9 24.3
Defense 19.7 20.4 10.5 24.5 23.1 21.6 21.2 25.8
Public order and safety affairs 9.2 10.6 4.6 10.7 11.6 12.8 12.6 12.7
Education 10.5 9.2 4.2 8.4 7.6 14.7 12.9 16.6
Health 4.8 6.1 2.5 5.3 5.3 3.9 5.5 7.3
Community & Social services 0.8 0.8 0.3 0.6 0.5 1.2 1.7 1.1
Economic services 1.1 1.1 0.3 0.8 1.7 1.2 1.6 3
Agriculture 0.7 0.7 0.2 0.7 0.9 1.2 1.8 2.9
Roads 1.9 1.9 0.6 1.5 1.8 4 5.5 6.1
Water - 0.1 0 0.1 0.1 0.2 0.2 0.2
Repayment of loans 12 25.7 66.3 24.9 16 - - -
Other functions 10.7 0.3 - - - - - -
Pensions 3.5 4.7 0.1 5.3 6.3 - - -
Total 100 100 100 100 100 100 100 100
Source: UBOS statistical abstracts ( several years) Uganda and Foreign aid
Uganda’s recovery since the 1990’s among others can be attributed to the substantial amount of aid the country has received which has been used to provide most of the public services, especially in health, education, and water and sanitation. For the period 1990-2007, aid averaged more than 10 percent of Uganda’s GDP (Figure 21). And although the government has been keen on reducing the percentage of expenditure from aid, the equivalent of 70 percent of government expenditures on education, health, water and sanitation and roads is still financed by external development assistance.
Figure 21: Aid (per cent of GDP) and Net official development assistance, 1990-2007 (per cent of GNI)
Source: World Development Indicators
Terms of trade shocks
Prior to the liberalization of the economy and the emphasis on import substitution and export diversification in the 1990s, Uganda depended mainly on coffee as the main export. This was a major constraint to the country’s terms of trade especially when the world coffee prices dropped as

22
was the case in the mid 1990’s. But since then, the country has diversified its exports and there is now an increasing role played by non-traditional exports like flowers and other agricultural exports that are mainly sold in the region.
In spite of this improvement, however, the balance of payment has not improved much because of the country’s enormous reliance on imports for both investments and exports. This is exacerbated by the large oil import bill that has continued to increase especially recently as the country relied more on thermal power with the corresponding increased use of diesel fuel. For example, it is estimated that the trade deficit as a percentage of GDP rose from 6.3 per cent in 2007 to 11.9 per cent in 2008 leading to a deterioration of the current account balance from a deficit of 2.8 per cent of GDP in 2007 to 6.2 per cent in 2008 (AfDB 2009).
4. Social policies
4.1. Social policy during the period 1990-2008
Social policy spending has been aimed at raising growth as well as the level of productivity of assets of poor people. The most important pro-poor policies undertaken by government were under the framework of Poverty Eradication Action Plan (PEAP) during the period 1997-2008. Such policies included Universal Primary Education (UPE) that was meant to provide free basic education to all school going children and free parents from the burden of paying school fees. Not only was this meant to increase education indicators of the population but also to remove the financial burden from the parents as a means of reducing poverty. Similarly there were efforts to increase health coverage by constructing health centres in all the sub-counties and parishes of the country. This was followed by the removal of user fees in health centres. These measures were meant to improve the health status of the population and also to reduce the burden of paying for health services by the poor. Similar initiatives were made in the water, roads and agriculture sectors with more and more funds directed at providing these services to the hitherto underserved areas. Consequently the share of the PAF within the medium term expenditure framework (MTEF) for poverty related activities increased from 16 per cent in 1997/98 to about 32 per cent in 2008/09. This was deemed to be substantial progress in terms of poverty orientation of public expenditure. Pro-poor spending has dominated spending under the pillar of improving the quality of life including spending on health, education, and water and sanitation. The government more than doubled its spending on education and health in the 1990s.
Evolution and structure of public spending (current and capital) and its connection to MDGs
Public spending in Uganda starting in the late 1980s and early 1990s was largely aimed at macroeconomic stability which necessitated keeping public expenditure low. But in the later 1990s and the 2000s policy shifted to poverty reduction and the improvement of the social indicators of the country. Examination of the composition of the public budget for the period shows that the composition of spending on education and health increased from 15 to 18 percent of total expenditure during the period 2001-2008. However, expenditure on other social services like water has generally remained low over the same period at 0.1 percent of the total budget.
Consequently in the framework of the PEAP, several poverty priority areas for public spending were identified including primary education, primary health care, road rehabilitation and maintenance, agricultural modernization, and water and sanitation. With the national commitment in 2000 made on the delivering on MDGs, the focus of public spending became more geared to delivering on the MDG goals.
In line with those commitments, in 1997, one year after Uganda qualified for HIPC-I initiative, it introduced the Poverty Action Fund (PAF) to help channel savings from debt relief, as well as donor contributions and government’s own resources, towards priority areas of spending that came

23
to coincide with expenditure on MDGs. Consequently, priority areas under PAF including primary education, primary health care, road rehabilitation and maintenance, agricultural modernization, and water and sanitation, and later, HIV/AIDS treatment and prevention, micro-finance, cattle restocking, adult literacy, environmental protection, and accountability measure, were emphasized for their perceived potential impact on the realization of the MDGs.
This emphasis on spending on MDGs is reflected in the fact that about three quarters of these PAF resources are channelled to Local governments who also implement most of the PAF programs, and the fact that PAF funds are protected from potential cuts in the budget (Williamson and Canagarajah, 2003). Consequently the share of the PAF in total public expenditure has risen over time from 15 per cent in 1998/99 to about 32 per cent per cent in 2008/09. Therefore there has been continued targeting of government expenditure towards areas that can impact the poor and help improve prospects for achieving MDGs. Studies which have been done to estimate the resource requirements to meet the MDGs put the total resource envelop at US billion 33 dollars in Uganda with an average of US billion 3 dollars spent every year during the period 2005-15 (Sachs et. al 2004).
Do social policy reforms seem to produce pro-poor outcomes?
Whereas it is clear that pro-poor spending increased tremendously over the last two decades, it is helpful to find out whether such spending and the accompanying policy reforms succeeded in improving the welfare of the poor. Benefit incidence analyses to determine the distributions of the benefits from public spending have been particularly illuminating. These studies indicate who gains from public services and describe the welfare impact on different groups of people or individual households.
Benefit incidence analysis studies have showed that as a consequence of increasing resources to primary education, primary health care, feeder roads, protected water sources, and agricultural extension services over time, the poor people’s access to most of these public services has improved. These studies however, found that access to primary health care and extension services is still insufficient and that serious quality concerns still prevail for all the above five areas (see for example Kappel, et.al., 2000).
Household Survey evidence shows that the share of 7 to 13-year old children who were not enrolled in school decreased dramatically between 1992/93 and 2002/03 and the poor who were previously over-represented among those who did not attend school benefited significantly from the policy. With regard to gender inequality, the survey shows that on average a gender bias that existed before UPE was introduced has been eliminated by the UPE policy. Consequently, whereas in 1992/93, considerably less female than male children were enrolled in school, regardless of their socio-economic background, by 2002/03, there was no longer any such clear-cut division.
Therefore it can be inferred that public spending on primary education has a pro-poor distribution in the sense that children from poorer households benefit more than children from richer households but that does not hold for tertiary education2 as benefits accrue mostly to children from richer households with the richest 20 per cent of the population receiving about 60 per cent of public subsidies on tertiary education especially at university level.
Except for primary health care, public expenditure on health especially that on hospitals is not pro-poor. Actually, the share of ill or injured people who did not receive any medical attention amounts to 14 per cent in the poorest quintile in 2002/03 compared to only 3.8 per cent for the fifth quintile with access to health services (Kappel, et.al., 2000). Moreover, most people, poor and rich, prefer private over public health facilities with the richer people more likely to attend private facilities due mainly to the poor quality of public health services. The poor services are mainly due to 2 The conclusion made for UPE may as well be made for Universal Secondary Education (USE) since the two programs were modeled similarly, although this study did not handle the latter because it was not yet under operation.

24
inadequately qualified and motivated staff and the diversion of drugs to private practice. This affects more acutely the rural areas that cannot compete favourably with urban areas for the limited medical staff in the country. Consequently, it is the poor (and women) who mainly live in rural areas that benefit least from public expenditure on health.
As for access to clean water, whereas as of 2002/03 more than two thirds of households had access to drinking water, the richer the household the more likely it is to use protected water (tap or piped water) and the less likely it is to use water from boreholes. But still, the policy of increasing water provision especially in semi-urban and rural areas has helped mostly the poor who had limited access to safe water.
As far as policies targeted to developing especially small-holder agriculture like PMA and its flagship policy, the National Agricultural Advisory Delivery Services (NAADS) are concerned; there is a feeling that they have not helped the poor as they had been intended. Not only does agriculture receive the least amount of public resources (slightly above 4 per cent of PAF resources in 2008/09) of the five priority areas under PAF, even the little resources seem to be spent on the relatively well off at the expense of the poor. This is reflected in the large section of the poor farmers that say they do not see any extension staff, complaining that they are discriminated against.
In summary, the policies that were initiated to help reduce poverty and improve social indicators for the poor have had mixed results for the intended beneficiaries. Whereas some policies like UPE (and USE) and primary health care have clearly been pro-poor the poor services being offered may have tempered these benefits. Moreover, some policies like limited public support to tertiary education and dysfunctional agricultural extension service may have actually been pro-rich and might need revision and /or reorientation if they are to help the poor as intended.
4.2. Social policy and pro-poor outcomes
Discussions on pro-poor economic growth usually centres on the impact of growth on household income or expenditure as the analysis in the previous section demonstrated. However, it is useful also to link the growth to changes in other measures of welfare related to the other social outcomes and MDG indicators in order to assess the full extent of how economic and social policies generate pro-poor outcomes. This is done on Figure 22 to Figure 27 using data from the demographic health surveys plotting social indicators against the population grouped by quintiles of a wealth index. The wealth index is computed using information on ownership of assets, physical features of the households and other indicators of material wellbeing, as an alternative to household income or consumption in surveys such as the UDHS, which lack this information. This data first confirms that being deprived in one dimension of welfare, material wellbeing, is correlated with deprivations in other dimensions. For instance, infant mortality is almost 40 percent higher among those in the lowest wealth quintile (poorest 20 percent of the population) compared to those in the highest quintile (wealthiest 20 percent). Similarly, the total rate of fertility is almost twice as high among the poorest households compared to the wealthiest, who also has tripled the rate when it comes to deliveries attended by skilled health personnel, which are key factors in reducing maternal mortality. Like the GICs we can also discern whether growth, as measured by changes in the wealth indicator, has been pro-poor. For both primary and secondary education it is noteworthy, and indeed worrisome, that the attendance among children from households in the lowest quintile has actually fallen between 2000/2001 and 2005/2006. For all other wealth quintiles there has been an increase in attendance. The opposite has been the case when it comes to the health indicators where the tendency has been for slight improvements for the poorest, and no change among the wealthiest.
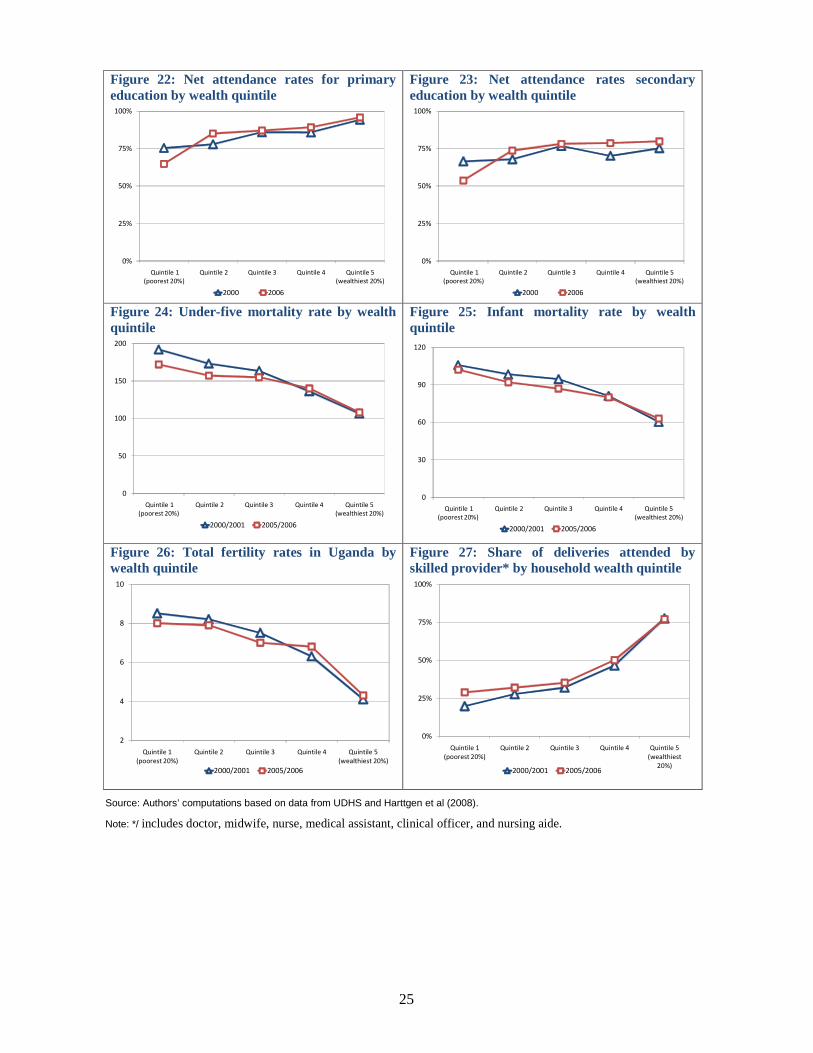
25
Figure 22: Net attendance rates for primary education by wealth quintile
0%
25%
50%
75%
100%
Quintile 1
(poorest 20%)
Quintile 2 Quintile 3 Quintile 4 Quintile 5
(wealthiest 20%)
2000 2006
Figure 23: Net attendance rates secondary education by wealth quintile
0%
25%
50%
75%
100%
Quintile 1
(poorest 20%)
Quintile 2 Quintile 3 Quintile 4 Quintile 5
(wealthiest 20%)
2000 2006 Figure 24: Under-five mortality rate by wealth quintile
0
50
100
150
200
Quintile 1
(poorest 20%)
Quintile 2 Quintile 3 Quintile 4 Quintile 5
(wealthiest 20%)
2000/2001 2005/2006
Figure 25: Infant mortality rate by wealth quintile
0
30
60
90
120
Quintile 1
(poorest 20%)
Quintile 2 Quintile 3 Quintile 4 Quintile 5
(wealthiest 20%)
2000/2001 2005/2006
Figure 26: Total fertility rates in Uganda by wealth quintile
2
4
6
8
10
Quintile 1
(poorest 20%)
Quintile 2 Quintile 3 Quintile 4 Quintile 5
(wealthiest 20%)
2000/2001 2005/2006
Figure 27: Share of deliveries attended by skilled provider* by household wealth quintile
0%
25%
50%
75%
100%
Quintile 1
(poorest 20%)
Quintile 2 Quintile 3 Quintile 4 Quintile 5
(wealthiest
20%)2000/2001 2005/2006
Source: Authors’ computations based on data from UDHS and Harttgen et al (2008).
Note: */ includes doctor, midwife, nurse, medical assistant, clinical officer, and nursing aide.

26
5. Sector analysis of MDG determinants
This section presents an overview of the micro-level analysis conducted to assess the determinants of MDG attainment. This analysis is important to assess the impact of economic and social policies in accelerating progress towards the MDGs. Some of the results also feed into the MAMS model as elasticities that capture the inter-linkages between changes in policy variables and the MDGs. This section presents analysis on the determinants of three MDGs covered in the MAMS MDG module for Uganda: primary education (MDG2), child mortality (MDG4), and water and sanitation (MDG7). Clearly, the MDGs are interrelated for instance as child health affects educational attendance, and as child health in turn is determined by exposure and vulnerability to malaria, HIV and other health risks. The effects on maternal health (MDG5), HIV and Malaria (MDG6), cannot be estimated directly due to data limitations but will be included in future studies. However, we do seek to account for the effects of increased mortality and morbidity as a result of HIV/AIDS and malaria indirectly, through a variable of child health in the primary education models. We also model water and sanitation in the child mortality models to capture some of the complex relations between MDG4 and 7.
For each of the goals we employ a logistic regression with a series of determinants that are considered important in the empirical literature either from Uganda or elsewhere. For purposes of calibrating the MAMS model we are particularly interested in assessing the impact on the individual MDGs of changes in household incomes, quality and quantity in provision of social services and infrastructure, as well as how progress in one MDG may directly impact progress in other goals.
5.1. Determinants of entry and enrolment in education
5.1.1. Introduction
Education features prominently in the NDP especially in terms of the instrumental attributes of education in enhancing human capital and thus contributing to increases in productivity and lifting rates of economic growth. Education remains the largest sub-sector in terms of allocations from the budget and its share of the total budget is expected to increase from 16 to 19 percent over the Plan period. No other sector is projected a similar degree of increase. Despite this priority granted to education the NDP still projects that MDG2, on completion of a full course of primary education for boys and girls, will not be met. The primary school completion rate is projected to growth from 64 percent in 2010/2011 to 80 percent in 2013/2014 and the net completion rate is expected to be 44 percent in 2014/2015 (NDP page 62). Moreover, the net secondary enrolment rate is projected to increase from 23.5 percent in 2008/2009 to 35 percent by the end of the planning period. The gross enrolment ratio in tertiary education is set to treble from 5 to 15 percent over the period, and the number of students enrolled in Business, Technical and Vocational Education and Training are to more than double.
5.1.2. Methodology and data
For purposes of generating elasticities for MAMS we estimate reduced form probit equations of the form:
Where is a 1/0 indicator of whether child j is enrolled or has entered at the various levels of education, i is to individual level data, h is household level, d is district level and s is sub-regional (8 regions divided into urban and rural for 16 strata). Data is from the UNHS 2005/2006, combined with district level data on educational quality from UBOS.

27
Dependent variables, y (=1/0)
The education cycle in Uganda covers seven grades of primary from the entry age of 6 years. Secondary education includes six grades from age 13 and tertiary degrees are five years from age 19. Accordingly six specifications were estimated accounting for both enrolment and entry at all three levels:
• Entry_primary = Attending P1-2 & aged 6
• Enrol_prim = Attending P1-7 & aged 6-12
• Entry_sec = Attending S1 & aged 13
• Enrol_sec = Attending S1-6 & aged 13-18
• Entry_ter = Attending degree and above & aged 19-20
• Enrol_ter = Attending degree and above & aged 19-27
Enrolment rates for each of these are indicated in Table 7. Just under half of the children aged 6 are have entered into P1 or P2, and 83 percent of children in the ages 6-12 are attending one of the primary levels, which is the corresponding measure of net enrolment estimated using survey data. Less that 19 percent of children aged 13-18 are in secondary school, while less than three percent of the 13 year-olds are in S1. Just one half of one percent of 19-20 year olds have entered into tertiary education, while less than 2 percent of all those 19-27 years of age are enrolled in a tertiary degree programme.
Table 7: School enrolment by education cycle, 2005/2006
Value
Net enrolment rate, attending P1-2 (6 years old) 0.487
Net enrolment rate, attending P1-7 (6-12 years old) 0.826
Net enrolment rate, attending S1 (13 years old) 0.028
Net enrolment rate, attending S1-6 (13-18 years old) 0.189
Net enrolment rate, attending tertiary (19-20 years old) 0.005
Net enrolment rate, attending tertiary (19-27 years old) 0.017
Source: Authors’ computations based on data sources listed in the text.
Independent variables, X
As noted, in the selection of independent variables we are guided by the key determinants needed for MAMS as well as variables such as service delivery, infrastructure and consumption per capita, as well as those that are commonly found important in the empirical literature such as education level of the head of household, gender of the child, household size and wage premium. The full list of independent variables is:
• Urban = Urban residence (1/0).
• Hsize = Household size.
• Hedyrs = Years of schooling of head of household.
• Boy = child is male (1/0).
• Service_delivery = Strata specific pupil classroom ratio education cycle is used as service delivery
proxy, district averages.
• Wage_prem = Wage premium education cycle relative to the one prior by sub-region (strata).
• Consum_ps = Household consumption per capita.
• Infrastructure = Household has access to electricity is used as proxy for infrastructure (1/0).
• Child_health = Number of days spent away from usual activity by the household member either
because of own illness or because of caring for a family member.
Constant term is included but not reported.

28
5.1.3. Results
For purposes of reporting results we emphasise those that are most of relevance for MAMS calibration and we are particularly interested in those cases where the coefficients are significant at a level of 10 percent or better. For entry and enrolment into primary education the results are displayed on Table 8. Consumption per capita displays a small but positive coefficient indicating the positive correlation between the household consumption and the probability of the child entering and enrolling in primary education. The effect of infrastructure provision is also positive although the elasticity is small. The number of years of education of the head of household also plays a positive role in determining entry and enrolment. On the other hand, the measure of child health is negative, which is an indication that illness of the child or someone in the household, which the child cares for, has a negative effect on the ability of the child to enter and attend primary school.
The service delivery variable, defined as the pupil/classroom ratio of the specific strata, has a positive coefficient. This is somewhat counter-intuitive as one would expect that in the long run expansion in education facilities would lead to the uptake of a greater number of children. Indeed this has been the case in Uganda where, according to the NDP the Pupil Classroom Ratio has fallen from 106 in 2000 to 72 in 2009. The wage premium is negative, which is also somewhat counterintuitive as it indicates that expected earnings do not affect parents’ decisions to send children to school. However, with UPE and the mandatory nature of primary education the quality of education and wage incentives thus appear to play a lesser role in terms of explaining student behaviour.
This changes when it comes to entry and enrolment into secondary education where the wage premium is positive and highly significant when it comes to enrolment as indicated in Table 9. At the time of the survey there thus appeared to be significant economic incentives for enrolling a child in secondary school. Moreover, household consumption is also a positive and significant determinant of whether the child has entered or is enrolled in secondary education. This is a reflection that better-off children tend to benefit more from post-primary education presumably due to a combination of economic and social factors. In this regard it should be noted that the data used here refer to 2005/2006, and thus reflecting conditions from before the introduction of Universal Secondary Education in 2007. Just as under primary education the number of years of education of the head of the household plays a significant and positive role in determining the secondary education status of the child in the household. This is a standard result in the literature, which also tends to emphasise the education level of the mother. It is noteworthy that the sign for service delivery under secondary enrolment is negative, which is what would be expected given the earlier discussion. However, the coefficient is still insignificant. Subsequent updates of the MAMS work should seek to experiment with and alternative service delivery variables such as public expenditure at sufficiently disaggregated levels, which was not available for the present study. As expected the infrastructure variable is also positive and significant.
The specification of the dependent variable in entry into tertiary education means that very few observations remain and consequently only one of the independent variables appear significant as is evident from Table 10. Under the more inclusive definition of tertiary enrolment three variables turn out significant at 10 percent or better: household size, consumption per capita and infrastructure.
Gender and geographic area are not covered in MAMS but they should be mentioned. In all education cycles individuals living in urban areas have higher likelihood of enrolment and attendance. Moreover, for all cycles the likelihood of attendance is lower for boys than for girls. This does not mean that overall rates of enrolment are higher for girls than for boys; in fact, as explored above, only for primary education is there close to parity between boys and girls. However, there is a clear pattern that boys delay their education relative to their age and therefore have lower rates of attendance and enrolment when under the age restriction used in MAMS.

29
Table 8: Probit estimates for entry and enrolment into primary education
Entry_prim (1/0) Enrol_prim (1/0)
Coef. _t P>t ey/ex Coef. _t P>t ey/ex
Urban 0.730 2.180 0.030 0.042 0.879 3.070 0.002 0.017
Hsize -0.029 -0.850 0.396 -0.128 -0.025 -1.270 0.207 -0.034
Hedyrs 0.028 0.980 0.327 0.077 0.055 3.300 0.001 0.047
Boy -0.088 -0.510 0.612 -0.023 -0.077 -0.760 0.445 -0.006
Service_delivery 0.010 1.880 0.061 0.390 0.011 2.860 0.005 0.133
Wage_prem -0.192 -2.730 0.007 -0.231 -0.202 -3.220 0.001 -0.075
Consum_pc 0.000 2.380 0.018 0.253 0.000 3.510 0.001 0.062
Infrastructure 0.214 0.460 0.649 0.009 0.298 1.060 0.290 0.003
Child_health -0.009 -1.040 0.298 -0.039 -0.008 -2.030 0.044 -0.010
Source: Authors’ computations based on data sources listed in the text.
Note: The ratio ey/ex is the elasticity that was calculated after the probit estimation. These elasticities give the percentage change in the probability of the child being entered or enrolled given a one percent change in the independent variable.
Table 9: Probit estimates for entry and enrolment into secondary education
Entry_sec (1/0) Enrol_sec (1/0)
Coef. _t P>t ey/ex Coef. _t P>t ey/ex
Urban 0.345 0.500 0.617 0.047 0.145 0.870 0.385 0.017
Hsize 0.012 0.190 0.851 0.104 0.027 1.910 0.057 0.203
Hedyrs 0.072 1.230 0.220 0.399 0.094 7.050 0.000 0.452
Boy -0.445 -1.230 0.222 -0.220 -0.128 -1.540 0.126 -0.054
Service_delivery 0.029 1.160 0.246 1.463 -0.001 -0.200 0.845 -0.048
Wage_prem 0.126 1.190 0.237 0.193 0.125 2.950 0.004 0.165
Consum_pc 0.000 1.680 0.095 0.156 0.000 5.530 0.000 0.340
Infrastructure 1.037 1.640 0.102 0.107 0.491 2.380 0.018 0.044
Source: Authors’ computations based on data sources listed in the text.
Note: The ratio ey/ex is the elasticity that was calculated after the probit estimation. These elasticities give the percentage change in the probability of the child being entered or enrolled given a one percent change in the independent variable.
Table 10: Probit estimates for entry and enrolment in tertiary education
Entry_ter (1/0) Enrol_ter (1/0)
Coef. _t P>t ey/ex Coef. _t P>t ey/ex
Urban 0.158 0.120 0.905 0.031 0.247 0.480 0.631 0.050
Hsize -0.040 -0.820 0.414 -0.342 0.061 1.770 0.078 0.486
Hedyrs 0.031 0.260 0.794 0.188 0.054 0.760 0.446 0.339
Boy -1.483 -1.310 0.192 -0.697 0.285 0.730 0.467 0.130
Wage_prem -0.771 -1.340 0.182 -2.152 0.175 0.800 0.427 0.486
Consum_pc 0.000 2.290 0.023 0.367 0.000 4.200 0.000 0.487
Infrastructure 2.156 1.370 0.172 0.327 1.151 2.040 0.043 0.167
Source: Authors’ computations based on data sources listed in the text.
Note: The ratio ey/ex is the elasticity that was calculated after the probit estimation. These elasticities give the percentage change in the probability of the child being entered or enrolled given a one percent change in the independent variable.

30
5.1.4. Conclusion
The regression analysis presented in this section confirms the important role that household consumption and infrastructure, as well as education level of the head of household, the gender of the child, the location of the household, and to some extent the wage premium, plays in determining decisions of parents and children in school enrolment. The specification of the service delivery variable leads to counter-intuitive results and other sources of information should be used in calibrating MAMS.
5.2. Determinants of child mortality
5.2.1. Introduction
The health sector is the fourth largest in the medium term expenditure framework presented as part of the NDP after education, works and transport, and energy and minerals development. The health sector is projected to consume 11-12 percent of the total budget over the five years spanning the NDP. However, as also highlighted above, the health-related goals of the MDGs are performing below what is needed if the 2015 targets are to be met. Notably the under-five mortality rate is expected to fall from 120 (per 1,000 live births) in 2010/2011 to 96 in 2014/2015, which is still short of the MDG target of 68 by 2015 (NDP page 62). In this section we estimate the determinants of under-five and infant mortality for purposes of the MAMS calibration and to gain further insights into the drivers of progress towards these critical health issues.
5.2.2. Methodology and data
Following the methodology of the estimation of the education elasticities we estimate reduced form probit equations of the form:
Where is a 1/0 indicator of infant or child death for birth j prior, h is household level data and d is district level. Data is from the file of births in 2005/2006 Demographic Health Survey that contain data about the mother and the child, as well as household characteristics. District level data is added from administrative data sources.
Dependent variables, y (=1/0) The two dependent variables are:
• U5_death = Child died before 60 months among all births reported within last 5 years.
• Infant_death = Child died before 12 months among all births reported within last 5 years.
Independent variables, X
Again, in the selection of independent variables we are guided by the key determinants needed for MAMS notably service delivery, infrastructure and consumption per capita, as well as those that are found important in the empirical literature such as the age and education level of the mother, sex of the child, household size and immunization rate. We also seek to capture the effects from changes in the safe water and sanitation, which are MDGs in their own right and subject to separate specification below. The full list of independent variables is:
• Urban = Urban residence (1/0).
• Hsize = Household size.
• Age_ mother = Age in number of years of mother.
• Age_mother2 = Age in number of years of mother squared.
• Mother_ noedu = Mother has no formal education (1/0).
• Boy = child is male (1/0)
• Consum_pc = Household wealth index from factor analysis as proxy for household consumption.
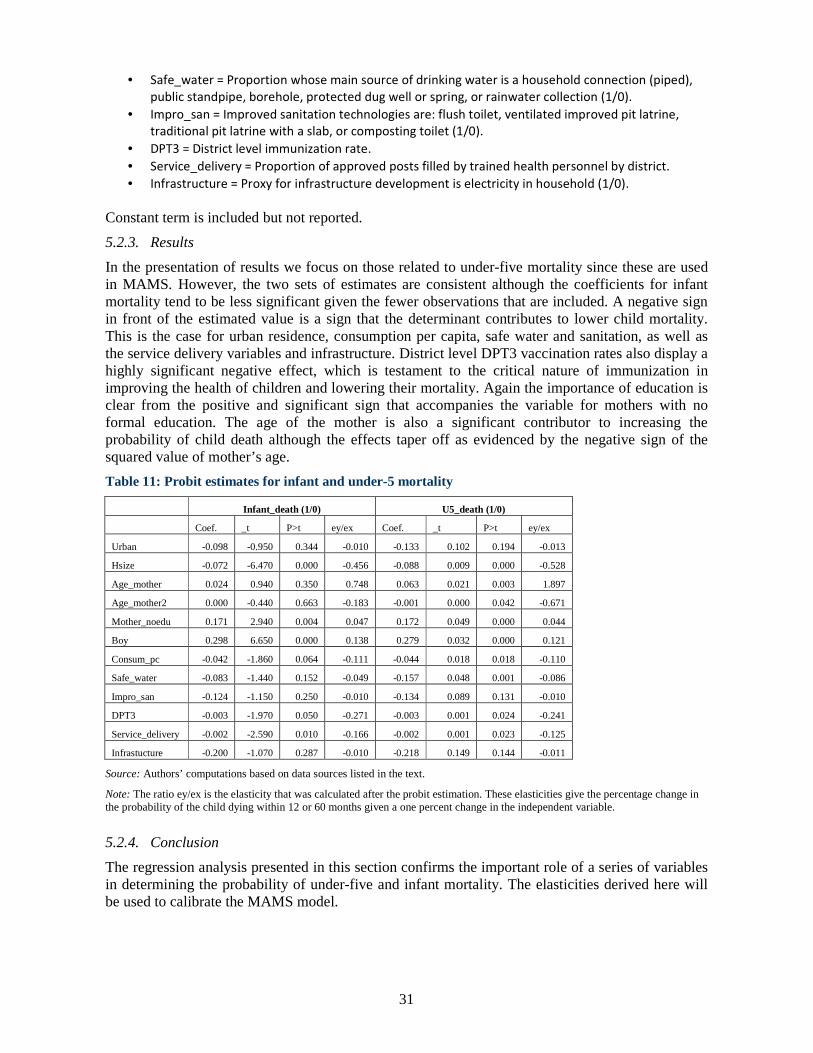
31
• Safe_water = Proportion whose main source of drinking water is a household connection (piped),
public standpipe, borehole, protected dug well or spring, or rainwater collection (1/0).
• Impro_san = Improved sanitation technologies are: flush toilet, ventilated improved pit latrine,
traditional pit latrine with a slab, or composting toilet (1/0).
• DPT3 = District level immunization rate.
• Service_delivery = Proportion of approved posts filled by trained health personnel by district.
• Infrastructure = Proxy for infrastructure development is electricity in household (1/0).
Constant term is included but not reported.
5.2.3. Results
In the presentation of results we focus on those related to under-five mortality since these are used in MAMS. However, the two sets of estimates are consistent although the coefficients for infant mortality tend to be less significant given the fewer observations that are included. A negative sign in front of the estimated value is a sign that the determinant contributes to lower child mortality. This is the case for urban residence, consumption per capita, safe water and sanitation, as well as the service delivery variables and infrastructure. District level DPT3 vaccination rates also display a highly significant negative effect, which is testament to the critical nature of immunization in improving the health of children and lowering their mortality. Again the importance of education is clear from the positive and significant sign that accompanies the variable for mothers with no formal education. The age of the mother is also a significant contributor to increasing the probability of child death although the effects taper off as evidenced by the negative sign of the squared value of mother’s age.
Table 11: Probit estimates for infant and under-5 mortality
Infant_death (1/0) U5_death (1/0)
Coef. _t P>t ey/ex Coef. _t P>t ey/ex
Urban -0.098 -0.950 0.344 -0.010 -0.133 0.102 0.194 -0.013
Hsize -0.072 -6.470 0.000 -0.456 -0.088 0.009 0.000 -0.528
Age_mother 0.024 0.940 0.350 0.748 0.063 0.021 0.003 1.897
Age_mother2 0.000 -0.440 0.663 -0.183 -0.001 0.000 0.042 -0.671
Mother_noedu 0.171 2.940 0.004 0.047 0.172 0.049 0.000 0.044
Boy 0.298 6.650 0.000 0.138 0.279 0.032 0.000 0.121
Consum_pc -0.042 -1.860 0.064 -0.111 -0.044 0.018 0.018 -0.110
Safe_water -0.083 -1.440 0.152 -0.049 -0.157 0.048 0.001 -0.086
Impro_san -0.124 -1.150 0.250 -0.010 -0.134 0.089 0.131 -0.010
DPT3 -0.003 -1.970 0.050 -0.271 -0.003 0.001 0.024 -0.241
Service_delivery -0.002 -2.590 0.010 -0.166 -0.002 0.001 0.023 -0.125
Infrastucture -0.200 -1.070 0.287 -0.010 -0.218 0.149 0.144 -0.011
Source: Authors’ computations based on data sources listed in the text.
Note: The ratio ey/ex is the elasticity that was calculated after the probit estimation. These elasticities give the percentage change in the probability of the child dying within 12 or 60 months given a one percent change in the independent variable.
5.2.4. Conclusion
The regression analysis presented in this section confirms the important role of a series of variables in determining the probability of under-five and infant mortality. The elasticities derived here will be used to calibrate the MAMS model.

32
5.3. Determinants of access to water and sanitation
5.3.1. Introduction
Access to adequate and safe water and improved sanitation is critical to secure nutrition, personal hygiene, disease prevention and for purposes of human dignity. While water and sanitation have their own MDG7, as was explored above, water and sanitation is also critical to the attainment of other MDGs especially in the health sector. As noted earlier, access to safe sanitation is one of the few targets that is projected to be met in the NDP. Specifically, the share of the population who live in households with access to safe water is expected to increase from 69 percent in 2010/2011 to 89 percent in 2014/2015, which is in excess of the 2015 target of 71 percent (NDP page 62). Sanitation coverage is expected to increase from 62 percent in 2008/2009 to 77 percent in 2014/2015.
5.3.2. Methodology and data
In this final set of regressions we estimate two reduced form probit equations of the form, for water and sanitation, respectively:
Where is a 1/0 indicator of whether household j has safe water/improved sanitation, h is household level data and d is district level. Data is from the UNHS 2005/2006, combined with district level data on service delivery from the Ministry of Water and Environment.
Dependent variables, y (=1/0) The two dependent variables are:
• Safe_wat = Water is from private connection to pipeline, public taps, bore-hole, or protected
well/spring (1/0).
• Impro_san = Sanitation is covered pit latrine, VIP latrine or flush toilet, all private (1/0).
Independent variables, X The independent variables used in the estimation are:
• Urban = Urban residence (1/0).
• Hsize = Household size.
• Service_delivery = Share of rural water supply sources that are found functioning during spot
checks, district averages. This is clearly not an ideal variable as it pertains to rural areas only, and
future revisions of the model should seek to improve the estimation by obtaining data that can
better reflect urban delivery as well.
• Consum_ps = Household consumption per capita.
• Infrastructure = Household has access to electricity is used as proxy for infrastructure (1/0).
The service delivery variable relates specifically to water supply as no adequate determinant could be identified with reasonable disaggregated data for sanitation. It is therefore expected to perform relatively better on safe water and future analysis should seek to obtain more relevant data on service delivery for sanitation. Again, constant term is included but not reported.
5.3.3. Results
For both water and sanitation, household residence in urban area is associated with higher probability of access to safe water and sanitation, holding other variables constant, which is as expected. However, the difference between urban and rural areas could be exaggerated as one concern with the household surveys relate to under-sampling in urban informal settlements. The service delivery variable is positive and highly significant for access to safe water, but negative for improved sanitation and insignificant. The latter finding is a reflection of the inadequacy of the

33
variable and a better one should be identified for future analysis. Infrastructure has positive signs for the two MDG targets, which is expected as access to improvements in the physical features of the household are positively correlated. The probability of access to safe water and improved sanitation increases with household consumption. However, only in the case of improved sanitation is the relationship significant, which is an indication that access to safe water is more equally distributed than access to sanitation as a result of the expansion in rural water supply.
Table 12: Probit estimates for access to safe water and improved sanitation
Safe_wat Impro_san
Coef. _t P>t ey/ex Coef. _t P>t ey/ex
Urban 1.498 4.860 0.000 0.067 0.519 1.630 0.104 0.004
Hsize 0.041 3.380 0.001 0.082 0.136 5.460 0.000 0.043
Consum_pc 0.000 0.160 0.877 0.001 0.000 8.520 0.000 0.089
Service_delivery 0.007 1.890 0.060 0.155 -0.004 -0.380 0.703 -0.016
Infrastructure 0.500 2.240 0.026 0.014 1.270 2.280 0.024 0.005
Source: Authors’ computations based on data sources listed in the text.
Note: The ratio ey/ex is the elasticity that was calculated after the probit estimation. These elasticities give the percentage change in the probability of the household having access to safe water or improved sanitation given a one percent change in the independent variable.
5.3.4. Conclusion
The regression analysis presented in this section confirms the important role of monetary welfare of households, as measured by consumption per capita, and the delivery of public services, as measured through the proxy variable of functioning water points, in determining the probability of access to safe water and improved sanitation. The elasticities derived here will be used to calibrate the MAMS model.
6. Calibration of MAMS with country-specific data
The analysis is based on the MAMS (Maquette for MDG – Millennium Development Goal – Simulations) which is a dynamic-recursive computable general equilibrium (CGE) model (see Lofgren et.al. 2006).3 The model is also linked to a micro-simulation module which is used to generate poverty estimates under the various scenarios. The MAMS model is integrated also with an additional MDG module which links all the MDG indicators to its determinants. The MDGs that MAMS focus on include MDG1, MDG2, MDG4, MDG5 and MDG 7a and 7b. To adequately address all these MDGs, the model provides a rich framework differentiating between government activities and private sectors activities in education and health. A detailed description of MAMS and how it works is provided in Lofgren and Bonilla (2006). This section will mainly focus on describing how the Uganda specific database required to calibrate MAMS was derived.
The first disaggregated Ugandan Social Accounting Matrix was derived in 2002 which was later modified in 2007 by IFPRI. The SAM on which the accounting consistency of the MAMS model is based builds from the 2007 SAM but it takes into account a more elaborated public sector. Table 13 shows the various accounts in the SAM on which the disaggregation of the model is based.
3 MAMS has been applied to more than 35 developing countries, primarily in the context of work undertaken to assess the resource requirements for countries to meet their MDGs.

34
Table 13: Social Accounting Matrix
Activities/Commodities Factors of Production Investment Accounts
Agriculture Labor - less than secondary education private investments
Industry Labor - completed secondary education Government investment in primary education
Transport Labor completed tertiary education Government investment in secondary education
Private services Private capital Government investment in tertiary education
Primary education nongovernment Capital for primary education Government investment in health
Secondary education nongovernment Capital for secondary education Government investment in water and sanitation
Tertiary education nongovernment Capital for tertiary education Government investment in agriculture
Health - non-government Capital for Health Government investment in roads
Primary education government Capital for water and sanitation Government other government
Secondary education government Capital for agriculture
Tertiary education government Capital for roads Other Accounts
Health - government Capital for other government interest payments on domestic debt
Water and Sanitation Land interest payments on foreign debt
Agriculture-government
Roads Institutions Tax Accounts
Other government Households Direct taxes
Government Indirect taxes
Rest of the World Import taxes
The SAM has 13 factors of production. Labour is disaggregated into three types comprising of individuals who failed to finish secondary education, those who completed secondary education and those who completed tertiary education. These labour types are therefore linked to the education cycles identified earlier. Other factors of production in the SAM are public capital for the government for the different types of activities in education, health, water and sanitation, roads and agriculture. Lastly, we also have private capital and land as factors of production.
The SAM has three institutions which include government, households and the rest of the world. Households are aggregated with the enterprises. The households are also classified based on the urban and rural classification and they are also grouped based on the income quartiles. In total there are four types of households. Each of the institutions above has its own capital accounts. The taxes considered are both direct (income and corporate tax), import and other indirect taxes. The model includes public investment demands for the various services provided by the government and one private investment demand. Interest payments are also disaggregated into foreign and domestic payments based on the 2007 fiscal accounts.
The 2007 SAM was built in several steps. The initial task in building a SAM involves compiling data from various sources into the SAM framework. This information is drawn from national accounts, household surveys, foreign trade statistics, government budgets, balance of payments, and various other publications. This information often uses (i) different disaggregation of sectors, production factors, and socio-economic household groups, (ii) different years and/or base-year prices, and (iii) different data collection and compilation techniques. Consequently, the initial or prior SAM inevitably includes imbalances between row and column account totals.
The prior macro SAM is based on national and government accounts and balance of payments. This SAM was built in such a way that it balanced with no inconsistencies across sectors. The capital accounts and the balance of payments data were used to disaggregate the savings and investment accounts of the macro SAM. The total value of government consumption spending is taken from government accounts (UBOS, 2007a) and disaggregated across commodities using information from the 2002/03 supply-use table (UBOS, 2007b). Government spending is primarily for the purchase of administrative services, education, roads, health and agriculture services. In this way the government is treated as a sector producing government services as well as a demander of these services. The technical coefficients used in the SAM are derived from the 2002/03 supply-use table (UBOS, 2007b), which contains detailed information for a large number of sectors. These coefficients had also been used to construct the previous 2002/03 SAM. Workers’ incomes from

35
wage and self-employment are drawn from the 2005/06 Uganda National Household Survey (UNHS5) (UBOS, 2006).
Since the focus of this study is largely on MDGs, the sectors of the SAM were aggregated into 16 activities. The first three activities are agriculture, industry, transport and services. All the other activities in the SAM are all MDG related. For instance, education is classified according the education cycles of primary, secondary and tertiary. Given the important role played by the private sector in the provision of education, the sector is further disaggregated into government and non-government for all the education cycles. To disaggregate this information, we relied on the information which is provided by the Ministry of Education website with details on the role of education provided by government and private sector. For the health sector, we disaggregate health into two categories based on what is provided by the government or the private sector. The private sector plays a significant role in the provision of health care especially primary health care. Other public sectors considered in the SAM are water and sanitation, roads and agriculture infrastructure provided by the government.
In addition to the SAM, the MAMS model requires a substantial amount of data related to the MDGs, labour market and various elasticities. For the MDGs, this calls for the level of service delivery required to meet the MDG targets, stocks of students at the different education cycles, and students’ behavioural patterns in terms of graduation. The elasticities include those in trade, production, consumption and MDG functions. For the Ugandan case, the focus was mainly put on estimating the determinants of the various MDGs. For education, various functions were estimated for the three cycles of education to determine factors that are important for both entry and enrolment for each education cycle.
The MDG elasticities used are provided in Table 14. As indicated, the elasticities in italics are the ones which were estimated for Uganda. In other cases like where the elasticities were not significant or they turned out to be with opposite signs, we draw on elasticities that have been estimated for other countries similar to Uganda. For example, using the Ugandan household survey we find that the wage premium is negatively related to entry and completion of primary education. Also the service provision elasticities for health and education were not estimated and this would require more work to map spending by regions into the available household surveys.
Table 14: Elasticities used in the MAMS specification for Uganda
Service provision
Health W/S Education Infrastructure Per capita
consumption MDG4 MDG7a MDG7b Wage
premium
MDG4 -1.000 -0.011 -0.110 -0.086 -0.010
MDG5 -1.000 -0.011 -0.110 -0.086 -0.010
MDG7a 0.744 0.014 0.001
MDG7b 0.099 0.005 0.089
Entry primary 1.000 0.009 -0.002 0.110
Completion primary 1.000 0.003 -0.003 0.087
Entry secondary 0.748 0.107 -0.003 0.165
Entry tertiary 0.169 0.327 -0.003 0.486
Completion secondary 0.632 0.044 -0.003 0.165
Completion tertiary 0.246 0.167 -0.003 0.486
Source: Authors’ computations.
Note: Elasticities in italics are drawn from the Uganda-specific micro-econometric analysis present in Section 5. The remainder of the elasticities are drawn from other sources used in the global project.
Other information used in the calibration of the MAMS includes the population growth rate. This is exogenously set at 3.2 percent per annum (World Development Indicators, 2010). For the employment figures these are derived from the most recent Labour Force Survey which was done as
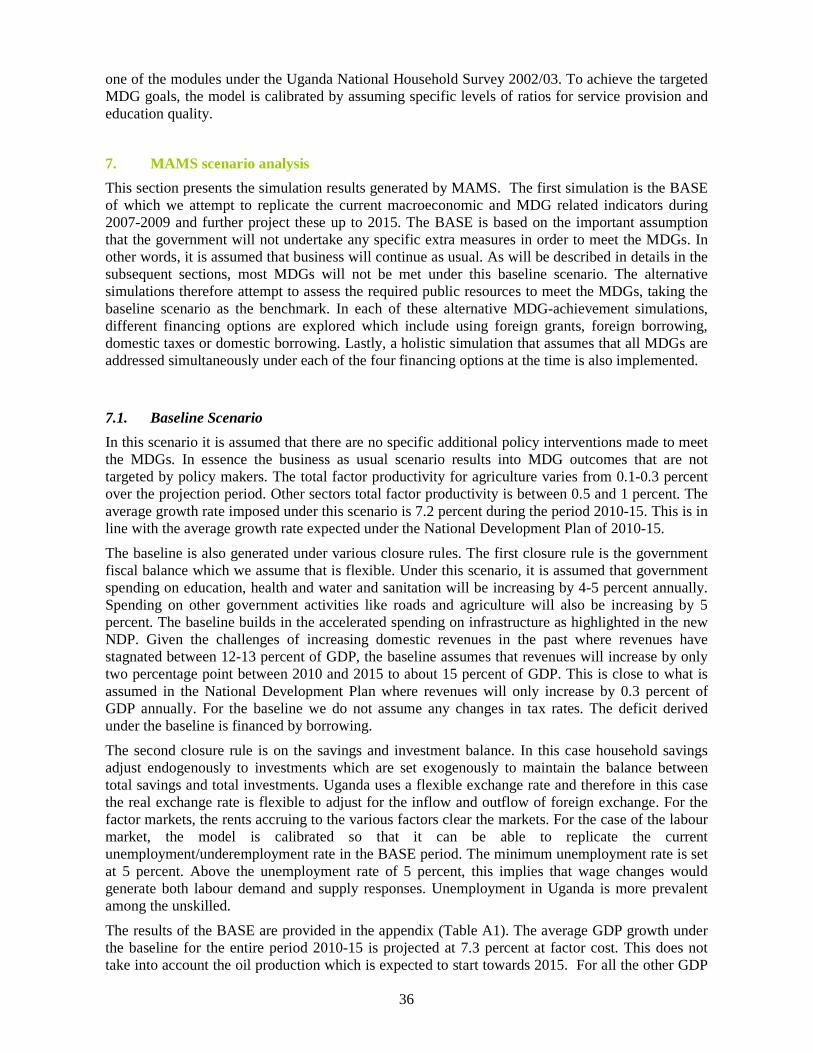
36
one of the modules under the Uganda National Household Survey 2002/03. To achieve the targeted MDG goals, the model is calibrated by assuming specific levels of ratios for service provision and education quality.
7. MAMS scenario analysis
This section presents the simulation results generated by MAMS. The first simulation is the BASE of which we attempt to replicate the current macroeconomic and MDG related indicators during 2007-2009 and further project these up to 2015. The BASE is based on the important assumption that the government will not undertake any specific extra measures in order to meet the MDGs. In other words, it is assumed that business will continue as usual. As will be described in details in the subsequent sections, most MDGs will not be met under this baseline scenario. The alternative simulations therefore attempt to assess the required public resources to meet the MDGs, taking the baseline scenario as the benchmark. In each of these alternative MDG-achievement simulations, different financing options are explored which include using foreign grants, foreign borrowing, domestic taxes or domestic borrowing. Lastly, a holistic simulation that assumes that all MDGs are addressed simultaneously under each of the four financing options at the time is also implemented.
7.1. Baseline Scenario
In this scenario it is assumed that there are no specific additional policy interventions made to meet the MDGs. In essence the business as usual scenario results into MDG outcomes that are not targeted by policy makers. The total factor productivity for agriculture varies from 0.1-0.3 percent over the projection period. Other sectors total factor productivity is between 0.5 and 1 percent. The average growth rate imposed under this scenario is 7.2 percent during the period 2010-15. This is in line with the average growth rate expected under the National Development Plan of 2010-15.
The baseline is also generated under various closure rules. The first closure rule is the government fiscal balance which we assume that is flexible. Under this scenario, it is assumed that government spending on education, health and water and sanitation will be increasing by 4-5 percent annually. Spending on other government activities like roads and agriculture will also be increasing by 5 percent. The baseline builds in the accelerated spending on infrastructure as highlighted in the new NDP. Given the challenges of increasing domestic revenues in the past where revenues have stagnated between 12-13 percent of GDP, the baseline assumes that revenues will increase by only two percentage point between 2010 and 2015 to about 15 percent of GDP. This is close to what is assumed in the National Development Plan where revenues will only increase by 0.3 percent of GDP annually. For the baseline we do not assume any changes in tax rates. The deficit derived under the baseline is financed by borrowing.
The second closure rule is on the savings and investment balance. In this case household savings adjust endogenously to investments which are set exogenously to maintain the balance between total savings and total investments. Uganda uses a flexible exchange rate and therefore in this case the real exchange rate is flexible to adjust for the inflow and outflow of foreign exchange. For the factor markets, the rents accruing to the various factors clear the markets. For the case of the labour market, the model is calibrated so that it can be able to replicate the current unemployment/underemployment rate in the BASE period. The minimum unemployment rate is set at 5 percent. Above the unemployment rate of 5 percent, this implies that wage changes would generate both labour demand and supply responses. Unemployment in Uganda is more prevalent among the unskilled.
The results of the BASE are provided in the appendix (Table A1). The average GDP growth under the baseline for the entire period 2010-15 is projected at 7.3 percent at factor cost. This does not take into account the oil production which is expected to start towards 2015. For all the other GDP

37
components, the annual growth rate is expected to be in the range of 6-9 percent. This growth would particularly be high for exports and public consumption at about 9 percent. Public consumption within the NDP is envisaged to growth with an emphasis on developing infrastructure, especially roads and energy. The real exchange rate depreciates by 0.8 percent annually and therefore not hurting the export competitiveness. At a sectoral level, growth will be largely driven by the services sector at a rate of 8.5 percent on average annually. On the other hand the agriculture sector under the BASE is assume to grow by 4.3 percent while industry by 7.6 percent. The slow growth of the agriculture sector under the baseline would raise questions on whether enough jobs could be created for the increasing youth population in Uganda.
For the government receipts under the baseline, it is envisaged that total revenues will only increase from 12.6 percent to 15.2 percent of GDP. This is in line with the general belief that already significant tax reforms have been undertaken both on the administrative and tax policy front. Therefore, although the tax revenues to GDP collected is considered to be low, even compared to other countries in the region, significant revenue collections (excluding the expected oil revenues) are not expected. This raises the question on how the MDGs are going to be financed. Domestic borrowing under the baseline is maintained at an average of 1 percent of GDP while foreign borrowing is estimated at 1 percent during the period 2010-15. This implies maintaining a fiscal deficit of 2 percent on average which is in line with the anticipated convergence criterion requirement of the East African Community Monetary Union expected to be ratified in 2012. Under the BASE, the debt to GDP ratio grows from 37 to 42.5 percent largely as a result of foreign borrowing to clear the deficit. Notwithstanding this would still be sustainable owing to the recent MDRI debt write off.
Under the above macroeconomic developments, none of the MDGs would be met with the exception of the poverty MDG indicator which has already been met. However, for the other MDGs this would require more considerable effort from the government if they are to be met by 2015. Fig. 28 shows how MDG2 (primary completion rate) would evolve over the remaining period. This MDG requires that students enrolling complete on time their education cycle without repetitions. As shown, by the target year the proportion of students who will be completing their education cycle on time will be 25 percent under the base. For the under five mortality rate (MDG4) it can be noted that this will also be hardly met. The target is set at 52 and as shown in Fig. 28, however under the baseline by 2015 under five mortality is expected to be at 99 per 1000. For the maternal mortality rate, the target is 131 per 1000 while it was estimated at 435 in 2005. As shown under the baseline, by 2015 Uganda can only attain 315 per 1000 maternal death. Lastly, the MDGs for access to both water and sanitation will also not be met as shown in Fig 28.
Figure 28: Baseline MDG Outcomes and Targets

38
Given the high growth rate expected during the BASE, there would be considerable reduction in unemployment/underemployment during the period 2010-15 from 29 to 13 percent (See Fig. 29). The considerable reduction in unemployment would largely be for the unskilled. However, growth in wages for the same category under the base would be marginal while for the highly skilled wages increase significantly by 7 percent as shown in Fig. 30.
Figure 29: Baseline Unemployment Rate by Factors of Production

39
Figure 30: Baseline Wage Rates by Factors of Production
7.2. MDG Simulations
The rest of the simulations help determine what would be required to meet the MDGs by 2015. The simulations run first target one MDG at a time under the various financing alternatives. For example, a simulation to target MDG2 only is implemented four times under each of the four financing alternatives respectively. Likewise this is done for all other individual MDGs 4 and 5, 7a and 7b. Lastly, the simulation where all the MDGs are targeted simultaneously is also undertaken. The difference between these simulations and the BASE is that the government endogenously increases its consumption of the relevant services in order to meet the given MDG. This would also require government to provide sufficient investments in the given service in order to maintain the government capital stocks. For the case of the baseline, government consumption was exogenously fixed to generate the macroeconomic aggregates in line with the NDP. This enables us to assess the costs of meeting the MDGs and the effects on the rest of the MDGs and macroeconomic aggregates. Table 15 provides the definitions of the various simulations.
Table 15: Scenarios in MAMS
Targeting of MDG and degree of attainment
Financing options
MDG2 (92% attained) 1. Domestic financing
2. Foreign transfers
3. Foreign borrowing
4. Domestic borrowing
MDG4 (100% attained) 5. Domestic financing
6. Foreign transfers
7. Foreign borrowing
8. Domestic borrowing
MDG5 (70% attained) 9. Domestic financing
10. Foreign transfers
11. Foreign borrowing
12. Domestic borrowing
MDG7a (100% attained) 13. Domestic financing
14. Foreign transfers
15. Foreign borrowing
16. Domestic borrowing
MDG7b (100% attained) 17. Domestic financing
18. Foreign transfers
19. Foreign borrowing
20. Domestic borrowing
All MDGs simultaneously 21. Domestic financing
22. Foreign transfers
23. Foreign borrowing
24. Domestic borrowing
7.3. Targeting MDG 2-Universal Primary Education
For Uganda to meet the target of MDG2, this would require increasing current spending on primary education from the baseline of 1.3 percent of GDP to an average of about 5 percent (See Table B1-2). In addition, capital expenditure on primary education would also have to increase to 13 percent

40
of GDP immediately. This is consistent with the fact that the current universal primary education provided while it has addressed the issue of enrolment, it has also had weaknesses of meeting high quality standards of the service provided owing to the marginal emphasis placed on capital investments. To realize some progress on this MDG this would require frontloading of spending on primary education spending. The required increase in real terms under the four financing regimes ranges from 90-100 percent increase. With a delay in spending on primary education, it would be more considerably harder for the primary education students to complete their education cycles on time. The required increase in capital spending over the years after the 2010/11 increase would be much smaller (Figure 32). The significant increase especially in outlays spent on capital expenditures on primary education would pose a challenge for the government given the current resource envelop. In addition, even if resources were available there are institutional challenges that would hinder the absorption of these resources immediately. These may include for example the length of procurement rules.
Figure 31: Recurrent Spending on Primary Education
Figure 32: Capital Spending on Primary Education
The key difference between the different financing simulations for this MDG2 is the impact on the exchange rate and export performance especially in the first year when resources would be needed the most. Under foreign borrowing or foreign transfers, there would also be some tradeoffs where exports would considerably decline due to the foreign exchange inflows especially in 2010 when significant resources would be required. For instance for the case of foreign transfers, exports decline by 6 percent in 2010 and this is due to the appreciation effects of the inflows on the shilling which would appreciate by 5 percent. There are also other trade-offs where if the MDG2 is financed using foreign borrowing there would be some considerable build up in debt levels increasing from 37 to 86 percent of GDP.

41
The challenge of financing MDG2 by using domestic taxes would largely be due to the limited possibility of expanding the tax base within a very short period. For instance, it would require increasing direct taxes and indirect taxes by 5 and 12 percent of GDP in 2010 respectively, which is not feasible. In light of the past tax performance where tax effort has stagnated at 12-13 percent of GDP, this would be an infeasible option.
The other challenge financing MDG2 using domestic borrowing is the significant increase in government outlays as a result of build up in interest payments. By the year 2015, government spending as a ratio of GDP would be 50 percent of which 31 percent of GDP would be domestic interest payments. Given the limited possibility of raising revenues to close the gap, this would be unsustainable.
Under all the scenarios of the various types of financing, primary completion rates would increase to 92 percent of students enrolling and completing on time. Hence, albeit allocating all these resources, it shows that there would be considerable challenges to meet this MDG. This is partly because there could also be other factors beyond increasing financial resources to meet this MDG.
Compared to the baseline, the simulations for financing MDG2 using foreign transfers or foreign borrowing would lead to lower unemployment rates relative to the baseline. On the contrary, if the financing of MDG2 is through increasing taxes or borrowing domestically this would generate a higher path of unemployment compared to the baseline. This is explained by the strain these later two financing options would put on the economy in the form of lowering resources available to the private sector.
For MDG2, given the challenges posed by domestic borrowing and the difficulties raising resources through taxation, the best to finance this MDG would be either to receive foreign grants or foreign borrowing albeit the appreciation effects of these two options.
7.4. Targeting MDG45-Reduced Under Five Mortality and Maternal Mortality.
This section focuses on targeting to reduce both under five mortality and maternal mortality under the four financing alternatives which include using taxes, domestic borrowing, foreign transfers and foreign borrowing. Under this targeting the government increases its recurrent spending to about 5 percent of GDP under the four financing options compared to 1.1 percent in the baseline (Figure 33). This would imply more than quadrupling the current amount allocated to the recurrent spending for health services. In addition, the government would have to scale up its spending on capital expenditures for the health sector to about 6 percent of GDP (Figure 34). Therefore the expansion of demand by the government for health services would have to be accompanied by expansion of the capital stock. Hence the total expenditure on health services would have to increase to about 10 percent of GDP under the four financing options.
Figure 33: Recurrent Spending on Health Services

42
Figure 33: Capital Spending on Health Services
However, given the financing demands required under MDG2, the possibility of increasing health spending to such high levels to reach the MDG45 could also be a challenge given budgetary constraints. In addition, over the medium term the thrust of the NDP is largely to re-orient spending towards infrastructure development while consolidating the past gains for the social sectors. This notwithstanding, a case can be made to efficiently utilize the current spending allocated to the health sector. The case of a mismatch and poor planning within the health sector has been widely documented. A case in point is where for example there could be new infrastructure in form of dispensaries but without drugs or health personnel to run the facility.
They key differences in macroeconomic developments are largely arising from the form of financing used to meet the MDG. In particular, if the financing is from domestic sources like domestic borrowing or raising taxes there would be no impact on the exchange rate while if the government resorts to using foreign resources this would hurt the competitiveness of the exports.
Owing to the rapid growth in the production of government services (estimated at 28 percent), the growth rate for total government service production increases from 9.3 percent to 12.6 percent on average. Similar to the previous simulation, there would be considerable build up in debt levels if financing is done by foreign borrowing. The ration of foreign debt to GDP increases from 37 to 68 percent almost doubling the current level. Hence in this case, foreign grants would be the most preferred option to finance this MDG albeit the appreciation effects and lower growth in exports.
7.5. Increased Access to Water and Sanitation
Under this scenario we attempt to target of meeting the MDG for increased access to water and sanitation. The required target is 72 for the case of access to water and 71.5 percent for access to sanitation. For the case of increased access to water, the required increase of government consumption is estimated at 1.6-1.7 percent of GDP under the four financing options compared to 0.03 percent of GDP under the baseline. The corresponding increase in capital expenditure for increased water access is about 1 percent compared to 0.4 percent of GDP. Similarly, for the case of sanitation this would require to increase government consumption to an average of 2 percent of GDP compared to 0.04 percent of GDP. The increase in capital expenditure would be about 1 percent of GDP relative to the base of 0.4 percent of GDP. The differences in the growth effects under the various scenarios are very marginal owing to the small size of both the water and sanitation sectors. However, for the case of exports, there are still some differences across the financing options with lower growth in exports when financed by foreign sources.

43
7.6. Targeting all MDGs simultaneously
Under this scenario, all the MDGs discussed above are targeted simultaneously (MDG2, MDG45, MDG7a and MDG7b). The various financing options are again explored in this simulation. The costs of targeting all the MDGs would be considerable given the current resource envelop.
As shown in Table B18, for the case of financing using foreign transfers, the additional financing required for all the targeted MDGs would be 10 percent of GDP compared to the base. The cost of financing is highest under domestic borrowing owing to the high domestic interest payments and lowest of the government used foreign grants. In all simulations, growth would be highest under the scenarios of foreign borrowing or transfers albeit the appreciation challenges
As shown in Table A19-20 we notice that exports in both cases would decline by 14 percent on average in 2010 when significant resources would be required. The worsening of the current account is largely precipitated by the strong appreciation effects of the foreign inflows. In the past there have been some discussions of the challenges of managing macroeconomic impact of the significant foreign exchange inflows which were targeted to the health sector. However, arguments have been made to the effect that by increasing the inflows, this could also result in a significant increase in productivity of the labour force which would counter the losses owing to the appreciation of the local currency. In addition, some of the inflows may not necessarily be in the form of foreign exchange. For example, for the case of health, the inflows could be drugs directly imported from a donor country and this might not necessarily hurt the exchange rate.
The additional tradeoff under the foreign borrowing option is the significant build up of debt which increases from 37 to 103 percent of GDP as shown in Table A2. This to a large extent could create fiscal sustainability problems for the future generations.
For the case of tax financing, this scenario would generate considerable unemployment outcomes relative to the baseline. The level of total unemployment in the economy would be about 20 percent compared to 13 percent under the baseline. For the case of foreign borrowing there are no marked differences in employment outcomes with the baseline. On the other hand, by using foreign borrowing or transfers the unemployment rates would be 7.6 percent compared to 13 percent in the baseline.
Overall, targeting all MDGs would be most feasible if financed using foreign transfers. Given the anticipated oil resources, these could partly be used to finance the MDGs. However, given the targeted date, and the anticipated date of drawing the first barrel of oil, it could be late to rely on the oil resources.
7.7. Efficient Utilization of Resources
While increasing resources to meet the MDGs is critical, policy makers in Uganda argue that its critical also to address the efficient use of resources. A study done by EPRC (2010) highlights various interventions that can be undertaken to address inefficiencies within the health sector. This study highlights the challenges of delivering drugs in Uganda are closely associated with (a) the institutional partnerships forged in the delivery of drugs; (b) the effectiveness of National Medical Stores (NMS) in drug procurement and disbursement; (c) the ineffective usage of funds meant for drugs under credit-line, third parties and PHC; and (d) the quality of district-level drug acquisition and delivery mechanisms. Similar expenditure tracking studies also highlight the fact that there are resource leakages especially in the education sector. For instance, the key finding by Ritva et.al. (1996) revealed that on average only 13 percent of the capitation grant (per student) from the central government reached the intended schools. There are also other inefficiencies in the education sector including absenteeism which cannot easily be quantified in this study.
To answer the policy makers concern, this study implements a simulation where all the MDGs are met and this is simultaneously complemented with increased efficiency in both the sectors of education, health, water and sanitation. We assume that in all these sectors total factor productivity

44
improves by 2 percent annually. The implication of this is that this would require less fiscal resources as demonstrated in Figure 34.
Figure 34: Required Spending under Various Financing Scenarios
.
7.8. Domestic Resource Mobilization
For all the previous simulations it has been assumed that there would be no effort to increase domestic revenue mobilization to finance the MDGs. Uganda’s tax reform goals have been fourfold: broaden the tax base; increase efficiency of collection; create incentives for the private sector; and ensure equity of taxation. The tax reforms undertaken were comprehensive and intended to encompass most of the important revenue sources and involved the adoption of new tax codes. The reforms were directed at rationalizing the tax structure and tax rates, widening the tax base, reducing exemptions, and simplifying procedures. A semi-autonomous Uganda Revenue Authority (URA) headed by a Commissioner General was established in 1991 with the view of improving tax administration. The Commissioner General’s independence and powers were enhanced in the URA Amendment Act, 2007. Albeit all these reforms, the taxes collected by Uganda Revenue Authority (URA) have stagnated at 12 percent of GDP. Uganda still relies mostly on indirect taxes for its revenue, particularly those inclined to international trade. This dependence on indirect taxes is mainly due to the fact that income taxes are limited by administrative and because its easier to tax at the border. Part of the reason why Uganda’s tax base is low is because a large section of the economy is untaxed, especially the informal and the commercial agricultural sectors, which complicates efforts to widen the tax base and increase domestic revenue.
Consequently, the tax burden has for long been falling on only a small section of the population that is either in formal employment or own businesses for which tax assessment is easier. It is estimated that the top 35 highest tax payers in the country alone account for about 50 per cent of all the tax revenue, an indication of how narrow the tax base is in the country. This narrow tax base is also aggravated by the high levels of tax evasion and corruption in the tax administration system. The aggregate outcome of these shortcomings is a low growth in domestic revenue compared to the expenditure needs of the growing Ugandan economy.
For all the previous simulations we assume that tax revenues to GDP will only improve from 13 to 15 percent of GDP as indicated in the National Development Plan. In this simulation however, we assume that the government would take deliberate steps to increase its domestic revenue base from the current 13 percent to 19 percent in 2015. As a result it’s found that with increased domestic revenue mobilization coupled with foreign transfers from abroad, the appreciation effects and

45
drastic reduction in export volumes would be mitigated where in this case exports would only reduce by 3 percent. This suggests that for the tradeoffs to be addressed Uganda would have to pursue policies where the burden of financing of MDGs would have to be shared between foreign resources and domestic resources.
8. Analysis of micro simulation results for MDG 1 and inequality
Poverty in this section is defined as the population below the poverty line which is a US $ 1 dollar a day. Under the baseline scenario, poverty would marginally change between the period 2007 and 2010 from 31.98 to 31.86 (Table C1). This is as a result of the marginal changes derived from unemployment, skills, relative wages, average wages and skills effects. The poverty goal for the case of Uganda is to halve poverty from 52 percent in 2005 to 26 percent of the population living below the poverty line by 2015. However, this suggests that the poverty target would not be met under the baseline. While it’s the case that the poverty target has already been met (which is currently estimated at 24.5 percent), we have also witnessed in the past when poverty increased. While poverty reduces marginally, income inequality as measured using the Gini coefficient increases from 0.43 to 0.46 due to largely employment effects.
Focusing on the poverty effects of addressing all the MDGs simultaneously, we find that the some factors influencing poverty changes work in opposite directions. For instance while unemployment effects reduce poverty, sectoral effects on the other hand increase poverty and the net impact on poverty would be marginal. The impact on poverty from other factors like relative and average wages effects is negligible as shown in Table C1. Similar to the baseline, in all cases income inequality as measured by the GINI coefficient would increase slightly from 0.44 to 0.47.
9. Conclusions and policy implications
This work has attempted to answer three important questions. First, if business continues as usual, would Uganda be able to meet its MDG outcomes? Second, if not, how much resources would be required to meet the MDGs? Third, what are the tradeoffs of using the various financing options to meet the MDGs?
With regard to the first question, Uganda would not be able to meet most of the MDGs with the exception of MDG1 which has already been met. According to the recent release of poverty estimates by the UBOS, 23 percent of the population leaves below the poverty line compared to the baseline of 56 percent in 1992/93. This implies that the target of 25 percent of the population below the poverty line has already been met. However, for all the other MDGs under the current spending patterns, it would be impossible to meet the targets before 2015. For the case of primary education there has been some considerable improvement in the enrolment of primary students. Using this indicator, the net enrolment ratio has increased from 86 percent in 2000 to about 93 percent in 2009. However, the other key indicator of students completing their education cycles on time would still be a challenge. Under the simulations it would be very difficult to meet the later indicator referred to as completion rates. Likewise, for the case of child mortality MDG4, it would be a challenge to achieve the target of 56 per 1000 live births by 2015. Lastly achieving the target outcomes of increasing the proportion of the population with improved sources of water and sanitation would not be possible if business continues as usual. The MDGs on gender equality and HIV/AIDS are not considered in this paper owing to the challenges of modelling these MDGs and availability of data.
The above results under the baseline notwithstanding, there are possibilities of reversing and perhaps attaining the MDGs above. This would require considerable scaling up of government spending on education, health, water and sanitation services. The additional spending required depending on the form of financing would range between 11-16 percent of GDP. For the case of primary education, additional increase in recurrent spending would also have to be accompanied by

46
capital expenditures. Likewise, both recurrent and capital spending would have to be increased in tandem to meet the target. The increase for water and sanitation is small compared to health and education given the small size of the sector. From a policy perspective, the question is whether it’s feasible to increase government spending on social services by such a large magnitude to meet the MDGs. Besides, the macro economic framework under the NDP has reoriented its focus to infrastructure spending (especially roads and energy sector) which –according to the MAMS framework would be expected to have a positive synergy over the other MDGs – but maintaining the status quo for the social sectors. In addition, the fiscal deficit within the macro framework is targeted to be less than 5 percent of GDP with spending levels at about 19 percent of GDP compared to 32 percent when all the MDGs are targeted under the foreign financing scenario. This therefore raises a question of whether policy makers would be willing to commit to increase spending to such levels that would be contrary to the existing framework. In some cases, it’s been argued that it’s not necessarily the level of spending for the case of Uganda, but rather the efficiency of spending. For instance for the case of health expenditures, it’s argued that considerable resources allocated to the sector purchase drugs which are about to expire or there are considerable delays to deliver them to the respective health centres. There is also an issue in the balance of spending between recurrent and capital spending. A case in point is where several new health centres have been built but without the requisite needs of personnel or considerable absenteeism.
Another important finding in this study is that the effect of scaling up spending on social sectors to meet the MDGs also depends on the form of financing used. The study implements various forms of financing the MDGs including use of domestic taxes, domestic borrowing, foreign borrowing and foreign transfers. The three financing options provide various trade-offs in form of growth and macroeconomic outcomes. In general, use of domestic resources lead to either lower savings for the private sector if taxes are increased or crowding out effects if domestic borrowing is used. On the other hand, use of foreign resources either through borrowing or transfers lead to strong appreciation effects and low growth in export volumes.
Overall, the study finds that use of foreign grants would be the most preferable option given that it leads to high growth with no implications on fiscal sustainability. The additional spending required is about 10 percent of GDP. The question is whether it would be possible to raise these resources under foreign aid. In light of the above findings, it is inconceivable that the government would be able to scale up spending to the required level in order to meet the MDGs by using domestic taxation or domestic borrowing. For the case of taxation, it would be impossible to increase tax revenues within such a short period given the past performance and the limited tax handles. In addition, using domestic borrowing would also be too costly for the government as domestic interest rate payments would lead to unsustainable fiscal situation.
Domestic resource mobilisation to a large extent has not been has hitherto not been satisfactory. Therefore there is need for increased resource mobilisation through increase tax revenue collection by expanding the tax base and/or reducing tax evasion and this would mitigate some of the tradeoffs as a result of using only foreign resources. The government can also mobilize non-tax revenue from capital markets and from prudently collecting mineral rents. Ultimately, the government needs to be efficient in domestic resource mobilisation not only to get enough revenue to spend but also to be able to reduce over dependence on foreign financing.
Related to resource mobilisation is the need for the government to use resources efficiently. There is need for the government to spend resources mainly on those areas that have the best possibility to lead to economic growth, reduce poverty and improve the welfare of the population, especially the poor. This will involve the reduction of wasteful spending and targeting spending to mainly productive sectors including ensuring that social spending is protected against budget cuts that have sometimes been necessary when the country has faced revenue shortfalls or when there is need to fund some emergency programs. But this may also involve reduction in rent seeking behaviour that has sometimes stymied the delivery of social services especially to the poor and rural areas. This will directly impact positively on the quality of the public services that are delivered mainly to the

47
poor including education, health extension services water etc. It is not enough to deliver public services but it is also important to ensure that these services are of good quality if they are to benefit the population especially the poor.
Another policy that is needed to help accelerate progress to MDGs achievement is affirmative action in the area of public service delivery in terms of offering incentives to attract public servants to the hitherto shunned rural areas. With surveys showing that rural areas find it difficult to attract public servants including teachers, health workers, and extension workers, the government should put measures in place to encourage these officials to these areas either by offering them higher salaries, or through any other type of compensation.
Another policy that might help the welfare of the very poor and impact positively on MDGs is the use of social cash transfers. Social cash transfers have been recognized as an effective response to a range of social and economic problems which arise from livelihood shocks and stresses and programs aim to provide basic social protection to those sections of the population who, for reasons beyond their control, are not able to provide for themselves. People in need of basic social protection usually live in labour-constrained households, that is, households with no adult members fit for productive work. Due to their limited self help capacity, these households cannot access any of the labour-based poverty reduction programs offered by governments or aid organizations. The bulk of households in need of basic social protection are headed by the elderly, widows, children, or individuals who are disabled or chronically sick.
Combining growth strategies with social protection represents one of the surest ways to achieve economic and social development. Such efforts are particularly important especially given that the 7 million chronically poor Ugandans could have a “recoil” effect on the rest of the population impeding economic growth and adversely affecting development outcomes including MDGs.

48
10. Appendices
Table A1: Baseline Macro-Economic Indicators- Growth Rate (Unless otherwise stated) 2007 2008 2009 2010 2011 2012 2013 2014 2015
Absorption 24636.1 9.6 5.4 6.3 6.2 5.0 5.6 5.9 6.0
Consumption - private 16397.4 9.5 6.1 6.4 4.9 4.9 5.1 5.2 5.2
Consumption - government 2341.0 12.8 4.9 8.4 8.9 8.4 8.0 8.2 8.4
Fixed investment - private 4046.7 10.0 6.3 6.9 6.4 6.0 6.2 6.3 6.3
Fixed investment - government 1789.7 9.1 -3 .1 1.0 15.6 -1.6 6.0 8.7 9.3
Stock change 61.3 Eps Eps Eps Eps Eps Eps Eps Eps
Exports 3317.0 -5.4 13.4 9.0 6.0 13.9 12.5 11.8 11.5
Imports 6766.2 4.3 5.1 7.7 2.2 2.6 4.7 5.6 5.8
GDP at factor cost 19184.2 9.6 7.8 8.1 7.9 7.2 7.0 6.8 6.7
Total factor employment (index) 2.7 2.8 3.4 5.6 3.6 3.1 3.2 3.4
Total factor productivity (index) 7.0 4.9 4.7 2.4 3.6 3.9 3.6 3.3
Real exchange rate (index) -5.4 2.7 1.2 0.1 2.5 1.8 1.4 1.3
Direct Taxes 3.7 3.6 3.6 3.6 3.8 3.9 4.1 4.2
Import tariffs 6.4 6.5 6.4 6.4 6.4 6.4 6.4 6.4
Other indirect taxes 3.2 3.1 2.5 3.1 3.5 3.9 4.2 4.6
Private transfers 0.0 0.0 0.0 0.0 0.0 0.0 0.0 0.0
Foreign transfers 4.8 4.3 4.1 4.0 4.0 4.0 4.0 4.0
Domestic borrowing -0.2 -0 .3 0.1 0.4 0.7 1.0 1.4 1.7
Foreign borrowing 3.0 2.5 2.7 2.6 1.3 0.5 0.0 -0.6
Consumption 11.3 11.0 11.1 11.2 11.3 11.3 11.4 11.4
Fixed investment 8.4 7.6 7.2 7.8 7.3 7.3 7.4 7.6
Domestic interest payments 0.9 0.8 0.8 0.8 0.8 0.8 0.9 1.1
Foreign interest payments 0.2 0.2 0.3 0.3 0.3 0.3 0.3 0.2
Total 20.8 19.7 19.4 20.1 19.6 19.7 20.0 20.3
Imports 28.5 28.5 28.6 28.5 28.2 28.1 28.0 27.9
Factor income to RoW 3.1 3.5 4.0 4.3 4.7 5.1 5.4 5.8
Net interest income to RoW 0.2 0.2 0.3 0.3 0.3 0.3 0.3 0.2
Total 31.8 32.2 32.8 33.1 33.2 33.4 33.7 34.0
Exports 12.7 14.0 14.5 15.1 16.5 17.5 18.3 19.1
Private transfers from RoW 6.8 6.8 6.8 6.8 6.8 6.8 6.8 6.8
Offic ial transfers from RoW 4.8 4.3 4.1 4.0 4.0 4.0 4.0 4.0
Factor income from RoW 0.7 0.8 0.8 0.8 0.8 0.8 0.8 0.8
Government borrowing 3.0 2.5 2.7 2.6 1.3 0.5 0.0 -0.6
Private borrowing 0.0 0.0 0.0 0.0 0.0 0.0 0.0 0.0
FDI 3.8 3.8 3.8 3.8 3.8 3.8 3.8 3.8
Total 31.8 32.2 32.8 33.1 33.2 33.4 33.7 34.0
Fiscal Reveneues and Other Receipts (Percent of GDP)
Expendi tures (Percent of GDP)
Ba l a nce of Pa yments (Percent of GDP)

49
Table A2: MDG2 Tax Financing: Macro-economic Indicators- Growth Rate (Unless otherwise stated)
2007 2008 2009 2010 2011 2012 2013 2014 2015
Absorption 24636.13 10.0 6.3 7.9 6.1 4.7 5.4 5.5 5.5
Consumption - private 16397.43 5.0 0.3 -5.1 21.7 8.4 6.2 5.9 5.8
Consumption - government 2341.01 21.2 21.0 32.5 3.2 5.2 4.9 2.5 2.1
Fixed investment - private 4046.72 9.5 6.2 6.9 8.0 6.2 6.2 6.1 6.0
Fixed investment - government 1789.72 46.4 29.5 50.2 -43.7 -24.0 -3.8 6.7 8.9
Stock change 61.25 Eps Eps Eps Eps Eps Eps Eps Eps
Exports 3317.03 -5.37 13.42 8.98 6.00 13.91 12.49 11.81 11.50
Imports 6766.16 4.33 5.08 7.68 2.24 2.61 4.67 5.59 5.81
GDP at factor cost 19184.20 9.61 7.76 8.10 7.93 7.22 7.04 6.76 6.73
Total factor employment (index) 2.65 2.83 3.36 5.57 3.65 3.14 3.17 3.38
Total factor productivity (index) 6.96 4.93 4.74 2.36 3.58 3.90 3.59 3.35
Real exchange rate (index) -5.38 2.67 1.17 0.05 2.50 1.78 1.43 1.28
Direct Taxes 3.92 5.65 7.96 13.07 7.26 5.99 5.56 5.24 4.95
Import tariffs 1.31 6.41 6.46 6.35 6.35 6.35 6.35 6.35 6.35
Other indirect taxes 8.15 4.92 7.24 10.24 6.39 5.46 5.41 5.37 5.37
Private transfers 0.00 0.00 0.00 0.00 0.00 0.00 0.00 0.00 0.00
Foreign transfers 3.99 4.70 4.15 3.83 3.76 3.80 3.82 3.86 3.90
Domestic borrowing 0.23 -0.23 -0.28 0.05 0.38 0.71 1.04 1.36 1.69
Foreign borrowing 3.09 2.96 2.55 2.72 2.57 1.32 0.53 -0.03 -0.57
Total 20.69 24.42 28.08 36.27 26.71 23.64 22.71 22.16 21.70
Consumption 11.05 12.05 13.30 15.95 15.63 15.39 15.08 14.41 13.66
Fixed investment 8.45 11.29 13.77 19.34 10.08 7.21 6.53 6.57 6.75
Domestic interest payments 0.99 0.88 0.79 0.73 0.73 0.77 0.83 0.93 1.05
Foreign interest payments 0.19 0.20 0.23 0.24 0.27 0.27 0.27 0.26 0.24
Total 20.69 24.42 28.08 36.27 26.71 23.64 22.71 22.16 21.70
Imports 31.94 28.36 27.88 27.45 26.93 26.69 26.64 26.82 27.03
Factor income to RoW 2.76 3.07 3.34 3.54 4.06 4.47 4.86 5.25 5.63
Net interest income to RoW 0.20 0.21 0.23 0.25 0.27 0.28 0.28 0.26 0.24
Total 34.89 31.64 31.44 31.23 31.26 31.45 31.78 32.33 32.90
Exports 15.66 12.61 13.38 13.33 13.56 14.92 16.01 17.07 18.13
Private transfers from RoW 6.85 6.85 6.85 6.85 6.85 6.85 6.85 6.85 6.85
Official transfers from RoW 3.99 4.70 4.15 3.83 3.76 3.80 3.82 3.86 3.90
Factor income from RoW 0.78 0.73 0.73 0.72 0.74 0.76 0.78 0.80 0.82
Government borrowing 3.09 2.96 2.55 2.72 2.57 1.32 0.53 -0.03 -0.57
Private borrowing 0.74 0.00 0.00 0.00 0.00 0.00 0.00 0.00 0.00
FDI 3.79 3.79 3.79 3.79 3.79 3.79 3.79 3.79 3.79
Total 34.89 31.64 31.44 31.23 31.26 31.45 31.78 32.33 32.90
Fiscal Reveneues and Other Receipts (Percent of GDP)
Expenditures (Percent of GDP)
Balance of Payments (Percent of GDP)
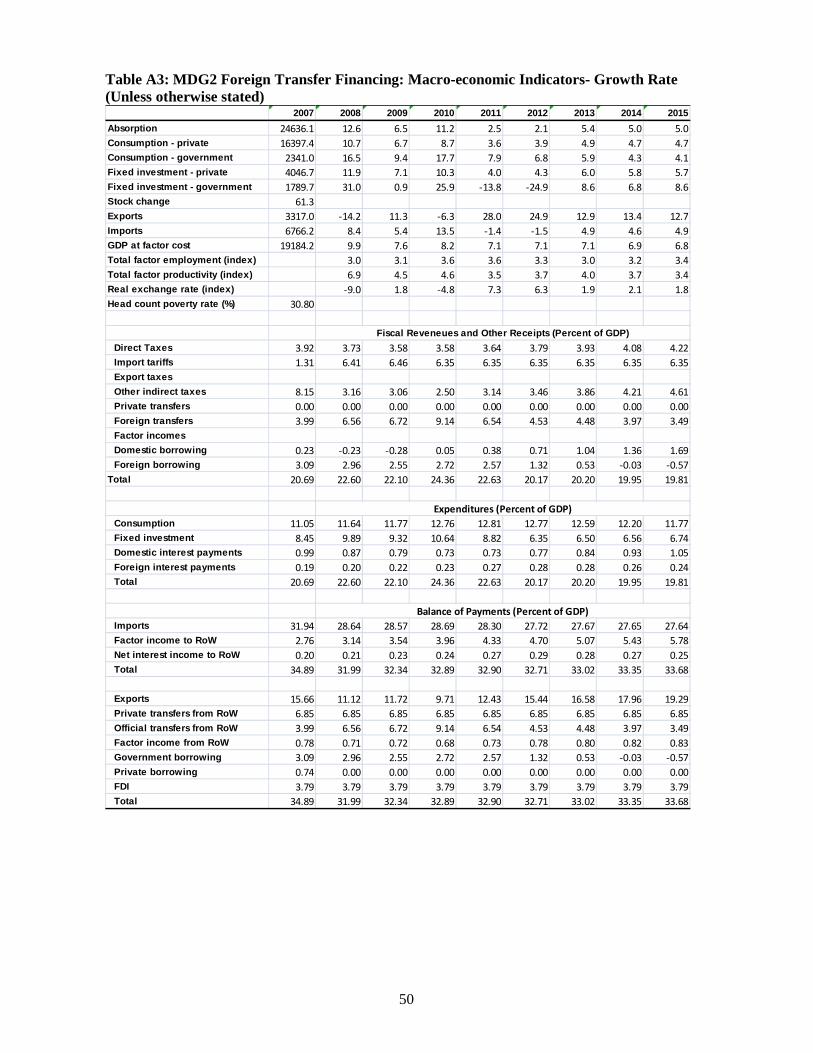
50
Table A3: MDG2 Foreign Transfer Financing: Macro-economic Indicators- Growth Rate (Unless otherwise stated)
2007 2008 2009 2010 2011 2012 2013 2014 2015
Absorption 24636.1 12.6 6.5 11.2 2.5 2.1 5.4 5.0 5.0
Consumption - private 16397.4 10.7 6.7 8.7 3.6 3.9 4.9 4.7 4.7
Consumption - government 2341.0 16.5 9.4 17.7 7.9 6.8 5.9 4.3 4.1
Fixed investment - private 4046.7 11.9 7.1 10.3 4.0 4.3 6.0 5.8 5.7
Fixed investment - government 1789.7 31.0 0.9 25.9 -13.8 -24.9 8.6 6.8 8.6
Stock change 61.3 Eps Eps Eps Eps Eps Eps Eps Eps
Exports 3317.0 -14.2 11.3 -6.3 28.0 24.9 12.9 13.4 12.7
Imports 6766.2 8.4 5.4 13.5 -1.4 -1.5 4.9 4.6 4.9
GDP at factor cost 19184.2 9.9 7.6 8.2 7.1 7.1 7.1 6.9 6.8
Total factor employment (index) 3.0 3.1 3.6 3.6 3.3 3.0 3.2 3.4
Total factor productivity (index) 6.9 4.5 4.6 3.5 3.7 4.0 3.7 3.4
Real exchange rate (index) -9.0 1.8 -4.8 7.3 6.3 1.9 2.1 1.8
Head count poverty rate (%) 30.80
Direct Taxes 3.92 3.73 3.58 3.58 3.64 3.79 3.93 4.08 4.22
Import tariffs 1.31 6.41 6.46 6.35 6.35 6.35 6.35 6.35 6.35
Export taxes
Other indirect taxes 8.15 3.16 3.06 2.50 3.14 3.46 3.86 4.21 4.61
Private transfers 0.00 0.00 0.00 0.00 0.00 0.00 0.00 0.00 0.00
Foreign transfers 3.99 6.56 6.72 9.14 6.54 4.53 4.48 3.97 3.49
Factor incomes
Domestic borrowing 0.23 -0.23 -0.28 0.05 0.38 0.71 1.04 1.36 1.69
Foreign borrowing 3.09 2.96 2.55 2.72 2.57 1.32 0.53 -0.03 -0.57
Total 20.69 22.60 22.10 24.36 22.63 20.17 20.20 19.95 19.81
Consumption 11.05 11.64 11.77 12.76 12.81 12.77 12.59 12.20 11.77
Fixed investment 8.45 9.89 9.32 10.64 8.82 6.35 6.50 6.56 6.74
Domestic interest payments 0.99 0.87 0.79 0.73 0.73 0.77 0.84 0.93 1.05
Foreign interest payments 0.19 0.20 0.22 0.23 0.27 0.28 0.28 0.26 0.24
Total 20.69 22.60 22.10 24.36 22.63 20.17 20.20 19.95 19.81
Imports 31.94 28.64 28.57 28.69 28.30 27.72 27.67 27.65 27.64
Factor income to RoW 2.76 3.14 3.54 3.96 4.33 4.70 5.07 5.43 5.78
Net interest income to RoW 0.20 0.21 0.23 0.24 0.27 0.29 0.28 0.27 0.25
Total 34.89 31.99 32.34 32.89 32.90 32.71 33.02 33.35 33.68
Exports 15.66 11.12 11.72 9.71 12.43 15.44 16.58 17.96 19.29
Private transfers from RoW 6.85 6.85 6.85 6.85 6.85 6.85 6.85 6.85 6.85
Official transfers from RoW 3.99 6.56 6.72 9.14 6.54 4.53 4.48 3.97 3.49
Factor income from RoW 0.78 0.71 0.72 0.68 0.73 0.78 0.80 0.82 0.83
Government borrowing 3.09 2.96 2.55 2.72 2.57 1.32 0.53 -0.03 -0.57
Private borrowing 0.74 0.00 0.00 0.00 0.00 0.00 0.00 0.00 0.00
FDI 3.79 3.79 3.79 3.79 3.79 3.79 3.79 3.79 3.79
Total 34.89 31.99 32.34 32.89 32.90 32.71 33.02 33.35 33.68
Fiscal Reveneues and Other Receipts (Percent of GDP)
Expenditures (Percent of GDP)
Balance of Payments (Percent of GDP)

51
Table A4: MDG2 Foreign Borrowing Financing: Macro-economic Indicators Growth Rate (Unless otherwise stated)
2007 2008 2009 2010 2011 2012 2013 2014 2015
Absorption 24636.1 12.6 6.5 11.2 2.5 2.1 5.4 5.0 5.0
Consumption - private 16397.4 10.7 6.7 8.7 3.6 3.9 4.9 4.7 4.7
Consumption - government 2341.0 16.5 9.4 17.7 7.9 6.8 5.9 4.3 4.1
Fixed investment - private 4046.7 11.9 7.1 10.3 4.0 4.3 6.0 5.8 5.7
Fixed investment - government 1789.7 31.0 0.9 25.9 -13.8 -24.9 8.6 6.8 8.6
Stock change 61.3 Eps Eps Eps Eps Eps Eps Eps Eps
Exports 3317.0 -14.2 11.3 -6.3 28.0 24.9 12.9 13.4 12.7
Imports 6766.2 8.4 5.4 13.5 -1.4 -1.5 4.9 4.6 4.9
GDP at factor cost 19184.2 9.9 7.6 8.2 7.1 7.1 7.1 6.9 6.8
Total factor employment (index) 3.0 3.1 3.6 3.6 3.3 3.0 3.2 3.4
Total factor productivity (index) 6.9 4.5 4.6 3.5 3.7 4.0 3.7 3.4
Real exchange rate (index) -9.0 1.8 -4.8 7.3 6.3 1.9 2.1 1.8
Direct Taxes 3.92 3.73 3.58 3.58 3.64 3.79 3.93 4.08 4.22
Import tariffs 1.31 6.41 6.46 6.35 6.35 6.35 6.35 6.35 6.35
Other indirect taxes 8.15 3.16 3.06 2.50 3.14 3.46 3.86 4.21 4.61
Private transfers 0.00 0.00 0.00 0.00 0.00 0.00 0.00 0.00 0.00
Foreign transfers 3.99 4.57 4.08 3.64 3.73 3.88 3.89 3.94 3.98
Domestic borrowing 0.23 -0.23 -0.28 0.05 0.38 0.71 1.04 1.36 1.69
Foreign borrowing 3.09 4.98 5.24 8.35 5.54 2.16 1.30 0.17 -0.90
Total 20.69 22.63 22.16 24.49 22.80 20.35 20.38 20.13 19.97
Consumption 11.05 11.64 11.77 12.76 12.81 12.77 12.59 12.20 11.77
Fixed investment 8.45 9.89 9.32 10.64 8.82 6.35 6.50 6.56 6.74
Domestic interest payments 0.99 0.87 0.79 0.73 0.73 0.77 0.84 0.93 1.05
Foreign interest payments 0.19 0.23 0.28 0.36 0.44 0.46 0.46 0.44 0.41
Total 20.69 22.63 22.16 24.49 22.80 20.35 20.38 20.13 19.97
Imports 31.94 28.64 28.57 28.69 28.30 27.72 27.67 27.65 27.64
Factor income to RoW 2.76 3.14 3.54 3.96 4.33 4.70 5.07 5.43 5.78
Net interest income to RoW 0.20 0.23 0.29 0.37 0.44 0.47 0.46 0.44 0.41
Total 34.89 32.02 32.40 33.02 33.07 32.89 33.20 33.52 33.84
Exports 15.66 11.12 11.72 9.71 12.43 15.44 16.58 17.96 19.29
Private transfers from RoW 6.85 6.85 6.85 6.85 6.85 6.85 6.85 6.85 6.85
Official transfers from RoW 3.99 4.57 4.08 3.64 3.73 3.88 3.89 3.94 3.98
Factor income from RoW 0.78 0.71 0.72 0.68 0.73 0.78 0.80 0.82 0.83
Government borrowing 3.09 4.98 5.24 8.35 5.54 2.16 1.30 0.17 -0.90
Private borrowing 0.74 0.00 0.00 0.00 0.00 0.00 0.00 0.00 0.00
FDI 3.79 3.79 3.79 3.79 3.79 3.79 3.79 3.79 3.79
Total 34.89 32.02 32.40 33.02 33.07 32.89 33.20 33.52 33.84
Fiscal Reveneues and Other Receipts (Percent of GDP)
Expenditures (Percent of GDP)
Balance of Payments (Percent of GDP)

52
Table A5: MDG2 Domestic Borrowing Financing: Macro-economic Indicators -Growth Rate (Unless otherwise stated)
2007 2008 2009 2010 2011 2012 2013 2014 2015
Absorption 24636.1 9.9 6.2 7.7 6.4 4.9 5.5 5.5 5.5
Consumption - private 16397.4 4.8 -0.1 -5.9 23.0 8.4 6.6 6.0 5.9
Consumption - government 2341.0 21.2 21.2 32.6 3.1 5.2 4.9 2.5 2.0
Fixed investment - private 4046.7 10.2 7.2 8.3 6.7 5.8 6.0 5.9 5.8
Fixed investment - government 1789.7 45.3 30.0 50.8 -43.7 -22.2 -5.4 6.4 8.9
Stock change 61.3 Eps Eps Eps Eps Eps Eps Eps Eps
Exports 3317.0 -3.9 15.6 12.1 2.7 12.8 12.0 11.5 11.2
Imports 6766.2 4.1 4.9 7.3 2.9 2.9 4.7 5.7 5.9
GDP at factor cost 19184.2 9.8 8.1 8.6 7.5 7.1 7.0 6.8 6.7
Total factor employment (index) 2.9 3.2 3.9 5.1 3.5 3.1 3.2 3.4
Total factor productivity (index) 6.9 4.9 4.7 2.5 3.6 3.9 3.6 3.4
Real exchange rate (index) -4.9 3.4 2.2 -1.1 2.1 1.6 1.3 1.2
Direct Taxes 3.92 3.73 3.58 3.58 3.64 3.79 3.93 4.08 4.22
Import tariffs 1.31 6.41 6.46 6.35 6.35 6.35 6.35 6.35 6.35
Other indirect taxes 8.15 3.16 3.06 2.50 3.14 3.46 3.86 4.21 4.61
Private transfers 0.00 0.00 0.00 0.00 0.00 0.00 0.00 0.00 0.00
Foreign transfers 3.99 4.78 4.31 4.11 3.87 3.86 3.86 3.88 3.91
Domestic borrowing 0.23 4.25 11.45 25.47 18.93 20.18 23.03 26.69 31.00
Foreign borrowing 3.09 2.96 2.55 2.72 2.57 1.32 0.53 -0.03 -0.57
Total 20.69 25.30 31.41 44.74 38.50 38.97 41.57 45.19 49.53
Consumption 11.05 12.15 13.58 16.60 15.87 15.53 15.16 14.45 13.67
Fixed investment 8.45 11.13 13.50 18.80 9.92 7.30 6.51 6.54 6.73
Domestic interest payments 0.99 1.81 4.10 9.09 12.44 15.87 19.63 23.95 28.90
Foreign interest payments 0.19 0.21 0.23 0.26 0.27 0.27 0.27 0.25 0.23
Total 20.69 25.30 31.41 44.74 38.50 38.97 41.57 45.19 49.53
Imports 31.94 28.78 28.87 29.26 27.68 27.18 27.00 27.09 27.21
Factor income to RoW 2.76 3.14 3.53 3.94 4.26 4.62 4.98 5.35 5.70
Net interest income to RoW 0.20 0.21 0.24 0.26 0.27 0.28 0.27 0.26 0.24
Total 34.89 32.14 32.64 33.47 32.22 32.07 32.26 32.70 33.15
Exports 15.66 13.02 14.38 15.23 14.39 15.48 16.44 17.40 18.36
Private transfers from RoW 6.85 6.85 6.85 6.85 6.85 6.85 6.85 6.85 6.85
Official transfers from RoW 3.99 4.78 4.31 4.11 3.87 3.86 3.86 3.88 3.91
Factor income from RoW 0.78 0.74 0.76 0.77 0.76 0.78 0.79 0.80 0.82
Government borrowing 3.09 2.96 2.55 2.72 2.57 1.32 0.53 -0.03 -0.57
Private borrowing 0.74 0.00 0.00 0.00 0.00 0.00 0.00 0.00 0.00
FDI 3.79 3.79 3.79 3.79 3.79 3.79 3.79 3.79 3.79
Total 34.89 32.14 32.64 33.47 32.22 32.07 32.26 32.70 33.15
Fiscal Reveneues and Other Receipts (Percent of GDP)
Expenditures (Percent of GDP)
Balance of Payments (Percent of GDP)

53
Table A6: MDG45 Tax Financing: Macro-economic Indicators -Growth Rate (Unless otherwise stated)
2007 2008 2009 2010 2011 2012 2013 2014 2015
Absorption 24636.1 9.6 5.4 6.4 6.3 5.0 5.6 5.9 6.0
Consumption - private 16397.4 7.8 3.3 5.7 4.9 3.8 2.3 2.4 2.7
Consumption - government 2341.0 14.8 9.9 11.8 11.9 11.7 12.7 13.2 13.5
Fixed investment - private 4046.7 9.7 6.0 7.0 6.4 5.8 5.9 6.0 5.9
Fixed investment - government 1789.7 23.3 15.7 3.7 9.2 3.3 17.8 17.6 13.9
Stock change 61.3 Eps Eps Eps Eps Eps Eps Eps Eps
Exports 3317.0 -5.5 14.2 9.0 9.5 13.5 11.4 10.2 9.7
Imports 6766.2 3.7 4.5 5.6 5.6 3.6 5.1 5.7 5.6
GDP at factor cost 19184.2 9.4 7.1 7.2 7.2 7.1 6.9 7.0 7.0
Total factor employment (index) 2.9 2.8 3.4 3.4 3.5 3.4 3.9 4.3
Total factor productivity (index) 6.5 4.2 3.8 3.9 3.6 3.5 3.1 2.7
Real exchange rate (index) -5.4 2.9 1.2 1.0 2.3 1.4 1.0 0.9
Direct Taxes 3.92 4.42 5.38 5.86 5.73 6.20 7.13 8.00 8.67
Import tariffs 1.31 6.41 6.46 6.35 6.35 6.35 6.35 6.35 6.35
Other indirect taxes 8.15 3.78 4.73 4.20 5.07 5.84 7.32 8.77 10.16
Private transfers 0.00 0.00 0.00 0.00 0.00 0.00 0.00 0.00 0.00
Foreign transfers 3.99 4.75 4.27 4.09 3.92 3.90 3.86 3.83 3.79
Domestic borrowing 0.23 -0.23 -0.28 0.05 0.38 0.71 1.04 1.36 1.69
Foreign borrowing 3.09 2.96 2.55 2.72 2.57 1.32 0.53 -0.03 -0.57
Total 20.69 22.09 23.11 23.28 24.03 24.34 26.24 28.29 30.10
Consumption 11.05 11.51 11.73 12.24 12.71 13.23 13.97 14.71 15.50
Fixed investment 8.45 9.49 10.35 10.03 10.29 10.04 11.17 12.40 13.33
Domestic interest payments 0.99 0.88 0.80 0.76 0.75 0.78 0.84 0.93 1.05
Foreign interest payments 0.19 0.21 0.23 0.25 0.27 0.28 0.27 0.25 0.23
Total 20.69 22.09 23.11 23.28 24.03 24.34 26.24 28.29 30.10
Imports 31.94 28.49 28.36 28.39 28.10 27.70 27.32 26.99 26.65
Factor income to RoW 2.76 3.12 3.48 3.89 4.22 4.55 4.82 5.08 5.31
Net interest income to RoW 0.20 0.21 0.24 0.26 0.28 0.28 0.27 0.26 0.23
Total 34.89 31.82 32.07 32.54 32.61 32.53 32.41 32.33 32.19
Exports 15.66 12.73 13.86 14.33 14.71 15.88 16.60 17.10 17.54
Private transfers from RoW 6.85 6.85 6.85 6.85 6.85 6.85 6.85 6.85 6.85
Official transfers from RoW 3.99 4.75 4.27 4.09 3.92 3.90 3.86 3.83 3.79
Factor income from RoW 0.78 0.74 0.75 0.77 0.77 0.79 0.79 0.79 0.79
Government borrowing 3.09 2.96 2.55 2.72 2.57 1.32 0.53 -0.03 -0.57
Private borrowing 0.74 0.00 0.00 0.00 0.00 0.00 0.00 0.00 0.00
FDI 3.79 3.79 3.79 3.79 3.79 3.79 3.79 3.79 3.79
Total 34.89 31.82 32.07 32.54 32.61 32.53 32.41 32.33 32.19
Fiscal Reveneues and Other Receipts (Percent of GDP)
Expenditures (Percent of GDP)
Balance of Payments (Percent of GDP)

54
Table A7: MDG45 Foreign Transfers Financing: Macro-economic Indicators -Growth Rate (Unless otherwise stated)
2007 2008 2009 2010 2011 2012 2013 2014 2015
Absorption 24636.1 11.3 8.0 7.1 6.4 6.0 7.7 8.0 7.9
Consumption - private 16397.4 10.1 7.1 6.8 5.1 5.3 5.9 6.1 6.0
Consumption - government 2341.0 14.3 9.0 11.5 11.7 11.4 11.9 12.3 12.7
Fixed investment - private 4046.7 11.0 8.0 7.5 6.7 6.6 7.7 7.8 7.6
Fixed investment - government 1789.7 23.3 14.6 4.0 9.5 3.1 15.8 16.0 13.8
Stock change 61.3 Eps Eps Eps Eps Eps Eps Eps Eps
Exports 3317.0 -10.7 5.2 7.0 10.3 11.7 5.9 5.2 5.9
Imports 6766.2 6.4 8.5 6.7 5.6 4.9 8.2 8.6 8.3
GDP at factor cost 19184.2 9.6 7.5 7.4 7.3 7.3 7.3 7.5 7.6
Total factor employment (index) 3.0 3.1 3.5 3.4 3.6 3.7 4.2 4.7
Total factor productivity (index) 6.6 4.4 3.9 3.9 3.7 3.7 3.3 2.9
Real exchange rate (index) -7.5 -0.5 0.3 1.1 1.4 -1.0 -1.2 -1.0
Direct Taxes 3.92 3.73 3.58 3.58 3.64 3.79 3.93 4.08 4.22
Import tariffs 1.31 6.41 6.46 6.35 6.35 6.35 6.35 6.35 6.35
Other indirect taxes 8.15 3.16 3.06 2.50 3.14 3.46 3.86 4.21 4.61
Private transfers 0.00 0.00 0.00 0.00 0.00 0.00 0.00 0.00 0.00
Foreign transfers 3.99 5.88 7.16 7.44 7.33 8.01 9.35 10.58 11.63
Domestic borrowing 0.23 -0.23 -0.28 0.05 0.38 0.71 1.04 1.36 1.69
Foreign borrowing 3.09 2.96 2.55 2.72 2.57 1.32 0.53 -0.03 -0.57
Total 20.69 21.92 22.54 22.66 23.42 23.65 25.06 26.56 27.94
Consumption 11.05 11.46 11.57 12.04 12.54 13.06 13.72 14.37 15.03
Fixed investment 8.45 9.38 9.96 9.63 9.88 9.55 10.27 11.05 11.68
Domestic interest payments 0.99 0.87 0.79 0.74 0.74 0.76 0.82 0.91 1.02
Foreign interest payments 0.19 0.20 0.22 0.24 0.26 0.27 0.25 0.23 0.21
Total 20.69 21.92 22.54 22.66 23.42 23.65 25.06 26.56 27.94
Imports 31.94 28.63 28.74 28.81 28.59 28.33 28.21 28.14 28.06
Factor income to RoW 2.76 3.15 3.55 3.98 4.34 4.70 5.04 5.38 5.69
Net interest income to RoW 0.20 0.21 0.23 0.25 0.27 0.27 0.26 0.24 0.21
Total 34.89 31.98 32.52 33.04 33.20 33.30 33.51 33.75 33.96
Exports 15.66 11.78 11.46 11.52 11.94 12.60 12.27 11.86 11.56
Private transfers from RoW 6.85 6.85 6.85 6.85 6.85 6.85 6.85 6.85 6.85
Official transfers from RoW 3.99 5.88 7.16 7.44 7.33 8.01 9.35 10.58 11.63
Factor income from RoW 0.78 0.72 0.72 0.72 0.73 0.74 0.73 0.72 0.71
Government borrowing 3.09 2.96 2.55 2.72 2.57 1.32 0.53 -0.03 -0.57
Private borrowing 0.74 0.00 0.00 0.00 0.00 0.00 0.00 0.00 0.00
FDI 3.79 3.79 3.79 3.79 3.79 3.79 3.79 3.79 3.79
Total 34.89 31.98 32.52 33.04 33.20 33.30 33.51 33.75 33.96
Fiscal Reveneues and Other Receipts (Percent of GDP)
Expenditures (Percent of GDP)
Balance of Payments (Percent of GDP)

55
Table A8: MDG45 Foreign Borrowing: Macro-economic Indicators -Growth Rate (Unless otherwise stated)
2007 2008 2009 2010 2011 2012 2013 2014 2015
Absorption 24636.1 11.3 8.0 7.1 6.4 6.0 7.7 8.0 7.9
Consumption - private 16397.4 10.1 7.1 6.8 5.1 5.3 5.9 6.1 6.0
Consumption - government 2341.0 14.3 9.0 11.5 11.7 11.4 11.9 12.3 12.7
Fixed investment - private 4046.7 11.0 8.0 7.5 6.7 6.6 7.7 7.8 7.6
Fixed investment - government 1789.7 23.3 14.6 4.0 9.5 3.1 15.8 16.0 13.8
Stock change 61.3 Eps Eps Eps Eps Eps Eps Eps Eps
Exports 3317.0 -10.7 5.2 7.0 10.3 11.7 5.9 5.2 5.9
Imports 6766.2 6.4 8.5 6.7 5.6 4.9 8.2 8.6 8.3
GDP at factor cost 19184.2 9.6 7.5 7.4 7.3 7.3 7.3 7.5 7.6
Total factor employment (index) 3.0 3.1 3.5 3.4 3.6 3.7 4.2 4.7
Total factor productivity (index) 6.6 4.4 3.9 3.9 3.7 3.7 3.3 2.9
Real exchange rate (index) -7.5 -0.5 0.3 1.1 1.4 -1.0 -1.2 -1.0
Head count poverty rate (%) 30.8
Direct Taxes 3.92 3.73 3.58 3.58 3.64 3.79 3.93 4.08 4.22
Import tariffs 1.31 6.41 6.46 6.35 6.35 6.35 6.35 6.35 6.35
Other indirect taxes 8.15 3.16 3.06 2.50 3.14 3.46 3.86 4.21 4.61
Private transfers 0.00 0.00 0.00 0.00 0.00 0.00 0.00 0.00 0.00
Foreign transfers 3.99 4.66 4.07 3.85 3.70 3.66 3.55 3.46 3.37
Domestic borrowing 0.23 -0.23 -0.28 0.05 0.38 0.71 1.04 1.36 1.69
Foreign borrowing 3.09 4.20 5.70 6.41 6.34 5.87 6.58 7.43 8.11
Total 20.69 21.93 22.60 22.76 23.56 23.84 25.32 26.90 28.37
Consumption 11.05 11.46 11.57 12.04 12.54 13.06 13.72 14.37 15.03
Fixed investment 8.45 9.38 9.96 9.63 9.88 9.55 10.27 11.05 11.68
Domestic interest payments 0.99 0.87 0.79 0.74 0.74 0.76 0.82 0.91 1.02
Foreign interest payments 0.19 0.22 0.28 0.35 0.41 0.46 0.51 0.57 0.63
Total 20.69 21.93 22.60 22.76 23.56 23.84 25.32 26.90 28.37
Imports 31.94 28.63 28.74 28.81 28.59 28.33 28.21 28.14 28.06
Factor income to RoW 2.76 3.15 3.55 3.98 4.34 4.70 5.04 5.38 5.69
Net interest income to RoW 0.20 0.23 0.28 0.35 0.42 0.47 0.52 0.58 0.64
Total 34.89 32.00 32.58 33.14 33.34 33.50 33.77 34.09 34.39
Exports 15.66 11.78 11.46 11.52 11.94 12.60 12.27 11.86 11.56
Private transfers from RoW 6.85 6.85 6.85 6.85 6.85 6.85 6.85 6.85 6.85
Official transfers from RoW 3.99 4.66 4.07 3.85 3.70 3.66 3.55 3.46 3.37
Factor income from RoW 0.78 0.72 0.72 0.72 0.73 0.74 0.73 0.72 0.71
Government borrowing 3.09 4.20 5.70 6.41 6.34 5.87 6.58 7.43 8.11
Private borrowing 0.74 0.00 0.00 0.00 0.00 0.00 0.00 0.00 0.00
FDI 3.79 3.79 3.79 3.79 3.79 3.79 3.79 3.79 3.79
Total 34.89 32.00 32.58 33.14 33.34 33.50 33.77 34.09 34.39
Fiscal Reveneues and Other Receipts (Percent of GDP)
Expenditures (Percent of GDP)
Balance of Payments (Percent of GDP)

56
Table A9: MDG45 Domestic Borrowing Financing: Macro-economic Indicators -Growth Rate (Unless otherwise stated)
2007 2008 2009 2010 2011 2012 2013 2014 2015
Absorption 24636.1 9.6 5.4 6.4 6.3 5.0 5.6 5.9 6.0
Consumption - private 16397.4 7.7 3.2 5.7 4.9 3.7 2.2 2.2 2.6
Consumption - government 2341.0 14.7 9.9 11.8 11.9 11.7 12.7 13.1 13.5
Fixed investment - private 4046.7 9.9 6.4 7.1 6.6 6.2 6.6 6.7 6.6
Fixed investment - government 1789.7 22.9 15.6 3.9 9.2 2.8 17.7 17.8 13.9
Stock change 61.3 Eps Eps Eps Eps Eps Eps Eps Eps
Exports 3317.0 -4.9 15.2 9.1 9.7 13.6 12.1 10.9 10.4
Imports 6766.2 3.6 4.4 5.6 5.6 3.6 5.2 5.7 5.7
GDP at factor cost 19184.2 9.5 7.2 7.2 7.3 7.2 7.1 7.1 7.2
Total factor employment (index) 2.9 3.0 3.4 3.4 3.5 3.5 4.0 4.5
Total factor productivity (index) 6.5 4.2 3.8 3.9 3.6 3.5 3.1 2.7
Real exchange rate (index) -5.2 3.2 1.2 1.1 2.3 1.5 1.1 1.0
Head count poverty rate (%) 30.8
Direct Taxes 3.92 3.73 3.58 3.58 3.64 3.79 3.93 4.08 4.22
Import tariffs 1.31 6.41 6.46 6.35 6.35 6.35 6.35 6.35 6.35
Other indirect taxes 8.15 3.16 3.06 2.50 3.14 3.46 3.86 4.21 4.61
Private transfers 0.00 0.00 0.00 0.00 0.00 0.00 0.00 0.00 0.00
Foreign transfers 3.99 4.78 4.34 4.15 3.99 3.98 3.97 3.96 3.95
Factor incomes
Domestic borrowing 0.23 1.35 4.39 6.53 8.40 11.49 16.51 22.48 29.21
Foreign borrowing 3.09 2.96 2.55 2.72 2.57 1.32 0.53 -0.03 -0.57
Total 20.69 22.40 24.38 25.84 28.10 30.40 35.15 41.05 47.78
Consumption 11.05 11.54 11.81 12.33 12.82 13.41 14.24 15.10 15.99
Fixed investment 8.45 9.44 10.25 9.95 10.19 9.86 10.89 12.03 12.85
Domestic interest payments 0.99 1.21 2.08 3.31 4.81 6.85 9.75 13.67 18.71
Foreign interest payments 0.19 0.21 0.23 0.26 0.28 0.28 0.27 0.26 0.23
Total 20.69 22.40 24.38 25.84 28.10 30.40 35.15 41.05 47.78
Imports 31.94 28.64 28.76 28.80 28.55 28.21 28.04 27.93 27.77
Factor income to RoW 2.76 3.15 3.55 3.98 4.34 4.70 5.06 5.40 5.73
Net interest income to RoW 0.20 0.21 0.24 0.26 0.28 0.29 0.28 0.26 0.24
Total 34.89 32.00 32.55 33.04 33.17 33.19 33.38 33.60 33.74
Exports 15.66 12.88 14.27 14.76 15.20 16.46 17.43 18.22 18.91
Private transfers from RoW 6.85 6.85 6.85 6.85 6.85 6.85 6.85 6.85 6.85
Official transfers from RoW 3.99 4.78 4.34 4.15 3.99 3.98 3.97 3.96 3.95
Factor income from RoW 0.78 0.74 0.77 0.78 0.78 0.80 0.81 0.82 0.83
Government borrowing 3.09 2.96 2.55 2.72 2.57 1.32 0.53 -0.03 -0.57
Private borrowing 0.74 0.00 0.00 0.00 0.00 0.00 0.00 0.00 0.00
FDI 3.79 3.79 3.79 3.79 3.79 3.79 3.79 3.79 3.79
Total 34.89 32.00 32.55 33.04 33.17 33.19 33.38 33.60 33.74
Fiscal Reveneues and Other Receipts (Percent of GDP)
Expenditures (Percent of GDP)
Balance of Payments (Percent of GDP)

57
Table A10: MDG7a Tax Financing: Macro-economic Indicators -Growth Rate (Unless otherwise stated)
2007 2008 2009 2010 2011 2012 2013 2014 2015
Absorption 24636.1 9.6 5.5 6.5 6.4 5.2 5.8 6.2 6.2
Consumption - private 16397.4 9.3 5.5 6.0 4.4 4.4 4.5 4.6 4.5
Consumption - government 2341.0 13.7 7.9 11.3 12.3 11.9 11.5 11.7 11.9
Fixed investment - private 4046.7 10.0 6.3 7.0 6.4 6.0 6.2 6.3 6.3
Fixed investment - government 1789.7 10.7 0.1 3.1 16.6 0.3 7.2 9.6 10.1
Stock change 61.3 Eps Eps Eps Eps Eps Eps Eps Eps
Exports 3317.0 -5.7 14.0 9.2 10.1 13.7 11.7 10.6 10.3
Imports 6766.2 3.4 4.1 5.7 5.8 3.7 5.0 5.6 5.7
GDP at factor cost 19184.2 9.5 7.3 7.3 7.4 7.4 7.4 7.4 7.4
Total factor employment (index) 2.9 2.7 3.0 3.0 3.3 3.3 3.5 3.7
Total factor productivity (index) 6.6 4.6 4.3 4.4 4.1 4.1 3.9 3.6
Real exchange rate (index) -5.5 2.9 1.2 1.2 2.4 1.6 1.1 1.0
Direct Taxes 3.92 3.84 3.98 4.27 4.51 4.87 5.21 5.55 5.88
Import tariffs 1.31 6.41 6.46 6.35 6.35 6.35 6.35 6.35 6.35
Other indirect taxes 8.15 3.26 3.41 2.99 3.91 4.49 5.17 5.80 6.51
Private transfers 0.00 0.00 0.00 0.00 0.00 0.00 0.00 0.00 0.00
Foreign transfers 3.99 4.76 4.30 4.11 3.95 3.93 3.92 3.90 3.89
Domestic borrowing 0.23 -0.23 -0.28 0.05 0.38 0.71 1.04 1.36 1.69
Foreign borrowing 3.09 2.96 2.55 2.72 2.57 1.32 0.53 -0.03 -0.57
Total 20.69 21.01 20.43 20.50 21.67 21.68 22.22 22.94 23.75
Consumption 11.05 11.42 11.40 11.78 12.20 12.63 13.04 13.45 13.87
Fixed investment 8.45 8.50 8.00 7.71 8.45 8.00 8.07 8.31 8.61
Domestic interest payments 0.99 0.88 0.80 0.76 0.75 0.78 0.84 0.93 1.05
Foreign interest payments 0.19 0.21 0.23 0.26 0.27 0.28 0.27 0.25 0.23
Total 20.69 21.01 20.43 20.50 21.67 21.68 22.22 22.94 23.75
Imports 31.94 28.47 28.36 28.41 28.21 27.85 27.59 27.39 27.20
Factor income to RoW 2.76 3.14 3.53 3.94 4.29 4.63 4.97 5.29 5.59
Net interest income to RoW 0.20 0.21 0.24 0.26 0.28 0.28 0.28 0.26 0.24
Total 34.89 31.82 32.13 32.61 32.78 32.77 32.83 32.94 33.02
Exports 15.66 12.72 13.88 14.38 14.85 16.08 16.95 17.63 18.26
Private transfers from RoW 6.85 6.85 6.85 6.85 6.85 6.85 6.85 6.85 6.85
Official transfers from RoW 3.99 4.76 4.30 4.11 3.95 3.93 3.92 3.90 3.89
Factor income from RoW 0.78 0.74 0.76 0.77 0.78 0.79 0.80 0.81 0.81
Government borrowing 3.09 2.96 2.55 2.72 2.57 1.32 0.53 -0.03 -0.57
Private borrowing 0.74 0.00 0.00 0.00 0.00 0.00 0.00 0.00 0.00
FDI 3.79 3.79 3.79 3.79 3.79 3.79 3.79 3.79 3.79
Total 34.89 31.82 32.13 32.61 32.78 32.77 32.83 32.94 33.02
Fiscal Reveneues and Other Receipts (Percent of GDP)
Expenditures (Percent of GDP)
Balance of Payments (Percent of GDP)

58
Table A11: MDG7a Foreign Transfer Financing: Macro-economic Indicators -Growth Rate (Unless otherwise stated)
2007 2008 2009 2010 2011 2012 2013 2014 2015
Absorption 24636.1 9.9 6.2 7.0 7.0 5.8 6.4 6.8 6.8
Consumption - private 16397.4 9.6 6.5 6.7 5.3 5.2 5.4 5.6 5.5
Consumption - government 2341.0 13.6 7.5 11.0 12.0 11.7 11.3 11.4 11.6
Fixed investment - private 4046.7 10.2 6.8 7.3 6.8 6.4 6.7 6.8 6.7
Fixed investment - government 1789.7 11.2 0.6 3.3 16.4 0.4 7.2 9.7 10.3
Stock change 61.3 Eps Eps Eps Eps Eps Eps Eps Eps
Exports 3317.0 -6.7 11.6 7.6 8.6 12.5 10.7 9.5 9.3
Imports 6766.2 3.9 5.2 6.5 6.6 4.5 5.8 6.4 6.6
GDP at factor cost 19184.2 9.6 7.4 7.4 7.5 7.5 7.5 7.5 7.6
Total factor employment (index) 2.9 2.8 3.1 3.1 3.4 3.4 3.7 3.9
Total factor productivity (index) 6.6 4.6 4.3 4.4 4.1 4.1 3.9 3.6
Real exchange rate (index) -5.9 2.0 0.6 0.6 1.9 1.1 0.6 0.5
Direct Taxes 3.92 3.73 3.58 3.58 3.64 3.79 3.93 4.08 4.22
Import tariffs 1.31 6.41 6.46 6.35 6.35 6.35 6.35 6.35 6.35
Other indirect taxes 8.15 3.16 3.06 2.50 3.14 3.46 3.86 4.21 4.61
Private transfers 0.00 0.00 0.00 0.00 0.00 0.00 0.00 0.00 0.00
Foreign transfers 3.99 4.97 5.02 5.21 5.43 5.84 6.24 6.63 7.04
Domestic borrowing 0.23 -0.23 -0.28 0.05 0.38 0.71 1.04 1.36 1.69
Foreign borrowing 3.09 2.96 2.55 2.72 2.57 1.32 0.53 -0.03 -0.57
Total 20.69 21.01 20.39 20.42 21.51 21.48 21.95 22.61 23.35
Consumption 11.05 11.40 11.35 11.70 12.09 12.50 12.88 13.26 13.63
Fixed investment 8.45 8.52 8.02 7.72 8.41 7.94 7.98 8.19 8.46
Domestic interest payments 0.99 0.88 0.80 0.75 0.74 0.77 0.83 0.92 1.04
Foreign interest payments 0.19 0.21 0.23 0.25 0.27 0.27 0.26 0.25 0.22
Total 20.69 21.01 20.39 20.42 21.51 21.48 21.95 22.61 23.35
Imports 31.94 28.50 28.47 28.57 28.46 28.21 28.05 27.96 27.88
Factor income to RoW 2.76 3.14 3.54 3.97 4.33 4.70 5.05 5.40 5.73
Net interest income to RoW 0.20 0.21 0.24 0.26 0.28 0.28 0.27 0.25 0.23
Total 34.89 31.85 32.25 32.80 33.07 33.18 33.37 33.61 33.84
Exports 15.66 12.54 13.30 13.48 13.68 14.61 15.20 15.60 15.95
Private transfers from RoW 6.85 6.85 6.85 6.85 6.85 6.85 6.85 6.85 6.85
Official transfers from RoW 3.99 4.97 5.02 5.21 5.43 5.84 6.24 6.63 7.04
Factor income from RoW 0.78 0.74 0.75 0.76 0.76 0.77 0.78 0.78 0.78
Government borrowing 3.09 2.96 2.55 2.72 2.57 1.32 0.53 -0.03 -0.57
Private borrowing 0.74 0.00 0.00 0.00 0.00 0.00 0.00 0.00 0.00
FDI 3.79 3.79 3.79 3.79 3.79 3.79 3.79 3.79 3.79
Total 34.89 31.85 32.25 32.80 33.07 33.18 33.37 33.61 33.84
Fiscal Reveneues and Other Receipts (Percent of GDP)
Expenditures (Percent of GDP)
Balance of Payments (Percent of GDP)

59
Table A12: MDG7a Foreign Borrowing Financing: Macro-economic Indicators -Growth Rate (Unless otherwise stated)
2007 2008 2009 2010 2011 2012 2013 2014 2015
Absorption 24636.1 9.9 6.2 7.0 7.0 5.8 6.4 6.8 6.8
Consumption - private 16397.4 9.6 6.5 6.7 5.3 5.2 5.4 5.6 5.5
Consumption - government 2341.0 13.6 7.5 11.0 12.0 11.7 11.3 11.4 11.6
Fixed investment - private 4046.7 10.2 6.8 7.3 6.8 6.4 6.7 6.8 6.7
Fixed investment - government 1789.7 11.2 0.6 3.3 16.4 0.4 7.2 9.7 10.3
Stock change 61.3 Eps Eps Eps Eps Eps Eps Eps Eps
Exports 3317.0 -6.7 11.6 7.6 8.6 12.5 10.7 9.5 9.3
Imports 6766.2 3.9 5.2 6.5 6.6 4.5 5.8 6.4 6.6
GDP at factor cost 19184.2 9.6 7.4 7.4 7.5 7.5 7.5 7.5 7.6
Total factor employment (index) 2.9 2.8 3.1 3.1 3.4 3.4 3.7 3.9
Total factor productivity (index) 6.6 4.6 4.3 4.4 4.1 4.1 3.9 3.6
Real exchange rate (index) -5.9 2.0 0.6 0.6 1.9 1.1 0.6 0.5
Direct Taxes 3.92 3.73 3.58 3.58 3.64 3.79 3.93 4.08 4.22
Import tariffs 1.31 6.41 6.46 6.35 6.35 6.35 6.35 6.35 6.35
Other indirect taxes 8.15 3.16 3.06 2.50 3.14 3.46 3.86 4.21 4.61
Private transfers 0.00 0.00 0.00 0.00 0.00 0.00 0.00 0.00 0.00
Foreign transfers 3.99 4.74 4.25 4.04 3.86 3.83 3.80 3.77 3.74
Domestic borrowing 0.23 -0.23 -0.28 0.05 0.38 0.71 1.04 1.36 1.69
Foreign borrowing 3.09 3.20 3.32 3.91 4.18 3.40 3.06 2.96 2.89
Total 20.69 21.01 20.41 20.45 21.56 21.55 22.05 22.75 23.53
Consumption 11.05 11.40 11.35 11.70 12.09 12.50 12.88 13.26 13.63
Fixed investment 8.45 8.52 8.02 7.72 8.41 7.94 7.98 8.19 8.46
Domestic interest payments 0.99 0.88 0.80 0.75 0.74 0.77 0.83 0.92 1.04
Foreign interest payments 0.19 0.21 0.24 0.28 0.32 0.35 0.37 0.38 0.40
Total 20.69 21.01 20.41 20.45 21.56 21.55 22.05 22.75 23.53
Imports 31.94 28.50 28.47 28.57 28.46 28.21 28.05 27.96 27.88
Factor income to RoW 2.76 3.14 3.54 3.97 4.33 4.70 5.05 5.40 5.73
Net interest income to RoW 0.20 0.22 0.25 0.29 0.32 0.35 0.37 0.39 0.40
Total 34.89 31.86 32.27 32.83 33.12 33.25 33.48 33.75 34.01
Exports 15.66 12.54 13.30 13.48 13.68 14.61 15.20 15.60 15.95
Private transfers from RoW 6.85 6.85 6.85 6.85 6.85 6.85 6.85 6.85 6.85
Official transfers from RoW 3.99 4.74 4.25 4.04 3.86 3.83 3.80 3.77 3.74
Factor income from RoW 0.78 0.74 0.75 0.76 0.76 0.77 0.78 0.78 0.78
Government borrowing 3.09 3.20 3.32 3.91 4.18 3.40 3.06 2.96 2.89
Private borrowing 0.74 0.00 0.00 0.00 0.00 0.00 0.00 0.00 0.00
FDI 3.79 3.79 3.79 3.79 3.79 3.79 3.79 3.79 3.79
Total 34.89 31.86 32.27 32.83 33.12 33.25 33.48 33.75 34.01
Fiscal Reveneues and Other Receipts (Percent of GDP)
Expenditures (Percent of GDP)
Balance of Payments (Percent of GDP)

60
Table A13: MDG7a Domestic Borrowing Financing: Macro-economic Indicators -Growth Rate (Unless otherwise stated)
2007 2008 2009 2010 2011 2012 2013 2014 2015
Absorption 24636.1 9.6 5.5 6.5 6.4 5.2 5.8 6.2 6.2
Consumption - private 16397.4 9.3 5.5 6.0 4.4 4.3 4.5 4.6 4.5
Consumption - government 2341.0 13.7 7.9 11.3 12.3 11.9 11.5 11.7 11.8
Fixed investment - private 4046.7 10.0 6.5 7.1 6.5 6.1 6.4 6.5 6.5
Fixed investment - government 1789.7 10.6 -0.1 3.2 16.5 0.2 7.1 9.5 10.1
Stock change 61.3 Eps Eps Eps Eps Eps Eps Eps Eps
Exports 3317.0 -5.7 14.3 9.4 10.3 13.8 11.9 10.8 10.5
Imports 6766.2 3.4 4.1 5.7 5.8 3.7 5.0 5.6 5.7
GDP at factor cost 19184.2 9.5 7.3 7.4 7.4 7.4 7.4 7.4 7.5
Total factor employment (index) 2.9 2.8 3.0 3.0 3.3 3.3 3.6 3.8
Total factor productivity (index) 6.6 4.6 4.3 4.4 4.1 4.1 3.9 3.6
Real exchange rate (index) -5.4 3.0 1.3 1.3 2.4 1.6 1.2 1.0
Direct Taxes 3.92 3.73 3.58 3.58 3.64 3.79 3.93 4.08 4.22
Import tariffs 1.31 6.41 6.46 6.35 6.35 6.35 6.35 6.35 6.35
Other indirect taxes 8.15 3.16 3.06 2.50 3.14 3.46 3.86 4.21 4.61
Private transfers 0.00 0.00 0.00 0.00 0.00 0.00 0.00 0.00 0.00
Foreign transfers 3.99 4.77 4.31 4.13 3.97 3.97 3.96 3.95 3.94
Domestic borrowing 0.23 0.02 0.70 1.79 3.09 4.64 6.44 8.55 11.04
Foreign borrowing 3.09 2.96 2.55 2.72 2.57 1.32 0.53 -0.03 -0.57
Total 20.69 21.05 20.66 21.09 22.78 23.54 25.08 27.12 29.60
Consumption 11.05 11.42 11.41 11.80 12.23 12.68 13.10 13.52 13.95
Fixed investment 8.45 8.49 7.97 7.68 8.40 7.93 7.98 8.21 8.49
Domestic interest payments 0.99 0.93 1.05 1.35 1.87 2.66 3.72 5.13 6.93
Foreign interest payments 0.19 0.21 0.23 0.26 0.28 0.28 0.27 0.26 0.23
Total 20.69 21.05 20.66 21.09 22.78 23.54 25.08 27.12 29.60
Imports 31.94 28.49 28.44 28.52 28.39 28.09 27.89 27.75 27.62
Factor income to RoW 2.76 3.14 3.54 3.97 4.33 4.70 5.06 5.41 5.74
Net interest income to RoW 0.20 0.21 0.24 0.26 0.28 0.29 0.28 0.26 0.24
Total 34.89 31.85 32.23 32.76 33.01 33.07 33.22 33.42 33.60
Exports 15.66 12.74 13.97 14.50 15.05 16.35 17.29 18.05 18.77
Private transfers from RoW 6.85 6.85 6.85 6.85 6.85 6.85 6.85 6.85 6.85
Official transfers from RoW 3.99 4.77 4.31 4.13 3.97 3.97 3.96 3.95 3.94
Factor income from RoW 0.78 0.74 0.76 0.77 0.78 0.80 0.81 0.82 0.82
Government borrowing 3.09 2.96 2.55 2.72 2.57 1.32 0.53 -0.03 -0.57
Private borrowing 0.74 0.00 0.00 0.00 0.00 0.00 0.00 0.00 0.00
FDI 3.79 3.79 3.79 3.79 3.79 3.79 3.79 3.79 3.79
Total 34.89 31.85 32.23 32.76 33.01 33.07 33.22 33.42 33.60
Fiscal Reveneues and Other Receipts (Percent of GDP)
Expenditures (Percent of GDP)
Balance of Payments (Percent of GDP)

61
Table A14: MDG7b Tax Financing: Macro-economic Indicators -Growth Rate (Unless otherwise stated)
2007 2008 2009 2010 2011 2012 2013 2014 2015
Absorption 24636.1 9.6 5.5 6.5 6.4 5.2 5.8 6.2 6.2
Consumption - private 16397.4 9.3 5.5 6.0 4.4 4.4 4.5 4.6 4.5
Consumption - government 2341.0 13.7 7.9 11.3 12.3 11.9 11.5 11.6 11.8
Fixed investment - private 4046.7 10.0 6.3 7.0 6.4 6.0 6.2 6.3 6.3
Fixed investment - government 1789.7 10.7 0.0 3.1 16.6 0.3 7.2 9.5 10.1
Stock change 61.3 Eps Eps Eps Eps Eps Eps Eps Eps
Exports 3317.0 -5.7 14.0 9.2 10.1 13.7 11.7 10.6 10.3
Imports 6766.2 3.4 4.1 5.7 5.8 3.7 5.0 5.6 5.7
GDP at factor cost 19184.2 9.5 7.3 7.3 7.4 7.4 7.4 7.4 7.4
Total factor employment (index) 2.9 2.7 3.0 3.0 3.3 3.3 3.5 3.7
Total factor productivity (index) 6.6 4.6 4.3 4.4 4.1 4.1 3.9 3.6
Real exchange rate (index) -5.5 2.9 1.2 1.2 2.4 1.6 1.1 1.0
Direct Taxes 3.92 3.85 3.98 4.27 4.50 4.87 5.21 5.54 5.87
Import tariffs 1.31 6.41 6.46 6.35 6.35 6.35 6.35 6.35 6.35
Export taxes
Other indirect taxes 8.15 3.26 3.41 2.99 3.91 4.49 5.16 5.80 6.50
Private transfers 0.00 0.00 0.00 0.00 0.00 0.00 0.00 0.00 0.00
Foreign transfers 3.99 4.76 4.30 4.11 3.95 3.93 3.92 3.90 3.89
Domestic borrowing 0.23 -0.23 -0.28 0.05 0.38 0.71 1.04 1.36 1.69
Foreign borrowing 3.09 2.96 2.55 2.72 2.57 1.32 0.53 -0.03 -0.57
Total 20.69 21.01 20.43 20.50 21.67 21.68 22.21 22.93 23.74
Consumption 11.05 11.42 11.40 11.77 12.19 12.63 13.04 13.45 13.86
Fixed investment 8.45 8.51 8.00 7.71 8.45 7.99 8.06 8.30 8.60
Domestic interest payments 0.99 0.88 0.80 0.76 0.75 0.78 0.84 0.93 1.05
Foreign interest payments 0.19 0.21 0.23 0.26 0.27 0.28 0.27 0.25 0.23
Total 20.69 21.01 20.43 20.50 21.67 21.68 22.21 22.93 23.74
Imports 31.94 28.47 28.36 28.41 28.21 27.85 27.59 27.40 27.20
Factor income to RoW 2.76 3.14 3.53 3.94 4.29 4.63 4.97 5.29 5.59
Net interest income to RoW 0.20 0.21 0.24 0.26 0.28 0.28 0.28 0.26 0.24
Total 34.89 31.82 32.13 32.61 32.78 32.77 32.84 32.95 33.03
Exports 15.66 12.72 13.88 14.38 14.86 16.08 16.96 17.63 18.26
Private transfers from RoW 6.85 6.85 6.85 6.85 6.85 6.85 6.85 6.85 6.85
Official transfers from RoW 3.99 4.76 4.30 4.11 3.95 3.93 3.92 3.90 3.89
Factor income from RoW 0.78 0.74 0.76 0.77 0.78 0.79 0.80 0.81 0.81
Government borrowing 3.09 2.96 2.55 2.72 2.57 1.32 0.53 -0.03 -0.57
Private borrowing 0.74 0.00 0.00 0.00 0.00 0.00 0.00 0.00 0.00
FDI 3.79 3.79 3.79 3.79 3.79 3.79 3.79 3.79 3.79
Total 34.89 31.82 32.13 32.61 32.78 32.77 32.84 32.95 33.03
Fiscal Reveneues and Other Receipts (Percent of GDP)
Expenditures (Percent of GDP)
Balance of Payments (Percent of GDP)

62
Table A15: MDG7b Foreign Transfer Financing: Macro-economic Indicators -Growth Rate (Unless otherwise stated)
2007 2008 2009 2010 2011 2012 2013 2014 2015
Absorption 24636.1 9.9 6.2 7.0 7.0 5.7 6.4 6.8 6.8
Consumption - private 16397.4 9.6 6.5 6.7 5.3 5.2 5.4 5.6 5.5
Consumption - government 2341.0 13.6 7.5 11.0 12.0 11.7 11.3 11.4 11.6
Fixed investment - private 4046.7 10.2 6.8 7.3 6.8 6.4 6.7 6.8 6.7
Fixed investment - government 1789.7 11.2 0.5 3.3 16.4 0.4 7.2 9.7 10.3
Stock change 61.3 Eps Eps Eps Eps Eps Eps Eps Eps
Exports 3317.0 -6.7 11.7 7.6 8.7 12.6 10.7 9.5 9.3
Imports 6766.2 3.9 5.2 6.5 6.6 4.5 5.8 6.4 6.6
GDP at factor cost 19184.2 9.6 7.4 7.4 7.5 7.5 7.5 7.5 7.6
Total factor employment (index) 2.9 2.8 3.1 3.1 3.4 3.4 3.7 3.9
Total factor productivity (index) 6.6 4.6 4.3 4.4 4.1 4.1 3.9 3.6
Real exchange rate (index) -5.9 2.0 0.6 0.6 1.9 1.1 0.6 0.5
Head count poverty rate (%) 30.8
Direct Taxes 3.92 3.73 3.58 3.58 3.64 3.79 3.93 4.08 4.22
Import tariffs 1.31 6.41 6.46 6.35 6.35 6.35 6.35 6.35 6.35
Export taxes
Other indirect taxes 8.15 3.16 3.06 2.50 3.14 3.46 3.86 4.21 4.61
Private transfers 0.00 0.00 0.00 0.00 0.00 0.00 0.00 0.00 0.00
Foreign transfers 3.99 4.98 5.02 5.21 5.42 5.84 6.23 6.63 7.03
Factor incomes
Domestic borrowing 0.23 -0.23 -0.28 0.05 0.38 0.71 1.04 1.36 1.69
Foreign borrowing 3.09 2.96 2.55 2.72 2.57 1.32 0.53 -0.03 -0.57
Total 20.69 21.01 20.39 20.42 21.51 21.48 21.95 22.61 23.35
Consumption 11.05 11.40 11.35 11.70 12.09 12.49 12.88 13.25 13.62
Fixed investment 8.45 8.52 8.02 7.72 8.41 7.94 7.97 8.19 8.46
Stock exchange
Private transfers
Foreign transfers
Domestic interest payments 0.99 0.88 0.80 0.75 0.74 0.77 0.83 0.92 1.04
Foreign interest payments 0.19 0.21 0.23 0.25 0.27 0.27 0.26 0.25 0.22
Domestic capital transfers
Total 20.69 21.01 20.39 20.42 21.51 21.48 21.95 22.61 23.35
Imports 31.94 28.50 28.47 28.57 28.46 28.20 28.05 27.96 27.88
Private transfers to ROW
Official transfers to ROW
Factor income to RoW 2.76 3.14 3.54 3.97 4.33 4.70 5.05 5.40 5.73
Net interest income to RoW 0.20 0.21 0.24 0.26 0.28 0.28 0.27 0.25 0.23
Total 34.89 31.85 32.25 32.80 33.07 33.18 33.37 33.61 33.84
Exports 15.66 12.54 13.30 13.48 13.69 14.61 15.20 15.60 15.96
Private transfers from RoW 6.85 6.85 6.85 6.85 6.85 6.85 6.85 6.85 6.85
Official transfers from RoW 3.99 4.98 5.02 5.21 5.42 5.84 6.23 6.63 7.03
Factor income from RoW 0.78 0.74 0.75 0.76 0.76 0.77 0.78 0.78 0.78
Government borrowing 3.09 2.96 2.55 2.72 2.57 1.32 0.53 -0.03 -0.57
Private borrowing 0.74 0.00 0.00 0.00 0.00 0.00 0.00 0.00 0.00
FDI 3.79 3.79 3.79 3.79 3.79 3.79 3.79 3.79 3.79
Total 34.89 31.85 32.25 32.80 33.07 33.18 33.37 33.61 33.84
Fiscal Reveneues and Other Receipts (Percent of GDP)
Expenditures (Percent of GDP)
Balance of Payments (Percent of GDP)

63
Table A16: MDG7b Foreign Borrowing Financing: Macro-economic Indicators -Growth Rate (Unless otherwise stated)
2007 2008 2009 2010 2011 2012 2013 2014 2015
Absorption 24636.1 9.9 6.2 7.0 7.0 5.7 6.4 6.8 6.8
Consumption - private 16397.4 9.6 6.5 6.7 5.3 5.2 5.4 5.6 5.5
Consumption - government 2341.0 13.6 7.5 11.0 12.0 11.7 11.3 11.4 11.6
Fixed investment - private 4046.7 10.2 6.8 7.3 6.8 6.4 6.7 6.8 6.7
Fixed investment - government 1789.7 11.2 0.5 3.3 16.4 0.4 7.2 9.7 10.3
Stock change 61.3 Eps Eps Eps Eps Eps Eps Eps Eps
Exports 3317.0 -6.7 11.7 7.6 8.7 12.6 10.7 9.5 9.3
Imports 6766.2 3.9 5.2 6.5 6.6 4.5 5.8 6.4 6.6
GDP at factor cost 19184.2 9.6 7.4 7.4 7.5 7.5 7.5 7.5 7.6
Total factor employment (index) 2.9 2.8 3.1 3.1 3.4 3.4 3.7 3.9
Total factor productivity (index) 6.6 4.6 4.3 4.4 4.1 4.1 3.9 3.6
Real exchange rate (index) -5.9 2.0 0.6 0.6 1.9 1.1 0.6 0.5
Head count poverty rate (%) 30.8
Direct Taxes 3.92 3.73 3.58 3.58 3.64 3.79 3.93 4.08 4.22
Import tariffs 1.31 6.41 6.46 6.35 6.35 6.35 6.35 6.35 6.35
Other indirect taxes 8.15 3.16 3.06 2.50 3.14 3.46 3.86 4.21 4.61
Private transfers 0.00 0.00 0.00 0.00 0.00 0.00 0.00 0.00 0.00
Foreign transfers 3.99 4.74 4.25 4.04 3.86 3.83 3.80 3.77 3.74
Domestic borrowing 0.23 -0.23 -0.28 0.05 0.38 0.71 1.04 1.36 1.69
Foreign borrowing 3.09 3.20 3.33 3.91 4.18 3.40 3.06 2.96 2.89
Total 20.69 21.02 20.41 20.45 21.56 21.55 22.05 22.74 23.52
Consumption 11.05 11.40 11.35 11.70 12.09 12.49 12.88 13.25 13.62
Fixed investment 8.45 8.52 8.02 7.72 8.41 7.94 7.97 8.19 8.46
Domestic interest payments 0.99 0.88 0.80 0.75 0.74 0.77 0.83 0.92 1.04
Foreign interest payments 0.19 0.21 0.24 0.28 0.32 0.35 0.37 0.38 0.40
Total 20.69 21.02 20.41 20.45 21.56 21.55 22.05 22.74 23.52
Imports 31.94 28.50 28.47 28.57 28.46 28.20 28.05 27.96 27.88
Factor income to RoW 2.76 3.14 3.54 3.97 4.33 4.70 5.05 5.40 5.73
Net interest income to RoW 0.20 0.22 0.25 0.29 0.32 0.35 0.37 0.39 0.40
Total 34.89 31.86 32.27 32.83 33.12 33.25 33.48 33.75 34.01
Exports 15.66 12.54 13.30 13.48 13.69 14.61 15.20 15.60 15.96
Private transfers from RoW 6.85 6.85 6.85 6.85 6.85 6.85 6.85 6.85 6.85
Official transfers from RoW 3.99 4.74 4.25 4.04 3.86 3.83 3.80 3.77 3.74
Factor income from RoW 0.78 0.74 0.75 0.76 0.76 0.77 0.78 0.78 0.78
Government borrowing 3.09 3.20 3.33 3.91 4.18 3.40 3.06 2.96 2.89
Private borrowing 0.74 0.00 0.00 0.00 0.00 0.00 0.00 0.00 0.00
FDI 3.79 3.79 3.79 3.79 3.79 3.79 3.79 3.79 3.79
Total 34.89 31.86 32.27 32.83 33.12 33.25 33.48 33.75 34.01
Fiscal Reveneues and Other Receipts (Percent of GDP)
Expenditures (Percent of GDP)
Balance of Payments (Percent of GDP)

64
Table A17: MDG7b Domestic Borrowing Financing: Macro-economic Indicators -Growth Rate (Unless otherwise stated)
2007 2008 2009 2010 2011 2012 2013 2014 2015
Absorption 24636.1 9.6 5.5 6.5 6.4 5.2 5.8 6.2 6.2
Consumption - private 16397.4 9.3 5.5 6.0 4.4 4.3 4.5 4.6 4.5
Consumption - government 2341.0 13.7 7.9 11.2 12.3 11.9 11.5 11.6 11.8
Fixed investment - private 4046.7 10.0 6.5 7.1 6.5 6.1 6.4 6.5 6.5
Fixed investment - government 1789.7 10.6 -0.1 3.1 16.5 0.2 7.1 9.5 10.1
Stock change 61.3 Eps Eps Eps Eps Eps Eps Eps Eps
Exports 3317.0 -5.7 14.3 9.4 10.3 13.8 11.9 10.8 10.5
Imports 6766.2 3.4 4.1 5.7 5.8 3.7 5.0 5.6 5.7
GDP at factor cost 19184.2 9.5 7.3 7.4 7.4 7.4 7.4 7.4 7.5
Total factor employment (index) 2.9 2.8 3.0 3.0 3.3 3.3 3.6 3.8
Total factor productivity (index) 6.6 4.6 4.3 4.4 4.1 4.1 3.9 3.6
Real exchange rate (index) -5.4 3.0 1.3 1.3 2.4 1.6 1.2 1.0
Direct Taxes 3.92 3.73 3.58 3.58 3.64 3.79 3.93 4.08 4.22
Import tariffs 1.31 6.41 6.46 6.35 6.35 6.35 6.35 6.35 6.35
Other indirect taxes 8.15 3.16 3.06 2.50 3.14 3.46 3.86 4.21 4.61
Private transfers 0.00 0.00 0.00 0.00 0.00 0.00 0.00 0.00 0.00
Foreign transfers 3.99 4.77 4.31 4.13 3.97 3.97 3.96 3.95 3.94
Domestic borrowing 0.23 0.02 0.70 1.79 3.09 4.64 6.43 8.53 11.01
Foreign borrowing 3.09 2.96 2.55 2.72 2.57 1.32 0.53 -0.03 -0.57
Total 20.69 21.05 20.66 21.08 22.77 23.53 25.07 27.10 29.57
Consumption 11.05 11.42 11.41 11.80 12.23 12.67 13.10 13.52 13.94
Fixed investment 8.45 8.49 7.97 7.68 8.39 7.93 7.98 8.20 8.48
Domestic interest payments 0.99 0.93 1.05 1.35 1.87 2.65 3.72 5.12 6.92
Foreign interest payments 0.19 0.21 0.23 0.26 0.28 0.28 0.27 0.26 0.23
Total 20.69 21.05 20.66 21.08 22.77 23.53 25.07 27.10 29.57
Imports 31.94 28.49 28.44 28.52 28.39 28.09 27.89 27.75 27.62
Factor income to RoW 2.76 3.14 3.54 3.97 4.33 4.70 5.06 5.41 5.74
Net interest income to RoW 0.20 0.21 0.24 0.26 0.28 0.29 0.28 0.26 0.24
Total 34.89 31.85 32.23 32.76 33.01 33.07 33.22 33.42 33.60
Exports 15.66 12.74 13.97 14.50 15.05 16.35 17.29 18.05 18.77
Private transfers from RoW 6.85 6.85 6.85 6.85 6.85 6.85 6.85 6.85 6.85
Official transfers from RoW 3.99 4.77 4.31 4.13 3.97 3.97 3.96 3.95 3.94
Factor income from RoW 0.78 0.74 0.76 0.77 0.78 0.80 0.81 0.82 0.82
Government borrowing 3.09 2.96 2.55 2.72 2.57 1.32 0.53 -0.03 -0.57
Private borrowing 0.74 0.00 0.00 0.00 0.00 0.00 0.00 0.00 0.00
FDI 3.79 3.79 3.79 3.79 3.79 3.79 3.79 3.79 3.79
Total 34.89 31.85 32.23 32.76 33.01 33.07 33.22 33.42 33.60
Fiscal Reveneues and Other Receipts (Percent of GDP)
Expenditures (Percent of GDP)
Balance of Payments (Percent of GDP)

65
Table A18: All MDGs Tax Financing: Macro-economic Indicators -Growth Rate (Unless otherwise stated)
2007 2008 2009 2010 2011 2012 2013 2014 2015
Absorption 24636.1 10.0 5.9 7.2 6.2 5.0 5.7 5.9 5.9
Consumption - private 16397.4 4.0 2.6 0.6 10.9 6.2 0.6 1.9 2.9
Consumption - government 2341.0 23.0 17.0 25.4 8.5 10.6 14.2 12.5 12.2
Fixed investment - private 4046.7 9.4 6.3 7.1 7.0 6.1 5.6 5.8 5.8
Fixed investment - government 1789.7 53.1 13.6 25.3 -18.1 -12.5 28.2 19.1 11.5
Exports 3317.0 -5.3 13.2 8.4 7.9 13.2 11.7 10.5 9.9
Imports 6766.2 4.5 4.4 6.4 4.3 2.8 5.4 5.7 5.5
GDP at factor cost 19184.2 9.5 7.5 7.8 7.5 7.3 7.0 6.9 7.0
Total factor employment (index) 2.6 3.1 3.5 4.3 3.8 3.1 3.8 4.3
Total factor productivity (index) 6.9 4.4 4.3 3.2 3.6 3.8 3.2 2.7
Real exchange rate (index) -5.4 2.6 1.0 0.6 2.3 1.5 1.1 1.0
Direct Taxes 3.92 6.02 7.33 10.26 7.75 7.31 8.71 9.58 10.03
Import tariffs 1.31 6.41 6.46 6.35 6.35 6.35 6.35 6.35 6.35
Other indirect taxes 8.15 5.28 6.60 7.70 6.93 6.84 8.99 10.61 11.89
Private transfers 0.00 0.00 0.00 0.00 0.00 0.00 0.00 0.00 0.00
Foreign transfers 3.99 4.69 4.18 3.92 3.78 3.78 3.73 3.70 3.67
Domestic borrowing 0.23 -0.23 -0.28 0.05 0.38 0.71 1.04 1.36 1.69
Foreign borrowing 3.09 2.96 2.55 2.72 2.57 1.32 0.53 -0.03 -0.57
Total 20.69 25.13 26.85 31.00 27.77 26.33 29.35 31.59 33.06
Consumption 11.05 12.23 13.18 15.23 15.45 15.96 16.93 17.66 18.36
Fixed investment 8.45 11.83 12.64 14.78 11.31 9.33 11.33 12.76 13.45
Domestic interest payments 0.99 0.88 0.79 0.74 0.74 0.77 0.83 0.92 1.04
Foreign interest payments 0.19 0.20 0.23 0.25 0.27 0.27 0.26 0.24 0.22
Total 20.69 25.13 26.85 31.00 27.77 26.33 29.35 31.59 33.06
Imports 31.94 28.34 27.95 27.63 27.18 26.73 26.32 26.03 25.73
Factor income to RoW 2.76 3.06 3.38 3.68 4.07 4.43 4.65 4.89 5.13
Net interest income to RoW 0.20 0.21 0.23 0.25 0.27 0.28 0.27 0.25 0.23
Total 34.89 31.61 31.55 31.56 31.53 31.44 31.24 31.17 31.09
Exports 15.66 12.59 13.45 13.55 13.80 14.93 15.59 16.11 16.58
Private transfers from RoW 6.85 6.85 6.85 6.85 6.85 6.85 6.85 6.85 6.85
Official transfers from RoW 3.99 4.69 4.18 3.92 3.78 3.78 3.73 3.70 3.67
Factor income from RoW 0.78 0.73 0.74 0.73 0.74 0.76 0.76 0.77 0.77
Government borrowing 3.09 2.96 2.55 2.72 2.57 1.32 0.53 -0.03 -0.57
Private borrowing 0.74 0.00 0.00 0.00 0.00 0.00 0.00 0.00 0.00
FDI 3.79 3.79 3.79 3.79 3.79 3.79 3.79 3.79 3.79
Total 34.89 31.61 31.55 31.56 31.53 31.44 31.24 31.17 31.09
Fiscal Reveneues and Other Receipts (Percent of GDP)
Expenditures (Percent of GDP)
Balance of Payments (Percent of GDP)
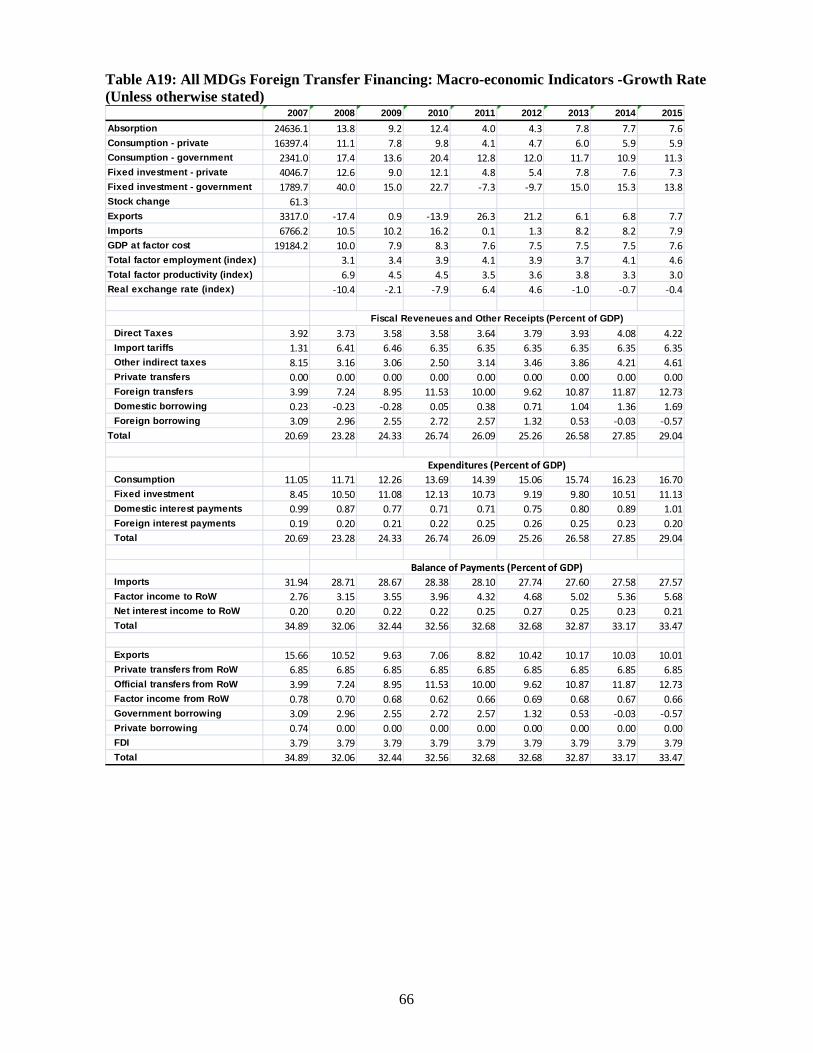
66
Table A19: All MDGs Foreign Transfer Financing: Macro-economic Indicators -Growth Rate (Unless otherwise stated)
2007 2008 2009 2010 2011 2012 2013 2014 2015
Absorption 24636.1 13.8 9.2 12.4 4.0 4.3 7.8 7.7 7.6
Consumption - private 16397.4 11.1 7.8 9.8 4.1 4.7 6.0 5.9 5.9
Consumption - government 2341.0 17.4 13.6 20.4 12.8 12.0 11.7 10.9 11.3
Fixed investment - private 4046.7 12.6 9.0 12.1 4.8 5.4 7.8 7.6 7.3
Fixed investment - government 1789.7 40.0 15.0 22.7 -7.3 -9.7 15.0 15.3 13.8
Stock change 61.3 Eps Eps Eps Eps Eps Eps Eps Eps
Exports 3317.0 -17.4 0.9 -13.9 26.3 21.2 6.1 6.8 7.7
Imports 6766.2 10.5 10.2 16.2 0.1 1.3 8.2 8.2 7.9
GDP at factor cost 19184.2 10.0 7.9 8.3 7.6 7.5 7.5 7.5 7.6
Total factor employment (index) 3.1 3.4 3.9 4.1 3.9 3.7 4.1 4.6
Total factor productivity (index) 6.9 4.5 4.5 3.5 3.6 3.8 3.3 3.0
Real exchange rate (index) -10.4 -2.1 -7.9 6.4 4.6 -1.0 -0.7 -0.4
Direct Taxes 3.92 3.73 3.58 3.58 3.64 3.79 3.93 4.08 4.22
Import tariffs 1.31 6.41 6.46 6.35 6.35 6.35 6.35 6.35 6.35
Other indirect taxes 8.15 3.16 3.06 2.50 3.14 3.46 3.86 4.21 4.61
Private transfers 0.00 0.00 0.00 0.00 0.00 0.00 0.00 0.00 0.00
Foreign transfers 3.99 7.24 8.95 11.53 10.00 9.62 10.87 11.87 12.73
Domestic borrowing 0.23 -0.23 -0.28 0.05 0.38 0.71 1.04 1.36 1.69
Foreign borrowing 3.09 2.96 2.55 2.72 2.57 1.32 0.53 -0.03 -0.57
Total 20.69 23.28 24.33 26.74 26.09 25.26 26.58 27.85 29.04
Consumption 11.05 11.71 12.26 13.69 14.39 15.06 15.74 16.23 16.70
Fixed investment 8.45 10.50 11.08 12.13 10.73 9.19 9.80 10.51 11.13
Domestic interest payments 0.99 0.87 0.77 0.71 0.71 0.75 0.80 0.89 1.01
Foreign interest payments 0.19 0.20 0.21 0.22 0.25 0.26 0.25 0.23 0.20
Total 20.69 23.28 24.33 26.74 26.09 25.26 26.58 27.85 29.04
Imports 31.94 28.71 28.67 28.38 28.10 27.74 27.60 27.58 27.57
Factor income to RoW 2.76 3.15 3.55 3.96 4.32 4.68 5.02 5.36 5.68
Net interest income to RoW 0.20 0.20 0.22 0.22 0.25 0.27 0.25 0.23 0.21
Total 34.89 32.06 32.44 32.56 32.68 32.68 32.87 33.17 33.47
Exports 15.66 10.52 9.63 7.06 8.82 10.42 10.17 10.03 10.01
Private transfers from RoW 6.85 6.85 6.85 6.85 6.85 6.85 6.85 6.85 6.85
Official transfers from RoW 3.99 7.24 8.95 11.53 10.00 9.62 10.87 11.87 12.73
Factor income from RoW 0.78 0.70 0.68 0.62 0.66 0.69 0.68 0.67 0.66
Government borrowing 3.09 2.96 2.55 2.72 2.57 1.32 0.53 -0.03 -0.57
Private borrowing 0.74 0.00 0.00 0.00 0.00 0.00 0.00 0.00 0.00
FDI 3.79 3.79 3.79 3.79 3.79 3.79 3.79 3.79 3.79
Total 34.89 32.06 32.44 32.56 32.68 32.68 32.87 33.17 33.47
Fiscal Reveneues and Other Receipts (Percent of GDP)
Expenditures (Percent of GDP)
Balance of Payments (Percent of GDP)

67
Table A20: All MDGs Foreign Borrowing Financing: Macro-economic Indicators -Growth Rate (Unless otherwise stated)
2007 2008 2009 2010 2011 2012 2013 2014 2015
Absorption 24636.1 13.8 9.2 12.4 4.0 4.3 7.8 7.7 7.6
Consumption - private 16397.4 11.1 7.8 9.8 4.1 4.7 6.0 5.9 5.9
Consumption - government 2341.0 17.4 13.6 20.4 12.8 12.0 11.7 10.9 11.3
Fixed investment - private 4046.7 12.6 9.0 12.1 4.8 5.4 7.8 7.6 7.3
Fixed investment - government 1789.7 40.0 15.0 22.7 -7.3 -9.7 15.0 15.3 13.8
Stock change 61.3 Eps Eps Eps Eps Eps Eps Eps Eps
Exports 3317.0 -17.4 0.9 -13.9 26.3 21.2 6.1 6.8 7.7
Imports 6766.2 10.5 10.2 16.2 0.1 1.3 8.2 8.2 7.9
GDP at factor cost 19184.2 10.0 7.9 8.3 7.6 7.5 7.5 7.5 7.6
Total factor employment (index) 3.1 3.4 3.9 4.1 3.9 3.7 4.1 4.6
Total factor productivity (index) 6.9 4.5 4.5 3.5 3.6 3.8 3.3 3.0
Real exchange rate (index) -10.4 -2.1 -7.9 6.4 4.6 -1.0 -0.7 -0.4
Direct Taxes 3.92 3.73 3.58 3.58 3.64 3.79 3.93 4.08 4.22
Import tariffs 1.31 6.41 6.46 6.35 6.35 6.35 6.35 6.35 6.35
Other indirect taxes 8.15 3.16 3.06 2.50 3.14 3.46 3.86 4.21 4.61
Private transfers 0.00 0.00 0.00 0.00 0.00 0.00 0.00 0.00 0.00
Foreign transfers 3.99 4.50 3.85 3.30 3.34 3.41 3.31 3.24 3.18
Domestic borrowing 0.23 -0.23 -0.28 0.05 0.38 0.71 1.04 1.36 1.69
Foreign borrowing 3.09 5.74 7.75 11.14 9.51 7.90 8.53 9.13 9.60
Total 20.69 23.31 24.43 26.94 26.37 25.62 27.03 28.38 29.67
Consumption 11.05 11.71 12.26 13.69 14.39 15.06 15.74 16.23 16.70
Fixed investment 8.45 10.50 11.08 12.13 10.73 9.19 9.80 10.51 11.13
Domestic interest payments 0.99 0.87 0.77 0.71 0.71 0.75 0.80 0.89 1.01
Foreign interest payments 0.19 0.23 0.31 0.42 0.54 0.63 0.69 0.76 0.83
Total 20.69 23.31 24.43 26.94 26.37 25.62 27.03 28.38 29.67
Imports 31.94 28.71 28.67 28.38 28.10 27.74 27.60 27.58 27.57
Factor income to RoW 2.76 3.15 3.55 3.96 4.32 4.68 5.02 5.36 5.68
Net interest income to RoW 0.20 0.24 0.32 0.42 0.54 0.63 0.70 0.76 0.83
Total 34.89 32.09 32.54 32.76 32.97 33.05 33.32 33.71 34.09
Exports 15.66 10.52 9.63 7.06 8.82 10.42 10.17 10.03 10.01
Private transfers from RoW 6.85 6.85 6.85 6.85 6.85 6.85 6.85 6.85 6.85
Official transfers from RoW 3.99 4.50 3.85 3.30 3.34 3.41 3.31 3.24 3.18
Factor income from RoW 0.78 0.70 0.68 0.62 0.66 0.69 0.68 0.67 0.66
Government borrowing 3.09 5.74 7.75 11.14 9.51 7.90 8.53 9.13 9.60
Private borrowing 0.74 0.00 0.00 0.00 0.00 0.00 0.00 0.00 0.00
FDI 3.79 3.79 3.79 3.79 3.79 3.79 3.79 3.79 3.79
Total 34.89 32.09 32.54 32.76 32.97 33.05 33.32 33.71 34.09
Fiscal Reveneues and Other Receipts (Percent of GDP)
Expenditures (Percent of GDP)
Balance of Payments (Percent of GDP)

68
Table A21: All MDGs Domestic Borrowing Financing: Macro-economic Indicators -Growth Rate (Unless otherwise stated)
2007 2008 2009 2010 2011 2012 2013 2014 2015
Absorption 24636.1 9.9 5.8 7.2 6.4 5.1 5.7 6.0 6.1
Consumption - private 16397.4 3.4 2.4 0.2 11.4 6.3 0.1 1.6 2.9
Consumption - government 2341.0 23.5 17.2 25.6 8.3 10.6 14.5 12.7 12.2
Fixed investment - private 4046.7 10.2 6.9 7.9 6.7 6.2 6.7 6.7 6.6
Fixed investment - government 1789.7 54.2 13.3 25.1 -18.6 -12.6 29.0 19.3 11.1
Stock change 61.3 Eps Eps Eps Eps Eps Eps Eps Eps
Exports 3317.0 -3.5 14.3 9.8 6.7 12.5 12.9 11.3 10.5
Imports 6766.2 4.3 4.4 6.2 4.5 3.0 5.4 5.8 5.7
GDP at factor cost 19184.2 9.8 7.7 8.0 7.4 7.3 7.2 7.2 7.3
Total factor employment (index) 2.9 3.3 3.8 4.2 3.7 3.4 4.0 4.5
Total factor productivity (index) 6.9 4.4 4.3 3.2 3.6 3.9 3.2 2.8
Real exchange rate (index) -4.7 3.0 1.4 0.1 1.9 1.8 1.3 1.0
Direct Taxes 3.92 3.73 3.58 3.58 3.64 3.79 3.93 4.08 4.22
Import tariffs 1.31 6.41 6.46 6.35 6.35 6.35 6.35 6.35 6.35
Other indirect taxes 8.15 3.16 3.06 2.50 3.14 3.46 3.86 4.21 4.61
Private transfers 0.00 0.00 0.00 0.00 0.00 0.00 0.00 0.00 0.00
Foreign transfers 3.99 4.79 4.32 4.10 3.91 3.88 3.88 3.87 3.86
Domestic borrowing 0.23 5.43 10.39 19.03 18.72 21.93 30.61 39.73 49.46
Foreign borrowing 3.09 2.96 2.55 2.72 2.57 1.32 0.53 -0.03 -0.57
Total 20.69 26.48 30.35 38.30 38.34 40.74 49.17 58.22 67.94
Consumption 11.05 12.40 13.48 15.73 15.83 16.36 17.59 18.51 19.31
Fixed investment 8.45 11.82 12.52 14.53 11.08 9.11 11.02 12.33 12.85
Domestic interest payments 0.99 2.05 4.11 7.79 11.15 14.99 20.29 27.13 35.55
Foreign interest payments 0.19 0.21 0.23 0.25 0.27 0.27 0.27 0.25 0.23
Total 20.69 26.48 30.35 38.30 38.34 40.74 49.17 58.22 67.94
Imports 31.94 28.87 28.79 28.83 28.02 27.42 27.34 27.28 27.11
Factor income to RoW 2.76 3.15 3.54 3.95 4.29 4.64 5.00 5.35 5.67
Net interest income to RoW 0.20 0.21 0.24 0.26 0.28 0.28 0.27 0.26 0.24
Total 34.89 32.23 32.57 33.05 32.59 32.34 32.61 32.88 33.02
Exports 15.66 13.10 14.31 14.82 14.71 15.72 16.78 17.61 18.29
Private transfers from RoW 6.85 6.85 6.85 6.85 6.85 6.85 6.85 6.85 6.85
Official transfers from RoW 3.99 4.79 4.32 4.10 3.91 3.88 3.88 3.87 3.86
Factor income from RoW 0.78 0.74 0.76 0.77 0.77 0.78 0.79 0.80 0.81
Government borrowing 3.09 2.96 2.55 2.72 2.57 1.32 0.53 -0.03 -0.57
Private borrowing 0.74 0.00 0.00 0.00 0.00 0.00 0.00 0.00 0.00
FDI 3.79 3.79 3.79 3.79 3.79 3.79 3.79 3.79 3.79
Total 34.89 32.23 32.57 33.05 32.59 32.34 32.61 32.88 33.02
Fiscal Reveneues and Other Receipts (Percent of GDP)
Expenditures (Percent of GDP)
Balance of Payments (Percent of GDP)

69
Table A22: All MDGs with Increased Efficiency and Foreign Transfer Financing: Macro-economic Indicators -Growth Rate (Unless otherwise stated)
2007 2008 2009 2010 2011 2012 2013 2014 2015
Absorption 24636.1 13.7 9.0 11.9 3.8 4.1 7.4 7.4 7.3
Consumption - private 16397.4 11.0 7.6 9.2 3.9 4.5 5.7 5.6 5.5
Consumption - government 2341.0 17.3 13.5 20.3 12.7 11.9 11.7 10.8 11.3
Fixed investment - private 4046.7 12.3 8.5 11.0 4.4 5.0 7.1 6.9 6.7
Fixed investment - government 1789.7 41.3 15.0 22.9 -7.1 -9.6 15.3 15.6 13.8
Stock change 61.3 Eps Eps Eps Eps Eps Eps Eps Eps
Exports 3317.0 -16.7 2.6 -10.1 27.0 21.9 8.0 8.5 9.1
Imports 6766.2 10.3 9.7 14.9 -0.2 0.9 7.6 7.6 7.4
GDP at factor cost 19184.2 10.1 8.0 8.5 7.7 7.6 7.6 7.5 7.6
Total factor employment (index) 3.1 3.4 3.9 4.1 3.9 3.6 4.1 4.5
Total factor productivity (index) 7.0 4.6 4.6 3.6 3.7 3.9 3.5 3.1
Real exchange rate (index) -9.9 -1.3 -6.1 7.0 5.2 0.0 0.2 0.4
Direct Taxes 3.92 3.73 3.58 3.58 3.64 3.79 3.93 4.08 4.22
Import tariffs 1.31 6.41 6.46 6.35 6.35 6.35 6.35 6.35 6.35
Other indirect taxes 8.15 3.16 3.06 2.50 3.14 3.46 3.86 4.21 4.61
Private transfers 0.00 0.00 0.00 0.00 0.00 0.00 0.00 0.00 0.00
Foreign transfers 3.99 7.21 8.81 11.27 9.53 8.91 10.02 10.90 11.64
Domestic borrowing 0.23 -0.23 -0.28 0.05 0.38 0.71 1.04 1.36 1.69
Foreign borrowing 3.09 2.96 2.55 2.72 2.57 1.32 0.53 -0.03 -0.57
Total 20.69 23.24 24.19 26.49 25.62 24.55 25.74 26.88 27.96
Consumption 11.05 11.56 11.94 13.09 13.56 13.98 14.40 14.64 14.88
Fixed investment 8.45 10.62 11.25 12.46 11.09 9.55 10.27 11.10 11.84
Domestic interest payments 0.99 0.87 0.78 0.72 0.72 0.76 0.81 0.90 1.02
Foreign interest payments 0.19 0.20 0.21 0.22 0.26 0.27 0.26 0.24 0.22
Total 20.69 23.24 24.19 26.49 25.62 24.55 25.74 26.88 27.96
Imports 31.94 28.81 28.90 28.87 28.66 28.37 28.40 28.53 28.66
Factor income to RoW 2.76 3.15 3.57 3.99 4.37 4.75 5.11 5.47 5.82
Net interest income to RoW 0.20 0.20 0.22 0.23 0.26 0.27 0.26 0.24 0.22
Total 34.89 32.17 32.68 33.09 33.30 33.39 33.77 34.24 34.70
Exports 15.66 10.67 10.00 7.82 9.88 11.81 11.87 12.02 12.27
Private transfers from RoW 6.85 6.85 6.85 6.85 6.85 6.85 6.85 6.85 6.85
Official transfers from RoW 3.99 7.21 8.81 11.27 9.53 8.91 10.02 10.90 11.64
Factor income from RoW 0.78 0.70 0.69 0.64 0.68 0.72 0.72 0.72 0.72
Government borrowing 3.09 2.96 2.55 2.72 2.57 1.32 0.53 -0.03 -0.57
Private borrowing 0.74 0.00 0.00 0.00 0.00 0.00 0.00 0.00 0.00
FDI 3.79 3.79 3.79 3.79 3.79 3.79 3.79 3.79 3.79
Total 34.89 32.17 32.68 33.09 33.30 33.39 33.77 34.24 34.70
Fiscal Reveneues and Other Receipts (Percent of GDP)
Expenditures (Percent of GDP)
Balance of Payments (Percent of GDP)

70
Table A23: All MDGs with Domestic Resource Mobilization and Foreign Transfer Financing: Macro-economic Indicators -Growth Rate (Unless otherwise stated)
2007 2008 2009 2010 2011 2012 2013 2014 2015
Absorption 24636.1 13.8 9.2 9.9 2.5 3.7 7.6 7.7 7.5
Consumption - private 16397.4 11.1 7.8 5.6 1.7 4.4 5.8 5.8 5.7
Consumption - government 2341.0 17.4 13.6 23.0 14.2 11.9 11.7 10.8 11.3
Fixed investment - private 4046.7 12.6 9.0 8.9 3.2 5.0 7.5 7.5 7.2
Fixed investment - government 1789.7 40.0 15.0 27.0 -6.1 -13.2 14.3 16.2 14.0
Stock change 61.3 Eps Eps Eps Eps Eps Eps Eps Eps
Exports 3317.0 -17.4 0.9 -3.3 30.4 20.3 5.8 5.8 6.6
Imports 6766.2 10.5 10.2 11.2 -2.1 0.4 8.0 8.4 8.0
GDP at factor cost 19184.2 10.0 7.9 8.0 7.2 7.3 7.3 7.3 7.4
Total factor employment (index) 3.1 3.4 3.6 3.9 3.8 3.5 4.0 4.5
Total factor productivity (index) 6.9 4.5 4.5 3.4 3.5 3.7 3.3 2.9
Real exchange rate (index) -10.4 -2.1 -3.6 8.1 4.6 -0.9 -1.0 -0.6
Direct Taxes 3.92 3.73 3.58 3.58 3.64 3.79 3.93 4.08 4.22
Import tariffs 1.31 6.41 6.46 6.35 6.35 6.35 6.35 6.35 6.35
Other indirect taxes 8.15 3.16 3.06 5.00 7.14 7.46 7.86 8.21 8.61
Private transfers 0.00 0.00 0.00 0.00 0.00 0.00 0.00 0.00 0.00
Foreign transfers 3.99 7.24 8.95 9.94 7.22 6.37 7.66 8.81 9.78
Domestic borrowing 0.23 -0.23 -0.28 0.05 0.38 0.71 1.04 1.36 1.69
Foreign borrowing 3.09 2.96 2.55 2.72 2.57 1.32 0.53 -0.03 -0.57
Total 20.69 23.28 24.33 27.66 27.31 26.01 27.37 28.79 30.09
Consumption 11.05 11.71 12.26 13.79 14.56 15.26 15.98 16.49 17.00
Fixed investment 8.45 10.50 11.08 12.93 11.77 9.72 10.33 11.17 11.87
Domestic interest payments 0.99 0.87 0.77 0.72 0.72 0.76 0.81 0.90 1.02
Foreign interest payments 0.19 0.20 0.21 0.22 0.26 0.27 0.25 0.23 0.21
Total 20.69 23.28 24.33 27.66 27.31 26.01 27.37 28.79 30.09
Imports 31.94 28.71 28.67 28.06 27.38 26.84 26.71 26.70 26.69
Factor income to RoW 2.76 3.15 3.55 3.84 4.11 4.44 4.76 5.07 5.38
Net interest income to RoW 0.20 0.20 0.22 0.23 0.26 0.27 0.26 0.24 0.21
Total 34.89 32.06 32.44 32.13 31.75 31.56 31.72 32.02 32.28
Exports 15.66 10.52 9.63 8.19 10.65 12.51 12.20 11.90 11.75
Private transfers from RoW 6.85 6.85 6.85 6.85 6.85 6.85 6.85 6.85 6.85
Official transfers from RoW 3.99 7.24 8.95 9.94 7.22 6.37 7.66 8.81 9.78
Factor income from RoW 0.78 0.70 0.68 0.64 0.68 0.72 0.71 0.70 0.69
Government borrowing 3.09 2.96 2.55 2.72 2.57 1.32 0.53 -0.03 -0.57
Private borrowing 0.74 0.00 0.00 0.00 0.00 0.00 0.00 0.00 0.00
FDI 3.79 3.79 3.79 3.79 3.79 3.79 3.79 3.79 3.79
Total 34.89 32.06 32.44 32.13 31.75 31.56 31.72 32.02 32.28
Fiscal Reveneues and Other Receipts (Percent of GDP)
Expenditures (Percent of GDP)
Balance of Payments (Percent of GDP)

71
Table A23. Macro indicators by simulation and year (% of nominal GDP)
2007 2008 2009 2010 2011 2012 2013 2014 2015 Foreign savings mdg2-tax 7.6 6.9 6.9 6.9 6.9 6.9 6.9 6.9 6.9 Gross national savings mdg2-tax 20.2 23.8 25.1 31.8 23.9 20.4 20.0 20.1 20.4 Gross domestic savings mdg2-tax 11.6 15.5 17.2 24.2 16.7 13.6 13.6 14.1 14.7 Foreign government debt mdg2-tax 37.3 37.3 37.6 36.1 38.2 39.5 40.1 41.0 41.9 Foreign private debt mdg2-tax 0.0 0.0 0.0 0.0 0.0 0.0 0.0 0.0 0.0 Domestic government debt mdg2-tax 4.8 4.5 4.3 4.1 4.0 3.8 3.7 3.6 3.5 Foreign savings mdg2-ftr 7.6 6.9 6.9 6.9 6.9 6.9 6.9 6.9 6.9 Gross national savings mdg2-ftr 20.2 23.7 24.5 28.2 22.7 19.0 19.4 19.7 20.0 Gross domestic savings mdg2-ftr 11.6 11.3 10.4 8.5 8.4 8.8 9.4 10.4 11.6 Foreign government debt mdg2-ftr 37.3 35.5 34.9 27.0 35.4 39.0 39.5 40.6 41.8 Foreign private debt mdg2-ftr 0.0 0.0 0.0 0.0 0.0 0.0 0.0 0.0 0.0 Domestic government debt mdg2-ftr 4.8 4.4 4.2 3.7 3.8 3.7 3.6 3.5 3.4 Foreign savings mdg2-fb 7.6 11.4 13.7 20.8 15.1 11.0 11.2 10.9 10.3 Gross national savings mdg2-fb 20.2 19.2 17.7 14.3 14.5 14.8 15.0 15.7 16.6 Gross domestic savings mdg2-fb 11.6 11.3 10.4 8.5 8.4 8.8 9.4 10.4 11.6 Foreign government debt mdg2-fb 37.3 40.0 45.7 48.4 69.2 77.6 79.8 82.8 85.6 Foreign private debt mdg2-fb 0.0 0.0 0.0 0.0 0.0 0.0 0.0 0.0 0.0 Domestic government debt mdg2-fb 4.8 4.4 4.2 3.7 3.8 3.7 3.6 3.5 3.4 Foreign savings mdg2-db 7.6 6.9 6.9 6.9 6.9 6.9 6.9 6.9 6.9 Gross national savings mdg2-db 20.2 23.5 24.7 30.5 23.6 20.5 19.9 20.0 20.3 Gross domestic savings mdg2-db 11.6 15.3 16.8 23.1 16.6 13.9 13.6 14.1 14.7 Foreign government debt mdg2-db 37.3 38.2 38.9 39.4 39.5 39.8 40.2 41.0 41.7 Foreign private debt mdg2-db 0.0 0.0 0.0 0.0 0.0 0.0 0.0 0.0 0.0 Domestic government debt mdg2-db 4.8 9.9 19.6 42.2 60.2 77.4 96.6 119.1 145.3 Foreign savings mdg45-tax 7.6 6.9 6.9 6.9 6.9 6.9 6.9 6.9 6.9 Gross national savings mdg45-tax 20.2 22.9 22.7 21.8 21.9 23.0 23.7 24.5 25.4 Gross domestic savings mdg45-tax 11.6 14.6 14.8 14.3 14.8 16.2 17.3 18.3 19.5 Foreign government debt mdg45-tax 37.3 37.7 38.5 39.3 39.8 40.0 40.1 40.3 40.5 Foreign private debt mdg45-tax 0.0 0.0 0.0 0.0 0.0 0.0 0.0 0.0 0.0 Domestic government debt mdg45-tax 4.8 4.5 4.3 4.2 4.0 3.9 3.8 3.6 3.5 Foreign savings mdg45-ftr 7.6 6.9 6.9 6.9 6.9 6.9 6.9 6.9 6.9 Gross national savings mdg45-ftr 20.2 22.6 22.4 21.6 21.5 22.3 22.9 23.4 23.9 Gross domestic savings mdg45-ftr 11.6 11.7 11.4 11.3 11.3 11.3 11.2 11.1 10.9 Foreign government debt mdg45-ftr 37.3 36.6 37.3 38.2 38.6 38.3 38.0 37.7 37.3 Foreign private debt mdg45-ftr 0.0 0.0 0.0 0.0 0.0 0.0 0.0 0.0 0.0 Domestic government debt mdg45-ftr 4.8 4.5 4.3 4.1 4.0 3.8 3.7 3.5 3.4 Foreign savings mdg45-fb 7.6 9.8 10.3 10.0 10.4 11.7 12.8 13.9 15.1 Gross national savings mdg45-fb 20.2 19.7 19.0 18.5 18.0 17.6 17.0 16.3 15.7 Gross domestic savings mdg45-fb 11.6 11.7 11.4 11.3 11.3 11.3 11.2 11.1 10.9 Foreign government debt mdg45-fb 37.3 39.5 43.4 47.1 50.4 53.9 58.1 63.0 68.5 Foreign private debt mdg45-fb 0.0 0.0 0.0 0.0 0.0 0.0 0.0 0.0 0.0 Domestic government debt mdg45-fb 4.8 4.5 4.3 4.1 4.0 3.8 3.7 3.5 3.4 Foreign savings mdg45-db 7.6 6.9 6.9 6.9 6.9 6.9 6.9 6.9 6.9 Gross national savings mdg45-db 20.2 22.8 22.5 21.7 21.7 22.7 23.4 24.1 24.9 Gross domestic savings mdg45-db 11.6 14.5 14.7 14.2 14.7 16.0 17.1 18.1 19.3 Foreign government debt mdg45-db 37.3 38.3 39.1 39.8 40.3 40.8 41.1 41.4 41.8 Foreign private debt mdg45-db 0.0 0.0 0.0 0.0 0.0 0.0 0.0 0.0 0.0 Domestic government debt mdg45-db 4.8 8.4 13.3 18.8 25.9 36.1 49.8 67.7 90.8 Foreign savings mdg7a-tax 7.6 6.9 6.9 6.9 6.9 6.9 6.9 6.9 6.9 Gross national savings mdg7a-tax 20.2 20.5 20.4 20.3 20.4 20.7 21.0 21.3 21.6 Gross domestic savings mdg7a-tax 11.6 12.3 12.5 12.9 13.3 14.0 14.6 15.3 15.9 Foreign government debt mdg7a-tax 37.3 38.0 38.9 39.5 40.0 40.5 40.8 41.2 41.6 Foreign private debt mdg7a-tax 0.0 0.0 0.0 0.0 0.0 0.0 0.0 0.0 0.0 Domestic government debt mdg7a-tax 4.8 4.5 4.3 4.2 4.0 3.9 3.8 3.6 3.5 Foreign savings mdg7a-ftr 7.6 6.9 6.9 6.9 6.9 6.9 6.9 6.9 6.9 Gross national savings mdg7a-ftr 20.2 20.5 20.4 20.3 20.4 20.6 20.8 21.0 21.3 Gross domestic savings mdg7a-ftr 11.6 11.8 11.7 11.7 11.8 12.1 12.2 12.4 12.7 Foreign government debt mdg7a-ftr 37.3 37.8 38.6 39.1 39.5 39.8 40.0 40.3 40.5 Foreign private debt mdg7a-ftr 0.0 0.0 0.0 0.0 0.0 0.0 0.0 0.0 0.0 Domestic government debt mdg7a-ftr 4.8 4.5 4.3 4.2 4.0 3.9 3.7 3.6 3.5 Foreign savings mdg7a-fb 7.6 7.4 7.7 8.1 8.5 8.9 9.4 9.8 10.2 Gross national savings mdg7a-fb 20.2 20.0 19.5 19.1 18.7 18.6 18.3 18.1 18.0 Gross domestic savings mdg7a-fb 11.6 11.8 11.7 11.7 11.8 12.1 12.2 12.4 12.7 Foreign government debt mdg7a-fb 37.3 38.3 39.9 41.6 43.5 45.6 47.8 50.4 53.3 Foreign private debt mdg7a-fb 0.0 0.0 0.0 0.0 0.0 0.0 0.0 0.0 0.0 Domestic government debt mdg7a-fb 4.8 4.5 4.3 4.2 4.0 3.9 3.7 3.6 3.5 Foreign savings mdg7a-db 7.6 6.9 6.9 6.9 6.9 6.9 6.9 6.9 6.9 Gross national savings mdg7a-db 20.2 20.5 20.3 20.3 20.3 20.6 20.8 21.1 21.4 Gross domestic savings mdg7a-db 11.6 12.2 12.5 12.8 13.3 14.0 14.5 15.2 15.8 Foreign government debt mdg7a-db 37.3 38.1 39.0 39.7 40.3 40.8 41.2 41.6 42.1 Foreign private debt mdg7a-db 0.0 0.0 0.0 0.0 0.0 0.0 0.0 0.0 0.0 Domestic government debt mdg7a-db 4.8 5.1 6.1 7.8 10.3 13.9 18.7 25.0 33.1 Foreign savings mdg7b-tax 7.6 6.9 6.9 6.9 6.9 6.9 6.9 6.9 6.9 Gross national savings mdg7b-tax 20.2 20.5 20.4 20.4 20.6 20.9 21.2 21.5 21.9 Gross domestic savings mdg7b-tax 11.6 12.2 12.5 13.0 13.5 14.2 14.9 15.5 16.2 Foreign government debt mdg7b-tax 37.3 38.0 38.9 39.5 40.0 40.4 40.7 41.0 41.4 Foreign private debt mdg7b-tax 0.0 0.0 0.0 0.0 0.0 0.0 0.0 0.0 0.0 Domestic government debt mdg7b-tax 4.8 4.5 4.3 4.2 4.0 3.9 3.8 3.6 3.5 Foreign savings mdg7b-ftr 7.6 6.9 6.9 6.9 6.9 6.9 6.9 6.9 6.9 Gross national savings mdg7b-ftr 20.2 20.5 20.4 20.4 20.4 20.7 20.8 21.1 21.4 Gross domestic savings mdg7b-ftr 11.6 11.8 11.8 11.7 11.8 12.1 12.2 12.3 12.5 Foreign government debt mdg7b-ftr 37.3 37.9 38.6 39.1 39.5 39.7 39.9 40.1 40.4 Foreign private debt mdg7b-ftr 0.0 0.0 0.0 0.0 0.0 0.0 0.0 0.0 0.0 Domestic government debt mdg7b-ftr 4.8 4.5 4.3 4.2 4.0 3.9 3.7 3.6 3.5

72
Foreign savings mdg7b-fb 7.6 7.3 7.7 8.1 8.6 9.0 9.5 10.0 10.5 Gross national savings mdg7b-fb 20.2 20.1 19.6 19.1 18.7 18.6 18.2 18.0 17.8 Gross domestic savings mdg7b-fb 11.6 11.8 11.8 11.7 11.8 12.1 12.2 12.3 12.5 Foreign government debt mdg7b-fb 37.3 38.3 39.8 41.4 43.3 45.5 47.8 50.6 53.7 Foreign private debt mdg7b-fb 0.0 0.0 0.0 0.0 0.0 0.0 0.0 0.0 0.0 Domestic government debt mdg7b-fb 4.8 4.5 4.3 4.2 4.0 3.9 3.7 3.6 3.5 Foreign savings mdg7b-db 7.6 6.9 6.9 6.9 6.9 6.9 6.9 6.9 6.9 Gross national savings mdg7b-db 20.2 20.5 20.3 20.4 20.5 20.8 21.0 21.3 21.7 Gross domestic savings mdg7b-db 11.6 12.2 12.5 12.9 13.4 14.1 14.7 15.4 16.1 Foreign government debt mdg7b-db 37.3 38.1 39.0 39.7 40.3 40.8 41.2 41.6 42.0 Foreign private debt mdg7b-db 0.0 0.0 0.0 0.0 0.0 0.0 0.0 0.0 0.0 Domestic government debt mdg7b-db 4.8 5.0 6.0 7.9 10.7 14.9 20.6 28.1 37.8 Foreign savings mdg-ftr 7.6 6.9 6.9 6.9 6.9 6.9 6.9 6.9 6.9 Gross national savings mdg-ftr 20.2 25.6 26.3 27.4 24.1 21.8 21.9 22.3 22.7 Gross domestic savings mdg-ftr 11.6 11.0 9.7 8.0 6.7 6.3 6.1 6.1 6.3 Foreign government debt mdg-ftr 37.3 33.9 32.5 21.5 31.7 34.3 33.7 33.3 33.1 Foreign private debt mdg-ftr 0.0 0.0 0.0 0.0 0.0 0.0 0.0 0.0 0.0 Domestic government debt mdg-ftr 4.8 4.4 4.1 3.5 3.6 3.5 3.4 3.2 3.1 Foreign savings mdg-tax 7.6 6.9 6.9 6.9 6.9 6.9 6.9 6.9 6.9 Gross national savings mdg-tax 20.2 30.3 29.5 38.1 24.3 21.4 25.7 27.0 27.0 Gross domestic savings mdg-tax 11.6 21.9 21.6 30.4 17.1 14.5 19.1 20.7 20.9 Foreign government debt mdg-tax 37.3 35.7 36.1 33.3 37.2 38.1 37.4 37.6 38.0 Foreign private debt mdg-tax 0.0 0.0 0.0 0.0 0.0 0.0 0.0 0.0 0.0 Domestic government debt mdg-tax 4.8 4.4 4.2 4.0 3.9 3.8 3.6 3.5 3.4 Foreign savings mdg-fb 7.6 13.8 16.6 21.3 18.8 17.2 18.0 18.8 19.6 Gross national savings mdg-fb 20.2 18.7 16.6 13.0 12.2 11.5 10.8 10.3 10.0 Gross domestic savings mdg-fb 11.6 11.0 9.7 8.0 6.7 6.3 6.1 6.1 6.3 Foreign government debt mdg-fb 37.3 40.9 48.2 44.9 74.6 86.9 91.8 97.4 103.4 Foreign private debt mdg-fb 0.0 0.0 0.0 0.0 0.0 0.0 0.0 0.0 0.0 Domestic government debt mdg-fb 4.8 4.4 4.1 3.5 3.6 3.5 3.4 3.2 3.1 Foreign savings mdg-db 7.6 6.9 6.9 6.9 6.9 6.9 6.9 6.9 6.9 Gross national savings mdg-db 20.2 30.3 28.7 35.8 23.5 21.0 24.7 25.8 25.6 Gross domestic savings mdg-db 11.6 22.0 20.9 28.4 16.6 14.4 18.6 19.9 20.1 Foreign government debt mdg-db 37.3 38.3 38.7 38.7 38.6 38.7 39.1 39.4 39.7 Foreign private debt mdg-db 0.0 0.0 0.0 0.0 0.0 0.0 0.0 0.0 0.0 Domestic government debt mdg-db 4.8 21.6 42.2 81.8 112.9 146.2 191.6 248.6 317.3

73
Table B1: Baseline Expenditure (Percent of GDP) 2007 2008 2009 2010 2011 2012 2013 2014 2015
Current Expenditure-Primary Education 1.39 1.44 1.29 1.29 1.29 1.29 1.29 1.29 1.29Current Expenditure-Secondary Education 0.55 0.53 0.51 0.51 0.51 0.51 0.51 0.51 0.51Current Expenditure-Tertiary Education 0.38 0.42 0.36 0.36 0.36 0.36 0.36 0.36 0.36Current Expenditure-Health 1.10 1.23 1.15 1.15 1.15 1.15 1.15 1.15 1.15Current Expenditure-Water and Sanitation 0.02 0.06 0.07 0.07 0.07 0.07 0.07 0.07 0.07Current Expenditure-Agriculture 0.14 0.14 0.14 0.14 0.14 0.14 0.14 0.14 0.14Current Expenditure-Roads 0.77 0.81 0.80 0.90 0.99 1.06 1.10 1.13 1.16Current Expenditure-Other Government 6.70 6.70 6.70 6.70 6.70 6.70 6.70 6.70 6.70Domestic Interest Payments 0.99 0.88 0.80 0.76 0.75 0.78 0.84 0.93 1.05Foreign Interest Payments 0.19 0.21 0.23 0.26 0.28 0.28 0.27 0.26 0.24Capital Expenditure-Primary Education 0.07 0.77 0.29 0.44 0.71 0.71 0.71 0.75 0.79Capital Expenditure-Secondary Education 0.03 0.15 0.16 0.25 0.33 0.33 0.33 0.34 0.36Capital Expenditure-Tertiary Education 0.08 0.11 0.01 0.01 0.04 0.04 0.04 0.04 0.04Capital Expenditure-Health 0.98 1.50 0.43 0.25 0.49 0.50 0.49 0.51 0.54Capital Expenditure-Water and Sanitation 0.33 0.61 0.50 0.45 0.43 0.42 0.44 0.45 0.46Capital Expenditure-Agriculture 0.57 0.57 0.48 0.43 0.45 0.46 0.46 0.47 0.50Capital Expenditure-Roads 2.23 1.27 3.11 3.15 3.15 2.59 2.59 2.59 2.59Capital Expenditure-Other Government 4.17 3.41 2.66 2.24 2.24 2.23 2.20 2.27 2.36total 20.69 20.80 19.70 19.35 20.08 19.63 19.71 19.97 20.31 Table B1: MDG2 Tax Financing- Expenditure (Percent of GDP)
2007 2008 2009 2010 2011 2012 2013 2014 2015Current Expenditure-Primary Education 1.39 2.24 3.77 6.54 5.96 5.59 5.20 4.45 3.64Current Expenditure-Secondary Education 0.55 0.53 0.51 0.51 0.51 0.51 0.51 0.51 0.51Current Expenditure-Tertiary Education 0.38 0.42 0.36 0.36 0.36 0.36 0.36 0.36 0.36Current Expenditure-Health 1.10 1.23 1.15 1.15 1.15 1.15 1.15 1.15 1.15Current Expenditure-Water and Sanitation 0.02 0.06 0.07 0.07 0.07 0.07 0.07 0.07 0.07Current Expenditure-Agriculture 0.14 0.14 0.14 0.13 0.14 0.14 0.14 0.14 0.14Current Expenditure-Roads 0.77 0.80 0.78 0.85 0.95 1.04 1.08 1.12 1.15Current Expenditure-Other Government 6.70 6.62 6.51 6.33 6.48 6.53 6.56 6.60 6.63Domestic Interest Payments 0.99 0.88 0.79 0.73 0.73 0.77 0.83 0.93 1.05Foreign Interest Payments 0.19 0.20 0.23 0.24 0.27 0.27 0.27 0.26 0.24Capital Expenditure-Primary Education 0.07 3.98 6.78 13.25 2.39Capital Expenditure-Secondary Education 0.03 0.16 0.19 0.31 0.37 0.33 0.32 0.32 0.34Capital Expenditure-Tertiary Education 0.08 0.11 0.02 0.03 0.04 0.03 0.04 0.04 0.04Capital Expenditure-Health 0.98 1.60 0.54 0.43 0.44 0.40 0.47 0.49 0.50Capital Expenditure-Water and Sanitation 0.33 0.39 0.24 0.74 0.82 0.47 0.44 0.46Capital Expenditure-Agriculture 0.57 0.57 0.48 0.43 0.45 0.46 0.45 0.47 0.50Capital Expenditure-Roads 2.23 1.27 3.13 3.17 3.12 2.56 2.56 2.57 2.57Capital Expenditure-Other Government 4.17 3.20 2.38 1.73 2.52 2.60 2.23 2.25 2.35total 20.69 24.42 28.08 36.27 26.71 23.64 22.71 22.16 21.70 Table B2: MDG2 Foreign Transfer Financing- Expenditure (Percent of GDP)
2007 2008 2009 2010 2011 2012 2013 2014 2015Current Expenditure-Primary Education 1.39 1.79 2.10 3.09 3.01 2.85 2.62 2.18 1.71Current Expenditure-Secondary Education 0.55 0.53 0.51 0.51 0.51 0.51 0.51 0.51 0.51Current Expenditure-Tertiary Education 0.38 0.42 0.36 0.36 0.36 0.36 0.36 0.36 0.36Current Expenditure-Health 1.10 1.23 1.15 1.15 1.15 1.15 1.15 1.15 1.15Current Expenditure-Water and Sanitation 0.02 0.06 0.07 0.07 0.07 0.07 0.07 0.07 0.07Current Expenditure-Agriculture 0.14 0.14 0.14 0.14 0.14 0.14 0.14 0.14 0.14Current Expenditure-Roads 0.77 0.80 0.79 0.88 0.97 1.05 1.09 1.13 1.15Current Expenditure-Other Government 6.70 6.65 6.63 6.55 6.59 6.62 6.63 6.65 6.67Domestic Interest Payments 0.99 0.87 0.79 0.73 0.73 0.77 0.84 0.93 1.05Foreign Interest Payments 0.19 0.20 0.22 0.23 0.27 0.28 0.28 0.26 0.24Capital Expenditure-Primary Education 0.07 2.20 2.01 3.94 1.90 0.06 0.11Capital Expenditure-Secondary Education 0.03 0.18 0.18 0.29 0.32 0.30 0.31 0.33 0.34Capital Expenditure-Tertiary Education 0.08 0.11 0.01 0.02 0.04 0.03 0.04 0.04 0.04Capital Expenditure-Health 0.98 1.53 0.45 0.30 0.48 0.45 0.48 0.50 0.52Capital Expenditure-Water and Sanitation 0.33 0.66 0.54 0.52 0.42 0.36 0.41 0.43 0.43Capital Expenditure-Agriculture 0.57 0.56 0.47 0.40 0.44 0.46 0.45 0.47 0.50Capital Expenditure-Roads 2.23 1.25 3.03 2.98 3.05 2.55 2.55 2.57 2.58Capital Expenditure-Other Government 4.17 3.41 2.63 2.19 2.16 2.14 2.16 2.23 2.33total 20.69 22.60 22.10 24.36 22.63 20.17 20.20 19.95 19.81

74
Table B3: MDG2 Foreign Borrowing Financing- Expenditure (Percent of GDP) 2007 2008 2009 2010 2011 2012 2013 2014 2015
Current Expenditure-Primary Education 1.39 1.79 2.10 3.09 3.01 2.85 2.62 2.18 1.71Current Expenditure-Secondary Education 0.55 0.53 0.51 0.51 0.51 0.51 0.51 0.51 0.51Current Expenditure-Tertiary Education 0.38 0.42 0.36 0.36 0.36 0.36 0.36 0.36 0.36Current Expenditure-Health 1.10 1.23 1.15 1.15 1.15 1.15 1.15 1.15 1.15Current Expenditure-Water and Sanitation 0.02 0.06 0.07 0.07 0.07 0.07 0.07 0.07 0.07Current Expenditure-Agriculture 0.14 0.14 0.14 0.14 0.14 0.14 0.14 0.14 0.14Current Expenditure-Roads 0.77 0.80 0.79 0.88 0.97 1.05 1.09 1.13 1.15Current Expenditure-Other Government 6.70 6.65 6.63 6.55 6.59 6.62 6.63 6.65 6.67Domestic Interest Payments 0.99 0.87 0.79 0.73 0.73 0.77 0.84 0.93 1.05Foreign Interest Payments 0.19 0.23 0.28 0.36 0.44 0.46 0.46 0.44 0.41Capital Expenditure-Primary Education 0.07 2.20 2.01 3.94 1.90 0.06 0.11Capital Expenditure-Secondary Education 0.03 0.18 0.18 0.29 0.32 0.30 0.31 0.33 0.34Capital Expenditure-Tertiary Education 0.08 0.11 0.01 0.02 0.04 0.03 0.04 0.04 0.04Capital Expenditure-Health 0.98 1.53 0.45 0.30 0.48 0.45 0.48 0.50 0.52Capital Expenditure-Water and Sanitation 0.33 0.66 0.54 0.52 0.42 0.36 0.41 0.43 0.43Capital Expenditure-Agriculture 0.57 0.56 0.47 0.40 0.44 0.46 0.45 0.47 0.50Capital Expenditure-Roads 2.23 1.25 3.03 2.98 3.05 2.55 2.55 2.57 2.58Capital Expenditure-Other Government 4.17 3.41 2.63 2.19 2.16 2.14 2.16 2.23 2.33total 20.69 22.63 22.16 24.49 22.80 20.35 20.38 20.13 19.97 Table B4: MDG2 Domestic Borrowing Financing- Expenditure (Percent of GDP)
2007 2008 2009 2010 2011 2012 2013 2014 2015Current Expenditure-Primary Education 1.39 2.27 3.91 6.92 6.10 5.67 5.25 4.48 3.65Current Expenditure-Secondary Education 0.55 0.53 0.51 0.51 0.51 0.51 0.51 0.51 0.51Current Expenditure-Tertiary Education 0.38 0.42 0.36 0.36 0.36 0.36 0.36 0.36 0.36Current Expenditure-Health 1.10 1.23 1.15 1.15 1.15 1.15 1.15 1.15 1.15Current Expenditure-Water and Sanitation 0.02 0.06 0.07 0.07 0.07 0.07 0.07 0.07 0.07Current Expenditure-Agriculture 0.14 0.14 0.14 0.14 0.14 0.14 0.14 0.14 0.14Current Expenditure-Roads 0.77 0.80 0.79 0.88 0.97 1.05 1.09 1.12 1.15Current Expenditure-Other Government 6.70 6.68 6.63 6.56 6.56 6.57 6.59 6.61 6.63Domestic Interest Payments 0.99 1.81 4.10 9.09 12.44 15.87 19.63 23.95 28.90Foreign Interest Payments 0.19 0.21 0.23 0.26 0.27 0.27 0.27 0.25 0.23Capital Expenditure-Primary Education 0.07 4.01 6.79 13.09 2.24Capital Expenditure-Secondary Education 0.03 0.13 0.15 0.24 0.40 0.38 0.33 0.32 0.34Capital Expenditure-Tertiary Education 0.08 0.11 0.02 0.02 0.04 0.04 0.04 0.04 0.04Capital Expenditure-Health 0.98 1.52 0.46 0.31 0.51 0.49 0.48 0.49 0.51Capital Expenditure-Water and Sanitation 0.33 0.37 0.21 0.73 0.83 0.47 0.44 0.46Capital Expenditure-Agriculture 0.57 0.57 0.48 0.42 0.44 0.45 0.45 0.47 0.49Capital Expenditure-Roads 2.23 1.26 3.08 3.08 3.07 2.53 2.53 2.54 2.55Capital Expenditure-Other Government 4.17 3.16 2.32 1.65 2.50 2.59 2.22 2.24 2.34total 20.69 25.30 31.41 44.74 38.50 38.97 41.57 45.19 49.53 Table B5: MDG45 Tax Financing- Expenditure (Percent of GDP)
2007 2008 2009 2010 2011 2012 2013 2014 2015Current Expenditure-Primary Education 1.39 1.44 1.29 1.29 1.29 1.29 1.29 1.29 1.29Current Expenditure-Secondary Education 0.55 0.53 0.51 0.51 0.51 0.51 0.51 0.51 0.51Current Expenditure-Tertiary Education 0.38 0.42 0.36 0.36 0.36 0.36 0.36 0.36 0.36Current Expenditure-Health 1.10 1.42 1.88 2.28 2.66 3.09 3.75 4.46 5.22Current Expenditure-Water and Sanitation 0.02 0.06 0.07 0.07 0.07 0.07 0.07 0.07 0.07Current Expenditure-Agriculture 0.14 0.14 0.14 0.14 0.14 0.14 0.14 0.14 0.14Current Expenditure-Roads 0.77 0.81 0.80 0.90 0.99 1.07 1.11 1.14 1.17Current Expenditure-Other Government 6.70 6.68 6.67 6.68 6.69 6.70 6.73 6.73 6.73Domestic Interest Payments 0.99 0.88 0.80 0.76 0.75 0.78 0.84 0.93 1.05Foreign Interest Payments 0.19 0.21 0.23 0.25 0.27 0.28 0.27 0.25 0.23Capital Expenditure-Primary Education 0.07 0.71 0.21 0.39 0.71 0.68 0.60 0.63 0.71Capital Expenditure-Secondary Education 0.03 0.15 0.16 0.25 0.34 0.34 0.32 0.34 0.38Capital Expenditure-Tertiary Education 0.08 0.11 0.01 0.01 0.04 0.04 0.04 0.04 0.05Capital Expenditure-Health 0.98 2.83 3.45 3.23 2.93 3.35 4.76 5.88 6.51Capital Expenditure-Water and Sanitation 0.33 0.52 0.38 0.38 0.42 0.38 0.30 0.29 0.32Capital Expenditure-Agriculture 0.57 0.57 0.48 0.43 0.46 0.47 0.46 0.48 0.51Capital Expenditure-Roads 2.23 1.27 3.13 3.17 3.16 2.60 2.61 2.62 2.63Capital Expenditure-Other Government 4.17 3.33 2.53 2.16 2.23 2.18 2.07 2.11 2.22total 20.69 22.09 23.11 23.28 24.03 24.34 26.24 28.29 30.10

75
Table B6: MDG45 Foreign Transfer Financing- Expenditure (Percent of GDP) 2007 2008 2009 2010 2011 2012 2013 2014 2015
Current Expenditure-Primary Education 1.39 1.44 1.29 1.29 1.29 1.29 1.29 1.29 1.29Current Expenditure-Secondary Education 0.55 0.53 0.51 0.51 0.51 0.51 0.51 0.51 0.51Current Expenditure-Tertiary Education 0.38 0.42 0.36 0.36 0.36 0.36 0.36 0.36 0.36Current Expenditure-Health 1.10 1.37 1.74 2.10 2.47 2.88 3.44 4.04 4.67Current Expenditure-Water and Sanitation 0.02 0.06 0.07 0.07 0.07 0.07 0.07 0.07 0.07Current Expenditure-Agriculture 0.14 0.14 0.14 0.14 0.14 0.14 0.14 0.15 0.15Current Expenditure-Roads 0.77 0.80 0.80 0.90 0.99 1.07 1.12 1.16 1.18Current Expenditure-Other Government 6.70 6.68 6.66 6.67 6.70 6.73 6.78 6.80 6.80Domestic Interest Payments 0.99 0.87 0.79 0.74 0.74 0.76 0.82 0.91 1.02Foreign Interest Payments 0.19 0.20 0.22 0.24 0.26 0.27 0.25 0.23 0.21Capital Expenditure-Primary Education 0.07 0.80 0.34 0.46 0.68 0.66 0.65 0.70 0.77Capital Expenditure-Secondary Education 0.03 0.16 0.18 0.26 0.32 0.31 0.30 0.33 0.36Capital Expenditure-Tertiary Education 0.08 0.11 0.01 0.01 0.04 0.04 0.03 0.04 0.04Capital Expenditure-Health 0.98 2.45 2.75 2.77 2.77 3.05 3.86 4.53 4.99Capital Expenditure-Water and Sanitation 0.33 0.64 0.54 0.46 0.42 0.41 0.43 0.46 0.47Capital Expenditure-Agriculture 0.57 0.56 0.47 0.41 0.44 0.45 0.44 0.44 0.46Capital Expenditure-Roads 2.23 1.26 3.03 3.06 3.05 2.49 2.46 2.42 2.39Capital Expenditure-Other Government 4.17 3.41 2.62 2.19 2.16 2.14 2.09 2.13 2.20total 20.69 21.92 22.54 22.66 23.42 23.65 25.06 26.56 27.94 Table B7: MDG45 Foreign Borrowing Financing- Expenditure (Percent of GDP)
2007 2008 2009 2010 2011 2012 2013 2014 2015Current Expenditure-Primary Education 1.39 1.44 1.29 1.29 1.29 1.29 1.29 1.29 1.29Current Expenditure-Secondary Education 0.55 0.53 0.51 0.51 0.51 0.51 0.51 0.51 0.51Current Expenditure-Tertiary Education 0.38 0.42 0.36 0.36 0.36 0.36 0.36 0.36 0.36Current Expenditure-Health 1.10 1.37 1.74 2.10 2.47 2.88 3.44 4.04 4.67Current Expenditure-Water and Sanitation 0.02 0.06 0.07 0.07 0.07 0.07 0.07 0.07 0.07Current Expenditure-Agriculture 0.14 0.14 0.14 0.14 0.14 0.14 0.14 0.15 0.15Current Expenditure-Roads 0.77 0.80 0.80 0.90 0.99 1.07 1.12 1.16 1.18Current Expenditure-Other Government 6.70 6.68 6.66 6.67 6.70 6.73 6.78 6.80 6.80Domestic Interest Payments 0.99 0.87 0.79 0.74 0.74 0.76 0.82 0.91 1.02Foreign Interest Payments 0.19 0.22 0.28 0.35 0.41 0.46 0.51 0.57 0.63Capital Expenditure-Primary Education 0.07 0.80 0.34 0.46 0.68 0.66 0.65 0.70 0.77Capital Expenditure-Secondary Education 0.03 0.16 0.18 0.26 0.32 0.31 0.30 0.33 0.36Capital Expenditure-Tertiary Education 0.08 0.11 0.01 0.01 0.04 0.04 0.03 0.04 0.04Capital Expenditure-Health 0.98 2.45 2.75 2.77 2.77 3.05 3.86 4.53 4.99Capital Expenditure-Water and Sanitation 0.33 0.64 0.54 0.46 0.42 0.41 0.43 0.46 0.47Capital Expenditure-Agriculture 0.57 0.56 0.47 0.41 0.44 0.45 0.44 0.44 0.46Capital Expenditure-Roads 2.23 1.26 3.03 3.06 3.05 2.49 2.46 2.42 2.39Capital Expenditure-Other Government 4.17 3.41 2.62 2.19 2.16 2.14 2.09 2.13 2.20total 20.69 21.93 22.60 22.76 23.56 23.84 25.32 26.90 28.37 Table B8: MDG45 Domestic Borrowing Financing- Expenditure (Percent of GDP)
2007 2008 2009 2010 2011 2012 2013 2014 2015Current Expenditure-Primary Education 1.39 1.44 1.29 1.29 1.29 1.29 1.29 1.29 1.29Current Expenditure-Secondary Education 0.55 0.53 0.51 0.51 0.51 0.51 0.51 0.51 0.51Current Expenditure-Tertiary Education 0.38 0.42 0.36 0.36 0.36 0.36 0.36 0.36 0.36Current Expenditure-Health 1.10 1.43 1.91 2.32 2.70 3.16 3.86 4.63 5.45Current Expenditure-Water and Sanitation 0.02 0.06 0.07 0.07 0.07 0.07 0.07 0.07 0.07Current Expenditure-Agriculture 0.14 0.14 0.14 0.14 0.14 0.14 0.15 0.15 0.15Current Expenditure-Roads 0.77 0.81 0.80 0.91 0.99 1.08 1.13 1.17 1.21Current Expenditure-Other Government 6.70 6.70 6.72 6.74 6.75 6.79 6.86 6.91 6.95Domestic Interest Payments 0.99 1.21 2.08 3.31 4.81 6.85 9.75 13.67 18.71Foreign Interest Payments 0.19 0.21 0.23 0.26 0.28 0.28 0.27 0.26 0.23Capital Expenditure-Primary Education 0.07 0.68 0.17 0.37 0.69 0.63 0.52 0.54 0.62Capital Expenditure-Secondary Education 0.03 0.13 0.14 0.24 0.33 0.31 0.28 0.30 0.34Capital Expenditure-Tertiary Education 0.08 0.11 0.01 0.01 0.04 0.04 0.03 0.04 0.04Capital Expenditure-Health 0.98 2.84 3.47 3.23 2.91 3.33 4.73 5.82 6.38Capital Expenditure-Water and Sanitation 0.33 0.52 0.36 0.37 0.42 0.36 0.28 0.27 0.29Capital Expenditure-Agriculture 0.57 0.57 0.48 0.43 0.45 0.46 0.45 0.47 0.49Capital Expenditure-Roads 2.23 1.27 3.11 3.14 3.14 2.57 2.57 2.56 2.55Capital Expenditure-Other Government 4.17 3.32 2.51 2.14 2.21 2.15 2.02 2.04 2.14total 20.69 22.40 24.38 25.84 28.10 30.40 35.15 41.05 47.78

76
Table B9: MDG7a Tax Financing- Expenditure (Percent of GDP) 2007 2008 2009 2010 2011 2012 2013 2014 2015
Current Expenditure-Primary Education 1.39 1.44 1.29 1.29 1.29 1.29 1.29 1.29 1.29Current Expenditure-Secondary Education 0.55 0.53 0.51 0.51 0.51 0.51 0.51 0.51 0.51Current Expenditure-Tertiary Education 0.38 0.42 0.36 0.36 0.36 0.36 0.36 0.36 0.36Current Expenditure-Health 1.10 1.23 1.15 1.15 1.15 1.15 1.15 1.15 1.15Current Expenditure-Water and Sanitation 0.02 0.15 0.46 0.76 1.12 1.50 1.89 2.29 2.71Current Expenditure-Agriculture 0.14 0.14 0.14 0.14 0.14 0.14 0.14 0.14 0.14Current Expenditure-Roads 0.77 0.81 0.80 0.90 0.98 1.05 1.09 1.11 1.13Current Expenditure-Other Government 6.70 6.69 6.68 6.66 6.64 6.63 6.61 6.59 6.57Domestic Interest Payments 0.99 0.88 0.80 0.76 0.75 0.78 0.84 0.93 1.05Foreign Interest Payments 0.19 0.21 0.23 0.26 0.27 0.28 0.27 0.25 0.23Capital Expenditure-Primary Education 0.07 0.76 0.28 0.43 0.70 0.70 0.70 0.74 0.77Capital Expenditure-Secondary Education 0.03 0.15 0.16 0.25 0.33 0.34 0.34 0.35 0.37Capital Expenditure-Tertiary Education 0.08 0.11 0.01 0.01 0.04 0.04 0.04 0.04 0.04Capital Expenditure-Health 0.98 1.51 0.44 0.26 0.51 0.52 0.52 0.54 0.56Capital Expenditure-Water and Sanitation 0.33 0.74 0.89 0.97 1.05 1.15 1.25 1.35 1.45Capital Expenditure-Agriculture 0.57 0.57 0.48 0.43 0.45 0.46 0.46 0.47 0.50Capital Expenditure-Roads 2.23 1.27 3.11 3.15 3.15 2.59 2.59 2.59 2.59Capital Expenditure-Other Government 4.17 3.40 2.63 2.21 2.21 2.20 2.17 2.23 2.32total 20.69 21.01 20.43 20.50 21.67 21.68 22.22 22.94 23.75 Table B10: MDG7a Foreign Transfer Financing- Expenditure (Percent of GDP)
2007 2008 2009 2010 2011 2012 2013 2014 2015Current Expenditure-Primary Education 1.39 1.44 1.29 1.29 1.29 1.29 1.29 1.29 1.29Current Expenditure-Secondary Education 0.55 0.53 0.51 0.51 0.51 0.51 0.51 0.51 0.51Current Expenditure-Tertiary Education 0.38 0.42 0.36 0.36 0.36 0.36 0.36 0.36 0.36Current Expenditure-Health 1.10 1.23 1.15 1.15 1.15 1.15 1.15 1.15 1.15Current Expenditure-Water and Sanitation 0.02 0.14 0.41 0.68 1.01 1.36 1.73 2.10 2.47Current Expenditure-Agriculture 0.14 0.14 0.14 0.14 0.14 0.14 0.14 0.14 0.14Current Expenditure-Roads 0.77 0.81 0.80 0.90 0.98 1.05 1.09 1.12 1.13Current Expenditure-Other Government 6.70 6.69 6.68 6.66 6.64 6.63 6.61 6.59 6.57Domestic Interest Payments 0.99 0.88 0.80 0.75 0.74 0.77 0.83 0.92 1.04Foreign Interest Payments 0.19 0.21 0.23 0.25 0.27 0.27 0.26 0.25 0.22Capital Expenditure-Primary Education 0.07 0.78 0.31 0.46 0.73 0.73 0.73 0.77 0.81Capital Expenditure-Secondary Education 0.03 0.15 0.17 0.26 0.34 0.34 0.34 0.35 0.37Capital Expenditure-Tertiary Education 0.08 0.11 0.01 0.01 0.04 0.04 0.04 0.04 0.04Capital Expenditure-Health 0.98 1.51 0.44 0.26 0.50 0.51 0.51 0.52 0.55Capital Expenditure-Water and Sanitation 0.33 0.74 0.88 0.95 1.03 1.12 1.21 1.30 1.39Capital Expenditure-Agriculture 0.57 0.57 0.48 0.42 0.45 0.45 0.45 0.46 0.48Capital Expenditure-Roads 2.23 1.26 3.09 3.12 3.10 2.54 2.53 2.52 2.51Capital Expenditure-Other Government 4.17 3.41 2.65 2.23 2.22 2.21 2.17 2.23 2.31total 20.69 21.01 20.39 20.42 21.51 21.48 21.95 22.61 23.35 Table B11: MDG7a Foreign Borrowing Financing- Expenditure (Percent of GDP)
2007 2008 2009 2010 2011 2012 2013 2014 2015Current Expenditure-Primary Education 1.39 1.44 1.29 1.29 1.29 1.29 1.29 1.29 1.29Current Expenditure-Secondary Education 0.55 0.53 0.51 0.51 0.51 0.51 0.51 0.51 0.51Current Expenditure-Tertiary Education 0.38 0.42 0.36 0.36 0.36 0.36 0.36 0.36 0.36Current Expenditure-Health 1.10 1.23 1.15 1.15 1.15 1.15 1.15 1.15 1.15Current Expenditure-Water and Sanitation 0.02 0.14 0.41 0.68 1.01 1.36 1.73 2.10 2.47Current Expenditure-Agriculture 0.14 0.14 0.14 0.14 0.14 0.14 0.14 0.14 0.14Current Expenditure-Roads 0.77 0.81 0.80 0.90 0.98 1.05 1.09 1.12 1.13Current Expenditure-Other Government 6.70 6.69 6.68 6.66 6.64 6.63 6.61 6.59 6.57Domestic Interest Payments 0.99 0.88 0.80 0.75 0.74 0.77 0.83 0.92 1.04Foreign Interest Payments 0.19 0.21 0.24 0.28 0.32 0.35 0.37 0.38 0.40Capital Expenditure-Primary Education 0.07 0.78 0.31 0.46 0.73 0.73 0.73 0.77 0.81Capital Expenditure-Secondary Education 0.03 0.15 0.17 0.26 0.34 0.34 0.34 0.35 0.37Capital Expenditure-Tertiary Education 0.08 0.11 0.01 0.01 0.04 0.04 0.04 0.04 0.04Capital Expenditure-Health 0.98 1.51 0.44 0.26 0.50 0.51 0.51 0.52 0.55Capital Expenditure-Water and Sanitation 0.33 0.74 0.88 0.95 1.03 1.12 1.21 1.30 1.39Capital Expenditure-Agriculture 0.57 0.57 0.48 0.42 0.45 0.45 0.45 0.46 0.48Capital Expenditure-Roads 2.23 1.26 3.09 3.12 3.10 2.54 2.53 2.52 2.51Capital Expenditure-Other Government 4.17 3.41 2.65 2.23 2.22 2.21 2.17 2.23 2.31total 20.69 21.01 20.41 20.45 21.56 21.55 22.05 22.75 23.53

77
Table B12: MDG7a Domestic Borrowing Financing- Expenditure (Percent of GDP) 2007 2008 2009 2010 2011 2012 2013 2014 2015
Current Expenditure-Primary Education 1.39 1.44 1.29 1.29 1.29 1.29 1.29 1.29 1.29Current Expenditure-Secondary Education 0.55 0.53 0.51 0.51 0.51 0.51 0.51 0.51 0.51Current Expenditure-Tertiary Education 0.38 0.42 0.36 0.36 0.36 0.36 0.36 0.36 0.36Current Expenditure-Health 1.10 1.23 1.15 1.15 1.15 1.15 1.15 1.15 1.15Current Expenditure-Water and Sanitation 0.02 0.15 0.47 0.77 1.13 1.51 1.91 2.32 2.73Current Expenditure-Agriculture 0.14 0.14 0.14 0.14 0.14 0.14 0.14 0.14 0.14Current Expenditure-Roads 0.77 0.81 0.80 0.90 0.98 1.06 1.09 1.12 1.14Current Expenditure-Other Government 6.70 6.69 6.69 6.68 6.67 6.65 6.64 6.63 6.62Domestic Interest Payments 0.99 0.93 1.05 1.35 1.87 2.66 3.72 5.13 6.93Foreign Interest Payments 0.19 0.21 0.23 0.26 0.28 0.28 0.27 0.26 0.23Capital Expenditure-Primary Education 0.07 0.76 0.27 0.42 0.69 0.68 0.69 0.72 0.75Capital Expenditure-Secondary Education 0.03 0.14 0.16 0.25 0.33 0.33 0.33 0.34 0.36Capital Expenditure-Tertiary Education 0.08 0.11 0.01 0.01 0.04 0.04 0.04 0.04 0.04Capital Expenditure-Health 0.98 1.51 0.43 0.26 0.50 0.51 0.51 0.52 0.55Capital Expenditure-Water and Sanitation 0.33 0.74 0.89 0.97 1.05 1.14 1.24 1.34 1.44Capital Expenditure-Agriculture 0.57 0.57 0.48 0.43 0.45 0.46 0.46 0.47 0.49Capital Expenditure-Roads 2.23 1.27 3.10 3.14 3.14 2.58 2.57 2.57 2.56Capital Expenditure-Other Government 4.17 3.40 2.63 2.20 2.20 2.18 2.15 2.21 2.29total 20.69 21.05 20.66 21.09 22.78 23.54 25.08 27.12 29.60 Table B13: MDG7b Tax Financing- Expenditure (Percent of GDP)
2007 2008 2009 2010 2011 2012 2013 2014 2015Current Expenditure-Primary Education 1.39 1.44 1.29 1.29 1.29 1.29 1.29 1.29 1.29Current Expenditure-Secondary Education 0.55 0.53 0.51 0.51 0.51 0.51 0.51 0.51 0.51Current Expenditure-Tertiary Education 0.38 0.42 0.36 0.36 0.36 0.36 0.36 0.36 0.36Current Expenditure-Health 1.10 1.23 1.15 1.15 1.15 1.15 1.15 1.15 1.15Current Expenditure-Water and Sanitation 0.02 0.15 0.46 0.76 1.12 1.49 1.89 2.29 2.70Current Expenditure-Agriculture 0.14 0.14 0.14 0.14 0.14 0.14 0.14 0.14 0.14Current Expenditure-Roads 0.77 0.81 0.80 0.90 0.98 1.05 1.09 1.11 1.13Current Expenditure-Other Government 6.70 6.69 6.68 6.66 6.64 6.63 6.61 6.59 6.57Domestic Interest Payments 0.99 0.88 0.80 0.76 0.75 0.78 0.84 0.93 1.05Foreign Interest Payments 0.19 0.21 0.23 0.26 0.27 0.28 0.27 0.25 0.23Capital Expenditure-Primary Education 0.07 0.76 0.28 0.43 0.70 0.70 0.70 0.74 0.77Capital Expenditure-Secondary Education 0.03 0.15 0.16 0.25 0.33 0.34 0.34 0.35 0.37Capital Expenditure-Tertiary Education 0.08 0.11 0.01 0.01 0.04 0.04 0.04 0.04 0.04Capital Expenditure-Health 0.98 1.51 0.44 0.26 0.51 0.52 0.52 0.54 0.56Capital Expenditure-Water and Sanitation 0.33 0.74 0.89 0.97 1.05 1.15 1.24 1.34 1.45Capital Expenditure-Agriculture 0.57 0.57 0.48 0.43 0.45 0.46 0.46 0.47 0.50Capital Expenditure-Roads 2.23 1.27 3.11 3.15 3.15 2.59 2.59 2.59 2.59Capital Expenditure-Other Government 4.17 3.40 2.63 2.21 2.21 2.20 2.17 2.23 2.32total 20.69 21.01 20.43 20.50 21.67 21.68 22.21 22.93 23.74 Table B14: MDG7b Foreign Transfer Financing- Expenditure (Percent of GDP)
2007 2008 2009 2010 2011 2012 2013 2014 2015Current Expenditure-Primary Education 1.39 1.44 1.29 1.29 1.29 1.29 1.29 1.29 1.29Current Expenditure-Secondary Education 0.55 0.53 0.51 0.51 0.51 0.51 0.51 0.51 0.51Current Expenditure-Tertiary Education 0.38 0.42 0.36 0.36 0.36 0.36 0.36 0.36 0.36Current Expenditure-Health 1.10 1.23 1.15 1.15 1.15 1.15 1.15 1.15 1.15Current Expenditure-Water and Sanitation 0.02 0.14 0.42 0.68 1.01 1.36 1.73 2.09 2.47Current Expenditure-Agriculture 0.14 0.14 0.14 0.14 0.14 0.14 0.14 0.14 0.14Current Expenditure-Roads 0.77 0.81 0.80 0.90 0.98 1.05 1.09 1.12 1.13Current Expenditure-Other Government 6.70 6.69 6.68 6.66 6.64 6.63 6.61 6.59 6.57Domestic Interest Payments 0.99 0.88 0.80 0.75 0.74 0.77 0.83 0.92 1.04Foreign Interest Payments 0.19 0.21 0.23 0.25 0.27 0.27 0.26 0.25 0.22Capital Expenditure-Primary Education 0.07 0.78 0.31 0.46 0.73 0.73 0.73 0.77 0.81Capital Expenditure-Secondary Education 0.03 0.15 0.17 0.26 0.34 0.34 0.34 0.35 0.37Capital Expenditure-Tertiary Education 0.08 0.11 0.01 0.01 0.04 0.04 0.04 0.04 0.04Capital Expenditure-Health 0.98 1.51 0.44 0.26 0.50 0.51 0.51 0.52 0.55Capital Expenditure-Water and Sanitation 0.33 0.74 0.88 0.95 1.03 1.12 1.21 1.29 1.39Capital Expenditure-Agriculture 0.57 0.57 0.48 0.42 0.45 0.45 0.45 0.46 0.48Capital Expenditure-Roads 2.23 1.26 3.09 3.12 3.10 2.54 2.53 2.52 2.51Capital Expenditure-Other Government 4.17 3.41 2.65 2.23 2.22 2.21 2.17 2.23 2.31total 20.69 21.01 20.39 20.42 21.51 21.48 21.95 22.61 23.35

78
Table B15: MDG7b Foreign Borrowing Financing- Expenditure (Percent of GDP) 2007 2008 2009 2010 2011 2012 2013 2014 2015
Current Expenditure-Primary Education 1.39 1.44 1.29 1.29 1.29 1.29 1.29 1.29 1.29Current Expenditure-Secondary Education 0.55 0.53 0.51 0.51 0.51 0.51 0.51 0.51 0.51Current Expenditure-Tertiary Education 0.38 0.42 0.36 0.36 0.36 0.36 0.36 0.36 0.36Current Expenditure-Health 1.10 1.23 1.15 1.15 1.15 1.15 1.15 1.15 1.15Current Expenditure-Water and Sanitation 0.02 0.14 0.42 0.68 1.01 1.36 1.73 2.09 2.47Current Expenditure-Agriculture 0.14 0.14 0.14 0.14 0.14 0.14 0.14 0.14 0.14Current Expenditure-Roads 0.77 0.81 0.80 0.90 0.98 1.05 1.09 1.12 1.13Current Expenditure-Other Government 6.70 6.69 6.68 6.66 6.64 6.63 6.61 6.59 6.57Domestic Interest Payments 0.99 0.88 0.80 0.75 0.74 0.77 0.83 0.92 1.04Foreign Interest Payments 0.19 0.21 0.24 0.28 0.32 0.35 0.37 0.38 0.40Capital Expenditure-Primary Education 0.07 0.78 0.31 0.46 0.73 0.73 0.73 0.77 0.81Capital Expenditure-Secondary Education 0.03 0.15 0.17 0.26 0.34 0.34 0.34 0.35 0.37Capital Expenditure-Tertiary Education 0.08 0.11 0.01 0.01 0.04 0.04 0.04 0.04 0.04Capital Expenditure-Health 0.98 1.51 0.44 0.26 0.50 0.51 0.51 0.52 0.55Capital Expenditure-Water and Sanitation 0.33 0.74 0.88 0.95 1.03 1.12 1.21 1.29 1.39Capital Expenditure-Agriculture 0.57 0.57 0.48 0.42 0.45 0.45 0.45 0.46 0.48Capital Expenditure-Roads 2.23 1.26 3.09 3.12 3.10 2.54 2.53 2.52 2.51Capital Expenditure-Other Government 4.17 3.41 2.65 2.23 2.22 2.21 2.17 2.23 2.31total 20.69 21.02 20.41 20.45 21.56 21.55 22.05 22.74 23.52 Table B16: MDG7b Domestic Borrowing Financing- Expenditure (Percent of GDP)
2007 2008 2009 2010 2011 2012 2013 2014 2015Current Expenditure-Primary Education 1.39 1.44 1.29 1.29 1.29 1.29 1.29 1.29 1.29Current Expenditure-Secondary Education 0.55 0.53 0.51 0.51 0.51 0.51 0.51 0.51 0.51Current Expenditure-Tertiary Education 0.38 0.42 0.36 0.36 0.36 0.36 0.36 0.36 0.36Current Expenditure-Health 1.10 1.23 1.15 1.15 1.15 1.15 1.15 1.15 1.15Current Expenditure-Water and Sanitation 0.02 0.15 0.47 0.76 1.13 1.51 1.91 2.31 2.72Current Expenditure-Agriculture 0.14 0.14 0.14 0.14 0.14 0.14 0.14 0.14 0.14Current Expenditure-Roads 0.77 0.81 0.80 0.90 0.98 1.06 1.09 1.12 1.14Current Expenditure-Other Government 6.70 6.69 6.69 6.68 6.67 6.65 6.64 6.63 6.62Domestic Interest Payments 0.99 0.93 1.05 1.35 1.87 2.65 3.72 5.12 6.92Foreign Interest Payments 0.19 0.21 0.23 0.26 0.28 0.28 0.27 0.26 0.23Capital Expenditure-Primary Education 0.07 0.76 0.27 0.42 0.69 0.68 0.69 0.72 0.75Capital Expenditure-Secondary Education 0.03 0.14 0.16 0.25 0.33 0.33 0.33 0.34 0.36Capital Expenditure-Tertiary Education 0.08 0.11 0.01 0.01 0.04 0.04 0.04 0.04 0.04Capital Expenditure-Health 0.98 1.51 0.43 0.26 0.50 0.51 0.51 0.52 0.55Capital Expenditure-Water and Sanitation 0.33 0.74 0.89 0.97 1.05 1.14 1.24 1.33 1.43Capital Expenditure-Agriculture 0.57 0.57 0.48 0.43 0.45 0.46 0.46 0.47 0.49Capital Expenditure-Roads 2.23 1.27 3.10 3.14 3.14 2.58 2.57 2.57 2.56Capital Expenditure-Other Government 4.17 3.40 2.63 2.20 2.20 2.18 2.15 2.21 2.29total 20.69 21.05 20.66 21.08 22.77 23.53 25.07 27.10 29.57 Table B17: All MDGs Tax Financing- Expenditure (Percent of GDP)
2007 2008 2009 2010 2011 2012 2013 2014 2015Current Expenditure-Primary Education 1.39 1.89 2.14 3.25 2.94 2.67 2.46 2.02 1.55 Current Expenditure-Secondary Education 0.55 0.53 0.51 0.51 0.51 0.51 0.51 0.51 0.51 Current Expenditure-Tertiary Education 0.38 0.42 0.36 0.36 0.36 0.36 0.36 0.36 0.36 Current Expenditure-Health 1.10 1.48 1.93 2.40 2.63 2.98 3.60 4.26 4.94 Current Expenditure-Water and Sanitation 0.02 0.34 0.74 1.20 1.34 1.67 2.20 2.69 3.16 Current Expenditure-Agriculture 0.14 0.14 0.14 0.14 0.14 0.14 0.14 0.14 0.14 Current Expenditure-Roads 0.77 0.80 0.79 0.87 0.97 1.05 1.08 1.11 1.14 Current Expenditure-Other Government 6.70 6.62 6.57 6.50 6.55 6.58 6.57 6.56 6.56 Domestic Interest Payments 0.99 0.88 0.79 0.74 0.74 0.77 0.83 0.92 1.04 Foreign Interest Payments 0.19 0.20 0.23 0.25 0.27 0.27 0.26 0.24 0.22 Capital Expenditure-Primary Education 0.07 2.39 1.84 4.18 1.57 Capital Expenditure-Secondary Education 0.03 0.16 0.18 0.28 0.36 0.34 0.33 0.35 0.38 Capital Expenditure-Tertiary Education 0.08 0.12 0.02 0.02 0.04 0.04 0.04 0.04 0.04 Capital Expenditure-Health 0.98 3.39 3.62 3.71 2.39 2.43 4.58 5.82 6.16 Capital Expenditure-Water and Sanitation 0.33 0.78 0.93 1.02 1.03 1.12 1.29 1.41 1.51 Capital Expenditure-Agriculture 0.57 0.57 0.48 0.43 0.45 0.46 0.46 0.48 0.51 Capital Expenditure-Roads 2.23 1.27 3.13 3.17 3.15 2.58 2.60 2.61 2.63 Capital Expenditure-Other Government 4.17 3.15 2.46 1.97 2.32 2.36 2.03 2.04 2.21 total 20.69 25.13 26.85 31.00 27.77 26.33 29.35 31.59 33.06

79
Table B18: All MDGs Foreign Transfer Financing- Expenditure (Percent of GDP) 2007 2008 2009 2010 2011 2012 2013 2014 2015
Current Expenditure-Primary Education 1.39 1.74 1.89 2.83 2.67 2.45 2.17 1.68 1.18 Current Expenditure-Secondary Education 0.55 0.53 0.51 0.51 0.51 0.51 0.51 0.51 0.51 Current Expenditure-Tertiary Education 0.38 0.42 0.36 0.36 0.36 0.36 0.36 0.36 0.36 Current Expenditure-Health 1.10 1.35 1.67 1.94 2.30 2.70 3.20 3.75 4.33 Current Expenditure-Water and Sanitation 0.02 0.08 0.31 0.48 0.85 1.23 1.60 1.99 2.37 Current Expenditure-Agriculture 0.14 0.14 0.14 0.14 0.14 0.14 0.14 0.14 0.14 Current Expenditure-Roads 0.77 0.80 0.79 0.88 0.97 1.05 1.10 1.13 1.16 Current Expenditure-Other Government 6.70 6.64 6.60 6.54 6.58 6.62 6.65 6.66 6.65 Domestic Interest Payments 0.99 0.87 0.77 0.71 0.71 0.75 0.80 0.89 1.01 Foreign Interest Payments 0.19 0.20 0.21 0.22 0.25 0.26 0.25 0.23 0.20 Capital Expenditure-Primary Education 0.07 2.02 1.50 3.37 1.55 Capital Expenditure-Secondary Education 0.03 0.19 0.20 0.28 0.31 0.29 0.30 0.32 0.35 Capital Expenditure-Tertiary Education 0.08 0.11 0.02 0.02 0.04 0.03 0.03 0.04 0.04 Capital Expenditure-Health 0.98 2.28 2.51 2.22 2.47 2.93 3.53 4.12 4.57 Capital Expenditure-Water and Sanitation 0.33 0.71 0.83 0.86 0.96 1.06 1.12 1.19 1.27 Capital Expenditure-Agriculture 0.57 0.55 0.46 0.39 0.42 0.43 0.42 0.43 0.45 Capital Expenditure-Roads 2.23 1.24 2.96 2.86 2.91 2.40 2.37 2.34 2.32 Capital Expenditure-Other Government 4.17 3.40 2.60 2.13 2.08 2.04 2.03 2.07 2.14 total 20.69 23.28 24.33 26.74 26.09 25.26 26.58 27.85 29.04 Table B19: All MDGs Foreign Borrowing Financing- Expenditure (Percent of GDP)
2007 2008 2009 2010 2011 2012 2013 2014 2015Current Expenditure-Primary Education 1.39 1.74 1.89 2.83 2.67 2.45 2.17 1.68 1.18 Current Expenditure-Secondary Education 0.55 0.53 0.51 0.51 0.51 0.51 0.51 0.51 0.51 Current Expenditure-Tertiary Education 0.38 0.42 0.36 0.36 0.36 0.36 0.36 0.36 0.36 Current Expenditure-Health 1.10 1.35 1.67 1.94 2.30 2.70 3.20 3.75 4.33 Current Expenditure-Water and Sanitation 0.02 0.08 0.31 0.48 0.85 1.23 1.60 1.99 2.37 Current Expenditure-Agriculture 0.14 0.14 0.14 0.14 0.14 0.14 0.14 0.14 0.14 Current Expenditure-Roads 0.77 0.80 0.79 0.88 0.97 1.05 1.10 1.13 1.16 Current Expenditure-Other Government 6.70 6.64 6.60 6.54 6.58 6.62 6.65 6.66 6.65 Domestic Interest Payments 0.99 0.87 0.77 0.71 0.71 0.75 0.80 0.89 1.01 Foreign Interest Payments 0.19 0.23 0.31 0.42 0.54 0.63 0.69 0.76 0.83 Capital Expenditure-Primary Education 0.07 2.02 1.50 3.37 1.55 Capital Expenditure-Secondary Education 0.03 0.19 0.20 0.28 0.31 0.29 0.30 0.32 0.35 Capital Expenditure-Tertiary Education 0.08 0.11 0.02 0.02 0.04 0.03 0.03 0.04 0.04 Capital Expenditure-Health 0.98 2.28 2.51 2.22 2.47 2.93 3.53 4.12 4.57 Capital Expenditure-Water and Sanitation 0.33 0.71 0.83 0.86 0.96 1.06 1.12 1.19 1.27 Capital Expenditure-Agriculture 0.57 0.55 0.46 0.39 0.42 0.43 0.42 0.43 0.45 Capital Expenditure-Roads 2.23 1.24 2.96 2.86 2.91 2.40 2.37 2.34 2.32 Capital Expenditure-Other Government 4.17 3.40 2.60 2.13 2.08 2.04 2.03 2.07 2.14 total 20.69 23.31 24.43 26.94 26.37 25.62 27.03 28.38 29.67 Table B20 All MDGs Domestic Borrowing Financing- Expenditure (Percent of GDP)
2007 2008 2009 2010 2011 2012 2013 2014 2015Current Expenditure-Primary Education 1.39 1.93 2.22 3.39 3.04 2.78 2.62 2.20 1.71 Current Expenditure-Secondary Education 0.55 0.53 0.51 0.51 0.51 0.51 0.51 0.51 0.51 Current Expenditure-Tertiary Education 0.38 0.42 0.36 0.36 0.36 0.36 0.36 0.36 0.36 Current Expenditure-Health 1.10 1.51 1.99 2.50 2.71 3.07 3.76 4.48 5.22 Current Expenditure-Water and Sanitation 0.02 0.37 0.79 1.28 1.41 1.73 2.32 2.86 3.36 Current Expenditure-Agriculture 0.14 0.14 0.14 0.14 0.14 0.14 0.14 0.14 0.15 Current Expenditure-Roads 0.77 0.81 0.80 0.90 0.98 1.07 1.12 1.15 1.18 Current Expenditure-Other Government 6.70 6.69 6.68 6.66 6.67 6.71 6.76 6.79 6.82 Domestic Interest Payments 0.99 2.05 4.11 7.79 11.15 14.99 20.29 27.13 35.55 Foreign Interest Payments 0.19 0.21 0.23 0.25 0.27 0.27 0.27 0.25 0.23 Capital Expenditure-Primary Education 0.07 2.41 1.84 4.12 1.54 Capital Expenditure-Secondary Education 0.03 0.12 0.15 0.25 0.35 0.34 0.28 0.29 0.33 Capital Expenditure-Tertiary Education 0.08 0.11 0.01 0.02 0.04 0.04 0.04 0.04 0.04 Capital Expenditure-Health 0.98 3.48 3.64 3.70 2.32 2.35 4.54 5.72 5.94 Capital Expenditure-Water and Sanitation 0.33 0.78 0.92 1.00 1.01 1.09 1.25 1.37 1.45 Capital Expenditure-Agriculture 0.57 0.57 0.48 0.42 0.44 0.45 0.45 0.46 0.48 Capital Expenditure-Roads 2.23 1.26 3.09 3.10 3.09 2.53 2.52 2.51 2.51 Capital Expenditure-Other Government 4.17 3.09 2.40 1.92 2.28 2.32 1.94 1.93 2.10 total 20.69 26.48 30.35 38.30 38.34 40.74 49.17 58.22 67.94

80
Table B21: All MDGs Efficient Spending and Foreign Transfer Financing- Expenditure (Percent of GDP)
2007 2008 2009 2010 2011 2012 2013 2014 2015Current Expenditure-Primary Education 1.39 1.70 1.80 2.64 2.43 2.16 1.86 1.39 0.92 Current Expenditure-Secondary Education 0.55 0.53 0.51 0.51 0.51 0.51 0.51 0.51 0.51 Current Expenditure-Tertiary Education 0.38 0.42 0.36 0.36 0.36 0.36 0.36 0.36 0.36 Current Expenditure-Health 1.10 1.33 1.63 1.87 2.19 2.53 2.97 3.42 3.90 Current Expenditure-Water and Sanitation 0.02 0.07 0.27 0.41 0.74 1.07 1.38 1.69 2.00 Current Expenditure-Agriculture 0.14 0.14 0.14 0.13 0.13 0.13 0.13 0.13 0.13 Current Expenditure-Roads 0.77 0.79 0.77 0.85 0.92 0.99 1.01 1.03 1.04 Current Expenditure-Other Government 6.70 6.57 6.45 6.31 6.27 6.22 6.17 6.10 6.02 Domestic Interest Payments 0.99 0.87 0.78 0.72 0.72 0.76 0.81 0.90 1.02 Foreign Interest Payments 0.19 0.20 0.21 0.22 0.26 0.27 0.26 0.24 0.22 Capital Expenditure-Primary Education 0.07 2.02 1.51 3.41 1.57 Capital Expenditure-Secondary Education 0.03 0.25 0.26 0.36 0.40 0.38 0.39 0.43 0.47 Capital Expenditure-Tertiary Education 0.08 0.12 0.02 0.02 0.04 0.04 0.04 0.04 0.05 Capital Expenditure-Health 0.98 2.29 2.55 2.30 2.55 3.01 3.68 4.33 4.83 Capital Expenditure-Water and Sanitation 0.33 0.72 0.84 0.87 0.98 1.09 1.16 1.24 1.33 Capital Expenditure-Agriculture 0.57 0.56 0.46 0.39 0.43 0.44 0.43 0.44 0.47 Capital Expenditure-Roads 2.23 1.24 2.98 2.91 2.97 2.46 2.44 2.43 2.42 Capital Expenditure-Other Government 4.17 3.43 2.64 2.19 2.15 2.12 2.12 2.18 2.27 total 20.69 23.24 24.19 26.49 25.62 24.55 25.74 26.88 27.96 Table B22 All MDGs Domestic Resource Mobilization and Foreign Transfer Borrowing Financing- Expenditure (Percent of GDP)
2007 2008 2009 2010 2011 2012 2013 2014 2015Current Expenditure-Primary Education 1.39 1.74 1.89 2.85 2.71 2.50 2.23 1.75 1.25 Current Expenditure-Secondary Education 0.55 0.53 0.51 0.51 0.51 0.51 0.51 0.51 0.51 Current Expenditure-Tertiary Education 0.38 0.42 0.36 0.36 0.36 0.36 0.36 0.36 0.36 Current Expenditure-Health 1.10 1.35 1.67 2.00 2.40 2.79 3.31 3.86 4.46 Current Expenditure-Water and Sanitation 0.02 0.08 0.31 0.60 1.03 1.42 1.80 2.18 2.57 Current Expenditure-Agriculture 0.14 0.14 0.14 0.14 0.14 0.14 0.14 0.14 0.14 Current Expenditure-Roads 0.77 0.80 0.79 0.87 0.95 1.04 1.08 1.12 1.14 Current Expenditure-Other Government 6.70 6.64 6.60 6.46 6.46 6.51 6.54 6.56 6.57 Domestic Interest Payments 0.99 0.87 0.77 0.72 0.72 0.76 0.81 0.90 1.02 Foreign Interest Payments 0.19 0.20 0.21 0.22 0.26 0.27 0.25 0.23 0.21 Capital Expenditure-Primary Education 0.07 2.02 1.50 3.58 1.74 Capital Expenditure-Secondary Education 0.03 0.19 0.20 0.31 0.35 0.31 0.31 0.33 0.37 Capital Expenditure-Tertiary Education 0.08 0.11 0.02 0.02 0.04 0.04 0.04 0.04 0.04 Capital Expenditure-Health 0.98 2.28 2.51 2.69 3.09 3.18 3.75 4.45 4.97 Capital Expenditure-Water and Sanitation 0.33 0.71 0.83 0.90 1.03 1.13 1.19 1.27 1.35 Capital Expenditure-Agriculture 0.57 0.55 0.46 0.40 0.44 0.45 0.44 0.45 0.47 Capital Expenditure-Roads 2.23 1.24 2.96 2.95 3.04 2.52 2.49 2.47 2.44 Capital Expenditure-Other Government 4.17 3.40 2.60 2.07 2.03 2.09 2.12 2.16 2.23 total 20.69 23.28 24.33 27.66 27.31 26.01 27.37 28.79 30.09

81
Table C1: Poverty and Inequality Indicators Ye ar
U S O W 1 W 2 M U S O W 1 W 2 M U S O W 1 W 2 M
base 2 0 0 7 3 1 .9 8 3 1 .9 8 3 1 .9 8 3 1 .9 8 3 1 .9 8 3 1 .9 8 1 4 .7 8 1 4 .7 8 1 4 .7 8 1 4 .7 8 1 4 .7 8 1 4 .7 8 0 .4 3 0 .4 3 0 .4 3 0 .4 3 0 .4 3 0 .4 3
base 2 0 1 0 3 1 .9 1 3 2 .0 2 3 1 .9 8 3 1 .9 8 3 1 .9 7 3 1 .9 9 1 4 .7 5 1 4 .8 1 1 4 .7 8 1 4 .7 8 1 4 .7 6 1 4 .7 8 0 .4 4 0 .4 3 0 .4 3 0 .4 3 0 .4 3 0 .4 3
base 2 0 1 5 3 1 .8 6 3 2 .0 4 3 1 .9 8 3 1 .9 8 3 1 .9 6 3 1 .9 9 1 4 .7 4 1 4 .8 3 1 4 .7 8 1 4 .7 8 1 4 .7 6 1 4 .7 9 0 .4 6 0 .4 3 0 .4 3 0 .4 3 0 .4 3 0 .4 3
m dg2 db 2 0 0 7 3 1 .9 8 3 1 .9 8 3 1 .9 8 3 1 .9 8 3 1 .9 8 3 1 .9 8 1 4 .7 8 1 4 .7 8 1 4 .7 8 1 4 .7 8 1 4 .7 8 1 4 .7 8 0 .4 3 0 .4 3 0 .4 3 0 .4 3 0 .4 3 0 .4 3
m dg2 db 2 0 1 0 3 1 .9 0 3 1 .9 8 3 1 .9 8 3 2 .0 3 3 1 .8 8 3 2 .0 0 1 4 .7 4 1 4 .7 8 1 4 .7 8 1 4 .8 3 1 4 .7 0 1 4 .7 9 0 .4 4 0 .4 3 0 .4 3 0 .4 3 0 .4 3 0 .4 3
m dg2 db 2 0 1 5 3 1 .8 3 3 2 .0 4 3 1 .9 8 3 2 .0 0 3 1 .9 0 3 2 .0 0 1 4 .7 3 1 4 .8 3 1 4 .7 8 1 4 .8 0 1 4 .7 1 1 4 .8 0 0 .4 7 0 .4 3 0 .4 3 0 .4 3 0 .4 3 0 .4 3
m dg2 fb 2 0 0 7 3 1 .9 8 3 1 .9 8 3 1 .9 8 3 1 .9 8 3 1 .9 8 3 1 .9 8 1 4 .7 8 1 4 .7 8 1 4 .7 8 1 4 .7 8 1 4 .7 8 1 4 .7 8 0 .4 3 0 .4 3 0 .4 3 0 .4 3 0 .4 3 0 .4 3
m dg2 fb 2 0 1 0 3 1 .8 9 3 1 .9 9 3 1 .9 8 3 2 .0 2 3 1 .9 2 3 1 .9 9 1 4 .7 4 1 4 .7 9 1 4 .7 8 1 4 .8 1 1 4 .7 2 1 4 .7 9 0 .4 5 0 .4 3 0 .4 3 0 .4 3 0 .4 3 0 .4 3
m dg2 fb 2 0 1 5 3 1 .8 5 3 2 .0 4 3 1 .9 8 3 1 .9 8 3 1 .9 4 3 1 .9 9 1 4 .7 4 1 4 .8 3 1 4 .7 8 1 4 .7 8 1 4 .7 4 1 4 .7 9 0 .4 6 0 .4 3 0 .4 3 0 .4 3 0 .4 3 0 .4 3
m dg2 ft r 2 0 0 7 3 1 .9 8 3 1 .9 8 3 1 .9 8 3 1 .9 8 3 1 .9 8 3 1 .9 8 1 4 .7 8 1 4 .7 8 1 4 .7 8 1 4 .7 8 1 4 .7 8 1 4 .7 8 0 .4 3 0 .4 3 0 .4 3 0 .4 3 0 .4 3 0 .4 3
m dg2 ft r 2 0 1 0 3 1 .8 9 3 1 .9 9 3 1 .9 8 3 2 .0 2 3 1 .9 2 3 1 .9 9 1 4 .7 4 1 4 .7 9 1 4 .7 8 1 4 .8 1 1 4 .7 2 1 4 .7 9 0 .4 5 0 .4 3 0 .4 3 0 .4 3 0 .4 3 0 .4 3
m dg2 ft r 2 0 1 5 3 1 .8 5 3 2 .0 4 3 1 .9 8 3 1 .9 8 3 1 .9 4 3 1 .9 9 1 4 .7 4 1 4 .8 3 1 4 .7 8 1 4 .7 8 1 4 .7 4 1 4 .7 9 0 .4 6 0 .4 3 0 .4 3 0 .4 3 0 .4 3 0 .4 3
m dg2 tax 2 0 0 7 3 1 .9 8 3 1 .9 8 3 1 .9 8 3 1 .9 8 3 1 .9 8 3 1 .9 8 1 4 .7 8 1 4 .7 8 1 4 .7 8 1 4 .7 8 1 4 .7 8 1 4 .7 8 0 .4 3 0 .4 3 0 .4 3 0 .4 3 0 .4 3 0 .4 3
m dg2 tax 2 0 1 0 3 1 .9 4 3 1 .9 8 3 1 .9 8 3 2 .0 2 3 1 .8 9 3 1 .9 9 1 4 .7 6 1 4 .7 8 1 4 .7 8 1 4 .8 3 1 4 .7 0 1 4 .7 9 0 .4 4 0 .4 3 0 .4 3 0 .4 3 0 .4 3 0 .4 3
m dg2 tax 2 0 1 5 3 1 .8 3 3 2 .0 3 3 1 .9 8 3 2 .0 0 3 1 .9 0 3 2 .0 0 1 4 .7 3 1 4 .8 2 1 4 .7 8 1 4 .8 0 1 4 .7 1 1 4 .8 0 0 .4 6 0 .4 3 0 .4 3 0 .4 3 0 .4 3 0 .4 3
m dg4 5 db 2 0 0 7 3 1 .9 8 3 1 .9 8 3 1 .9 8 3 1 .9 8 3 1 .9 8 3 1 .9 8 1 4 .7 8 1 4 .7 8 1 4 .7 8 1 4 .7 8 1 4 .7 8 1 4 .7 8 0 .4 3 0 .4 3 0 .4 3 0 .4 3 0 .4 3 0 .4 3
m dg4 5 db 2 0 1 0 3 1 .9 2 3 2 .0 1 3 1 .9 8 3 1 .9 8 3 1 .9 6 3 1 .9 9 1 4 .7 5 1 4 .8 0 1 4 .7 8 1 4 .7 8 1 4 .7 5 1 4 .7 9 0 .4 4 0 .4 3 0 .4 3 0 .4 3 0 .4 3 0 .4 3
m dg4 5 db 2 0 1 5 3 1 .8 6 3 2 .0 3 3 1 .9 8 3 2 .0 1 3 1 .8 9 3 1 .9 9 1 4 .7 4 1 4 .8 2 1 4 .7 8 1 4 .8 1 1 4 .7 0 1 4 .8 0 0 .4 6 0 .4 3 0 .4 3 0 .4 3 0 .4 3 0 .4 3
m dg4 5 fb 2 0 0 7 3 1 .9 8 3 1 .9 8 3 1 .9 8 3 1 .9 8 3 1 .9 8 3 1 .9 8 1 4 .7 8 1 4 .7 8 1 4 .7 8 1 4 .7 8 1 4 .7 8 1 4 .7 8 0 .4 3 0 .4 3 0 .4 3 0 .4 3 0 .4 3 0 .4 3
m dg4 5 fb 2 0 1 0 3 1 .9 1 3 2 .0 1 3 1 .9 8 3 1 .9 9 3 1 .9 4 3 1 .9 9 1 4 .7 5 1 4 .8 0 1 4 .7 8 1 4 .7 8 1 4 .7 3 1 4 .7 9 0 .4 5 0 .4 3 0 .4 3 0 .4 3 0 .4 3 0 .4 3
m dg4 5 fb 2 0 1 5 3 1 .8 2 3 2 .0 3 3 1 .9 8 3 2 .0 4 3 1 .8 3 3 2 .0 0 1 4 .7 3 1 4 .8 2 1 4 .7 8 1 4 .8 2 1 4 .6 9 1 4 .8 0 0 .4 7 0 .4 3 0 .4 3 0 .4 3 0 .4 3 0 .4 3
m dg4 5 ftr 2 0 0 7 3 1 .9 8 3 1 .9 8 3 1 .9 8 3 1 .9 8 3 1 .9 8 3 1 .9 8 1 4 .7 8 1 4 .7 8 1 4 .7 8 1 4 .7 8 1 4 .7 8 1 4 .7 8 0 .4 3 0 .4 3 0 .4 3 0 .4 3 0 .4 3 0 .4 3
m dg4 5 ftr 2 0 1 0 3 1 .9 1 3 2 .0 1 3 1 .9 8 3 1 .9 9 3 1 .9 4 3 1 .9 9 1 4 .7 5 1 4 .8 0 1 4 .7 8 1 4 .7 8 1 4 .7 3 1 4 .7 9 0 .4 5 0 .4 3 0 .4 3 0 .4 3 0 .4 3 0 .4 3
m dg4 5 ftr 2 0 1 5 3 1 .8 2 3 2 .0 3 3 1 .9 8 3 2 .0 4 3 1 .8 3 3 2 .0 0 1 4 .7 3 1 4 .8 2 1 4 .7 8 1 4 .8 2 1 4 .6 9 1 4 .8 0 0 .4 7 0 .4 3 0 .4 3 0 .4 3 0 .4 3 0 .4 3
m dg4 5 tax 2 0 0 7 3 1 .9 8 3 1 .9 8 3 1 .9 8 3 1 .9 8 3 1 .9 8 3 1 .9 8 1 4 .7 8 1 4 .7 8 1 4 .7 8 1 4 .7 8 1 4 .7 8 1 4 .7 8 0 .4 3 0 .4 3 0 .4 3 0 .4 3 0 .4 3 0 .4 3
m dg4 5 tax 2 0 1 0 3 1 .9 2 3 2 .0 1 3 1 .9 8 3 1 .9 8 3 1 .9 6 3 1 .9 8 1 4 .7 5 1 4 .8 0 1 4 .7 8 1 4 .7 8 1 4 .7 5 1 4 .7 8 0 .4 4 0 .4 3 0 .4 3 0 .4 3 0 .4 3 0 .4 3
m dg4 5 tax 2 0 1 5 3 1 .8 9 3 2 .0 3 3 1 .9 8 3 2 .0 0 3 1 .9 2 3 1 .9 9 1 4 .7 5 1 4 .8 2 1 4 .7 8 1 4 .8 0 1 4 .7 1 1 4 .8 0 0 .4 6 0 .4 3 0 .4 3 0 .4 3 0 .4 3 0 .4 3
m dg7 adb 2 0 0 7 3 1 .9 8 3 1 .9 8 3 1 .9 8 3 1 .9 8 3 1 .9 8 3 1 .9 8 1 4 .7 8 1 4 .7 8 1 4 .7 8 1 4 .7 8 1 4 .7 8 1 4 .7 8 0 .4 3 0 .4 3 0 .4 3 0 .4 3 0 .4 3 0 .4 3
m dg7 adb 2 0 1 0 3 1 .9 1 3 2 .0 2 3 1 .9 8 3 1 .9 9 3 1 .9 6 3 1 .9 9 1 4 .7 5 1 4 .8 1 1 4 .7 8 1 4 .7 8 1 4 .7 5 1 4 .7 8 0 .4 4 0 .4 3 0 .4 3 0 .4 3 0 .4 3 0 .4 3
m dg7 adb 2 0 1 5 3 1 .8 6 3 2 .0 4 3 1 .9 8 3 2 .0 2 3 1 .9 2 3 2 .0 0 1 4 .7 4 1 4 .8 3 1 4 .7 8 1 4 .8 1 1 4 .7 2 1 4 .7 9 0 .4 6 0 .4 3 0 .4 3 0 .4 3 0 .4 3 0 .4 3
m dg7 afb 2 0 0 7 3 1 .9 8 3 1 .9 8 3 1 .9 8 3 1 .9 8 3 1 .9 8 3 1 .9 8 1 4 .7 8 1 4 .7 8 1 4 .7 8 1 4 .7 8 1 4 .7 8 1 4 .7 8 0 .4 3 0 .4 3 0 .4 3 0 .4 3 0 .4 3 0 .4 3
m dg7 afb 2 0 1 0 3 1 .9 1 3 2 .0 2 3 1 .9 8 3 1 .9 9 3 1 .9 6 3 1 .9 9 1 4 .7 5 1 4 .8 1 1 4 .7 8 1 4 .7 8 1 4 .7 5 1 4 .7 9 0 .4 4 0 .4 3 0 .4 3 0 .4 3 0 .4 3 0 .4 3
m dg7 afb 2 0 1 5 3 1 .8 5 3 2 .0 4 3 1 .9 8 3 2 .0 2 3 1 .9 2 3 1 .9 9 1 4 .7 4 1 4 .8 3 1 4 .7 8 1 4 .8 1 1 4 .7 1 1 4 .7 9 0 .4 6 0 .4 3 0 .4 3 0 .4 3 0 .4 3 0 .4 3
m dg7 aftr 2 0 0 7 3 1 .9 8 3 1 .9 8 3 1 .9 8 3 1 .9 8 3 1 .9 8 3 1 .9 8 1 4 .7 8 1 4 .7 8 1 4 .7 8 1 4 .7 8 1 4 .7 8 1 4 .7 8 0 .4 3 0 .4 3 0 .4 3 0 .4 3 0 .4 3 0 .4 3
m dg7 aftr 2 0 0 8 3 1 .9 6 3 1 .9 8 3 1 .9 8 3 1 .9 8 3 1 .9 6 3 1 .9 8 1 4 .7 7 1 4 .7 8 1 4 .7 8 1 4 .7 8 1 4 .7 5 1 4 .7 8 0 .4 3 0 .4 3 0 .4 3 0 .4 3 0 .4 3 0 .4 3
m dg7 aftr 2 0 0 9 3 1 .9 2 3 2 .0 0 3 1 .9 8 3 1 .9 8 3 1 .9 6 3 1 .9 9 1 4 .7 5 1 4 .7 9 1 4 .7 8 1 4 .7 8 1 4 .7 6 1 4 .7 8 0 .4 4 0 .4 3 0 .4 3 0 .4 3 0 .4 3 0 .4 3
m dg7 aftr 2 0 1 0 3 1 .9 1 3 2 .0 2 3 1 .9 8 3 1 .9 9 3 1 .9 6 3 1 .9 9 1 4 .7 5 1 4 .8 1 1 4 .7 8 1 4 .7 8 1 4 .7 5 1 4 .7 9 0 .4 4 0 .4 3 0 .4 3 0 .4 3 0 .4 3 0 .4 3
m dg7 aftr 2 0 1 5 3 1 .8 5 3 2 .0 4 3 1 .9 8 3 2 .0 2 3 1 .9 2 3 1 .9 9 1 4 .7 4 1 4 .8 3 1 4 .7 8 1 4 .8 1 1 4 .7 1 1 4 .7 9 0 .4 6 0 .4 3 0 .4 3 0 .4 3 0 .4 3 0 .4 3
m dg7 at ax 2 0 0 7 3 1 .9 8 3 1 .9 8 3 1 .9 8 3 1 .9 8 3 1 .9 8 3 1 .9 8 1 4 .7 8 1 4 .7 8 1 4 .7 8 1 4 .7 8 1 4 .7 8 1 4 .7 8 0 .4 3 0 .4 3 0 .4 3 0 .4 3 0 .4 3 0 .4 3
m dg7 at ax 2 0 0 8 3 1 .9 6 3 1 .9 8 3 1 .9 8 3 1 .9 8 3 1 .9 6 3 1 .9 8 1 4 .7 7 1 4 .7 8 1 4 .7 8 1 4 .7 8 1 4 .7 6 1 4 .7 8 0 .4 3 0 .4 3 0 .4 3 0 .4 3 0 .4 3 0 .4 3
m dg7 at ax 2 0 0 9 3 1 .9 2 3 2 .0 0 3 1 .9 8 3 1 .9 8 3 1 .9 7 3 1 .9 9 1 4 .7 5 1 4 .7 9 1 4 .7 8 1 4 .7 8 1 4 .7 6 1 4 .7 8 0 .4 4 0 .4 3 0 .4 3 0 .4 3 0 .4 3 0 .4 3
m dg7 at ax 2 0 1 0 3 1 .9 2 3 2 .0 2 3 1 .9 8 3 1 .9 9 3 1 .9 6 3 1 .9 9 1 4 .7 6 1 4 .8 1 1 4 .7 8 1 4 .7 8 1 4 .7 5 1 4 .7 8 0 .4 4 0 .4 3 0 .4 3 0 .4 3 0 .4 3 0 .4 3
m dg7 at ax 2 0 1 5 3 1 .8 7 3 2 .0 4 3 1 .9 8 3 2 .0 2 3 1 .9 3 3 1 .9 9 1 4 .7 5 1 4 .8 3 1 4 .7 8 1 4 .8 1 1 4 .7 2 1 4 .7 9 0 .4 6 0 .4 3 0 .4 3 0 .4 3 0 .4 3 0 .4 3
m dg7 bdb 2 0 0 7 3 1 .9 8 3 1 .9 8 3 1 .9 8 3 1 .9 8 3 1 .9 8 3 1 .9 8 1 4 .7 8 1 4 .7 8 1 4 .7 8 1 4 .7 8 1 4 .7 8 1 4 .7 8 0 .4 3 0 .4 3 0 .4 3 0 .4 3 0 .4 3 0 .4 3
m dg7 bdb 2 0 1 0 3 1 .9 1 3 2 .0 2 3 1 .9 8 3 1 .9 9 3 1 .9 6 3 1 .9 9 1 4 .7 5 1 4 .8 1 1 4 .7 8 1 4 .7 8 1 4 .7 5 1 4 .7 8 0 .4 4 0 .4 3 0 .4 3 0 .4 3 0 .4 3 0 .4 3
m dg7 bdb 2 0 1 5 3 1 .8 6 3 2 .0 4 3 1 .9 8 3 2 .0 2 3 1 .9 2 3 2 .0 0 1 4 .7 4 1 4 .8 3 1 4 .7 8 1 4 .8 1 1 4 .7 2 1 4 .7 9 0 .4 6 0 .4 3 0 .4 3 0 .4 3 0 .4 3 0 .4 3
m dg7 bfb 2 0 0 7 3 1 .9 8 3 1 .9 8 3 1 .9 8 3 1 .9 8 3 1 .9 8 3 1 .9 8 1 4 .7 8 1 4 .7 8 1 4 .7 8 1 4 .7 8 1 4 .7 8 1 4 .7 8 0 .4 3 0 .4 3 0 .4 3 0 .4 3 0 .4 3 0 .4 3
m dg7 bfb 2 0 0 8 3 1 .9 6 3 1 .9 8 3 1 .9 8 3 1 .9 8 3 1 .9 6 3 1 .9 8 1 4 .7 7 1 4 .7 8 1 4 .7 8 1 4 .7 8 1 4 .7 5 1 4 .7 8 0 .4 3 0 .4 3 0 .4 3 0 .4 3 0 .4 3 0 .4 3
m dg7 bfb 2 0 0 9 3 1 .9 2 3 2 .0 0 3 1 .9 8 3 1 .9 8 3 1 .9 6 3 1 .9 9 1 4 .7 5 1 4 .7 9 1 4 .7 8 1 4 .7 8 1 4 .7 6 1 4 .7 8 0 .4 4 0 .4 3 0 .4 3 0 .4 3 0 .4 3 0 .4 3
m dg7 bfb 2 0 1 0 3 1 .9 1 3 2 .0 2 3 1 .9 8 3 1 .9 9 3 1 .9 6 3 1 .9 9 1 4 .7 5 1 4 .8 1 1 4 .7 8 1 4 .7 8 1 4 .7 5 1 4 .7 9 0 .4 4 0 .4 3 0 .4 3 0 .4 3 0 .4 3 0 .4 3
m dg7 bfb 2 0 1 5 3 1 .8 5 3 2 .0 4 3 1 .9 8 3 2 .0 2 3 1 .9 2 3 1 .9 9 1 4 .7 4 1 4 .8 3 1 4 .7 8 1 4 .8 1 1 4 .7 1 1 4 .7 9 0 .4 6 0 .4 3 0 .4 3 0 .4 3 0 .4 3 0 .4 3
m dg7 bftr 2 0 0 7 3 1 .9 8 3 1 .9 8 3 1 .9 8 3 1 .9 8 3 1 .9 8 3 1 .9 8 1 4 .7 8 1 4 .7 8 1 4 .7 8 1 4 .7 8 1 4 .7 8 1 4 .7 8 0 .4 3 0 .4 3 0 .4 3 0 .4 3 0 .4 3 0 .4 3
m dg7 bftr 2 0 1 0 3 1 .9 1 3 2 .0 2 3 1 .9 8 3 1 .9 9 3 1 .9 6 3 1 .9 9 1 4 .7 5 1 4 .8 1 1 4 .7 8 1 4 .7 8 1 4 .7 5 1 4 .7 9 0 .4 4 0 .4 3 0 .4 3 0 .4 3 0 .4 3 0 .4 3
m dg7 bftr 2 0 1 5 3 1 .8 5 3 2 .0 4 3 1 .9 8 3 2 .0 2 3 1 .9 2 3 1 .9 9 1 4 .7 4 1 4 .8 3 1 4 .7 8 1 4 .8 1 1 4 .7 1 1 4 .7 9 0 .4 6 0 .4 3 0 .4 3 0 .4 3 0 .4 3 0 .4 3
m dg7 btax 2 0 0 7 3 1 .9 8 3 1 .9 8 3 1 .9 8 3 1 .9 8 3 1 .9 8 3 1 .9 8 1 4 .7 8 1 4 .7 8 1 4 .7 8 1 4 .7 8 1 4 .7 8 1 4 .7 8 0 .4 3 0 .4 3 0 .4 3 0 .4 3 0 .4 3 0 .4 3
m dg7 btax 2 0 1 0 3 1 .9 2 3 2 .0 2 3 1 .9 8 3 1 .9 9 3 1 .9 6 3 1 .9 9 1 4 .7 6 1 4 .8 1 1 4 .7 8 1 4 .7 8 1 4 .7 5 1 4 .7 8 0 .4 4 0 .4 3 0 .4 3 0 .4 3 0 .4 3 0 .4 3
m dg7 btax 2 0 1 5 3 1 .8 7 3 2 .0 4 3 1 .9 8 3 2 .0 2 3 1 .9 3 3 1 .9 9 1 4 .7 5 1 4 .8 3 1 4 .7 8 1 4 .8 1 1 4 .7 2 1 4 .7 9 0 .4 6 0 .4 3 0 .4 3 0 .4 3 0 .4 3 0 .4 3
m dgdb 2 0 0 7 3 1 .9 8 3 1 .9 8 3 1 .9 8 3 1 .9 8 3 1 .9 8 3 1 .9 8 1 4 .7 8 1 4 .7 8 1 4 .7 8 1 4 .7 8 1 4 .7 8 1 4 .7 8 0 .4 3 0 .4 3 0 .4 3 0 .4 3 0 .4 3 0 .4 3
m dgdb 2 0 1 0 3 1 .9 1 3 1 .9 8 3 1 .9 8 3 2 .0 2 3 1 .9 0 3 1 .9 9 1 4 .7 5 1 4 .7 8 1 4 .7 8 1 4 .8 1 1 4 .7 1 1 4 .7 9 0 .4 4 0 .4 3 0 .4 3 0 .4 3 0 .4 3 0 .4 3
m dgdb 2 0 1 5 3 1 .8 6 3 2 .0 2 3 1 .9 8 3 2 .0 6 3 1 .8 0 3 2 .0 0 1 4 .7 5 1 4 .8 1 1 4 .7 8 1 4 .8 4 1 4 .6 7 1 4 .8 0 0 .4 6 0 .4 3 0 .4 3 0 .4 3 0 .4 3 0 .4 3
m dgfb 2 0 0 7 3 1 .9 8 3 1 .9 8 3 1 .9 8 3 1 .9 8 3 1 .9 8 3 1 .9 8 1 4 .7 8 1 4 .7 8 1 4 .7 8 1 4 .7 8 1 4 .7 8 1 4 .7 8 0 .4 3 0 .4 3 0 .4 3 0 .4 3 0 .4 3 0 .4 3
m dgfb 2 0 1 0 3 1 .8 9 3 1 .9 8 3 1 .9 8 3 2 .0 4 3 1 .8 8 3 2 .0 0 1 4 .7 4 1 4 .7 8 1 4 .7 8 1 4 .8 3 1 4 .7 0 1 4 .8 0 0 .4 5 0 .4 3 0 .4 3 0 .4 3 0 .4 3 0 .4 3
m dgfb 2 0 1 5 3 1 .8 2 3 2 .0 3 3 1 .9 8 3 2 .0 8 3 1 .7 9 3 2 .0 0 1 4 .7 3 1 4 .8 2 1 4 .7 8 1 4 .8 6 1 4 .6 7 1 4 .8 0 0 .4 7 0 .4 3 0 .4 3 0 .4 3 0 .4 3 0 .4 3
m dgft r 2 0 0 7 3 1 .9 8 3 1 .9 8 3 1 .9 8 3 1 .9 8 3 1 .9 8 3 1 .9 8 1 4 .7 8 1 4 .7 8 1 4 .7 8 1 4 .7 8 1 4 .7 8 1 4 .7 8 0 .4 3 0 .4 3 0 .4 3 0 .4 3 0 .4 3 0 .4 3
m dgft r 2 0 1 0 3 1 .8 9 3 1 .9 8 3 1 .9 8 3 2 .0 4 3 1 .8 8 3 2 .0 0 1 4 .7 4 1 4 .7 8 1 4 .7 8 1 4 .8 3 1 4 .7 0 1 4 .8 0 0 .4 5 0 .4 3 0 .4 3 0 .4 3 0 .4 3 0 .4 3
m dgft r 2 0 1 5 3 1 .8 2 3 2 .0 3 3 1 .9 8 3 2 .0 8 3 1 .7 9 3 2 .0 0 1 4 .7 3 1 4 .8 2 1 4 .7 8 1 4 .8 6 1 4 .6 7 1 4 .8 0 0 .4 7 0 .4 3 0 .4 3 0 .4 3 0 .4 3 0 .4 3
m dgft rdr m 2 0 0 7 3 1 .9 8 3 1 .9 8 3 1 .9 8 3 1 .9 8 3 1 .9 8 3 1 .9 8 1 4 .7 8 1 4 .7 8 1 4 .7 8 1 4 .7 8 1 4 .7 8 1 4 .7 8 0 .4 3 0 .4 3 0 .4 3 0 .4 3 0 .4 3 0 .4 3
m dgft rdr m 2 0 1 0 3 1 .9 0 3 1 .9 9 3 1 .9 8 3 2 .0 2 3 1 .8 9 3 1 .9 9 1 4 .7 5 1 4 .7 8 1 4 .7 8 1 4 .8 2 1 4 .7 0 1 4 .7 9 0 .4 4 0 .4 3 0 .4 3 0 .4 3 0 .4 3 0 .4 3
m dgft rdr m 2 0 1 5 3 1 .8 6 3 2 .0 3 3 1 .9 8 3 2 .0 6 3 1 .8 2 3 2 .0 0 1 4 .7 4 1 4 .8 2 1 4 .7 8 1 4 .8 4 1 4 .6 7 1 4 .8 0 0 .4 6 0 .4 3 0 .4 3 0 .4 3 0 .4 3 0 .4 3
Pove r ty Rate Ext re m e Pove r ty Gini Co e fficie nt
U=Unemployment effects; S=Sector effects; W1=Relative wage effects; W2=Average wage effects; M=skill effects.

82
11. References
African Development Bank, AfDB (2008) ‘Uganda Economic Outlook 2009/10’, in ‘Africa Economic Outlook 2009/10’, AfDB/ OECD Publications.
Araar, A. and J-Y. Duclos (2007) DASP: Distributive Analysis Stata Package. PEP, CIRPEE and World Bank: Universite of Laval.
Ayoki, M., Obwona M. and M. Ogwapus (2005) ‘Tax Reforms and Domestic Revenue Mobilization in Uganda, Global Development Network (GDN), Institute of Policy Research and Analysis, Washington, D.C.
Kappel, R., Lay, J. and S. Steiner (2005) ‘Uganda: No More Pro-poor Growth?’ Development Policy Review, 23(1):27-53.
Kasekende, L, Atingi-Ego and R. Sebudde (2004), ‘The African Growth Experience: Uganda Country Case Study,’ African Economic Research Consortium.
Harttgen, K., Klasen, S. and M. Misselhorn (2008) ‘Education for All? Measuring Pro-Poor Educational Outcomes in Developing Countries’, Background paper prepared for the Education for All Global Monitoring Report 2009.
Levine, S. (2010) ‘Exploring differences in national and international poverty estimates: Is Uganda on track to halve poverty by 2015?’ Paper presented at the African Economic Conference in Tunis, Tunesia, 27-29 October, 2010.
Lofgren, H., Harris, R.L. and S. Robinson (2002) A Standard Computable General Equilibrium (CGE) Model in GAMS. Microcomputers in Policy Research, Vol. 5. Washington, D.C.: IFPRI (http://www.ifpri.org/pubs/microcom/micro5.htm).
Lofgren, H. and C. Diaz-Bonilla (2006) ‘MAMS: An Economywide Model for Analysis of MDG Country Strategies – Technical Documentation,’ mimeographed, World Bank.
Ministry of Finance Planning and Economic Development (2009) ‘National Budget Framework Paper for 2009/2010,’ Kampala.
Ministry of Finance, Planning and Economic Development (2010) ‘Millennium Development Goals Report for Uganda. Special theme: Accelerating progress towards improving maternal health,’ September 2010, Kampala.
Okidi, A., Ssewanyana, S., Bategeka, L,. and F. Muhumuza (2007) ‘Uganda’s Experience with Operationalising Pro-poor Growth 1992-2003’, in T. Besley and L.J. Cord (eds) ‘Delivering on the Promise of Pro-poor Growth: Insights and Lessons from Country Experiences,’ Washington, DC: Palgrave MacMillan and World Bank.
Oxford Policy Management (2008) ‘Independent Evaluation of Uganda’s Poverty Eradication Action Plan (PEAP): Final Synthesis Report’, July 2008.
Ravallion, M. and S. Chen (2003) ‘Measuring Pro-Poor Growth’, Economic Letters, 78(1): 93-99.
Ssewanyana, S. and S. Younger (2007) ‘Infant Mortality in Uganda: Determinants, Trends and the Millennium Development Goals.’ Journal of African Economies, 17(1):34-61.
Twimukye, E., Matovu, J., Levine, S. and P. Birungi (2009) ‘Sectoral and Welfare Effects of the Global Economic and Financial Crisis on Uganda: A Recursive Dynamic CGE Analysis,’ EPRC Working Paper.
Uganda Bureau of Statistics (2008), 2008 Statistical Abstract, Kampala.
Uganda Bureau of Statistics (2009), 2009 Statistical Abstract, Kampala.
Vos, R. and M. V. Sánchez (2010) ‘A Non-Parametric Microsimulation Approach to Assess Changes in Inequality and Poverty.’ DESA Working Paper No. 94, United Nations Department of Economic and Social Affairs, New York.

83
Williamson, T. and S. Canagarajah (2003) ‘Is there a place for virtual poverty funds in pro-poor public spending reform? Lessons from Uganda’s PAF’, Development Policy Review, 21(3):449-480.
World Bank (2007) ‘Uganda: Moving Beyond Recovery. Investment and Behavior Change for Growth,’ Country Economic Memorandum, Volume 1, Summary and Recommendations. Washington D.C: World Bank.