Embed Size (px)
Citation preview
The respiratory system Practical 2
Objectives
The lung volumes and capacities
Ventilation and its changes, hyper and hypoventilation
The dead volume and its function, alveolar ventilation
Composition of the atmospheric and the alveolar air, partial pressure of a gas
Diffusion of O2 and CO2 in lungs and their transport in blood
Regulation of breathing
Practical tasks
1. Functional lung examination
2. Examination with the SanoScope spirometer
3. The effect of increasing CO2 and decreasing O2 content in the inspired air on respiration
4. Measurement of haemoglobin oxygen saturation by the pulse oxymeter
© Katarína Babinská MD, PhD., MSc., 2016
The respiratory system
Practical 2
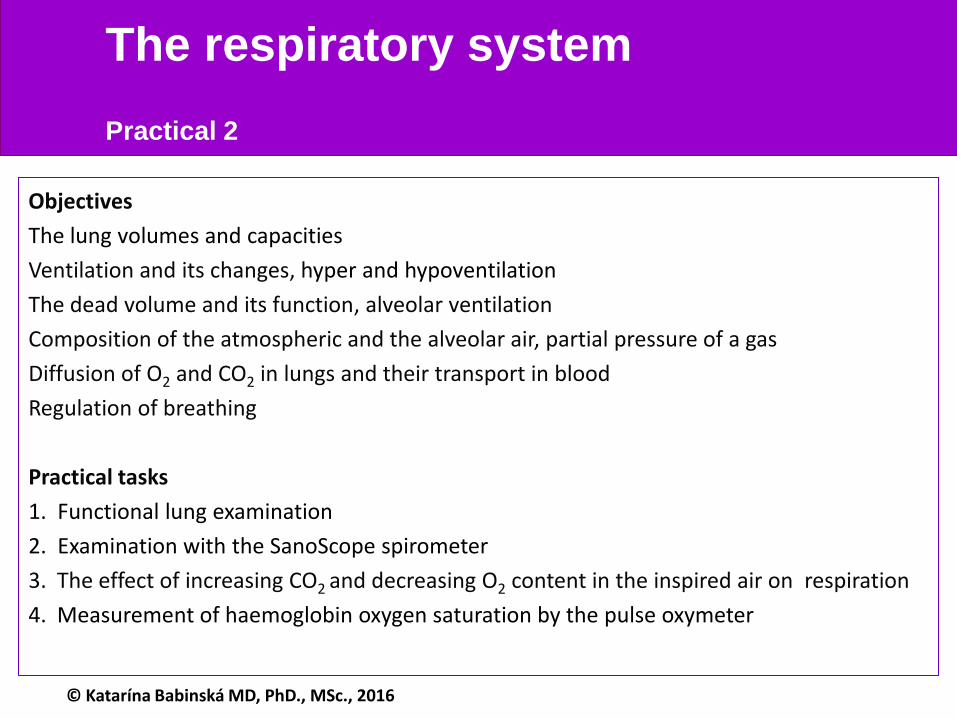
- the most common pulmonary function test
- the patient is breathing into a spirometer - he follows the doctor´s instructions
how to breathe: quiet breathing, maximum inspiration, hold the breath, ....
- a record is obtained and evaluated (manually or by a computer)
Task 1. The functional lung examination (spirometry)
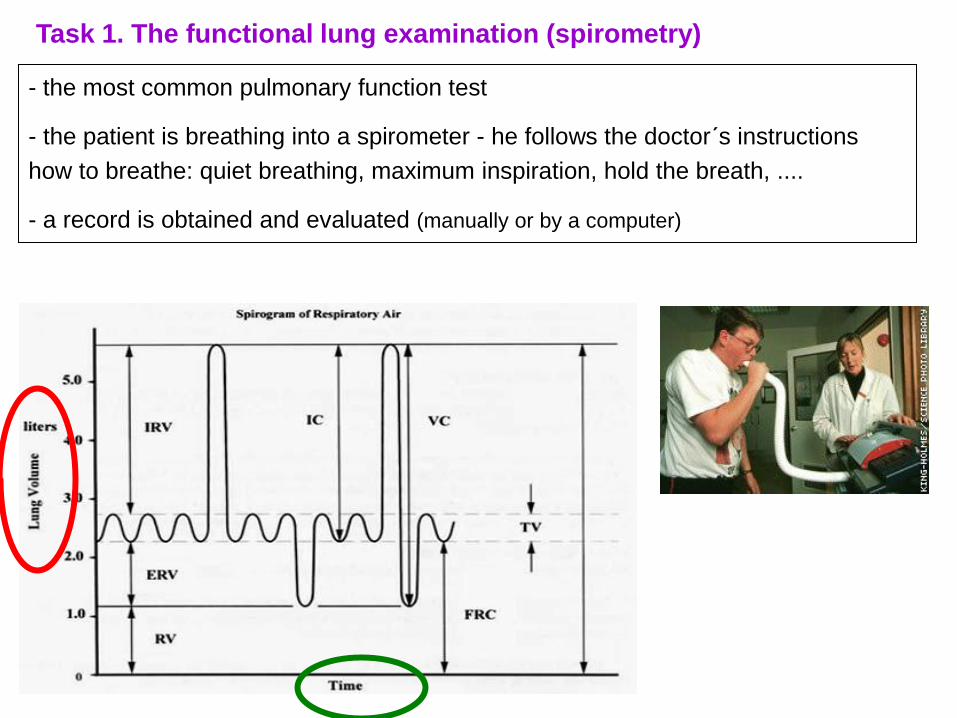
1. Perform the examination – get a record
- patient is in sitting position
- he/she is exhaling into the spirometer
Procedure
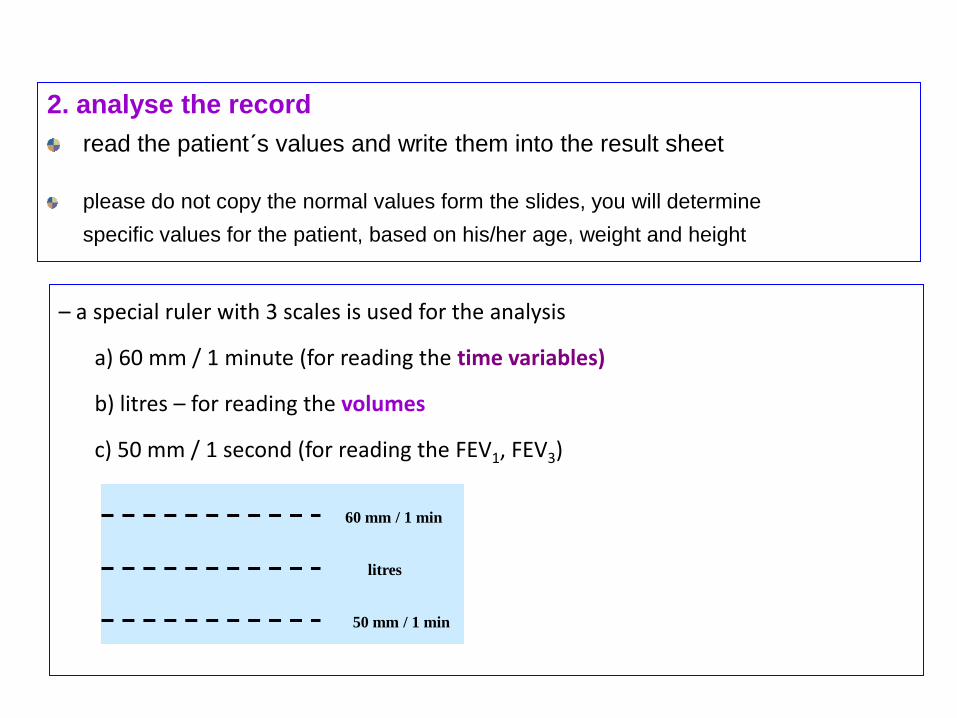
– a special ruler with 3 scales is used for the analysis
a) 60 mm / 1 minute (for reading the time variables)
b) litres – for reading the volumes
c) 50 mm / 1 second (for reading the FEV1, FEV3)
2. analyse the record
read the patient´s values and write them into the result sheet
please do not copy the normal values form the slides, you will determine
specific values for the patient, based on his/her age, weight and height
60 mm / 1 min
litres
50 mm / 1 min
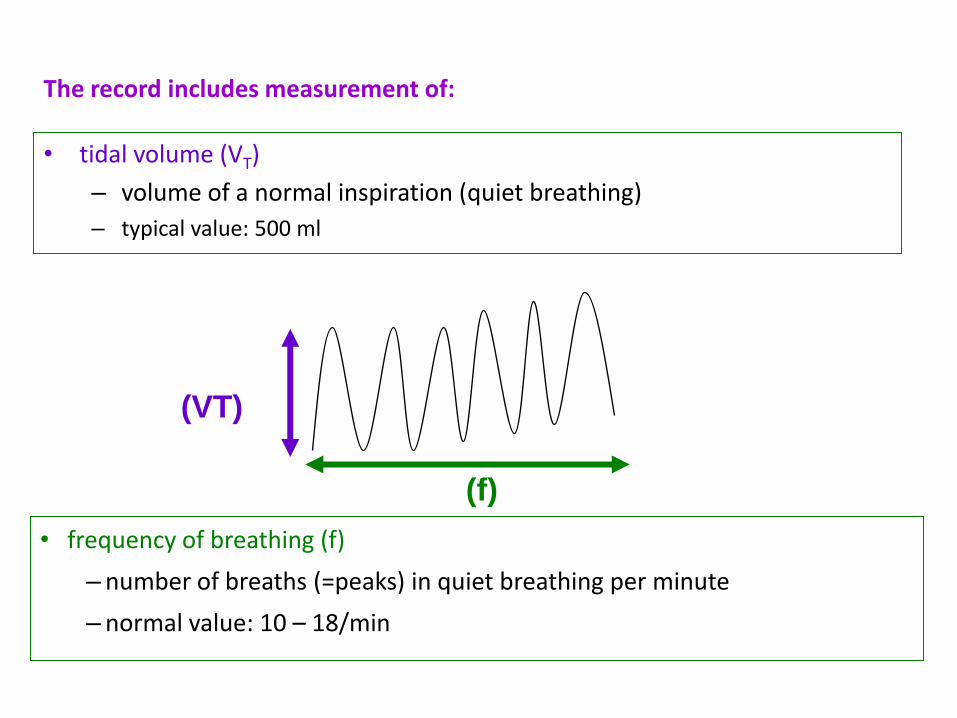
The record includes measurement of:
• tidal volume (VT)
– volume of a normal inspiration (quiet breathing)
– typical value: 500 ml
• frequency of breathing (f)
– number of breaths (=peaks) in quiet breathing per minute
– normal value: 10 – 18/min
(VT)
(f)
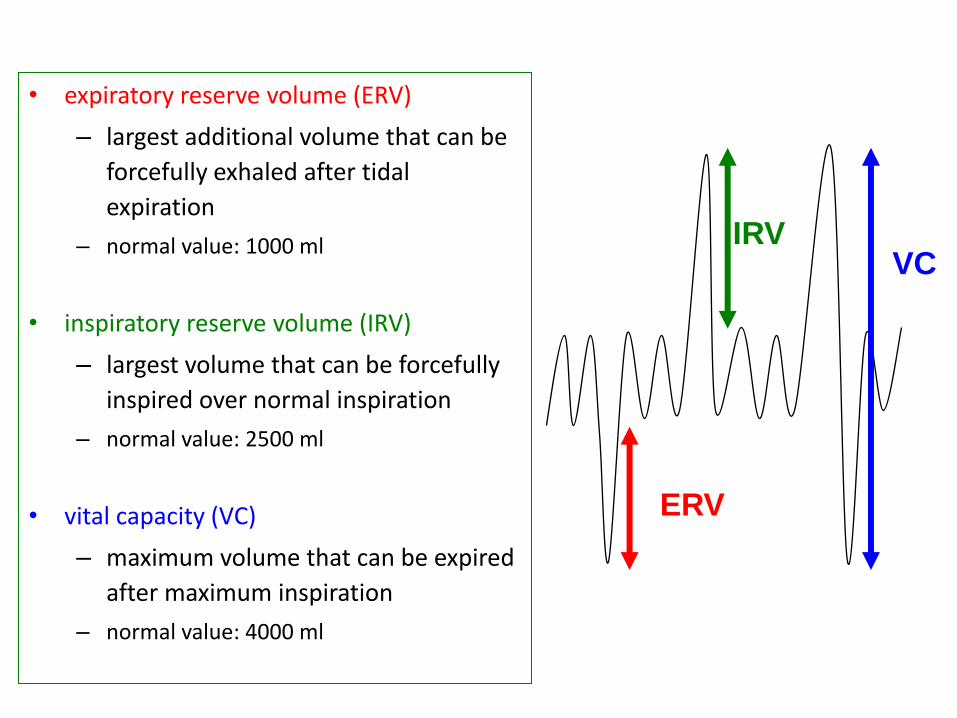
• expiratory reserve volume (ERV)
– largest additional volume that can be
forcefully exhaled after tidal
expiration
– normal value: 1000 ml
• inspiratory reserve volume (IRV)
– largest volume that can be forcefully
inspired over normal inspiration
– normal value: 2500 ml
• vital capacity (VC)
– maximum volume that can be expired
after maximum inspiration
– normal value: 4000 ml
ERV
IRV VC
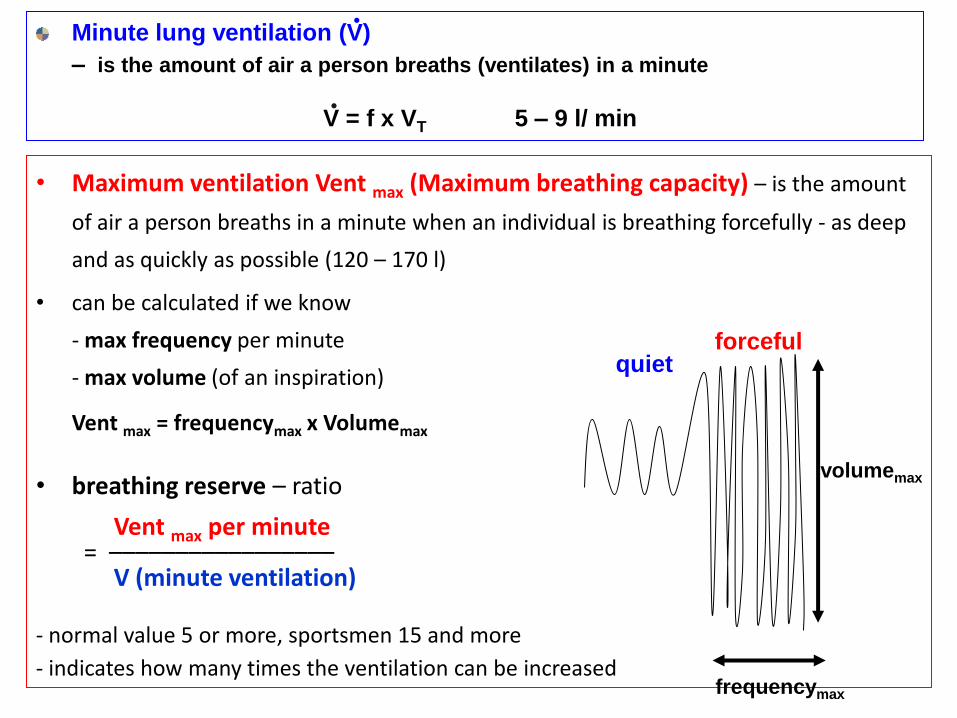
Minute lung ventilation (V)
– is the amount of air a person breaths (ventilates) in a minute
V = f x VT 5 – 9 l/ min
• Maximum ventilation Vent max (Maximum breathing capacity) – is the amount
of air a person breaths in a minute when an individual is breathing forcefully - as deep
and as quickly as possible (120 – 170 l)
• can be calculated if we know
- max frequency per minute
- max volume (of an inspiration)
Vent max = frequencymax x Volumemax
• breathing reserve – ratio
Vent max per minute = ––––––––––––––––– V (minute ventilation)
- normal value 5 or more, sportsmen 15 and more
- indicates how many times the ventilation can be increased
.
quiet forceful
frequencymax
volumemax
.
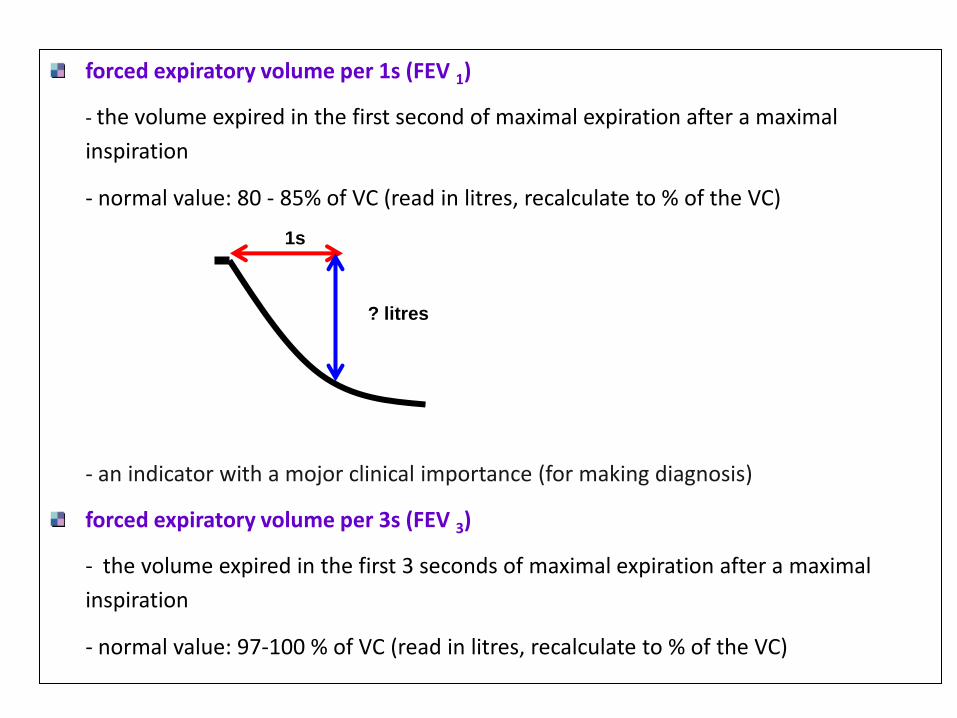
forced expiratory volume per 1s (FEV 1)
- the volume expired in the first second of maximal expiration after a maximal
inspiration
- normal value: 80 - 85% of VC (read in litres, recalculate to % of the VC)
- an indicator with a mojor clinical importance (for making diagnosis)
forced expiratory volume per 3s (FEV 3)
- the volume expired in the first 3 seconds of maximal expiration after a maximal
inspiration
- normal value: 97-100 % of VC (read in litres, recalculate to % of the VC)
1s
? litres
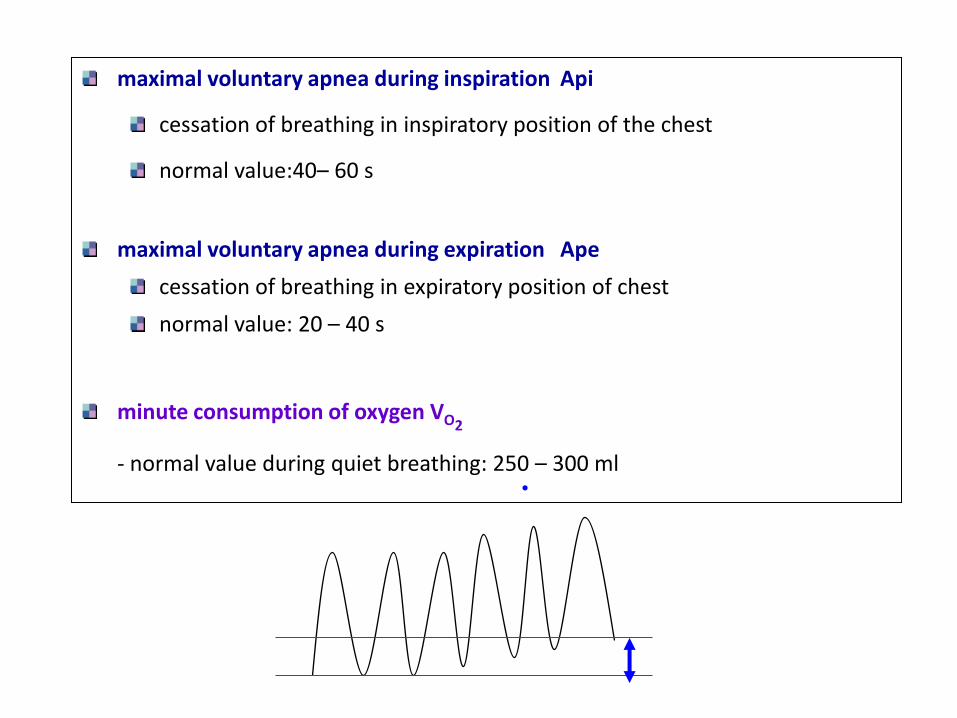
maximal voluntary apnea during inspiration Api
cessation of breathing in inspiratory position of the chest
normal value:40– 60 s
maximal voluntary apnea during expiration Ape
cessation of breathing in expiratory position of chest
normal value: 20 – 40 s
minute consumption of oxygen VO2
- normal value during quiet breathing: 250 – 300 ml .
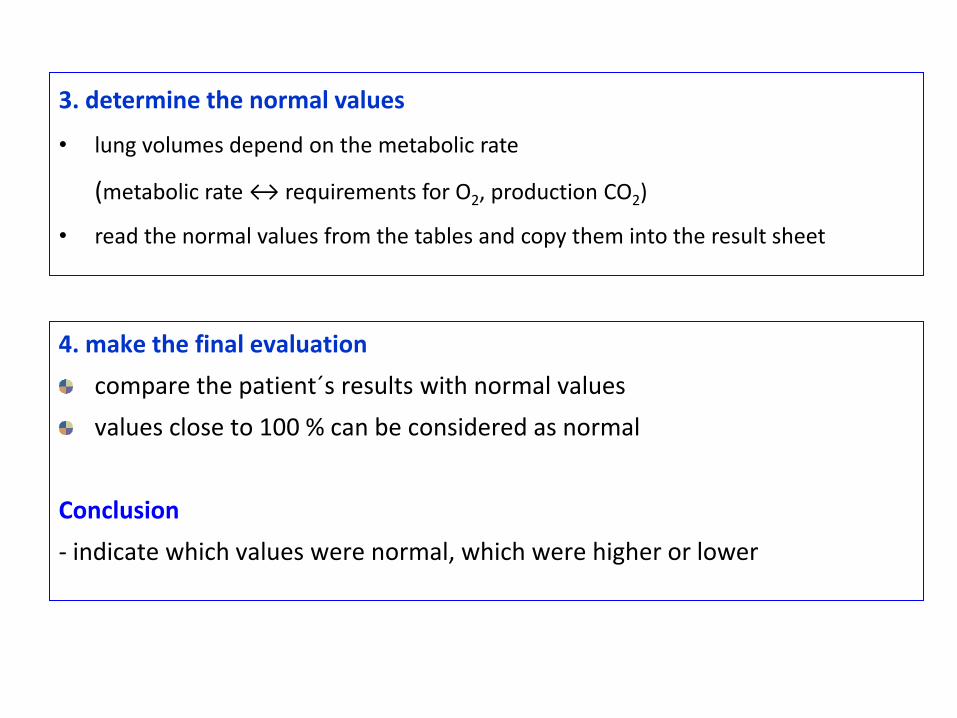
3. determine the normal values
• lung volumes depend on the metabolic rate
(metabolic rate ↔ requirements for O2, production CO2)
• read the normal values from the tables and copy them into the result sheet
4. make the final evaluation
compare the patient´s results with normal values
values close to 100 % can be considered as normal
Conclusion
- indicate which values were normal, which were higher or lower

Spirometry examination using Sanoscope device
- Computer spirometry
Procedure
- Provide your personal data (date of birth, age, height, gender, smoking status..)
1. 2x normal in/ex
2. normal in and then maximum inspiration at normal pace (not quick)
3. immediately forceful/quick inspiration (as quick as possible)
4. immediately forceful expiration (as quick as possible)
1 2 3 4
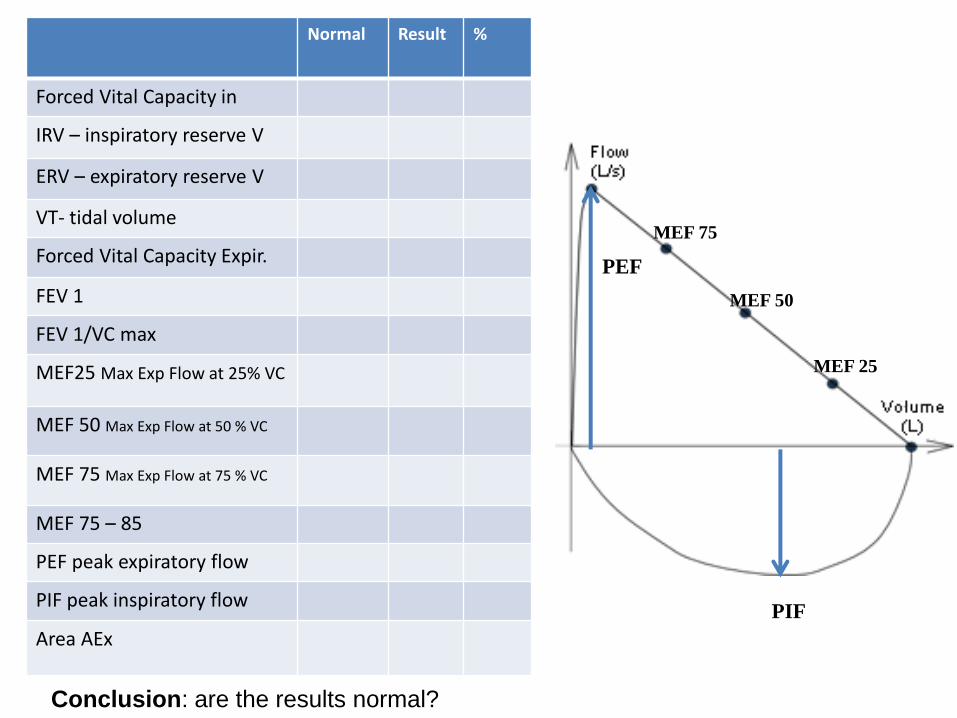
Conclusion: are the results normal?
Normal Result %
Forced Vital Capacity in
IRV – inspiratory reserve V
ERV – expiratory reserve V
VT- tidal volume
Forced Vital Capacity Expir.
FEV 1
FEV 1/VC max
MEF25 Max Exp Flow at 25% VC
MEF 50 Max Exp Flow at 50 % VC
MEF 75 Max Exp Flow at 75 % VC
MEF 75 – 85
PEF peak expiratory flow
PIF peak inspiratory flow
Area AEx
MEF 25
MEF 50
MEF 75
PIF
PEF
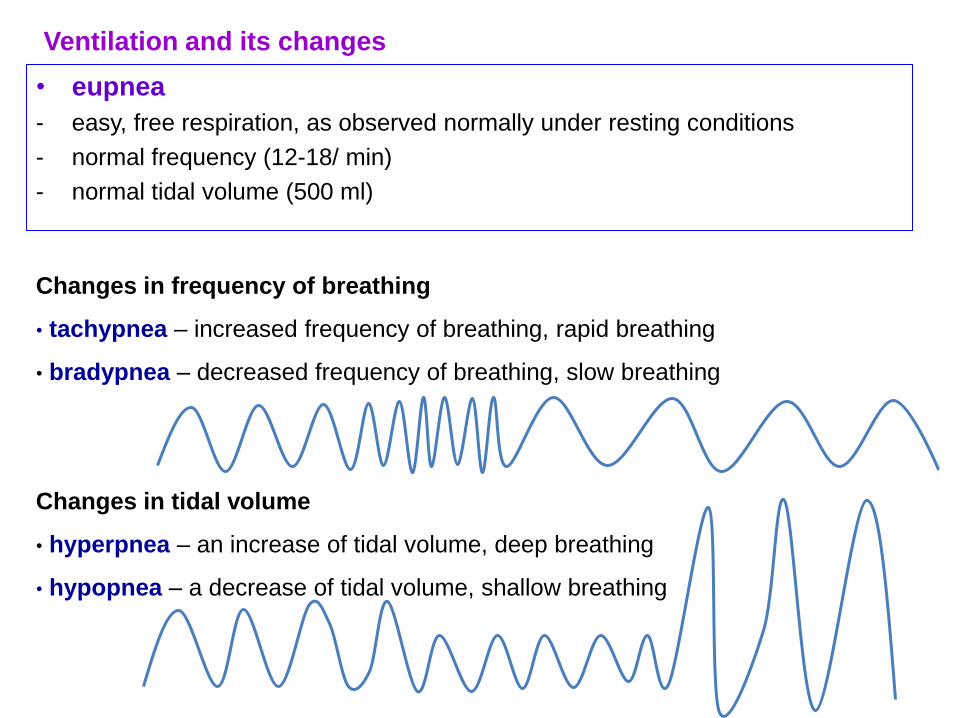
• eupnea
- easy, free respiration, as observed normally under resting conditions
- normal frequency (12-18/ min)
- normal tidal volume (500 ml)
Changes in frequency of breathing
• tachypnea – increased frequency of breathing, rapid breathing
• bradypnea – decreased frequency of breathing, slow breathing
Changes in tidal volume
• hyperpnea – an increase of tidal volume, deep breathing
• hypopnea – a decrease of tidal volume, shallow breathing
Ventilation and its changes
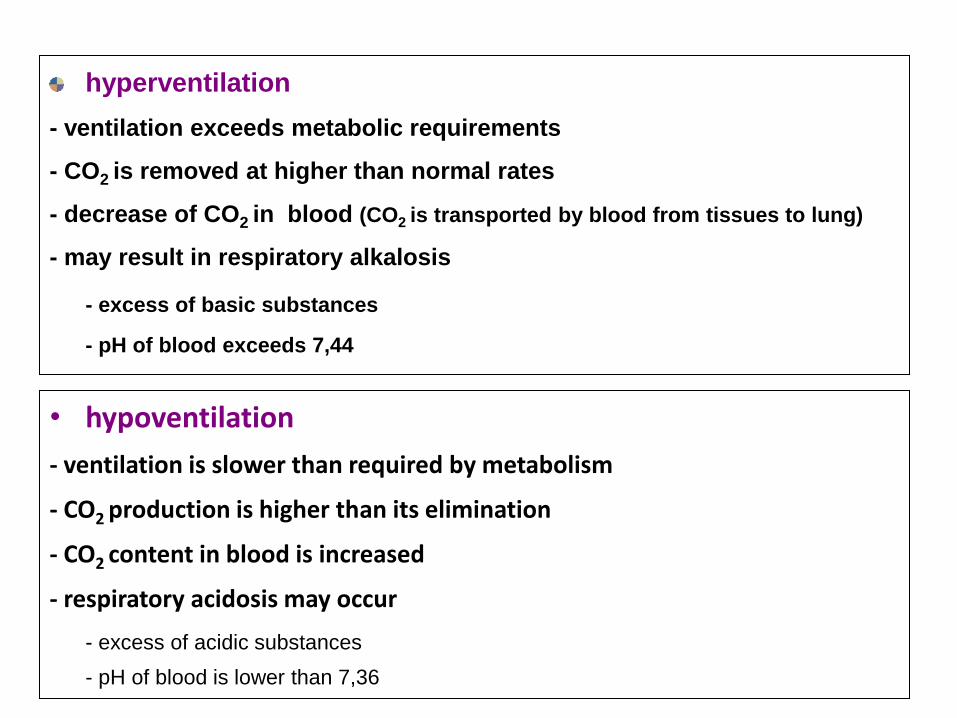
• hypoventilation
- ventilation is slower than required by metabolism
- CO2 production is higher than its elimination
- CO2 content in blood is increased
- respiratory acidosis may occur
- excess of acidic substances
- pH of blood is lower than 7,36
hyperventilation
- ventilation exceeds metabolic requirements
- CO2 is removed at higher than normal rates
- decrease of CO2 in blood (CO2 is transported by blood from tissues to lung)
- may result in respiratory alkalosis
- excess of basic substances
- pH of blood exceeds 7,44
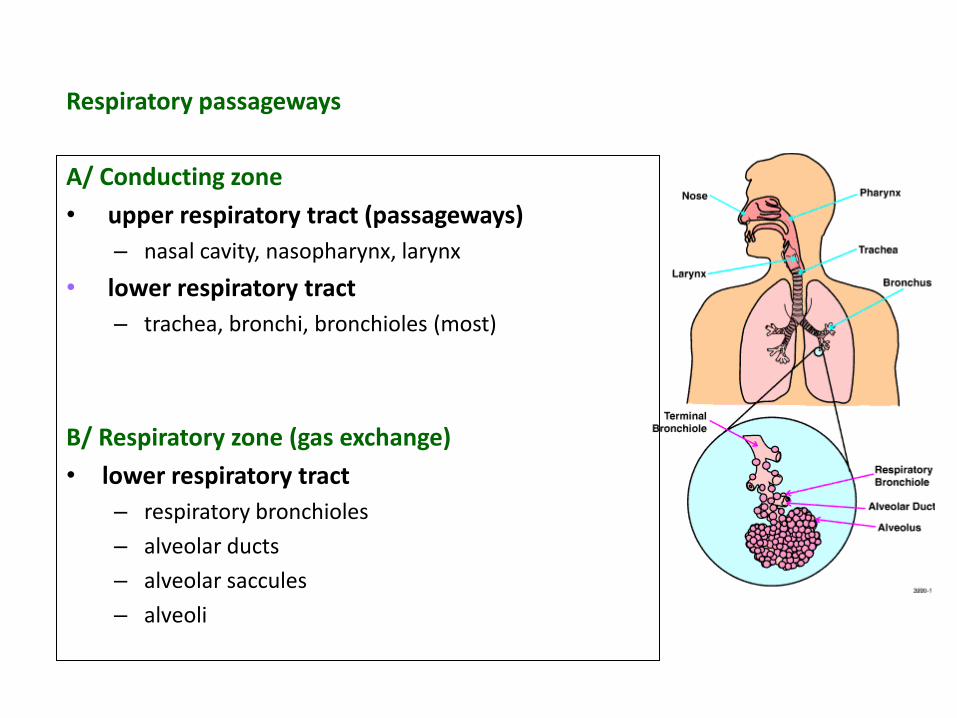
Respiratory passageways
A/ Conducting zone
• upper respiratory tract (passageways)
– nasal cavity, nasopharynx, larynx
• lower respiratory tract
– trachea, bronchi, bronchioles (most)
B/ Respiratory zone (gas exchange)
• lower respiratory tract
– respiratory bronchioles
– alveolar ducts
– alveolar saccules
– alveoli
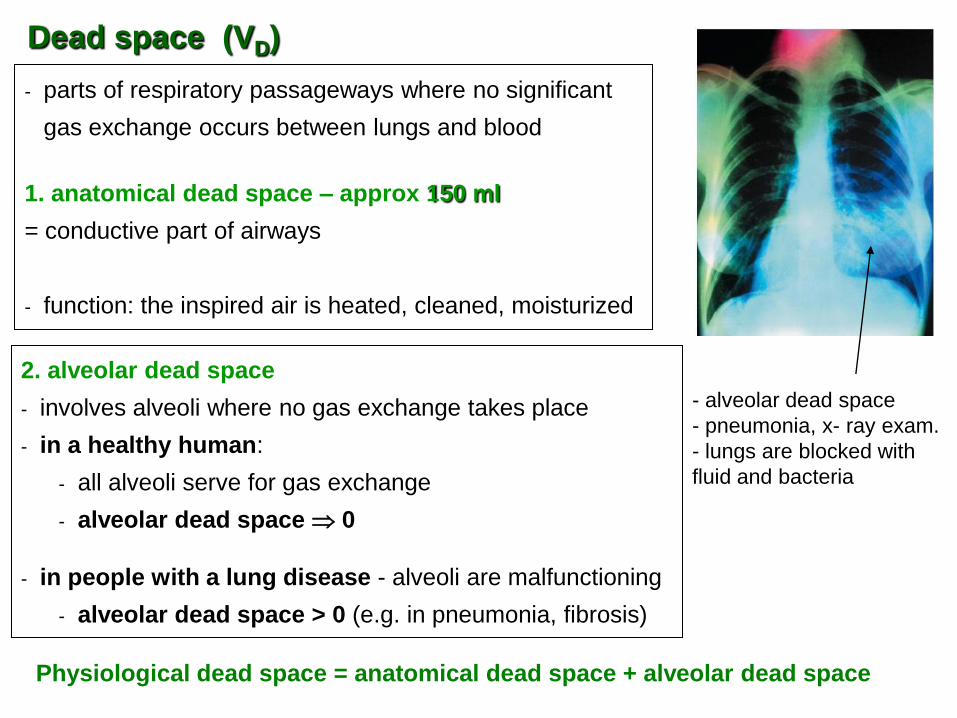
2. alveolar dead space
- involves alveoli where no gas exchange takes place
- in a healthy human:
- all alveoli serve for gas exchange
- alveolar dead space 0
- in people with a lung disease - alveoli are malfunctioning
- alveolar dead space > 0 (e.g. in pneumonia, fibrosis)
- parts of respiratory passageways where no significant
gas exchange occurs between lungs and blood
1. anatomical dead space – approx 150 ml
= conductive part of airways
- function: the inspired air is heated, cleaned, moisturized
Physiological dead space = anatomical dead space + alveolar dead space
Dead space (VD)
- alveolar dead space
- pneumonia, x- ray exam.
- lungs are blocked with
fluid and bacteria
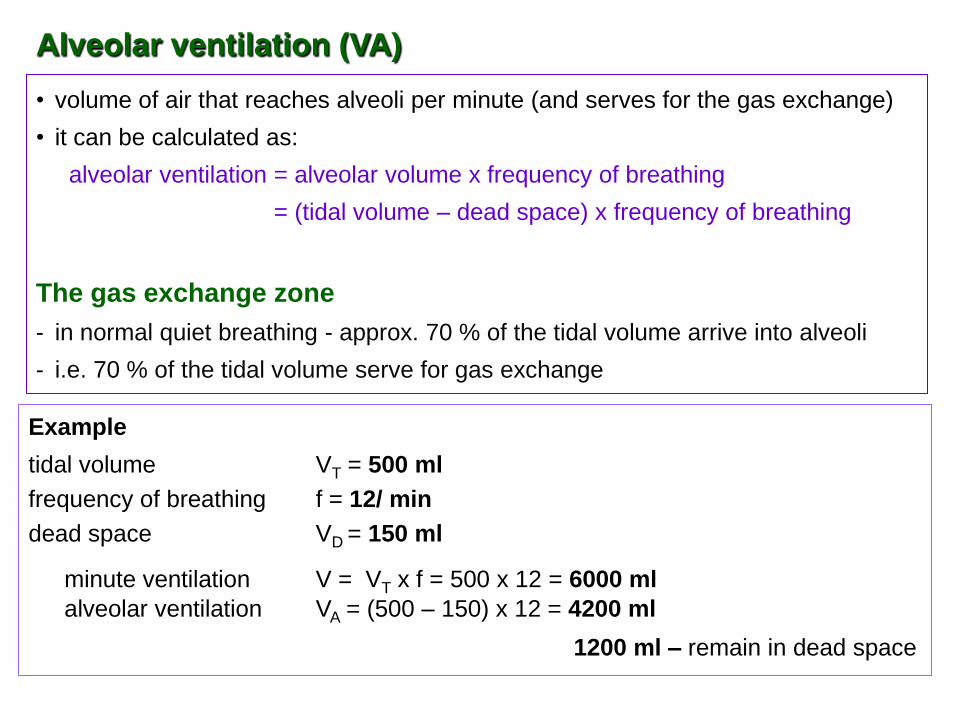
• volume of air that reaches alveoli per minute (and serves for the gas exchange)
• it can be calculated as:
alveolar ventilation = alveolar volume x frequency of breathing
= (tidal volume – dead space) x frequency of breathing
The gas exchange zone
- in normal quiet breathing - approx. 70 % of the tidal volume arrive into alveoli
- i.e. 70 % of the tidal volume serve for gas exchange
Example
tidal volume VT = 500 ml
frequency of breathing f = 12/ min
dead space VD = 150 ml
minute ventilation V = VT x f = 500 x 12 = 6000 ml
alveolar ventilation VA = (500 – 150) x 12 = 4200 ml
1200 ml – remain in dead space
Alveolar ventilation (VA)
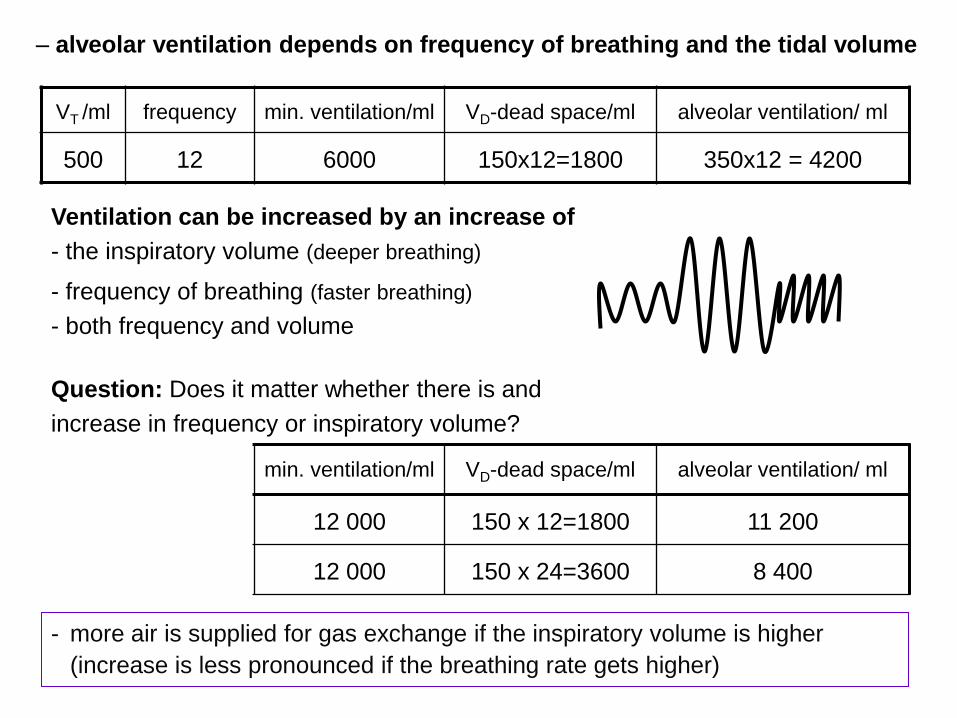
- more air is supplied for gas exchange if the inspiratory volume is higher
(increase is less pronounced if the breathing rate gets higher)
VT /ml frequency min. ventilation/ml VD-dead space/ml alveolar ventilation/ ml
500 12 6000 150x12=1800 350x12 = 4200
Ventilation can be increased by an increase of
- the inspiratory volume (deeper breathing)
- frequency of breathing (faster breathing)
- both frequency and volume
Question: Does it matter whether there is and
increase in frequency or inspiratory volume?
VT /ml frequency min. ventilation/ml VD-dead space/ml alveolar ventilation/ ml
1000 12 12 000 150 x 12=1800 11 200
500 24 12 000 150 x 24=3600 8 400
– alveolar ventilation depends on frequency of breathing and the tidal volume
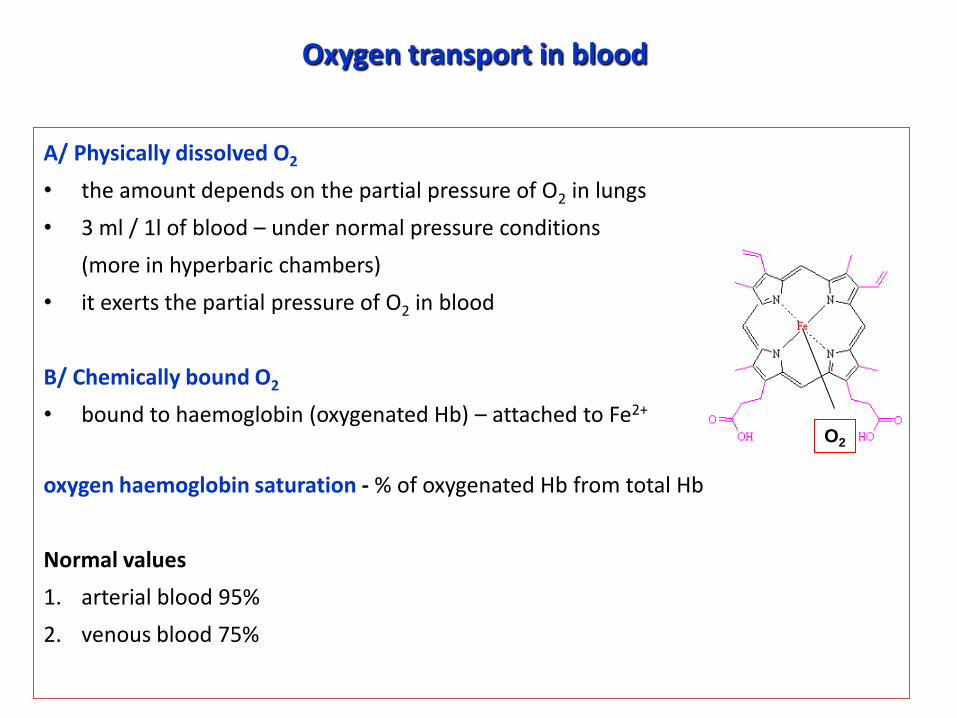
Oxygen transport in blood
A/ Physically dissolved O2
• the amount depends on the partial pressure of O2 in lungs
• 3 ml / 1l of blood – under normal pressure conditions
(more in hyperbaric chambers)
• it exerts the partial pressure of O2 in blood
B/ Chemically bound O2
• bound to haemoglobin (oxygenated Hb) – attached to Fe2+
oxygen haemoglobin saturation - % of oxygenated Hb from total Hb
Normal values
1. arterial blood 95%
2. venous blood 75%
O2
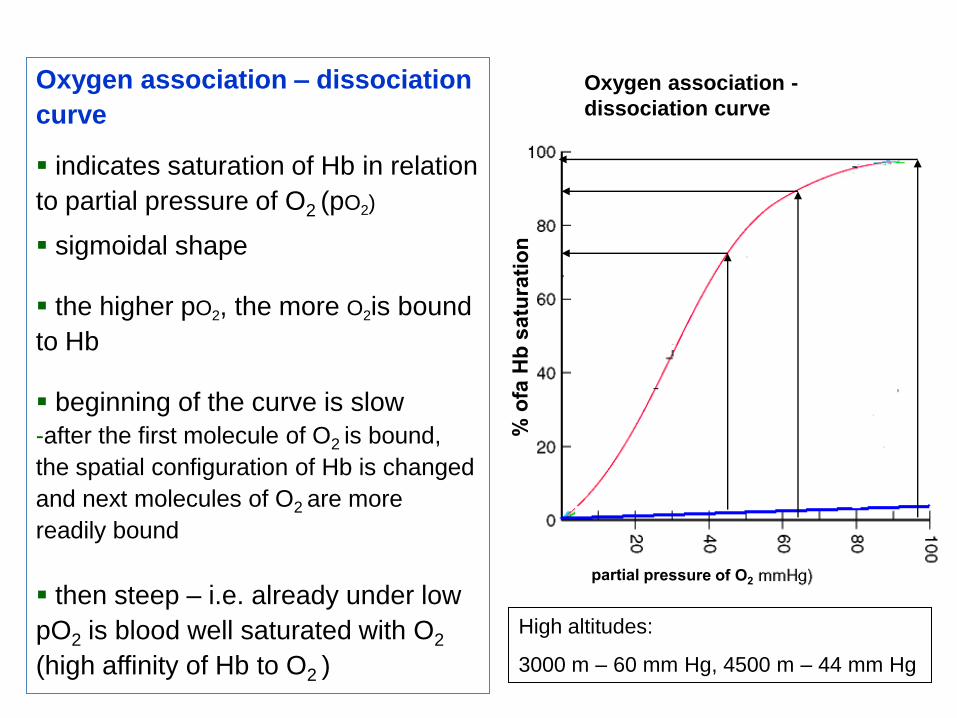
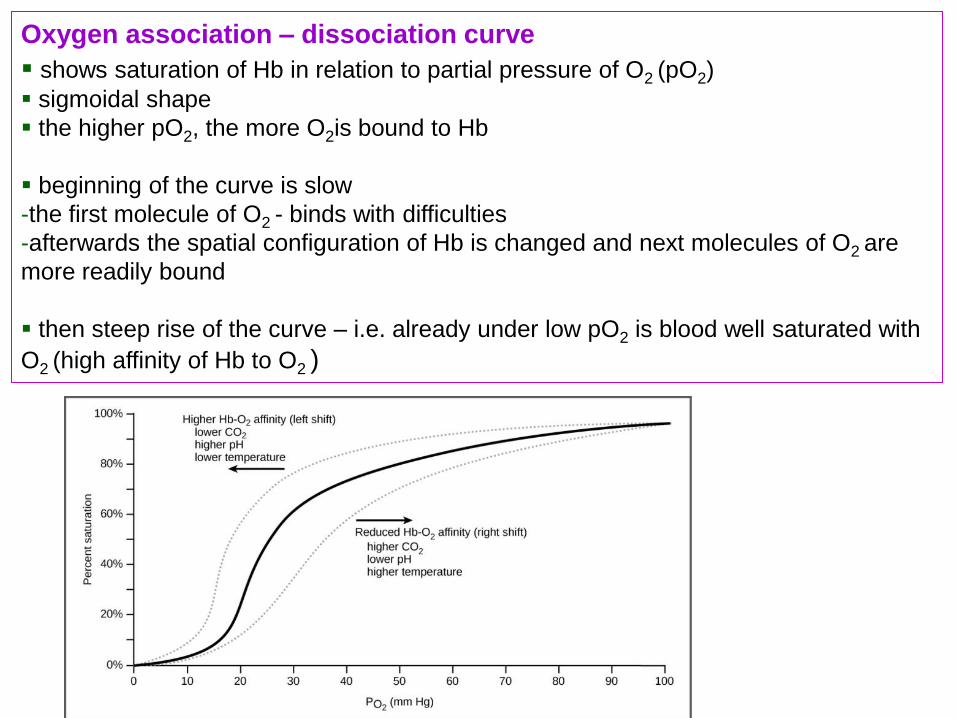
Oxygen association – dissociation
curve indicates saturation of Hb in relation
to partial pressure of O2 (pO2)
sigmoidal shape
the higher pO2, the more O2is bound
to Hb
beginning of the curve is slow
-after the first molecule of O2 is bound,
the spatial configuration of Hb is changed
and next molecules of O2 are more
readily bound
then steep – i.e. already under low
pO2 is blood well saturated with O2
(high affinity of Hb to O2 )
Oxygen association -
dissociation curve
High altitudes:
3000 m – 60 mm Hg, 4500 m – 44 mm Hg
Oxygen association – dissociation curve
shows saturation of Hb in relation to partial pressure of O2 (pO2) sigmoidal shape
the higher pO2, the more O2is bound to Hb
beginning of the curve is slow
-the first molecule of O2 - binds with difficulties
-afterwards the spatial configuration of Hb is changed and next molecules of O2 are
more readily bound
then steep rise of the curve – i.e. already under low pO2 is blood well saturated with
O2 (high affinity of Hb to O2 )
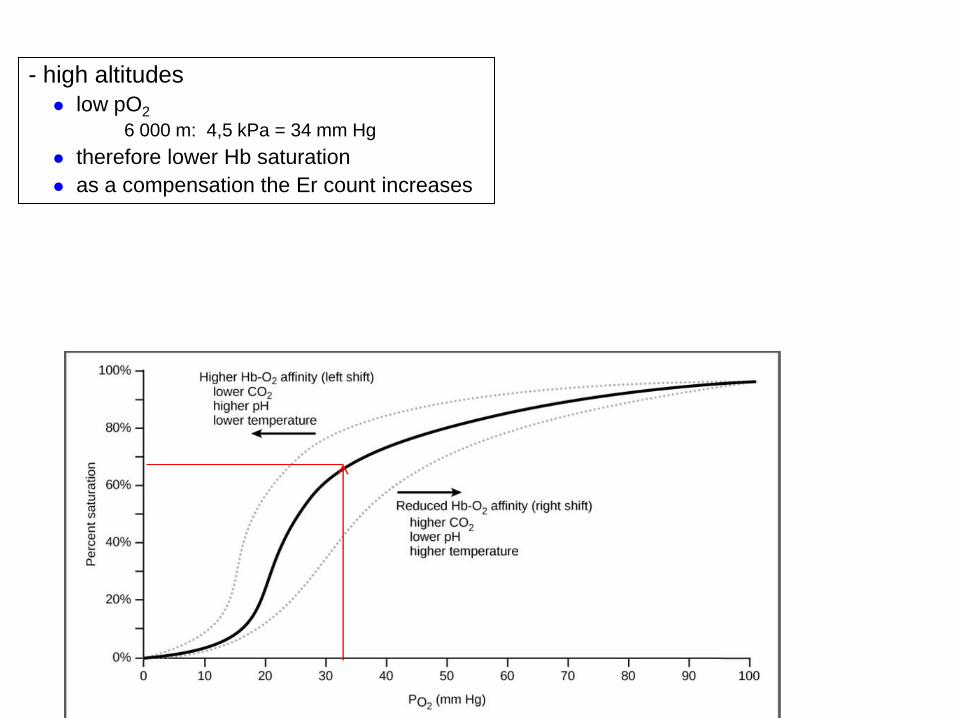
- high altitudes
low pO2
6 000 m: 4,5 kPa = 34 mm Hg
therefore lower Hb saturation
as a compensation the Er count increases
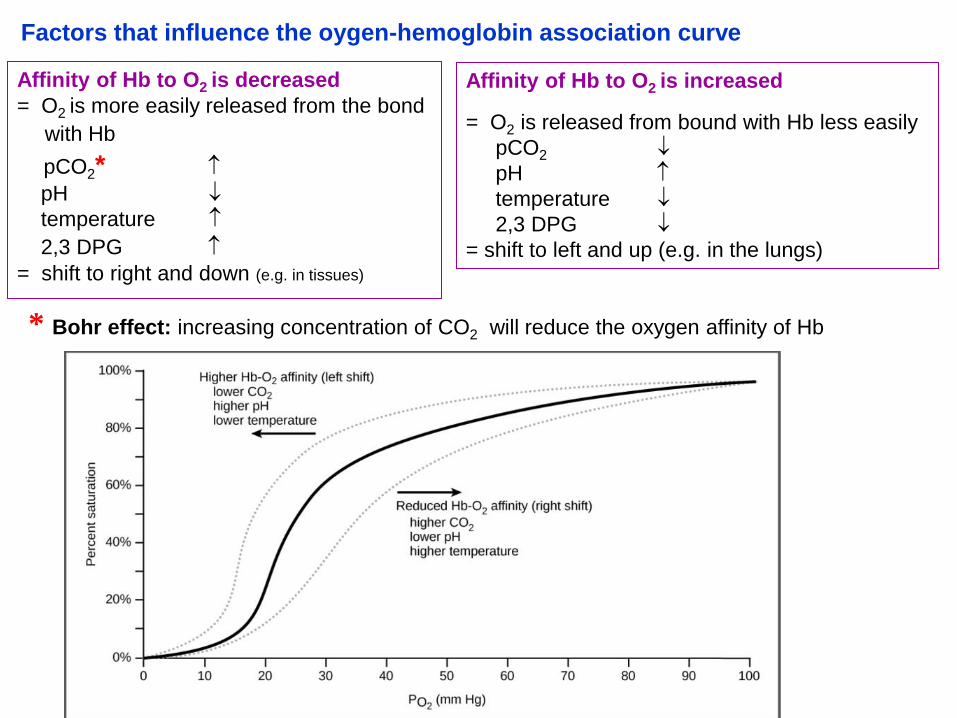
Affinity of Hb to O2 is decreased
= O2 is more easily released from the bond
with Hb
pCO2*
pH
temperature
2,3 DPG = shift to right and down (e.g. in tissues)
Affinity of Hb to O2 is increased
= O2 is released from bound with Hb less easily
pCO2
pH
temperature
2,3 DPG
= shift to left and up (e.g. in the lungs)
* Bohr effect: increasing concentration of CO2 will reduce the oxygen affinity of Hb
Factors that influence the oygen-hemoglobin association curve
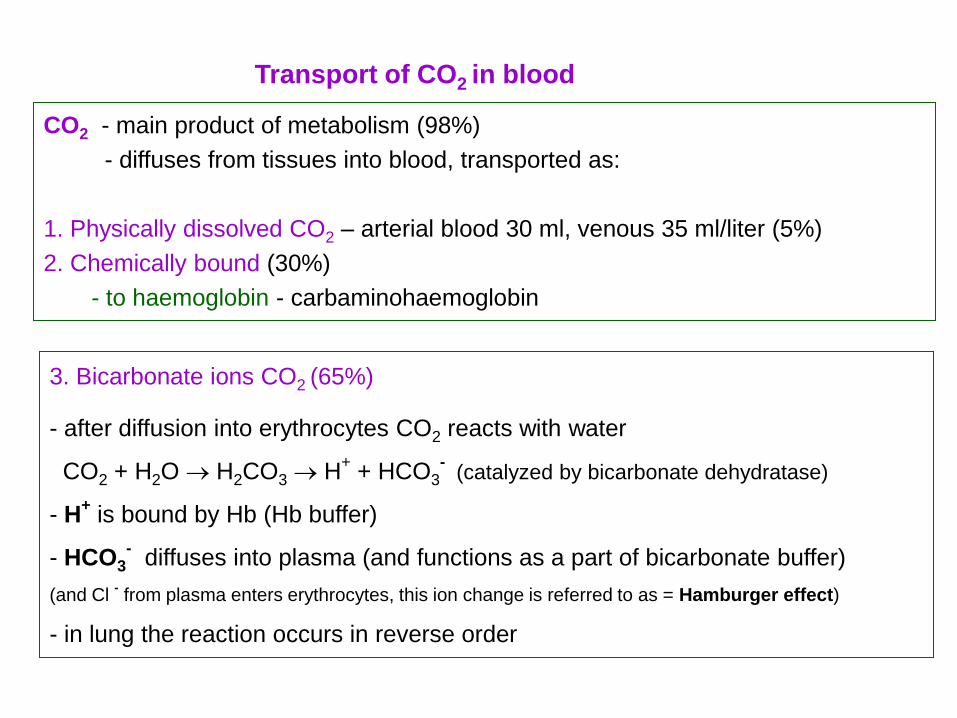
CO2 - main product of metabolism (98%)
- diffuses from tissues into blood, transported as:
1. Physically dissolved CO2 – arterial blood 30 ml, venous 35 ml/liter (5%)
2. Chemically bound (30%)
- to haemoglobin - carbaminohaemoglobin
Transport of CO2 in blood
3. Bicarbonate ions CO2 (65%)
- after diffusion into erythrocytes CO2 reacts with water
CO2 + H2O H2CO3 H+ + HCO3
- (catalyzed by bicarbonate dehydratase)
- H+ is bound by Hb (Hb buffer)
- HCO3- diffuses into plasma (and functions as a part of bicarbonate buffer)
(and Cl - from plasma enters erythrocytes, this ion change is referred to as = Hamburger effect)
- in lung the reaction occurs in reverse order
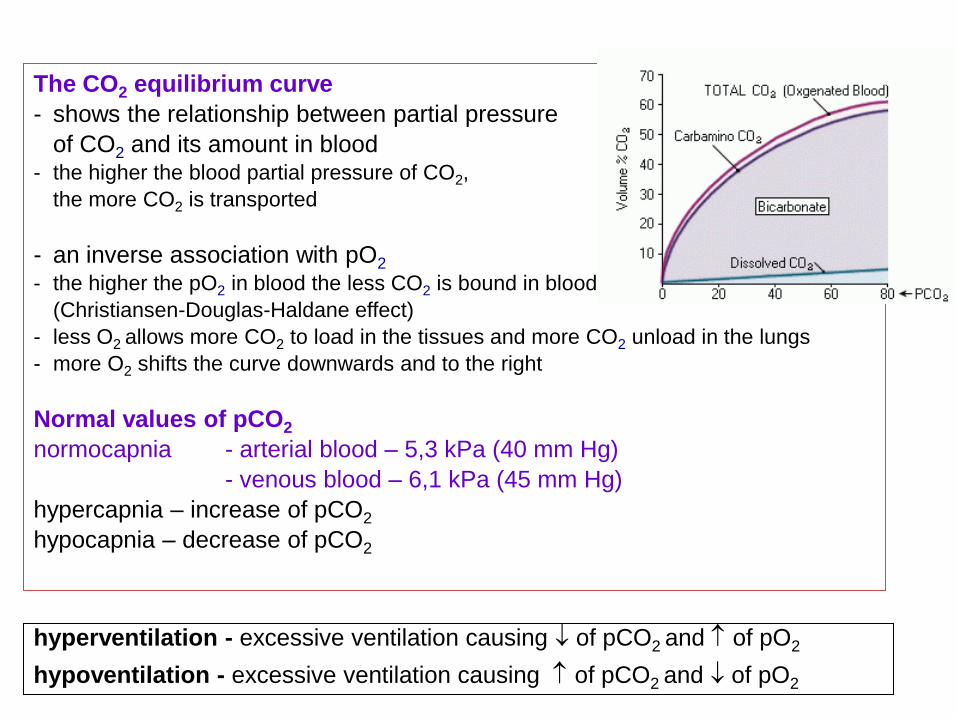
The CO2 equilibrium curve
- shows the relationship between partial pressure
of CO2 and its amount in blood - the higher the blood partial pressure of CO2,
the more CO2 is transported
- an inverse association with pO2 - the higher the pO2 in blood the less CO2 is bound in blood
(Christiansen-Douglas-Haldane effect)
- less O2 allows more CO2 to load in the tissues and more CO2 unload in the lungs
- more O2 shifts the curve downwards and to the right
Normal values of pCO2
normocapnia - arterial blood – 5,3 kPa (40 mm Hg)
- venous blood – 6,1 kPa (45 mm Hg)
hypercapnia – increase of pCO2
hypocapnia – decrease of pCO2
hyperventilation - excessive ventilation causing of pCO2 and of pO2
hypoventilation - excessive ventilation causing of pCO2 and of pO2
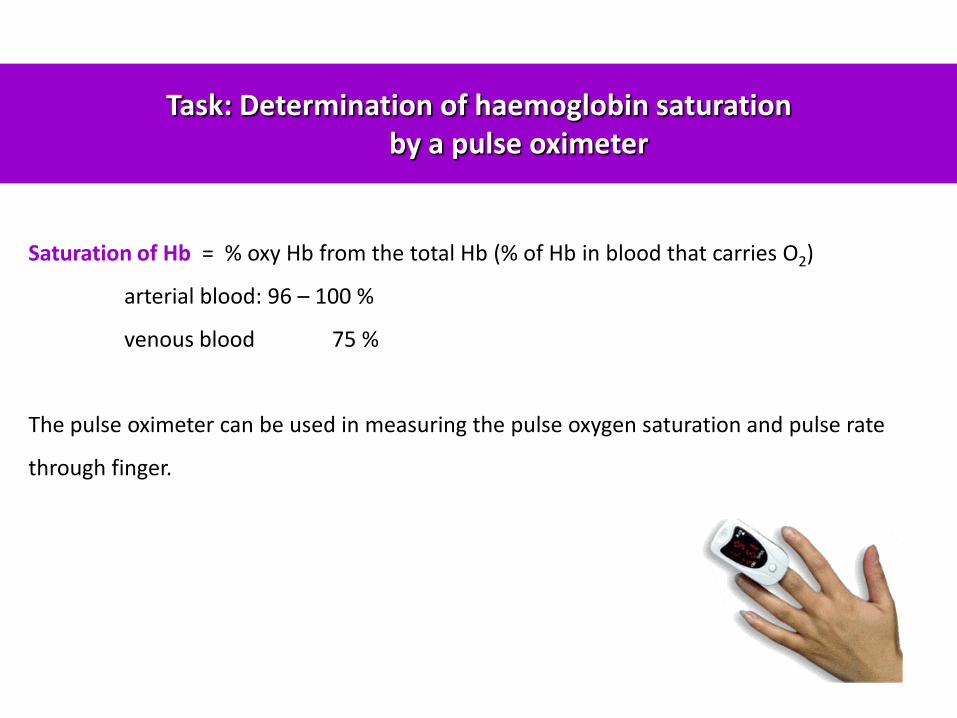
Task: Determination of haemoglobin saturation by a pulse oximeter
Saturation of Hb = % oxy Hb from the total Hb (% of Hb in blood that carries O2)
arterial blood: 96 – 100 %
venous blood 75 %
The pulse oximeter can be used in measuring the pulse oxygen saturation and pulse rate
through finger.
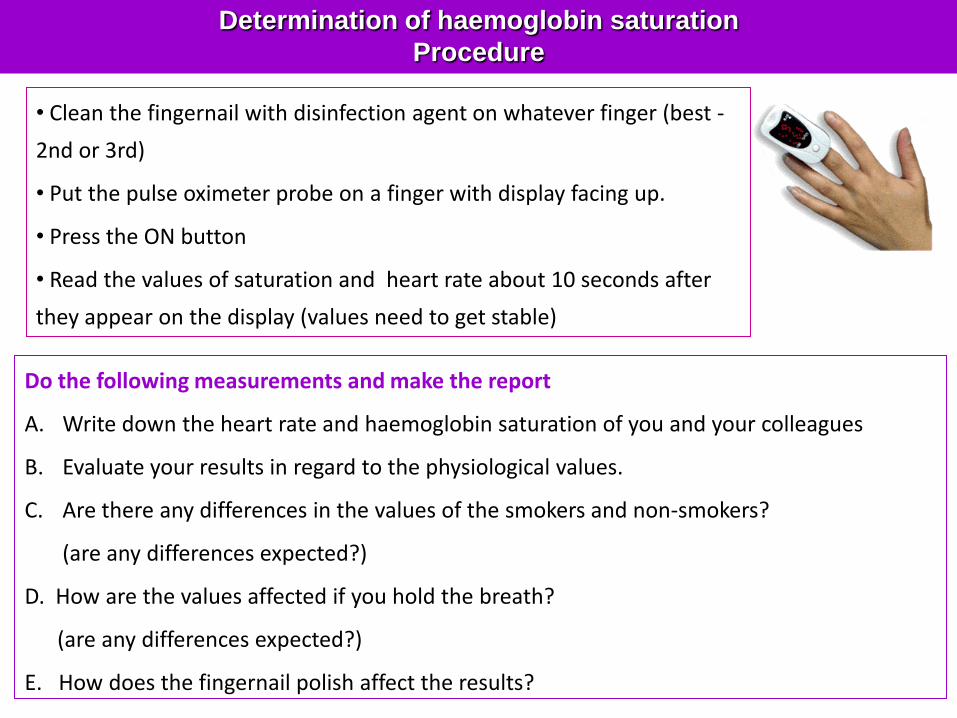
• Clean the fingernail with disinfection agent on whatever finger (best -
2nd or 3rd)
• Put the pulse oximeter probe on a finger with display facing up.
• Press the ON button
• Read the values of saturation and heart rate about 10 seconds after
they appear on the display (values need to get stable)
Do the following measurements and make the report
A. Write down the heart rate and haemoglobin saturation of you and your colleagues
B. Evaluate your results in regard to the physiological values.
C. Are there any differences in the values of the smokers and non-smokers?
(are any differences expected?)
D. How are the values affected if you hold the breath?
(are any differences expected?)
E. How does the fingernail polish affect the results?
Determination of haemoglobin saturation
Procedure
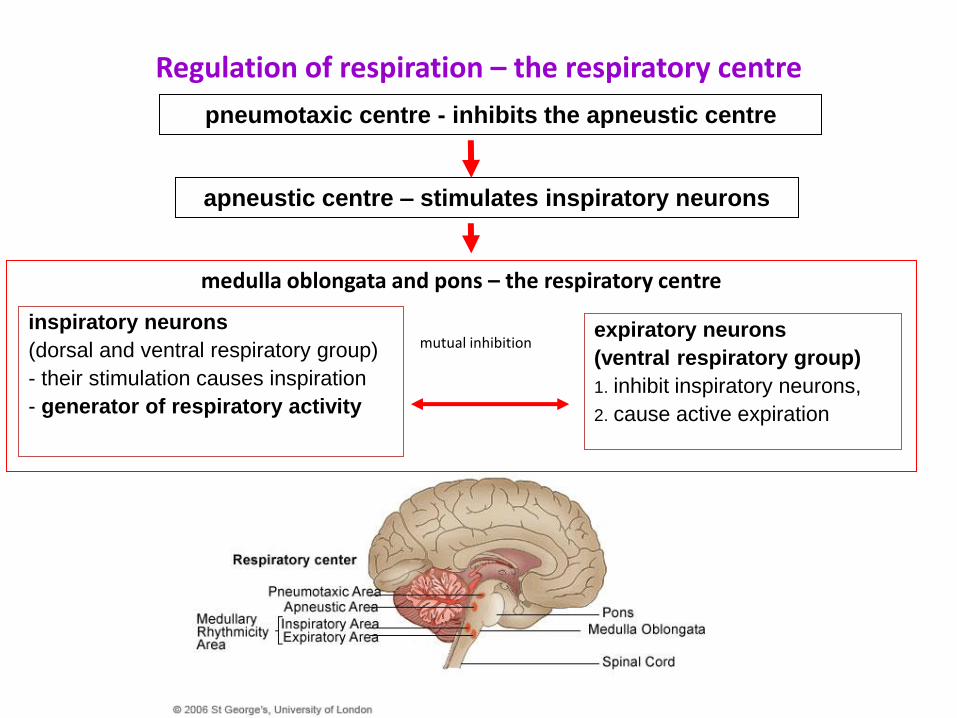
Regulation of respiration – the respiratory centre
medulla oblongata and pons – the respiratory centre
mutual inhibition
expiratory neurons
(ventral respiratory group)
1. inhibit inspiratory neurons,
2. cause active expiration
inspiratory neurons
(dorsal and ventral respiratory group)
- their stimulation causes inspiration
- generator of respiratory activity
pneumotaxic centre - inhibits the apneustic centre
apneustic centre – stimulates inspiratory neurons
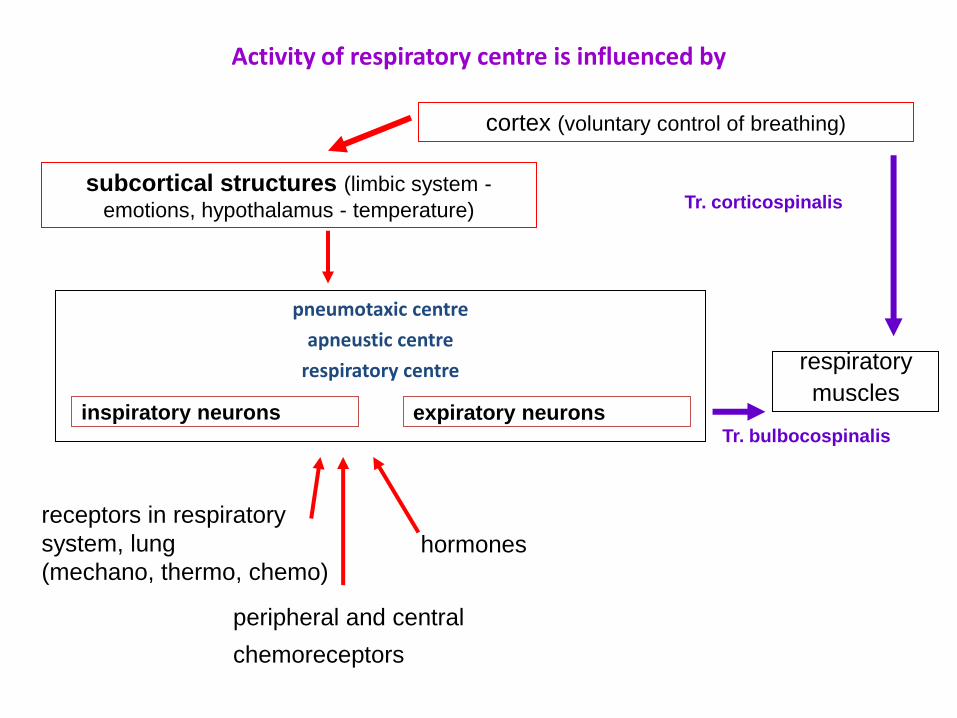
Activity of respiratory centre is influenced by
pneumotaxic centre
apneustic centre
respiratory centre
expiratory neurons inspiratory neurons
cortex (voluntary control of breathing)
subcortical structures (limbic system -
emotions, hypothalamus - temperature)
receptors in respiratory
system, lung
(mechano, thermo, chemo)
peripheral and central
chemoreceptors
hormones
respiratory
muscles
Tr. corticospinalis
Tr. bulbocospinalis
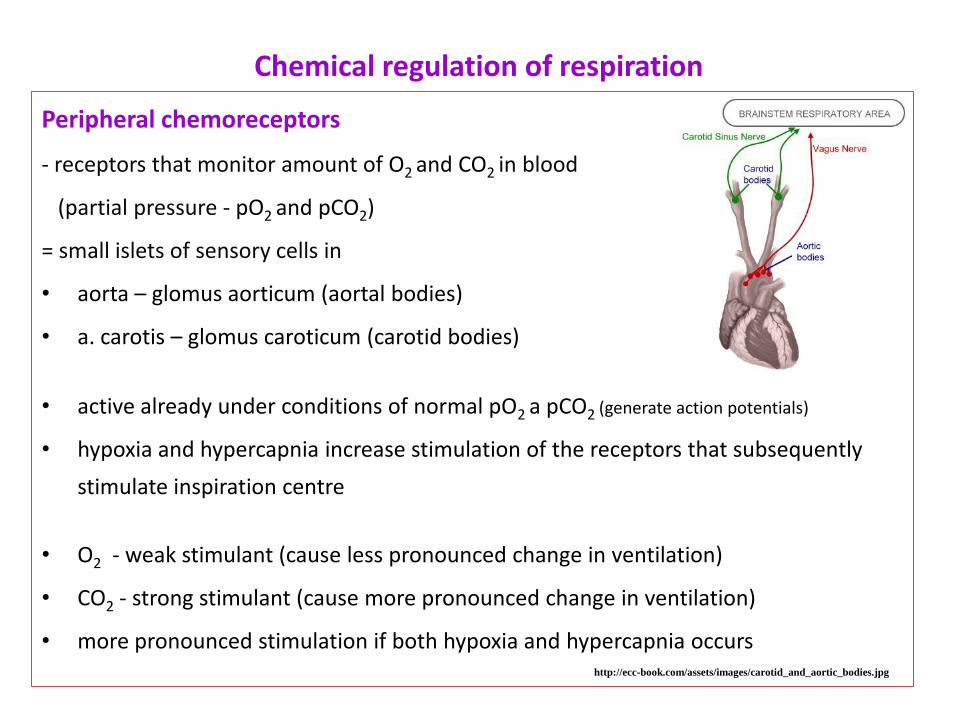
Chemical regulation of respiration
Peripheral chemoreceptors
- receptors that monitor amount of O2 and CO2 in blood
(partial pressure - pO2 and pCO2)
= small islets of sensory cells in
• aorta – glomus aorticum (aortal bodies)
• a. carotis – glomus caroticum (carotid bodies)
• active already under conditions of normal pO2 a pCO2 (generate action potentials)
• hypoxia and hypercapnia increase stimulation of the receptors that subsequently
stimulate inspiration centre
• O2 - weak stimulant (cause less pronounced change in ventilation)
• CO2 - strong stimulant (cause more pronounced change in ventilation)
• more pronounced stimulation if both hypoxia and hypercapnia occurs http://ecc-book.com/assets/images/carotid_and_aortic_bodies.jpg
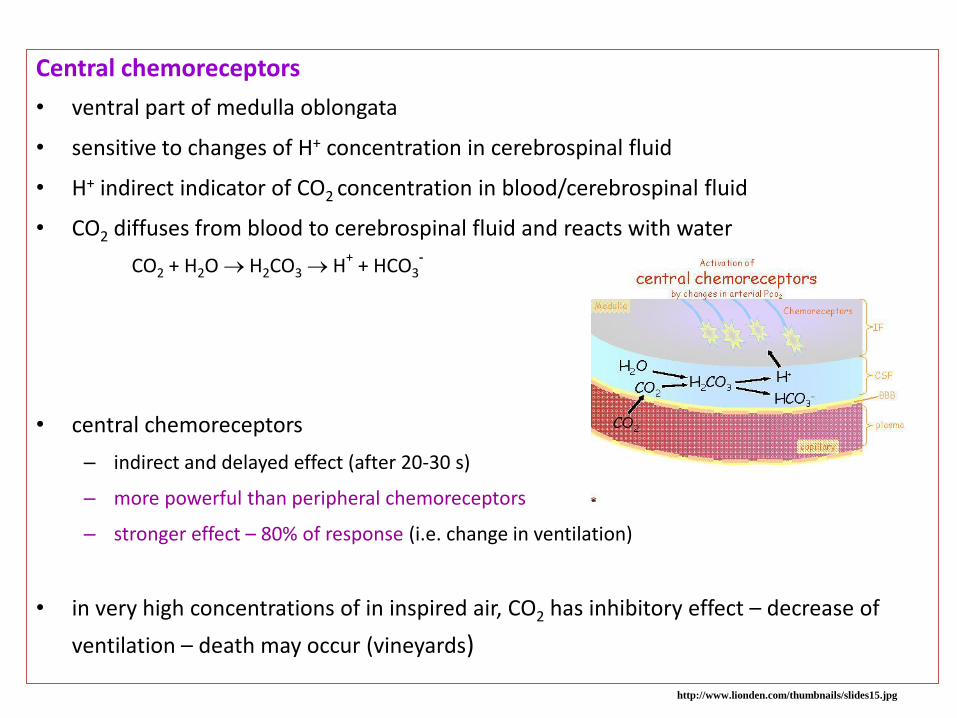
Central chemoreceptors
• ventral part of medulla oblongata
• sensitive to changes of H+ concentration in cerebrospinal fluid
• H+ indirect indicator of CO2 concentration in blood/cerebrospinal fluid
• CO2 diffuses from blood to cerebrospinal fluid and reacts with water
CO2 + H2O H2CO3 H+ + HCO3
-
• central chemoreceptors
– indirect and delayed effect (after 20-30 s)
– more powerful than peripheral chemoreceptors
– stronger effect – 80% of response (i.e. change in ventilation)
• in very high concentrations of in inspired air, CO2 has inhibitory effect – decrease of
ventilation – death may occur (vineyards)
http://www.lionden.com/thumbnails/slides15.jpg
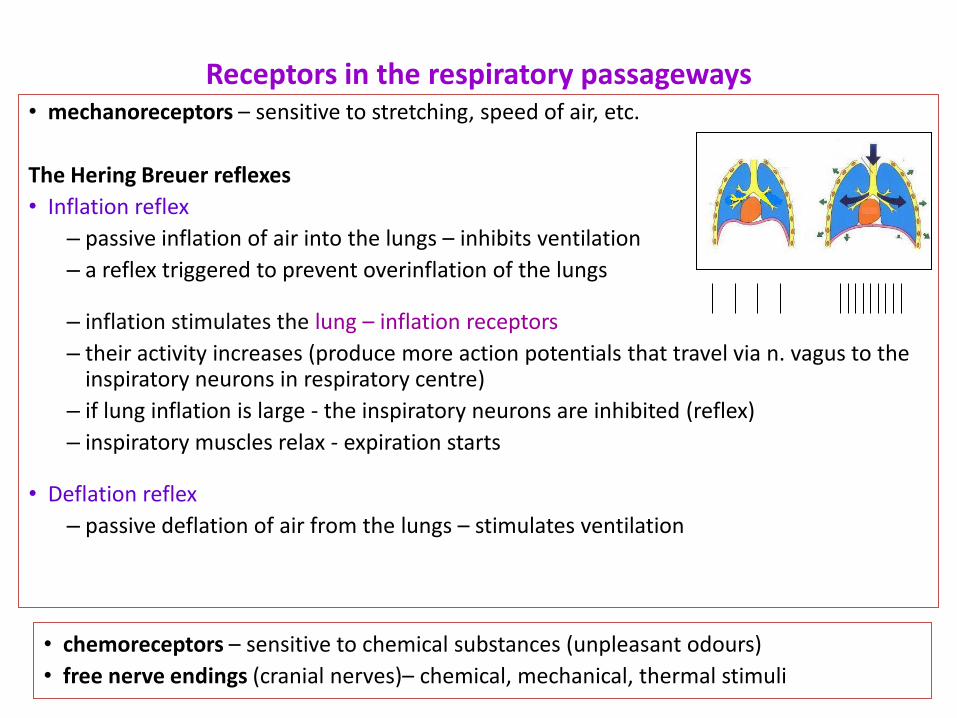
Receptors in the respiratory passageways • mechanoreceptors – sensitive to stretching, speed of air, etc.
The Hering Breuer reflexes
• Inflation reflex
– passive inflation of air into the lungs – inhibits ventilation
– a reflex triggered to prevent overinflation of the lungs
– inflation stimulates the lung – inflation receptors
– their activity increases (produce more action potentials that travel via n. vagus to the inspiratory neurons in respiratory centre)
– if lung inflation is large - the inspiratory neurons are inhibited (reflex)
– inspiratory muscles relax - expiration starts
• Deflation reflex
– passive deflation of air from the lungs – stimulates ventilation
• chemoreceptors – sensitive to chemical substances (unpleasant odours)
• free nerve endings (cranial nerves)– chemical, mechanical, thermal stimuli
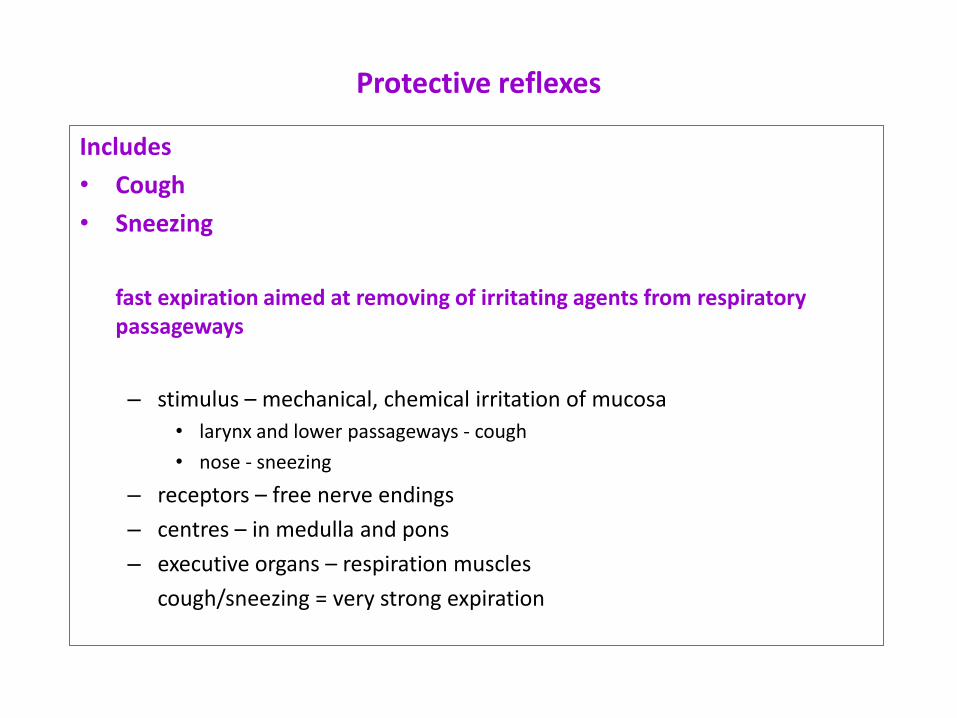
Protective reflexes
Includes
• Cough
• Sneezing
fast expiration aimed at removing of irritating agents from respiratory passageways
– stimulus – mechanical, chemical irritation of mucosa
• larynx and lower passageways - cough
• nose - sneezing
– receptors – free nerve endings
– centres – in medulla and pons
– executive organs – respiration muscles
cough/sneezing = very strong expiration
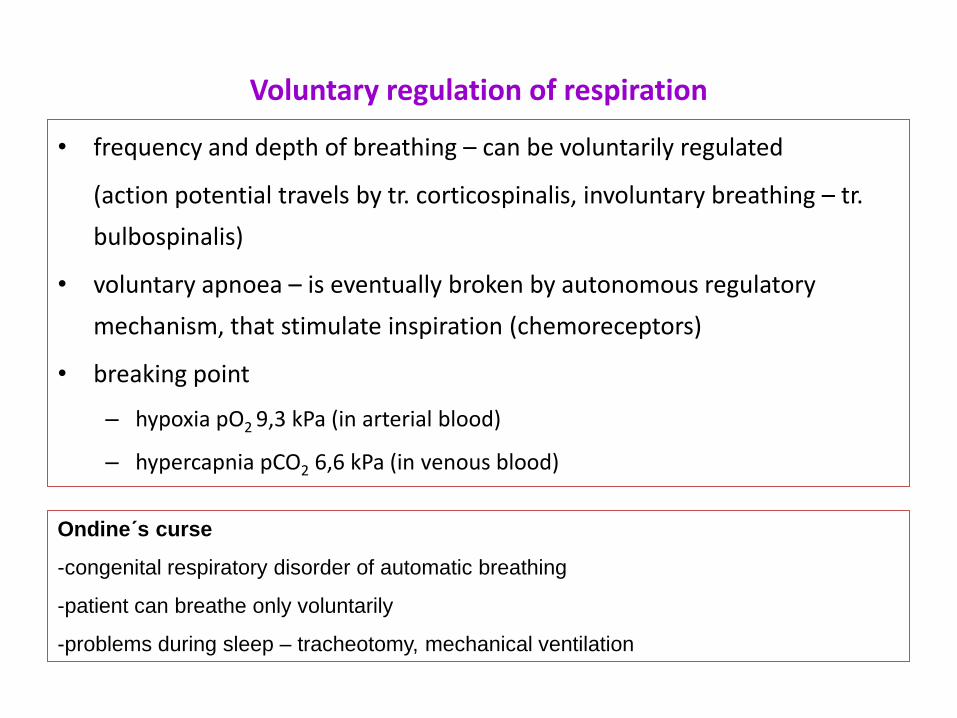
Voluntary regulation of respiration
• frequency and depth of breathing – can be voluntarily regulated
(action potential travels by tr. corticospinalis, involuntary breathing – tr.
bulbospinalis)
• voluntary apnoea – is eventually broken by autonomous regulatory
mechanism, that stimulate inspiration (chemoreceptors)
• breaking point
– hypoxia pO2 9,3 kPa (in arterial blood)
– hypercapnia pCO2 6,6 kPa (in venous blood)
Ondine´s curse
-congenital respiratory disorder of automatic breathing
-patient can breathe only voluntarily
-problems during sleep – tracheotomy, mechanical ventilation
Task: The influence of increasing CO2 concentration and decreasing O2 concentration on respiration
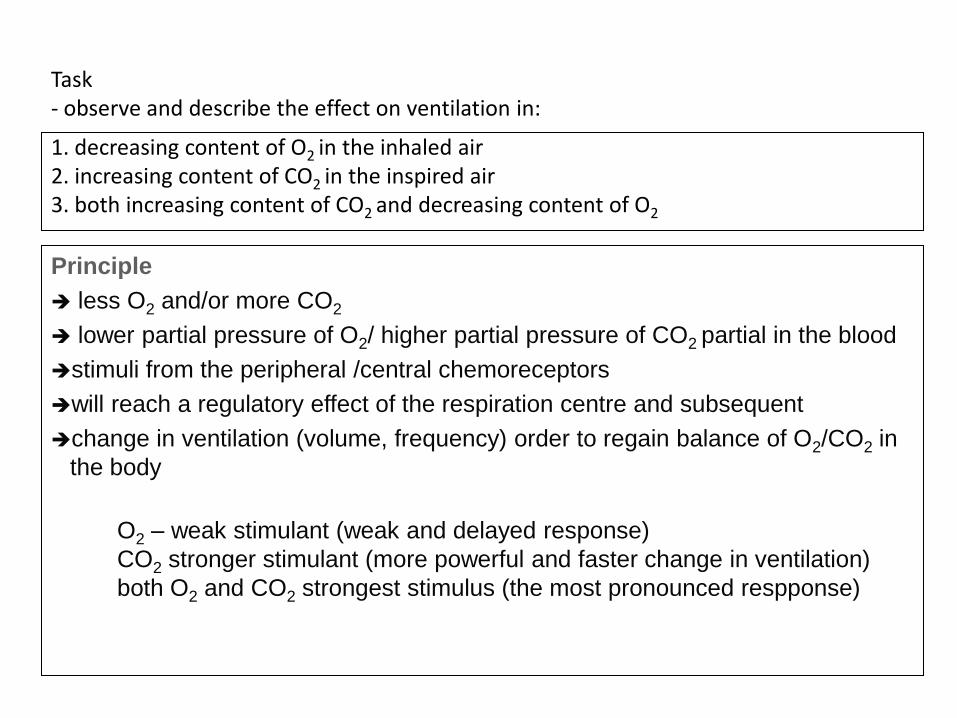
Task - observe and describe the effect on ventilation in:
1. decreasing content of O2 in the inhaled air 2. increasing content of CO2 in the inspired air 3. both increasing content of CO2 and decreasing content of O2
Principle
less O2 and/or more CO2
lower partial pressure of O2/ higher partial pressure of CO2 partial in the blood
stimuli from the peripheral /central chemoreceptors
will reach a regulatory effect of the respiration centre and subsequent
change in ventilation (volume, frequency) order to regain balance of O2/CO2 in
the body
O2 – weak stimulant (weak and delayed response)
CO2 stronger stimulant (more powerful and faster change in ventilation)
both O2 and CO2 strongest stimulus (the most pronounced respponse)
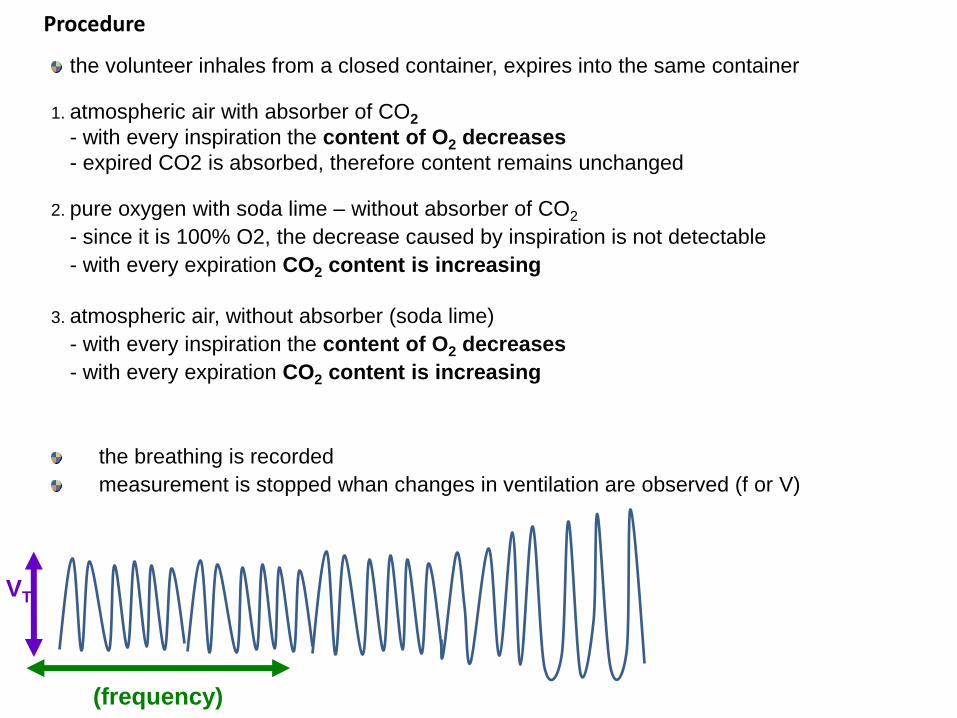
Procedure
the volunteer inhales from a closed container, expires into the same container
1. atmospheric air with absorber of CO2
- with every inspiration the content of O2 decreases
- expired CO2 is absorbed, therefore content remains unchanged
2. pure oxygen with soda lime – without absorber of CO2
- since it is 100% O2, the decrease caused by inspiration is not detectable
- with every expiration CO2 content is increasing
3. atmospheric air, without absorber (soda lime)
- with every inspiration the content of O2 decreases
- with every expiration CO2 content is increasing
the breathing is recorded
measurement is stopped whan changes in ventilation are observed (f or V)
VT
(frequency)
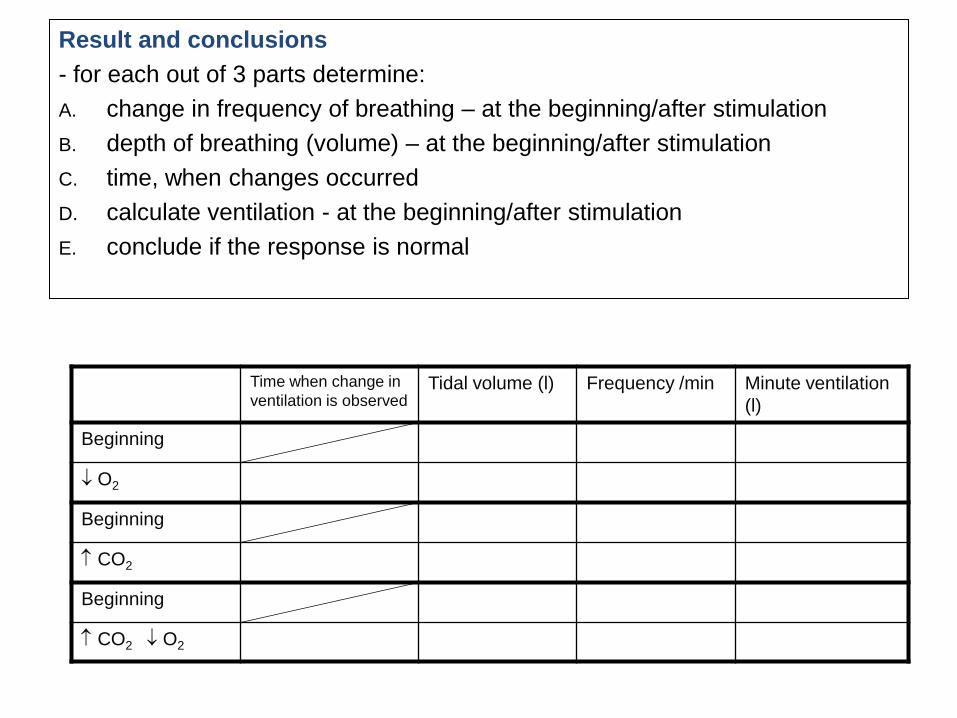
Result and conclusions
- for each out of 3 parts determine:
A. change in frequency of breathing – at the beginning/after stimulation
B. depth of breathing (volume) – at the beginning/after stimulation
C. time, when changes occurred
D. calculate ventilation - at the beginning/after stimulation
E. conclude if the response is normal
Time when change in
ventilation is observed Tidal volume (l) Frequency /min Minute ventilation
(l)
Beginning
O2
Beginning
CO2
Beginning
CO2 O2