Embed Size (px)
Citation preview

The revival of East Berlin’s land market after
the German reunification
Rainer Schulz and Martin Wersing∗
February 7, 2018
∗University of Aberdeen Business School, Edward Wright Building, Dunbar Street, Ab-
erdeen AB24 3QY, United Kingdom. Emails: [email protected] (corresponding author)
and [email protected]. We are grateful for comments and suggestions by two
anonymous referees, Paul Cheshire and Christian Hilber (the guest editors), Jens Kolbe,
Euan Phimister, and Verity Watson. We thank Michaela Beeck, Brit Boche, and Gabriele
Knopf from the Statistical Office Berlin-Brandenburg for their help with some of the data.
The usual disclaimer applies.
1

Abstract
The communist regime in the German Democratic Republic (GDR)
curtailed property rights in the urban land market through expropri-ation, forced administration, rationing, and restrained marketability.
After the fall of the Berlin Wall in 1989, well-defined property rightshad to be reestablished to restore competitive urban land markets un-der German laws. We examine the revival process from 1990-2008 for
East Berlin, the capital of the former GDR. West Berlin, which alwayshad a market-based land market, is used as comparator. We find that
the revival of the East Berlin land market and substantial investmentsupport resulted in a swift convergence in the composition of the hous-ing stock and in the pricing behavior in both parts of Berlin.
Keywords: property rights, urban land market, housing
JEL Classification: K25, P25, R31
2

1 Introduction
After forty years in existence, the communist East German Democratic Re-
public (GDR) acceded on 3 October 1990 to the market-based West German
Federal Republic of Germany (FRG). Most citizens of the GDR supported the
accession, because the communist regime had failed economically and politi-
cally, whereas the FRG had a strong record of economic success, high living
standards, and political stability (Frowein 1991). The German reunification
brought the East German economy instantly a legal system with enforceable
rules of contract. However, unambiguously assigned property rights were
missing in East Germany because these had been purposefully destroyed by
the communist regime. The assignment of such rights was essential for the
transition into a market-based economy.
In this paper, we analyse the transition of East Berlin’s land and housing
market from 1990 until 2008. For the analysis, we use transaction data and
information on the building stock. Data from West Berlin, which has al-
ways been part of the FRG, provides comparative evidence. We focus on
three aspects. First, we examine if and how the chosen privatization method
affected the speed of the transition process. Politicians decided that prop-
erty transferred into state control between 1945-1948 should be sold, whereas
property transferred during the GDR should be restituted in kind.1 The for-
mer related mainly to firms and agricultural land, whereas the latter related
to urban land and residential property. Economists objected to this decision,
because they anticipated that restitution would delay economic improvement
1The restitution provision was included in the unification treaty after the West German
government exerted “massive pressure” on the East German government (Brucker 1997,
p.127). For a categorization of privatization methods, see Roland (2000, Chapter 10).
3

in East Germany and could cause social frictions in Germany (Moschel 1992,
Sievert 1993, Sinn and Sinn 1993). Decisions on restitution claims take time
and assignment of ownership rights can be complicated, for instance because
roads or housing units were constructed on expropriated land. Restitution
claims can also jeopardize valuable investment projects, for instance when the
possessor of a plot cannot sell it to a housing developer due to an unsettled
claim (Sinn and Sinn 1993, p.112). It is also debatable whether restituted
owners or their heirs will make the best use of the property (Brucker 1997,
pp.84). Second, we examine the total effect of the generous accelerated depre-
ciation allowances, which complemented the privatization. The allowances
were intended to extend and improve the housing stock in East Germany.
The pre-war stock was mostly dilapidated and the stock constructed during
the GDR was often inappropriate and located in decentralized settlements
of tower blocks. In comparison with West Germany, only a small fraction of
single-family houses was constructed during the communist regime; condo-
miniums were nonexistent. The quality and composition of the stock needed
to be improved to ensure social cohesion and facilitate labor mobility within
the reunited Germany (Moschel 1992, p.492). Third, we analyze if by the end
of our sample – nearly 20 years after accession – the land market in Berlin
shows the relevant signs of an integrated market.
The results of our analysis are as follows. First, we find that the land mar-
ket in East Berlin becomes active quite quickly. In the first years after the
reunification, the transaction volume of land is above its long-run average
and then converges to the same ratio of volume to long-run average that we
observe for West Berlin. We take this as evidence that initially land in East
Berlin was not efficiently allocated and that the revived market corrected this.
We find that unusual legal characteristics, such as separate land and building
4

ownership and complex restitution cases, delayed land transactions. Initially,
single-family houses built during the communist regime had a low transaction
propensity, because restitution was not conducive for merging the separate
ownership of land and building. After a law introduced in 1994 provided clear
procedures to merge the separate titles, the transaction propensity increased.
This shows that restitution caused delays, as anticipated by economists. Sec-
ond, we find that the accelerated depreciation allowances had a positive effect
on housing construction. Soon after the reunification, housing construction
begins in segments that were previously under-represented or non-existent.
Persistently more single-family houses are constructed in East than in West
Berlin. Multi-family buildings are converted into blocks of condominiums
and new condominium buildings are constructed. Third, by the end of 2008,
the Berlin housing market shows many signs of full integration. The housing
stock has similar features in East and West Berlin. The growth of land and
house prices has converged and the spatial distribution of land prices shows
a smooth transition at the former border between East and West Berlin.
Characteristics of single-family buildings are valued identically in East and
West Berlin. Single-family houses in West Berlin are still more expensive on
average, but this is due to nicer locations.
The rest of the paper is organized as follows. Section 2 discusses housing
provision during the communist regime in East Germany. Section 3 discusses
the problems that existed after the reunification for a revival of a market-
based land and housing market. It also discusses the main measures that were
chosen by policy makers to deal with these problems. Section 4 examines
empirically the revival of the land and housing market in East Berlin after
the reunification. Section 5 concludes. The appendix provides details on the
data and the empirical methods used in the analysis.
5

2 Land and housing under communism
During its reign, the communist regime of the GDR aimed to bring as much
property as possible under state control. While individuals could own prop-
erty for personal use, such as a car or a single-family building, ownership of
property as means of production of goods and services was all but impossible.
To achieve this aim, the regime used expropriation, confiscation, and state
administration. Procedural law was absent in the GDR and property owners
could not contest decisions of state organs (Gesamtdeutsches Institut 1971,
1984).
Expropriation provisions are common in market-based countries and are used
to assemble property for public projects, such as new roads and transport net-
works. However, the communist regime often implemented these provisions
in a discriminatory way. For instance, West Germans received smaller finan-
cial compensation than GDR citizens for expropriated property in the GDR.
The regime used provisions when no link to a public projects was given, solely
to bring property under state control. Property of specific groups was con-
fiscated, in particular the property of war criminals and perceived enemies of
the socialist society. GDR citizens who fled the country had their property
either confiscated and transferred into state ownership or placed under state
administration. Property of foreigners was also placed under state adminis-
tration. West Germans had the option to mandate a private administrator.
Nevertheless, owners had no control rights over their property in the GDR
once it was placed under administration.
The regime charged administrative fees for property of citizens who fled the
GDR. These fees were punitively high, so that financial obligations soon
exceeded the intentionally low assessed property values. In the liquidation
6
process, the state could exploit its preemptive purchase right and acquire
the property. The hostile treatment of small private enterprizes—the only
form of private business allowed—resulted in the same outcome for many
rental businesses. Rents were frozen at 1944 levels, tenants were allocated
by state administrators, and rental income was taxed at a rate higher than
employment income. Private landlords could be forced to take on loans on
financially unfavorable terms. Landlords often forfeited their property to
avoid liquidation. The regime also used extortion and coercion to acquire
property, often for the personal benefit of regime officials. Permissions to
leave the GDR were given to owners of single-family houses only after they
forfeited the property, which was then placed under state administration and
consigned to a state functionary. While formally illegal under GDR laws,
such practices were executed frequently.
In the early years of the GDR, the transfer of private into state property
had some legal pretense. In later years, this became less important. The
regime and its officials treated most property as if it belonged to the state.
For instance, single-family houses and land were allocated without regard for
actual ownership. Confiscation and expropriation—even if executed following
GDR legal procedures—and change of property ownership due to inheritance
were seldom recorded (Vossius 1995, pp.4). Land registers were neglected,
lost, or allowed to rot, see Horn (1994, p.224) and Sinn and Sinn (1993,
p.115).
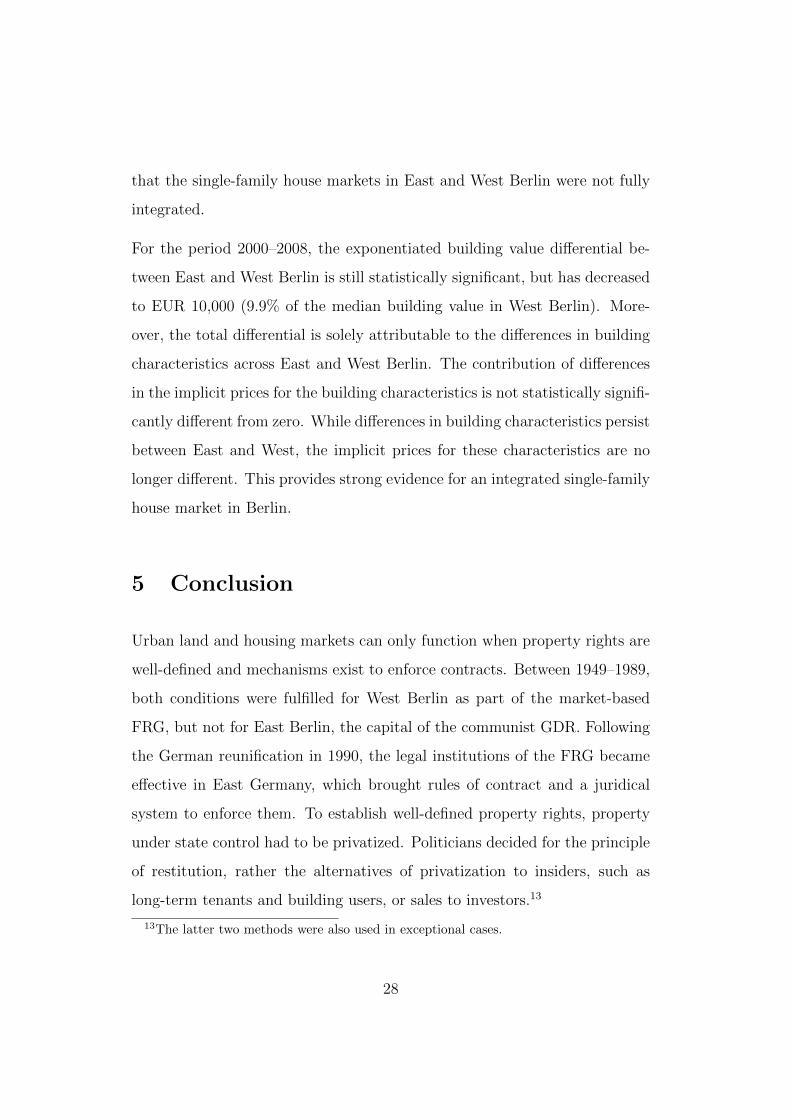
The impact of the communist regime on the ownership structure of the hous-
ing stock is visible from Table 1. It contains in Panel A data for East Berlin in
1990, one year after the end of the GDR.2 Compared with the data in Panel
2The 1995 building census for East Berlin retrospectively surveyed some few variables
for 1990, amongst these was building ownership.
7

B for the market-based West Berlin in 1987, ownership by natural persons is
much lower in East Berlin, in particular in the multi-family sector. Whereas
53.4% of multi-family buildings in West Berlin are owned by natural per-
sons, which includes ownership by condominium associations, only 9.9% are
in East Berlin. The multi-family sector in East Berlin in 1990 is dominated
by housing associations in state ownership, properties under state adminis-
tration, and building cooperatives which could not choose members freely.
This shows that the regime was effective in dismantling the private rental
sector. In the single-family house sector, the difference is less pronounced,
with 92.2% private owners in West and 80.2% in East Berlin. This provides
evidence that the communist regime respected building ownership for per-
sonal use to some degree, although the 12.2% of single-family houses under
state administration shows that this right could be taken away.3 Property
rights of owner-occupiers were also curtailed in other respects. For instance,
a sale was possible in principle, but required permission from state officials
and could be conducted only at administered prices.
[Table 1 about here.]
The communist regime decided which existing buildings were worth maintain-
ing, what new housing to build, and where to build it. The regime had no
interest in maintaining the pre-1945 housing stock, in particular the work-
ing class districts in inner cities. Accordingly, the historical housing stock
in city centers dilapidated over time. New housing construction focussed
on large mass-produced tower blocks. This exploited economies of scale of
standardization and prefabricated parts. Settlements of homogeneous blocks
3Some of the privately owned single-family houses could be rented out, but we presume
that all are inhabited by their owners.
8

were concentrated in the outskirts of cities. The dwellings in these blocks
were small and of poor quality (Haußermann and Kapphan 2002, Strubelt
1996). GDR citizens could construct single-family houses for their own use
on land assigned by the state, but completing such a project required a lot
of personal initiative.4 The would-be building owner had to have access to
goods that could be bartered for material and manual help. The necessary
material was often unavailable and substitution with lower quality material
was common.
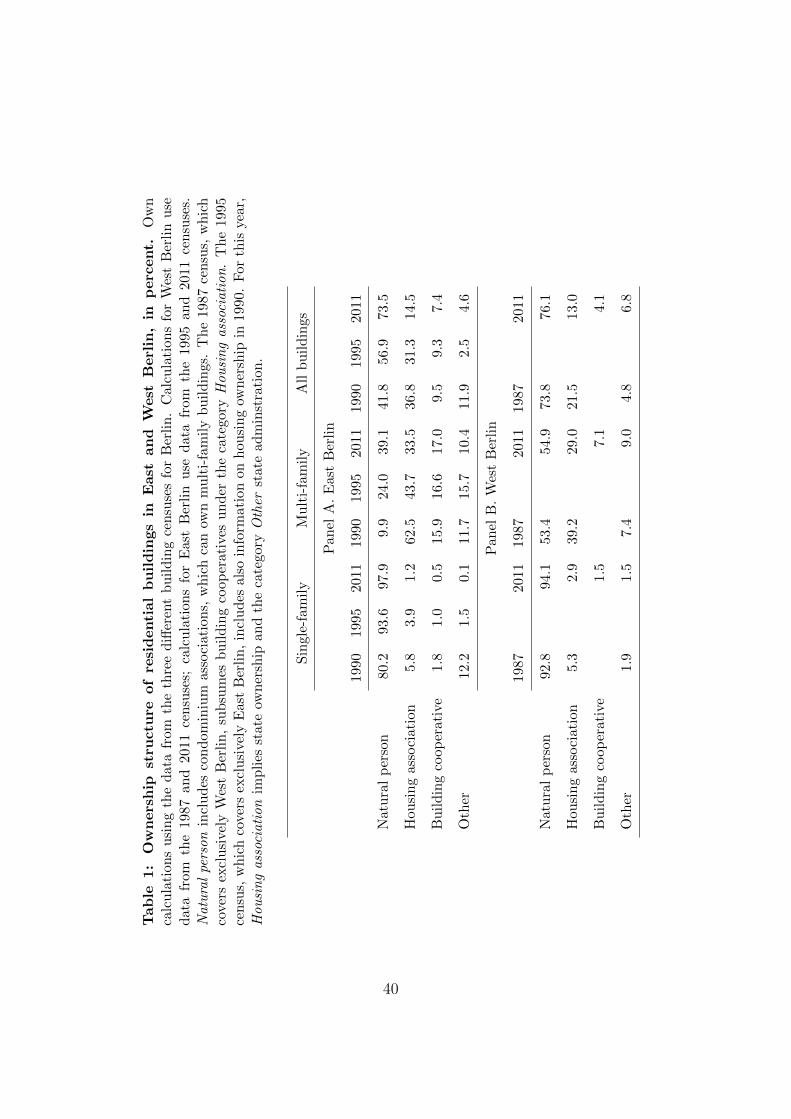
The impact of the communist regime can be seen when we contrast the build-
ing and dwelling stock in East and West Berlin around the time of the reuni-
fication. Table 2 shows that buildings constructed before 1949 dominate the
stock in East Berlin (1995), whereas most buildings in West Berlin (1987)
are constructed after 1948.5 The stock in East Berlin contains also fewer
single-family houses. Nearly 80% of the multi-family buildings in East Berlin
are damaged because of a lack of maintenance, half of them so severely that
the functional safety is affected and fundamental repairs are required. Single-
family buildings are in slightly better condition, but are also damaged because
of the lack of maintenance and inappropriate building materials.
[Table 2 about here.]
Table 3 shows that the vintage distribution of dwellings in East and West
Berlin is similar around the time of the reunification. In both parts of the
4Legally, only the building could be owned, whereas land was assigned by the state and
remained in state ownership.5The first building census for East Berlin was conducted in 1995; none was conducted for
West Berlin. We use the 1987 census for West Berlin, which is closest to the reunification.
This introduces a positive bias in favor of East Berlin and the true, but unobserved,
differences are even more pronounced than discussed here.
9

city, the majority of dwellings were constructed during the German division
(1949–1990). As we observed above, only a few buildings were constructed
during 1949–1990 in East Berlin, so that most of the dwellings are in mass-
produced large tower blocks which can have hundreds of units. Nearly 40%
of all dwellings in East Berlin are in buildings in need of fundamental repairs,
many of which are from the neglected pre-1949 stock.
[Table 3 about here.]
3 Restitution and revival measures
Given the unambiguous property rights and the poor condition of the housing
stock at the end of the GDR, privatization and investment incentives were es-
sential for any future economic improvement. The question of property rights
was an integral part of the accession proceedings in 1990 (Heslop and Roberto
1993, III). It was decided and announced through the Joint Declaration from
15 June 1990 that formerly private property that was state-controlled in East
Germany should be restituted in principle, and, where this was not possible,
that expropriated former owners should be compensated financially or in-kind
(the latter happened only occasionally). Compensation applied whenever the
property was no longer available, because streets or multi-family housing were
built on a—possibly cleared—plot. In the case of single-family houses, resti-
tution was impossible if those in possession had obtained the property in good
faith and followed the legal procedures of the GDR. Regime officials who ob-
tained houses through coercion and deception could not retain them. Many
members of the East German political and cultural elite were affected and
lost possession of the buildings they occupied during the communist regime
10

(Glock et al. 2001). Housing associations were transferred into municipal
ownership and building cooperations transferred into the ownership of their
members. Many of these housing providers encountered immediate financial
difficulties. These occured because the providers had liabilities which were
converted into Deutsche Mark, but were still bound by previously controlled
rents. This made it difficult to finance the repairs that dilapidated buildings
needed.
All restitution claims had to be filed by the end of 1992. Once filed, the pos-
sessor of the contested property could take no actions, such as selling, signing
new rental contracts or conducting repairs, until a decision on the claim was
rendered (Stack 1997, p.1224). Decisions on claims were complicated, because
entries in land registers could be missing or incomplete. Ownership histories
could be fragmentary, way-leaves unclear, and information on a property’s
borders unknown. It was labor-intensive to complete the entries and this re-
lied on documents pre-dating the GDR, such as archived land registers, past
sales contracts, and old mortgage agreements. The incomplete documenta-
tion invited rent seekers to try their luck, even if their restitution claims were
weak or unjustified. Consequently, it took months and often years to decide
a restitution claim.
To ensure that only property with unambiguous rights comes to the market,
the amended Land Transaction Act (Grundstucksverkehrsverordnung) stip-
ulated that a property in East Germany needs a permission to be traded
for the first time after the reunification. The permission is granted by the
local land registry for properties with fully rectified entries and only if no
undecided restitution claim is pending. Permissions can be obtained quickly
for properties in successive private ownership by a family since before 1933.6
6At the end of the GDR, 60.7% of all plots were still legally in private ownership
11

Figure 1 shows the ratio of settled claims to all restitution claims for land
and buildings in East Berlin. At the end of 1993, one year after the deadline
for claims, 32.5% of claims had been settled by either restitution, financial
compensation, release from state administration, or through the refusal of
the claim. In 2000, about 95% of claims had been settled.
[Figure 1 about here.]
The economic recovery would have been slower if it had relied only on resti-
tution. This became clear soon after the reunification and policy makers
weakened the restitution principle by introducing the Investment Law in
1990, the Impediments Removal Law in 1991, and the Investment Priority
Law in 1992. It became possible that those in possession could modify a
property or that a property could be sold to an investor despite a pending
restitution claim (Stack 1997, pp.1224). This required that the possessor
or investor committed to investments which created jobs or improved the
housing provision (Heslop and Roberto 1993, pp.260).
Single-family buildings constructed during the GDR on land assigned by the
state initially remained legally separate. This was in conflict with German
law, under which separate ownership of building and land is impossible. A
grace period was agreed in the Joint declaration, so that building owners
could retain the right of land use. But it was also announced that a future
law would be enacted to regulate how the separate ownership rights should
be merged. The legal uncertainty, however, made waiting a reasonable ac-
(German Federal Ministry of Finance, Dok: 2006/0066554, August 14, 2006). We have
no detailed information on the specific situation in East Berlin. As not all property will
have been traded for the first time since the reunification, the Land Transaction Act is
still effective at the time of writing.
12

tion. On 21 September 1994, the Property Adjustment Law (Sachenrechts-
bereinigungsgesetz) was enacted to facilitate the merger of building and land
ownership. The law presented building owners with the option to buy the
land from the owner at half the assessed market value or to request a ground
lease at similarly favorable terms (Vossius 1995).
The Assisted Area Law (Fordergebietsgesetz) was implemented in 1991 to
encourage investment. This allowed generous accelerated depreciation op-
portunities for investments in East Germany and West Berlin. The law has
been amended many times since. The intention of the law was to encourage
the construction of new buildings. Later amendments favored investments
that maintained the old building stock, and phased out incentives to invest
in West Berlin (Toben 1996). The Liability Support Law (Altschuldenhil-
fegesetz) from 1993 reduced the cost of the liabilities of housing associations
and building cooperatives under the condition that these organizations sell
units in their multi-family building as condominiums, preferably to current
tenants.
4 Revival of East Berlin’s land market
We use transaction data of undeveloped land and of single-family houses to
analyse the revival of the market in East Berlin after the reunification. We
complement the transaction data with information on construction activity
and other information on the Berlin economy. Appendix A.1 gives a detailed
account of the different data sources.
13

4.1 Land market
We look at the revival of the land market in East Berlin. First, we examine the
volume of land transactions and the speed at which individual plots entered
the market for the first time following the reunification. Second, we analyse
the effect of the revived market activity on land prices in Berlin to examine
if the market is integrated.
4.1.1 Land transactions
Figure 2 shows the volume of land (in sqm) transacted in West and East
Berlin relative to its respective long-run average (left scale).7 In West Berlin,
the ratio remains fairly stable after the reunification, albeit it settles at a
slightly lower level than before the reunification. In East Berlin, the land
market did not exist before the accession, but becomes active soon after.
The relative transaction volume is particularly high during 1992–1996, which
is the period during which the majority of restitution claims were decided,
see Figure 1. The excess activity indicates that restituted properties were
sold and not used by the former owners.8 Economists objected to restitution
because it does not necessarily lead to an efficient initial allocation of property
rights. Our results support this objection. Once this initial mismatch is
corrected, the ratios for East and West Berlin behave very similarly.
[Figure 2 about here.]
7We do not observe the stock of developable land and take the long-run average as a
proxy. Appendix A.2 gives details on the transaction data.8Glock et al. (2001, pp.541) provide direct evidence and report for an area in Prenzlauer
Berg, a district of East Berlin, that 58% of properties restituted between 1991–1998 were
sold on to third parties. In Kleinmachnow, a town close to Berlin, about 95% of restituted
single-family houses were sold.
14

We examine the factors which influence the speed at which plots of land in
East Berlin are transacted for the first time after the reunification. To do so,
we fit the regression
ln ti = α + xiβ + diγ + εi (1)
where ti is the number of days it takes from 3 October 1990 until plot i is
transacted. The row vector xi contains different sets of variables that could
affect how quickly plot i is sold. The variables are binary indicators that
take the value one if the characteristic is present and zero otherwise. The
first set of variables describes legal characteristics of the transaction. As-
sembly indicates if the transaction joins two adjacent plots under legal joint
ownership. Inheritance indicates if the transaction was part of an inheritance
dispute. Contractual indicates if the transaction came with further contrac-
tual arrangements, such as investment commitments from the buyer. Merge
indicates if the transaction unites building and plot ownership legally. The
second set of variables controls for characteristics of the plot. Back indicates
a plot that is located off the street and that access might be only possible
through right of way over the—separate—front plot. Contamination indi-
cates if a plot is contaminated or if contamination is likely. Heritage site
indicates if the plot is a designated heritage site. Commercial use indicates
if the plot is located in an area zoned for commercial and mixed residential-
commercial use. Waterfront indicates if the plot has direct access to a lake
or river. The third set of variables control for the combination of sectors
(private and public) the seller and the buyer belong to. We also include a
full set of district dummies to control for local differences.
For the regression sample, we identify transacted plots on the basis of the
street address and for each plot we select the first transaction. We have
to ensure that we do not select follow-on transactions such as plots that
15

were subdivided or assembled after the first transaction. In many cases we
identify subdivisions and assemblies on the basis of the street address. In
some cases a subdivision or assembly could have been accompanied by an
address change. We would then, unknowingly, select repeated transactions
for the sample. This problem becomes more prevalent the longer our sample
period. We thus restrict our analysis to the period from 3 October 1990
and 31 December 1999, during which nearly 95% of all restitution claims for
property in East Berlin were decided.
Table 4 presents the estimated coefficients for Eq. 1, which are all statistically
significant at the usual levels.9
[Table 4 about here.]
The effects of a plot’s legal characteristics on the time taken until it is trans-
acted for the first time are as follows. Plots involved in land assembly take
on average 22.6% (exp{0.204} − 1) longer to be transacted than the average
plot. Complicated restitution should not be the reason for this delay and
we attribute it to the hold-out problem, in which the owner of the plot that
should be assembled exerts market power over the interested buyer. Even if
strategic hold-out were not relevant, land assembly in itself would be more
time consuming in a market that is just reviving. Plots sold in connection
with inheritance proceedings take on average 10.6% less time until the first
transaction. There are two complementary explanations. First, such plots
could have stayed in family ownership during the GDR and have unambigu-
ous property rights. Restitution, if required, and a permission to trade would
9We estimated also a proportional hazard model and used a truncated maximum like-
lihood estimator, which corrects for the potential right-truncation of the sample. The
qualitative results remain the same to those reported here.
16

be easy to obtain. Second, heirs might agree to trade quickly, because they
want to monetize the windfall profit from a property to which they have no
emotional connection. This should reduce the transaction time even further.
If a plot comes with special contractual arrangements, the expected time
until the first transaction is 4.3% longer than average. Contractual arrange-
ments relate in particular to investment commitments, which can override
the restitution principle, see Section 3. Investors will use such arrangements
when restitution claims are complex, therefore the estimated effect will un-
derstate the joint true cost of poorly assigned property rights and restitution.
Transactions that merge legally building and land delay the expected time
until the first sale of the plot by 30.9%. Restitution of such plots should
not be more complicated than for other plots, but before 1995, building and
land could only be merged by private agreements between building and land
owners. Such private agreements were presumably difficult to achieve.
Regarding the control variables, we find a delay for back plots. Such plots
will only become attractive once the legal situation of the front plot is estab-
lished and the rights of way recorded in the land register. This takes more
time than establishing the property rights of the back plot itself, extending
the expected time until the first transaction by 20.8%. If the plot is contam-
inated, all else equal, potential buyers will require detailed inspections and
cost assessments, which increase the expected time until the first transaction
by 38.8%. The development of plots that are designated as heritage assets
are more time consuming and costly. This increases the expected time until
the first transaction by 40.5%. If the plot is located in an area that is zoned
for commercial use, the expected time until the first transaction decreases by
65.4%. These are mainly attractive inner-city plots in very good locations. If
a plot is located on a waterfront, the expected time until the first transaction
17

increases by 11.4%. While these plots offer access to an attractive amenity,
most of them are in less central locations. The last set of coefficients in Table
4 relates to seller and buyer combinations. The excluded category are sales in
which both seller and buyer are from the private sector. This is the dominant
category accounting for 90.9% of first-time land transactions. The coefficients
show that the expected time until the first transaction is delayed once the
public sector is involved. A plausible explanation is that the public sector
was tasked after the reunification to ensure that the land market revives,
whereas active intervention in the market was postponed to later years.
Table 4 provides evidence on the combined effect of ambiguous property rights
inherited from the GDR and the privatization method chosen for the land
market. Transaction delays are related to how property rights and properties
were mistreated in the GDR. Contamination and the unclear legal situation
of land and separate building ownership led to sizable delays. The effect
of investment commitments also indicates that transactions were delayed by
restitution.
4.1.2 Land prices
Figure 3 shows in its top-left panel box plots of the real land price (per
sqm) for each year in 1980–2008. In all years in which land prices for Berlin
are observed, the median price is higher in West than in East Berlin. This
difference in levels is reasonable given the many attractive neighborhoods in
West Berlin.
[Figure 3 about here.]
To examine the price growth once amenity differences are accounted for,
we compute quality-controlled land price indices, for details see Appendix
18
A.3. Figure 2 shows the growth rates for these indices (right axis). In the
years immediately after the reunification, land prices show a strong growth
in East Berlin, but growth soon converges to the rate in West Berlin. The
convergence is a sign of an integrated land market, where land prices react
similarly to systematic factors, such as shocks to the local economy.
We estimate land price gradients for East and West Berlin to examine if land
prices show signs of integration at the spatial level. We do this for two time
periods: 1991–1999 and 2000–2008.10 Figure 3 shows the estimated gradients
along with point-wise confidence bands at the 95% significance level. We
choose Potsdamer Platz as the central business district (CBD). This square
was the heart of Berlin until the end of the Second World War, was cleared
during the Cold War and separated by the Wall, and became the central
building site after the reunification.
Land price gradients estimated with transactions from the 1991–1999 period
(top-right panel) and the 2000–2008 period (bottom-left panel) decrease with
the distance from the CBD in West and East Berlin. This is in accordance
with the predictions of the Alonso-Muth monocentric city model. The gradi-
ents estimated for the 1991–1999 period are steeper than those for the 2000–
2008 period. One possible explanation for this result is that prime inner-city
plots were transacted first and that plots transacted in the 2000–2008 period
were of lower quality. A second, complementary, explanation is that mar-
ket participants paid prices during 1991–1999 based on the expectation that
Berlin would become the economic powerhouse that it had been before the
Second World War.11 This did not happen. When taking the estimation un-
10Land price gradients are estimated with semiparametric regressions that control for
characteristics of the plot and the transaction, time effects and district fixed effects; Ap-
pendix A.4 provides details.11The expectations were fueled by the decision of the German Parliament in 1991 for
19

certainty into account, the land price levels at the CBD are not statistically
different in West and East Berlin in each of the two periods. Focussing on
the point estimates, this result is stronger for the second period (bottom-left
panel). Land close to the CBD is priced very similarly in East and West
Berlin, which is to be expected for an integrated land market, because plots
are close to the same amenities. Once we move away from the CBD—from
about 2.5km onwards—the land price gradient for West Berlin lies above the
gradient for East Berlin. The difference is statistically significant in most
cases and reflects the many attractive neighborhoods in West Berlin.
The bottom-right panel of Figure 3 shows the land gradient for West Berlin
estimated with transactions from 1980-1990. During this period, Potsdamer
Platz was an empty space close to the Berlin Wall and land prices close to it
were low. The effective CBD was around the Kurfurstendamm, where land
prices are highest. The reunification opened up Potsdamer Platz as the CBD
and the effect on land prices in West Berlin is visible in the bottom-left panel.
Taking the evidence together, at the end of the sample period, land prices in
East and West Berlin show behavior that is to be expected from an integrated
market.
4.2 Housing market
The communist regime in the GDR focused on housing provision in mass-
produced tower blocks that contained standardized apartments and ignored
the stock of pre-1949 buildings. The construction of single-family houses
was a challenging endeavor and land provided had unclear property rights;
Berlin becoming the capital of the reunited Germany and the hope that Berlin would host
the 2000 Olympic Games.
20

condominiums were nonexistent. The sale and purchase of existing single-
family houses was tightly regulated. This resulted in a building stock that
was ill-suited to the population’s needs in terms of composition, ownership
rights, and quality. Post-reunification, policy makers hoped that the market
would improve the housing provision quickly. Policy makers encouraged this
using tax and other incentives.
We examine the transition in the East Berlin housing market from three
angles. First, we analyse the construction activity and look at the effects this
had on the composition of the stock and the ownership structure. Second, we
analyse the transaction activity in the single-family house market after the
reunification and assess the effect of the Property Adjustment Law, which was
introduced in 1994 to merge building and land ownership. Third, we analyse
the behavior of house prices and examine whether implicit prices of building
characteristics converge between East and West Berlin.
4.2.1 Construction activity
After the reunification, market-based building construction started in East
Berlin. This activity was encouraged by tax incentives, see Section 3. Figure
4 shows in its left panel the number of dwellings constructed between 1991–
2008 in single-family (left axis) and multi-family buildings (right axis).
[Figure 4 about here.]
While the number of completed dwellings in single-family houses remained
fairly stable in West Berlin, many more dwellings were completed in East
Berlin. With exception of the period 1996–1998, completions of dwellings in
multi-family buildings followed a similar trend in East and West Berlin. The
21

difference in the number of completions between 1996 and 1998 is most likely
the result of accelerated depreciation allowances, which were extended for
East, but not West Berlin. In addition to the construction of new buildings,
amendments of the Assisted Area Law in 1993 encouraged the repair and
modernization of pre-1990 buildings. For some buildings, this was not eco-
nomically feasible, because the buildings were either damaged beyond repair
or dwellings were not in demand and vacant. The latter applied in particular
to dwellings in blocks constructed during the GDR. By 2007, blocks with a
total of 2,485 dwellings had been demolished in East Berlin (Bundesminis-
terium fur Verkehr, Bau und Stadtentwicklung 2007).
The implementation of German law in East Germany implied condominium
ownership in multi-family buildings became possible. The right panel of
Figure 4 shows the number of conversions of rental units (left axis) and the
number of condominiums in newly constructed buildings (right axis) between
1991–2008. Conversions of rental apartments into condominiums show a very
similar trend in East and West Berlin. In East Berlin, conversions began in
1993, but we see no further evidence that the Liability Support Law had—
compared with the trend in West Berlin—a strong effect.
Table 2 shows the effect of construction, demolition, and conversion on the
composition of the housing stock in East Berlin. In 2011, buildings are,
on average, younger in East than in West Berlin. The share of pre-1949
buildings is about the same, but buildings constructed since the reunification
contribute 32.6% to the stock in East and only 10.6% in West Berlin. Single-
family houses are the dominant building type in East Berlin in 2011, as it
is the case for West Berlin. With respect to dwellings, Table 3 shows that
more dwellings in East Berlin are in buildings constructed after 1995 than
in West Berlin, but that less dwellings are in buildings constructed before
22

1949. Despite these small differences, the vintage distribution of dwellings in
2011 is very similar in East and West Berlin. This implies that housing built
during the communist regime is still very important in 2011. 47.0% of all
dwellings in East Berlin in 2011 are in the large blocks and other buildings
constructed during the GDR.
Table 1 shows how building ownership has changed in East Berlin since 1990.
In 2011, single-family houses in East Berlin are owned nearly exclusively
by natural persons, which is identical to the situation in West Berlin in
1987 and 2011. The large majority of such houses is occupied by owners
(East Berlin 88.7% and West Berlin 77.9%). Natural persons’ ownership of
multi-family houses is 39.1% in East Berlin in 2011, less than the 54.9% in
West Berlin, but a large increase from the 9.9% in 1990. Back then, most
multi-family buildings were under state control in East Berlin. After the
reunification, the buildings were transferred into the ownership of housing
associations, privatized, or demolished. The last column in Table 1 shows
that the ownership structure is in 2011 very similar in East and West Berlin.
4.2.2 House transactions
Figure 5 shows the relative transaction volume of single-family houses (left
scale). In East Berlin, transactions revived quickly after the reunification. By
2000, the transactions relative to the stock in East and West Berlin are very
similar and move together, as one would expect for an integrated housing
market.
[Figure 5 about here.]
In the GDR, single-family buildings could be constructed on land allocated
by the state. This implied that after the reunification, land and building
23

could be legally separate units, which conflicted with German law. We have
seen above that this impeded the liquidity of affected plots. In 1994 the Prop-
erty Adjustment Law was enacted to facilitate the legal merging of land and
building. We analyse whether this law increased the transaction propensity
of houses constructed in East Berlin during the communist regime, relative
to houses that were constructed during the same period in West Berlin and
relative to houses constructed in both parts of Berlin before 1949. For the
analysis, we use all house transactions since 1990 and fit the probit regression
P(yi = 1|DE
i , DAi ,xi
)= Φ
(β1D
Ei + β2D
Ei ×DA
i + xiγ). (2)
The binary dependent variable yi takes the value one if house i has been
constructed during the period 1949–1989, and is zero otherwise. DEi is a
binary indicator that takes the value one if house i is located in East Berlin
and the value zero otherwise. DAi is a binary indicator that takes the value one
if house i is transacted after the Property Adjustment Law became enacted.
The coefficient β2 for the interaction term DEi × DA
i measures the impact
of the law on the transaction propensity of houses constructed during the
communist regime. The row vector xi contains control variables. These
are the floor to area ratio of the house and binary indicators that take the
value one if the characteristic is present and the value zero otherwise. Attic
indicates if the attic is upgraded for living. Flat roof indicates if the house
has a flat roof. 2–3 storeys indicates if the house has more than one storey.
Waterfront indicates if the house has direct access to a lake or river. Building
type considers four types, detached house is the excluded category. State of
repair has three categories, a fair state of repair is the excluded category.
Non-private indicates if either the seller or the buyer of the house is from the
public sector. We also include a full set of yearly time dummies and district
dummies in xi which control for year and location effects.
24
Table 5 presents maximum likelihood (ML) estimates of the marginal ef-
fects from Eq. 2. In column (1), we report a baseline specification that
only includes the treatment indicator, as well as time-dummies and district-
dummies. Column (2) adds the control variables to consider other factors
that can impact on the transaction propensity.
[Table 5 about here.]
In both specifications, we find that single-family houses constructed during
the communist regime have a significantly lower baseline propensity of being
transacted than other such houses. The estimate in Specification (1) indi-
cates that the propensity falls by 86.5% if the house was built in the GDR.
Specification (2) takes the control variables into account, but the estimated
marginal effect still indicates a fall of the propensity by 69.0%. This result
reflects to some degree that such houses represent only a small fraction of
Berlin’s single-family house stock. The estimated marginal effect of the in-
teraction term is of more interest. The effect is statistically positive and
economically significant. In Specification (2), the transaction propensity of
a single-family house built in the GDR is 11.3 percentage points higher af-
ter the enactment of the Property Adjustment Law. This indicates that the
Property Adjustment Law had the desired effect. The law facilitated the legal
merger of ownership of buildings built in the GDR and the land they were re-
siding, as is required under German law. This implied that the marketability
of single-family houses increased and so did their transaction propensity.
4.2.3 House prices
The left panel of Figure 6 shows box plots for real single-family house prices
for each year in the period 1980–2008.
25

[Figure 6 about here.]
In all years since 1990, the median house price is lower in East than in West
Berlin. This is to be expected, given the many attractive single-family house
neighborhoods in West Berlin. While this difference in single-family house
prices in East and West Berlin persists over the whole sample, the price
growth rates converge. Figure 5 shows the price growth rates in East and
West Berlin computed from quality-controlled indices (right axis). The rates
converge soon after the reunification and follow the same pattern afterwards.
Figure 6 shows also the distribution of real building values, which are the
house price minus the assessed value for the land (right-panel).12 Both val-
ues are less dispersed in East than in West Berlin. Building values—house
prices controlled for location effects—vary because buildings represent bun-
dles of characteristics and these characteristics are assessed at implicit price.
Building values in an integrated market will differ whenever building char-
acteristics differ (see Appendix A.2), but they should not differ because the
characteristics are assessed with differential implicit prices.
We analyse this question for the Berlin market and apply the decomposition
pioneered by Oaxaca (1973) and Blinder (1973). The dependent variable
of our regressions is the logarithm of the building value, which implies that
we effectively compare the median building value differential. Appendix A.5
gives details on the regression model.
Given the estimated regression function, the building value differential can
12The land values come from the provider of the transaction data. It is not uncommon
in the literature to decompose the house price additively into the location (land) and the
building value, see for example Rosenthal (1999) and Bourassa et al. (2011).
26

be decomposed in
D = (xW − xE) θW − xE
(θW − θE
)(3)
where xj collects the average building characteristics in East (j = E) and
West (j = W ) Berlin, respectively. θj are estimates of the respective co-
efficients. The first summand on the right hand side of Eq. 3 quantifies
how much of the log building value differential can be attributed to differ-
ences in observed building characteristics. The second summand attributes
the remainder of the differential to differences in the estimated coefficients—
the implicit prices—for these building characteristics including the constant
term. For an integrated market, we expect that the building value differential
is solely attributable to characteristic differences.
Table 6 summarizes the decomposition results. Given that the previously pre-
sented evidence suggests that both the land market and the housing market in
East Berlin has been fully revived by 2000, we split the sample of transacted
single-family houses into the two subperiods 1991–1999 and 2000–2008.
[Table 6 about here.]
For the period 1991–1999, the average log building value differential is both
statistically and economically significant. The exponentiated differential amounts
to about 60,000 Euros, which implies that the median building value for
single-family houses in West Berlin is 87% higher than in East Berlin. The
decomposition of this building value differential reveals that it can be at-
tributed to differences in both building characteristics and implicit prices for
these characteristics. The former accounts for about 63% of the differen-
tial and the latter for about 37%. The differential pricing provides evidence
27
that the single-family house markets in East and West Berlin were not fully
integrated.
For the period 2000–2008, the exponentiated building value differential be-
tween East and West Berlin is still statistically significant, but has decreased
to EUR 10,000 (9.9% of the median building value in West Berlin). More-
over, the total differential is solely attributable to the differences in building
characteristics across East and West Berlin. The contribution of differences
in the implicit prices for the building characteristics is not statistically signifi-
cantly different from zero. While differences in building characteristics persist
between East and West, the implicit prices for these characteristics are no
longer different. This provides strong evidence for an integrated single-family
house market in Berlin.
5 Conclusion
Urban land and housing markets can only function when property rights are
well-defined and mechanisms exist to enforce contracts. Between 1949–1989,
both conditions were fulfilled for West Berlin as part of the market-based
FRG, but not for East Berlin, the capital of the communist GDR. Following
the German reunification in 1990, the legal institutions of the FRG became
effective in East Germany, which brought rules of contract and a juridical
system to enforce them. To establish well-defined property rights, property
under state control had to be privatized. Politicians decided for the principle
of restitution, rather the alternatives of privatization to insiders, such as
long-term tenants and building users, or sales to investors.13
13The latter two methods were also used in exceptional cases.
28

Our paper shows that the land market in East Berlin revived quickly, but
we also find evidence that the complex legal nature of restitutions caused de-
lays. We find evidence that restitution meant that land was not immediately
allocated to those most willing and able to use it. The revival of the land
market is accompanied by an increase in housing construction, encouraged
by generous tax depreciation allowances. This construction activity resulted
in building and dwelling stocks with similar composition in the two parts of
Berlin. Land and house prices growth converged soon after the reunification
in East and West Berlin. Towards the end of our sample period, land prices
have a spatial distribution in line with the monocentric city model and build-
ing characteristics are valued identically in both parts of Berlin. These are
all signs of an integrated market.
Our results from the land and housing market of Berlin have general rele-
vance for two reasons. First, our analysis helps to understand urban land
markets in Germany. The revival of the land market in East Berlin might
have been faster than elsewhere, because it could benefit from West Berlin’s
well-functioning administration. But absent possible differences in speed, the
revival process should have been similar in other East German cities. This
is an area for further investigation. Second, our results in the context of a
particular land market show that transition is a lengthy process and exposed
to many vagaries. East Germany was in a very favorable situation compared
with other transition countries (Dornbusch and Wolf 1992, p.236). The reuni-
fication brought a functioning political and legal system, financial transfers,
and, at least in the beginning, the wide backing of the transition by the
East German population. However, the transition was not without frictions.
Restitution, in addition to delaying transactions, also caused contention be-
29

tween East and West Germans.14 Such frictions could have been avoided if
the legal situation of users, such as single-family building owners, had been
clarified sooner after the reunification. The same applies to the situation
of tenants in state controlled multi-family buildings, who could have partic-
ipated in the privatization process through purchase opportunities earlier.
Other transition economies did not have the same resources available and in
these circumstances market transition should be slower, remain unfinished, or
could even reverse through the lack of political support (Rapaczynski 1996).
A Appendix
A.1 Data sources
Construction activity and building permits: The data comes from
various reports provided by the Federal Statistical Office and the Statistical
Office of Berlin-Brandenburg. The data covers the period 1991–2008.
Conversion of rental apartments to condominiums: The data comes
from annual reports (Grundstucksmarktreport) published by Berlin’s Com-
mittee of Valuation Experts (Gutachterausschuss fur Grundstuckswerte, GAA).
Digital map: The data comes from Berlin’s Senate Department for Urban
Development and Housing.
14The article ‘Die Lage ist trostlos’ in the weekly magazine Der Spiegel, 41/1990, gives
several examples of former owners who tried to force single-family house users in East
Germany out of the property.
30

Housing stock: The data comes from the building censuses 1987, 1995
and 2011. The 1987 census is exclusively for West Berlin. The 1995 census
is exclusively for East Berlin. For both censuses micro-data on the block
level is provided by the Statistical Office of Berlin-Brandenburg. Additional
information is taken from Statistisches Landesamt Berlin (1991) and Statis-
tisches Landesamt Berlin (1997). Data from the 2011 census is compiled from
the online census database of the Federal Statistical Office. This data is for
the whole of Berlin. Further information used to disaggregate the data for
East and West Berlin comes from Statistische Amter des Bundes und der
Lander (2014). The building census also provides information about owner-
occupation rates.
Land and single-family house transactions: The data comes from
Berlin’s Committee of Valuation Experts (Gutachterausschuss fur Grund-
stuckswerte, GAA) and consists of all transactions of single-family houses
and undeveloped land plots between 1980–2008. Prior to 3 October 1990,
observations are exclusively for West Berlin. Nominal prices are deflated into
real prices with the consumer price index (CPI) for Berlin. The CPI has the
base year 2010 and is provided by Statistical Office of Berlin-Brandenburg.
A.2 Description of transaction data
Transaction activity: Table A1 shows the number of transactions—for
both undeveloped land plots and single-family houses—per year.
[Table A1 about here.]
The number of transactions of land plots indicates that trading activity re-
vived in East Berlin fairly quickly after the reunification. From 1993 onward,
31

the number of transacted land plots is between three to four times higher in
East than in West Berlin. The number of transactions of single-family houses
in East Berlin also increased quickly after the reunification. The smaller stock
means that the total number of transactions in East Berlin is always lower
than in West Berlin.
Figure A1 shows the locations of land plots transacted in East Berlin (1990–
2008) and West Berlin (1980–2008). The plots come from all the neighbor-
hoods of East and West Berlin.
[Figure A1 about here.]
Most strikingly, there are a substantial number of transactions of land plots
in central inner-city locations. This allows us to estimate land price gradients
for the city as a whole. The transactions of single-family houses, on the other
hand, are spatially concentrated in the suburban neighborhoods of East and
West Berlin (not reported).
Single-family house characteristics: Table A2 summarizes the building
type composition and the state of repair for the transacted houses in East
and West Berlin.
[Table A2 about here.]
The first panel shows that the building type composition of the transacted
houses becomes more similar in East and West Berlin over time. In the period
1991–1999, there are fewer terraced buildings and more detached buildings
in East compared to West Berlin. However, by the period 2000-2008, new
32

construction and also demolition in East Berlin mean that building composi-
tion is very similar across East and West Berlin. Similarly, the state of repair
of buildings transacted in East Berlin improves over time, see Table A2. In
the period 2000–2008, many of the transacted houses in East Berlin are in
excellent condition, more than there are in West Berlin. Still, 16.4% are in
poor condition in East Berlin, whereas only 2.0% are in West Berlin.
Figure A2 shows box plots of the building vintages for the single-family houses
transacted during the period 1980–2008.
[Figure A2 about here.]
Over time, the transacted houses in East Berlin become younger. Figure A3
shows box plots of the floor-to-area ratio (FAR).
[Figure A3 about here.]
The median FAR of houses transacted in East Berlin is, in each year except
of 2003, smaller than in West Berlin. The median is also more variable in
East than in West Berlin. Taken together, there are persistent differences in
average building characteristics across both parts and substantial variation
in building characteristics within each part of Berlin.
A.3 Land and house price indices
To compute constant-quality price indices, we use the regression
ln pi = tiγ + eiδ + xiβ + εi (A1)
where pi is the real price per sqm of plot i (the real price of house i), the
vector ti contains a full set of yearly time dummies which are allowed to
33

differ by East and West Berlin. This is achieved by including interaction
terms between the time dummies and a East Berlin dummy in the vector
ei. The vector xi contains characteristics of the plot (house). In the land
price regressions, xi contains binary indicators for contaminated plots, plots
located off the street, waterfront plots, heritage assets, further contractual
arrangements, and type of buyer and seller. In the house price regressions,
xi contains binary indicators for the type of building, type of roof, state of
repair, located at the waterfront, type of buyer and seller, and third-degree
polynomials in the lot size, the floor size of the building, and the age of the
building. The last polynomial is allowed to differ by a building’s state of
repair, which is achieved by including the respective interaction terms in xi.
In both the land and house price regressions, we also include a third-degree
polynomial in the distance to the CBD and a full set of district dummies in xi
in order to control for location-specific amenities. The constant-quality land
and house price indices are then computed from the estimated time dummy
coefficients and interaction terms in Eq. A1.
A.4 Semiparametric land price regression
To estimate the land price gradient, we use the semiparametric regression
pi = xiβ +m(di) + εi (A2)
where pi is the real price per sqm of plot i, the vector xi collects binary
indicators for contaminated plots, plots located off the street, waterfront
plots, heritage assets, further contractual arrangements, and type of buyer
and seller. We also include a full set of district dummies and yearly time
dummies in xi. The former control for location-specific amenities at the
same distance to the CBD; the latter control for deviations of the general
34

trend in land prices from the CPI. The land price gradient is modeled by
m(di), which is a smooth function in the distance of plot i to the CBD. We
estimate the coefficients in Eq. A2 using the difference estimator of Yatchew
(2003, Chapter 4.5). The coefficient estimates are then used to compute
pi = pi − xβ. The control variables in x are set to represent a standard plot
in the year 2000. We then estimate the land rent gradient nonparametrically
by fitting pi to di via a third-degree local polynomial kernel regressions. The
bandwidth is chosen according to rule of thumb described in Fan and Gijbels
(1996, Chapter 4.2).
A.5 Building value regression
To implement the building value decomposition we use the regression
ln bi = siγ + aiδ + riλ + xiβ + εi (A3)
where bi is the real building value of house i, the vector si contains a third-
degree polynomial in the floor size of the building, and the vector ai contains
a third-degree polynomial in the age of the building. The latter polynomial
is allowed to differ by the state-of-repair of the building, which is achieved
by including the respective interaction terms in the vector ri. The vector xi
collects binary indicators for the type of building, type of roof, and type of
buyer and seller. To control for deviations of the general trend in building
values from the CPI we include also a full set of yearly time-dummies in xi.
We note that we use the building value—and not the house price—as de-
pendent variable in the decomposition exercise. The house price would work
as dependent variable if we observed all variables that are relevant for the
explanation of location values. If we do not, as we suspect, a clean decom-
position of the house price into building and location value is impossible and
35

the estimated implicit prices for building characteristics would be conflated
by uncontrolled amenity differences (Fortin et al. 2011).
References
Blinder, A. S.: 1973, Age discrimination: Reduced form and structural esti-
mates, Journal of Human Resources 8, 436–455.
Bourassa, S. C., Hoesli, M., Scognamiglio, D. and Zhang, S.: 2011, Land
leverage and house prices, Regional Science and Urban Economics 41, 134–
144.
Brucker, H.: 1997, Privatization in Eastern Germany. A neo-institutional
analysis, Frank Cass & Co, London.
Bundesministerium fur Verkehr, Bau und Stadtentwicklung: 2007, 5 Jahre
Stadtumbau Ost, eine Zwischenbilanz. Zweiter Statusbericht der Bunde-
stransferstelle, Leibniz-Institut fur Regionalentwicklung und Strukturplan-
nung, Erkner.
Dornbusch, R. and Wolf, H.: 1992, Economic transition in Eastern Germany,
Brookings Papers on Economic Activity 1992(1), 235–272.
Fan, J. and Gijbels, I.: 1996, Local Polynomial Modelling and Its Applica-
tions, Chapman and Hall, London.
Fortin, N., Lemieux, T. and Firpo, S.: 2011, Decomposition methods in eco-
nomics, in O. Ashenfelter and D. Card (eds), Handbook of Labor Economics
4A, Elsevier North-Holland, Amsterdam, pp. 1–102.
36

Frowein, J. A.: 1991, Germany reunited, Zeitschrift fur auslandisches und
offentliches Recht 51, 333–348.
Gesamtdeutsches Institut: 1971, Bestimmungen der DDR zu Eigentumsfra-
gen und Enteignungen. Ausgabe August 1971, Bundesanstalt fur Gesamt-
deutsche Aufgaben, Bonn.
Gesamtdeutsches Institut: 1984, Bestimmungen der DDR zu Eigentumsfra-
gen und Enteignungen. Ausgabe Mai 1984, Bundesanstalt fur Gesamt-
deutsche Aufgaben, Bonn.
Glock, B., Haußermann, H. and Keller, C.: 2001, Die sozialen Konsequenzen
der Restitution von Grundeigentum in Deutschland und Polen, Berliner
Journal fur Soziologie 11, 533–550.
Haußermann, H. and Kapphan, A.: 2002, Berlin: Von der geteilten zur ges-
paltenen Stadt? Sozialraumlicher Wandel seit 1990, second edn, Leske +
Budrich, Opladen.
Heslop, J. and Roberto, J.: 1993, Property rights in the reunified Germany: A
constitutional, comparative, and international analysis, Boston University
International Law Journal 11, 243–298.
Horn, N.: 1994, Die Rolle des Zivilrechts im Prozeß der Wiedervereinigung
Deutschlands, Archiv fur die civilistische Praxis 194, 177–230.
Moschel, W.: 1992, Strukturwandel in den funf neuen Bundeslandern - Eine
Zwischenbilanz, JuristenZeitung 47(10), 489–493.
Oaxaca, R.: 1973, Male-female wage differentials in urban labor markets,
International Economic Review 14, 693–709.
37

Oaxaca, R. L. and Ransom, M.: 1998, Calculations of approximate variances
for wage decomposition differentials, Journal of Economic and Social Mea-
surement 24, 55–61.
Rapaczynski, A.: 1996, The role of the state and the market in establishing
property rights, Journal of Economic Perspectives 10(2), 87–103.
Roland, G.: 2000, Transition and economics. Politics, markets, and firms,
MIT Press, Cambridge MA.
Rosenthal, S. S.: 1999, Residential buildings and the cost of construction:
New evidence on the efficiency of the housing market, Review of Economics
and Statistics 81, 288–302.
Sievert, O.: 1993, Probleme des Ubergangs vom Sozialismus zur Markt-
wirtschaft – Die Eigentumsfrage, in W. Dichmann and G. Fels
(eds), Gesellschaftliche und okonomische Funktionen des Privateigentums,
Deutscher Instituts-Verlag, Koln, pp. 206–242.
Sinn, G. and Sinn, H.-W.: 1993, Kaltstart: Volkswirtschaftliche Aspekte der
deutschen Vereinigung, Beck-Wirtschaftsberater im dtv, Munchen.
Stack, H. M.: 1997, The “colonization” of East Germany?: A comparative
analysis of German privatization, Duke Law Journal 46, 1211–1253.
Statistische Amter des Bundes und der Lander: 2014, Gebaude und Wohnun-
gen in den neuen Bundeslandern und Berlin-Ost: Vergleich der Ergebnisse
der Gebaude- und Wohnungszahlungen 2011 und 1995. Accessed on Jan-
uary 30, 2017.
URL: www.statistikportal.de/Statistik-Portal/Zensus 2011 Vergleich.pdf
38

Statistisches Landesamt Berlin: 1991, Gebaude- und Wohnungszahlung in
Berlin-West am 25. Mai 1987, Kulturbuch-Verlag, Berlin.
Statistisches Landesamt Berlin: 1997, Gebaude- und Wohnungszahlung in
Berlin-Ost am 30. September 1995, Kulturbuch-Verlag, Berlin.
Strubelt, W.: 1996, Regionale Disparitaten zwischen Wandel und Persis-
tenz, in W. Strubelt, J. Genosko, H. Bertram, J. Friedrichs, P. Gans,
H. Haußermann, U. Herlyn and H. Sahner (eds), Stadte und Regio-
nen – Raumliche Folgen des Transformationsprozesses, Leske + Budrich,
Opladen, pp. 11–110.
Toben, T.: 1996, Das Fordergebietsgesetz, second edn, RWS Verlag Kommu-
nikationsforum.
Vossius, O.: 1995, Sachenrechtsbereinigungsgesetz. Kommentar, C.H. Beck,
Munchen.
Yatchew, A.: 2003, Semiparametric Regression for the Applied Econometri-
cian, Themes in Modern Econometrics, Cambridge University Press, Cam-
bridge.
39
Tab
le1:
Ow
ners
hip
stru
ctu
reof
resi
denti
al
bu
ild
ings
inE
ast
an
dW
est
Berl
in,
inp
erc
ent.
Ow
nca
lcu
lati
ons
usi
ng
the
dat
afr
om
the
thre
ed
iffer
ent
bu
ild
ing
cen
suse
sfo
rB
erli
n.
Cal
cula
tion
sfo
rW
est
Ber
lin
use
data
from
the
1987
and
2011
cen
suse
s;ca
lcula
tion
sfo
rE
ast
Ber
lin
use
dat
afr
omth
e19
95an
d20
11ce
nsu
ses.
Natu
ral
pers
on
incl
ud
esco
nd
omin
ium
asso
ciat
ion
s,w
hic
hca
now
nm
ult
i-fa
mil
yb
uil
din
gs.
The
1987
cen
sus,
wh
ich
cove
rsex
clu
sivel
yW
est
Ber
lin
,su
bsu
mes
bu
ild
ing
coop
erat
ives
un
der
the
cate
gory
Hou
sin
gass
ocia
tion
.T
he
1995
cen
sus,
wh
ich
cove
rsex
clu
sive
lyE
ast
Ber
lin
,in
clu
des
also
info
rmat
ion
onh
ousi
ng
own
ersh
ipin
1990
.F
orth
isye
ar,
Hou
sin
gass
ocia
tion
imp
lies
stat
eow
ner
ship
and
the
cate
gory
Oth
erst
ate
adm
inst
rati
on.
Sin
gle-
fam
ily
Mu
lti-
fam
ily
All
bu
ild
ings
Pan
elA
.E
ast
Ber
lin
1990
1995
2011
1990
1995
2011
1990
1995
2011
Natu
ral
per
son
80.2
93.6
97.9
9.9
24.0
39.1
41.8
56.9
73.5
Hou
sin
gas
soci
atio
n5.
83.
91.
262
.543
.733
.536
.831
.314
.5
Bu
ild
ing
coop
erati
ve1.
81.
00.
515
.916
.617
.09.
59.
37.
4
Oth
er12
.21.
50.
111
.715
.710
.411
.92.
54.
6
Pan
elB
.W
est
Ber
lin
1987
2011
1987
2011
1987
2011
Natu
ral
per
son
92.8
94.1
53.4
54.9
73.8
76.1
Hou
sin
gas
soci
atio
n5.
32.
939
.229
.021
.513
.0
Bu
ild
ing
coop
erati
ve1.
57.
14.
1
Oth
er1.
91.
57.
49.
04.
86.
8
40
Table 2: Characteristics of the housing stock in Berlin, in per-cent. Own calculations using the three different building censuses for
Berlin. Calculations for West Berlin use data from the 1987 and 2011censuses; calculations for East Berlin use data from the 1995 and 2011censuses. Columns of Building type and Building vintage each add to one
hundred. Category Building vintage 1949–90 for West Berlin is based onthe 1987 census and covers only vintages 1949–1987.
West East
1987 2011 1995 2011
Building vintage
before 1919 19.2 16.4 23.2 13.7
1919–48 29.7 25.6 38.3 25.8
1949–90 51.1 47.4 33.0 27.9
1991–95 2.9 5.5 5.6
after 1995 7.7 27.0
Building type
Single-family 52.4 54.2 47.1 58.4
Multi-family 47.6 45.8 52.9 41.6
Building damages
single-family minor 50.3
single-family major 15.0
multi-family minor 39.1
multi-family major 40.5
41

Table 3: Characteristics of dwellings in Berlin, in percent. Owncalculations using the three different building censuses for Berlin. Calcu-
lations for West Berlin use data from the 1987 and 2011 censuses; calcula-tions for East Berlin use data from the 1995 and 2011 censuses. Columnsin In buildings with vintage each add to one hundred. Category 1949–
90 for West Berlin is based on the 1987 census and covers only vintages1949–1987.
West East
1987 2011 1995 2011
In buildings with vintage
before 1919 31.3 29.4 28.0 23.7
1919–48 16.8 15.5 17.1 14.1
1949–90 51.9 49.0 51.6 47.0
1991–95 2.5 3.3 3.0
after 1995 3.7 12.2
In building with
minor damages 38.0
major damages 39.3
42

Table 4: Time until land plot’s first market transaction afterreunification. Reports OLS estimates of Eq. 1. Number of observa-
tions is 11,984. District dummies and constant are included but not re-ported. Heteroscedasticity robust standard errors are reported in brack-ets. ∗∗∗0.1%-level ∗∗1%-level ∗5%-level.
Dep. var.: Log time until first transaction
Assembly 0.204∗∗∗ [0.030]
Inheritance -0.112∗∗∗ [0.051]
Contractual 0.042∗∗∗ [0.016]
Merge 0.269∗∗∗ [0.020]
Back 0.189∗∗∗ [0.012]
Contamination 0.328∗∗∗ [0.050]
Heritage asset 0.340∗∗∗ [0.059]
Commercial use -1.061∗∗∗ [0.017]
Waterfront 0.108∗∗∗ [0.044]
Private-to-public 0.184∗∗∗ [0.044]
Public-to-private 0.372∗∗∗ [0.021]
Public-to-public 0.243∗∗∗ [0.089]
R2 0.462∗∗∗
43

Table 5: Transaction propensity after reunification of single-family houses constructed during the GDR. Reports marginal ef-
fects from ML estimates of Eq. 2. Marginal effects are evaluated at samplemeans of explanatory variables. Uses transactions of single-family housesconstructed before 3 October 1990. Number of observations is 18,376.
Time-dummies, district-dummies and constant are included, but not re-ported. Heteroscedasticity robust standard errors are reported in brack-
ets. Standard errors are computed using the delta method. ∗∗∗0.1%-level∗∗1%-level ∗5%-level.
(1) (2)
East -0.865∗∗∗ [0.057] -0.690∗∗∗ [0.050]
East × After 0.142∗∗∗ [0.024] 0.113∗∗∗ [0.022]
Floor to area ratio 0.283∗∗∗ [0.030]
Attic -0.203∗∗∗ [0.014]
Flat roof 0.429∗∗∗ [0.010]
2–3 Storeys -0.172∗∗∗ [0.008]
Waterfront -0.032∗∗∗ [0.033]
Building type
Semi-detached -0.039∗∗∗ [0.008]
Row house -0.066∗∗∗ [0.012]
End row house 0.073∗∗∗ [0.015]
State of repair
Poor -0.125∗∗∗ [0.013]
Excellent 0.217∗∗∗ [0.009]
Non-private
Buyer -0.049∗∗∗ [0.021]
Seller -0.158∗∗∗ [0.012]
Pseudo R2 0.063∗∗∗ 0.226∗∗∗
44
Table 6: Oaxaca-Blinder decomposition of building value. De-composition uses OLS estimates of Eq. A3. Regression is fitted using
only building values for arms-length transactions. Heteroscedasticity ro-bust standard errors are reported in brackets. Standard errors for thedecomposition are computed according to the approximation in Oaxaca
and Ransom (1998). Significant at ∗∗∗0.1%-level ∗∗1%-level ∗5%-level.
Panel A. 1991–1999 (N = 7, 543)
Differential
West Berlin 11.769∗∗∗ [0.010]
East Berlin 11.142∗∗∗ [0.021]
Difference 0.627∗∗∗ [0.023]
Decomposition
Characteristics 0.395∗∗∗ [0.025]
Coefficients 0.233∗∗∗ [0.035]
Panel B. 2000–2008 (N = 12, 498)
Differential
West Berlin 11.580∗∗∗ [0.008]
East Berlin 11.480∗∗∗ [0.010]
Difference 0.099∗∗∗ [0.012]
Decomposition
Characteristics 0.138∗∗∗ [0.016]
Coefficients -0.039∗∗∗ [0.020]
45

Table A1: Transactions of land plots and single-family housesin Berlin. Year 1990 covers only the period starting with the German
reunification on 3 October 1990.
Plots Houses
East West East West
1990 38 900 5 669
1991 780 812 119 623
1992 1,407 621 184 633
1993 2,196 585 317 863
1994 2,436 549 201 674
1995 2,028 432 160 687
1996 2,009 455 242 707
1997 1,801 430 255 680
1998 1,953 546 315 767
1999 1,967 640 350 801
2000 1,724 555 451 789
2001 1,327 418 484 838
2002 1,436 480 460 905
2003 1,633 450 431 980
2004 1,648 482 468 942
2005 1,973 647 618 1,123
2006 1,725 587 427 1,015
2007 1,550 528 476 1,128
2008 1,500 500 597 1,160
46
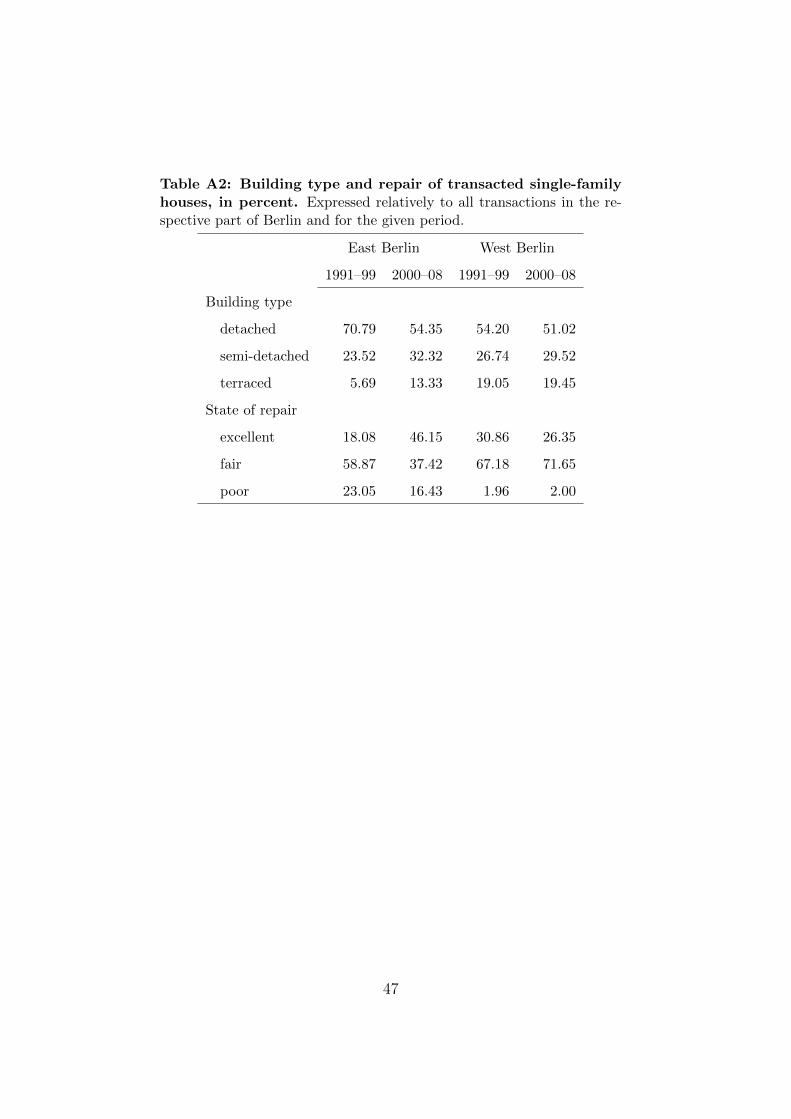
Table A2: Building type and repair of transacted single-familyhouses, in percent. Expressed relatively to all transactions in the re-
spective part of Berlin and for the given period.
East Berlin West Berlin
1991–99 2000–08 1991–99 2000–08
Building type
detached 70.79 54.35 54.20 51.02
semi-detached 23.52 32.32 26.74 29.52
terraced 5.69 13.33 19.05 19.45
State of repair
excellent 18.08 46.15 30.86 26.35
fair 58.87 37.42 67.18 71.65
poor 23.05 16.43 1.96 2.00
47
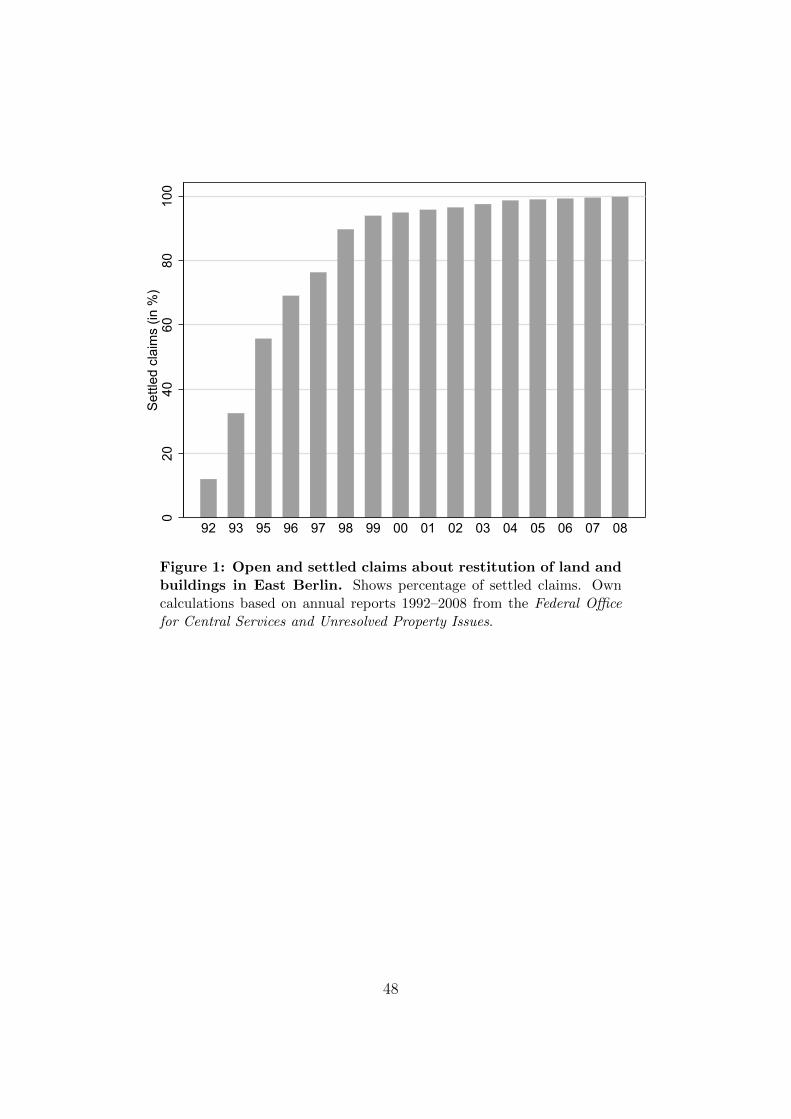
020
4060
8010
0S
ettle
d cl
aim
s (in
%)
92 93 95 96 97 98 99 00 01 02 03 04 05 06 07 08
Figure 1: Open and settled claims about restitution of land and
buildings in East Berlin. Shows percentage of settled claims. Owncalculations based on annual reports 1992–2008 from the Federal Officefor Central Services and Unresolved Property Issues.
48

-.20
.2.4
Gro
wth
rate
0.5
11.
52
Tran
sact
ion
volu
me
1980 1984 1988 1992 1996 2000 2004 2008
Volume West Berlin Land price West BerlinVolume East Berlin Land price East Berlin
Figure 2: Relative transaction volume and land price growth
rate. Left axis shows the volume of transacted land in sqm relative to itslong-run average. Volume is computed using all transactions. Right axismeasures growth rate of land price per sqm. Growth rates are computed
from quality-controlled price indices. Indices are computed from real (year2010) transaction prices of arms-length transactions.
49

020
040
060
080
01,
000
Pric
e
1980
1981
1982
1983
1984
1985
1986
1987
1988
1989
1990
1991
1992
1993
1994
1995
1996
1997
1998
1999
2000
2001
2002
2003
2004
2005
2006
2007
2008
West Berlin East Berlin
1991-99
020
0040
0060
0080
00La
nd v
alue
per
sqm
0 5 10 15 20Distance to CBD
West Berlin East Berlin
2000-08
020
0040
0060
0080
00La
nd v
alue
per
sqm
0 5 10 15 20Distance to CBD
West Berlin East Berlin
1980-90
010
0020
0030
0040
00La
nd v
alue
per
sqm
0 5 10 15 20Distance to CBD
West Berlin
Figure 3: Land price distributions and gradients. Top-left panel
shows cross-sectional land price distributions. Lower (upper) hinge of boxcorresponds to 25th (75th) percentile. Line in the middle is the median.Top-right to bottom-right panels show local polynomial estimates of land
price gradients. Dotted lines are 95% point-wise confidence bands. TheCBD is the Potsdamer Platz; distance is measured in km. All panels
use real (year 2010) price per sqm of arms-length transactions in respec-tive period. Estimation period for bottom-right panel is truncated at 3October 1990.
50
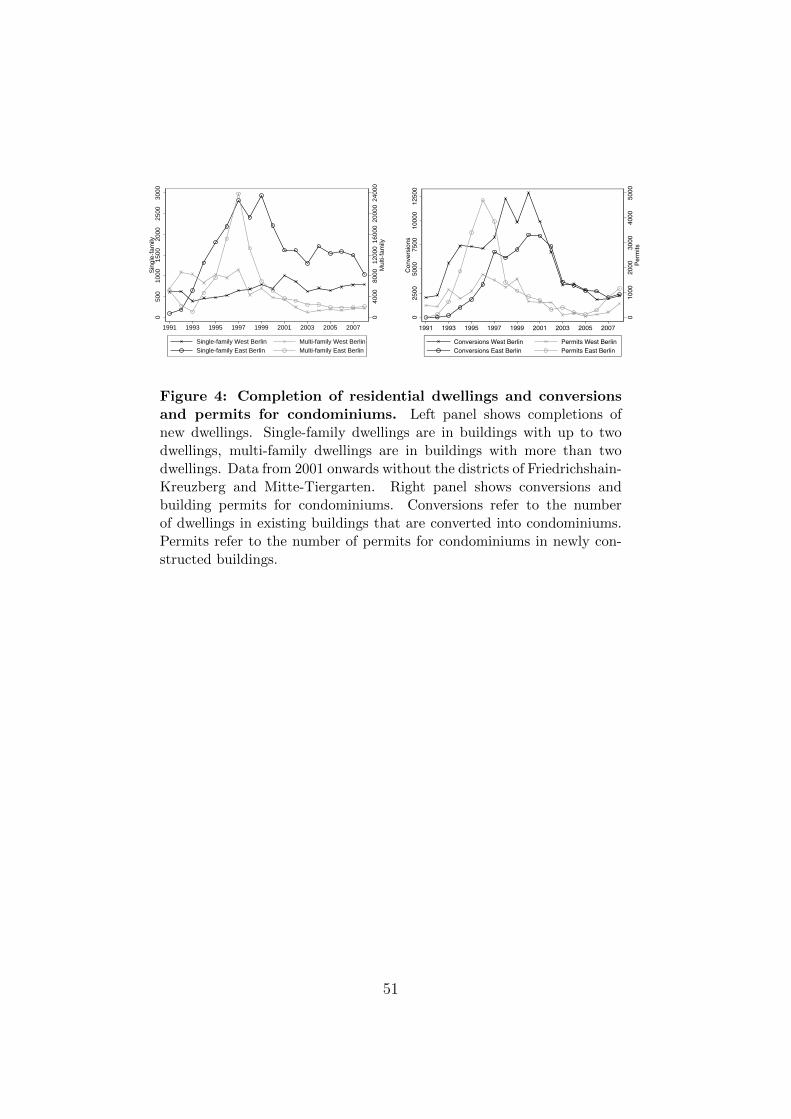
040
0080
0012
000
1600
020
000
2400
0M
ulti-
fam
ily
050
010
0015
0020
0025
0030
00S
ingl
e-fa
mily
1991 1993 1995 1997 1999 2001 2003 2005 2007
Single-family West Berlin Multi-family West BerlinSingle-family East Berlin Multi-family East Berlin
010
0020
0030
0040
0050
00P
erm
its
025
0050
0075
0010
000
1250
0C
onve
rsio
ns
1991 1993 1995 1997 1999 2001 2003 2005 2007
Conversions West Berlin Permits West BerlinConversions East Berlin Permits East Berlin
Figure 4: Completion of residential dwellings and conversionsand permits for condominiums. Left panel shows completions of
new dwellings. Single-family dwellings are in buildings with up to twodwellings, multi-family dwellings are in buildings with more than twodwellings. Data from 2001 onwards without the districts of Friedrichshain-
Kreuzberg and Mitte-Tiergarten. Right panel shows conversions andbuilding permits for condominiums. Conversions refer to the number
of dwellings in existing buildings that are converted into condominiums.Permits refer to the number of permits for condominiums in newly con-structed buildings.
51

-.20
.2.4
.6.8
Gro
wth
rate
0.0
05.0
1.0
15Tr
ansa
ctio
n vo
lum
e
1980 1984 1988 1992 1996 2000 2004 2008
Volume West Berlin House price West BerlinVolume East Berlin House price East Berlin
Figure 5: Relative transaction volume and house price growth
rate. Left axis shows transaction volume relative to single-family housingstock. Volume is computed using all observed transactions. Housing stockis calculated from 1987 and 1995 building censuses and completions of new
single-family houses. Right axis measures growth rate of single-familyhouse price. Growth rates are computed from quality-controlled price
indices. Indices are computed from real (year 2010) transaction prices ofarms-length transactions.
52

020
040
060
080
01,
000
Pric
e
1980
1981
1982
1983
1984
1985
1986
1987
1988
1989
1990
1991
1992
1993
1994
1995
1996
1997
1998
1999
2000
2001
2002
2003
2004
2005
2006
2007
2008
West Berlin East Berlin
020
040
060
0B
uild
ing
valu
e
1980
1981
1982
1983
1984
1985
1986
1987
1988
1989
1990
1991
1992
1993
1994
1995
1996
1997
1998
1999
2000
2001
2002
2003
2004
2005
2006
2007
2008
West Berlin East Berlin
Figure 6: Distributions of house prices and building values. Uses
arms-lengths transactions of single-family houses. House price and build-ing value are in real (year 2010) Euros. In ’000 units. Building value is
transaction price net of assessed land value. Lower (upper) hinge of boxcorresponds to 25th (75th) percentile. Middle line is the median.
53

Figure A1: Location of transacted plots of land. Berlin covers an
area of 891 sqkm, the maximal extension in west-to-east direction is 45km. Thick (red) line represents the Berlin Wall, which entirely surrounded
West Berlin. Circle indicates location of Potsdamer Platz. Thin blacklines represent streets and street blocks. Solid grey (blue) areas are riversand lakes. White areas are forests, other green spaces, and non-developed
areas. Total number of observations is 52,929.
54

1870
1894
1918
1942
1966
1990
2014
Bui
ldin
g vi
ntag
e
1980
1981
1982
1983
1984
1985
1986
1987
1988
1989
1990
1991
1992
1993
1994
1995
1996
1997
1998
1999
2000
2001
2002
2003
2004
2005
2006
2007
2008
West Berlin East Berlin
Figure A2: Cross-sectional building vintage distributions (1980–
2008). Uses arms-lengths transactions of single-family houses. Buildingvintage is measured by year of construction. Lower (upper) hinge of boxcorresponds to 25th (75th) percentile. Middle line is the median.
55
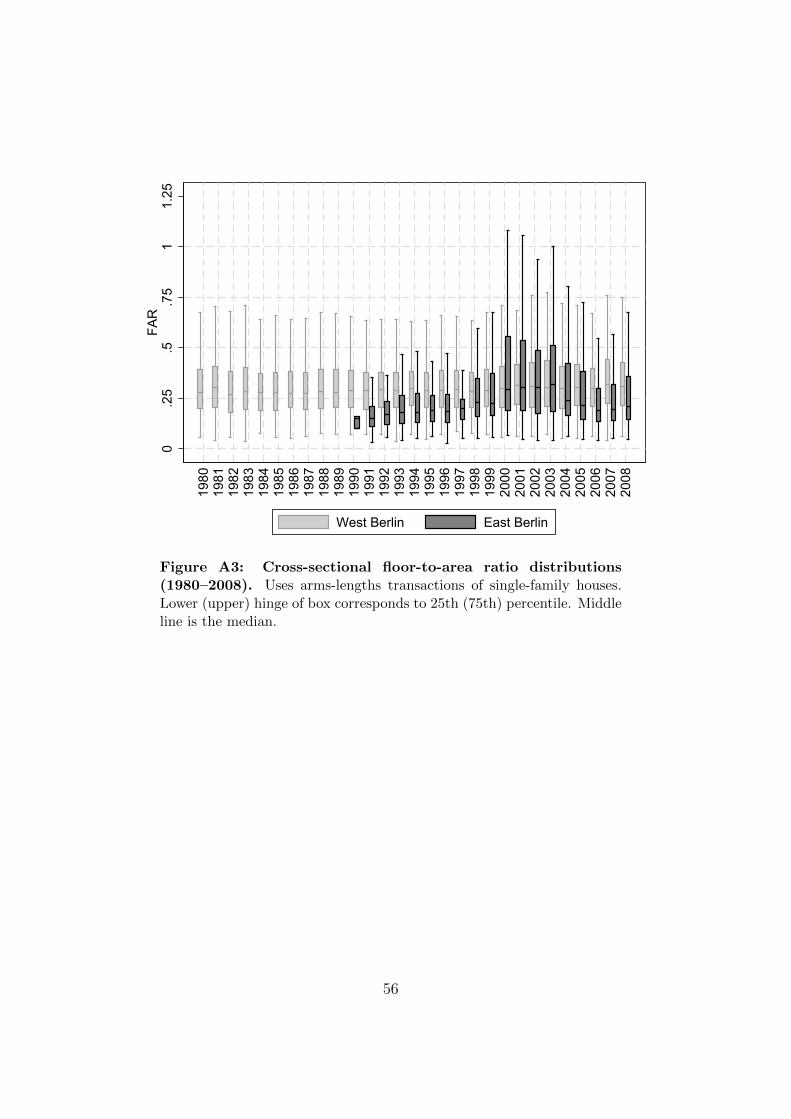
0.2
5.5
.75
11.
25FA
R
1980
1981
1982
1983
1984
1985
1986
1987
1988
1989
1990
1991
1992
1993
1994
1995
1996
1997
1998
1999
2000
2001
2002
2003
2004
2005
2006
2007
2008
West Berlin East Berlin
Figure A3: Cross-sectional floor-to-area ratio distributions
(1980–2008). Uses arms-lengths transactions of single-family houses.Lower (upper) hinge of box corresponds to 25th (75th) percentile. Middleline is the median.
56