Embed Size (px)
Citation preview
THE RHESSI SPECTROMETER
D. M. SMITH1, R. P. LIN1, P. TURIN1, D. W. CURTIS1, J. H. PRIMBSCH1,R. D. CAMPBELL1, R. ABIAD1, P. SCHROEDER1, C. P. CORK2, E. L. HULL2,
D. A. LANDIS2, N. W. MADDEN2, D. MALONE2, R. H. PEHL2, T. RAUDORF3,P. SANGSINGKEOW3, R. BOYLE4, I. S. BANKS4, K. SHIREY4 and
RICHARD SCHWARTZ5
1Space Sciences Laboratory, University of California, Berkeley, U.S.A.2Lawrence Berkeley National Laboratory, U.S.A.
3ORTEC, U.S.A.4NASA Goddard Space Flight Center, U.S.A.
5NASA Goddard Space Flight Center/SSAI, U.S.A.
(Received 12 September 2002; accepted 16 September 2002)
Abstract. RHESSI observes solar photons over three orders of magnitude in energy (3 keV to17 MeV) with a single instrument: a set of nine cryogenically cooled coaxial germanium detectors.With their extremely high energy resolution, RHESSI can resolve the line shape of every knownsolar gamma-ray line except the neutron capture line at 2.223 MeV. High resolution also allowsclean separation of thermal and non-thermal hard X-rays and the accurate measurement of evenextremely steep power-law spectra. Detector segmentation, fast signal processing, and two sets ofmovable attenuators allow RHESSI to make high-quality spectra and images of flares across sevenorders of magnitude in intensity. Here we describe the configuration and operation of the RHESSIspectrometer, show early results on in-flight performance, and discuss the principles of spectroscopicdata analysis used by the RHESSI software.
1. Introduction
The Reuven Ramaty High-Energy Solar Spectroscopic Imager (RHESSI) was de-signed to study high-energy emission from flares over a broad energy range, fromthermal X-rays through nuclear gamma-ray lines (Lin et al., 2002). The designof its spectrometer was driven by the need to satisfy many requirements with asingle instrument of modest cost and weight. The spectrometer had to be able toprocess up to millions of hard X-rays per second for imaging, while carefully col-lecting rare gamma-ray line photons with high efficiency, high energy resolution,and without interference from the X-rays. It was desirable for the energy range toextend down to 3 or 4 keV to clearly image the thermal components of flares and tobe highly sensitive to microflares, while extending well above the 4.4 and 6.1 MeVgamma-ray lines to characterize the electron bremsstrahlung spectrum above thenuclear line region. We wanted to be sensitive to events covering at least sevenorders of magnitude in intensity, from microflares to the largest X-class events.
Solar Physics 210: 33–60, 2002.© 2002 Kluwer Academic Publishers. Printed in the Netherlands.
34 D. M. SMITH ET AL.
Most importantly, RHESSI had to have extremely high energy resolution in or-der to make advances in spectroscopy comparable to the advances its high-angular-resolution Rotating Modulation Collimator (RMC) system would make in imaging(Hurford et al., 2002). The Solar Maximum Mission Gamma-Ray Spectrometer(SMM/GRS), with its large collecting area and its long and successful mission op-erations, produced a wealth of data on gamma-ray lines from large flares (Vestrandet al., 1999) and a significant contribution was also made by the instruments onthe Compton Gamma-Ray Observatory (Share, Murphy, and Ryan, 1997) and theGamma-Ray Spectrometer on Yohkoh (Yoshimori et al., 1994). But all these instru-ments were scintillators with energy resolution ≥ 6% full width at half maximum(FWHM) at gamma-ray line energies. In some cases (particularly around 1 MeV)this low resolution can result in the blending of several lines, and, more importantly,it leaves the issue of Doppler shifts and broadening of the nuclear deexcitation linesmostly unaddressed. Energy resolution an order of magnitude finer would allowthese Doppler phenomena to be observed unambiguously, revealing informationabout the angular distribution of accelerated ions in large flares. In the hard X-rayband, high resolution (about 1 keV FWHM from 3–100 keV) would allow a cleanseparation between thermal and nonthermal emission never before achieved excepton balloon payloads flying germanium spectrometers (Lin and Schwartz, 1987).
RHESSI has many new, unique features compared to other gamma-ray spec-trometers flown in space, even beyond the obvious advance of using a large arrayof germanium detectors. These include an efficient, lightweight, and inexpensivemechanical cooler; movable attenuators that respond to the intensity of a flare,so that the detectors can record microflares without saturating even in the biggestflares; and extremely low-noise electronics and segmented detectors to cover from3 keV to 17 MeV with a single crystal. These and other advances allow RHESSIto meet its goals of resolution, sensitivity, and dynamic range within the cost andweight constraints of a Small Explorer mission.
The sections below will address the composition and operation of the RHESSIspectrometer, the spectrometer data formats, in-flight performance, and the princi-ples of the spectroscopic data analysis.
2. Components of the RHESSI Spectrometer
2.1. GERMANIUM DETECTORS
RHESSI’s spectrometer is an array of segmented coaxial germanium detectors.When ultrapure germanium is at cryogenic temperatures, no electron-hole pairs arein the conduction band, but a hard X-ray or gamma ray interacting in the crystalwill release one or more energetic electrons, which lose energy by creating freepairs. If there is a high electric field (on the order of 1000 V cm−1) across thecrystal, the electrons and holes will be pulled to each electrode, creating a current

THE RHESSI SPECTROMETER 35
Figure 1. Cross-sections of a RHESSI detector. (A) A detector profile with field lines, with thefield line marking the segment boundary in bold dashes. (B) A detector in the cryostat, showingTa/Sn/Fe/Al shielding around the side of the front segment and above the shoulder of the rearsegment.
pulse that can be amplified and digitized by suitable electronics. The total chargein the current pulse is proportional to the photon energy.
Figure 1 shows two cross-sections of the cylindrically-symmetrical RHESSIdetector design. This design was a joint effort of the RHESSI co-investigators atU. C. Berkeley and Lawrence Berkeley National Laboratory and the manufac-turer, ORTEC (currently a division of AMETEK). The shape is a variation of a‘closed-end coaxial’ detector, the industry standard design for large volumes andhigh gamma-ray sensitivity. The ultrapure, slightly n-type germanium material isdoped in a very thin outer layer with boron on the front and side surfaces, and athicker, n-type layer of diffused lithium ions on the inner bore. The rear surfaceis left as an insulator. When 2000–4000 V is applied between the inner and outerelectrodes, the crystal is depleted of free charge carriers, with enough electric fieldin the crystal from the space charge and external voltage combined to cause theelectron-hole pairs to reach terminal velocity.
For space applications, it is important to fly n-type material with this electrodeconfiguration in order to minimize the effect of radiation damage on resolution.

36 D. M. SMITH ET AL.
Since radiation damage produces primarily hole traps rather than electron traps, thegoal is to minimize the length of germanium traversed by the holes. For a coaxialdetector, most of the volume is near the outer radius. Thus most interactions takeplace near the outside and the holes should therefore travel to the outside electrode.The effects of radiation damage can also be minimized by keeping the detectorsvery cold (72–76 K in the case of RHESSI) and making sure the detector highvoltage is never turned off once there has been significant exposure to protons andneutrons (Hull, 1998; Koenen et al., 1995).
The inner (lithium) contact is discontinuous at a point near the top, and signalsare extracted separately from the two halves of this electrode. The line extendingfrom this point to the outside edge of the detector in Figure 1(A) represents aboundary electric field line: photons stopping above this line are detected in thefront channel, and those stopping below it in the rear channel. Thus a single crystalbecomes a zero-gap stacked pair of detectors. The front segment will absorb all thehard X-rays up to about 100 keV, letting most gamma-ray line photons through.The rear segment will stop many of the latter, so that fine spectroscopy can be donewithout high deadtime from the X-rays.
The notch on the outer edge of the detector serves two purposes: first, it con-centrates the electric field lines at the corner of the notch, so that the field linethat originates at the break in the inner contact always hits the proper place on theoutside of the detector. In addition, it removes some mass from in front of the rearsegment, so that fewer high-energy gamma rays Compton scatter before enteringthe rear. A ring of ‘graded-Z’ material keeps the shoulder of the rear segment frombeing swamped with flare hard X-rays (see below). This shield is just as effectiveas the front segment in photoelectrically absorbing hard X-rays, but with much lessCompton scattering of gamma-rays.
Figure 2 shows a side view of the detector segmentation produced by scanninga 3 mm beam of 81-keV X-rays across the detector in discrete positions corre-sponding to each pixel. The brightness of each pixel is the sum of the front andrear segment count rates in the photopeak of the line. The segmentation boundaryprobably looks dark due to a combination of effects which cause charge to be splitbetween the front and rear signal electrodes: Compton scattering and k-shell photontransport, which produce interactions on either side of the boundary, and charge-sharing between the segments for even single-site interactions that happen veryclose to the boundary.
Note that the segmentation boundary is not independent of azimuth angle, butrather has a wavy appearance, with four peaks and four valleys around the pe-riphery of the detector. This is a natural result of the cubic crystal structure ofgermanium: electron mobility is highest along the three main crystal axes and lowerbetween them. Thus electrons traveling to the central bore from different spots onthe crystal surface at terminal velocity will not travel directly along field lines butinstead their paths will bend toward the nearest axis. This distorts the segmentationboundary position as a function of azimuth about the cylindrical axis. The crystals

THE RHESSI SPECTROMETER 37
Figure 2. Result of a narrow-beam 81 keV X-ray scan of the side of a RHESSI detector showing theripple in the segmentation boundary (see text). The front of the detector is to the left. The scan doesnot proceed all the way down the rear segment. Lighter shades represent a higher count rate in the81 keV line.
are always grown so that one axis is parallel to the axis of the cylinder (‘X’ inFigure 2).
2.2. DETECTOR ELECTRONICS
The preamplifiers for the RHESSI detectors feature custom four-terminal, N chan-nel junction field effect transisitors (JFETS) with adjustable back-gate voltage forvery-low-noise operation, one for each segment. These are immediately behind thedetectors, and are thermally connected by wires to the outer thermal shield (seebelow) to achieve an ideal operating temperature between 130 and 170 K. Theirsignals are taken out to the rest of the preamplifier circuit, which resides in anindividual box for each detector, clustered around the bottom of the spectrometer(see Figure 3), by a harness consisting of thin traces of manganin (for low thermalconductivity) layered in a flexible plastic film.
The preamplifiers use a pulsed reset circuit developed at Lawrence BerkeleyNational Laboratory (Landis, Cork, and Goulding, 1982). The integrated chargeon the preamplifier’s feedback capacitor is restored by this circuit when a totalcharge equivalent to interactions from 40 MeV worth of photons or cosmic rayshas been deposited in each segment. The preamplifier’s output-level-sensing andcharge-restoration logic avoids transient signal reductions associated with high-energy events.

38 D. M. SMITH ET AL.
Figure 3. The RHESSI spectrometer, before being mounted on the spacecraft. The aluminum at-tenuator disks are visible on top (one set in the aperture, the other out), and the preamplifiers andhigh-voltage filter boxes can be seen around the skirt. The detectors are behind the thin, ribbed sidewall.
Leakage current in the detectors is so low (a few picoamps) that cosmic rays andbackground photons dominate the total current through the detectors. Each resetevent results in approximately 40 µs of deadtime in the resetting segment, but asthis seldom happens at a rate of more than 100 Hz it represents a small contributionto the overall system deadtime. Leakage current is kept low by avoiding the intro-duction of any contamination on the back (insulating) surface of the crystals in twoways: (1) careful design of the cryostat (see below) and (2) a proprietary ORTECpassivation process used on the rear germanium surface.
The signals from the preamplifier are taken to a Detector Interface Board (DIB)in the primary Instrument Data Processing Unit (IDPU) (Curtis et al., 2002) boxon the spacecraft deck. Each board contains both the analog and digital signal-processing circuitry for both segments of one detector. The signal from each eventis split, going to a fast-shaping channel (which produces a triangular pulse 800 nswide at the base) and a slow-shaping channel (8 µs peaking time) for spectroscopy.
The fast pulse is used for pileup rejection: two events very close together intime, which would be analyzed as a single higher-energy event by the analog-to-digital converter (ADC), can instead be recognized, and both rejected. If the secondevent comes shortly after the slow-shaped pulse from the first has already been

THE RHESSI SPECTROMETER 39
sampled at its peak and fed to the ADC, then only the second is rejected, since thefirst was read with its correct energy. The fast lower-level discriminator is set atabout 7 keV in the front segments (just above the noise) and about 20 keV in therear segments. Photons below 7 keV in the front segments may pile up with othercounts without triggering the pileup veto, so careful data analysis is necessary forhigh count rates of soft photons.
The circuit also uses the height of the fast pulse for large events to choosequickly between one of two gain ranges available in the rear segments: a high gainsetting that goes up to about 2.7 MeV and a low one that goes to about 17 MeV.The ADC samples the shaped pulse (see below) at its peak to produce a 13-bit(8192 channel) value for either range. Thus the ADC gain can be set before theslow-shaped pulse reaches its peak. Because the energy resolution of the fast pulseis poor and because its short integration time means that each pulse still has adifferent shape depending on the position of the interactions in the detector, thetransition between the two rear gain ranges is gradual rather than abrupt, i.e., eventsfrom about 2.6 to 3.2 MeV may appear with either gain. Since the gain range thatwas used is recorded as part of the event, there is no loss of information. The frontsegments use only the first (high) gain value.
The bottoms of the usable energy ranges in each segment are set by both elec-tronics and physics. The physical limits are absorption in the materials around thedetectors (see below). The electronic thresholds, set by the noise level in the slow-shaping channel, are about 2.7 keV for most of the front segments and 20 keV in therears. Both the physical and electronic cutoffs are somewhat gradual and have to bemodeled precisely for low-energy spectral analysis. The front segment electronicsuse quasi-triangular shaping to optimize low-energy response, and the electronicsfor the rear segments use quasi-trapezoidal shaping to minimize ballistic deficit.
The ADC-busy and pileup rejection signals are ‘or-ed’ together and sampled at1 MHz by a livetime counter. Because the pileup circuit has the ability to sometimesveto both piled-up events, no simple circuit can sample the true system livetime.There is, however, a simple mapping between the recorded and true livetimes aslong as all events are above the fast discriminator threshold. When a large fractionof the counts are below this energy, deriving the true livetime is more complicated,but can still be done based on pre-flight and in-flight calibrations.
2.3. THE RHESSI CRYOSTAT
The RHESSI cryostat was designed to provide a lightweight but secure environ-ment for the detectors. This involves maintaining a hard vacuum and very goodthermal insulation, so that the detectors can remain at operating temperature (about75 K) with a very low heat leak. Figures 3–5 depict the interior and exterior of thecryostat and the arrangement of the detectors.
The weight constraints of a Small Explorer did not allow a heavy active shieldto veto solar photons that scatter out of the detectors and to keep out background

40 D. M. SMITH ET AL.
Figure 4. Exterior of the spectrometer shown with part of the outer housing cut away, revealing thedetector modules inside. The numbering scheme of the detectors matches the grids.
Figure 5. The interior of the RHESSI spectrometer, showing the detectors mounted on the coldplate,the Sunpower cryocooler below it, and the fiberglass-strap ‘cartwheels’ that suspend this assemblyin the interior of the cryostat.

THE RHESSI SPECTROMETER 41
photons. We therefore decided instead to design the side walls of the cryostat tobe as thin as possible; there is about 4 mm of Al between the rear detector sidesurfaces and space. This allows hard X-rays (above about 25 keV) and gamma-rays from cosmic sources such as supernova remnants, pulsars, and gamma-raybursters to enter the spectrometer, providing a wealth of secondary science, includ-ing astrophysical topics (Smith et al., 2000, 2002) and the study of emissions fromthe Earth’s atmosphere (Share et al., 2002). Cosmic and terrestrial sources usuallyappear primarily in the rear segments rather than the front segments, so they cangenerally be distinguished from solar events.
The detectors are securely housed in independent modules that are not hermet-ically sealed but have a very small indirect gas conductance path to the outsideto minimize contamination during handling. The modules are firmly attached to acommon coldplate, and the detector/coldplate assembly is suspended by three setsof fiberglass straps for thermal isolation (see Figure 5). The coldplate assemblyis surrounded by two thin aluminum thermal shields at intermediate temperatures,each of which is surrounded by multilayer aluminized-mylar insulation.
The cryocooler is a Sunpower model M77 Stirling-cycle refrigerator, a small,high-efficiency unit modified for long-term use in orbit by the cryogenics groupat NASA’s Goddard Space Flight Center. The cooler is visible in Figure 5 as thehorizontal cylindrical object below the coldplate. It is equipped with an actively-driven balancer mass to cancel vibrations to first order. Its ‘gas bearing’ systemmeans that there is no rubbing of solid parts during operation. With 55 W ofinput power, the cooler can provide the approximately 3.5 W of cooling neededto keep the entire coldplate/detector assembly at 75 K. The cooler is coupled to thecoldplate by a flexible, S-shaped link made from 700 sheets of 0.025 mm aluminumfoil for good heat conduction with minimum transmission of vibration. Also in thethermal path between the cooler’s coldfinger and the coldplate is a rod of sapphire.This material has high thermal conductivity at low temperatures and vice-versa,and is important during cooldown and annealing (see below). As part of the thermalisolation, the outer thermal shield is actively cooled by its own separate connectionpartway down the coldfinger of the cooler, which keeps it at about 155 K. Wasteheat from the cooler is radiated to space from the back surface of the spectrometer,which is also the rearmost surface of the spacecraft. It is covered with silver teflontape. It alternately views deep space and the Earth during each orbit.
2.4. THE ATTENUATORS OR SHUTTERS
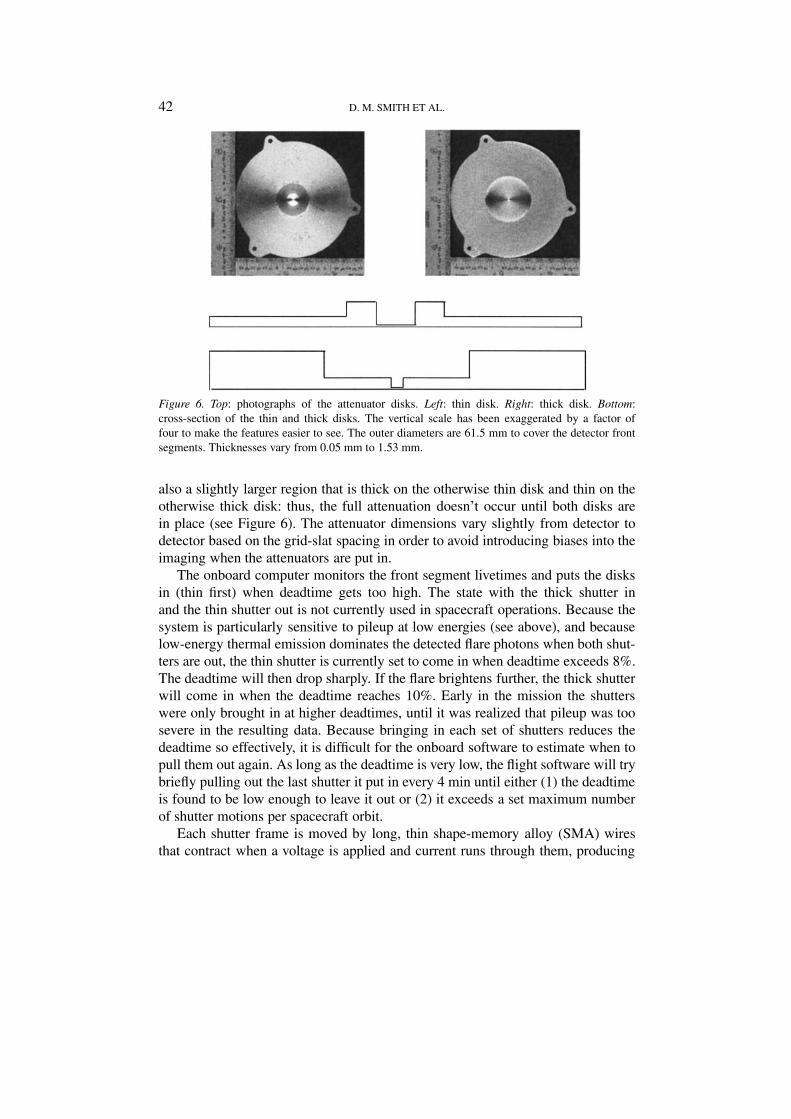
Attached to the top of the spectrometer are two lightweight, movable frames, eachof which carries nine aluminum disks that can be moved in front of the detectors(see Figure 3). These disks, manufactured to our design by Tecomet, Inc., serve asattenuators, to keep the detectors from being saturated at high counting rates. Oneset of disks is thicker than the other, but they are not uniform: each has a small,thin spot in the center so that there is always some low-energy response. There is
42 D. M. SMITH ET AL.
Figure 6. Top: photographs of the attenuator disks. Left: thin disk. Right: thick disk. Bottom:cross-section of the thin and thick disks. The vertical scale has been exaggerated by a factor offour to make the features easier to see. The outer diameters are 61.5 mm to cover the detector frontsegments. Thicknesses vary from 0.05 mm to 1.53 mm.
also a slightly larger region that is thick on the otherwise thin disk and thin on theotherwise thick disk: thus, the full attenuation doesn’t occur until both disks arein place (see Figure 6). The attenuator dimensions vary slightly from detector todetector based on the grid-slat spacing in order to avoid introducing biases into theimaging when the attenuators are put in.
The onboard computer monitors the front segment livetimes and puts the disksin (thin first) when deadtime gets too high. The state with the thick shutter inand the thin shutter out is not currently used in spacecraft operations. Because thesystem is particularly sensitive to pileup at low energies (see above), and becauselow-energy thermal emission dominates the detected flare photons when both shut-ters are out, the thin shutter is currently set to come in when deadtime exceeds 8%.The deadtime will then drop sharply. If the flare brightens further, the thick shutterwill come in when the deadtime reaches 10%. Early in the mission the shutterswere only brought in at higher deadtimes, until it was realized that pileup was toosevere in the resulting data. Because bringing in each set of shutters reduces thedeadtime so effectively, it is difficult for the onboard software to estimate when topull them out again. As long as the deadtime is very low, the flight software will trybriefly pulling out the last shutter it put in every 4 min until either (1) the deadtimeis found to be low enough to leave it out or (2) it exceeds a set maximum numberof shutter motions per spacecraft orbit.
Each shutter frame is moved by long, thin shape-memory alloy (SMA) wiresthat contract when a voltage is applied and current runs through them, producing

THE RHESSI SPECTROMETER 43
heat. There are four sets of six wires each: one set for moving each frame ineach direction. Each motion takes less than one second, including the delay forheating, and about 20 s is required for cooldown before the same set of wires canbe activated again. In addition, each frame is connected to a heavy SMA springfor an emergency backup that can pull it strongly into its default position (thin in,thick out) and lock it there. These are only to be used in the unlikely event of amechanical jam or other failure of the wire SMA system. A second set of SMAsprings was used to uncage each frame after launch.
With neither attenuator in place, the front segments view the Sun through fourBe windows and four blankets of multilayer aluminized-mylar insulation (two in-side the cryostat and one on each end of the imager tube). The blankets are thinnedbut not eliminated immediately above each detector to improve the transmission ofsolar photons. The net transmission is 10% at about 5.5 keV (see Figure 8 below).The attenuator system adds about four orders of magnitude to the dynamic rangeof microflares and flares detectable by RHESSI. In order to save onboard memoryand downlink capacity, the thin shutter is often left in place for one or more daysat a time.
2.5. OTHER SPECTROMETER SUBSYSTEMS
2.5.1. Charged Particle DetectorA solid-state silicon charged particle detector (CPD) is mounted on a strut that runspast the side of the spectrometer. The detector is a disk 1.0 mm thick and 5.64 mmin diameter, and is mounted so that it faces outward, its normal axis perpendicularto the spacecraft axis. It is encased in shielding consisting of at least 3.8 mm ofAl in all directions except for an outward-facing pinhole of diameter 1.02 mm.This detector is not configured as a spectrometer, but count rates are read out every18 s above two energy thresholds: 50 keV and 620 keV. The higher threshold iscommandable and the lower fixed. The commandable threshold may be set to anyenergy from about 20 keV (limited by noise) to 2 MeV.
Cosmic rays penetrate the shielding easily and usually trigger both thresholds.Thus the CPD can measure cosmic-ray flux, although the upper level discriminator(ULD) counter in the germanium detectors themselves provides a more accuratemeasure due to their much larger area. Electron precipitation events generallytrigger the lower threshold only. During transit of the SAA, the upper thresholdcounts mostly trapped protons and the lower mostly trapped electrons, although theupper threshold is partially contaminated by SAA electrons, which are much morenumerous, entering the pinhole. Because the detector rotates with the spacecraft itsamples the pitch-angle distribution of the particles whenever the spacecraft axisis near perpendicular to the local magnetic field. At these times, the SAA particlesare seen to have an extreme pancake distribution (circling at 90◦ to the field) asexpected for mirroring particles.

44 D. M. SMITH ET AL.
2.5.2. Beryllium ScattererSince the rear segments see no direct flare photons below 100 keV, we can use themat these low energies as a hard X-ray polarimeter (McConnell et al., 2002). There isa cylinder of beryllium 3 cm in diameter and 3.5 cm long attached to the coldplate,nestled among the rear segments near the center of the spectrometer. Above thiscylinder is a thin spot in the spectrometer shell and a hole in the grid trays, so thatsolar photons > 20 keV can reach the cylinder and scatter into the adjacent rear seg-ments. The Compton cross-section, differential in azimuth angle, is a function ofthe angle from the polarization axis. Thus, by watching the relative counting ratesin these rear segments, we will measure the direction and degree of polarization forincoming photons of roughly 20–100 keV. Simulations (McConnell et al., 2002)suggest that we will be able to detect polarization fractions as low as a few percentfor the largest flares. The key difficulty in the analysis will be photons scatteredfrom the Earth’s atmosphere, which also produce low-energy counts in the reardetectors and which also vary with the spacecraft spin, albeit with one peak perspin instead of two. Since this component will not be a perfect sinusoid, any first-harmonic power it has could be mistaken for a polarization signal. Scattering inthe coldplate and other passive materials into the rear detectors does not modulatewith the spacecraft spin, and so it only interferes with polarization measurementsby increasing the background count rate.
2.5.3. Graded-Z ShieldingIn the absence of a heavy active shield, there were several places were a smallamount of passive shielding to block hard X-rays was considered valuable. Ineach place, the material is a ‘graded-Z’ laminate of metals: from outside to inside,0.5 mm of tantalum, 1.0 mm of tin, and 0.5 mm of stainless steel. The tantalumstops most incident photons up to 100 keV. Each successive metal absorbs theK-shell fluorescence photons of the one before it. The iron K-shell photons fromthe steel are absorbed in the aluminum structures backing the shielding, and thealuminum K-shell photons are both too low in energy to trigger the detectors andmostly stopped in the aluminum itself. The combination is mostly opaque below100 keV, and fairly transparent above.
A ring of this material surrounds the side surface of the front segments to shieldthem from background photons from the Earth and space, so that they can besensitive to the faintest possible microflares. A washer-shaped ring sits above theshoulder of each of the rear segments to protect them from direct solar photons.Both these rings are visible in Figure 1(B). Finally, a larger sheet of the material,with holes for each detector and the Be scatterer, is attached to the top cryostatwall, below the attenuator assemblies. Its purpose is to minimize the number ofsolar hard X-rays which scatter in the coldplate and other cryostat materials andenter the rear segments at low energies. This serves two functions: to keep thecounting rates in the rear segments from saturating during the largest flares, and to

THE RHESSI SPECTROMETER 45
reduce the background against which polarization measurements will be made inthe rear segments at low energies.
2.5.4. Onboard Radioactive SourceRHESSI carries a tiny onboard radioactive source (5 nanocuries of 137Cs) thatmakes a line at 662 keV, far from any line expected to occur in flares or in RHESSI’svariable background. This source is so weak that it only gives a useful number ofcounts in spectra accumulated over many hours. Having a line of known intensitylets us monitor loss of narrow-line efficiency in the detectors due to radiation dam-age, which happens on a time scale of months to years. The same function can beserved by a line at 1460 keV from naturally occurring 40K in the spacecraft, but theabsolute flux of this line is not known from before launch since there was alwayssome of the isotope in the laboratory.
2.5.5. Onboard PulserThe IDPU can put regular, small pulses onto the detectors’ high voltage (HV) line.The electronics see this as equivalent to photon events. The pulse energy can betuned across the detectors’ full range, but the front/rear ratio is fixed at roughly 1:3because the HV is shared by both segments and their response is proportional totheir capacitance. Pulse rates can be commanded separately for each detector at 11discrete frequencies, spaced by a factor of two, up to 1024 Hz.
2.6. CRYOSTAT THERMAL OPERATIONS
Cooldown of the spectrometer began within a few hours of launch and lasted aboutsix days. Although the cryostat was kept on a vacuum pump until being sealed offshortly before launch, continued outgassing from the interior, particularly waterfrom the mylar thermal blankets, remained a concern. The thermal impedance ofthe sapphire rod between the coldplate and the cryocooler was included to force thefirst stage of cooldown of the detectors to proceed extremely slowly. The secondaryconnection between the cryocooler and the intermediate thermal shield has no suchimpedance, so the shield cools much more quickly. This allows all the water vaporand other volatiles in the cryostat vacuum to freeze out onto the shield first insteadof the detectors, so that we do not need to use detectors that are individually her-metically sealed. At about 200 K the cooling curves cross and the detectors becomecolder than the shield from then until they reached their operating temperature ofaround 75 K.
Once the radiation damage that has built up in the detectors is significantlyaffecting RHESSI’s energy resolution (which we predict will occur 2–4 yearsafter launch), we can anneal the detectors at high temperature to remove most ofthe effects of the damage. Although some damage is due to cosmic rays and thesecondary neutrons they generate, most of it will be caused by trapped protonsencountered when the spacecraft passes through the SAA. When the anneal cycle

46 D. M. SMITH ET AL.
begins, the detectors will be powered down and then a one-time-use SMA actuatorwill be fired to open a valve in the cryostat’s back surface to the vacuum of spaceso that gases released during the warmup can escape. Then, diode heaters on thecoldplate will be powered to begin heating it up. The cryocooler will be run at a lowpower level during the early phases of the warmup to keep the intermediate shieldcold, so that it doesn’t release any deposited water onto the detector surfaces. Thedetectors will be held near 100 ◦C for several days before being cooled down againto operating temperature.
3. Data Formats
3.1. EVENT DATA
Most of the time, whether a flare is active or not, every photon event in the RHESSIdetectors is stored in onboard memory as 4 bytes of data and is telemetered to theBerkeley ground station (or a backup station) within a day or two. Each eventcontains:
– 5 bits identifying the segment and (if a rear segment) gain setting of the event,– 13 bits for the energy channel,– the last 10 bits of the time counter, giving the event time in units of binary
microseconds (i.e., 2−20 seconds), and– 4 bits that are a partial measurement of the livetime counter (Curtis et al.,
2002).If the onboard memory starts to fill up, a decimation algorithm automatically
throws out all but one out of every N events in the front segments below a certainenergy E, with N from 2–16. E and N are functions of the remaining memoryand the position of the attenuators. Decimation in the rear segments can be com-manded as a routine way of keeping background (mostly photons from the Earth’satmosphere or the cosmic diffuse background) from filling up the memory. Oper-ating modes that have been used in flight have decimated the rear segments (withN = 3 or 4 and E = 150 keV to 450 keV) either during spacecraft night or at timeswhen RHESSI is at high magnetic latitudes and electron precipitation is common(see below). For most of the mission, front segment events have been turned offduring spacecraft night, and all events are always turned off during passage throughthe SAA.
3.2. MONITOR RATES
Monitor rates are counters that are read out every second for each of the 18 seg-ments. They include: number of resets, number of events triggering the slow-channel lower-level discriminator (LLD), number of events triggering the fast-channel LLD, number of high-energy (ULD) events beyond the scale of the ADC

THE RHESSI SPECTROMETER 47
(usually cosmic rays), and livetime. This information is normally used to check thehealth of the detectors and is not necessary for spectroscopy.
3.3. FAST RATES
Fast rate data are produced only when the count rates are very high – they are thelast line of defense against detector saturation for flares big enough to overwhelmthe normal electronics chain with both attenuators in place. The data are countrates in four broad energy bands, roughly 7–15 keV, 15–25 keV, 25–70 keV,and 70 keV and higher, with significant variation from detector to detector. Thepulses are sampled from the fast electronics chain. The rates for the three detectorsunder the finest grids (and therefore the fastest imaging modulations) are sampledat 16 kHz; the next three at 4 kHz; and the three coarsest grids at 1 kHz. Events arenot shut off when the fast rate data turn on; however, at these very high count ratesthe event data will naturally taper off due to very high deadtime.
4. RHESSI’s Performance in Flight
4.1. RESOLUTION
At low energies (below about 200 keV in the RHESSI front segments), the widthof a spectral line in a germanium detector is dominated by noise in the electronics,and is roughly constant. At higher energies, one of two noise components willdominate: the counting statistics of the electron-hole pairs, which increases as thesquare root of energy, and broadening due to trapping of electrons or holes inthe crystal, which goes linearly with energy. Electron trapping is intrinsic to thedetectors, due to impurities when they are grown. Hole trapping is the result ofradiation damage in space.
Eight of the nine RHESSI detectors have been performing well since the startof the mission, with energy resolution of about 1 keV FWHM and a low-energycutoff of about 2.7 keV in the front segments and with resolution of better than3 keV FWHM in the rear segments to over 1 MeV (see Table I). Figure 7 shows the2.223 MeV line from neutron capture on hydrogen seen by RHESSI from the X4.8flare of 23 July 2002. This is a sum of gain-corrected spectra from the rear segmentsof all the detectors except the one below grid No. 2 (‘G2’; see below). The FWHMis 4.4 keV. The line is expected to be intrinsically � 1 keV because the neutronsat the Sun thermalize before being captured, so this is a good measurement of thecurrent resolution capability of the instrument at this energy. The slight asymmetryof the line is probably due to a small amount of trapping. If interpreted as due toradiation damage, it is similar to our prediction for this phase of the mission (sixmonths after launch). The resolution of the summed rear segments at low energies(i.e., the 93.3 keV background line) is 2.5 keV FWHM, which is the contributionof the electronics plus any blurring due to imperfect gain calibration.

48 D. M. SMITH ET AL.
TABLE I
RHESSI in-flight resolution by detector segment. Resolu-tion is measured at 93.9 keV in the front segments and1117 keV in the rears.
Detector Front FWHM (keV) Rear FWHM (keV)
G1 1.13 2.90
G2 7.94 . . .
G3 0.98 2.77
G4 0.98 2.82
G5 1.47 2.73
G6 1.01 3.05
G7 3.15 2.98
G8 1.26 3.36
G9 1.19 2.27
Figure 7. The 2.223 MeV neutron-capture line from the X4.8 solar flare of 23 July 2002, as observedby the RHESSI rear segments.
The gain calibration of each segment is currently re-calculated about once aweek, using a full orbit’s worth of background data. The entire channel-to-energyconversion is represented as a purely linear fit over each energy scale (0.0–2.7 MeVfor the front segments and 0.0–2.7 and 2.7–17 MeV in the rear segments). The gainand offset of the linear relation are currently determined by finding the centroids ofthe two brightest background lines, a germanium activation line at 93.3 keV and thepositron annihilation line at 511 keV. The high degree of linearity of the electronics

THE RHESSI SPECTROMETER 49
Figure 8. RHESSI front and rear segment effective areas for photopeak absorption, summed over all9 detectors. The front-segment traces peak at lower energy, and from top to bottom represent the casewith no attenuator in, with the thin attenuator only in, and with both in. Below the rear-segment traceis the trace representing events which are split between the front and rear segment of one detector.The total of the front (no attenuator), rear, and coincidence modes is also shown.
allows this fit to produce results as good as Figure 7 even though the energy isextrapolated by a factor of four from the higher line used in the gain solution.Gain variations within one orbit and within one day are negligible thanks to thethermal isolation of the detectors and the careful design of the electronics to betemperature-independent. Gain solutions using more background lines and longerintegrations are currently being produced and may yield a slight improvement onthe already excellent results.
4.2. DYNAMIC RANGE AND EFFECTIVE AREA
With both sets of attenuators out, RHESSI can see microflares in the 3–10 keVrange that are too small to be seen by GOES (Krucker et al., 2002). With both setsin, the X4.8 flare of 23 July 2002, at its peak, caused no more than 30% deadtimein the front segments. This still requires a pileup correction for good hard X-rayspectroscopy (see below), but not a particularly difficult or nonlinear one. Thecount rate at the peak of the X4.8 flare was between 20 000 and 25 000 counts s−1 ineach front segment, close to the maximum throughput. The maximum throughputis about 20% higher when both shutters are out and the flare is dominated by softphotons that don’t trigger the pileup suppression. A count rate several times highercan be processed by the fast rate counters.

50 D. M. SMITH ET AL.
Figure 8 shows the effective area of the RHESSI array for the front segmentsalone and the rear segments alone, excluding the effects of the grids. The effectof the attenuators on the front segment effective area is also shown; their effect onthe rear segment is negligible. The curve labeled ‘F/R COINC.’ represents eventsthat leave part of their energy in each segment, adding up to the full energy. Theseevents are not yet used by the analysis software, but the adaptation, which requiresnew ways of dealing with background and gain, is in progress. Such ‘coincidence’events between segments of different detectors present even more complicationsand add less added effective area, so they will be addressed only after front/rearcoincidences have been incorporated.
The grids reduce the effective areas shown by factors strongly dependent onenergy and the offset of the flare from the imaging axis, ranging from roughly 4to 6 below 100 keV. The response of the spectrometer is generated by GEANT3, ahigh-energy photon and particle transport code that is used to generate the responsematrix of the instrument (see below). Before flight, the GEANT3 performance wascalibrated by taking spectrometer data in the laboratory using radioisotopes withlines from 3.7 keV to 6.1 MeV, placed in many positions above and around thespectrometer. The laboratory data were compared with GEANT3 simulations ofthe same configurations, and the detectors’ internal segmentation boundaries inGEANT3 were adjusted until the GEANT3 results matched the data.
Although the effective areas of the front and rear segments in Figure 8 crossat about 250 keV, this is not where the sensitivity of the two segments crosses.Because the background in the rear segments is a factor of 10 higher (see below),the front segments are more sensitive in a background-dominated situation up toabout 800 keV.
4.3. BACKGROUND
RHESSI is not designed to be a low-background instrument. Heavy shielding wasnot possible within the Small Explorer weight constraints. A launch into an equa-torial orbit was not available, which would have reduced every background com-ponent except cosmic diffuse radiation by minimizing cosmic-ray exposure andeliminating exposure to trapped protons in the South Atlantic Anomaly (SAA).Fortunately, solar flares are bright, and most RHESSI flare science will still bedone using data that are source-count limited rather than limited by statisticalfluctuations in the background.
Figure 9 shows the background in the RHESSI front and rear segments. Thefront spectrum is shown both with the segment operated on its own and in antico-incidence with the rear segment. The latter mode is similar to ‘phoswich’ detectorsmade of two layers of scintillator, i.e. the rear segment serves as a closely-placedanticoincidence shield to reject events that Compton scatter into or out of the frontsegment and charged-particle events. At most energies continuum is dominant,which is typical for an unshielded instrument. The continuum is comparable to

THE RHESSI SPECTROMETER 51
Figure 9. Typical RHESSI background spectra, accumulated over 2.5 hr. The three solid traces, topto bottom, are the backgrounds in the rear segments, the front segments, and the front segmentsusing front/rear anticoincidence (‘phoswich mode’). The dotted lines are pre-flight predictions ofthe background that included continuum from the cosmic diffuse background and from cosmic raysinteracting in the Earth’s atmosphere and in the spacecraft.
preflight estimates (dotted lines in Figure 9). In the simulations that producedthe estimates, the dominant background component is continuum from the Earth’satmosphere. Below about 100 keV in the rear segments, cosmic diffuse emissiondominates. Prompt cosmic-ray interactions with the spacecraft, induced radioac-tivity of spacecraft materials and β-decays in the detectors also contribute.
Most of the prominent lines in the background spectra are due to the activationof the germanium detectors themselves (e.g., 10, 54, 67, 93, and 198 keV). Thebrightest higher-energy line, however, is the positron-annihilation line at 511 keV.Much of this comes from the atmosphere, but there is a significant contribution dueto the activation of spacecraft materials: immediately after RHESSI exits the SouthAtlantic Anomaly (SAA), the 511 keV line flux is several times its average valuefor orbits that don’t include the SAA, and the excess decays over the next hour orso.
The three primary sources of variation in the RHESSI background are passesthrough the SAA (several a day on successive orbits), smooth modulations dueto changes in geomagnetic latitude (and therefore cosmic-ray flux) over each or-bit, and occasional periods of electron precipitation from the outer radiation beltwhen the spacecraft is at its highest geomagnetic latitudes (about 40–50◦). Brems-
52 D. M. SMITH ET AL.
strahlung produced by these electrons in the spacecraft and the Earth’s atmospherecan temporarily increase the background rate by more than an order of magnitudeat times. These events can be distinguished from solar flares because they appearmore strongly in the larger rear segments, whereas flares always produce morecounts in the front segments. In addition, the CPD counts electrons at a significantrate in all but the smallest precipitation events.
4.4. INSTRUMENTAL ANOMALIES
4.4.1. Detector DropoutsOn orbit, we find that each detector segment can spontaneously shut off for a briefperiod ranging from tens to hundreds of milliseconds. These dropouts occur up toonce every few seconds in the front segments and generally much less often in therear segments, although this is reversed in detector G5. The cause is still underinvestigation, but we expect it is a response of the electronics to heavy cosmic-ray nuclei, which leave more energy in the detector than anything available onthe ground during pre-flight testing. This phenomenon does not have a significanteffect on spectroscopy, since it is energy independent, nor on imaging, since thedropouts do not correlate with the count-rate modulations used to reconstruct im-ages. It does have an effect on photometry and lightcurves, and this is addressedby the data-analysis software, which can recognize the dropouts and compensatefor them by adjusting the livetime accordingly. During periods when the count rateis relatively low, dropouts are distinguished from merely quiet moments becausethey always begin with a preamplifier-reset event.
4.4.2. Individual Detector AnomaliesShortly after its high voltage was turned on, detector G2 suffered from a breakdowneither on the rear surface of the crystal or somewhere along its high voltage circuit,such that it can no longer be operated above about 2400 V. At this voltage, theinnermost part of the crystal is not depleted, and therefore the contact break on theinner bore (see Figure 1(A)) is not seen: G2 operates as a monolithic detector, withall events anywhere in the crystal going through the front segment electronics.In addition to losing the various advantages of segmentation, this also results inextremely noisy operation: energy resolution of about 10 keV FWHM and a low-energy cutoff closer to 20 keV than the 2.7 keV of most of the front segments.Therefore this detector should not be used for spectroscopy, although it can still beused for imaging from about 20 keV to the energy at which its grids, which are thesecond-finest of the nine, become transparent.
Detector G8, which is located just a few centimeters from the aft spacecraftantenna, becomes noisy when that antenna is switched on. This can occur severaltimes a day for a few minutes at a time during contacts with the spacecraft. Adatabase of times when this antenna is active is on line, but has not yet beenintegrated with the data analysis software.

THE RHESSI SPECTROMETER 53
Finally, detector G7 has a slight problem with its front segment signal contact,which causes its energy resolution to be degraded from 1 keV to 3 keV FWHMand its energy threshold to be raised from about the normal 2.7 keV to 7 keV. Thisbehavior has been understood and unchanged since before launch.
4.4.3. Spectral ArtifactsA very small fraction of events near or above 3 MeV that should be analyzedwith the high-energy (low-gain) range of the rear segments do not trigger the gainshift in the fast channel. These pile up in the top 64 channels (8128–8191) of thehigh-gain scale, and produce a spectral artifact there. A similar artifact appearsin the 64 channels preceding the halfway point of the spectrum (i.e., channels4032–4095) (Share et al., 2002). Routines to automatically eliminate these channelranges for each detector will be implemented but are not yet in place.
4.4.4. Image EventsWhen the clouds of electrons and holes liberated by a gamma-ray event movethrough the detector, they create induced charges on the electrodes of the segmentin which they are moving. The change in time of this induced charge is the currentpulse that is amplified and integrated by the electronics to become the detectedevent. However, they also induce charges on the electrodes of the empty segment.The difference is that this image charge reverses sign in the empty segment as theclouds approach the electrode of the segment in which they are actually moving.The result is that the image signals (current versus time) in the empty segment arebipolar in shape and integrate to zero charge.
The RHESSI electronics, however, do not integrate the signals for an infinitetime. Therefore a small amount at the very end of each pulse is not counted. Sinceit is the negative part of the bipolar signal in an empty segment that comes last,the result is that there is a very small, positive residual from the bipolar signal: inother words, a 1 MeV event detected in one segment will create a simultaneous (butfalse) event in the other segment of a few keV. Fortunately, the timing of an imageevent is a couple of microseconds different from that of a front/rear coincidencedue to Compton scattering, so the image events can be weeded out of the data onthe ground without eliminating Compton scattered events, if that is desired.
5. Spectral Data Analysis
Spectral analysis is an inverse problem that begins with a spectrum of counts perspectrometer channel and seeks to recover the spectrum of photons per energyinterval initially incident on the spacecraft. Figure 10 is a block diagram of thedata analysis process for RHESSI spectra. The RHESSI data analysis software iswritten to be part of the SolarSoft system (Freeland and Handy, 1996), and, like allthe data, is publicly available without a proprietary period. Spectral analysis in par-

54 D. M. SMITH ET AL.
Figure 10. Flow chart of a spectroscopy analysis. ‘Advanced’ features are needed only for a fewflares, mostly the highest-energy ones.
ticular is accomplished with the SPEX spectral-inversion code (Schwartz, 1996),which has heritage from the Burst and Transient Source Experiment (BATSE) onthe Compton Gamma-Ray Observatory. It would be beyond the scope of this paperto begin a tutorial on the use of the software, but it is worthwhile to summarize thesteps that are needed for an accurate spectral result. As the software evolves, moreand more of this will become automated and transparent to the user.
5.1. GAIN, LIVETIME, AND BACKGROUND
The first stage of analysis is to correct for gain drift and deadtime. Even ourpreliminary gain analysis is yielding excellent results (see Figure 7) due to thehigh linearity of the electronics and the narrow, easily identified background lines.The deadtime correction routines start with the livetime counter in the electron-ics, correct for the double rejection of piled-up events, and compensate for datadropouts.
The next task is to identify and subtract background. At present this is mosteasily done by selecting data intervals just before and just after the flare and sub-

THE RHESSI SPECTROMETER 55
tracting the spectra in those intervals from the spectrum at the time of interest(whether this is a small part of the flare or its entire duration). When the flare islong, this can be inaccurate, since the background varies significantly over tens ofminutes. The results are improved by SPEX’s ability to take several such intervalsbefore and after the flare and fit a low-order polynomial to the background variationin each energy channel. At low energies, most flares are bright enough that thebackground is small compared to the flare flux, and this method of subtraction issuitable.
For a very few flares, more precise methods of background estimation are desir-able. These include very long flares and flares with faint hard emission or faintgamma-ray lines. We are developing several additional background-subtractionoptions, including: (1) using as background the periods exactly 15 orbits (approx-imately one day) before and after the flare interval, since at these times most ofthe parameters that control the background had the same value as during the flare;(2) for flares that do not extend much above 50 keV, using the simultaneous back-ground in the rear segments to predict the background in the front segments; and(3) training a neural network to produce a predictive model of the background atany time given a few parameters as input (such as geomagnetic latitude, time sincelast passage through the SAA, etc.).
5.2. RESPONSE MATRIX
Once gain, livetime and background are accounted for, a series of instrumentaleffects that together constitute the ‘response matrix’ of the instrument to flarephotons must be removed. There are many effects that modify the input spectrum,including:
– absorption in the mylar blankets, cryostat windows, and grids;– Compton scattering into and out of the detectors;– Compton scattering off the Earth’s atmosphere, which can dominate the flare
count rate in the rear segments below 100 keV;– noise in the electronics;– resolution degradation due to radiation damage; and– the low-energy cutoff imposed by the electronics.All these effects are accounted for when the analysis software creates a response
matrix. Each of these effects contributes either to the diagonal elements of thematrix (i.e. the efficiency of the instrument for detecting photons at their properenergy) or to the off-diagonal elements (moving photons from their true energy toanother energy, usually lower), or to both.
When the user is only interested in isolated gamma-ray lines, the response is justthe efficiency for photopeak detection, and the conversion from counts to photonsis done immediately by dividing the count spectrum by the diagonal terms of theresponse matrix. This is also adequate for hard X-ray flares with no significantcomponent above 100 keV, since the response of the front segments below this

56 D. M. SMITH ET AL.
Figure 11. RHESSI response matrices: photopeak to Compton-continuum ratio versus energy. Thecontinuum contains every simulated photon which leaves less than its full energy but more than 3 keVin the detectors.
point is dominated by complete absorption, not scattering. Figure 11 shows theratio of photopeak to partial-energy (Compton-scattered) detections in RHESSIversus energy. Since most flare spectra are steeply falling, the measured count ratein any given energy band is usually dominated by photopeak counts up to an energywell beyond 100 keV. One exception is at the lowest energies (below 15 keV)when one or both of the shutters are in. In this case, the true low-energy countsare strongly reduced and the spectrum can be dominated by non-photopeak countscreated when a 15–25 keV photon is photoelectrically absorbed in the germaniumbut the K-shell fluorescence photon (about 10 keV) escapes.
For studying low energies with the shutters in, or for studying continuum andbroad-band emission at high energies, the non-diagonal response must be accountedfor. This can be done automatically by SPEX using forward-folding. The user spec-ifies a model form for the flare spectrum, which can be a combination of simplefunctions (power laws, Gaussians, etc.) and physics-based spectral forms (e.g., a setof known nuclear lines from a particular element bombarded by energetic protons,or a thin-target bremsstrahlung spectrum from a monoenergetic electron beam).The software will then multiply this spectrum by the full response matrix, checkthe goodness of fit to the observed count spectrum, and repeat the process, varyingthe parameters of the input model until the best fit is found. The output of thisprocess is either the best-fit parameters themselves, or else a spectrum created bymultiplying the observed count spectrum by the ratio of the model photon spectrumto the model count spectrum.
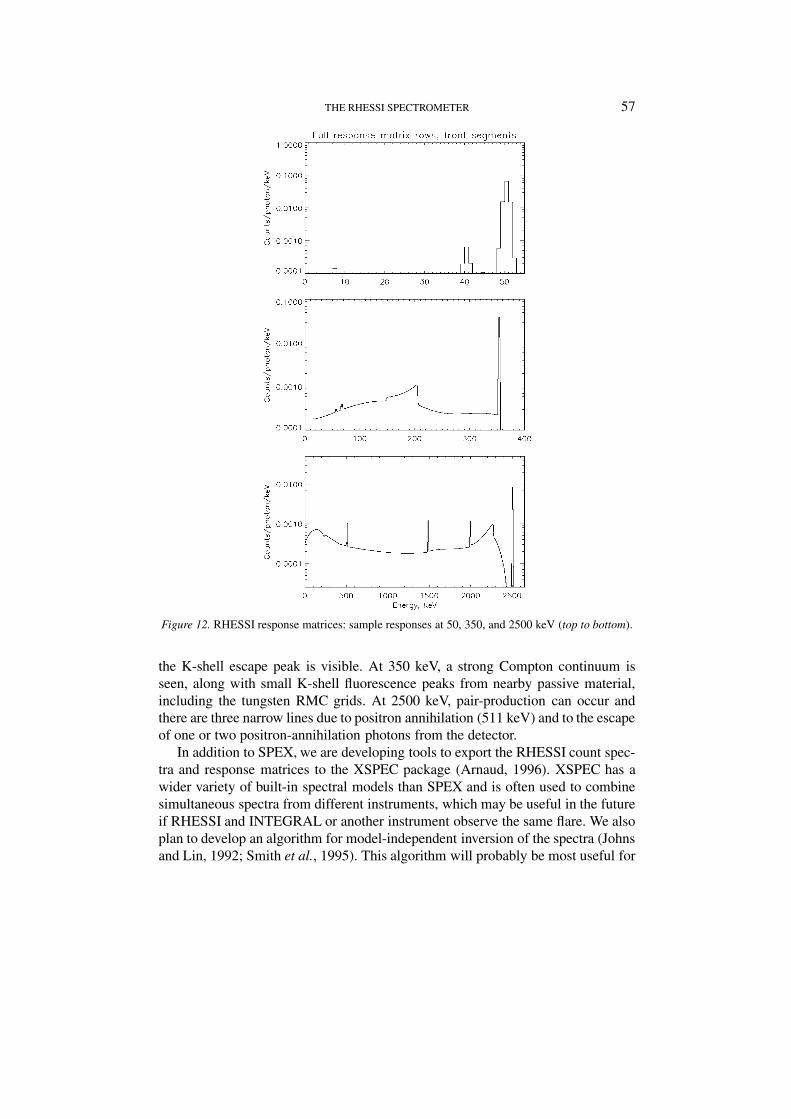
Figure 12 shows the modeled RHESSI front-segment response to input photonsat three energies: 50, 350, and 2500 keV. At 50 keV, the photopeak dominates but
THE RHESSI SPECTROMETER 57
Figure 12. RHESSI response matrices: sample responses at 50, 350, and 2500 keV (top to bottom).
the K-shell escape peak is visible. At 350 keV, a strong Compton continuum isseen, along with small K-shell fluorescence peaks from nearby passive material,including the tungsten RMC grids. At 2500 keV, pair-production can occur andthere are three narrow lines due to positron annihilation (511 keV) and to the escapeof one or two positron-annihilation photons from the detector.
In addition to SPEX, we are developing tools to export the RHESSI count spec-tra and response matrices to the XSPEC package (Arnaud, 1996). XSPEC has awider variety of built-in spectral models than SPEX and is often used to combinesimultaneous spectra from different instruments, which may be useful in the futureif RHESSI and INTEGRAL or another instrument observe the same flare. We alsoplan to develop an algorithm for model-independent inversion of the spectra (Johnsand Lin, 1992; Smith et al., 1995). This algorithm will probably be most useful for

58 D. M. SMITH ET AL.
Figure 13. Pileup correction at modest deadtime with the thin shutter in place. Top: count spectrabefore and after pileup correction. Bottom: ratio of corrected to uncorrected spectrum as a functionof energy.
spectra that are dominated by the continuum, not lines, but that extend to highenough energies that simply dividing by the efficiency is insufficiently accurate.
5.3. PILEUP
The pileup correction is the most difficult to implement. It is an off-diagonal effectin that it redistributes counts to different energies, but, unlike Compton scattering,its effect is also non-linear: the contribution of 100 keV photons to the piled-upspectrum depends not only on the number of 100 keV photons coming in, but alsoon the shape of the rest of the spectrum as well. For this reason it cannot be madepart of the response matrix. A full, correct treatment of pileup requires it to betreated as a separate stage of forward folding, occurring after the model spectrumhas been folded through the response matrix. The (real) background must be addedto the forward-folded model flux before pileup is simulated. Furthermore, since thedeadtime and degree of pileup will vary rapidly as the grids modulate a bright flare,working with the average count rate to estimate pileup is only an approximation.For imaging in particular, future livetime and pileup corrections will have to befully time-dependent down to the millisecond scale.
These refinements are still far in the future for the RHESSI analysis software,but in the meantime we are implementing an approximate pileup correction that

THE RHESSI SPECTROMETER 59
can be applied early in the analysis flow (see Figure 10) without the need of aspectral model. Figure 13 shows the effect of that pileup correction on a spectrumtaken with the thin shutter in and an average of 12.4% deadtime. As we notedabove, under the current flight software version the thick shutter would normallybe brought in to cut down on pileup at 10% deadtime.
Acknowledgements
The authors would like to thank Gerald Share of the Naval Research Laboratoryfor providing a valuable external perspective and advice throughout the devel-opment process and since launch. We would like to recognize our colleagues atthe Space Sciences Laboratory who participated in calibration and testing of thespectrometer: engineers Peter Harvey (also the RHESSI Project Manager) and JaneHoberman, technician Michelle Galloway, and students Daniel Main, Albert Shih,Lewis Hyatt, Eunyong Cho, Scott Pollack, Mark Chu, and Carmel Levitan. Finally,we would like to thank the technicians, machinists, and others who helped build theRHESSI spectrometer.
The instrument could not have been what it is without the contributions of ourcolleagues who passed away before RHESSI was launched: Reuven Ramaty andNatalie Mandzhavidze, whose work on gamma-ray line emission in flares inspiredits high-resolution design, and Robert D. Campbell, who designed its particle de-tector and worked tirelessly to characterize and calibrate its germanium detectors.We remember them with gratitude and respect.
References
Arnaud, K.: 1996, in G. Jacoby and J. Barnes (eds.), Astronomical Data Analysis Software andSystems V, Astronomical Society of the Pacific, San Francisco, U.S.A., p. 17.
Curtis, D. W. et al.: 2002, Solar Phys., this volume.Freeland, S. L. and Handy, B. N.: 1998, Solar Phys. 182, 497.Hull, E. L.: 1998, Ph. D. dissertation, Indiana University, U.S.A.Hurford, G. et al.: 2002, Solar Phys., this volume.Johns, C. M. and Lin, R. P.: 1992, Solar Phys. 137, 121 (Erratum: Solar Phys. 142, 219).Koenen, M., Bruckner, J., Korfer, M., Taylor, I. and Wanke, H.: 1995, IEEE Trans. Nucl. Sci. 42,
653.Krucker, S., Christe, S., Lin, R.P., Hurford, G.J., and Schwartz, R.A.: 2002, Solar Phys., this volume.Landis, D. A., Cork, C. P., and Goulding, F. S.: 1982, IEEE Trans. Nucl. Sci. 29, 1125.Lin, R. P. and Schwartz, R.: 1987, Astrophys. J. 312, 462.Lin, R. P. et al.: 2002, Solar Phys., this volume.McConnell, M.L., Ryan, J.M., Smith, D.M., Lin, R.P., and Emslie, A.G.: 2002, Solar Phys., this
volume.Schwartz, R. A. 1996, ‘Compton Gamma Ray Observatory Phase 4 Guest Investigator Program:
Solar Flare Hard X-ray Spectroscopy,’ Technical Report, NASA Goddard Space Flight Center.
60 D. M. SMITH ET AL.
Share, G. H., Murphy, R. J., and Ryan, J.: 1997, in C. D. Dermer, M. S. Strickman, and J. D. Kurfess(eds.), Proceedings of the Fourth Compton Symposium, American Institute of Physics, Woodbury,New York, U.S.A., p. 17.
Share, G. H. et al.: 2002, Solar Phys., this volume.Smith, D. M. et al.: 1995, J. Geophys. Res. 100, 19675.Smith, D. M. et al.: 2000, ‘Extra-Solar Astrophysics with the High-Energy Solar Spectroscopic
Imager (HESSI),’ AIP Conf. Proc., The 5th Compton Symposium, AIP New York, AIP), pp. 510,671.
Smith, D. M. et al.: 2002, ‘Non-solar Astronomy with the Reuven Ramaty High-Energy SolarSpectroscopic Imager (RHESSI),’ SPIE Conf. Proc. 4851, in press.
Vestrand, W. T. et al.: 1999, Astrophys. J. Suppl. 120, 409.Yoshimori, M. et al.: 1994, Astrophys. J. Suppl. 90, 639.


![RHESSI arXiv:0709.1963v3 [astro-ph] 18 Dec 2007](https://img.pdfslide.net/doc/110x75/6199d32546f4a65fd6604a10/rhessi-arxiv07091963v3-astro-ph-18-dec-2007.jpg)