Embed Size (px)
Citation preview
Journal of Marine Research 70 505ndash558 2012
The rise and fall of Crassostrea virginica oyster reefsThe role of disease and fishing in their demise and a vignette
on their management
by Eric N Powell12 John M Klinck3 Kathryn Ashton-Alcox1 Eileen E Hofmann3
and Jason Morson1
ABSTRACTWe describe a model designed to simulate the shell carbonate budget of an oyster reef We identify
five parameters descriptive of basic characteristics of the shell carbonate budget of a reef that limitsimulation accuracy Two describe the TAZ (taphonomically-active zone) and the distribution of shellcarbonate within it One is the taphonomic rate in the TAZ Two determine the volume contribution ofshell carbonate and the taphonomic loss rate within the reef framework For Mid-Atlantic estuariesmodel simulations suggest that reef accretion only occurs if oyster abundance is near carrying capacitySimulations further suggest that reef accretion is infeasible for any estuarine reach where dermo is acontrolling influence on population dynamics We forecast that the oyster disease dermo is a principalantagonist of reef persistence through its ability to limit shell addition
Model simulations suggest that reefs with inadequate shell addition lsquoprotect themselvesrsquo by limitingthe volumetric content of shell carbonate in the TAZ Thus a dominant process is the transientexpansion and contraction of the shell resource otherwise termed cultch within the TAZ rarelyexpanding enough to generate reef accretion yet rarely contracting enough to foster erosion of thereef framework The loss of framework carbonate thusly is curtailed during periods when the surficialshell layer deteriorates Stasis a reef neither accreting nor eroding is a preferred state Reef recessionrequires an inordinately unbalanced shell carbonate budget Results strongly argue for expandedfocus on the dynamics of the shell resource within the TAZ as this likely fosters a feedback loop withabundance through recruitment serves as the protective layer for the reef during periods of reef stasisand establishes the threshold conditions for reef accretion and recession Model simulations suggestthat attaining maximum sustainable yield and maintaining a biomass capable of supporting sufficientshell production for reef accretion are irreconcilable goals over a large component of the oysterrsquosrange Reef stasis would appear to be the only achievable restoration goal in Mid-Atlantic estuarinereaches where dermo holds sway Exploitation rates much above 5 of the fishable stock per yearrestrict availability of surficial shell and foster reef erosion In contrast in the Gulf of Mexico at thehigh-productivity end of the oysterrsquos range an enhanced fishery and reef accretion may be compatiblegoals
1 Rutgers University Institute of Marine and Coastal Sciences and The New Jersey Agricultural ExperimentStation Haskin Shellfish Research Laboratory Port Norris New Jersey 08349 USA
2 Corresponding author email erichsrlrutgersedu3 Center for Coastal Physical Oceanography Department of Ocean Earth and Atmospheric Sciences Old
Dominion University Norfolk Virginia 23508 USA
505
506 Journal of Marine Research [70 2-3
1 Introduction
Once upon a time East-coast and Gulf-coast estuaries were replete with oyster reefs (egMoore 1907 1911 Powell et al 1995a Mann 2000 Woods et al 2005 Smith et al2005) They influenced perhaps determined such estuarine characteristics as phytoplanktoncontent (Guyondet et al 2005 Cerco and Noel 2007) trophic food-web dynamics (Gottlieband Schweighofer 1996 Breitburg and Fulford 2006 Coen et al 2007) hydrodynamics(Lenihan 1999) fetch (Newell and Koch 2004) and characteristics of the salinity gradient(Galtsoff 1931 Gunter 1972) A large portion of these reefs have disappeared or are todayin decline (Beck et al 2009 but see Powell et al 1995a Power et al 2010) Their lossstems from a host of reasons shell dredging (Marshall 1954 Woods et al 2005 Powellet al 1995a) overfishing (Rothschild et al 1994 Jackson et al 2001 Jordan and Coakley2004) and environmental change (Wilber 1992 Powell et al 1995a Smith et al 2005)being significant contributors depending on local circumstances A few of these processesinvolve physical removal of shell (eg shell dredging and to a certain extent harvest)Most however contribute to the lowering of abundance that ultimately results in a declinein the rate of shell addition to the reef
Oyster shell is not a permanent resource (Powell et al 2006 Mann et al 2009) Ratheroyster shell suffers the vicissitudes of taphonomy poorly and as a consequence half-livesfor oyster shell are typically no longer than decadal (Powell et al 2006) Consequently theaddition of copious quantities of shell are required yearly to counterweigh the persistentloss of shell (Powell and Klinck 2007 Mann et al 2009) Over much of the worldrsquos oysterhabitat today shell loss very likely exceeds shell gain This is certainly true for the largerEast-coast estuaries of the US Chesapeake Bay (Mann et al 2009 Harding et al 2010)and Delaware Bay (Powell and Klinck 2007)
Not inconsequential in the demise of oyster populations in the Mid-Atlantic region ofthe US is the impact of two diseases MSX and dermo Both depress abundance and byshortening generation time (Mann et al 2009 Powell et al 2011c this issue) also limitthe quantity of shell added by the deaths they cause (Mann et al 2009) The impacts ofthese two diseases on the oyster stocks is legendary (eg Andrews 1979 1988 Ford andHaskin 1982 Ford 1996 1997 Ray 1996) The impact on the oysterrsquos habitat the reefitself has received minimal attention However the impermanence of oyster shell impliesthat shell production on oyster reefs may be a key determinant of the long-term continuityof the habitat and the oyster resource
In this contribution we first describe a model designed to simulate the shell carbonatebudget of an oyster reef Hereafter we will use the term lsquocarbonate budgetrsquo to distinguishthe reef budget that we model from the term lsquoshell budgetrsquo as applied to the surficialshell resource by previous authors (eg Powell and Klinck 2007) We acknowledge theambiguity that the term lsquocarbonatersquo entails in that the term can be applied to the dissolvedion or used as in this instance as a shorthand for the calcium carbonate composite of themolluscan shell The model we describe builds on earlier formulations by Powell et al(2006) and Powell and Klinck (2007) and the creative applications by Mann et al (2009)
2012] Powell et al Rise amp fall of Crassostrea virginica oyster reefs 507
and Southworth et al (2010) The model explicitly evaluates the carbonate budget for thesurficial living reef but also includes parameterization for the long-term accretion or erosionof the reef framework upon which the living reef rests In proposing this model we proffera set of parameters that we posit are key regulators of this system Following this we applya gene-based population dynamics model to examine the influence of dermo disease on thepopulation and the reef examining the impact of onset of the disease upon a naiumlve populationand the subsequent fate of the population and the reef as the oyster attempts to adapt tothe disease through the development of disease resistance In doing this we build on twoprevious examinations of this subject by Powell et al (2011c this issue) We next considerthe influence of fishing an activity postulated as causative for a substantial proportion ofthe demise of the oyster in some East-coast estuaries (Rothschild et al 1994 Jordan et al2002 Jordan and Coakley 2004 Woods et al 2005) Finally we reconsider the wisdomof reef restoration and shell-planting programs building on previous discussions by Mannand Powell (2007) and Mann et al (2009)
2 Methods
a Reef clumpiness
Ruminations on reef clumpiness benefit from data obtained from stock surveys inDelaware Bay during 2005 to 2009 Survey design is detailed in Fegley et al (2003) andPowell et al (2008a) Clumps are defined as independent carbonate concretions includingsingle oysters single shells or single boxes but often comprising aggregates of live oystersshells andor boxes cemented into single conglomerates As part of the survey protocolthe ten largest clumps were identified each set on a flat surface as it may have sat on thebottom of the bay and the longest length and height measured with digital calipers As theorientation of the clump in situ was frequently ambiguous following earlier conventions(eg Powell et al 1987a 1987b Wilson et al 1988) the two measurements were aver-aged for analyses to get a single clump dimension that was assumed to represent its verticalexpression in situ
b The reef carbonate-budget model
i Perspective The reef carbonate-budget model divides the reef into two vertically-oriented components or tiers (Fig 1) The surficial tier includes the living communityand the surficial shell typically termed cultch (Gunter 1938 1972 Soniat et al 1991Bushek et al 2004) both of which provide substrate for larval settlement The subsurfacetier is the compacted aggregated carbonate mass that represents the reef framework Thedifferentiation of the surficial tier from the subsurface tier is premised on the recognition that(a) shell is added only on the surface and (b) the taphonomic processes degrading carbonateproceed at a much higher rate on shell exposed at the sediment-water interface if for noother reason than the fact that boring bionts are most plentiful there We define the TAZ(taphonomically-active zone ndash Davies et al 1989) as synonymous with the surficial tier
508 Journal of Marine Research [70 2-3
Figure 1 Stylized cross-section of an oyster reef in accretionary (above) and erosional (below) modeOn the left ordinate is the packing coefficient showing the relationship of p(z) with its defined rangebetween MaxPack and MinPack On the right ordinate are the depth determinants in the TAZ withz = 0 marking the depth of final burial dividing the surficial and subsurface tiers and z = Tmax
marking the upper boundary of the TAZ A third value z = Tmin on the lower depiction marks thepoint at which erosion begins S shell input from death of living oysters λ taphonomic loss
2012] Powell et al Rise amp fall of Crassostrea virginica oyster reefs 509
thus the TAZ is a zone that includes the live oysters the surficial clumps and disaggregatedshells and no more than the upper few centimeters of the compacted reef The boundarybetween the two tiers can be denoted the depth of final burial (DFB) although the finalityof burial is determined over the long-term by the accretionary or recessionary status of thereef (Fig 1)
The two tiers differ in a number of other ways First the porosity of the subsurface tieris assumed to be low and invariant with depth In contrast the surfacial tier has a complexvertical structure in which some fraction of the total carbonate is housed in clumps shell andlive oysters that rise above the substrate surface (Moore 1911 Powell and Ashton-Alcox2004 Powell et al 2007 Stiner and Walters 2008) The fraction of the volume occludedby shell declines with height above the bottom as the number of clumps of increasingsize and vertical extent necessarily diminishes with increasing clump size This structureestablishes a zone of defined vertical extent wherein much of the shell is exposed to a rangeof taphonomic processes operating at a relatively rapid rate
The two tiers interact In an accreting reef some carbonate becomes buried below the TAZas carbonate addition exceeds loss resulting in an incremental increase in reef frameworkthickness ultimately yielding a geological mass rising above the surrounding soft sedimentIn a degrading reef as shell addition lags behind shell loss some shell carbonate onceburied becomes exposed4 The burial of shell below the TAZ is a common componentof taphonomic models (Powell 1992 Olszewski 2004 Tomašovyacutech et al 2006) thereverse in which shell is re-exposed though a well-known phenomenon in soft sediments(eg Aller 1995 Powell and Davies 1990 Best and Kidwell 2000 Olszewski 2004)has not routinely been modeled (Powell 1992) and remains unconsidered in reef carbonatebudgets However we know from direct observation that reefs can recede in height and thatthis recession is unexplained by regional sedimentation indeed loss of relief may occurcommonly and this requires erosion of the reef framework (eg Haven and Whitcomb1983 Woods et al 2005 Mann et al 2009)
ii The surface tier (TAZ) ndash relationship of complexity shell volume and vertical reliefWe define a vertical gradient in oyster shell density as the volume of shell occupying thetotal volume at any height above the DFB This packing coefficient P varies verticallywithin the surficial tier or TAZ such that the volume fraction occupied is highest at its baseand lowest at the height of the highest routinely-encountered clump The fraction of theTAZ volume occluded by shell is a nonlinear function of the maximum volume occupiedby shell at the interface with the subsurface tier the DFB at a position defined as z = 0and the distance z above the base of the TAZ Thus
z = a(MaxPack minus P)b (1)
where a and b are shape parameters determining the relationship and MaxPack is the volumefraction occupied by carbonate at the base of the TAZ
4 We distinguish the process of reef degradation from burial of the reef due to the accumulation of unconsoli-dated sediment at a rate exceeding the rate of reef accretion
510 Journal of Marine Research [70 2-3
Eq (1) can be reorganized so that the vertical extent of the TAZ is described in termsof the differential between the packing coefficient at the base of the TAZ MaxPack andthe packing coefficient at the apex of the TAZ MinPack where this apex is defined as theheight above the bottom z = Tmax of the highest routinely-encountered oyster clump
Tmax = a(MaxPack minus MinPack)b (2)
From Eq (2)
a = Tmax
(MaxPack minus MinPack)b(3)
which permits re-expression of Eq (1) as
z = Tmax
(MaxPack minus P
MaxPack minus MinPack
)b
(4)
This relationship can be inverted to give
P(z) = MaxPack minus(
z
Tmax
) 1b
(MaxPack minus MinPack) (5)
Eq (5) generates a hypothetical distribution of shell in the TAZ that can take a multitudeof specific forms depending on the value of b (Fig 2) Note that most of these curves expressan assumed nonlinear reduction in volume contributed by shell with height above the bottomsuch that shell rapidly becomes sparse over the first few cm of relief This relationship willbe considered more thoroughly in a later section
The integral of Eq (5) is the total mass of shell carbonate within the TAZ occupyinga specified area of the bottom stipulated by convention as 1 m2 hereafter Thus the totalmass of shell carbonate M in g mminus2 is
M = ρc
int Tmax
z=0=DFBP(z)dz
= ρcTmax
(MaxPack minus b
b + 1(MaxPack minus MinPack)
)(6)
where ρc is the density (g mminus3) of oyster shelliii The reef carbonate budget ndash surface and subsurface tier A dynamic (time-dependent)
carbonate-budget model for an oyster reef requires relationships for the surficial carbonate inthe TAZ MT and the buried carbonate below the DFB comprising the reef framework MF Throughout the subscript T will be used for processes in the surficial tier or TAZ and thesubscript F for processes in the subsurface tier or reef framework Each tier loses carbonateby taphonomic processes at rates defined by λT and λF (Fig 1) Shell is transferred acrossthe boundary between the TAZ and the reef framework based on the burial rate αTF and theerosion rate αFT In addition a quantity of carbonate S (in g yrminus1) is added to the TAZ each
2012] Powell et al Rise amp fall of Crassostrea virginica oyster reefs 511
Figure 2 Fraction of volume occupied by carbonate as a function of position within the TAZ for fivepossible values of b with Tmax the height of the highest clump set at 10 cm
year as determined by the number and size frequency of oysters dying The relationship ofoyster anterior-posterior length L in mm to shell mass SM in g is obtained from Powelland Klinck (2007)
SM = 000041 times L270 (7)
thus
S =dsum
i=1
SMi (8)
where d is the number of oysters dying each yearThe two relationships governing the addition to and loss of carbonate from the surficial
(TAZ) and subsurface (reef framework) tiers are then
d MT
dt= minusα
T FMT + α
FTMF minus λT MT + S (9)
andd MF
dt= α
T FMT minus α
FTMF minus λF MF (10)
512 Journal of Marine Research [70 2-3
where the first term on the right-hand side is the transfer from the surface (TAZ) to thesubsurface (reef framework) tier the second term is the erosive movement of buried car-bonate into the surficial tier and the third term is the loss of shell by taphonomic processesThe fourth term in Eq (9) is the addition of shell to the TAZ through the deaths of livingoysters
iv The transfer rules ndash surface harr subsurface For the reef to grow the subsurfaceframework must increase in thickness This requires burial of carbonate beneath the TAZ[Eq (10)] However if conditions change and the reef enters a period of negative carbonatebalance the reef framework may begin to erode moving buried carbonate back into theTAZ [Eq (9)] The model is based on two assumptions about the processes of accretion anderosion of the subsurface tier First these processes are determined by the distribution ofcarbonate in the TAZ healthy growing reefs have a degree of vertical complexity due to thegrowth of oyster clumps and the filling of voids between clumps by disarticulating shells(Fig 1) Thus only vertically complex reefs accrete Second when the carbonate balanceis negative the movement of carbonate back into the TAZ is inhibited by the limited poros-ity at the exposed surface Erosion does not create vertical complexity Thus most of thevertical complexity must be lost before the erosive transfer of buried carbonate back intothe TAZ becomes significant
Accordingly burial occurs when the exposed reef exceeds a certain height Tmax Burialrate increases as the clumps of the living reef increasingly surpass Tmax in height This isequivalent from Eq (6) to the volume fraction of carbonate exceeding the amount that canaccumulate in the TAZ before the rate of clump disaggregation and shell accumulation at itsbase begins to bury shell and as a consequence re-establishes the initial volume fraction anddimension Tmax In the figures that follow the amount of shell in the TAZ will be portrayedin terms of clump heightT recognizing that variation in this variable is equivalent to variationin the volume fraction of carbonate in the TAZ
If the vertical expression of the living reef the TAZ is less than Tmax then some partof the buried reef may become exposed through erosive processes carbonate is transferedinto the TAZ However the rate of mobilization of buried carbonate is presumed to be lowover a large range of surficial complexity In anthropomorphic terms the reef protects itselfby limiting the exposure of framework carbonate to taphonomic processes during periodsof negative carbonate balance by exposing a relatively flat surface to the overlying waterThus when the surficial carbonate declines to a low level and perforce a very low reliefthe reef expresses a vertically narrow TAZ defined as T lt Tmin Only at this point is buriedcarbonate exposed relatively rapidly and thus transferred into the TAZ
These processes are summarized as follows For T lt Tmax the maximum-height ofroutinely-encountered clumps T is too low to provide sufficient carbonate coverage inthe TAZ to promote burial Erosion may occur depending upon the relationship of T
to Tmin
αT F
= 0 (11)
2012] Powell et al Rise amp fall of Crassostrea virginica oyster reefs 513
and
αFT
=(
αmaxF
(1 minus tanh
(T minus Tmin
αslope
F
)))+
(αmin
F(Tmax minus T )
) (12)
For T gt Tmax the height of routinely-encountered oyster clumps exceeds Tmax and reefaccretion occurs at a rate determined by the exceedance of T over Tmax
αT F
= αmaxT
(1 minus tanh
((β
TTmax) minus T
αslope
T
))(13)
and
αFT
= 0 (14)
c DyPoGEn (Dynamic Population Genetics Engine)
i Overview Simulations from a gene-based population dynamics model are used to pro-vide a time series of shell addition [S in Eq (9)] See Powell et al (2011ac) for a fulldescription of DyPoGEn The model simulates a population composed of multiple cohortseach composed of multiple individuals and can be described as the marriage of three com-ponents a post-settlement population dynamics submodel that contains parameterizationsfor growth mortality and reproduction a larval submodel that contains parameterizationsfor larval mortality and a gene submodel that describes each animal in terms of its geneticstructure and that tracks genotype through time from one cohort to the next Finally agenotype-phenotype interface interprets genotype in terms of fitness that then influencesthe larval and post-settlement submodels This permits the feedback between genotype andphenotype that drives selection
Powell et al (2011c this issue) describe the model structure for reproduction sex changeand larval mortality Very briefly each simulated mating season creates a new generationrepresented by a cohort of newly-recruited individuals Most simulations supporting thisstudy were conducted under the assumption that animals born in one year do not spawn inthe same year a reproductive pattern typical of all but the most southern climes (Stauber1950 Hayes and Menzel 1981 Kennedy and Krantz 1982 Barber et al 1991) Eachyear the population first suffers adult mortality at a rate that is age-dependent [see Pow-ell et al (2011c this issue) for justification see also Martinius (1991)] The age of allindividuals in the population is incremented by one and the functional sex changes forsome individuals Then reproduction occurs with gametes formed through the process ofmeiosis such that each set of haploid chromosomes is obtained as a random draw from theparental genotype The fate of each offspring is controlled by random larval mortality ata rate set to permit establishment of a relatively stable population thus a compensatorybroodstock-recruitment relationship is assumed (Powell et al 2009a)
514 Journal of Marine Research [70 2-3
In the following subsections we provide additional details focused solely on the compo-nents controlling mortality and fitness based on the presence of alleles conferring diseaseresistance The reason for this focus is the later simulation of reef carbonate budgets for pop-ulations influenced by dermo disease and the potential response of the population throughthe development of disease resistance that might result ultimately in a diminishing impactof dermo on shell production
ii Mortality Although juvenile mortality is high in bivalves this portion of mortalitywas subsumed into larval mortality as the purpose of the simulations was to examine theinfluence of mortality factors acting on sexually mature animals that dominate shell produc-tion Thus an age-dependent adult mortality rate was imposed by deriving the probabilityof dying from the age of the animal according to the formulae
AM = AvgAgeMort minus ((1 minus FitFac) middot dAvgAgeMort) (15)
ASM = AvgSpreadMort minus ((1 minus FitFac) middot dAvgSspreadMort) (16)
Pr = 5
[1 + tanh
(Age minus AM
ASM
)](17)
where Pr is the probability of dying AvgAgeMort is the average age of mortality (Pr
is 05 at this age) and AvgSpreadMort controls how rapidly the mortality approaches 1FitFac is a fitness factor that varies mortality by reducing the average age of death by thefactors dAvgAgeMort and dAvgSpreadMort
Dermo-induced mortality is modulated by the local environment particularly the latesummer temperature and salinity (Andrews 1988 Powell et al 1996 Ragone Calvo et al2001) Thus we considered two levels of mortality at the onset of disease interpretableas relative measures of the virulence of the disease or conduciveness of the environmentsim40 of the population yearly and sim22 The lower rate is representative of epizooticmortality rates often observed in Delaware Bay and Chesapeake Bay (Burreson and RagoneCalvo 1996 Powell et al 2008a 2009a) The higher rate is a minimal value for the Gulf ofMexico (Mackin 1959 1962 Mackin and Sparks 1962 Mackin and Hopkins 1962) and alevel observed in the initial epizootics after onset of dermo disease in the higher-mortalityregions of Delaware Bay (Powell et al 2008a 2009a)
iii Genetic structure and implementation of fitness The genetic structure of each oysteris defined in terms of 10 pairs of chromosomes (Wang et al 1999 2005) each in the presentstudy with four genes and two alleles Thus the genotypes permitted for each locus were AAAB and BB Guo (unpubl data) identified fourteen loci distributed among the majority ofthe chromosomes (see Table 1 in Powell et al 2011c) with alleles that may confer somedegree of disease resistance to mortality from dermo disease Most models of genetically-based disease resistance rely on one-locus (eg Wilhoit 1991 MacKenzie and Bishop1999 Abell et al 2005) or two-loci (eg Galvani and Slatkin 2004) configurations Fordermo disease a multi-locus model is required (Powell et al 2011c) The initially-lowallele frequency for alleles conferring disease resistance approximately 10 invoked the
Tabl
e1
Para
met
erva
lues
vary
ing
betw
een
mod
elsi
mul
atio
nsI
nvar
iant
para
met
erse
tting
sw
ere
Min
Pack
=0
05T
min
=0
02α
min
F=
000
1α
max
F=
002
5α
slop
e F=
000
5an
dα
max
T=
065
The
Del
awar
eB
ayhi
gh-a
bund
ance
case
isa
popu
latio
nw
itha
tota
lof
abou
t12
mill
ion
anim
als
For
allG
ulf
ofM
exic
oca
ses
tota
lpop
ulat
ion
size
was
seta
tabo
ut47
500
0an
imal
sFo
rth
eD
elaw
are
Bay
low
-abu
ndan
ceca
set
otal
popu
latio
nsi
zew
asse
tata
bout
400
000
anim
als
Car
ryin
gca
paci
ty(K
)is
the
loca
lpop
ulat
ion
dens
ity(n
umbe
rsm
minus2)
Sim
ulat
ions
liste
dw
ithan
initi
alsi
mul
atio
nye
arof
201
used
the
base
case
for
the
first
200
gene
ratio
nss
peci
fied
cond
ition
sth
enco
mm
ence
din
Yea
r20
1dA
vg-
dAvg
-In
itial
Age
-Sp
read
-B
erta
-G
ener
atio
nsSi
mul
atio
nC
ase
Figu
res
Max
Pack
bλ
Fλ
TAZ
Tm
ax
αslo
pe T
βT
KM
ort
Mor
tla
nffy
kŁ
infinY
rminus1
FY
ear
Del
awar
eB
ay(H
igh-
orL
ow-a
bund
ance
)B
ase
Cas
e4
111
316
19
55
01
10
03
15
300
00
23
140
10
1V
aria
ble
λT
55
50
05ndash
51
00
31
530
00
02
314
01
01
Var
iabl
eλ
F6
55
0ndash0
21
10
03
15
300
00
23
140
10
1V
aria
ble
Max
Pack
72
5ndash1
50
11
00
31
530
00
02
314
01
01
Var
iabl
eT
max
75
50
10
25ndash
200
31
530
00
02
314
01
01
Var
iabl
eb
95
5ndash1
60
11
00
31
530
00
02
314
01
01
Var
iabl
eB
uria
lRat
e11
55
01
10
005
ndash02
11ndash
230
00
02
314
01
01
Var
iabl
eK
125
50
11
00
31
525
ndash600
00
23
140
10
1R
educ
edL
infin13
55
01
10
03
15
300
00
23
100
10
1M
oder
ate
Mor
talit
y(d
erm
o)14
ndash15
55
01
10
03
15
300
74
23
140
10
201
Hig
hM
orta
lity
(der
mo)
14ndash1
519
55
01
10
03
15
300
106
23
140
10
201
Fish
ing
Setu
pL
ower
Tm
ax
165
50
10
50
31
530
00
02
314
01
01
Incr
ease
dB
uria
l16
55
01
05
007
51
330
00
02
314
01
01
Dec
reas
edC
lum
pD
ensi
ty16
58
01
05
007
51
330
00
02
314
01
01
Var
iabl
eFi
shin
gSt
anda
rdC
ase
171
95
80
10
50
075
13
300
00
23
140
11
05ndash
511
201
Hig
hT
max
175
80
11
00
075
13
300
00
23
140
11
05ndash
511
201
Low
F18
58
01
05
007
51
330
00
02
314
01
053
201
Mod
erat
eM
orta
lity
(der
mo)
185
80
10
50
075
13
300
74
23
140
11
05ndash
511
201
Gul
fof
Mex
ico
One
-Gen
erat
ion
135
50
11
00
31
530
00
01
210
01
01
Two-
Gen
erat
ion
Mod
erat
eM
orta
lity
(der
mo)
145
50
11
00
31
530
07
41
210
02
020
1H
igh
Mor
talit
y(d
erm
o)14
55
01
10
03
15
300
106
12
100
20
201
Var
iabl
eFi
shin
gM
oder
ate
Mor
talit
y(d
erm
o)18
58
01
05
007
51
330
07
41
210
02
105
ndash51
120
1
516 Journal of Marine Research [70 2-3
assumption that such alleles are rare in naiumlve populations possibly due to the likelihoodthat such alleles are inherently deleterious if the disease is not present (eg Cotter et al2004 Zbinden et al 2008 Hasu et al 2009 Duffy and Forde 2009) Most oyster locihave more than two alleles (Launey and Hedgecock 2001 Wang and Guo 2007) For thesesimulations we assume that only one of these alleles is associated with disease resistanceso that a two-allele configuration can be used with the second allele representing the hostof alleles having no influence on disease resistance
Fitness is the mechanism by which physiological function is encoded by the genesThe relative contribution of each of the permitted genotypes AA AB or BB to diseaseresistance is independently set so that one locus may be characterized by dominance andanother overdominance for example Fitness for an individual is determined as the averageof the fourteen values determined for each of the fourteen loci conferring disease resistancestandardized to fall within a range of 0 for completely susceptible to 1 for fully resistantinclusive In simulations reported here the survival of the adult animal is affected by a fitnessvalue FitFac as specified in Eqs (15) and (16) Each simulation is referenced against abase case configured for a mortality rate thought to be characteristic of oyster populationsbefore the onset of significant mortality by dermo disease This value is 10 to 15 ofthe adult population per year (Powell et al 2008 2009a) Dermo disease is introduced byincreasing the value of dAvgAgeMort and dAvgSpreadMort in Eqs (15) and (16) from zeroto some value between 0 and the respective values of AvgAgeMort and AvgSpreadMortThis increases the rate of adult mortality to the degree permitted by the fitness value ofthe individual as determined by FitFac An example is shown in Figure 3 in which a naiumlvepopulation with a yearly mortality of about 13 of the stock without the disease (labeledF = 1 in Fig 3) is exposed to a yearly mortality of about 24 of the stock at FitFac = 0(labeled F = 0 in Fig 3) After developing complete resistance to the disease at FitFac = 1the stock attains the natural mortality rate of the unexposed naiumlve population (labeled F = 1in Fig 3)
3 Oyster-reef carbonate-budget model Formula appraisal andparameter valuation
a Perspective
The sobering apprehension under which this modeling exercise proceeds is the exceed-ingly limited understanding of the mechanisms of oyster reef formation in comparison to thevast quantity of research on the oyster itself Oysters are the reef builders of the temperatezone far outstripping the works of other creators of hard bottom at these latitudes suchas serpulid and sabellariid polychaetes Yet little beyond the description of Wreck Shoalsby DeAlteris (1988) and some descriptions of fossil reefs (eg Parras and Casadiacuteo 2006Pufahl and James 2006) is known about the geological structure and mode of constructionand consolidation of this most important component of the estuary The consequence of thisabysmal paucity of information is to emplace severe constraints on model construction and
2012] Powell et al Rise amp fall of Crassostrea virginica oyster reefs 517
Figure 3 An example of oyster mortality trends with age while fitness varies by 02 units from afitness of 0 to a fitness of 1 The fitness-of-0 case (F = 0 or naiumlve exposed) yields a populationmortality rate of about 24 The fitness-of-1 case (F = 1 or naiumlve unexposed) yields a populationmortality rate of about 13
severe limitations on model verification Persevering under these encumbrances we pro-pose a general model for the mechanics of reef construction and destruction as a hypothesisrather than a synthesis of knowledge In accordance with this proposition we first discussthoroughly the rationale for the parameterizations chosen and for a selection of them weevaluate the influence of a range of values upon model performance Our initial foray isbased on the thorough discussion of Mann et al (2009) that can be summarized for ourpurposes thusly Over geological time oyster reefs increment slowly as their long-termaverage accretion rate cannot exceed the rate of sea level rise Thus carbonate productionmust be only marginally more rapid than carbonate loss even on healthy and accreting reefsmost of the time Occasionally higher rates may occur (eg DeAlteris 1988 Powell et al1995a) but such time periods must be of limited duration
518 Journal of Marine Research [70 2-3
b Base case parameterization
Figure 4 shows an accreting reef for which shell input consistently exceeds loss In thissimulation the amount of added shell varies over time as population abundance rises andfalls about a carrying capacity of about 300 animals mminus2 Over the course of 200 years thesubsurface tier increments in elevation by almost 30 cm a rate consistent with DeAlterisrsquo(1988) estimates for Wreck Shoals during its phase of rapid growth For much of the timethe vertical relief of the surficial tier the living reef varies from 10 to 11 cm Excursionsabove 11 cm are rare because burial occurs whenever the TAZ exceeds 10 cm in thicknessas it does throughout much of this simulation
The simulation shown in Figure 4 is based on a Delaware Bay simulation (High AbundanceBase Case Fig 8 in Powell et al this issue) of an undiseased (thus unexposed or naiumlve)oyster population near carrying capacity existing under a natural mortality rate of about 10ndash13 per year Such populations have a few animals reaching nearly 20 years of age and arobust size frequency that includesnumerous largeanimals (von-BertalanffyLinfin = 140 mmKraeuter et al 2007) We have only limited knowledge of the population characteristicsof unfished reefs pre-disease in Mid-Atlantic estuaries all anecdotal Literature accountsfrequently reveal abundances of 250ndash350 oysters mminus2 Oyster density in the mid-1970shigh-productivity regime in Delaware Bay is estimated to have been near carrying capacityin the range of 200ndash300 mminus2 (eg Powell et al 2008a) These values resulted in estimatedlimitations on growth due to local competitive interactions limiting food supply based on thesimple flux model of Wilson-Ormond et al (1997) Population dynamics modeling indicatesthat abundances considerably exceeding this density surpass carrying capacity at rationallevels of food supply (eg Powell et al 1995b 2009b Wilson-Ormond et al 1997)
Consequently the simulated population in Figure 4 is designed to be representative of1970s conditions in Delaware Bay and illustrative of the population dynamics of the bestexample in the Mid-Atlantic region of a relatively unimpacted population surveyed withmodern random-sample survey methods thus Figure 4 should be at least reminiscent ofpristine conditions Note in particular that a fishing mortality rate that exceeded 44 of theentire stock per year occurred in only one year in Delaware Bay during this period (Powellet al 2008a) The simulation was conducted under the following important additionalassumptions (1) the packing coefficient (MaxPack) is 50 with a minimal value 10 cmabove the reef surface (Tmax) of 5 (2) significant reef accretion occurs only when thevolume of shell in the TAZ results in a vertical relief of the living reef exceeding 10 cm(3) mobilization of the underlying buried reef increases rapidly only when the surficial reefhas degraded to a relief of 2 cm (Tmin) (4) the taphonomic loss rate for buried carbonate(λF ) is negligible and (5) the taphonomic rate in the TAZ (λT ) is equivalent to a 10-yearhalf-life for added shell Parameter values are given in Table 1
c Parameterization and uncertainty
i Preliminaries Recognizing the limited database from which to develop a model forthe process of reef accretion we now consider the sensitivity of the outcome depicted in
2012] Powell et al Rise amp fall of Crassostrea virginica oyster reefs 519
Figure 4 Temporal history of surficial (TAZ) and subsurface reef carbonate for a simulated oysterreef in Delaware Bay prior to the onset of MSX or dermo disease and in the absence of fishing [seeTable 1 for details additional information on this simulation can be found in Figure 8 of Powellet al this issue] Above The vertical extent of the TAZ over 200 years relative to the thresholdeliciting burial of shell (Tmax = 10 cm) and the relief of the reef framework relative to the 1-mrelief defined at the initiation of the simulation Below The amount of shell added each year per m2
through deaths of living oysters
Figure 4 to variations in a selection of the basic parameters controlling the taphonomicrates burial rates and structure of the living and buried reef We impose a few constraintsFrom Mann et al (2009) we anticipate that accretion will occur under only a very fewconditions whereas stasis or degradation will occur over a wide range of conditions From
520 Journal of Marine Research [70 2-3
DeAlteris (1988) we assume that rapid accretion rates are possible but from Mann et al(2009) we expect to find that such rates occur under an exceedingly limited set of optimalconditions and in fact we observe that rapid accretion of reef has been documented veryrarely (eg Powell et al 1995a Power et al 2010) The model requires that the followingparameters be set λF λT MaxPack MinPack b Tmax Tmin αmax
F αmin
F α
slopeF
αmaxT
α
slopeT
βT
and ρc The model also requires input of carbonate as a time series S(t) Weconsider parameterization of each of these in the following sections
ii Oyster shell density Oyster shell is primarily calcitic but the density ρc is some-what less than that of pure calcite due to the presence of voids chalky layers a foliatedmicrostructure and the organic matrix (Kennedy et al 1969 Rosenberg 1980 Carrikeret al 1980 Hong et al 1995) Estimates of oyster shell density vary in the range of 22ndash25g cmminus3 (Taylor and Layman 1972 Nell et al 1999 Yoon et al 2004 Powell and Klinck2007) We use the value of 22 g cmminus3
iii Taphonomic loss λF λT Oyster shell breaks down relatively quickly in comparisonto most molluscan shell other than mytilid mussels [compare Powell et al (2006) to egPeterson (1976) Callender et al (1994) Strayer and Malcom (2007) Powell et al (2008b)Kosnik et al (2009)] Half-lives estimated from reefs in Delaware Bay varied between lt5and 20 years with most lt10 years (Powell et al 2006) Mann et al (2009) inferred sim-ilar rates for Chesapeake Bay and Waldbusser et al (2011) observed similar rates underexperimental conditions We assume that these estimates are TAZ rates that is the com-ponent of shell sampled by survey methods is a good representation of the shell within theTAZ
Why oyster shell degrades so rapidly is unclear [but see Taylor and Layman (1972) fordata on compressive strength] although bioerosion as well as dissolution is certainly atwork (Warburton 1958 Gunter et al 1957 Carriker et al 1980) Bioerosion rates arewell documented in some tropical and temperate habitats (Powell et al 1989 Sartoretto1998 Lescinsky et al 2002 Wisshak et al 2005 Mallela and Perry 2007) but measuredrates for oyster shell are few (Carver et al 2010) although bioerosion is assumed to be animportant mechanisms of shell loss (eg Warburton 1958 Bahr and Lanier 1981 Carrikeret al 1980) Dissolution is a principal taphonomic process in most estuarine and marinehabitats (eg Staff and Powell 1990 Cutler 1995 Walker and Goldstein 1999 Lazo 2004Villiers 2005) the details of the process and the degree of modulation by microbiota versusgeochemistry are poorly understood (Powell et al 2008b 2011b 2011d) Fragmentationby biotic attack is also a common occurrence (eg Lawrence 1968 Elner and Lavoie1983 Zuschin et al 2003) and although this does not result in the loss of carbonate thechange in particle size very likely influences the rate of further degradation (eg Cumminset al 1986 Kidwell 2001) Nevertheless the apparently more rapid loss of oyster shellrelative to other estuarine shell resources conforms to the tendency for shell exposed onhard grounds and carbonate-rich sediments to be much more rapidly degraded than shellexposed on or buried in siliciclastic sediments (Powell et al 2008b 2011b Best et al2007 Best 2008)
2012] Powell et al Rise amp fall of Crassostrea virginica oyster reefs 521
Figure 5 Temporal history of surficial (TAZ) and subsurface reef carbonate for a simulated oysterreef derived from the base case for Delaware Bay depicted in Figure 4 (see Table 1 for additionaldetails) under five assumed values for λT the taphonomic loss rate for shell within the TAZLeft the vertical extent of the TAZ over 200 years relative to the threshold eliciting burial of shell(Tmax = 10 cm) Right the relief of the reef framework relative to the 1-m relief defined at theinitiation of the simulation
Simulations with a range of λT consistent with half-lives reported from Delaware Bay(Powell et al 2006) reveal that half-lives much shorter than 10 years produce reef stasis5
or degradation (Fig 5) Shorter half-lives of two to five years result in less surficial shelleven though the reef framework remains relatively unaffected consistent with observation
5 Stasis as used here will refer to a reef neither rapidly accreting nor rapidly eroding with a change in relief ofno more than 01ndash02 m over a period of several hundred simulation years
522 Journal of Marine Research [70 2-3
(Powell et al 2006) Longer half-lives promote reef accretion Thus field-estimated half-lives and measures of the shell budget in the TAZ (Powell and Klinck 2007 HSRL 2010) areconsistent with model expectation (Fig 5) Results are also consistent with the calculationsof Mann et al (2009) and observations of DeAlteris (1988)
In most simulations we assume a 10-year half-life a value permitting reef accretion forpopulations near carrying capacity Eq (9) assumes that all carbonate is equally susceptibleto degradation within the TAZ ignoring particle size-dependent processes that may beimportant Variations in surface-to-volume ratio the possibility that borers may be moreactive in larger shells and the fact that shell amalgamated into clumps may expose moresurface area than shell reclining on the bottom are potentially important modulators ofcarbonate loss No information is available permitting inclusion of these complexities inthe model
Whether buried reef retains carbonate without loss is unknown Any packing coefficientless than 100 would suggest some interstitial flow that might result in slow carbonateloss Certainly the rate of degradation of carbonate within the reef framework below theDFB is much lower than in the surficial tier that is half-lives are much longer Carbonatedegradation is an ongoing process in carbonate soft sediments (eg Powell et al 1989Walter and Burton 1990 Hover et al 2001 Parsons-Hubbard 2005 Perry and Taylor2006) and water flow through coral reefs and carbonate sands is well-described (Tribbleet al 1992 Jones et al 2009 Burdige et al 2010 see also Precht and Huettel 2004)but the degree of permanence of carbonate encased within the oyster reef framework isunknown Simulations suggest that half-lives of 500 years or less for buried shell producesome reef degradation with shorter half-lives resulting in rapid reef recession (Fig 6)thus the expectation that loss of carbonate from buried reef is negligible seems a nec-essary conclusion This outcome is consistent with the general view that the base of theTAZ the depth-of-final-burial demarcates a horizon below which carbonate loss is exceed-ingly slow (Powell 1992 Olszewski 2004) and with observations by Waldbusser et al(2011) that previously buried shell is less taphonomically active than recently-dead shellBy inference half-lives must be at least 50 to 100 times longer for buried shell than forsurficial shell Hereafter we assume that taphonomic loss ceases below the DFB that isλF sim 0
iv Packing coefficients for carbonate ndash MaxPack MinPack The volume of carbonateper volume of reef is set by MaxPack [Eq (5)] DeAlteris (1988) estimates a porosityof 50 a value used by Mann et al (2009) [compare Dorshel et al (2007) for cold-water carbonate mounds] Whether this value is representative is unknown as is the mate-rial that might fill the interstices wherever voids do not exist [see Perry and Smithers(2006) for an analogy] although the fill likely includes considerable siliciclastic material(Twichell et al 2010) As a consequence we investigate a range of packing coefficientsfrom 25 carbonate to 100 carbonate (Fig 7) MinPack is set to 005 at some heightabove the bottom consistent with the height of the highest routinely-encountered oysterclumps
2012] Powell et al Rise amp fall of Crassostrea virginica oyster reefs 523
Figure 6 Temporal history of subsurface reef carbonate for simulated oyster reefs derived from thebase case for Delaware Bay depicted in Figure 4 (see Table 1 for additional details) under fourassumed values for λF the taphonomic loss rate for shell below the DFB Depicted is the relief ofthe reef framework relative to the 1-m relief defined at the initiation of the simulation
Simulations suggest that little reef accretion occurs if the reef framework is 75 to 100carbonate (Fig 8) As the contribution of carbonate to reef framework volume declines below75 the rate of reef accretion accelerates We suspect however that packing coefficientsmuch less than 50 imply the existence of substantial fine material that would smother liveoysters (eg Moore 1911 Lenihan 1999 Smith et al 2001) We note in contrast thatAllen (1974) suggests that packing coefficients of 10ndash20 may be stable configurationsfor shell beds Regardless the simulations suggest that the packing coefficient is a keyvariable controlling reef accretion and recession and provides some support for acceptingthe DeAlteris (1988) estimate as consistent with reef growth
524 Journal of Marine Research [70 2-3
Figure 7 Temporal history of subsurface reef carbonate for a simulated oyster reef derived from thebase case for Delaware Bay depicted in Figure 4 (see Table 1 for additional details) left underfive assumed values for MaxPack the packing coefficient for carbonate at and below the DFBright under five assumed values for Tmax the maximum vertical extent of the TAZ above theDFB permitted without burial In the simulations on the right higher values of Tmax coincide withgreater sequestration of carbonate in the TAZ and consequently with greater surface area availablefor taphonomic attack Depicted is the relief of the reef framework relative to the 1-m relief definedat the initiation of the simulation
2012] Powell et al Rise amp fall of Crassostrea virginica oyster reefs 525
Figure 8 The frequency of collection of clumps of specified size in Delaware Bay survey dredgesamples expressed as a relative frequency for three bay regions Note that the data were obtainedby measuring the ten largest clumps in each sample As a consequence the relative probabilityof encountering the largest clumps approximates their relative commonness in situ whereas theprobability of encountering smaller clumps (approximately lt80 mm) is large but unknown Theplot shows that clumps gt100 mm are uncommon regardless of bay region and clumps gt110 mmare rare Bay regions are defined in Powell et al (2008 see their Fig 1 and Table 1) Fishing effortis high on the high-mortality and medium-mortality beds but negligible on the low-mortality beds(HSRL 2010)
One might consider the possibility that half-lives decline with increased subsurfaceporosity as is likely the case in bioturbated soft sediments (see for example Meadowsand Meadows 1991 Boudreau 1986 1991) Having no information upon which to basesuch a formulation we do not include this process in Eq (10)
v Distribution of carbonate in the TAZ ndash b Tmax Tmin The vertical extent of the TAZis controlled by clump height parameterized by Tmax Data from Delaware Bay suggestthat clumps rarely exceed 100 mm in vertical relief (Fig 8) A further complication is thelikelihood that fishing reduces clump size and frequency This seems logical although datafrom Delaware Bay for areas fished and unfished do not reveal remarkably divergent clumpheights indeed they suggest a modestly opposing trend (Fig 8) We know little about thethree-dimensional structure of the living reef on unfished reefs Information from Powellet al (1987a) and Wilson et al (1988) suggest that maximum relief is not substantivelyhigher than observed in Figure 8 however one certainly suspects that the frequency oflarger clumps might be considerably higher in the pristine condition
526 Journal of Marine Research [70 2-3
For these and all other simulations we set the value of Tmin the thickness of the shelllayer at the base of the TAZ upon and within which the clumps reside to 2 cm about thethickness of two oyster shells The value is unknown [see Aline (2008) for an analogy]and very likely dependent upon porosity and the packing coefficient previously discussedHowever as earlier reviewed the necessity of a very long half-life for the subsurface shellnecessitates that the DFB be very near the objective surface of the reef upon which theclumps rest Further support comes from the outcome of simulations withb 1 as describedsubsequently Low values of b can be interpreted as the extension of the TAZ into the reefframework
The rate of reef accretion is inversely proportional to the vertical extent of the TAZdefined by clump height (Fig 7) The inverse relationship between the vertical relief of theTAZ and the rate of reef accretion stems from the fact that an expanded TAZ increases theamount of carbonate exposed to taphonomic processes prior to burial and thus less carbonatesurvives the vicissitudes of taphonomy until interment By inference the production ofclumps by oysters limits the vertical accretion rate of reefs This hypothesis comes witha number of caveats previously described Moreover the environment inside the TAZ ofa clumpy reef is certainly divergent from the overlying estuarine water [see for exampleJumars and Nowell (1984) Peterson et al (1984) DeAlteris (1989) Coco et al (2006) forexamples of boundary layer processes] and so too may be the rate of taphonomy
The distribution of carbonate in the TAZ is dependent on the number height and volumeof clumps The structure of the surficial reef is very likely highly variable (eg Powellet al 1987a Rodney and Paynter 2006 Stiner and Walters 2008) In the model thedistribution and volume contribution of clumps is primarily controlled by parameter b inEq (1) One would assume that pristine reefs are substantively divergent from fished reefsin that the number of clumps and their height might be assumed to be larger (but see Fig 8)Inasmuch as the structure of the living reef is as yet poorly documented we investigate awide range of values for the parameter b yielding distributional patterns that vary fromextremely hollow curves to distributions in which carbonate volume exceeds 50 of totalvolume over more than half of the TAZ (Fig 2) These alternatives provide a wide rangeof simulated outcomes although all generate nearly stable to increasing reef thicknesses(Fig 9) Increasing the carbonate volume fraction throughout the TAZ results in reducedcarbonate burial and greater carbonate loss Thus if more carbonate is stored in the TAZprior to burial more is lost through taphonomy prior to burial and as a consequenceless carbonate is preserved The value of b likely varies over a wide range of values thatgenerate hollow curves of substantial to extreme hollowness (Fig 2) Any value that resultsin carbonate contributing close to half or more of the TAZ volume (eg b le 20 in Fig 2)dramatically limits reef accretion The assumption of reef accretion over a wide range ofvalues of b ge 2 generating hollow curves (Fig 9) is consistent with the relative paucityof large clumps (Fig 8) and suggests that the value of b is unlikely to be among the mostsignificant parameters controlling reef accretion
2012] Powell et al Rise amp fall of Crassostrea virginica oyster reefs 527
Figure 9 Temporal history of surficial (TAZ) and subsurface reef carbonate for a simulated oyster reefderived from the base case for Delaware Bay depicted in Figure 4 (see Table 1 for additional details)under five assumed values for b (Fig 2) the variable controlling the distribution of carbonate withinthe TAZ Left the vertical extent of the TAZ over 200 years relative to the threshold eliciting burialof shell (Tmax = 10 cm) Right the relief of the reef framework relative to the 1-m relief definedat the initiation of the simulation
Two additional assumptions of unknown consequence should be considered First lowervalues of b and hence larger fractions of the volume of the TAZ occluded by carbonatemight be expected to buffer environmental acid and reduce dissolution (see for exampleGreen et al 1998 2004 Tribble 1993) This possibility is not included in the modelSecond carbonate bound up in the shells of living oysters is not included in the reef carbonatebudget and is assumed to suffer minimal loss through taphonomic processes although boringof live oyster shells is well documented and carbonate loss almost certainly consequential
528 Journal of Marine Research [70 2-3
in higher salinity regions (eg Hopkins 1956 1962 Gunter 1979 Royer et al 2006)Age-dependent variations in shell weight due to bioerosion are subsumed in Eq (7) and notfurther considered The relative proportion of live-oyster carbonate as a component of thecarbonate resource of the TAZ is poorly documented as is the relative importance of thetwo for supporting recruitment (eg Bahr 1976 Bahr and Lanier 1981 Tamburri et al2008 Powell et al 2008a) One might assume that much more carbonate is bound up inliving animals in the pristine reef and this in and of itself limits taphonomic loss as the innershell surface is only exposed at death (Lescinsky 1993 Cutler 1995 Kidwell et al 2001)
vi Carbonate transport across the DFB ndash αmaxF αmin
F α
slopeF αmax
T α
slopeT β
T
Remobilization of carbonate into the TAZ from the reef framework during times of reefrecession is parameterized by Eq (12) We assume αmin
Fis near zero thus buried reef
remains inactive unless the base shell layer in the TAZ is reduced to very near the thicknessof Tmin This seems reasonable as the surficial shell layer on a degrading reef will remainrelatively flat and impervious We arbitrarily set αmax
Fto 0025 based on the presumed con-
solidated nature of the reef framework The parameter αslope
Fis set to 0005 so that buried
reef is re-exposed when erosion occurs only when the surficial carbonate has been reducedto near Tmin The corollary assumption is that the vertical complexity of the TAZ is muchlower in a receding reef than an accreting reef We know of no empirical observations tosupport or refute this presumption Thus we assume that buried carbonate is remobilizedonly when the TAZ becomes less thick than Tmin (2 cm)
As it seems self evident that reef recession will only occur when the basal surficialshell layer becomes very thin we do not investigate alternative formulations Althoughreef loss is well documented [see for example Mann et al (2009) and Smith et al (20012005)] the mechanism of carbonate mobilization is unstudied6 Our parameterization ofEq (12) implies that exhumation of carbonate should be a slow and arduous process limitingexposure of framework carbonate to taphonomic loss Relaxation of this assumption wouldresult in many cases of reef near-stasis being relegated to the reef-in-recession category inlater simulations and sorely minimize the suite of population dynamics that would lead toreef accretion
Burial of carbonate is described by Eq (13) The rate of burial should be influenced bythe distribution of carbonate within the TAZ No empirical observations are available toparameterize this process beyond the description of Wreck Shoals by DeAlteris (1988) Inthe model we merely require that the burial rate exceed zero only when the TAZ is lsquofullrsquoof carbonate as dictated by the packing coefficient (Fig 7) and the parameter b (Fig 9)However once these conditions are met the burial rate may be more or less rapid dependingon the increment of carbonate in the TAZ above the maximum permitted without burialSimulations of different formulations describing the burial rate as a function of carbonatecontent by varying the values of α
slopeT
and βT
over a relatively wide range (Fig 10) suggest
6 Note again that we distinguish the process of exhumation or erosion from burial through sedimentation aprocess that identifies a reef failing to accrete at a sufficiently rapid rate rather than a reef in recession
2012] Powell et al Rise amp fall of Crassostrea virginica oyster reefs 529
Figure 10 Dependency of the rate of burial of carbonate at the base of the TAZ as a functionof vertical thickness of the TAZ for five cases investigated in Figure 11 The parameter setsare (base) α
slopeT
= 003 βT
= 15 (1) αslope
T= 002 β
T= 125 (2) α
slopeT
= 005 βT
= 20
(3) αslope
T= 0005 β
T= 11 and (4) α
slopeT
= 0005 βT
= 14 Note that an increase in vertical
relief above Tmax implies an accumulation of shell at the base of the TAZ sufficient to result incarbonate burial and preservation
that rates of reef accretion vary relatively little (Fig 11) a factor of two in accretion over200 years in the extreme cases with the outliers characterized by extensions of the TAZabove Tmax to a degree unlikely to occur Thus the calculation of the burial rate basedon the volume of carbonate in the TAZ is little influenced by the specific formulationused
vii Summary Uncertainty in the model formulation can be related to five parametersdescriptive of basic characteristics of the oyster reef and its carbonate content Two describethe TAZ and the distribution of carbonate within it Tmax and b These depend upon anunderstanding of variations in clump height and density an obvious feature of a living reefbut one sparsely documented Another is the taphonomic rate in the TAZ λT a parameterknown to be variable for which the source of variability is largely unknown Two moreinvolve the subsurface framework namely the volume contribution of carbonate MaxPackand the taphonomic loss rate λF if taphonomic loss occurs at all As the values for theseparameters likely vary considerably between reefs all following simulations come with acaveat concerning our chosen values (1) buried carbonate is taphonomically quiescent (2)carbonate volume contributes about 50 of total reef volume (3) clump height is about
530 Journal of Marine Research [70 2-3
Figure 11 Temporal history of surficial (TAZ) and subsurface reef carbonate for a simulated oysterreef derived from the base case for Delaware Bay depicted in Figure 4 (see Table 1 for additionaldetails) under five assumed combinations of αslopeT
and βT the parameters controlling the rela-tionship between the rate of burial of carbonate and the degree to which carbonate has increasedin content in the TAZ beyond that associated with Tmax Left the vertical extent of the TAZ over200 years relative to the threshold eliciting burial of shell (Tmax = 10 cm) Right the relief of thereef framework relative to the 1-m relief defined at the initiation of the simulation Parameter setsare defined in Figure 10
10 cm and (4) is distributed within the TAZ as a hollow curve (b = 5) and (5) a typicaltaphonomic loss rate for the TAZ is expressed by a 10-year half-life for newly-added shellAll simulations hereafter are proffered under the hypothesis that the Delaware Bay basecase thus parameterized (Fig 4) is a relatively informed approximation of the carbonatebudget of the pristine reef
2012] Powell et al Rise amp fall of Crassostrea virginica oyster reefs 531
d The influence of population dynamics
The rate of input of carbonate is of course a critical element in determining whetheroyster reefs accrete or degrade Three factors likely dominate the input rate recruitmentthat influences abundance mortality rate that influences abundance and the size frequencyof the animals that die The recruitment rate of oysters is known to be highly variable (egLoosanoff 1966 Austin et al 1996 Southworth and Mann 2004 Powell et al 2008a)influenced by regime shifts (Southworth and Mann 2004 Powell et al 2009a) and maybe related in an as-yet unexplained way to broodstock abundance (Mann and Evans 1998Kimmel and Newell 2007 Powell et al 2009b)
In a series of simulations we varied abundance without varying the size frequency ofthe population Such an outcome might occur if the broodstock-recruitment relationshipchanged but other factors controlling the population dynamics did not Figure 12 demon-strates the anticipated strong influence of abundance on the dynamics of the reef carbonatebudget Only high abundance generates reef accretion What is interesting however is thatlower shell input rates which result in limited carbonate in the TAZ (low vertical reliefvalues in Fig 12) result in reef stasis but only limited degradation A drop in abundanceconsiderably exceeding a factor of 5 below the carrying capacity of 300 oysters mminus2 inferredfor Delaware Bay is required to generate distinct loss of reef and even this is minor over the200 simulated years Reefs accrete relatively rapidly and recede relatively slowly due to thedifferential in taphonomic rates between the TAZ and the subsurface tier and the differentialin the degree of exposure of carbonate during periods of reef accretion and recession Notethat the model assumes that buried reef is only exposed when the surficial shell is sparse[Tmin in Eqs (11) and (12)] Thus we assume that a thin coating of surficial shell about 2shells thick is sufficient to limit reef recession Nevertheless it is a prediction of the modelthat reefs lsquoprotect themselvesrsquo by limiting the rate of transfer of buried carbonate back intothe TAZ during times of low shell input
The rate of carbonate input is a function of abundance and the mortality rate but also ofthe size frequency of deaths as oyster shell weight increases as a power function of length[Eq (7)] (Mann et al 2009 Powell and Klinck 2007) The size frequency at death is acomplex product of the sources of mortality and the rate of growth expressed by the von-Bertalanffy parameters k and Linfin The growth function exerts a strong influence on the rateof shell addition [Fig 13 compares three cases taken from Powell et al (2012) their Figures8 and 10] The first case is the base case for Delaware Bay used for previous simulations(eg Fig 4) The second case (labeled lsquoreduced Linfin casersquo in Fig 13) is a Mid-Atlantic casewith a lower asymptotic length [eg Shell Rock in Delaware Bay (Kraeuter et al (2007)]The third case is a case for the Gulf of Mexico with an increased value of k but a similarlylow value of Linfin (from Addison 2006) These cases vary primarily in the size frequencyat death and secondarily in the turnover rate of the population The most rapid rate of reefaccretion occurs in the case with the highest Linfin and thus the largest and heaviest shells atdeath This outcome is consistent with Mann et al (2009) who emphasized the importanceof large adults in the carbonate budget The case with least reef accretion is one with both alower Linfin and a lower k In this simulation animals grow slowly to a lesser size and so the
532 Journal of Marine Research [70 2-3
Figure 12 Temporal history of surficial (TAZ) and subsurface reef carbonate for a simulated oysterreef derived from the base case for Delaware Bay depicted in Figure 4 (see Table 1 for additionaldetails) under five assumed values of carrying capacity K expressed in numbers mminus2 Left thevertical extent of the TAZ over 200 years relative to the threshold eliciting burial of shell (Tmax =10 cm) Right the relief of the reef framework relative to the 1-m relief defined at the initiation ofthe simulation
animals dying average smaller in size Reef accretion and recession are ineluctably relatedto the growth dynamics in the population and the age at death of the adult animals
4 Dermo disease and fishing The dynamics of reef budgets in the modern age
a Generation time mortality and dermo disease
We present three specific cases designed to cover a range of oyster population dynamicsThe first is the Delaware Bay case that has served as the base case for this study (Fig 4) This
2012] Powell et al Rise amp fall of Crassostrea virginica oyster reefs 533
Figure 13 Temporal history of surficial (TAZ) and subsurface reef carbonate for a simulated oysterreef for populations differing in their growth curve as described by the von-Bertalanffy parametersLinfin and k (see Table 1 for additional details) Above the vertical extent of the TAZ over 200 yearsrelative to the threshold eliciting burial of shell (Tmax = 10 cm) and the relief of the reef frameworkrelative to the 1-m relief defined at the initiation of the simulation Below The amount of shelladded each year per m2 through deaths of living oysters
534 Journal of Marine Research [70 2-3
is a case with population abundance sufficient to minimize the vagaries of genetic drift witha von-Bertalanffy growth curve that permits large old animals to exist in the populationand a 10ndash13-per-year mortality rate The second is a modified case for Delaware Bayspecifically constructed to minimize the populationrsquos ability to adapt to dermo disease bydeveloping resistance to the disease because some alleles conferring disease resistance arelost early after the onset of the disease This is accomplished by assuming a much reducedpopulation abundance thus facilitating genetic drift [Note that this is total populationabundance not density or numbers mminus2] The third case is for high-productivity regions ofthe Gulf of Mexico where two generations can occur yearly (Hopkins 1954 Mackenzie1977 Hayes and Menzel 1981 Hofmann et al 1994 Gullian and Aguirre-Macedo 2009)7
Simulations were run such that a naiumlve population was followed for 200 years permittingthe trajectory of the reef carbonate budget to be documented in the absence of disease(Fig 14) At year 201 dermo disease was introduced into the simulated population at twointensities a high-mortality rate typical of the Gulf of Mexico and the initial epizooticsrecorded in some reaches of Delaware Bay and a moderate mortality rate typical of otherlocations within the Mid-Atlantic region of the US and the most recent epizootic in DelawareBay [see Powell et al 2011c for details for mortality data see Mackin and Hopkins (1962)Mackin and Sparks (1962) Powell et al (2008a 2009a) Ragone Calvo et al (2001)] Overthe next 200 years of simulation time the population was permitted to respond to the diseaseby developing resistance the degree to which this occurred is discussed by Powell et al(2011c this issue)
Over the first 200 years each naiumlve population retained an abundance near a carryingcapacity of 300 animals mminus2 (Fig 14) Each population experienced an extraordinary abun-dance decline in the first few years after disease onset to values between about 20 and50 of carrying capacity The degree of decline was larger for the higher mortality ratesubset as anticipated In most simulations abundance recovered marginally over the 200years after disease onset consistent with the slow development of disease resistance that con-fers a lower mortality rate upon the population as described by Powell et al (2011c) Buteven after 200 years of exposure population abundance remained approximately 40ndash50below carrying capacity in the best scenarios
The reef carbonate budget shows an accreting reef for each naiumlve population prior toonset of disease Accretion rate is lower for the Gulf of Mexico consistent with a lowerasymptotic size (eg Fig 13) and because a second generation per year is inconsequentialfor a population at carrying capacity The surficial shell follows three distinctive trajectoriesafter the onset of disease For the Gulf case the vertical relief remains largely unaffected Therate of reef accretion is transiently slowed but rapidly returns to a near-carrying-capacityrate despite lower population abundance Basically the higher rate of shell addition asa consequence of the higher mortality rate offsets a potential reduction in shell additionas a consequence of lower abundance in a situation where productivity is high enough
7 This case should be distinguished from the one-generation case reported in Figure 13
Figure 14 Temporal history of surficial (TAZ) and subsurface reef carbonate for a series of simulatedoyster reefs with populations representing widely different population dynamics including lowand high abundance and one and two generations per year (see Table 1 for additional details)Simulations of a naiumlve population were run for 200 years the last 50 years are shown In year 201dermo disease entered the population and elevated mortality rates to approximating 40 (HM)and 22 (MM) per year relative to the approximately 13 per year prior to disease onset Legenddesignations are DB-Low a low-abundance Delaware Bay simulation DB-High a high-abundanceDelaware Bay simulation GM a simulation of a Gulf of Mexico population with two generationsper year The three cases are further described in Powell et al (this issue) their Figures 8 and 12Above left the vertical extent of the TAZ over the last 250 of 400 years relative to the thresholdeliciting burial of shell (Tmax = 10 cm) Above right the relief of the reef framwork relative tothe 1-m relief defined at the initiation of the simulation for the last 250 years Below Populationdensity in individuals mminus2 to be distinguished from total population abundance whch averaged inthe first 200 years 12 million (DB-High) 400000 (DB-Low) and 475000 (GM)
536 Journal of Marine Research [70 2-3
to maintain a high throughput of animals For one Delaware Bay case a low-abundancehigh-mortality case carbonate loss exceeds gain the TAZ carbonate content declines toa low level and the reef framework begins to degrade For the remaining Delaware Baycases reef stasis occurs The carbonate production initially declines and a nadir in surficialshell occurs This depression in cultch volume abates over time as the population developsdisease resistance and population productivity increases but not sufficiently to permit reefaccretion to recommence
The simulations are consistent with the assessment by Mann et al (2009) who stressedthe importance of large old animals in contributing to the total volume of shell input tothe reef in the Mid-Atlantic region of the US and with Powell and Klinck (2007) whosuggested that the ability for oysters to generate accreting reefs was evolutionarily in equi-librium with a 10 mortality rate and the age-structure of the population thereby main-tained The simulations identify the Gulf of Mexico as a uniquely different system andone consistent with a documented higher potential for rapid reef accretion (Powell et al1995a)
Dermo disease epizootics tend to be cyclic (Powell et al 1992 2009a Soniat et al 20062009) We borrow two pairs of simulations from Powell et al (this issue) who examine theinfluence of cycles on the development of disease resistance One pair simulated dermoepizootics in a 4-year cycle representative of Gulf of Mexico disease dynamics (Soniatet al 2009) and typical of the El Nintildeo-Southern Oscillation (Cane 2005 Tolan 2007Thatje et al 2008) the other pair simulated dermo epizootics in an 8-year cycle a durationrepresentative of Delaware Bay dynamics (Soniat et al 2009) and typical of the NorthAtlantic Oscillation (Bojariu and Gimeno 2003 Notaro et al 2006 Soniat et al 2009)Following the onset of disease in Year 201 surficial shell declines in some cases remainingdepressed for an extended period of time but then recovers to near carrying-capacity in allbut one case as disease resistance develops (Fig 15) Cyclic disease epizootics imposinga moderate mortality rate result in a lesser decline in surficial shell than cycles imposing ahigh mortality rate regardless of cycle period (Fig 15) However in all cases reef accretionceases Stasis occurs This outcome is independent of epizootic cycle period or the degreeof mortality imposed
In most of the cases shown in Figures 14 and 15 onset of dermo disease is accompa-nied by stasis or recession of the reef indicative of inadequate rates of shell productionDermo reduces generation time (Powell et al 2011c) and by forcing increased mortal-ity on larger animals results in a de facto reduction in Linfin As a consequence abun-dance declines reducing total shell input and the size of animals dying declines furtherreducing shell input per each death Decreased generation time and reduced abundance areineluctably conflated in C virginica population dynamics because most populations are tosome significant degree controlled by one or more oyster diseases that preferentially impactolder adults and this perforce reduces generation time while simultaneously decreasingabundance
2012] Powell et al Rise amp fall of Crassostrea virginica oyster reefs 537
Figure 15 Temporal history of surficial (TAZ) and subsurface reef carbonate for a simulated oysterreef in Delaware Bay (see Table 1 for additional details) Simulations of a naiumlve population were runfor 200 years the last 50 years are shown See Figure 4 for a representative full 200-year trajectoryIn year 201 dermo disease entered the population and elevated mortality rates to approximating40 (HM) and 22 (MM) per year relative to the approximately 13 per year prior to diseaseonset Dermo mortality rate varied with a 4-year or 8-year periodicity with cycle zenith equivalentto the previously defined mortality rate and cycle nadir with a mortality rate equivalent to that priorto disease onset The case for non-cyclic mortality is shown in Figure 14 Left the vertical extentof the TAZ over the last 250 years of a 400-year simulation relative to the threshold eliciting burialof shell (Tmax = 10 cm) Right the relief of the reef framework relative to the 1-m relief definedat the initiation of the simulation
b The influence of fishing
Dredge fishing modifies the shell bed reduces abundance and removes shell from theTAZ The impact of dredging on the shell bed is mostly speculative Powell et al (2001)found that dredging tends to chip shells this was observed on living oysters that subse-quently repaired their shells but can be assumed also to occur for dead shells Powell
538 Journal of Marine Research [70 2-3
and Ashton-Alcox (2004) observed that dredge efficiency declined with repeated dredgingassumably because the degree of consolidation at the base of the TAZ was reduced therebyincreasing porosity The impact of either on the reef carbonate budget is unknown
Presumably however the vertical relief will be lowered by dredging as clump height isreduced although data presented in Figure 8 is not strongly supportive of the hypothesis Inall probability the action of the dredge in breaking down clumps is likely to make burial ofsurficial shell more rapid for a given shell mass in the TAZ because more of the carbonatewill be distributed across the reef surface rather than conglomerated into clumps Mostlikely increasingly tall clumps will be increasingly rare relative to the unfished reef thatis the distribution of clump sizes will be skewed more toward single shells In simulationsin Figure 16 we combine these three expectations sequentially but we do not include theremoval of animals by the fishery Thus these simulations examine the potential influenceof the activity of dredging not the activity of fishing The reduction in vertical relief hasby far the greatest impact nevertheless the summary impact is to increase the rate ofreef accretion The primary reason is that reduced vertical relief results in lesser exposureof carbonate to taphonomic processes in the TAZ and thus a greater proportion of addedcarbonate is preserved
Readers may question the decision to impose changes in relief in the surficial tier indepen-dent of the degree of fishing pressure Dredge efficiency is extremely low in dredge fisheriesas standardly prosecuted much lower than when the dredge is used in survey mode (Powellet al 2002) resulting in a high degree of swept-area coverage at low exploitation rates(Banta et al 2003) Thus we assume that the majority of dredging impact on vertical reliefis experienced even at the lowest exploitation rates routinely permitted (eg Powell et al2008a)
The counterintuitive outcome of dredging (Fig 16) is rectified by taking into account thereduction in abundance and removal of shell mass by fishing (Fig 17) These simulationswere run under the following important constraints (1) Fishing is imposed as a constant-F(fishing mortality rate) process not a constant quota process consistent with sustainablemanagement criteria (Restrepo et al 1998 Applegate et al 1998 Powell et al 2009b)Thus for example removal of 10 of the stock annually results in proportionally moredeaths with higher stock sizes (2) Fishing is assumed to be a knife-edge process witha minimum size of 63 mm (Powell et al 2005) (3) Incidental catch of smaller animalsis assumed to be minimal (Powell et al 2005) (4) Discard mortality is assumed to beinconsequential (Powell et al 2001)
Simulation of three fishing intensities under Delaware Bay population dynamics withnatural mortality set at 13 per year consistent with a population existing prior to the onsetof disease shows that a removal of 10 of the fishable stock yearly permits continuedreef accretion albeit at a slower rate (Fig 17) A mortality rate of 20 per year results innear-stasis A removal of 40 of the fishable stock yearly results in reef recession (Fig 17)
All fishing activities result in a contraction of the amount of surficial shell This is con-sistent (1) with the assumption that clump height is reduced (2) with the reduction in
2012] Powell et al Rise amp fall of Crassostrea virginica oyster reefs 539
Figure 16 Temporal history of subsurface reef carbonate for a simulated oyster reef in Delaware Bay(see Table 1 for additional details) but modified in keeping with the expectations of the impact ofdredge fishing on the TAZ The lsquoreduced clump heightrsquo cases assumed a reduction in Tmax to 005Increased burial was obtained by setting α
slopeT
to 00075 and βT
to 13 in addition to lowering
Tmax Decreased clump density was obtained by setting b to 8 in addition to modifying Tmax α
slopeT
and βT
Depicted is the relief of the reef framework relative to the 1-m relief defined at the
initiation of the simulation
abundance that results in a decline in the addition of shell to the surficial tier (Fig 17) and(3) with the removal of otherwise-to-be-contributed shell by the fishery in the form of livinganimals The contraction of the surficial shell is consistent with Powell and Klinck (2007)who concluded that any mortality higher than about 10 per year will result in a reductionof surficial shell
We also show in Figure 17 the outcome if a reduction in vertical relief is not assumedto accompany fishing This is an interpretation consistent with data presented in Figure 8albeit loosely as the Delaware Bay exploitation rates are lower than those simulated hereThe singular difference is the enhanced impact at low fishing intensity In this case reef
Figure 17 Temporal history of surficial (TAZ) and subsurface reef carbonate for a simulated oysterreef in Delaware Bay with the vertical extent of the TAZ eliciting burial set for the pristine conditionand for an anticipated reduction in vertical relief assumed to be the outcome of fishing parameterizedby setting Tmax to 010 and 005 respectively (see Table 1 and Fig 16 for additional details) Ineach case an unfished population was simulated for 200 years the last 50 years are shown In year201 fishing commenced Fishing was implemented under a constant-F (fishing mortality rate)assumption Removal rates are equivalent to the removal of 10 (F = 0105) 20 (F = 0222)and 40 (F = 0511) of the fishable stock yearly Increased burial was obtained by setting α
slopeT
to 00075 and βT
to 13 (Fig 16) Decreased clump density was obtained by setting b to 8 (Fig 16)Left above the vertical extent of the TAZ over the last 250 years of a 400 year simulation relativeto the threshold eliciting burial of shell under pristine conditions (Tmax = 10 cm) Right abovethe relief of the reef framework relative to the 1-m relief defined at the initiation of the simulationBelow Population abundance prior to Year 201 population density in each case approximated300 individuals mminus2
2012] Powell et al Rise amp fall of Crassostrea virginica oyster reefs 541
stasis rather than reef accretion is the result This occurs because the increased carbonatehoused in a vertically-larger TAZ permits increased carbonate loss through taphonomicprocesses The proportionately more extreme effect at low fishing pressure occurs becausehigher fishing rates rob from the TAZ sufficient carbonate that enhanced vertical relief isnot retained regardless of model parameterization
In the case of a high-productivity region in the Gulf of Mexico where two generationsper year are feasible the impact of fishing is relatively similar to Delaware Bay despitethe higher potential throughput of animals Reef accretion can occur under low F butexploitation rates of 20 per year or more lead to stasis or reef recession In this case thehigher productivity is balanced by greater removals under the constant-F constraint leadingto an increased loss of potential shell input
c Simultaneity in dermo and fishing
In most C virginica populations dermo mortality and fishing occur simultaneouslySimulations of the Delaware Bay case show that surficial shell was reduced substantively inall cases including a moderate fishing level of 10 per year (Fig 18) At all but the highestfishing rate some increase in surficial shell content occurred resulting from the increasedabundance that developed commensurately with disease resistance over the 200 years Forthe 10-per-year level of fishing the volume of cultch in the TAZ tracked by the change invertical relief of the surficial shell layer in Figure 18 recovered to the volume assumed to bemaximal for a fished reef ie T = Tmax = 005 However this recovery did not materializefully until well into the second century of simulated fishing and disease mortality In nocase did reef accretion occur (Fig 18) A 10 fishing rate was characterized by reef stasisFor the two higher fishing rates reef recession occurred either modestly or moderately
Comparison to a high-productivity extremum exemplified by Gulf of Mexico populationsproducing two generations per year shows a distinctly different outcome from the DelawareBay case in a number of key particulars (Fig 18) First reef accretion continues at lowF with dermo disease mortality at moderate (Fig 18) or high (not shown) rates No suchoutcome is obtained in Delaware Bay (Fig 18) Second the surficial tier remains shell-richover a much wider range of F and in fact the TAZ is relatively unimpacted from thepurportedly pristine condition even at a 20-per-year exploitation rate The surficial tier ismoderately to significantly shell-poor over the same range of exploitation rates in DelawareBay implying a reduced potential for recruitment relative to the Gulf of Mexico case
5 Discussion
a The reef carbonate budget
Much attention is given to the maintenance or re-establishment of oyster reefs degradedover time Generally fishing has been considered a principal factor in reef degradationHowever recently-increased appreciation of the impermanence of oyster shell has focusedattention on all processes that might limit shell addition or encourage shell loss We present a
542 Journal of Marine Research [70 2-3
Figure 18 Temporal history of surficial (TAZ) and subsurface reef carbonate for a simulated oysterreef exposed to fishing and dermo disease (see Table 1 for additional details) In year 201 fishing wasimplemented under a constant-F (fishing mortality rate) assumption Removal rates are equivalentto the removal of 10 (F = 0105) 20 (F = 0222) and 40 (F = 0511) of the fishable stockyearly For Delaware Bay a removal rate of 5 (F = 0053) is also shown Dermo was imposedat a moderate mortality rate 22 of the population yearly DB a Delaware Bay case GM a Gulfof Mexico case from a high-productivity region capable of sustaining two generations per yearLeft the vertical extent of the TAZ over the last 250 years of a 400-year simulation relative to thethreshold eliciting burial of shell for a pristine and a fished reef (Tmax = 5 or 10 cm) Right therelief of the reef framework relative to the 1-m relief defined at the initiation of the simulation Thelower rate of reef accretion prior to year 200 for the Gulf of Mexico originates from the lower valuefor Linfin used for these simulations (Table 1)
model for the carbonate budget of an oyster reef building upon earlier treatments by Powellet al (2006) Powell and Klinck (2007) and Mann et al (2009) We present this modelmore in the form of an hypothesis rather than a verifiable representation as the formulationof the model highlights the limited understanding of the mechanisms by which oyster reefs
2012] Powell et al Rise amp fall of Crassostrea virginica oyster reefs 543
accrete and degrade Basic descriptors such as the vertical distribution of shell within theTAZ the packing coefficient for the reef the origin of the wide range of measured half-lives for carbonate in the TAZ and the modulators of burial either are unknown or poorlycharacterized
The model and coincident hypothesis provides some interesting speculations howeverFirst the anecdotal literature the treatment of Mann et al (2009) and the scarcity of empir-ical observations (eg Powell et al 1995a) all suggest that reef accretion rarely occursFrom DeAlteris (1988) we presume that reef accretion when it occurs is both rapid andtransient The model formulated here supports these contentions For Mid-Atlantic estuarineconditions reef accretion is only obtained under near-pristine conditions with abundancenear carrying capacity Over geological time such occurrences must have been recurringif not common In the last several centuries such happenstances have been passingly rareHigh-productivity regions of the Gulf of Mexico pose an interesting exception There highproductivity leading to multiple generations yearly expand the conditions under which reefaccretion can occur (eg Powell et al 1995a) and greatly insulate the reef from the depre-dations of dermo disease and unfettered fishing
One would think then that reefs might rapidly degrade Such instances are well doc-umented (eg Bahr and Lanier 1981 Haven and Whitcomb 1983 Mann et al 2009)but reef stasis is apparently a common state (eg DeAlteris 1988 Powell et al 1995a)Why We hypothesize that reefs with limited shell addition respond by reducing the vol-umetric content of carbonate in the TAZ As a consequence carbonate loss is curtailedThe subsurface tier when exposed is a mono-layer that minimizes the surface area uponwhich taphonomy can act Thus a dominant outcome in model simulations is the transientexpansion and contraction of the shell resource within the TAZ (eg Figs 14 15 and 17)rarely expanding enough to accrete yet rarely contracting enough to foster erosion of thereef framework The model simulations suggest that stasis is a preferred outcome obtainedfrom a wide range of conditions defining the balance between shell addition and loss andthat reefs lsquoprotect themselvesrsquo by limiting the exposure of framework carbonate to the over-lying water while the surficial shell layer deteriorates Reef recession by corollary requiresan inordinately unbalanced carbonate budget
The model suggests that shell in the TAZ what oyster-reef aficionados consider cultchis temporally highly variable waxing and waning as abundance rises and falls This phe-nomenon likely explains observed broodstock-recruitment relationships that seemingly arecontradictory of the enhancement of recruitment by the planting of shell (eg Abbe 1988Bowling 1992 Bushek et al 2004) Shell planting increases cultch above the level per-mitted by the equilibrium of natural addition and loss Thus the model indirectly lendssupport to the suggestion that the broodstock-recruitment relationship at low abundancerecords the availability of shell for settlement not the availability of larvae or the limitationof egg production
These ruminations strongly argue for expanded focus on the dynamics of the shellresource within the TAZ as this resource likely fosters a feedback loop with abundance
544 Journal of Marine Research [70 2-3
through recruitment serves as the protective layer for the reef during periods of reef stasisand establishes the threshold conditions for reef accretion and recession A final ratioci-nation is the likely requirement that populations be near carrying capacity to promote reefaccretion a condition incompatible with estuarine conditions typical of modern times Fewconditions could be simulated permitting reef accretion at lower population abundancebeyond the high-productivity extremum of the Gulf of Mexico
b Reef recession the why of it
The model suggests that conditions fostering reef recession are not easily obtained Wedistinguish this from the case where sedimentation overtops a reef this is a failure toaccrete in competition with regional sedimentation rate rather than the process of reefrecession A critical requirement for recession to occur is a substantial reduction in oysterabundance Declining abundance results from increased mortality or declining recruitmentBoth are documented (eg Ford and Haskin 1982 Hargis and Haven 1994 Kimmel andNewell 2007 Powell et al 2008a) However for oysters two mechanisms of mortalityare customarily conjured as explanations epizootic disease and fishing Though implicatedneither has been demonstrably identified as the protagonist of reef recession
Simulations of the impact of dermo disease at frequently-observed mortality levelsimposed continuously or cyclically at several periodicities suggest that reef accretion isan infeasible outcome within the Mid-Atlantic for any estuarine reach where dermo is acontrolling influence on population dynamics Simulations also suggest that stasis ratherthan recession is far more likely Nevertheless stasis is not a viable outcome in an estuarywhere sedimentation rates require reef accretion to permit reefs to remain extant Such con-ditions are commonplace (eg Lenihan 1999 Smith et al 2001 2005 Taylor and Bushek2008) Thus these simulations forecast that dermo will be shown to be a principal constrainton reef survival in the Mid-Atlantic through its negative influence on shell addition ratescontrariwise to the high-productivity regions of the Gulf of Mexico where the impact ofdisease may impose only a minor constraint on reef accretion (Fig 14)
The suggestion that increased mortality from disease should reduce shell addition is atfirst glance counterintuitive However dermo exerts its influence in three ways First theconsiderable reduction in oyster abundance limits shell input directly lower abundancemeans fewer deaths even if the mortality rate is higher Of at least equal importance is thereduction in generation time Dermo constrains the input of shell from the largest animalsby limiting their proportional contribution to the population (Fig 19) These animals (7+in Fig 19) are by far the greatest contributors of shell in the pristine condition Our modelstrongly supports the thesis of Mann et al (2009) that large animals are essential for shellbalance Third though more uncertain is the reduction in cultch observed in simulated reefsat stasis Less surficial shell more or less correlates with the lower abundance (eg Fig 17)and the commensurate likely reduction in available hard substrate for recruitment Thusalthough dermo disease may impose only a minor constraint on fecundity (Choi et al 1989
2012] Powell et al Rise amp fall of Crassostrea virginica oyster reefs 545
Figure 19 Example size frequencies from a Delaware Bay population (top) unfished and withoutdermo disease (middle) exposed to fishing for 150 generations with an exploitation rate of 40per year and (bottom) exposed to dermo disease at a relatively high total mortality rate (HM) of40 per year for 150 generations Note that the y-axis scales differ between plots
Dittman et al 2001 Paynter 1996) it may impose a much larger constraint on recruitmentthrough its influence on the quantity of cultch retained in the TAZ
Fishing like dermo disease reduces abundance and selectively limits shell imput fromthe largest animals (Fig 19) Like dermo disease this reduction in abundance limits out-comes to stasis or recession over a wide range of fishing removal rates Unlike dermocareful management may permit a more positive outcome but only at a low F even thoughfishing results in the removal of potentially-added shell from the reef Like dermo highproductivity in the Gulf of Mexico permits greater mortality without jeopardizing habitatintegrity The more positive outcome observed in simulations with fishing only in com-parison to simulations with dermo only is solely due to the presumed ability to constrain
546 Journal of Marine Research [70 2-3
fishing to mortality rates considerably below the mortality rates normally realized in dermoepizootics Total allowable landing limits have proven to provide this restraint (Powell et al2008a)
Most Federal fisherery management plans (FMPs) define biological reference pointsfor fishery management that maintain abundance at Bmsy (biomass-maximum-sustainable-yield) (eg Applegate et al 1998 Hilborn 2002 Haltuch et al 2008 Powell et al 2009b)Generally Bmsy is defined as half of carrying capacity K based on the standard Schaefermodel (Hilborn and Walters 1992 Maunder 2003) Bmsy = 1
2K (but see eg Haltuchet al 2008) For oyster populations prior to the onset of disease Bmsy has been shown tofall near K
2 (Powell et al 2009b) Model simulations suggest that population abundanceat Bmsy falls below the range permitting reef accretion for Mid-Atlantic estuaries thoughnot for the Gulf of Mexico Thus in the Mid-Atlantic reef stasis is the likely result ofmanagement at Bmsy Note in Figure 17 that the potential for reef accretion exists at anabundance value of about 2
3K but not at K2 for example Thus maximizing production
to the fishery and maintaining minimal conditions for reef accretion may be irreconcilablegoals aside from some Gulf of Mexico locales
Powell et al (2008a) noted that fishing removal rates of 20ndash25 per year were incom-patible with a sustainable stock Sustainability was more readily achieved at exploitationrates below 10 per year These observations are consistent with the dynamics of reefaccretion as modeled here and also with the suggestion that surficial shell is an importantdeterminant of recruitment success Surficial shell as modeled here declines to low levelsat exploitation rates much above 10 per year (Figure 17)
c Dermo disease and fishing
Simulations suggest that reef accretion in the Mid-Atlantic cannot occur with a totalmortality rate (Z = M + F ) exceeding about 20 per year No mixture of dermo diseaseand fishing under Mid-Atlantic conditions permits a total mortality rate this low unlesslow salinity strongly limits disease mortality Salinities likely to moderate dermo mortalitytypically fall below 15 and potentially nearer 10 (Andrews 1988 Powell et al 1996Ragone Calvo et al 2001) Simulations suggest that all but the lowest fishing mortalityrates not only doom the reef to stasis but also severely limit the availability of surficial shellunder our hypothesized TAZ dynamics and thus limit the potential for recruitment
A fishing level of 5 of the fishable stock yearly is representative of Delaware Bay [the1997ndash2009 median is about 35 of the oysters gt25primeprime (HSRL 2010)] Powell et al (2009a2009b) suggested that removal rates exceeding 5ndash10 of the stock are unsustainable Evenat a low level of fishing of 5 per year reef accretion is unlikely (Fig 18) howeverconsiderable cultch might be retained in the TAZ That is the surficial tier would retain arelatively desirable vertical relief and shell content at fishing rates of this order or lowerconsistent with Figure 8 The simulations support the exploitation rates implemented inDelaware Bay based on other criteria related to surplus production
2012] Powell et al Rise amp fall of Crassostrea virginica oyster reefs 547
6 Conclusions a vignette on management
Can the oyster resource in the Mid-Atlantic be managed under present-day disease pres-sure to achieve a sustainable population and a sustainable habitat Powell and Klinck (2007)Mann and Powell (2007) Mann et al (2009) and Harding et al (2010) suggest that thisrarely can be achieved Simulations of this reef carbonate-budget model identify few suc-cessful options Natural mortality rates in Mid-Atlantic estuaries are too high for reef accre-tion to occur over much of the estuarine salinity gradient even in the absence of fishing Oneconsequence of a tacit appreciation of this dilemma is the attention given to reef restorationfor habitat (eg Breitburg et al 2000 Meyer and Townsend 2000 Brumbaugh et al2006 Gregalis et al 2008 Olsen et al 2006 Cohen and Zabin 2009) and shell plantingfor recruitment enhancement (eg Gunter 1972 1979 Southworth and Mann 1998) How-ever these activities require a vast investment of money time and effort for optimal resultsbut barely more than a negligible body of data is available upon which to design an opti-mal program or even to define the characteristics of a reasonable goal Critical controllingparameters of the carbonate budget remain poorly characterized
Nevertheless an oft-stated aspiration is the restoration of an earlier reef footprint onepresent prior to the onset of disease and the overharvesting that characterized even the earlyyears of the better-managed present-day fisheries Such a goal appears unachievable reefstasis appears to be the only attainable goal However an appropriately limited fishery wouldpermit a quantity of surficial shell conducive to adequate recruitment and sufficient to limitloss of reef framework under conditions that restrict the impact of sedimentation on habitatintegrity An expanded subset of options may be achieved in many areas through carefulmanagement plus the addition of shell to maintain an adequate surficial shell resource inthe TAZ
The model supports earlier suggestions by and inferences from Powell and Klinck (2007)Mann and Powell (2007) and Mann et al (2009) that successful management of the oysterreef habitat in Mid-Atlantic estuaries is incompatible with fishery exploitation rates exceed-ing about 5 of the fishable stock Higher removal rates at the very least result in a severeloss of surficial shell and a contraction of the TAZ with accompanying loss of recruitmentpotential Such low fishing levels are consistent with estimates of removal rates obtainedusing population dynamics criteria and estimates inferred from long-term time series Theoyster in the Mid-Atlantic region is not resilient to high exploitation rates over significantperiods of time and neither is the habitat upon which it depends What resiliency existedhas been absorbed by the depredations of dermo (and MSX) disease leaving managerswith an extraordinarily limited repertoire and habitat restorers with an intractable obstacleto success
The impact of changing ocean pH on calcification and carbonate preservation is becom-ing well documented (Wootten et al 2008 Cohen and Holcomb 2009 Fabry et al 2009Miller et al 2009) Calcification rates of many carbonate producers are expected to decline(eg Kleypas and Yates 2009 Dersquoath et al 2009) with consequent impacts on ecosys-tem services and shellfisheries (Cooley et al 2009) The commensurate adjustment in
548 Journal of Marine Research [70 2-3
taphonomic decay rates has been little considered by comparison (eg Waldbusser et al2011) although both bioerosion and dissolution can be expected to be affected Becausetaphonomic decay tends to be a persistent process independent of the temporal vagaries ofbiological production of carbonate any increase in taphonomic rates will exact a dispro-portionate impact on the carbonate budget and further restrict the conditions under whichoyster reef development and persistence can occur
Acknowledgments Funding was provided by the NSF Biocomplexity in the Environment programgrant OCE-0412696 the NSF Ecology of Infectious Diseases program grant OCE-0622672 andthe National Sea Grant Oyster Disease Research Program grant NA07OAR4170047 We appreciatethis support
REFERENCES
Abbe G R 1988 Population structure of the American oyster Crassostrea virginica on an oysterbar in central Chesapeake Bay changes associated with shell planting and increased recruitmentJ Shellfish Res 7 33ndash40
Abell M J Braselton and L Braselton 2005 A host-microparasite model with a resistant host EcolComplexity 2 300ndash311
Addison C 2006 Oyster recruitment and early growth patterns in the Barataria Estuary MastersThesis Nicholls State University Thibodaux Louisiana 119 pp
Aline T 2008 Dissolution of dead corals by euendolithic microorganisms across the northern GreatBarrier Reef (Australia) Microb Ecol 55 569ndash580
Allen J R L 1974 Packing and resistance to compaction of shells Sedimentology 21 71ndash86Aller J Y 1995 Molluscan death assemblages on the Amazon shelf implication for physical and
biological controls on benthic populations Palaeogeogr Palaeoclimatol Palaeoecol 118 181ndash212
Andrews J D 1979 Oyster diseases in Chesapeake Bay Mar Fish Rev 41(1-2) 45ndash53mdashmdash J D 1988 Epizootiology of the disease caused by the oyster pathogen Perkinsus marinus and
its effects on the oyster industry Am Fish Soc Spec Publ 18 47ndash63Applegate A S Cadrin J Hoenig C Moore S Murawski and E Pikitch 1998 Evaluation of
existing overfishing definitions and recommendations for new overfishing definitions to complywith the sustainable fisheries act Overfishing Definition Review Panel Final Rpt NOAA NMFS179 pp
Austin H M D Evans and D S Haven 1996 A retrospective time series analysis of oysterCrassostrea virginica recruitment (1946ndash1993) J Shellfish Res 15 565ndash582
Bahr L M 1976 Energetic aspects of the intertidal oyster reef community at Sapelo Island Georgia(USA) Ecology 57 121ndash131
Bahr L M and W P Lanier 1981 The ecology of intertidal oyster reefs of the south Atlantic coasta community profile US Fish Wildl Serv FWSOBS-8115 105 pp
Banta S E E N Powell and K A Ashton-Alcox 2003 Evaluation of dredging effort by theDelaware Bay oyster fishery in New Jersey waters N Am J Fish Manag 23 732ndash741
Barber B J S E Ford and R N Wargo 1991 Genetic variation in the timing of gonadal maturationand spawning of the Eastern oyster Crassostrea virginica (Gmelin) Biol Bull (Woods Hole)181 216ndash224
Beck M W R D Brumbaugh L Airoldi A Carranza L D Coen C Crawford O Defeo GJ Edgar B Hancock M Kay H Lenihan M W Luckenbach C L Toropova amp G Zhang
2012] Powell et al Rise amp fall of Crassostrea virginica oyster reefs 549
2009 Shellfish reefs at risk A global analysis of problems and solutions The Nature ConservancyArlington Virginia 52 pp
Best M M R 2008 Contrast in preservation of bivalve death assemblages in siliciclastic and car-bonate tropical shelf settings Palaios 23 796ndash809
Best M M R and S M Kidwell 2000 Bivalve taphonomy in tropical mixed siliciclastic-carbonatesettings I Environmental variation in shell condition Paleobiology 26 80ndash102
Best M M R T C W Ku S M Kidwell and L M Walter 2007 Carbonate preservation in shallowwater environments unexpected role of tropical siliciclastics J Geol 115 437ndash456
Bojariu R and L Gimeno 2003 Predictability and numerical modelling of the North AtlanticOscillation Earth-Sci Rev 63 145ndash168
Boudreau B P 1991 Modelling the sulfide-oxygen reaction and associated pH gradients in porewa-ters Geochim Cosmochim Acta 55 145ndash159
mdashmdash 1986 Mathematics of tracer mixing in sediments II Nonlocal mixing and biological conveyor-belt phenomena Am J Sci 286 199ndash238
Bowling B G 1992 Rehabilitation of public oyster reefs damaged by a natural disaster in GalvestonBay Tex Parks Wildl Dept Manage Data Ser No 8 46 pp
Breitburg D L L D Coen M W Luckenbach R Mann M Posey and J A Wesson 2000 Oysterreef restoration convergence of harvest and conservation strategies J Shellfish Res 19 371ndash377
Breitburg D L and R S Fulford 2006 Oyster-sea nettle interdependence and altered control withinthe Chesapeake Bay ecosystem Estuaries Coasts 29 776ndash784
Brumbaugh R D M W Beck L D Coen L Craig and P Hicks 2006 A practitioners guide to thedesign amp monitoring of shellfish restoration projects An ecosystem services approach The NatureConservancy Arlington Virginia 30 pp
Burdige D J X P Hu R C Zimmerman 2010 The widespread occurrence of coupled carbonatedissolutionprecipitation in surface sediments on the Bahamas Bank Am J Sci 310 492ndash521
Burreson E M and L M Ragone Calvo 1996 Epizootiology of Perkinsus marinus disease of oystersin Chesapeake Bay with emphasis on data since 1985 J Shellfish Res 15 17ndash34
Bushek D D Richardson M Y Bobo and L D Coen 2004 Quarantine of oyster shell cultchreduces the abundance of Perkinsus marinus J Shellfish Res 23 369ndash373
Callender W R E N Powell and G M Staff 1994 Taphonomic rates of molluscan shells placedin autochthonous assemblages on the Louisiana continental slope Palaios 9 60ndash73
Cane M A 2005 The evolution of El Nintildeo past and future Earth Planet Sci Lett 230 227ndash240Carriker M R R E Palmer and R S Prezant 1980 Functional ultramorphology of the dissoconch
valves of the oyster Crassostrea virginica Proc Natl Shellfish Assoc 70 139ndash183Carver C E I Theacuteriault and A L Malley 2010 Infection of cultured eastern oysters Crassostrea
virginica by the boring sponge Cliona celeata with emphasis on sponge life history and mitigationstrategies J Shellfish Res 29 905ndash915
Cerco C F and M R Noel 2007 Can oyster restoration reverse cultural eutrophication inChesapeake Bay Estuaries Coasts 30 331ndash343
Choi K-S E A Wilson D H Lewis E N Powell and S M Ray 1989 The energetic cost ofPerkinsus marinus parasitism in oysters quantification of the thioglycollate method J ShellfishRes 8 125ndash131
Coco G S F Thrush M O Green and J E Hewitt 2006 Feedbacks between bivalve density flowand suspended sediment concentration on patch stable states Ecology 87 2862ndash2870
Coen L D R D Brumbaugh D Bushek R Grizzle M W Luckenbach M H Posey S P Powersand S G Tolley 2007 Ecosystem services related to oyster restoration Mar Ecol Prog Ser 341303ndash307
550 Journal of Marine Research [70 2-3
Cohen A L and M Holcomb 2009 Why corals care about ocean acidification uncovering themechanism Oceanography 22 118ndash127
Cohen A N and C J Zabin 2009 Oyster shells as vectors for exotic organisms J Shellfish Res28 163ndash167
Cooley S R H L Kite-Powell and S C Doney 2009 Ocean acidificationrsquos potential to alter globalmarine ecosystem services Oceanography 22 172ndash181
Cotter S C L E B Kruuk and K Wilson 2004 Costs of resistance genetic correlations andpotential trade-offs in an insect immune system J Evol Biol 17 421ndash429
Cummins H E N Powell R J Stanton Jr and G Staff 1986 The size-frequency distributionin palaeoecology the effects of taphonomic processes during formation of death assemblages inTexas bays Palaeontology (Lond) 29 495ndash518
Cutler A H 1995 Taphonomic implications of shell surface textures in Bahia la Choya northernGulf of California Palaeogeogr Palaeoclimatol Palaeoecol 114 219ndash240
Davies D J E N Powell and R J Stanton Jr 1989 Relative rates of shell dissolution and netsediment accumulation - a commentary can shell beds form by the gradual accumulation of bio-genic debris on the sea floor Lethaia 22 207ndash212
DeAlteris J T 1988 The geomorphic development of Wreck Shoal a subtidal oyster reef of theJames River Virginia Estuaries 11 240ndash249
mdashmdash 1989 The rate of bottom current and estuarine geomorphology on the sedimentation processesand productivity of Wreck Shoal an oyster reef of the James River Virginia in Estuarine circulationB J Neilson A Kuo and J Brubaker eds Clifton New Jersey The Humana Press Inc 279ndash307
Dersquoath G J M Lough and K E Fabricius 2009 Declining coral calcification on the Great BarrierReef Science (Wash DC) 323 116ndash119
Dittman D E S E Ford and D K Padilla 2001 Effects of Perkinsus marinus on reproductionand condition of the Eastern oyster Crassostrea virginica depend on timing J Shellfish Res 201025ndash1034
Dorschel B D Hebbeln A Ruumlggeberg and C Dullo 2007 Carbonate budget of a cold-water coralcarbonate mound Propeller Mound Porcupine Seabight Int J Earth Sci 96 73ndash83
Duffy M A and S E Forde 2009 Ecological feedbacks and the evolution of resistance J AnimEcol 78 1106ndash1112
Elner R W and R E Lavoie 1983 Predation on American oysters (Crassostrea virginica (Gmelin))by American lobsters (Homarus americanus Milne-Edwards) rock crabs (Cancer irroratus Say)and mud crabs (Neopanope sayi (Smith)) J Shellfish Res 3 129ndash134
Fabry V J J B McClintock J T Mathis and J M Grebmeier 2009 Ocean acidification at highlatitudes the bellweather Oceanography 22 160ndash171
Fegley S R S E Ford J N Kraeuter and H H Haskin 2003 The persistence of New Jerseyrsquosoyster seedbeds in the presence of oyster disease and harvest the role of management J ShellfishRes 22 451ndash464
Ford S E 1996 Range extension by the oyster parasite Perkinsus marinus into the northeasternUnited States response to climate change J Shellfish Res 15 45ndash56
mdashmdash 1997 History and present status of molluscan shellfisheries from Barnegat Bay to DelawareBay NOAA Tech Rpt NMFS 127 119ndash140
Ford S E and H H Haskin 1982 History and epizootiology of Haplosporidium nelsoni (MSX) anoyster pathogen in Delaware Bay 1957ndash1980 J Invertebr Pathol 40 118ndash141
Galtsoff P S 1931 Survey of oyster bottoms in Texas US Bur Fish Invest Report 6 30 ppGalvani A P and M Slatkin 2004 Intense selection in an age-structured population Proc R Soc
Lond B Biol Sci 271 171ndash176
2012] Powell et al Rise amp fall of Crassostrea virginica oyster reefs 551
Gottlieb S J and M E Schweighofer 1996 Oysters and the Chesapeake Bay ecosystem a case forexotic species introduction to improve environmental quality Estuaries 19 639ndash650
Green M A R C Aller and J Y Aller 1998 Influence of carbonate dissolution on survival ofshell-bearing meiobenthos in nearshore sediments Limnol Oceanogr 43 18ndash28
Green M A M E Jones C L Boudreau R L Moore and B A Westman 2004 Dissolutionmortality of juvenile bivalves in coastal marine deposits Limnol Oceanogr 49 727ndash734
Gregalis K C S P Powers and K L Heck Jr 2008 Restoration of oyster reefs along a bio-physicalgradient in Mobile Bay Alabama J Shellfish Res 27 1163ndash1169
Gullian M and L Aguirre-Macedo 2009 Seasonal variation of physiological parameters in theeastern oyster Crassostrea virginica from a tropical region of the Gulf of Mexico J Shellfish Res28 439ndash446
Gunter G 1938 A new oyster clutch [sic] for the Texas coast Proc Tex Acad Sci 21 14mdashmdash 1972 Use of dead reef shell and its relation to estuarine conservation Trans N Am Wildl Nat
Resour Conf pp 110ndash121mdashmdash 1979 The grit principle and the morphology of oyster reefs Proc Natl Shellfish Assoc 69
1ndash5Gunter G C E Dawson and W J Demoran 1957 Determination of how long oysters have been
dead by studies of their shells Proc Natl Shellfish Assoc 47 31ndash33Guyondet T V G Koutitonsky and S Roy 2005 Effects of water renewal estimates on the oyster
aquaculture potential of an inshore area J Mar Syst 58 35ndash51Haltuch M A A E Punt and M W Dorn 2008 Evaluating alternative estimators of fishery man-
agement reference points Fish Res 94 290ndash303Harding J M R Mann M J Southworth and J A Wesson 2010 Management of the Piankatank
River Virginia in support of oyster (Crassostrea virginica Gmelin 1791) fishery repletion JShellfish Res 29 867ndash888
Hargis Jr W J and D S Haven 1994 The precarious state of the Chesapeake public oyster resourcein Toward a sustainable coastal watershed the Chesapeake experiment Proceedings of the confer-ence 1ndash3 June 1994 Norfolk Va P Hill and S Nelson eds Chesapeake Research ConsortiumPublication No 149 559ndash584
Hasu T D P Benesh and E T Valtonen 2009 Differences in parasite susceptibility and costs ofresistance between naturally exposed and unexposed host populations J Evol Biol 22 699ndash707
Haven D S and J P Whitcomb 1983 The origin and extent of oyster reefs in the James RiverVirginia J Shellfish Res 3 141ndash151
Hayes P F and R W Menzel 1981 The reproductive cycle of early setting Crassostrea virginica(Gmelin) in the northern Gulf of Mexico and its implications for population recruitment BiolBull (Woods Hole) 160 80ndash88
Hilborn R 2002 The dark side of reference points Bull Mar Sci 70 403ndash408Hilborn R and C J Walters 1992 Quantitative fisheries stock assessment Choice dynamics and
uncertainty New York Chapman amp Hall 570 ppHofmann E E J M Klinck E N Powell S Boyles and M Ellis 1994 Modeling oyster populations
II Adult size and reproductive effort J Shellfish Res 13 165ndash182Hong W E Keppens P Nielsen A van Riet 1995 Oxygen and carbon isotope study of the Holocene
oyster reefs and paleoenvironmental reconstruction on the northwest coast of Bohai Bay ChinaMar Geol 124 289ndash302
Hopkins S H 1954 Oyster setting on the Gulf coast Proc Natl Shellfish Assoc 45 52ndash55mdashmdash 1956 Notes on the boring sponges in Gulf coast estuaries and their relation to salinity Bull
Mar Sci Gulf Caribb 6 44ndash58
552 Journal of Marine Research [70 2-3
mdashmdash 1962 Distribution of species of Cliona (boring sponge) on the eastern shore of Virginia inrelation to salinity Chesapeake Sci 3 121ndash124
Hover V C L M Walter and D R Peacor 2001 Early marine diagenesis of biogenic aragonite andMg-calcite new constraints from high-resolution STEM and AEM analyses of modern platformcarbonates Chem Geol 175 221ndash248
HSRL 2010 Report of the 2010 Stock Assessment Workshop (12th SAW) for the New JerseyDelaware Bay Oyster Beds Port Norris New Jersey Haskin Shellfish Research Laboratory RutgersUniversity 142 pp
Jackson J B C M X Kirby W H Berger K A Bjorndal L W Botsford B J Bourque RH Bradbury R Cooke J Erlandson J A Estes T P Hughes S Kidwell C B Lange H SLenihan J M Pandolfi C H Peterson R S Steneck M J Tegner and R R Warner 2001Historical overfishing and the recent collapse of coastal ecosystems Science (Wash DC) 293629ndash637
Jones A T J M Kennard G A Logan E Grosjean and J Marshall 2009 Fluid expulsion featuresassociated with sand waves on Australiarsquos central North West Shelf Geo-Marine Lett 29 233ndash248
Jordan S J and J M Coakley 2004 Long-term projections of eastern oyster populations undervarious management scenarios J Shellfish Res 23 63ndash72
Jordan S J K N Greenhawk C B McCollough J Vanisko and M L Homer 2002 Oyster biomassabundance and harvest in northern Chesapeake Bay trends and forecasts J Shellfish Res 21733ndash741
Jumars P A and A R M Nowell 1984 Fluid and sediment dynamic effects on marine benthiccommunity structure Am Zool 24 45ndash55
Kennedy V S and C B Krantz 1982 Comparative gametogenic and spawning patterns of the oysterCrassostrea virginica (Gmelin) in central Chesapeake Bay J Shellfish Res 2 133ndash140
Kennedy W J J D Taylor and A Hall 1969 Environmental and biological controls on bivalveshell mineralogy Biol Rev Camb Philos Soc 44 499ndash530
Kidwell S M 2001 Preservation of species abundance in marine death assemblages Science (WashDC) 294 1091ndash1094
Kidwell S M T A Rothfus and M M R Best 2001 Sensitivity of taphonomic signature to samplesize sieve size damage scoring system and target taxa Palaios 16 26ndash52
Kimmel D G and R I E Newell 2007 The influence of climate variation on eastern oyster(Crassostrea virginica) juvenile abundance in Chesapeake Bay Limnol Oceanogr 52 959ndash965
Kleypas J A and K K Yates 2009 Coral reefs and ocean acidification Oceanography 22 108ndash117Kosnik M A Q Hua D S Kaufman and R A Wuumlst 2009 Taphonomic bias and time-averaging in
tropical molluscan death assemblages differential shell half-lives in Great Barrier Reef sedimentPaleobiology 35 565ndash586
Kraeuter J N S Ford and M Cummings 2007 Oyster growth analysis a comparison of methodsJ Shellfish Res 26 479ndash491
Launey S and D Hedgecock 2001 High genetic load in the Pacific oyster Crassostrea gigasGenetics 159 255ndash265
Lawrence D 1968 Taphonomy and information losses in fossil communities Geol Soc Am Bull79 1315ndash1330
Lazo D G 2004 Bivalve taphonomy testing the effect of life habits on the shell condition of thelittleneck clam Protothaca (Protothaca) staminea (Mollusca Bivalvia) Palaios 19 451ndash459
Lenihan H S 1999 Physical-biological coupling on oyster reefs how habitat structure influencesindividual performance Ecol Monogr 69 251ndash275
Lescinsky H L 1993 Taphonomy and paleoecology of epibionts on the scallops Chlamys hastata(Sowerby 1843) and Chlamys rubida (Hinds 1845) Palaios 8 267ndash277
2012] Powell et al Rise amp fall of Crassostrea virginica oyster reefs 553
Lescinsky H L E Edinger and M J Risk 2002 Mollusc shell encrustation and bioerosion ratesin a modern epeiric sea taphonomy experiments in the Java Sea Indonesia Palaios 17 171ndash191
Loosanoff V L 1966 Time and intensity of setting of the oyster Crassostrea virginica in LongIsland Sound Biol Bull (Woods Hole) 130 211ndash227
MacKenzie Jr C L 1977 Development of an aquacultural program for rehabilitation of damagedoyster reefs in Mississippi Mar Fish Rev 39(8) 1ndash13
MacKenzie K and S C Bishop 1999 A discrete-time epidemiological model to quantify selectionfor disease resistance Anim Sci 69 543ndash551
Mackin J G 1959 A method of estimation of mortality rates in oysters Proc Natl Shellfish Assoc50 41ndash51
mdashmdash 1962 Oyster disease caused by Dermocystidium marinum and other microorganisms inLouisiana Publ Inst Mar Sci Univ Tex 7 132ndash229
Mackin J G and S H Hopkins 1962 Studies on oyster mortality in relation to natural environmentsand to oil fields in Louisiana Publ Inst Mar Sci Univ Tex 7 1ndash131
Mackin J G and A K Sparks 1962 A study of the effect on oysters of crude oil loss from a wildwell Publ Inst Mar Sci Univ Tex 7 230ndash261
Mallela J and C T Perry 2007 Calcium carbonate budgets for two coral reefs affected by differentialterrestrial runoff regimes Rio Bueno Jamaica Coral Reefs 26 129ndash145
Mann R 2000 Restoring the oyster reef communities in the Chesapeake Bay a commentaryJ Shellfish Res 19 335ndash339
Mann R and D A Evans 1998 Estimation of oyster Crassostrea virginica standing stock larvalproduction and advective loss in relation to observed recruitment in the James River VirginiaJ Shellfish Res 17 239ndash253
Mann R J M Harding and M J Southworth 2009 Reconstructing pre-colonial oyster demographicsin the Chesapeake Bay USA Estuar Coast Shelf Sci 85 217ndash222
Mann R and E N Powell 2007 Why oyster restoration goals in the Chesapeake Bay are not andprobably cannot be achieved J Shellfish Res 26 905ndash917
Marshall N 1954 Changes in the physiography of oyster bars in the James River Virginia NatlShellfish Assoc Conv Add pp 113ndash121
Martinius A W 1991 Growth rates and population dynamics in Crassostrea cf rarilamella fromthe Lower Eocene Roda Formation (southern Pyrenees Spain) Geol Mijnbouw 70 59ndash73
Maunder M N 2003 Is it time to discard the Schaefer model from the stock assessment scientistrsquostoolbox Fish Res 61 145ndash149
Meadows P S and A Meadows 1991 The geotechnical and geochemical implications of bioturbationin marine sedimentary ecosystems Symp Zool Soc Lond 63 157ndash181
Meyer D L and E C Townsend 2000 Faunal utilization of created intertidal Eastern oyster (Cras-sostrea virginica) reefs in the southeastern United States Estuaries 23 34ndash45
Miller A W A C Reynolds C Sobrino and G F Riedel 2009 Shellfish face uncertain future inhigh CO2 world influence of acidification on oyster larvae calcification and growth in estuariesPlos One 4(5) e5661 doi101371journalpone0005661
Moore H F 1907 Survey of oyster bottoms in Matagorda Bay Texas US Bur Fish Doc 6101ndash86
mdashmdash 1911 Condition and extent of the natural oyster beds of Delaware US Bur Fish Doc 7451ndash29
Nell J A I R Smith and A K Sheridan 1999 Third generation evaluation of Sydney rockoyster Saccostrea commercialis (Iredale and Roughley) breeding lines Aquaculture 170 195ndash203
554 Journal of Marine Research [70 2-3
Newell R I E and E W Koch 2004 Modeling seagrass density and distribution in response tochanges in turbidity stemming from bivalve filtration and seagrass sediment stabilization Estuaries27 793ndash806
Notaro M W-C Wang and W Gong 2006 Model and observational analysis of the northeast USregional climate and its relationship to the PNA and NAO patterns during early winter MonWeather Rev 134 3479ndash3505
Olsen L A S Johnston Jr D Mades D Lee G Molinaro and C Listowski 2006 Relocation ofoysters from Phillippi Creek (Sarasota Florida) to a nearby section of the intracoastal waterwayto create new reefs Fl Sci 69 80ndash91
Olszewski T F 2004 Modeling the influence of taphonomic destruction reworking and burial ontime-averaging in fossil accumulations Palaios 19 39ndash50
Parras A and S Casadiacuteo 2006 The oyster Crassostrea hatcheri (Ortmann 1897) a physicalecosystem engineer from the Upper Oligocene-Lower Miocene of Patagonia southern ArgentinaPalaios 21 168ndash186
Parsons-Hubbard K 2005 Molluscan taphofacies in recent carbonate reeflagoon systems and theirapplication to sub-fossil samples from reef cores Palaios 20 175ndash191
Paynter K T 1996 The effects of Perkinsus marinus infection on physiological processes in theEastern oyster Crassostrea virginica J Shellfish Res 15 119ndash125
Perry C T and S G Smithers 2006 Taphonomic signatures of turbid-zone reef developmentexamples from Paluma Shoals and Lugger Shoal inshore central Great Barrier Reef AustraliaPalaeogeogr Palaeoclimatol Palaeoecol 242 1ndash20
Perry C T and K G Taylor 2006 Inhibition of dissolution within shallow water carbonate sedimentsimpacts of terrigenous sediment input on syn-depositional carbonate diagenesis Sedimentology53 495ndash513
Peterson C H 1976 Relative abundances of living and dead molluscs in two California lagoonsLethaia 9 137ndash148
Peterson C H H C Summerson and P B Duncan 1984 The influence of seagrass cover on popula-tion structure and individual growth rate of a suspension-feeding bivalve Mercenaria mercenariaJ Mar Res 42 123ndash138
Powell E N 1992 A model for death assemblage formation Can sediment shelliness be explainedJ Mar Res 50 229ndash265
Powell E N and K A Ashton-Alcox 2004 A comparison between a suction dredge and a tradi-tional oyster dredge in the transplantation of oysters in Delaware Bay J Shellfish Res 23 803ndash823
Powell E N K A Ashton-Alcox S E Banta and A J Bonner 2001 Impact of repeated dredgingon a Delaware Bay oyster reef J Shellfish Res 20 961ndash975
Powell E N K A Ashton-Alcox J A Dobarro M Cummings and S E Banta 2002 The inherentefficiency of oyster dredges in survey mode J Shellfish Res 21 691ndash695
Powell E N K A Ashton-Alcox and J N Kraeuter 2007 Reevaluation of eastern oyster dredgeefficiency in survey mode Application in stock assessment N Am J Fish Manage 27 492ndash511
Powell E N K A Ashton-Alcox J N Kraeuter S E Ford and D Bushek 2008a Long-termtrends in oyster population dynamics in Delaware Bay Regime shifts and response to diseaseJ Shellfish Res 27 729ndash755
Powell E N C E Brett K M Parsons-Hubbard W R Callender G M Staff S E Walker ARaymond and K A Ashton-Alcox 2011b The relationship of bionts and taphonomic processesin molluscan taphofacies formation on the continental shelf and slope eight-year trends ndash Gulf ofMexico and Bahamas Facies 57 15ndash37
2012] Powell et al Rise amp fall of Crassostrea virginica oyster reefs 555
Powell E N W R Callender G M Staff K M Parsons-Hubbard C E Brett S E Walker ARaymond and K A Ashton-Alcox 2008b Mollusc shell condition after eight years on the seafloor ndash taphonomy in the Gulf of Mexico and Bahamas J Shellfish Res 27 191ndash225
Powell E N and D J Davies 1990 When is an ldquooldrdquo shell really old J Geol 98 823ndash844Powell E N J D Gauthier E A Wilson A Nelson R R Fay and J M Brooks 1992 Oyster disease
and climate change Are yearly changes in Perkinsus marinus parasitism in oysters (Crassostreavirginica) controlled by climatic cycles in the Gulf of Mexico PSZNI Mar Ecol 13 243ndash270
Powell E N J J Gendek and K A Ashton-Alcox 2005 Fisherman choice and incidental catchsize frequency of oyster landings in the New Jersey oyster fishery J Shellfish Res 24 469ndash476
Powell E N and J M Klinck 2007 Is oyster shell a sustainable estuarine resource J ShellfishRes 26 181ndash194
Powell E N J M Klinck K A Ashton-Alcox and J N Kraeuter 2009a Multiple stable referencepoints in oyster populations biological relationships for the eastern oyster (Crassostrea virginica)in Delaware Bay Fish Bull 107 109ndash132
mdashmdash 2009b Multiple stable reference points in oyster populations implications for reference point-based management Fish Bull 107 133ndash147
Powell E N J M Klinck X Guo E E Hofmann S E Ford and D Bushek 2011c Can oystersCrassostrea virginica develop resistance to Dermo disease in the field evaluation using a gene-based population dynamics model J Shellfish Res 30 685ndash712
Powell E N J M Klinck X Guo E E Hofmann S E Ford and D Bushek 2012 Can oystersCrassostrea virginica develop resistance to Dermo disease in the field the impediment posed byclimate cycles J Mar Res 70 309ndash355
Powell E N J M Klinck and E E Hofmann 1996 Modeling diseased oyster populations IITriggering mechanisms for Perkinsus marinus epizootics J Shellfish Res 15 141ndash165
mdashmdash 2011a Generation time and the stability of sex-determining alleles in oyster populations asdeduced using a gene-based population dynamics model J Theor Biol 271 27ndash43
Powell E N J M Klinck E E Hofmann E A Wilson-Ormond and M S Ellis 1995b Modelingoyster populations V Declining phytoplankton stocks and the population dynamics of Americanoyster (Crassostrea virginica) populations Fish Res 24 199ndash222
Powell E N J N Kraeuter and K A Ashton-Alcox 2006 How long does oyster shell last on anoyster reef Estuar Coast Shelf Sci 69 531ndash542
Powell E N J Song M S Ellis and E A Wilson-Ormond 1995a The status and long-term trendsof oyster reefs in Galveston Bay Texas J Shellfish Res 14 439ndash457
Powell E N G M Staff W R Callender K A Ashton-Alcox C E Brett K M Parsons-HubbardS E Walker and A Raymond 2011d Taphonomic degradation of molluscan remains duringthirteen years on the continental shelf and slope of the northwestern Gulf of Mexico PalaeogeogrPalaeoclimatol Palaeoecol 312 209ndash232
Powell E N G M Staff D J Davies and W R Callender 1989 Macrobenthic death assemblagesin modern marine environments formation interpretation and application Crit Rev Aquat Sci1555ndash589
Powell E N M E White E A Wilson and S M Ray 1987a Small-scale spatial distribution of apyramidellid snail ectoparasitic Boonea impressa in relation to its host Crassostrea virginica onoyster reefs PSZNI Mar Ecol 8 107ndash130
mdashmdash 1987b Small-scale spatial distribution of oysters (Crassostrea virginica) on oyster reefs BullMar Sci 41 835ndash855
Power A B Corley D Atkinson R Walker D Harris J Manley and T Johnson 2010 A cautionagainst interpreting and quantifying oyster habitat loss from historical surveys J Shellfish Res29 927ndash936
556 Journal of Marine Research [70 2-3
Precht E and M Huettel 2004 Rapid wave-driven advective pore water exchange in a permeablecoastal sediment J Sea Res 51 93ndash107
Pufahl P K and N P James 2006 Monospecific Pliocene oyster buildups Murray Basin South Aus-tralia brackish water end member of the reef spectrum Palaeogeogr Palaeoclimatol Palaeoecol233 11ndash33
Ragone Calvo L M R L Wetzel and E M Burreson 2001 Development and verification of amodel for the population dynamics of the protistan parasite Perkinsus marinus within its host theeastern oyster Crassostrea virginica in Chesapeake Bay J Shellfish Res 20 231ndash241
Ray S M 1996 Historical perspective on Perkinsus marinus disease of oysters in the Gulf of MexicoJ Shellfish Res 15 9ndash11
Restrepo V R G G Thompson P M Mace W K Gabriel L L Low A D MacCall R D MethotJ E Powers B L Taylor P R Wade and J F Witzig 1998 Technical guidance on the use ofprecautionary approaches to implementing National Standard 1 of the MagnusonStevens FisheryConservation and Management Act NOAA Tech Mem NMFS-FSPO-31 54 pp
Rodney W S and K T Paynter 2006 Comparisons of macrofaunal assemblages on restored andnon-restored oyster reefs in mesohaline regions of Chesapeake Bay in Maryland J Exp Mar BiolEcol 335 39ndash51
Rosenberg G D 1980 The ldquovital effectrdquo on skeletal trace element content as exemplified by magne-sium in Skeletal biomineralization patterns processes and evolutionary trends J G Carter edvol 1 chap 23 pp 567ndash577
Rothschild B J J S Ault P Goulletquer and M Heacuteral 1994 Decline of the Chesapeake Bay oysterpopulations a century of habitat destruction and overfishing Mar Ecol Prog Ser 111 29ndash39
Royer J M Ropert M Mathieu and K Costil 2006 Presence of spionid worms and other epibiontsin Pacific oysters (Crassostrea gigas) cultured in Normandy France Aquaculture 253 461ndash474
Sartoretto S 1998 Bioeacuterosion des concreacutetions coralligegraveres de Meacutediterraneacutee par les organismes per-forants essai de quantification des processus CR Acad Sci Paris Sci Terre Planeacutetes 327831ndash844
Smith G F D G Bruce E B Roach A Hansen R I E Newell and A M McManus 2005Assessment of recent habitat conditions of eastern oyster Crassostrea virginica bars in mesohalineChesapeake Bay N Am J Fish Manage 25 1569ndash1590
Smith G F K N Greenhawk D G Bruce E B Roach and S J Jordan 2001 A digital presentationof the Maryland oyster habitat and associated bottom types in the Chesapeake Bay (1974ndash1983)J Shellfish Res 20 197ndash206
Soniat T M B C Broadhurst III and E L Haywood III 1991 Alternatives to clam shell as cultchfor oysters and the use of gypsum for the production of cultchless oysters J Shellfish Res 10405ndash410
Soniat T M E E Hofmann J M Klinck and E N Powell 2009 Differential modulation of easternoyster (Crassostrea virginica) disease parasites by the El Nintildeo-Southern Oscillation and the NorthAtlantic Oscillation Int J Earth Sci 98 99ndash114
Soniat T M J M Klinck E N Powell and E E Hofmann 2006 Understanding the success andfailure of oyster populations climatic cycles and Perkinsus marinus J Shellfish Res 25 83ndash93
Southworth M J M Harding J A Wesson and R Mann 2010 Oyster (Crassostrea virginicaGmelin 1791) population dynamics on public reefs in the Great Wicomico River Virginia USAJ Shellfish Res 29 271ndash290
Southworth M and R Mann 1998 Oyster reef broodstock enhancement in the Great WicomicoRiver Virginia J Shellfish Res 17 1101ndash1114
mdashmdash 2004 Decadal scale changes in seasonal patterns of oyster recruitment in the Virginia subestuaries of the Chesapeake Bay J Shellfish Res 23 391ndash402
2012] Powell et al Rise amp fall of Crassostrea virginica oyster reefs 557
Staff G M and E N Powell 1990 Taphonomic signature and the imprint of taphonomic historydiscriminating between taphofacies of the inner continental shelf and a microtidal inlet in Paleo-community temporal dynamics the long-term development of multispecies assemblages W MillerIII ed Spec Publ (Paleontol Soc) 5 370ndash390
Stauber L A 1950 The problem of physiological species with special reference to oysters and oysterdrills Ecology 31 109ndash118
Stiner J L and L J Walters 2008 Effects of recreational boating on oyster reef architecture andspecies interactions Fl Sci 71 31ndash44
Strayer D L and H M Malcom 2007 Shell decay rates of native and alien freshwater bivalves andimplications for habitat engineering Freshwater Biol 52 1611ndash1617
Tamburri M N M W Luckenbach D L Breitburg and S M Bonniwell 2008 Settlement ofCrassostrea ariakensis larvae effects of substrate biofilms sediment and adult chemical cuesJ Shellfish Res 27 601ndash608
Taylor J and D Bushek 2008 Intertidal oyster reefs can persist and function in a temperate NorthAmerican Atlantic estuary Mar Ecol Prog Ser 361 301ndash306
Taylor J D and M Layman 1972 The mechanical properties of bivalve (Mollusca) shell structuresPalaeontology (Lond) 15 73ndash87
Thatje S O Heilmayer and J Laudien 2008 Climate variability and El Nintildeo Southern Oscillationimplications for natural coastal resources and management Helgol Mar Res 62 (Suppl 1) S5ndashS14
Tolan J M 2007 El Nintildeo-Southern Oscillation impacts translated to the watershed scale estuarinesalinity patterns along the Texas Gulf coast 1982 to 2004 Estuar Coast Shelf Sci 72 247ndash260
Tomašovyacutech A F T Fuumlrsich and T D Olszewski 2006 Modeling shelliness and alteration in shellbeds variation in hardpart input and burial rates leads to opposing predictions Paleobiology 32278ndash298
Tribble G W 1993 Organic matter oxidation and aragonite diagenesis in a coral reef J SedimentPetrol 63 523ndash527
Tribble G W F J Sansone R W Buddemeier and Y H Li 1992 Hydraulic exchange between acoral reef and surface sea water Geol Soc Am Bull 104 1280ndash1291
Twichell D L Edmiston B Andrews W Stevenson J Donoghue R Poore and L Osterman2010 Geologic controls on the recent evolution of oyster reefs in Apalachicola Bay and St GeorgeSound Florida Estuar Coast Shelf Sci 88 385ndash394
Villiers S de 2005 Foraminiferal shell-weight evidence for sedimentary calcite dissolution abovethe lysocline Deep Sea Res I 52 671ndash680
Waldbusser G G R A Steenson and M A Green 2011 Oyster shell dissolution rates in estuarinewaters effects of pH and shell legacy J Shellfish Res 30 659ndash669
Walker S E and S T Goldstein 1999 Taphonomic tiering experimental field taphonomy of mol-luscs and foraminifera above and below the sediment water interface Palaeogeogr PalaeoclimatolPalaeoecol 149 227ndash244
Walter L M and E A Burton 1990 Dissolution of recent platform carbonate sediments in marinepore fluids Am J Sci 290 601ndash645
Wang Y and X Guo 2007 Development and characterization of EST-SSR markers in the easternoyster Crassostrea virginica Mar Biotechnol 9 500ndash511
Wang Y Z Xu J C Pierce and X Guo 2005 Characterization of eastern oyster (Crassostreavirginica Gmelin) chromosomes by fluorescence in situ hybridization with bacteriophage P1 clonesMar Biotechnol 7 207ndash214
Wang Z P X M Guo S K Allen Jr and R Wang 1999 Aneuploid Pacific oyster (Crassostreagigas Thunberg) as incidentals from triploid production Aquaculture 173 347ndash357
558 Journal of Marine Research [70 2-3
Warburton F E 1958 Control of the boring sponge on oyster beds Fish Res Bd Canada Prog RepAtl Coast Stns 69 7ndash11
Wilber D H 1992 Associations between freshwater inflows and oyster productivity in ApalachicolaBay Florida Estuar Coast Shelf Sci 35 179ndash190
Wilhoit L R 1991 Modelling the population dynamics of different aphid genotypes in plant varietymixtures Ecol Modelling 55 257ndash283
Wilson E A M E White E N Powell and S M Ray 1988 Patch formation by the ectoparasiticsnail Boonea impressa on its oyster host Crassostrea virginica Veliger 31 101ndash110
Wilson-Ormond E A E N Powell and S M Ray 1997 Short-term and small-scale variation infood availability to natural oyster populations food flow and flux PSZNI Mar Ecol 18 1ndash34
Wisshak M M Gektidis A Freiwald and T Lundaumllv 2005 Bioerosion along a bathymetric gradientin a cold-temperate setting (Kosterfjord SW Sweden) an experimental study Facies 51 93ndash117
Woods H W J Hargis Jr C H Hershner and P Mason 2005 Disappearance of the natural emergent3-dimensional oyster reef system of the James River Virginia 1871ndash1948 J Shellfish Res 24139ndash142
Wootton J T C A Pfister and J D Forester 2008 Dynamic patterns and ecological impacts ofdeclining ocean pH in a high-resolution multi-year dataset P Natl Acad Sci USA 105 18848ndash18853
Yoon H S Park K Lee and J Park 2004 Oyster shell as substitute for aggregate in mortar WasteManage Res 22 158ndash170
Zbinden M C R Haag and D Ebert 2008 Experimental evolution of field populations of Daphniamagna in response to parasite treatment J Evol Biol 21 1068ndash1078
Zuschin M M Stachowitsch and R J Stanton Jr 2003 Patterns and processes of shell fragmentationin modern and ancient marine environments Earth Sci Rev 63 33ndash82
Received 11 November 2011 revised 12 March 2012
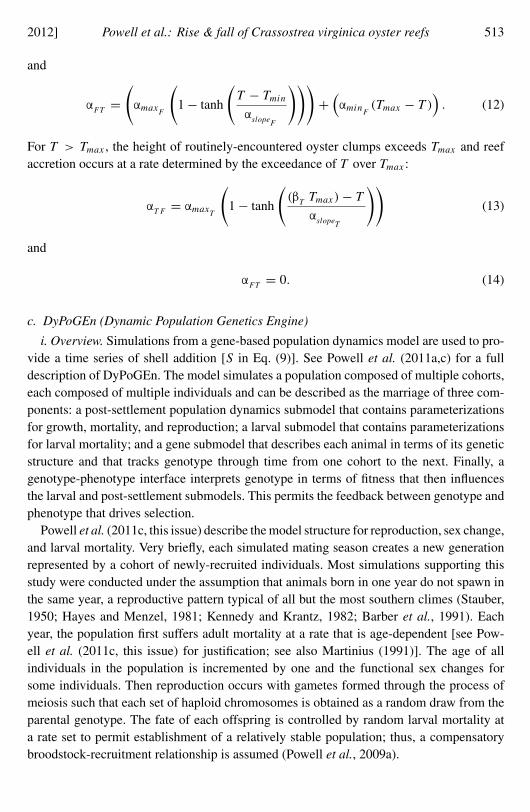
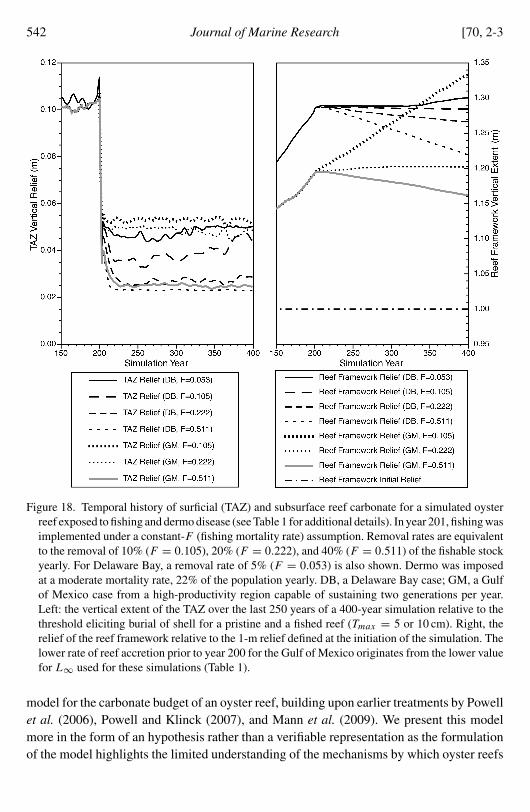