Embed Size (px)
Citation preview
ELECTRICITY MARKETS & POLICYENERGY TECHNOLOGIES AREA ENERGY ANALYSIS AND ENVIRONMENTAL IMPACTS DIVISION
The Rise of the Hybrid Power Plant Will GormanLawrence Berkeley National Laboratory
July 2020
This work was funded by the U.S. Department of Energy under Contract No. DE-AC02-05CH11231. The views and opinions of the authors expressed herein do not necessarily state or reflect those of the United States Government or any agency thereof, or The Regents of the University of California.

Introduction and motivation
2
Integrating growing levels of variable renewable energy (wind and solar) may require strategies
that enhance grid-system flexibility
• Storage technologies can be used for enhanced flexibility
• Due to declining costs, batteries have become a popular choice
Developers have increasing interest in co-locating generation with
batteries at the point of interconnection, rather than siting
separately
• Siting choice depends on multiple considerations…
• …which can also impact effective renewable integration

Wholesale market rules related to hybridization are under development within ISOs and at FERC
3
Need for information on advantages & disadvantages of hybridization, development trends, cost & value, and wholesale market participation options
& issues to help inform these proceedings and the energy sector more broadly
FERC Order 841
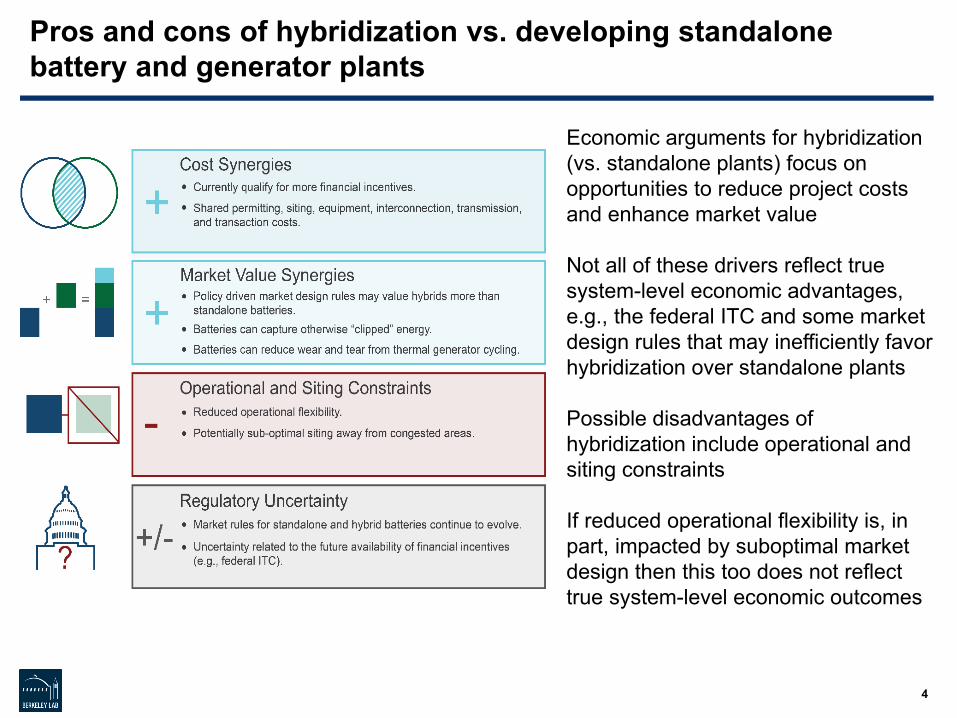
Pros and cons of hybridization vs. developing standalone battery and generator plants
4
Economic arguments for hybridization (vs. standalone plants) focus on opportunities to reduce project costs and enhance market value
Not all of these drivers reflect true system-level economic advantages, e.g., the federal ITC and some market design rules that may inefficiently favor hybridization over standalone plants
Possible disadvantages of hybridization include operational and siting constraints
If reduced operational flexibility is, in part, impacted by suboptimal market design then this too does not reflect true system-level economic outcomes
ELECTRICITY MARKETS & POLICYENERGY TECHNOLOGIES AREA ENERGY ANALYSIS AND ENVIRONMENTAL IMPACTS DIVISION
Existing Hybrid Projects:Installed by end of 2019

Hybrid / co-located projects of various configurations exist as of the end of 2019, but market remains limited in overall size
Sources: EIA 860 2019 Early Release, Berkeley Lab
6
Installed at end of 2019 # projects Gen 1 (MW)
Gen 2 (MW)
Gen 3 (MW)
Total Gen (MW)
Storage capacity
(MW)
Storage energy (MWh)
Storage: generator
ratio
Duration (hrs)
Wind+Storage 13 1,290 0 0 1,290 184 109 14% 0.6Wind+PV+Storage 2 216 21 0 237 34 15 15% 0.4Wind+Fossil+Storage 1 5 12 0 17 1 1 7% 0.8Wind+PV+Fossil+Storage 1 0.1 0.1 1 1 0 1 25% 1.7Wind+PV 6 535 212 0 747 0 0 0% n/aWind+PV+Fossil 3 6 2 98 106 0 0 0% n/aWind+Fossil 8 27 79 0 106 0 0 0% n/aPV+Storage 40 882 0 0 882 169 446 19% 2.6PV+Fossil 26 77 6,876 0 6,953 0 0 0% n/aPV+Fossil+Storage 3 9 10 0 20 5 9 24% 1.9PV+Biomass 3 4 15 0 19 0 0 0% n/aPV+Geothermal 2 18 85 0 103 0 0 0% n/aPV+Geothermal+CSP 1 22 47 2 71 0 0 0% n/aCSP+Storage 2 390 0 0 390 390 2,780 100% 7.1Fossil+Storage 10 2,414 0 0 2,414 91 84 4% 0.9Hydro+Storage 4 71 0 0 71 12 11 17% 0.9
125 projects, 13.4 GW of generating capacity, 0.9 GW storage capacity
Note: Pumped hydro is not considered a hybrid resource for the purpose of this compilation. The hydro+storage plants noted in the table pair hydropower with batteries.

Comparing the frequency and design of a subset of the various hybrid / co-located project configurations: end of 2019
Sources: EIA 860 2019 Early Release, Berkeley Lab
Notes: Not included in the figure are 54 other hybrid / co-located projects with other configurations; details on those projects are provided in the table on the previous slide. Storage ratio defined as average storage capacity divided by total generation capacity. Duration defined as average MWh of storage divided by MW of storage.
7
# projects Total capacity (MW) Storage ratio Duration (hrs)
Wind PV Fossil Storage
PV+Storage 40 881.6 169.1 19% 2.6
Wind+Storage 13 1,289.9 183.6 14% 0.6
Wind+PV+Storage 2 215.8 20.7 34.3 15% 0.4
Fossil+Storage 10 2,413.6 91.0 4% 0.9
Wind+PV 6 535.3 211.5 0.0 n/a n/a
0 500 1000 1500 2000 2500
Wind
PV
Fossil
Storage

PV hybrid / co-located projects of various configurations as of the end of 2019, and over time
Online PV Hybrid / Co-located Projects
Sources: EIA 860 2019 Early Release, Berkeley Lab
Growth in PV Hybrid / Co-located Projects over Time
8
Note: PV+fossil plants involve minor amount of PV added to larger fossil units at the point of interconnection: thus, the fossil category dominates this figure
Note: The larger PV+storage projects in California are in LADWP’s service territory, not CAISO
depicts amount of PV and other types of generation and storage being
paired with PV, over time

Wind hybrid / co-located projects of various configurations as of the end of 2019, and over time
Online Wind Hybrid / Co-located Projects Growth in Wind Hybrid / Co-located Projects over Time
9Sources: EIA 860 2019 Early Release, Berkeley Lab
depicts amount of wind and other types of generation and storage being
paired with wind, over time

Sources: EIA 860 2019 Early Release, Berkeley Lab
Standalone storage (even excluding pumped hydro) capacity exceeds the storage capacity included in existing hybrids
• Standalone storage capacity (battery, flywheel and CAES, excluding pumped hydro) is greatest in PJM, CAISO, Southeast
• Standalone storage capacity exceeds storage capacity included in wind+storage, PV+storage, and fossil+storage hybrids
• Storage capacity included in hybrids is located roughly in proportion to where the hybrid plants are located
10

ELECTRICITY MARKETS & POLICYENERGY TECHNOLOGIES AREA ENERGY ANALYSIS AND ENVIRONMENTAL IMPACTS DIVISION
Longer-term Pipeline:Interconnection Queues at end of 2019
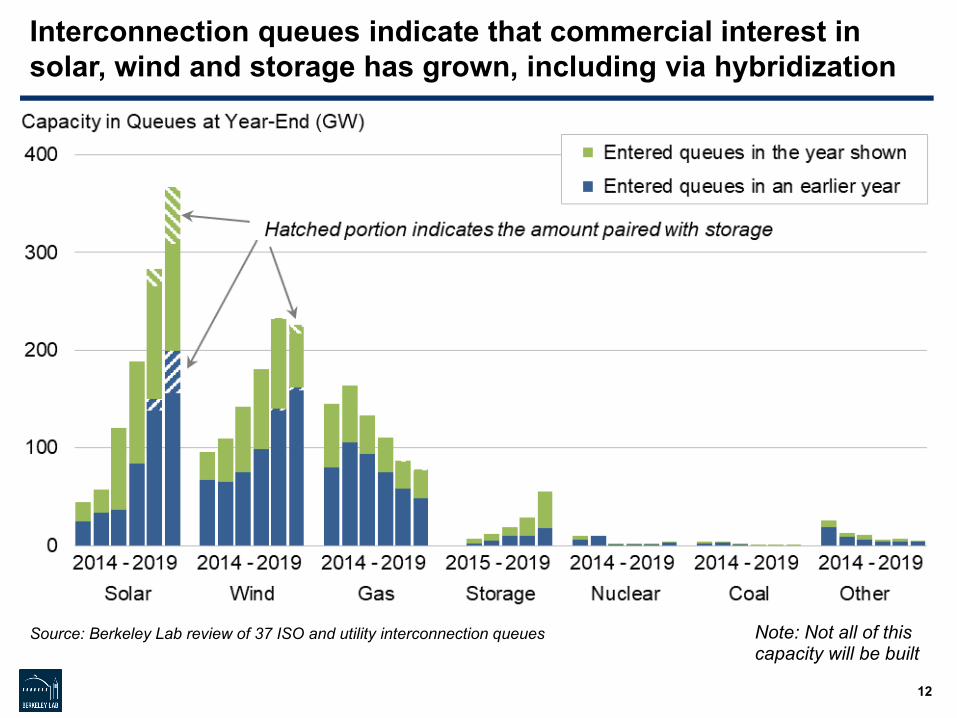
Interconnection queues indicate that commercial interest in solar, wind and storage has grown, including via hybridization
Note: Not all of this capacity will be built
Source: Berkeley Lab review of 37 ISO and utility interconnection queues
12

Interest in hybrid plants has increased: 28% of solar proposed as hybrids (102 GW), 5% of wind proposed as hybrids (11 GW)
Notes: (1) Not all of this capacity will be built; (2) Hybrid plants involving multiple generator types (e.g., wind+PV+ storage, wind+PV) show up in all generator categories, presuming the capacity is known for each type.
Source: Berkeley Lab review of interconnection queues
13
Solar+Storage and Wind+Storageconfigurations are more common than
other hybrid types1
1 Emphasis was placed on identification of wind+storage and solar+storage: other hybrid configurations are likely undercounted.

Solar+storage is dominant hybrid type in queues, wind+storageis much less common; CAISO & West of greatest interest so far
14Source: Berkeley Lab review of interconnection queues Note: Not all of this capacity will be built
Average storage:generation capacity ratio for solar+storage (66%) is higher than for wind+storage
(27%), in subset of ISO queues; these are both much higher than for existing hybrid plants shown earlier
Wind+Storage Solar+StorageCAISO 25% 78%ERCOT 54% 38%SPP 23% 38%NYISO 7% 49%Combined 27% 66%
Storage:Generation Capacity RatioRegion
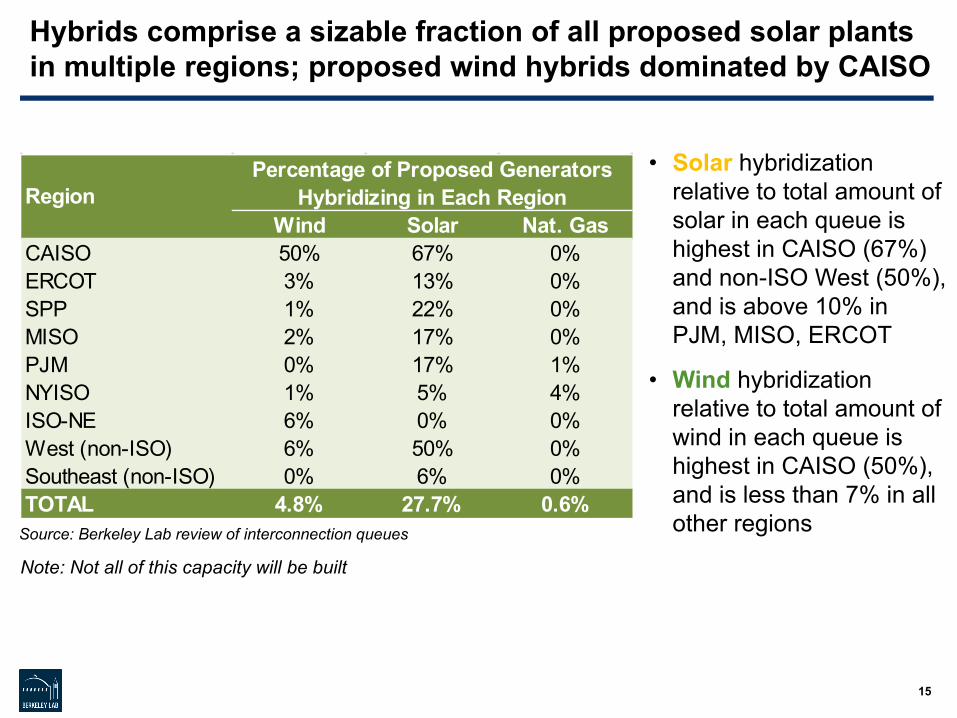
Hybrids comprise a sizable fraction of all proposed solar plants in multiple regions; proposed wind hybrids dominated by CAISO
Note: Not all of this capacity will be built
Source: Berkeley Lab review of interconnection queues
15
• Solar hybridization relative to total amount of solar in each queue is highest in CAISO (67%) and non-ISO West (50%), and is above 10% in PJM, MISO, ERCOT
• Wind hybridization relative to total amount of wind in each queue is highest in CAISO (50%), and is less than 7% in all other regions
Wind Solar Nat. GasCAISO 50% 67% 0%ERCOT 3% 13% 0%SPP 1% 22% 0%MISO 2% 17% 0%PJM 0% 17% 1%NYISO 1% 5% 4%ISO-NE 6% 0% 0%West (non-ISO) 6% 50% 0%Southeast (non-ISO) 0% 6% 0%TOTAL 4.8% 27.7% 0.6%
Percentage of Proposed Generators Hybridizing in Each RegionRegion

ELECTRICITY MARKETS & POLICYENERGY TECHNOLOGIES AREA ENERGY ANALYSIS AND ENVIRONMENTAL IMPACTS DIVISION
Cost and Valuation of Hybrid Projects

Levelized PPA prices for PV-battery projects are declining
Hawaiian prices dropped from around $120/MWh in 2015 to around $70/MWh by the end of 2018
For southwestern U.S. projects, prices dropped from $40–$70/MWh in 2017 to $20–$30/MWh in 2018 and 2019
Hawaiian hybrids priced at premium; may be attributable to higher construction cost and higher battery-generator ratios
17

Battery PPA premium for 4-hr duration storage is ~$4-14/MWh depending on battery size relative to PV capacity
Six of the 23 PV-battery PPAs provide information to enable calculation of a battery adder (e.g., through separate capacity payments for battery component)
For 4-hr duration storage, as the battery capacity increases from 25% to 50% and 75% of the PV capacity, the levelized battery adder increases linearly from $4/MWh-delivered to about $10/MWh-delivered and $14/MWh-delivered, respectively
18

Simple optimization model used to provide preliminary insights into value of hybridization, vs. standalone
System specifications 4-hour, AC-coupled battery (81% roundtrip efficiency) Battery sized to 50% of renewable capacity No battery degradation cost
Optimization Storage dispatch maximizes hourly real-time energy market
revenue with perfect foresight (exclude AS, given relatively small size of AS markets)
Alternative bounding scenarios using 15-minute real-time prices and perfect foresight (highest case) and day-ahead persistence method (low case)
Hybrid charges from generator only (not from grid), given federal ITC
Inputs Price taker analysis using SP15 (CA) and West Hub (ERCOT)
prices from 2016-2018 PV profiles modeled from weather data; wind profiles represent
aggregate production in SP15 and West Texas regions Same renewable profiles used for hybrid and standalone system Standalone batteries assumed to access same pricing nodes as in
hybrid In CA, hybrids get the wind/solar capacity credit plus 100% capacity
credit of storage, capped at the generator nameplate capacity (also assumed to be POI limit)
19
Hybrid Project Market Value
BatteryConstraints
VREProfiles
MarketPrices
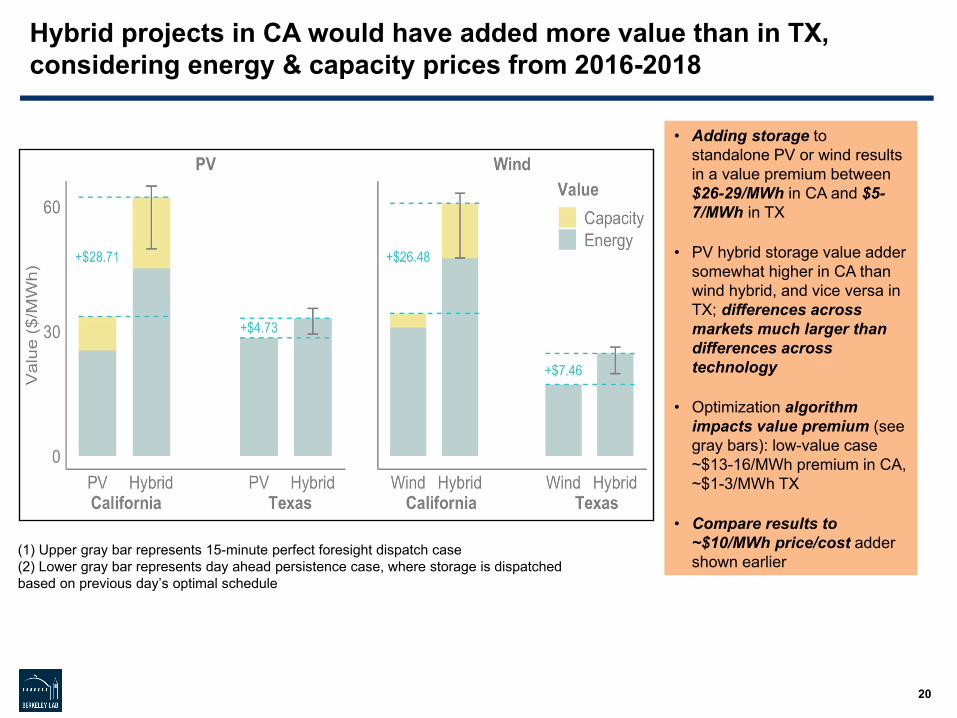
Hybrid projects in CA would have added more value than in TX, considering energy & capacity prices from 2016-2018
20
• Adding storage to standalone PV or wind results in a value premium between $26-29/MWh in CA and $5-7/MWh in TX
• PV hybrid storage value adder somewhat higher in CA than wind hybrid, and vice versa in TX; differences across markets much larger than differences across technology
• Optimization algorithm impacts value premium (see gray bars): low-value case ~$13-16/MWh premium in CA, ~$1-3/MWh TX
• Compare results to ~$10/MWh price/cost adder shown earlier
(1) Upper gray bar represents 15-minute perfect foresight dispatch case(2) Lower gray bar represents day ahead persistence case, where storage is dispatched based on previous day’s optimal schedule

Constraints on hybrid projects lead to somewhat lower value relative to standalone projects without constraints
21
Two constraints drive difference(1) Hybrid cannot
charge from grid • Would disappear or be
relaxed post-ITC
(2) Point of interconnection limit
• Developer choice but queues suggest hybrids sizing POI limit close to size of generator
NOTE: Analysis assumes standalone battery delivers to same pricing node as hybrid; as such, analysis likely understates value of standalone storage and so also understates value-reduction due to hybridizationBenefits of hybridization from receiving the investment tax
credit and reducing interconnection costs need to be weighed against this value loss from hybridization

Questions?
Contact the presenterWill Gorman ([email protected])
Additional project team at Lawrence Berkeley National Laboratory:Andrew MillsRyan WiserMark Bolinger Joe RandCristina Crespo Jo SeelCody WarnerBen Paulos
22
Download all of our work at:
http://emp.lbl.gov/reports/re
Follow the Electricity Markets & Policy Group on Twitter:
@BerkeleyLabEMP
This work is funded by the Office and Electricity and the Office of Energy Efficiency and Renewable Energy of the U.S. Department of Energy

ELECTRICITY MARKETS & POLICYENERGY TECHNOLOGIES AREA ENERGY ANALYSIS AND ENVIRONMENTAL IMPACTS DIVISION
Extra Slides

Methods and Data Source: Online Projects
Form EIA-860 2019 early release Generator specific information for power plants with >1 MW combined capacity
Very limited amount of spot checking for corrections to EIA data
Hybrids identified by having the same EIA ID Suggests co-location of generators at one plant / point of interconnection, but not
necessarily co-controlled generators
Virtual hybrids cannot be identified; smaller plants excluded
24
Challenges and Limitations: Difficult to separate behind-the-
meter/micro-grid resources from front of the meter resources
EIA ID does not identify all hybrids or co-located plants as some co-located plants could have different IDs

Hybrid / co-located projects of various configurations exist as of the end of 2019, but market remains limited in overall sizeWind Hybrids / Co-Located Projects
Wind+Storage dominates configurations: 13 projects, 1,290 MW wind, 184 MW storage Small storage:generator ratios (14%) and storage durations (0.6 hrs) on average, built for AS markets
Wind+PV (535 MW wind) and Wind+PV+Storage (216 MW wind) also present Configurations that include fossil involve minor amounts of wind
PV Hybrids / Co-Located Projects PV+Storage dominates configurations: 40 projects, 882 MW solar, 169 MW storage
Small storage:generator ratios (19%), but longer storage durations (2.6 hrs) on average
PV+Fossil is common (26 projects) but involves minor amount of PV (77 MW) added to fossil units (6,876 MW, including 3 coal plants totaling 5 GW) at point of interconnection
Other configurations w/ wind, fossil, biomass, geothermal, CSP involve small amount of PV Fossil Hybrids / Co-Located Projects
Fossil+PV is most common: small amount of PV added to larger fossil units (6,876 MW) Fossil+Storage also relatively common (10 projects, 2,414 MW fossil, 91 MW storage)
Small storage:generator ratios (4%) and storage durations (0.9 hrs) on average, built for AS markets
CSP, Geothermal, Hydropower, Biomass Hybrids / Co-located Projects Multiple configurations, with CSP+Storage involving the most capacity
25
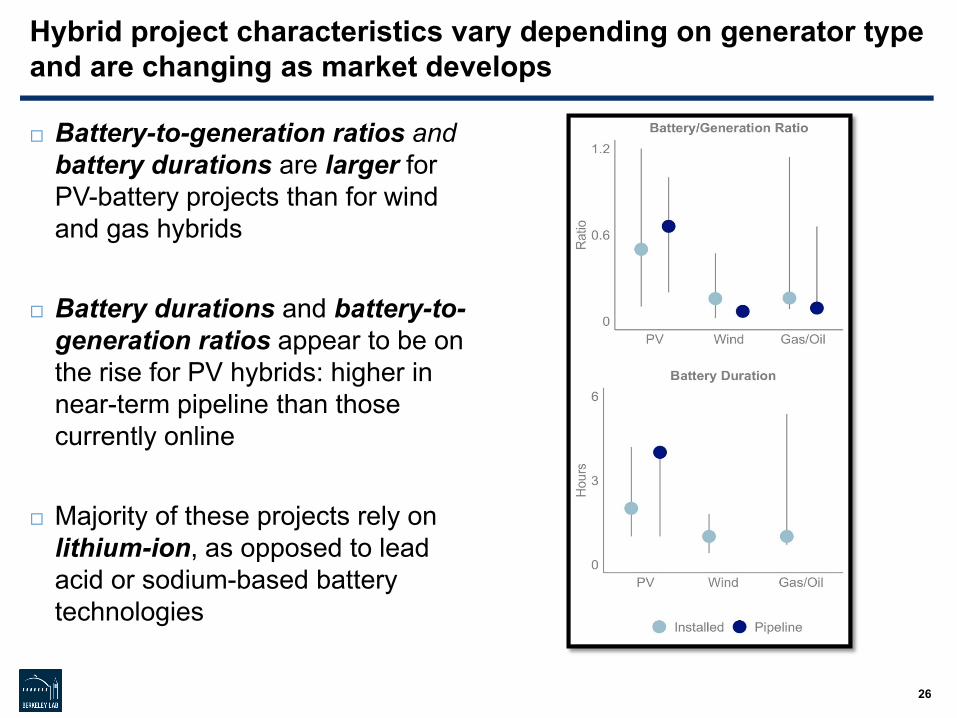
Hybrid project characteristics vary depending on generator type and are changing as market develops
Battery-to-generation ratios and battery durations are larger for PV-battery projects than for wind and gas hybrids
Battery durations and battery-to-generation ratios appear to be on the rise for PV hybrids: higher in near-term pipeline than those currently online
Majority of these projects rely on lithium-ion, as opposed to lead acid or sodium-based battery technologies
26

Generator + storage hybrid / co-located projects at end of 2019, compared to subset of standalone storage technologies
Sources: EIA 860 2019 Early Release, Berkeley Lab
• Wind+storage plants located primarily in ERCOT and PJM so far
• PV+storage plants located primarily in non-ISO West, ERCOT, and Southeast
• Fossil+storage plants located primarily in MISO and ISO-NE
• Standalone storage (ex. pumped hydro) largely in PJM, CAISO, Southeast
27
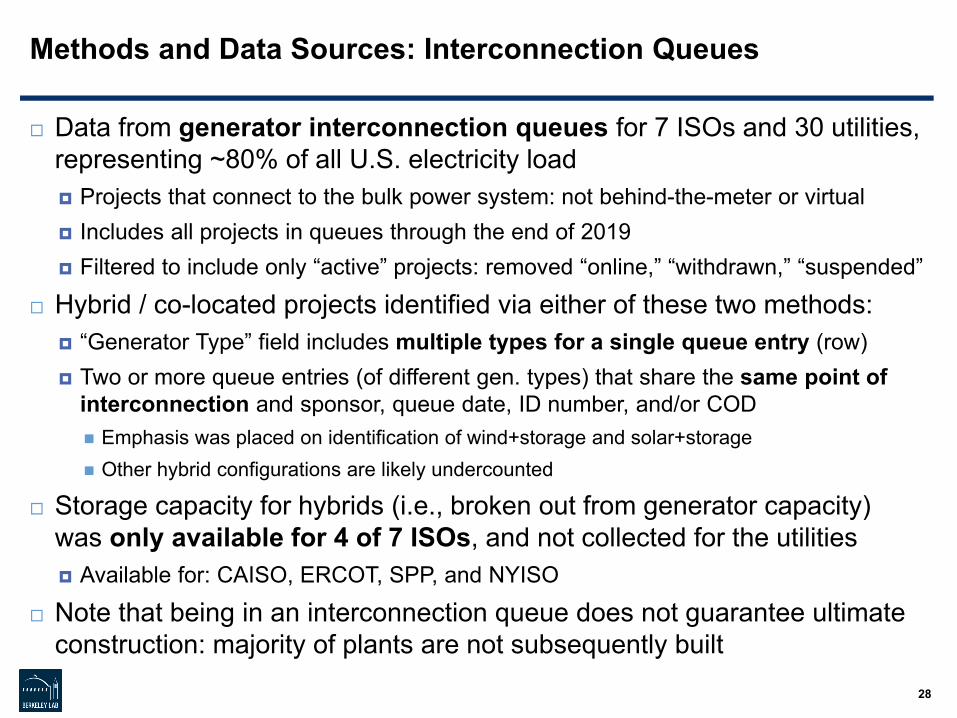
Methods and Data Sources: Interconnection Queues
Data from generator interconnection queues for 7 ISOs and 30 utilities, representing ~80% of all U.S. electricity load Projects that connect to the bulk power system: not behind-the-meter or virtual Includes all projects in queues through the end of 2019 Filtered to include only “active” projects: removed “online,” “withdrawn,” “suspended”
Hybrid / co-located projects identified via either of these two methods: “Generator Type” field includes multiple types for a single queue entry (row) Two or more queue entries (of different gen. types) that share the same point of
interconnection and sponsor, queue date, ID number, and/or COD Emphasis was placed on identification of wind+storage and solar+storage Other hybrid configurations are likely undercounted
Storage capacity for hybrids (i.e., broken out from generator capacity) was only available for 4 of 7 ISOs, and not collected for the utilities Available for: CAISO, ERCOT, SPP, and NYISO
Note that being in an interconnection queue does not guarantee ultimate construction: majority of plants are not subsequently built
28
ELECTRICITY MARKETS & POLICYENERGY TECHNOLOGIES AREA ENERGY ANALYSIS AND ENVIRONMENTAL IMPACTS DIVISION
Disclaimer This document was prepared as an account of work sponsored by the United States Government. While this document is believed to contain correct information, neither the United States Government nor any agency thereof, nor The Regents of the University of California, nor any of their employees, makes any warranty, express or implied, or assumes any legal responsibility for the accuracy, completeness, or usefulness of any information, apparatus, product, or process disclosed, or represents that its use would not infringe privately owned rights. Reference herein to any specific commercial product, process, or service by its trade name, trademark, manufacturer, or otherwise, does not necessarily constitute or imply its endorsement, recommendation, or favoring by the United States Government or any agency thereof, or The Regents of the University of California. The views and opinions of authors expressed herein do not necessarily state or reflect those of the United States Government or any agency thereof, or The Regents of the University of California.
Ernest Orlando Lawrence Berkeley National Laboratory is an equal opportunity employer.
Copyright NoticeThis manuscript has been authored by an author at Lawrence Berkeley National Laboratory under Contract No. DE-AC02-05CH11231 with the U.S. Department of Energy. The U.S. Government retains, and the publisher, by accepting the article for publication, acknowledges, that the U.S. Government retains a non-exclusive, paid-up, irrevocable, worldwide license to publish or reproduce the published form of this manuscript, or allow others to do so, for U.S. Government purposes