Embed Size (px)
Citation preview
The Open Analytical Chemistry Journal, 2011, 5, 1-21 1
1874-0650/11 2011 Bentham Open
Open Access
The Role of and the Place of Method Validation in Drug Analysis Using Electroanalytical Techniques
Mehmet Gumustas1,2 and Sibel A. Ozkan*,1
1Ankara University, Faculty of Pharmacy, Department of Analytical Chemistry, Ankara, Turkey
2Hitit University, Faculty of Art&Science, Department of Chemistry, Corum, Turkey
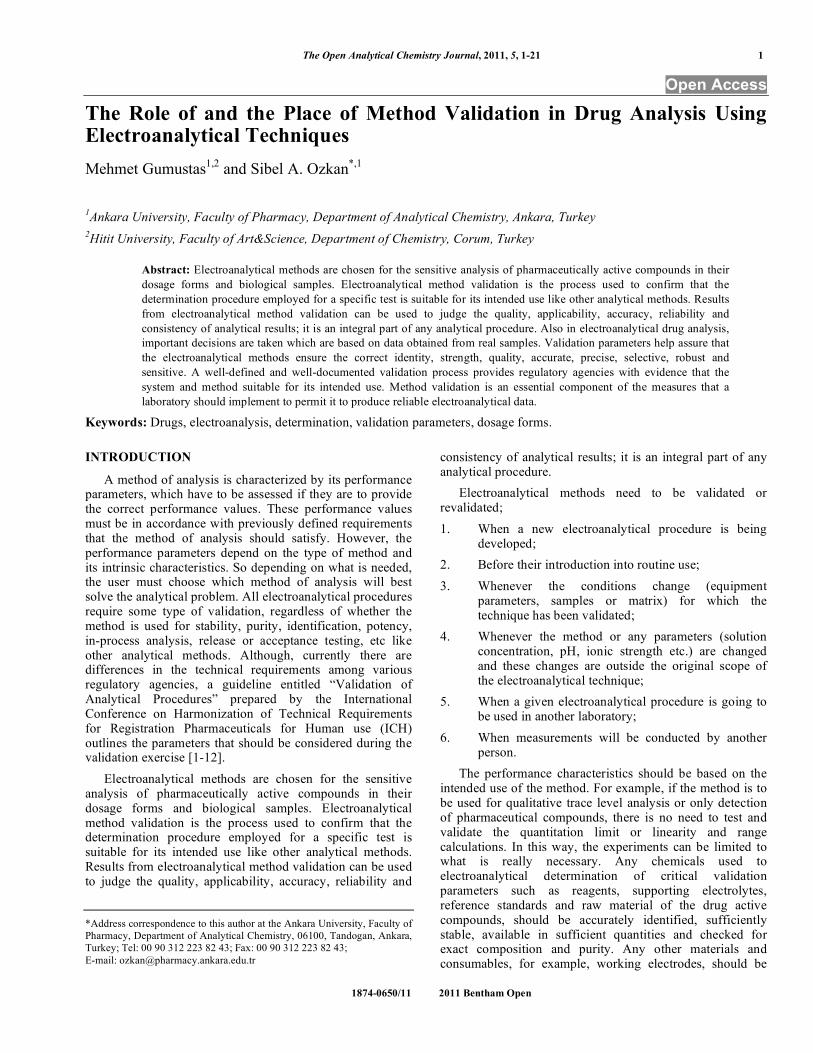
Abstract: Electroanalytical methods are chosen for the sensitive analysis of pharmaceutically active compounds in their dosage forms and biological samples. Electroanalytical method validation is the process used to confirm that the determination procedure employed for a specific test is suitable for its intended use like other analytical methods. Results from electroanalytical method validation can be used to judge the quality, applicability, accuracy, reliability and consistency of analytical results; it is an integral part of any analytical procedure. Also in electroanalytical drug analysis, important decisions are taken which are based on data obtained from real samples. Validation parameters help assure that the electroanalytical methods ensure the correct identity, strength, quality, accurate, precise, selective, robust and sensitive. A well-defined and well-documented validation process provides regulatory agencies with evidence that the system and method suitable for its intended use. Method validation is an essential component of the measures that a laboratory should implement to permit it to produce reliable electroanalytical data.
Keywords: Drugs, electroanalysis, determination, validation parameters, dosage forms.
INTRODUCTION
A method of analysis is characterized by its performance parameters, which have to be assessed if they are to provide the correct performance values. These performance values must be in accordance with previously defined requirements that the method of analysis should satisfy. However, the performance parameters depend on the type of method and its intrinsic characteristics. So depending on what is needed, the user must choose which method of analysis will best solve the analytical problem. All electroanalytical procedures require some type of validation, regardless of whether the method is used for stability, purity, identification, potency, in-process analysis, release or acceptance testing, etc like other analytical methods. Although, currently there are differences in the technical requirements among various regulatory agencies, a guideline entitled “Validation of Analytical Procedures” prepared by the International Conference on Harmonization of Technical Requirements for Registration Pharmaceuticals for Human use (ICH) outlines the parameters that should be considered during the validation exercise [1-12].
Electroanalytical methods are chosen for the sensitive analysis of pharmaceutically active compounds in their dosage forms and biological samples. Electroanalytical method validation is the process used to confirm that the determination procedure employed for a specific test is suitable for its intended use like other analytical methods. Results from electroanalytical method validation can be used to judge the quality, applicability, accuracy, reliability and
*Address correspondence to this author at the Ankara University, Faculty of Pharmacy, Department of Analytical Chemistry, 06100, Tandogan, Ankara, Turkey; Tel: 00 90 312 223 82 43; Fax: 00 90 312 223 82 43; E-mail: [email protected]
consistency of analytical results; it is an integral part of any analytical procedure.
Electroanalytical methods need to be validated or revalidated;
1. When a new electroanalytical procedure is being developed;
2. Before their introduction into routine use;
3. Whenever the conditions change (equipment parameters, samples or matrix) for which the technique has been validated;
4. Whenever the method or any parameters (solution concentration, pH, ionic strength etc.) are changed and these changes are outside the original scope of the electroanalytical technique;
5. When a given electroanalytical procedure is going to be used in another laboratory;
6. When measurements will be conducted by another person.
The performance characteristics should be based on the intended use of the method. For example, if the method is to be used for qualitative trace level analysis or only detection of pharmaceutical compounds, there is no need to test and validate the quantitation limit or linearity and range calculations. In this way, the experiments can be limited to what is really necessary. Any chemicals used to electroanalytical determination of critical validation parameters such as reagents, supporting electrolytes, reference standards and raw material of the drug active compounds, should be accurately identified, sufficiently stable, available in sufficient quantities and checked for exact composition and purity. Any other materials and consumables, for example, working electrodes, should be
2 The Open Analytical Chemistry Journal, 2011, Volume 5 Gumustas and Ozkan
new or to be in good working order and be qualified to meet the electroanalytical performance criteria. This ensures that one set of the experimental conditions and consumables can be used for most experiments and avoids unpleasant surprises during method validation assay and application to the sample.
In method validation, the quantitative characteristics of interest relate to the accuracy and precision of the result likely to be supplied. It is recommended to prove the suitability of the method for its intended use in initial experiments and design of the electroanalytical techniques, if there is little or no information on performance characteristics of the method. These studies should include the detection limit, linearity and range, accuracy and the approximate precision. If this preliminary validation data appear to be inappropriate, the method itself, the equipment, the electroanalytical technique or the acceptance limits should be changed. During last two decades, validation has become traditional to represent different aspects to method performance by reference to the separate items for different analytical techniques, and to a considerable extent these guidelines reflect that pattern.
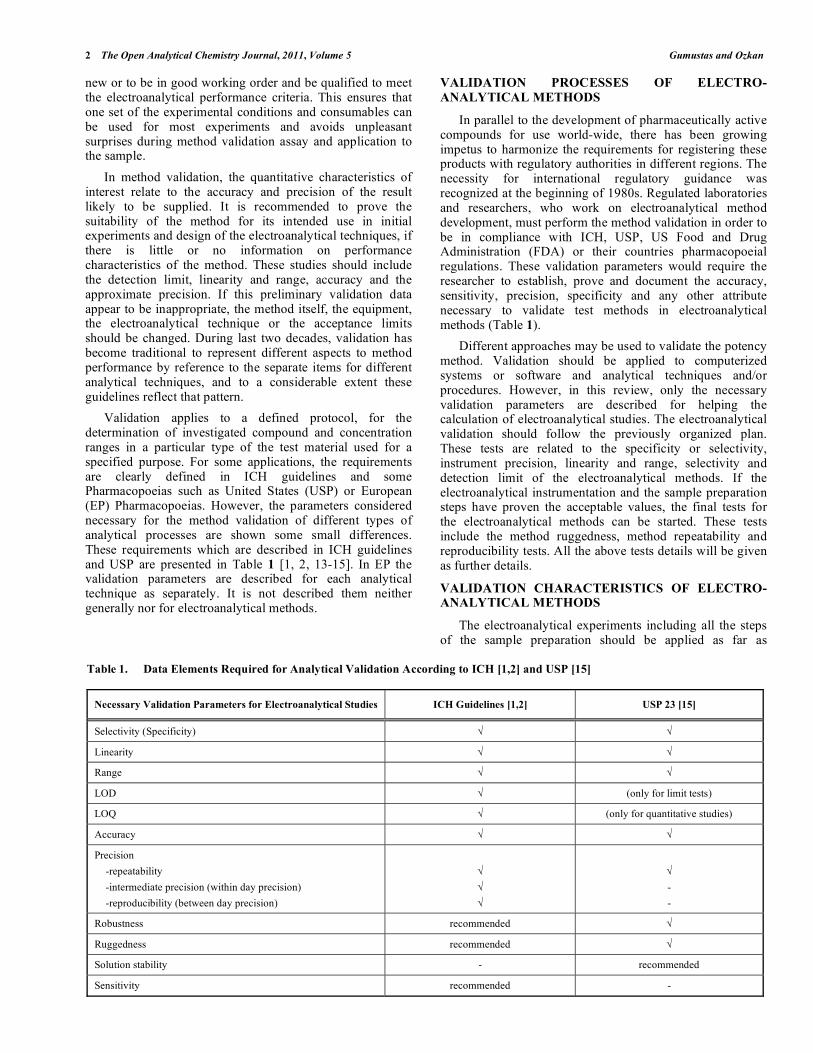
Validation applies to a defined protocol, for the determination of investigated compound and concentration ranges in a particular type of the test material used for a specified purpose. For some applications, the requirements are clearly defined in ICH guidelines and some Pharmacopoeias such as United States (USP) or European (EP) Pharmacopoeias. However, the parameters considered necessary for the method validation of different types of analytical processes are shown some small differences. These requirements which are described in ICH guidelines and USP are presented in Table 1 [1, 2, 13-15]. In EP the validation parameters are described for each analytical technique as separately. It is not described them neither generally nor for electroanalytical methods.
VALIDATION PROCESSES OF ELECTRO-
ANALYTICAL METHODS
In parallel to the development of pharmaceutically active compounds for use world-wide, there has been growing impetus to harmonize the requirements for registering these products with regulatory authorities in different regions. The necessity for international regulatory guidance was recognized at the beginning of 1980s. Regulated laboratories and researchers, who work on electroanalytical method development, must perform the method validation in order to be in compliance with ICH, USP, US Food and Drug Administration (FDA) or their countries pharmacopoeial regulations. These validation parameters would require the researcher to establish, prove and document the accuracy, sensitivity, precision, specificity and any other attribute necessary to validate test methods in electroanalytical methods (Table 1).
Different approaches may be used to validate the potency method. Validation should be applied to computerized systems or software and analytical techniques and/or procedures. However, in this review, only the necessary validation parameters are described for helping the calculation of electroanalytical studies. The electroanalytical validation should follow the previously organized plan. These tests are related to the specificity or selectivity, instrument precision, linearity and range, selectivity and detection limit of the electroanalytical methods. If the electroanalytical instrumentation and the sample preparation steps have proven the acceptable values, the final tests for the electroanalytical methods can be started. These tests include the method ruggedness, method repeatability and reproducibility tests. All the above tests details will be given as further details.
VALIDATION CHARACTERISTICS OF ELECTRO-ANALYTICAL METHODS
The electroanalytical experiments including all the steps of the sample preparation should be applied as far as
Table 1. Data Elements Required for Analytical Validation According to ICH [1,2] and USP [15]
Necessary Validation Parameters for Electroanalytical Studies ICH Guidelines [1,2] USP 23 [15]
Selectivity (Specificity)
Linearity
Range
LOD (only for limit tests)
LOQ (only for quantitative studies)
Accuracy
Precision
-repeatability
-intermediate precision (within day precision)
-reproducibility (between day precision)
-
-
Robustness recommended
Ruggedness recommended
Solution stability - recommended
Sensitivity recommended -
Method Validation in Drug Analysis Using Electroanalytical Techniques The Open Analytical Chemistry Journal, 2011, Volume 5 3
possible, when performing validation studies. Validation parameters are determined based on the analysis of the measured electroanalytical values and that is something to be kept in mind during the validation of an electroanalytical procedure.
SPECIFICITY AND SELECTIVITY
Specificity and selectivity are related to the detection and selective determination events and both give an idea of the reliability of the electroanalytical method. The terms selectivity and specificity are often used interchangeably.
Generally, specificity is the first validation parameter addressed in the establishment of electroanalytical methods for the determination of drug active compounds. It can be described as “an electroanalytical method as its ability to measure accurately and specifically the analyte in the presence of component that may be expected in the sample matrix”. Specificity is appropriately applied to electroanalytical techniques in which only a single parameter can be measured. For the proving the specificity of the proposed electroanalytical methods, analyte, supporting electrolyte, matrix with and/or without analyte, impurities of the starting material, degradation products or metabolites should all be analyzed. As an advantage of the electroanalytical methods, they usually not effected from the inactive ingredients of pharmaceutical dosage forms.
Selectivity is generally applicable to all analytical techniques like electroanalytical methods. It refers to extent to which a method can be used to determine particular analytes in mixtures or matrices free from interferences which are found in dosage forms or biological samples. It is also the capability of a method to distinguish a given analyte from other substances. The selectivity of an electroanalytical method is typically validated by demonstrating that the separation of analytes is free of interferences under nominal conditions. The source of interferences could be impurities, degradation compounds, excipients, endogenous substances and sample matrix. As a general rule, selectivity should be sufficiently good for any interference to be ignored [1-5, 13-39]. A method is called selective if the response is distinguished from all other responses. Varying test procedures and statistical calculation method can be utilized to study selectivity depending on the availability of the analyte, suitable reference samples, the matrix without the analyte, and on the concentration of interest.
If the matrix composition is unknown, the systematic matrix effects can be tested. For this, the slopes of standard addition curves can be compared. If the reference samples or a sample matrix without the analyte is available paired test t and paired test F can be applied for the obtaining of selectivity. For calculation paired test F and paired test t tests, two sets of test samples prepare which, one with the matrix and the other without the matrix, both sets having identical analyte concentration at each concentration level of interest. After calculation of F and t-value using related equations, the calculated F and t values should compare with the suitable theoretical F and t values which are found from theoretical F and t tables. If the calculated F and t- values are smaller then the theoretical F and t-values (with the specified degree of freedom) one makes the assumption that the matrix does not affect the analysis. If the calculated F and t values
exceed that expected, the matrix has been found to have a statistically significant effect on the results.
When matrix or excipients without the analyte is unavailable, the selectivity can be tested by comparing the slopes on standard addition curves. For this, two sample sets prepare containing the same analyte addition at each concentration level. The one set does not include the sample matrix and basic level of analyte and the other set includes the sample matrix with the basic level of analyte. After the standard addition, the results of these two sets samples should be plotted as a function of analyte addition concentration in the same graph. The slopes of these curves are compared and if the slopes of these two linear regression curves are the same, the matrix does not effect on the analysis result [1-8, 23-40].
Most of the application of electroanalytical methods on pharmaceutical analysis in their dosage form or in biological samples could not be affected from the possible interferences depending on their oxidation or reduction potentials.
LINEARITY
Linearity is necessary and indispensable validation parameter for quantitative determination studies. A linearity study for electroanalytical techniques like other analytical methods verifies that the response is linearity proportional to the analyte concentration in the concentration range of sample solutions. When a specific characteristic defined to the electroanalytical signal without any doubt than a relationship between the concentration and response can be investigated [1-14, 19-40]. Linearity of an electroanalytical method is a measure of how well calibration plot of electroanalytical response versus concentration approximates a straight line. The choice of analyte concentrations in standard solutions should reflect the expected analyte contents in the investigated samples; usually, linearity in the range of 50-150 % of nominal sample concentration should be demonstrated. The samples of standard solutions at the minimum six different concentration levels are measured. Usually, three replicates are used for each concentration levels. However, in electroanalytical chemistry the low limit of the linearity should be identified, because of its sensitive determination capability. Analyzed samples can be serially diluted solutions with the selected supporting electrolyte containing the analyte at proper concentrations with proper amounts of analyte added.
In order to describe the relationship between the electroanalytical response and analyte concentration, the linear regression method is mainly employed. Using the linear regression method, linearity, correctness (standard error estimation), limit of detection (LOD) and limit of quantification (LOQ), can be defined for the proposed method [1-11, 14, 41-46].
It is important that the linear curve is repeatable in between day measurements. A test for general matrix effects such as inactive ingredients from pharmaceutical dosage forms or endogenous substances from biological fluids can be made by applying the electroanalytical method of pure pharmaceutical compound additions to a test solution derived from a typical test media. This method is called briefly standard addition technique. The standard addition technique should be done in a way that provides the same
4 The Open Analytical Chemistry Journal, 2011, Volume 5 Gumustas and Ozkan
final dilution similar to the normal electroanalytical process, and the range of standard additions should encompass the same range as the procedure-defined calibration validation. If the obtained calibration curve is linear, the slopes and correlation coefficient between the usual calibration function and the analyte additions plot can be compared for significance for difference. A lack of significance means that there are no detectable general matrix effects either in pharmaceutical dosage forms or in biological samples. If the calibration is not linear, a more complex technique for significance tests [1-18, 48-52]. However, using the electroanalytical methods this kind of interferences are not detected because of the electro-inactive nature of the excipients of pharmaceuticals and most of the endogenous substances of biological media.
Generally, the data are processed using a linear least-squares regression method. Data from the regression line itself may be helpful to provide mathematical estimates of the degree of linearity. The resulting plot slope (m), y-intercept (n), residual sum of squares and correlation coefficient (r) or determination coefficient (r2) provide the desired information on linearity. A linearity correlation coefficient or determination coefficient above 0.999 is acceptable for most methods [1-16, 41-47]. The slope and y-intercept values depend on the measurement technique.
Frequently, the linearity is evaluated graphically, in addition to or as an alternative mathematical calculation type evaluation. The evaluation is made by visually inspecting a plot of electroanalytical response (peak or wave) as a function of the concentration of drug active compound. Some researchers can be finding sufficient to calculate the regression coefficient. Then, when the correlation coefficient values reach at least 0.999 the linearity can be assumed in the concentration range for which standard solutions had been prepared during the calibration procedure. However, this parameter is mostly used, but correlation coefficient (r) is neither a proof of linearity nor suitable for quantitative measurement [19, 25, 48-52]. Correlation coefficient (r) just indicates the extent of the relationship between the dependent and independent variables such as the electroanalytical response and the electroactive compound concentration. It is important to carry out a visual inspection of the residual plot to check for trends. Electroanalytical methods with linearity poorer than the acceptable “r” value may have to be treated as non-linear and use more complicated multi-point calibrations or non-linear regression type statistical modeling. The least square method for the determination of linearity can have serious shortcomings if response must be measured over one or more orders of magnitude. In this statistical analysis, slope, intercept and correlation coefficient can be terribly affected from the low and/or high concentration limit of the linearity.
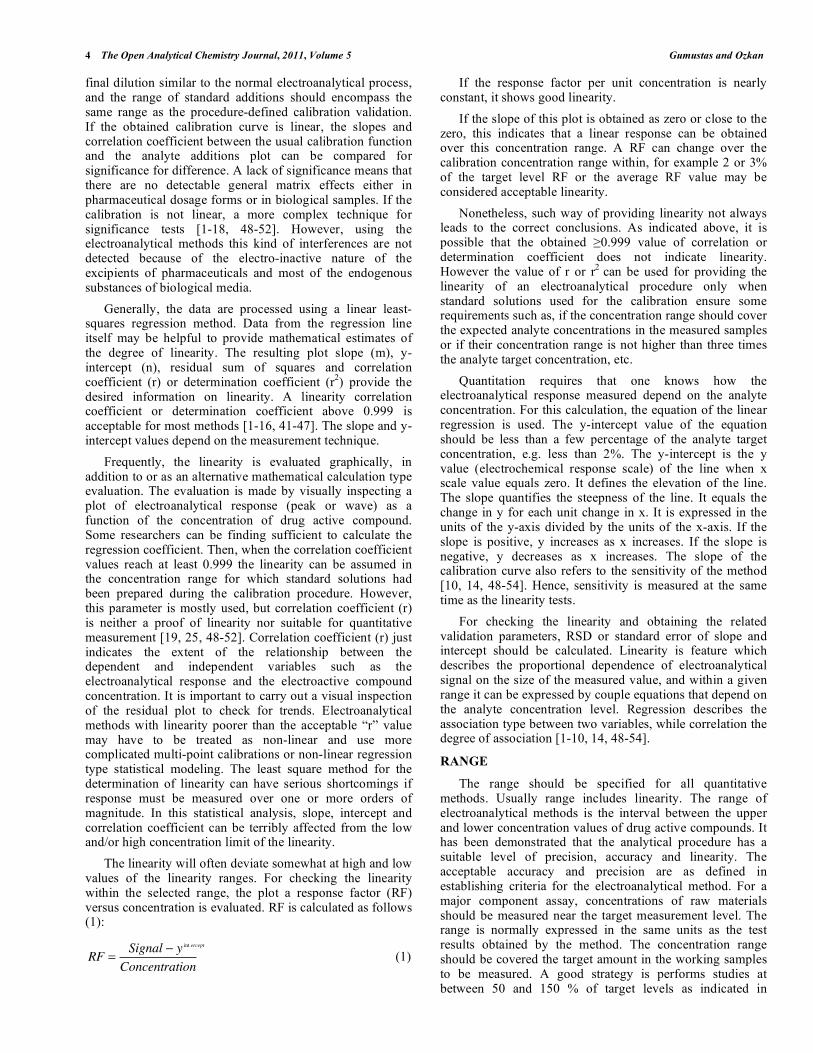
The linearity will often deviate somewhat at high and low values of the linearity ranges. For checking the linearity within the selected range, the plot a response factor (RF) versus concentration is evaluated. RF is calculated as follows (1):
RF =Signal y int ercept
Concentration (1)
If the response factor per unit concentration is nearly constant, it shows good linearity.
If the slope of this plot is obtained as zero or close to the zero, this indicates that a linear response can be obtained over this concentration range. A RF can change over the calibration concentration range within, for example 2 or 3% of the target level RF or the average RF value may be considered acceptable linearity.
Nonetheless, such way of providing linearity not always leads to the correct conclusions. As indicated above, it is possible that the obtained 0.999 value of correlation or determination coefficient does not indicate linearity. However the value of r or r2 can be used for providing the linearity of an electroanalytical procedure only when standard solutions used for the calibration ensure some requirements such as, if the concentration range should cover the expected analyte concentrations in the measured samples or if their concentration range is not higher than three times the analyte target concentration, etc.
Quantitation requires that one knows how the electroanalytical response measured depend on the analyte concentration. For this calculation, the equation of the linear regression is used. The y-intercept value of the equation should be less than a few percentage of the analyte target concentration, e.g. less than 2%. The y-intercept is the y value (electrochemical response scale) of the line when x scale value equals zero. It defines the elevation of the line. The slope quantifies the steepness of the line. It equals the change in y for each unit change in x. It is expressed in the units of the y-axis divided by the units of the x-axis. If the slope is positive, y increases as x increases. If the slope is negative, y decreases as x increases. The slope of the calibration curve also refers to the sensitivity of the method [10, 14, 48-54]. Hence, sensitivity is measured at the same time as the linearity tests.
For checking the linearity and obtaining the related validation parameters, RSD or standard error of slope and intercept should be calculated. Linearity is feature which describes the proportional dependence of electroanalytical signal on the size of the measured value, and within a given range it can be expressed by couple equations that depend on the analyte concentration level. Regression describes the association type between two variables, while correlation the degree of association [1-10, 14, 48-54].
RANGE
The range should be specified for all quantitative methods. Usually range includes linearity. The range of electroanalytical methods is the interval between the upper and lower concentration values of drug active compounds. It has been demonstrated that the analytical procedure has a suitable level of precision, accuracy and linearity. The acceptable accuracy and precision are as defined in establishing criteria for the electroanalytical method. For a major component assay, concentrations of raw materials should be measured near the target measurement level. The range is normally expressed in the same units as the test results obtained by the method. The concentration range should be covered the target amount in the working samples to be measured. A good strategy is performs studies at between 50 and 150 % of target levels as indicated in
Method Validation in Drug Analysis Using Electroanalytical Techniques The Open Analytical Chemistry Journal, 2011, Volume 5 5
linearity section [1-16, 29-47]. For working with the pure or purity known pharmaceutically active compounds, the ICH [1, 2] requires the minimum specified range to be 50 to 150 % of the test concentration. Although, electroanalytical studies requires wider concentration ranges. This range should be obtained after linearity studies which are obtained during the validation process.
LIMIT OF DETECTION (LOD)
LOD is the lowest amount of the investigated compound in a sample that can be detected, but not necessarily quantified with an acceptable uncertainly. LOD of an electroanalytical method is an important parameter if quantitative measurements are to be made at concentrations close to it. Especially, LOD is necessary for the trace analysis of drug active compounds in pharmaceuticals and/or biological samples, for working on trace impurities in a bulk drug sample, degradation products in a finished dosage forms or metabolites of drugs in biological samples. In electroanalytical studies LOD can be defined using the instrumental or non-instrumental methods. The LOD calculation approaches types are given below. These types of LOD calculations are recommended by the official guidelines and pharmacopoeias.
1. Visual evaluation method: The LOD is determined by the electroanalysis of drug active compounds with known concentrations of analyte and by establishing the minimum level at which the compound can be reliably detected [1-16].
2. Signal-to-noise ratio method: Signal-to-noise ratio method is usually used for the calculation of LOD in separation and spectrometric methods. In electroanalytical studies, noise can not be obtained clearly because of the nature of methodology and supporting electrolytes. That’s why this type of calculation of LOD is not commonly used in electroanalytical techniques [1, 2].
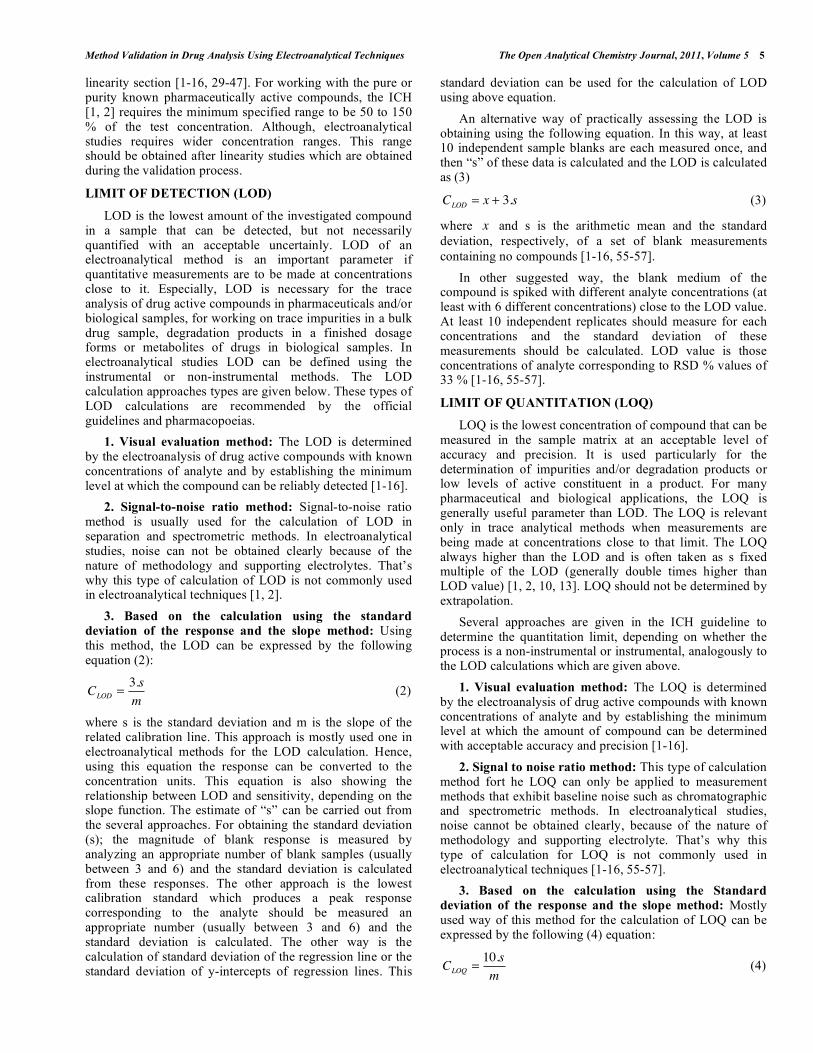
3. Based on the calculation using the standard
deviation of the response and the slope method: Using this method, the LOD can be expressed by the following equation (2):
CLOD =3.s
m (2)
where s is the standard deviation and m is the slope of the related calibration line. This approach is mostly used one in electroanalytical methods for the LOD calculation. Hence, using this equation the response can be converted to the concentration units. This equation is also showing the relationship between LOD and sensitivity, depending on the slope function. The estimate of “s” can be carried out from the several approaches. For obtaining the standard deviation (s); the magnitude of blank response is measured by analyzing an appropriate number of blank samples (usually between 3 and 6) and the standard deviation is calculated from these responses. The other approach is the lowest calibration standard which produces a peak response corresponding to the analyte should be measured an appropriate number (usually between 3 and 6) and the standard deviation is calculated. The other way is the calculation of standard deviation of the regression line or the standard deviation of y-intercepts of regression lines. This
standard deviation can be used for the calculation of LOD using above equation.
An alternative way of practically assessing the LOD is obtaining using the following equation. In this way, at least 10 independent sample blanks are each measured once, and then “s” of these data is calculated and the LOD is calculated as (3)
CLOD = x + 3.s (3)
where x and s is the arithmetic mean and the standard deviation, respectively, of a set of blank measurements containing no compounds [1-16, 55-57].
In other suggested way, the blank medium of the compound is spiked with different analyte concentrations (at least with 6 different concentrations) close to the LOD value. At least 10 independent replicates should measure for each concentrations and the standard deviation of these measurements should be calculated. LOD value is those concentrations of analyte corresponding to RSD % values of 33 % [1-16, 55-57].
LIMIT OF QUANTITATION (LOQ)
LOQ is the lowest concentration of compound that can be measured in the sample matrix at an acceptable level of accuracy and precision. It is used particularly for the determination of impurities and/or degradation products or low levels of active constituent in a product. For many pharmaceutical and biological applications, the LOQ is generally useful parameter than LOD. The LOQ is relevant only in trace analytical methods when measurements are being made at concentrations close to that limit. The LOQ always higher than the LOD and is often taken as s fixed multiple of the LOD (generally double times higher than LOD value) [1, 2, 10, 13]. LOQ should not be determined by extrapolation.
Several approaches are given in the ICH guideline to determine the quantitation limit, depending on whether the process is a non-instrumental or instrumental, analogously to the LOD calculations which are given above.
1. Visual evaluation method: The LOQ is determined by the electroanalysis of drug active compounds with known concentrations of analyte and by establishing the minimum level at which the amount of compound can be determined with acceptable accuracy and precision [1-16].
2. Signal to noise ratio method: This type of calculation method fort he LOQ can only be applied to measurement methods that exhibit baseline noise such as chromatographic and spectrometric methods. In electroanalytical studies, noise cannot be obtained clearly, because of the nature of methodology and supporting electrolyte. That’s why this type of calculation for LOQ is not commonly used in electroanalytical techniques [1-16, 55-57].
3. Based on the calculation using the Standard
deviation of the response and the slope method: Mostly used way of this method for the calculation of LOQ can be expressed by the following (4) equation:
CLOQ =10.s
m (4)
6 The Open Analytical Chemistry Journal, 2011, Volume 5 Gumustas and Ozkan
“s” and “m” is the same values with LOD calculation. This approach is mostly used one in electroanalytical method for the LOQ calculation. Hence, using this equation, the response can be converted to the concentration units. This equation is also showing the relationship between LOQ and sensitivity, depending on the slope function. The estimate of s can be carried out from the several approaches which is given in LOD section.
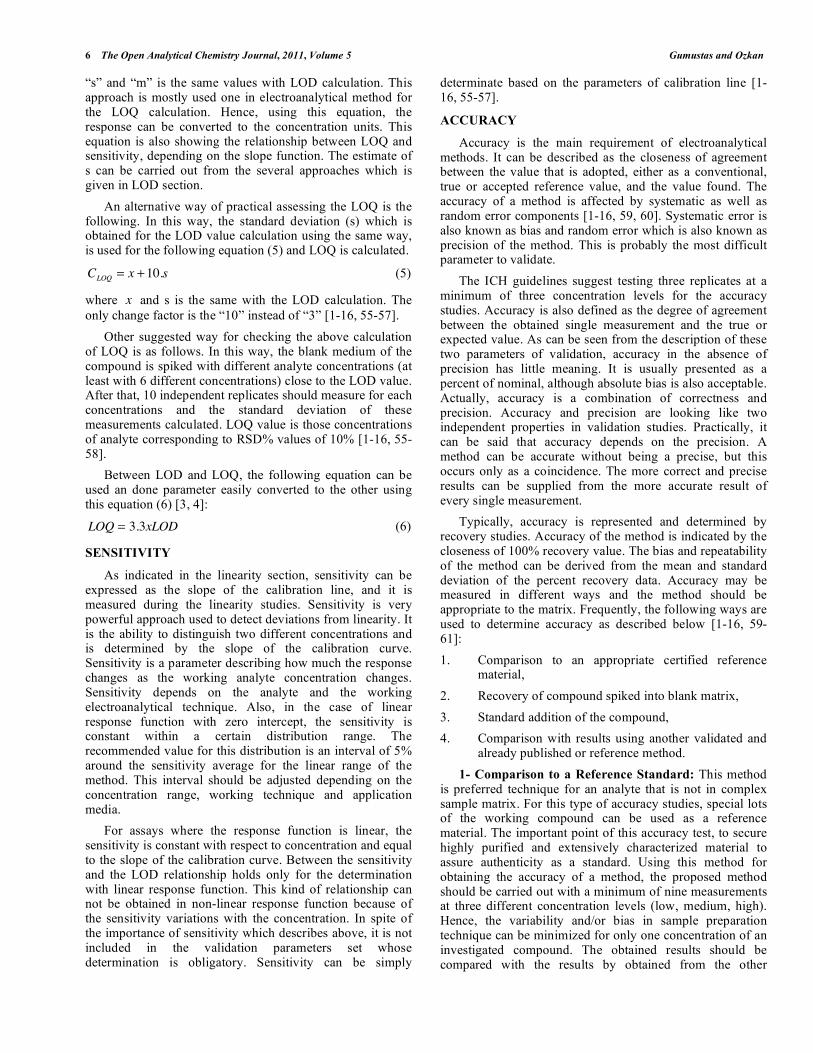
An alternative way of practical assessing the LOQ is the following. In this way, the standard deviation (s) which is obtained for the LOD value calculation using the same way, is used for the following equation (5) and LOQ is calculated.
CLOQ = x +10.s (5)
where x and s is the same with the LOD calculation. The only change factor is the “10” instead of “3” [1-16, 55-57].
Other suggested way for checking the above calculation of LOQ is as follows. In this way, the blank medium of the compound is spiked with different analyte concentrations (at least with 6 different concentrations) close to the LOD value. After that, 10 independent replicates should measure for each concentrations and the standard deviation of these measurements calculated. LOQ value is those concentrations of analyte corresponding to RSD% values of 10% [1-16, 55-58].
Between LOD and LOQ, the following equation can be used an done parameter easily converted to the other using this equation (6) [3, 4]:
LOQ = 3.3xLOD (6)
SENSITIVITY
As indicated in the linearity section, sensitivity can be expressed as the slope of the calibration line, and it is measured during the linearity studies. Sensitivity is very powerful approach used to detect deviations from linearity. It is the ability to distinguish two different concentrations and is determined by the slope of the calibration curve. Sensitivity is a parameter describing how much the response changes as the working analyte concentration changes. Sensitivity depends on the analyte and the working electroanalytical technique. Also, in the case of linear response function with zero intercept, the sensitivity is constant within a certain distribution range. The recommended value for this distribution is an interval of 5% around the sensitivity average for the linear range of the method. This interval should be adjusted depending on the concentration range, working technique and application media.
For assays where the response function is linear, the sensitivity is constant with respect to concentration and equal to the slope of the calibration curve. Between the sensitivity and the LOD relationship holds only for the determination with linear response function. This kind of relationship can not be obtained in non-linear response function because of the sensitivity variations with the concentration. In spite of the importance of sensitivity which describes above, it is not included in the validation parameters set whose determination is obligatory. Sensitivity can be simply
determinate based on the parameters of calibration line [1-16, 55-57].
ACCURACY
Accuracy is the main requirement of electroanalytical methods. It can be described as the closeness of agreement between the value that is adopted, either as a conventional, true or accepted reference value, and the value found. The accuracy of a method is affected by systematic as well as random error components [1-16, 59, 60]. Systematic error is also known as bias and random error which is also known as precision of the method. This is probably the most difficult parameter to validate.
The ICH guidelines suggest testing three replicates at a minimum of three concentration levels for the accuracy studies. Accuracy is also defined as the degree of agreement between the obtained single measurement and the true or expected value. As can be seen from the description of these two parameters of validation, accuracy in the absence of precision has little meaning. It is usually presented as a percent of nominal, although absolute bias is also acceptable. Actually, accuracy is a combination of correctness and precision. Accuracy and precision are looking like two independent properties in validation studies. Practically, it can be said that accuracy depends on the precision. A method can be accurate without being a precise, but this occurs only as a coincidence. The more correct and precise results can be supplied from the more accurate result of every single measurement.
Typically, accuracy is represented and determined by recovery studies. Accuracy of the method is indicated by the closeness of 100% recovery value. The bias and repeatability of the method can be derived from the mean and standard deviation of the percent recovery data. Accuracy may be measured in different ways and the method should be appropriate to the matrix. Frequently, the following ways are used to determine accuracy as described below [1-16, 59-61]:
1. Comparison to an appropriate certified reference material,
2. Recovery of compound spiked into blank matrix,
3. Standard addition of the compound,
4. Comparison with results using another validated and already published or reference method.
1- Comparison to a Reference Standard: This method is preferred technique for an analyte that is not in complex sample matrix. For this type of accuracy studies, special lots of the working compound can be used as a reference material. The important point of this accuracy test, to secure highly purified and extensively characterized material to assure authenticity as a standard. Using this method for obtaining the accuracy of a method, the proposed method should be carried out with a minimum of nine measurements at three different concentration levels (low, medium, high). Hence, the variability and/or bias in sample preparation technique can be minimized for only one concentration of an investigated compound. The obtained results should be compared with the results by obtained from the other
Method Validation in Drug Analysis Using Electroanalytical Techniques The Open Analytical Chemistry Journal, 2011, Volume 5 7
methods or results reported on a certificate of analysis from an external source.
2- Recovery of Compound Spiked into Blank Matrix:
The experiments are performed in the presence of the matrix media. For this type of recovery studies, a well-characterized and purity known standard compounds is still required. Analyte reference standard is added to a blank matrix media which can be called as placebo, at different concentration levels. Using this technique, the possible interferences and potential effects between the inactive ingredients and pharmaceutically active compound can be investigated [1-16, 59-62]. The recovery at each working concentration level is determined by comparison to the known amount added. It should be at 50, 75, 100, 125 and 150% of the level expected for the analyte in a normal assay. A minimum of three repeated experiments should be realized at each level. Furthermore, the results which are obtained using spiked into the blank matrix method can be converted as percent recovery results and they reported with their RSD% and bias% values for showing the accuracy of the proposed method [1-16, 59-62].
3- Standard addition of the Compound: If no matrix blank is available, standard addition technique should be chosen for the accuracy test. In this method, the known amount of compound are spiked at different levels into a sample matrix that already contain some amount of the investigated compound. The difference between the spiked and unspiked sample results is the recovered part of the added analyte, which can be compared with the known amount added. In general, for standard addition using this technique, a good approach is to add 25, 50 and 100% of the expected working compound concentration to the matrix in different experiments [1-20, 59-62]. The measured amounts are reported versus the amount added with the average percent recovery results, RSD% and bias% results. The ICH recommends collecting data from a minimum nine determinations over a minimum of concentration levels covering the specified range [1, 2].
4- Comparison with Results Using another Reference
Method: The other accuracy method is to perform the analysis by two independent methods. Method comparison is the bias evaluation procedure of choice, especially when it is not possible to spike blank matrix homogeneously or when no blank matrix is available. In this accuracy method, the second method should be known to be accurate for the sample matrix of interest and it called as reference method. This reference method can easily be applied for the comparison of the proposed method and find the accuracy value, even the sample treatment is different. The selected reference (or pharmacopoeia) method can in principle be used to test for bias in another method under validation. If the proposed electroanalytical method and the reference method agree, this is good evidence they both work for the studied compound and application media such dosage forms, biological material etc [1-20, 59-62]. For obtaining the accuracy from these results, student-t and F tests are generally used for statistical comparison methods [1-16, 59-62]. Accuracy should be reported as percent recovery by the assay of known amount addition of analyte in the sample or as the difference between the mean and the accepted true
value together with the confidence intervals and calculated student-t and F results.
PRECISION
Precision describes as the degree of agreement among individual test results when the procedure is applied repeatedly to multiple samplings of a homogeneous sample. It depends only on the distribution of random errors and does not relate to the true value. Precision usually expressed as standard or relative standard deviations of the replicate analysis. In numerical terms, a large number for the precision indicates that the results are scattered and it means the precision is poor. The good precision depend critically on the supplying the similar conditions. Precision can be considered at three levels [1-16] and it can be called as repeatability, intermediate precision and reproducibility.
Repeatability: Repeatability represents the lowest level degree of the precision. It is obtained by using the same method on the working compound, under the same conditions such as same analyst, same equipment, same laboratory and the same time interval, may be expected to lie with a specified probability in the absence of other indications. Therefore, it is essential to apply the whole electroanalytical procedure in the same sample solution at least six times. Repeatability should be performed with large number of data (at least 6 times). The repeatability criterion for an electroanalytical assay method will be 1.0% (RSD). However, for an impurity or trace amount assay, this precision criterion will be 5.0% [1-20, 63, 64].
Intermediate Precision: It expresses within laboratory variations such as different stock solutions, different days, different analysts, different equipment etc [1-20]. In order to estimate it, the RSD% of a series of measurements obtained in a given laboratory during the time period of couple weeks is used. Intermediate precision is the total precision under varied conditions and it can be called as between day, between run or inter assay precision. A pooled RSD indicate the intermediate precision. A precision criterion for an assay method is that the intermediate precision will be 2.0%. However, for an impurity or trace amount assay, this precision will be 5.0% [1-20, 38, 63, 64].
Reproducibility: Reproducibility is the value below which the absolute difference between two single tests results obtained by the same method on investigated test compound under different conditions such as different analysts, different equipments, different laboratories etc. It may be expected to lie with a specified probability in the absence of other indications; the probability is taken as 95%. The reproducibility parameter is important if the method is to be used in different laboratories [1-20, 38, 63, 64]. Reproducibility has some similarities with the other analytical validation procedure which is called as “ruggedness”. Reproducibility from collaborative trials can be expected to include additional contributions due to a probably larger difference of knowledge experience, equipment etc among the participating laboratories. Sometimes, reproducibility may be used instead of the intermediate precision. Precision criteria for an assay method are that the reproducibility will be 2.0%. For an impurity or trace amount assay, this precision parameter can be 10.0%. Reproducibility is not normally expected and the
8 The Open Analytical Chemistry Journal, 2011, Volume 5 Gumustas and Ozkan
mandatory validation parameter if intermediate precision is performed.
ROBUSTNESS
Robustness of an electroanalytical procedure is measure of its capacity to remain unaffected by small fluctuations in electroanalytical conditions on the final results. The main goal of the robustness is to detect and quantify the experimental weakness of the method, so that any critical factors can be anticipated and controlled in order to ensure that the operating conditions will fall within an undisturbed range. The robustness of an electroanalytical method can generally be described as the ability to reproduce an electroanalytical method in different laboratories or in different circumstances without the occurrence of unexpected differences in the obtained results. It provides an indication of its reliability during normal usage. Robustness tests examine the effect that operational parameters have on the analysis results [1-20, 65-67]. Typically, method performance parameters such as specificity, selectivity, sensitivity, precision and accuracy are used to assess robustness. However, considering the amount of time wasted for problem-solving during a routine application, robustness testing has certainly an impact for pharmaceutical and biological sample analysis that are used over longer periods of time and/or in different laboratories. As a short description, robustness is a parameter related to the changes in internal experimental conditions. For the determination of robustness of the proposed electroanalytical method a number of parameters should be evaluated [1-20, 65-67].
A study of the robustness of an electrochemical method should begin with careful selection of those experimental variables that are crucial to the electroanalytical method such as supporting electrolyte, nature of the buffer, pH, ionic strength, pulse period, pulse width, temperature etc. Then a systematic procedure should be used to implement to method under slightly different experimental parameters [1-20, 65-72]. The usual way of performing robustness testing is first to define the parameters with reasonable maximum variation. Then each parameter is successively varied, whereas the others are held at nominal setting. One parameter is changed and the others are always set to nominal levels. Nowadays, an experimental design approach is often preferred for robustness testing [1-20, 65-72]. The robustness study is an essential subject in the validation of an electroanalytical process.
RUGGEDNESS
Ruggedness is normally expressed as the lack of influence on test results of operational and environmental variables of an electroanalytical method. It is measure of the reproducibility of test results under normal operating conditions as specified in the method, and may be determined as part of collaborative trial. It can also be defined as the reproducibility of experimental results when the method is performed under actual use conditions. This includes different laboratories, instruments, and analysts, sources of reagents, chemicals, solvents, and different elapsed assay times and so on. These experiments and results are similar with the reproducibility. Ruggedness is a measure of reproducibility of test results under normal, expected
operational conditions between laboratories and from analyst to analyst [1-20, 65-67, 73-76]. Ruggedness is not addressed in the ICH guidelines. It defines by USP as the degree of reproducibility of results obtained under a variety of conditions.
All the results are reported as RSD% values which are described in precision section [1-20, 65-67, 73-76].
STABILITY
A stability indicating method is defined as a validated electroanalytical procedure that accurately and precisely measure drug active compounds free from potential interferences like degradation products, process impurities, excipients, endogenous substances or other potential impurities. The aim of a stability test is to detect any degradation of the analytes of interest, during the entire period of sample collection, processing, storing, preparing, analysis, etc. A stability indicating method is a quantitative analytical procedure used to detect a decrease in the amount of the active pharmaceutical ingredients present due to degradation. The tendency of drug substances to form degradation products under normal storage and handling conditions is an indication of difficulties for the formulation development researchers and may ultimately threaten the commercial viability of the drug candidate. To generate reproducible and reliable results, the samples, standards, reagents, supporting electrolytes and working electrodes must be stable for required time interval. It is a measure of the bias in assay results generated during a pre-selected time interval. Studies to determine the stability of the analytes of interest should be conducted to replicate as closely as possible the actual in use conditions and the storage period should exceed the expected period of use. The stability of the stored frozen samples should be constant at least two freeze-thaw cycles [1-20, 77-80]. Stability studies should evaluate the stability of the analytes during sample collection, handling, after short-term (room temperature, stressing conditions) and long-term (frozen at the intended storage temperature) storage, and after going through freeze-thaw cycles and the analytical process.
The stability of all reagents and solutions is important with regards to both time and temperature. Conditions used in stability experiments should reflect situations likely to be encountered during actual sample handling and electroanalysis. The working procedure should include an evaluation of analyte stability in main stock solution. The potentially available metabolites and the stability of the drug active compounds should be confirmed. It should be realized using the same solution. Hence, it is considered appropriate when the RSD values calculated on the assay results obtained at different time intervals. System stability is appropriate if results do not exceed 20% of system precision [1-20, 77-86]. Stability data are obtained from two or three different concentration levels (low, medium and high concentrations of the linearity range) at different time intervals after storing, performing replicate analysis (between 5 and 10 experiments) [1-20, 77-88]. For the determination of compound amount, freshly prepared calibration samples must be diluted from stock solutions using the same substance batch, same blank in the matrix of
Method Validation in Drug Analysis Using Electroanalytical Techniques The Open Analytical Chemistry Journal, 2011, Volume 5 9
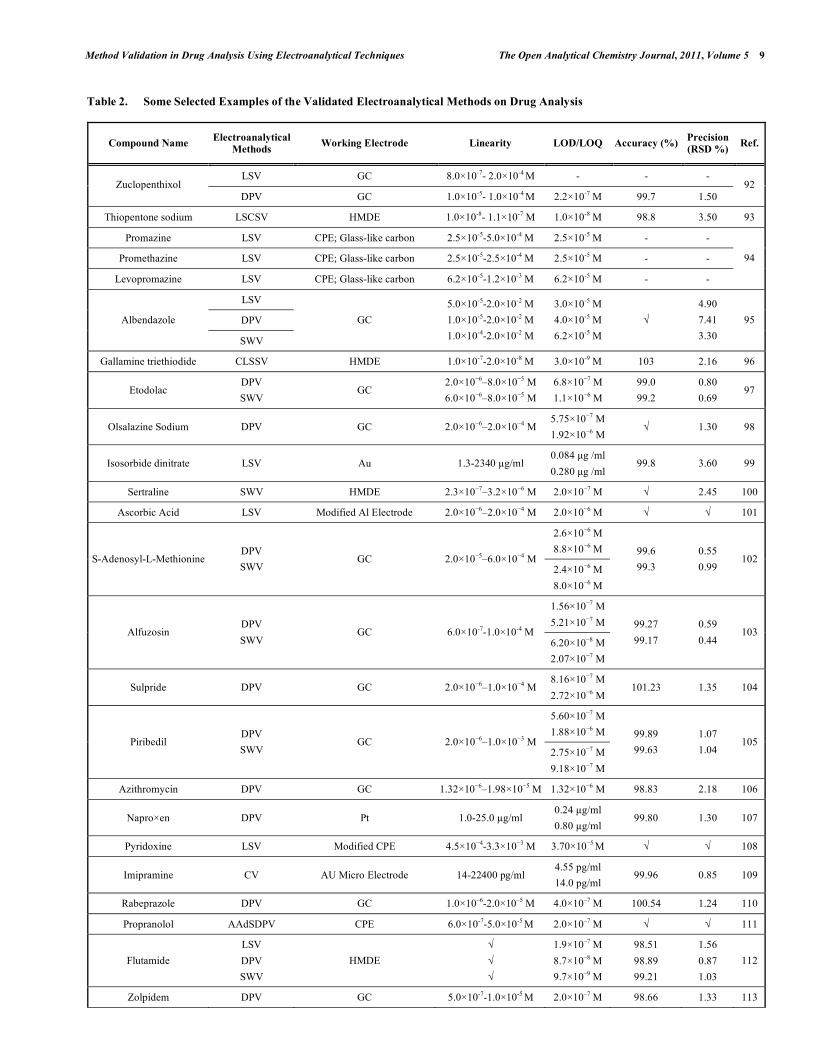
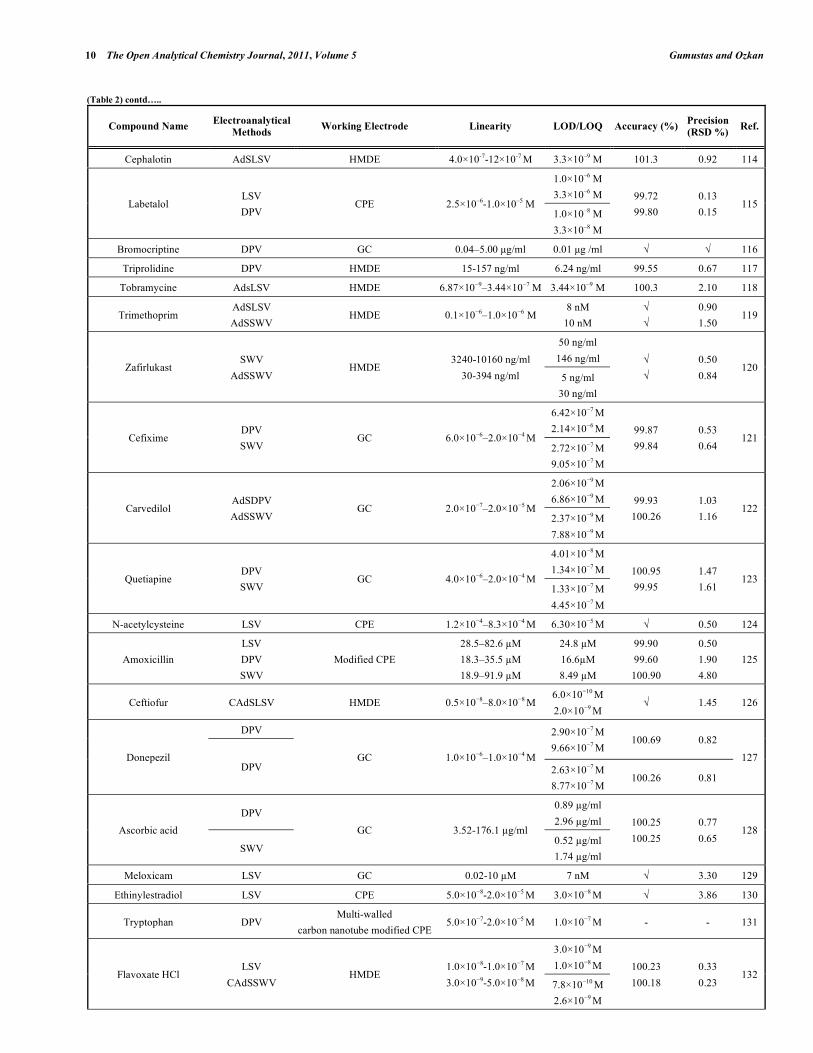
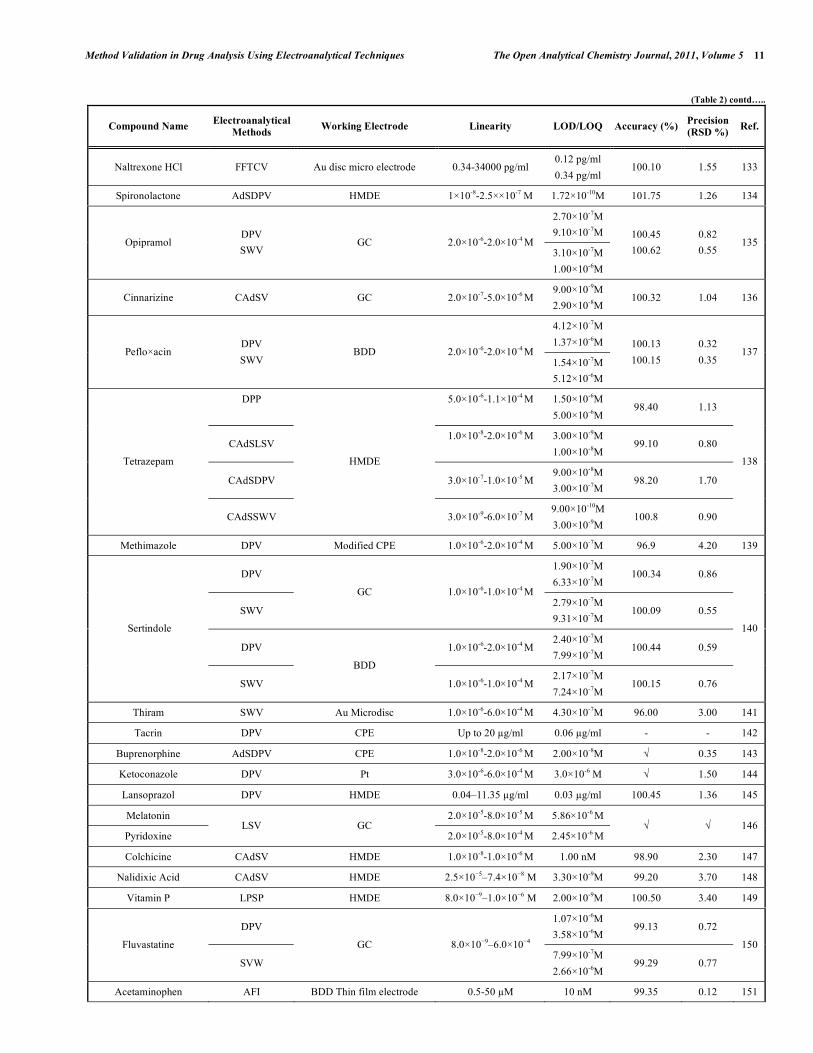
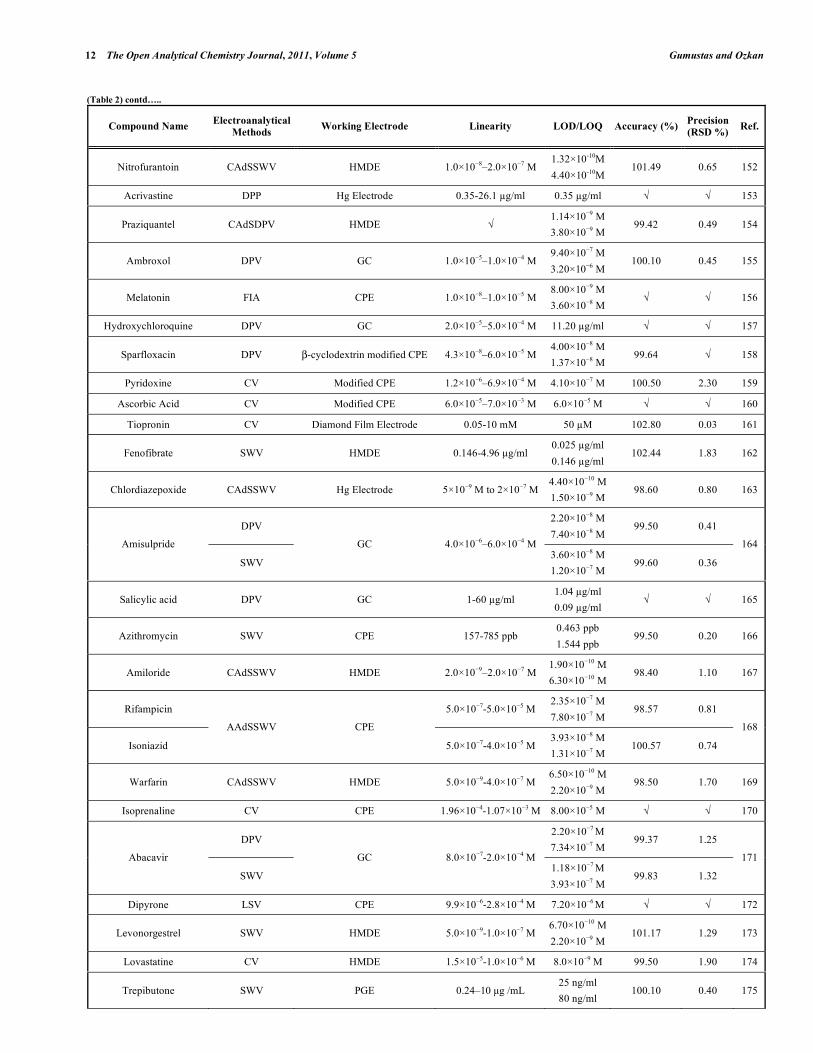
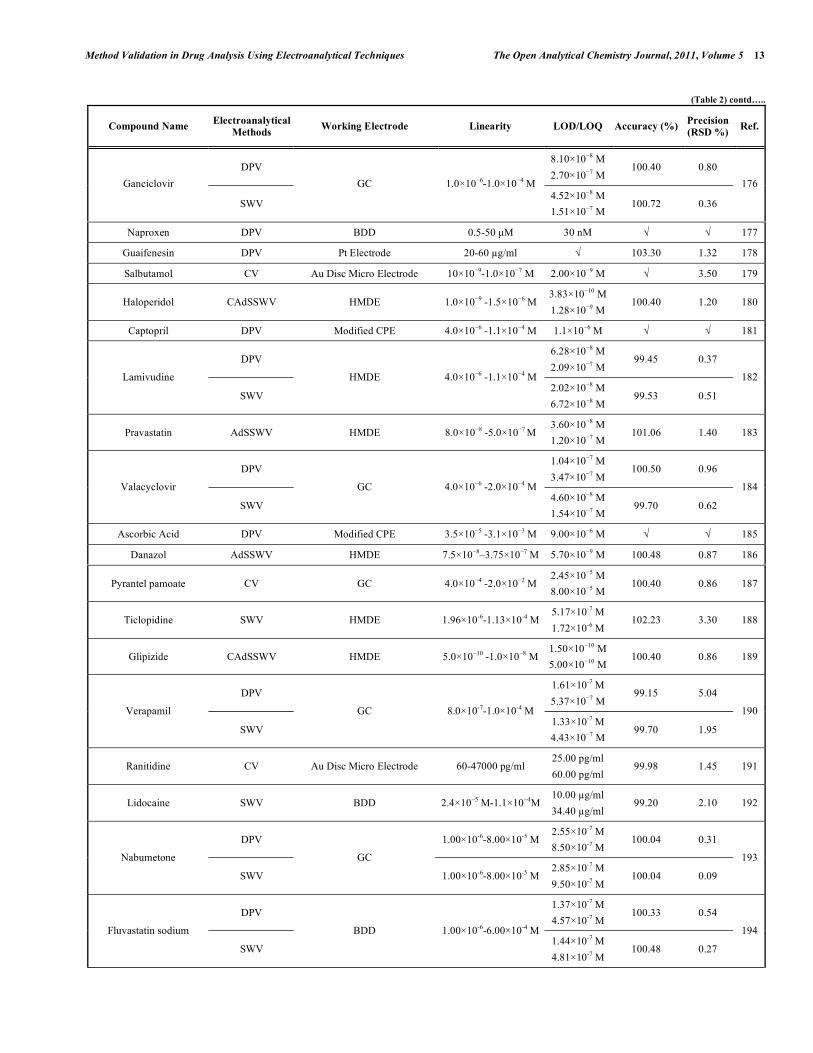
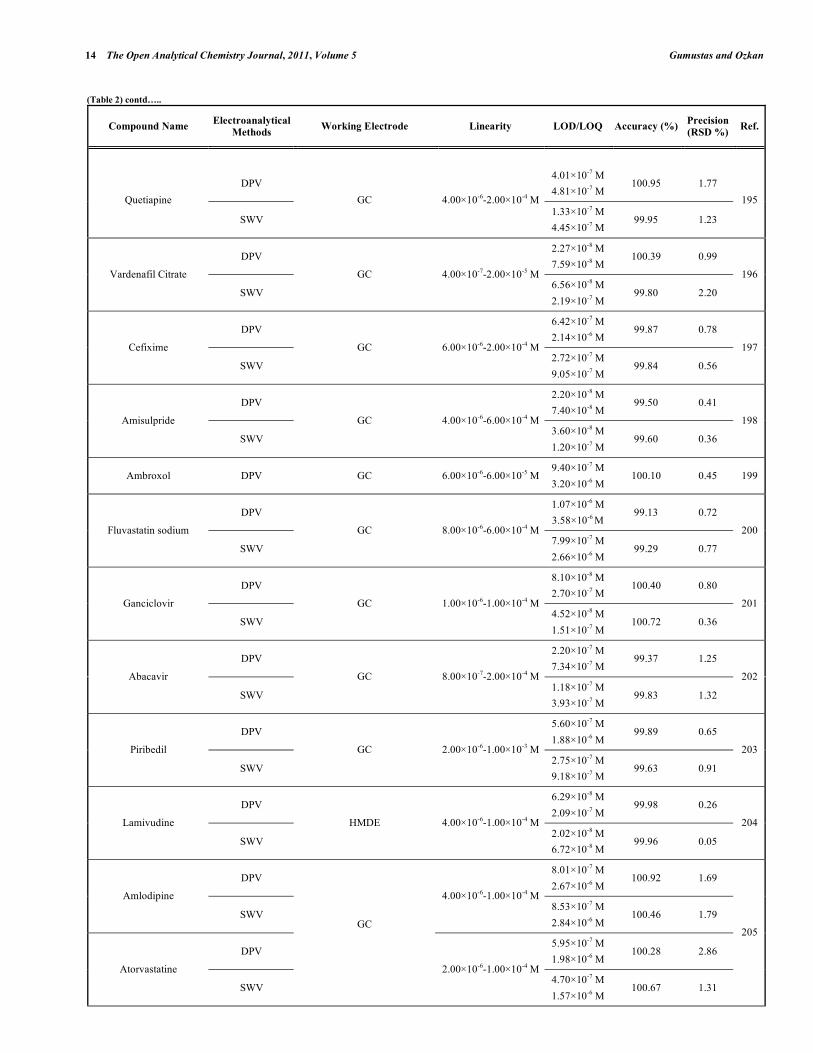
Table 2. Some Selected Examples of the Validated Electroanalytical Methods on Drug Analysis
Compound Name Electroanalytical
Methods Working Electrode Linearity LOD/LOQ Accuracy (%)
Precision
(RSD %) Ref.
LSV GC 8.0 10-7- 2.0 10-4 M - - - Zuclopenthixol
DPV GC 1.0 10-5- 1.0 10-4 M 2.2 10-7 M 99.7 1.50 92
Thiopentone sodium LSCSV HMDE 1.0 10-8- 1.1 10-7 M 1.0 10-8 M 98.8 3.50 93
Promazine LSV CPE; Glass-like carbon 2.5 10-5-5.0 10-4 M 2.5 10-5 M - -
Promethazine LSV CPE; Glass-like carbon 2.5 10-5-2.5 10-4 M 2.5 10-5 M - -
Levopromazine LSV CPE; Glass-like carbon 6.2 10-5-1.2 10-3 M 6.2 10-5 M - -
94
LSV
DPV Albendazole
SWV
GC
5.0 10-5-2.0 10-2 M
1.0 10-5-2.0 10-2 M
1.0 10-4-2.0 10-2 M
3.0 10-5 M
4.0 10-5 M
6.2 10-5 M
4.90
7.41
3.30
95
Gallamine triethiodide CLSSV HMDE 1.0 10-7-2.0 10-8 M 3.0 10-9 M 103 2.16 96
Etodolac DPV
SWV GC
2.0 10 6–8.0 10 5 M
6.0 10 6–8.0 10 5 M
6.8 10 7 M
1.1 10 6 M
99.0
99.2
0.80
0.69 97
Olsalazine Sodium DPV GC 2.0 10 6–2.0 10 4 M 5.75 10 7 M
1.92 10 6 M 1.30 98
Isosorbide dinitrate LSV Au 1.3-2340 g/ml 0.084 μg /ml
0.280 μg /ml 99.8 3.60 99
Sertraline SWV HMDE 2.3 10 7–3.2 10 6 M 2.0 10 7 M 2.45 100
Ascorbic Acid LSV Modified Al Electrode 2.0 10 6–2.0 10 4 M 2.0 10 6 M 101
2.6 10 6 M
8.8 10 6 M S-Adenosyl-L-Methionine
DPV
SWV GC 2.0 10 5–6.0 10 4 M
2.4 10 6 M
8.0 10 6 M
99.6
99.3
0.55
0.99 102
1.56 10 7 M
5.21 10 7 M Alfuzosin
DPV
SWV GC 6.0 10-7-1.0 10-4 M
6.20 10 8 M
2.07 10 7 M
99.27
99.17
0.59
0.44 103
Sulpride DPV GC 2.0 10 6–1.0 10 4 M 8.16 10 7 M
2.72 10 6 M 101.23 1.35 104
5.60 10 7 M
1.88 10 6 M Piribedil
DPV
SWV GC 2.0 10 6–1.0 10 3 M
2.75 10 7 M
9.18 10 7 M
99.89
99.63
1.07
1.04 105
Azithromycin DPV GC 1.32 10 6–1.98 10 5 M 1.32 10 6 M 98.83 2.18 106
Napro en DPV Pt 1.0-25.0 g/ml 0.24 g/ml
0.80 g/ml 99.80 1.30 107
Pyridoxine LSV Modified CPE 4.5 10 4-3.3 10 3 M 3.70 10 5 M 108
Imipramine CV AU Micro Electrode 14-22400 pg/ml 4.55 pg/ml
14.0 pg/ml 99.96 0.85 109
Rabeprazole DPV GC 1.0 10–6-2.0 10–5 M 4.0 10–7 M 100.54 1.24 110
Propranolol AAdSDPV CPE 6.0 10-7-5.0 10-5 M 2.0 10–7 M 111
Flutamide
LSV
DPV
SWV
HMDE
1.9 10–7 M
8.7 10–8 M
9.7 10–9 M
98.51
98.89
99.21
1.56
0.87
1.03
112
Zolpidem DPV GC 5.0 10-7-1.0 10-5 M 2.0 10–7 M 98.66 1.33 113
10 The Open Analytical Chemistry Journal, 2011, Volume 5 Gumustas and Ozkan
(Table 2) contd…..
Compound Name Electroanalytical
Methods Working Electrode Linearity LOD/LOQ Accuracy (%)
Precision
(RSD %) Ref.
Cephalotin AdSLSV HMDE 4.0 10-7-12 10-7 M 3.3 10–9 M 101.3 0.92 114
1.0 10–6 M
3.3 10–6 M Labetalol
LSV
DPV CPE 2.5 10–6-1.0 10–5 M
1.0 10–8 M
3.3 10–8 M
99.72
99.80
0.13
0.15 115
Bromocriptine DPV GC 0.04–5.00 μg/ml 0.01 μg /ml 116
Triprolidine DPV HMDE 15-157 ng/ml 6.24 ng/ml 99.55 0.67 117
Tobramycine AdsLSV HMDE 6.87 10 9–3.44 10 7 M 3.44 10 9 M 100.3 2.10 118
Trimethoprim AdSLSV
AdSSWV HMDE 0.1 10 6–1.0 10 6 M
8 nM
10 nM
0.90
1.50 119
50 ng/ml
146 ng/ml Zafirlukast
SWV
AdSSWV HMDE
3240-10160 ng/ml
30-394 ng/ml 5 ng/ml
30 ng/ml
0.50
0.84 120
6.42 10 7 M
2.14 10 6 M Cefixime
DPV
SWV GC 6.0 10 6–2.0 10 4 M
2.72 10 7 M
9.05 10 7 M
99.87
99.84
0.53
0.64 121
2.06 10 9 M
6.86 10 9 M Carvedilol
AdSDPV
AdSSWV GC 2.0 10 7–2.0 10 5 M
2.37 10 9 M
7.88 10 9 M
99.93
100.26
1.03
1.16 122
4.01 10 8 M
1.34 10 7 M Quetiapine
DPV
SWV GC 4.0 10 6–2.0 10 4 M
1.33 10 7 M
4.45 10 7 M
100.95
99.95
1.47
1.61 123
N-acetylcysteine LSV CPE 1.2 10 4–8.3 10 4 M 6.30 10 5 M 0.50 124
Amoxicillin
LSV
DPV
SWV
Modified CPE
28.5–82.6 M
18.3–35.5 M
18.9–91.9 M
24.8 M
16.6 M
8.49 M
99.90
99.60
100.90
0.50
1.90
4.80
125
Ceftiofur CAdSLSV HMDE 0.5 10 8–8.0 10 8 M 6.0 10 10 M
2.0 10 9 M 1.45 126
DPV 2.90 10 7 M
9.66 10 7 M 100.69 0.82
Donepezil DPV
GC 1.0 10 6–1.0 10 4 M 2.63 10 7 M
8.77 10 7 M 100.26 0.81
127
DPV 0.89 g/ml
2.96 g/ml Ascorbic acid
SWV
GC 3.52-176.1 g/ml 0.52 g/ml
1.74 g/ml
100.25
100.25
0.77
0.65 128
Meloxicam LSV GC 0.02-10 M 7 nM 3.30 129
Ethinylestradiol LSV CPE 5.0 10 8-2.0 10 5 M 3.0 10 8 M 3.86 130
Tryptophan DPV Multi-walled
carbon nanotube modified CPE 5.0 10 7-2.0 10 5 M 1.0 10 7 M - - 131
3.0 10 9 M
1.0 10 8 M Flavoxate HCl
LSV
CAdSSWV HMDE
1.0 10 8-1.0 10 7 M
3.0 10 9-5.0 10 8 M 7.8 10 10 M
2.6 10 9 M
100.23
100.18
0.33
0.23 132
Method Validation in Drug Analysis Using Electroanalytical Techniques The Open Analytical Chemistry Journal, 2011, Volume 5 11
(Table 2) contd…..
Compound Name Electroanalytical
Methods Working Electrode Linearity LOD/LOQ Accuracy (%)
Precision
(RSD %) Ref.
Naltrexone HCl FFTCV Au disc micro electrode 0.34-34000 pg/ml 0.12 pg/ml
0.34 pg/ml 100.10 1.55 133
Spironolactone AdSDPV HMDE 1 10-8-2.5 10-7 M 1.72 10-10M 101.75 1.26 134
2.70 10-7M
9.10 10-7M Opipramol
DPV
SWV GC 2.0 10-6-2.0 10-4 M
3.10 10-7M
1.00 10-6M
100.45
100.62
0.82
0.55 135
Cinnarizine CAdSV GC 2.0 10-7-5.0 10-6 M 9.00 10-9M
2.90 10-8M 100.32 1.04 136
4.12 10-7M
1.37 10-6M Peflo acin
DPV
SWV BDD 2.0 10-6-2.0 10-4 M
1.54 10-7M
5.12 10-6M
100.13
100.15
0.32
0.35 137
DPP
5.0 10-6-1.1 10-4 M
1.50 10-6M
5.00 10-6M 98.40 1.13
CAdSLSV 1.0 10-8-2.0 10-6 M
3.00 10-9M
1.00 10-8M 99.10 0.80
CAdSDPV 3.0 10-7-1.0 10-5 M 9.00 10-8M
3.00 10-7M 98.20 1.70
Tetrazepam
CAdSSWV
HMDE
3.0 10-9-6.0 10-7 M 9.00 10-10M
3.00 10-9M 100.8 0.90
138
Methimazole DPV Modified CPE 1.0 10-6-2.0 10-4 M 5.00 10-7M 96.9 4.20 139
DPV 1.90 10-7M
6.33 10-7M 100.34 0.86
SWV
GC 1.0 10-6-1.0 10-4 M 2.79 10-7M
9.31 10-7M 100.09 0.55
DPV 1.0 10-6-2.0 10-4 M 2.40 10-7M
7.99 10-7M 100.44 0.59
Sertindole
SWV
BDD
1.0 10-6-1.0 10-4 M 2.17 10-7M
7.24 10-7M 100.15 0.76
140
Thiram SWV Au Microdisc 1.0 10-6-6.0 10-4 M 4.30 10-7M 96.00 3.00 141
Tacrin DPV CPE Up to 20 g/ml 0.06 g/ml - - 142
Buprenorphine AdSDPV CPE 1.0 10-8-2.0 10-6 M 2.00 10-8M 0.35 143
Ketoconazole DPV Pt 3.0 10-6-6.0 10-4 M 3.0 10-6 M 1.50 144
Lansoprazol DPV HMDE 0.04–11.35 g/ml 0.03 g/ml 100.45 1.36 145
Melatonin 2.0 10-5-8.0 10-5 M 5.86 10-6 M
Pyridoxine LSV GC
2.0 10-5-8.0 10-4 M 2.45 10-6 M 146
Colchicine CAdSV HMDE 1.0 10-8-1.0 10-6 M 1.00 nM 98.90 2.30 147
Nalidixic Acid CAdSV HMDE 2.5 10 5–7.4 10 8 M 3.30 10-9M 99.20 3.70 148
Vitamin P LPSP HMDE 8.0 10 9–1.0 10 6 M 2.00 10-9M 100.50 3.40 149
DPV 1.07 10-6M
3.58 10-6M 99.13 0.72
Fluvastatine
SVW
GC 8.0 10 9–6.0 10 4 7.99 10-7M
2.66 10-6M 99.29 0.77
150
Acetaminophen AFI BDD Thin film electrode 0.5-50 M 10 nM 99.35 0.12 151
12 The Open Analytical Chemistry Journal, 2011, Volume 5 Gumustas and Ozkan
(Table 2) contd…..
Compound Name Electroanalytical
Methods Working Electrode Linearity LOD/LOQ Accuracy (%)
Precision
(RSD %) Ref.
Nitrofurantoin CAdSSWV HMDE 1.0 10 8–2.0 10 7 M 1.32 10-10M
4.40 10-10M 101.49 0.65 152
Acrivastine DPP Hg Electrode 0.35-26.1 g/ml 0.35 g/ml 153
Praziquantel CAdSDPV HMDE 1.14 10 9 M
3.80 10 9 M 99.42 0.49 154
Ambroxol DPV GC 1.0 10 5–1.0 10 4 M 9.40 10 7 M
3.20 10 6 M 100.10 0.45 155
Melatonin FIA CPE 1.0 10 8–1.0 10 5 M 8.00 10 9 M
3.60 10 8 M 156
Hydroxychloroquine DPV GC 2.0 10 5–5.0 10 4 M 11.20 g/ml 157
Sparfloxacin DPV -cyclodextrin modified CPE 4.3 10 8–6.0 10 5 M 4.00 10 8 M
1.37 10 8 M 99.64 158
Pyridoxine CV Modified CPE 1.2 10 6–6.9 10 4 M 4.10 10 7 M 100.50 2.30 159
Ascorbic Acid CV Modified CPE 6.0 10 5–7.0 10 3 M 6.0 10 5 M 160
Tiopronin CV Diamond Film Electrode 0.05-10 mM 50 M 102.80 0.03 161
Fenofibrate SWV HMDE 0.146-4.96 g/ml 0.025 g/ml
0.146 g/ml 102.44 1.83 162
Chlordiazepoxide CAdSSWV Hg Electrode 5 10 9 M to 2 10 7 M 4.40 10 10 M
1.50 10 9 M 98.60 0.80 163
DPV 2.20 10 8 M
7.40 10 8 M 99.50 0.41
Amisulpride
SWV
GC 4.0 10 6–6.0 10 4 M 3.60 10 8 M
1.20 10 7 M 99.60 0.36
164
Salicylic acid DPV GC 1-60 g/ml 1.04 g/ml
0.09 g/ml 165
Azithromycin SWV CPE 157-785 ppb 0.463 ppb
1.544 ppb 99.50 0.20 166
Amiloride CAdSSWV HMDE 2.0 10 9–2.0 10 7 M 1.90 10 10 M
6.30 10 10 M 98.40 1.10 167
Rifampicin 5.0 10 7-5.0 10 5 M 2.35 10 7 M
7.80 10 7 M 98.57 0.81
Isoniazid
AAdSSWV CPE
5.0 10 7-4.0 10 5 M 3.93 10 8 M
1.31 10 7 M 100.57 0.74
168
Warfarin CAdSSWV HMDE 5.0 10 9-4.0 10 7 M 6.50 10 10 M
2.20 10 9 M 98.50 1.70 169
Isoprenaline CV CPE 1.96 10 4-1.07 10 3 M 8.00 10 5 M 170
DPV 2.20 10 7 M
7.34 10 7 M 99.37 1.25
Abacavir
SWV
GC 8.0 10 7-2.0 10 4 M 1.18 10 7 M
3.93 10 7 M 99.83 1.32
171
Dipyrone LSV CPE 9.9 10 6-2.8 10 4 M 7.20 10 6 M 172
Levonorgestrel SWV HMDE 5.0 10 9-1.0 10 7 M 6.70 10 10 M
2.20 10 9 M 101.17 1.29 173
Lovastatine CV HMDE 1.5 10 5-1.0 10 6 M 8.0 10 9 M 99.50 1.90 174
Trepibutone SWV PGE 0.24–10 μg /mL 25 ng/ml
80 ng/ml 100.10 0.40 175
Method Validation in Drug Analysis Using Electroanalytical Techniques The Open Analytical Chemistry Journal, 2011, Volume 5 13
(Table 2) contd…..
Compound Name Electroanalytical
Methods Working Electrode Linearity LOD/LOQ Accuracy (%)
Precision
(RSD %) Ref.
DPV 8.10 10 8 M
2.70 10 7 M 100.40 0.80
Ganciclovir
SWV
GC 1.0 10 6-1.0 10 4 M 4.52 10 8 M
1.51 10 7 M 100.72 0.36
176
Naproxen DPV BDD 0.5-50 μM 30 nM 177
Guaifenesin DPV Pt Electrode 20-60 g/ml 103.30 1.32 178
Salbutamol CV Au Disc Micro Electrode 10 10 9-1.0 10 7 M 2.00 10 9 M 3.50 179
Haloperidol CAdSSWV HMDE 1.0 10 9 -1.5 10 6 M 3.83 10 10 M
1.28 10 9 M 100.40 1.20 180
Captopril DPV Modified CPE 4.0 10 6 -1.1 10 4 M 1.1 10 6 M 181
DPV 6.28 10 8 M
2.09 10 7 M 99.45 0.37
Lamivudine
SWV
HMDE 4.0 10 6 -1.1 10 4 M 2.02 10 8 M
6.72 10 8 M 99.53 0.51
182
Pravastatin AdSSWV HMDE 8.0 10 8 -5.0 10 7 M 3.60 10 8 M
1.20 10 7 M 101.06 1.40 183
DPV 1.04 10 7 M
3.47 10 7 M 100.50 0.96
Valacyclovir
SWV
GC 4.0 10 6 -2.0 10 4 M 4.60 10 8 M
1.54 10 7 M 99.70 0.62
184
Ascorbic Acid DPV Modified CPE 3.5 10 5 -3.1 10 3 M 9.00 10 6 M 185
Danazol AdSSWV HMDE 7.5 10 8–3.75 10 7 M 5.70 10 9 M 100.48 0.87 186
Pyrantel pamoate CV GC 4.0 10 4 -2.0 10 2 M 2.45 10 5 M
8.00 10 5 M 100.40 0.86 187
Ticlopidine SWV HMDE 1.96 10-6-1.13 10-4 M 5.17 10-7 M
1.72 10-6 M 102.23 3.30 188
Glipizide CAdSSWV HMDE 5.0 10 10 -1.0 10 8 M 1.50 10 10 M
5.00 10 10 M 100.40 0.86 189
DPV 1.61 10-7 M
5.37 10 7 M 99.15 5.04
Verapamil
SWV
GC 8.0 10-7-1.0 10-4 M 1.33 10-7 M
4.43 10 7 M 99.70 1.95
190
Ranitidine CV Au Disc Micro Electrode 60-47000 pg/ml 25.00 pg/ml
60.00 pg/ml 99.98 1.45 191
Lidocaine SWV BDD 2.4 10 5 M-1.1 10 4M 10.00 g/ml
34.40 g/ml 99.20 2.10 192
DPV 1.00 10-6-8.00 10-5 M 2.55 10-7 M
8.50 10-7 M 100.04 0.31
Nabumetone
SWV
GC
1.00 10-6-8.00 10-5 M 2.85 10-7 M
9.50 10-7 M 100.04 0.09
193
DPV 1.37 10-7 M
4.57 10-7 M 100.33 0.54
Fluvastatin sodium
SWV
BDD 1.00 10-6-6.00 10-4 M 1.44 10-7 M
4.81 10-7 M 100.48 0.27
194
14 The Open Analytical Chemistry Journal, 2011, Volume 5 Gumustas and Ozkan
(Table 2) contd…..
Compound Name Electroanalytical
Methods Working Electrode Linearity LOD/LOQ Accuracy (%)
Precision
(RSD %) Ref.
DPV
4.01 10-7 M
4.81 10-7 M
100.95
1.77
Quetiapine
SWV
GC
4.00 10-6-2.00 10-4 M 1.33 10-7 M
4.45 10-7 M 99.95 1.23
195
DPV 2.27 10-8 M
7.59 10-8 M 100.39 0.99
Vardenafil Citrate
SWV
GC 4.00 10-7-2.00 10-5 M 6.56 10-8 M
2.19 10-7 M 99.80 2.20
196
DPV 6.42 10-7 M
2.14 10-6 M 99.87 0.78
Cefixime
SWV
GC 6.00 10-6-2.00 10-4 M 2.72 10-7 M
9.05 10-7 M 99.84 0.56
197
DPV 2.20 10-8 M
7.40 10-8 M 99.50 0.41
Amisulpride
SWV
GC 4.00 10-6-6.00 10-4 M 3.60 10-8 M
1.20 10-7 M 99.60 0.36
198
Ambroxol DPV GC 6.00 10-6-6.00 10-5 M 9.40 10-7 M
3.20 10-6 M 100.10 0.45 199
DPV 1.07 10-6 M
3.58 10-6 M 99.13 0.72
Fluvastatin sodium
SWV
GC 8.00 10-6-6.00 10-4 M 7.99 10-7 M
2.66 10-6 M 99.29 0.77
200
DPV 8.10 10-8 M
2.70 10-7 M 100.40 0.80
Ganciclovir
SWV
GC 1.00 10-6-1.00 10-4 M 4.52 10-8 M
1.51 10-7 M 100.72 0.36
201
DPV 2.20 10-7 M
7.34 10-7 M 99.37 1.25
Abacavir
SWV
GC 8.00 10-7-2.00 10-4 M 1.18 10-7 M
3.93 10-7 M 99.83 1.32
202
DPV 5.60 10-7 M
1.88 10-6 M 99.89 0.65
Piribedil
SWV
GC 2.00 10-6-1.00 10-3 M 2.75 10-7 M
9.18 10-7 M 99.63 0.91
203
DPV 6.29 10-8 M
2.09 10-7 M 99.98 0.26
Lamivudine
SWV
HMDE 4.00 10-6-1.00 10-4 M 2.02 10-8 M
6.72 10-8 M 99.96 0.05
204
DPV 8.01 10-7 M
2.67 10-6 M 100.92 1.69
Amlodipine
SWV
4.00 10-6-1.00 10-4 M 8.53 10-7 M
2.84 10-6 M 100.46 1.79
DPV 5.95 10-7 M
1.98 10-6 M 100.28 2.86
Atorvastatine
SWV
GC
2.00 10-6-1.00 10-4 M 4.70 10-7 M
1.57 10-6 M 100.67 1.31
205
Method Validation in Drug Analysis Using Electroanalytical Techniques The Open Analytical Chemistry Journal, 2011, Volume 5 15
Table 2) contd…..
Compound Name Electroanalytical
Methods Working Electrode Linearity LOD/LOQ Accuracy (%)
Precision
(RSD %) Ref.
Ofloxacine AdSSWV HMDE 5.00 10-7-1.60 10-6 M 1.10 10-8 M 99.60 1.21 206
Sumatriptan CV Modified PGE 8.00 10-8-1.00 10-4 M 4.10 10-8 M 96.44 4.30 207
Cinnarizine DPV Modified GC 9.00 10-8-6.00 10-6 M 2.58 10-9 M 98.9 1.43 208
Gabapentin DPV Au Electrode 0.3-15 μM 0.13 μM 99.87 0.36 209
Trazodone DPV Modified GC 0.2-10 μM 24 nm 99.70 0.32 210
Chloroquine DPV 0.068-6.88 g/ml 0.01 g/ml 99.20
Primaquine DPV Modified CPE
0.58-5.89 0.25 g/ml 100.30 211
AdSDPV 6.00 10-7-2.00 10-5 M 2.78 10-7 M
5.28 10-7 M 99.73 0.43
Zopiclone
AdSSWV
GC
6.00 10-7-2.00 10-5 M 1.70 10-7 M
5.78 10-7 M 99.87 0.33
212
Atenolol AdSDPV Modified CPE 0.4-80 μM 0.1 μM
0.35 μM 213
Moexipril DPV CPE 4.00 10-7-5.20 10-6 M 6.87 10-8 M
2.29 10-7 M 99.96 0.66 214
Secnidazole CAdSV GC 4.00 10-6-1.20 10-4 M 1.20 10-6 M 100.91 1.82 215
Ciprofloxacin CV Modified GC 40–1000 μM 6 μM - - 216
Amlodipine Besylate SWV Modified EPPGE 5.00 10-9-1.00 10-6 M 5.00 10-9 M 217
CAdSDPV 1-80 μg/mL 32.3 ng/mL 99.99 0.76 Pyridostigmine Bromide
CAdSSWV HMDE
100 ng/mL –-72 μg/mL 20.7 ng/mL 100.10 0.50 218
DPV 0.75 10-7 M
2.28 10-7 M 99.47 1.09
Ziprasidone
SWV
BDD 8.00 10-7-8.00 10-6 M 0.48 10-7 M
1.44 10-7 M 99.27 0.50
219
Estriol SWV BDD 2.00 10-7-2.00 10-5 M 1.70 10-7 M
8.50 10-7 M 99.50 1.20 220
Azathioprine CV Modified GC 0.2–100 μM 65 nm 3.70 221
Naratriptan DPV GC 8.00 10-5-1.00 10-3 M 9.50 10-6 M
2.00 10-5 M 102.10 1.80 222
DPV 2.17 10-7 M
6.59 10-7 M 100.10 0.13
SWV
BDD 4.00 10-6-1.00 10-4 M 2.97 10-7 M
9.00 10-7 M 100.02 0.14
DPV 5.05 10-7 M
1.53 10-6 M 99.88 0.06
Fosamprenavir
SWV
GC 1.00 10-5-1.00 10-4 M 3.78 10-7 M
1.16 10-6 M 100.54 0.20
223
Abbreviations: CV: Cyclic Voltammetry; HMDE: Hanging mercury drop electrode; PGE: Pencil graphite electrode; LSV: Linear sweep voltammetry; SWV: Square wave voltammetry; DPV: Differential pulse voltammetry; GCE: Glassy carbon electrode; CPE:Carbon paste electrode; MWCNT: multi walled carbon nanotube; PSA: Potentiometric stripping analysis; LSCSV: Linear sweep cathodic stripping voltammetry; AdSDPV: Adsorptive stripping differential pulse voltammetry; AdSLSV: Adsorptive stripping linear sweep voltammetry; AdSSWV: Adsorptive stripping square wave voltammetry; CAdSLSV: Cathodic adsorptive stripping linear sweep voltammetry; CAdSDPV: Cathodic adsorptive stripping differential pulse voltammetry; CAdSSWV: Cathodic adsorptive stripping square wave voltammetry; CadSV: Cathodic adsorptive stripping voltammetry; AAdSDPV: Anodic adsorptive stripping differential pulse voltammetry; AAdSSWV: Anodic adsorptive stripping square wave voltammetry; FFTCV: Fourier transforms continuous cyclic voltammetry; BDD: Boron doped diamond; LPSP: Linear potential scan polarography; AFI: Amperometric flow injection; FIA: Flow injection analysis; PGE: Pencil graphite electrode; EPPGE: Edge plane pencil graphite electrode.
16 The Open Analytical Chemistry Journal, 2011, Volume 5 Gumustas and Ozkan
pharmaceutical dosage forms and same blank biological matrix as used for the stored samples [77-88]. A few hours of standard and sample solution stability can be required even for fast voltammetric methods [1-20, 77-91]. A t-test can be applied to assess analyte stability. Nonetheless, RSD results can be shown the analyte stability. The stability is considered appropriate when the RSD values, calculated on the assay results obtained at different time intervals, does not exceed more than 20% of the corresponding value of the precision of the proposed method.
The stability of all reagents, supporting electrolytes, buffers and solutions is important with regard to both time and temperature. The stability of the standard solutions of the analyte should be evaluated to cover the time interval from preparation until use. Typically, between 24 and 48 hours stability is desired for solutions and reagents that need to be prepared for each analysis. Supporting electrolytes should be chosen to avoid stability problems, especially the working with phosphate and acetate buffers. These supporting electrolytes should be kept in the fridge and controlled every day before use. However, it can be better if this type buffer solution may be freshly prepared every 3 or 4 days, because of the phosphate and acetate buffers provide good media for microbial growth.
To establish stability for electroanalytical assays, the mean analyzed results for all investigated samples should be within 15% of the nominal sample concentrations. For all type stabilities such as long-term, short-term, freeze-thaw stability, it is recommended that the coefficient variation (CV) (precision) for the replicate analyses not exceed 15%. However, stability studies are not mandatory parameters of the validation.
CONCLUSION
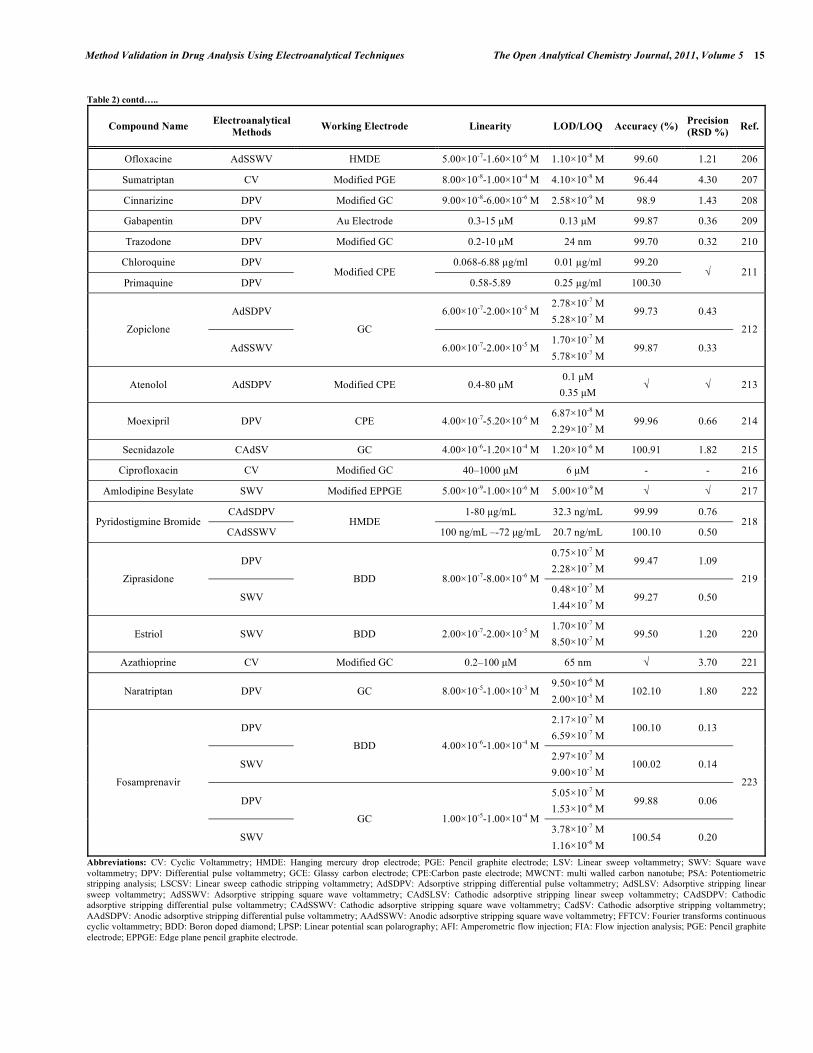
In electroanalytical drug analysis, important decisions are taken which are based on data obtained from real samples. The quality of electroanalytical data is the key to drug development programme success and the process of method development and validation has a direct impact on the quality of these data. Therefore, it is generally accepted that method validation is required to demonstrate the performance of the method and the reliability of the analytical results. Method validation is an essential component of the measures that a laboratory should implement to permit it to produce reliable electroanalytical data. Table 2 lists the some selected pharmaceutical active compounds that can be determined using fully validated electroanalytical methods together with their some validation parameters [92- 223]. Mostly DPV and SWV techniques were used for the analysis of drugs with glassy carbon electrodes. However, stripping techniques showed more sensitive responses when compared with the classical voltammetric techniques. In these selected electroanalytical procedures, the linearity, LOD and/or LOQ were reported for all techniques. However, in these selected electroanalytical study, accuracy and precision were reported for most of the literatures. Classical least square methods were mostly selected calculation techniques for the calibration equations (Table 2).
The method validation and its related parameters have been extended as details and guidelines have been published
by recognized authorities. Acceptance criteria can be dependent on the nature of the sample, the type of analytical methodology, and the purpose of carrying out the analysis. Validation parameters help assure that the electroanalytical methods ensure the correct identity, strength, quality, accurate, precise, selective, robust and sensitive. A well-defined and well-documented validation process provides regulatory agencies with evidence that the system and method suitable for its intended use.
REFERENCES
[1] ICH Guideline Q2A (R1), Validation of Analytical Procedures; Text and methodology. November, 2005.
[2] ICH Guideline Q2B, Validation of Analytical Procedures; Methodology. November, 1996.
[3] Ermer, J.; Miller, J.H.McB., Eds.; Method Validation in Pharmaceutical Analysis. Wiley-VCH Publishers; Weinheim,
2005. [4] Riley, C.M.; Rosanske T.W., Eds.; Development and Validation of
Analytical Methods, Pergamon Press; Oxford, 1996. [5] Chan, C.C.; Lam, H.; Lee, Y.C.; Zhang X.M., Eds.; Analytical
Method Validation and Instrument Performance Verification, Wiley-Interscience Pub.; New Jersey, 2004.
[6] Ahuja, S.; Scypinski S., Ed.; Handbook of Modern Pharmaceutical Analysis, Academic Press Pub.; London, 2001.
[7] De Bievre, P.; Günzler, H., Eds.; Validation in Chemical Measurement, Springer-Verlag Pub.; Heidelberg, 2005.
[8] Lunte, S.M.; Radzik, D.M. Pharmaceutical and Biomedical Applications of Capillary Electrophoresis, Pergamon Press; Oxford, 1996.
[9] Haider, S.I., Ed.; Pharmaceutical Master Validation Plan, CRC Press; New York, 2002.
[10] Thompson, M.; Ellison, S.L.R.; Wood, R. Harmonized Guidelines for Single-Laboratory Validation of Methods of Analysis (IUPAC Technical Report). Pure Appl. Chem., 2002, 74, 835-855.
[11] Berry, I.R.; Harpaz, D., Eds; Validation of Active Pharmaceutical Ingredients, CRC Press; Boca Raton, 2001.
[12] Bliesner, D.M., Ed; Validating Chromatographic Methods; A Practical Guide, Wiley- Interscience Pub.; New Jersey, 2006.
[13] Taverniers, I.; De Loose, M.; Van Bockstaele, E. Trends in quality in the analytical laboratory. II. Analytical method validation and quality assurance. Trends Anal. Chem., 2004, 23, 535-552.
[14] Konieczka, P. The Role of and the Place of Method Validation in the Quality Assurance and Quality Control (QA/QC) System. Crit. Rev. Anal. Chem., 2007, 37, 173-190.
[15] The United States Pharmacopoeia, USP 23, Validation of Compendial Methods, General information, The United States Pharmacopoeial Convention Inc., Taunton, MA, 1225, 1994.
[16] Prichard, E.; Barwick, V. Quality Assurance in Analytical
Chemistry, John Wiley&Sons Ltd. Pub.; United Kingdom, 2007. [17] Christian, G.D., Ed.; Analytical chemistry, 6th ed.; John Wiley &
Sons Inc.; New Jersey, 2004. [18] Kellner, R.; Mermet, J.M.; Otto, M.; Valcarcel, M.; H.M.Widmer,
Eds.; Analytical Chemistry, A Modern Approach to Analytical Science. 2nd ed.; Wiley-VCH Pub.; New York, 2004.
[19] S. Kromidas, Ed.; More Practical Problem Solving in HPLC, Wiley-VCH Verlag Gmgh&Co KgaA Pub.; Weinheim, 2005.
[20] Snyder, L.R.; Kirkland, J.J.; Glajch, J.L. Practical HPLC Method Development, 2nd ed.; John Wiley & Sons Inc.; New York, 1997.
[21] Branch, S.K. Guidelines from the International Conference on Harmonization (ICH). J. Pharm. Biomed. Anal., 2005, 38, 798-805.
[22] Bakshi, M.; Singh, S. Development of validated stability-indicating assay methods—critical review. J. Pharm. Biomed. Anal., 2002, 28, 1011-1040.
[23] Ermer, J.; Ploss, H.J. Validation in pharmaceutical analysis: Part II: central importance of precision to establish acceptance criteria and for verifying and improving the quality of analytical data. J.
Pharm. Biomed. Anal., 2005, 37, 859-870. [24] Furlanetto, S.; Orlandini, S.; Mura, P.; Sergent, M.; Pinzauti, S.
How experimental design can improve the validation process. Studies in pharmaceutical analysis. Anal. Bioanal. Chem., 2003, 377, 937-944.
Method Validation in Drug Analysis Using Electroanalytical Techniques The Open Analytical Chemistry Journal, 2011, Volume 5 17
[25] Bruce, P.; Minkkinen, P.; Riekkola, M.L. Practical method validation: Validation sufficient for an analysis method. Microchim. Acta, 1998, 128, 93-106.
[26] Grdinic, V.; Vukovic, J. Prevalidation in pharmaceutical analysis Part I. Fundamentals and critical discussion. J. Pharm. Biomed.
Anal., 2004, 35, 489-514. [27] Taylor, J.K. Validation of analytical methods. Anal. Chem., 1983,
55, 600A-609A. [28] Gorog, S. The changing face of pharmaceutical analysis. TrAC,
Trends Anal. Chem., 2007, 26, 12-17. [29] Meier, P.C.; Zünd, R.E., Eds; Statistical methods in analytical
chemistry, 2nd Ed.; Vol 153 in chemical analysis: A series of monographs on analytical chemistry and its applications, Winefordner, J.D., Series Ed.; John Wiley & Sons Inc.; New York, 2000.
[30] Jeya Chandra, M., Ed.; Statistical quaility control, CRC Press; Florida, 2001.
[31] Nilsen, C.L., Ed.; Managing the Analytical Laboratory; Plain and simple, Interpharm/ CRC Press; London, 1996.
[32] Kealey, D.; Haines P.J., Eds.; Analytical Chemistry, Bios Scientific Publishers Ltd.; Oxford, 2002.
[33] Stefan, R.I.; Aboul-Enein, H.Y. Validation criteria for developing ion-selective membrane electrodes for analysis of pharmaceuticals. Accredit. Qual. Assur., 1998, 3, 194-196.
[34] Hibbert, B. Method validation of modern analytical techniques. Accredit. Qual. Assur., 1999, 4, 352-356.
[35] Garfield, F.M. Quality Assurance Principles for Analytical
Laboratories, 2nd ed.; AOAC Int. Pub., 1992. [36] Ermer, J. Validation in pharmaceutical analysis. Part I: An
integrated approach. J. Pharm. Biomed. Anal., 2001, 24, 755-767. [37] Hajicostas, E. Validation of Analytical Methods, Springer-Verlag
Pub.; Berlin, 2003. [38] Huber, L., Ed.; Validation and Qualification in Analytical
Laboratories, Interpharm Press; East Englewood CO, USA, 1998. [39] Vessman, J. Selectivity or specificity? Validation of analytical
methods from the perspective of an analytical chemist in the pharmaceutical industry. J. Pharm. Biomed. Anal., 1996, 14, 867-869.
[40] Chanbers, D.; Kelly, G.; Limentani, G.; Lister, A.; Lung, K.R.; Warner, E. Analytical Method Equivalency An Acceptable Analytical Practice. Pharm.Technol., 2005, September, 64-80.
[41] Shabir, G.A.; Lough, W.J.; Arain, S.A.; Bradshow, T.K. Evaluation and Application of Best Practice in Analytical Method Validation.
J. Liq. Cromatogr. Related. Technol., 2007, 30, 311-333. [42] Jenke, D.R. Chromatographic Method Validation: A Review of
Current Practices and Procedures. II. Guidelines for Primary Validation Parameters. J. Liq. Cromatogr. Reated. Technol., 1996, 19, 737-757.
[43] Crowter, J.B.; Ahuja, S.; Scypinski, S., Eds.; Validation of
Pharmaceutical Methods. In Handbook of Modern Pharmaceutical Analysis. Academic Press; San Diego, 2001.
[44] Fabre, H.; Altria, K.D.; Key points for validating CE methods, particularly in pharmaceutical analysis. LC-GC, 2001, 19, 498-505.
[45] Mauricio, M.; Margaret, L.W. Regulatory Issues in Chromatographic Analysis in the Pharmaceutical Industry. J. Liq.
Cromatogr. Rel. Technol., 2005, 27, 1413-1442. [46] Rosing, H.; Man, W.Y.; Doyle, E.; Bult, A.; Beijnen, J.H.
Bioanalytical liquid chromatographic method validation. a review of current practices and procedures. J. Liq. Cromatogr. Rel.
Technol., 2000, 23, 329-354. [47] Baumann, K. Regression and calibration for analytical separation
techniques. Process Control and Quality. Process Control. Qual., 1997, 10, 75-112.
[48] Danzer, K.; Currie, L.A. Guidelines for calibration in analytical chemistry. Part I. Fundamentals and single component calibration. Pure Appl. Chem., 1998, 70, 993-1014.
[49] Asuero, A.G.; Sayago, A.; Gonzalez, A.G. The Correlation Coefficient: An Overview. Crit. Rev. Anal. Chem., 2006, 36, 41-59.
[50] van Loco, J.; Elskens. M.; Croux, C.; Beernaert, H. Linearity of calibration curves: use and misuse of the correlation coefficient. Accredit. Qual. Assur., 2002, 7, 281-285.
[51] Hibbert, D.B. Further comments on the (miss-) use of r for testing the linearity of calibration. Accredit. Qual. Assur., 2005, 10, 300-301.
[52] Huber, W. On the use of the correlation coefficient r for testing the linearity of calibration functions. Accredit. Qual. Assur., 2004, 9, 726.
[53] Ellison, S.L.R. In defence of the correlation coefficient. Accredit. Qual. Assur., 2006, 11,146-152.
[54] Gonzalez, A.G.; Herrador, M.A.; Asuero, A.G.; Sayago, A. The correlation coefficient attacks again. Accredit. Qual. Assur., 2006, 11, 256-258.
[55] Kaus, R. Detection limits and quantitation limits in the view of international harmonization and the consequences for analytical laboratories. Accredit. Qual. Assur., 1998, 3, 150-154.
[56] Armbruster, D.A.; Tillman, M.D.; Hubbs, L.M. Limit of detection (LQD)/limit of quantitation (LOQ): comparison of the empirical and the statistical methods exemplified with GC-MS assays of abused drugs. Clin. Chem., 1994, 40, 1233-1238.
[57] Currie, L.A. Nomenclature in evaluation of analytical methods including detection and quantification capabilities. Pure Appl.
Chem., 1995, 67, 1699-1723. [58] Switaj-Zawadka, A.; Konieczka, P.; Przyk, E;. Namiesnik, J.
Calibration in metrological approach. Anal. Lett., 2005, 38, 353-376.
[59] Hartmann, C.; Massart, D.L.; McDowall, R.D. An analysis of the Washington Conference Report on bioanalytical method validation. J. Pharm. Biomed. Anal., 1994, 12, 1337-1343.
[60] Hartmann, C.; Smeyers-Verbeke, J.; Massart, D.L.; McDowall, R.D. Validation of bioanalytical chromatographic methods. J. Pharm. Biomed. Anal., 1998, 17, 193-218.
[61] de Castro, M.; Bolfarine, H.; Galea-Rojas, M.; de Castilho, M.V. An exact test for analytical bias detection. Anal. Chim. Acta, 2005, 538, 375-381.
[62] Thompson, M.; Ellison, S.L.R.; Fajgely, A.; Willetts, P.; Wood, R. Harmonised guidelines for the use of recovery information in analytical measurement. Pure Appl. Chem., 1999, 71, 337-348.
[63] Rosslein, M.; Rezzonico, S.; Hedinger, R.; Wolf, M. Repeatability: some aspects concerning the evaluation of the measurement uncertainty. Accredit. Qual. Assur., 2007, 12, 425-434.
[64] Peters, F.T.; Maurer, H.M. Bioanalytical method validation and its implications for forensic and clinical toxicology – A review. Accredit. Qual. Assur., 2002, 7, 441-449.
[65] Cuadros-Rodriguez, L.; Romero, R.; Bosque-Sendra, J.M. The role of the robustness/ruggedness and inertia studies in research and development of analytical processes. Crit. Rev. Anal. Chem., 2005, 35, 57-69.
[66] Vander Heyden, Y.; Hartmann, C.; Massart, D.L.; Michel, L.; Kiechle, P.; Erni, F. Ruggedness tests for a high-performance liquid chromatographic assay: Comparison of an evaluation at two and three levels by using two-level Plackett-Burman designs. Anal.
Chim. Acta, 1995, 316, 15-26. [67] Vander Heyden, Y.; Luypaert, K.; Hartmann, C.; Massart, D.L.;
Hoogmartens, J.; De Beer, J. Ruggedness tests on the high-performance liquid chromatography assay of the United States Pharmacopeia XXII for tetracycline hydrochloride. A comparison of experimental designs and statistical interpretations. Anal. Chim.
Acta, 1995, 312, 245-262. [68] Cuadros-Rodriguez, L.; Blanc-Garcia, R.; Garcia-Compana, A.;
Bosque-Sendra, J.M. A new approach to a complete robustness test of experimental nominal conditions of chemical testing procedures for internal analytical quality assessment. Chemometr. Intell. Lab. Syst., 1998, 41, 57-68.
[69] Aybar-Munoz, J.; Garcia-Campana, A.; Cuadros-Rodriguez, L. Evaluating the significance threshold in robustness testing. A critical discussion on the influence of time in molecular fluorescence spectrometry. Talanta, 2002, 56, 123-136.
[70] Bosque-Sendra, J.M.; Nechar, M.; Cuadros-Rodriguez, L. Decision protocol for checking robustness with previous outlier detection in the validation of analytical methods. J. Anal. Chem., 1999, 365, 480-488.
[71] Furlanetto, S.; Pinzauti, S.; Gratteri, P.; La Porta, E.; Calzeroni, G. Experimental design strategies in the optimization and robustness testing of adsorptive stripping voltammetric conditions for kynurenic acid determination. J. Pharm. Biomed. Anal., 1997, 15, 1585- 1594.
[72] Sanz, M.B.; Sarabia, L.A.; Herrero, A.; Ortiz, M.C. A study of robustness with multivariate calibration. Application to the polarographic determination of benzaldehyde. Talanta, 2002, 56, 1039-1048.
18 The Open Analytical Chemistry Journal, 2011, Volume 5 Gumustas and Ozkan
[73] van Leeuwen, J.A.; Vandeginste, B.G.M.; Kateman, G.; Mulholland, M.; Cleland, A. An expert system for the choice of factors for a ruggedness test in liquid chromatography. Anal. Chim.
Acta, 1990, 228, 145-153. [74] Mulholland, M. Ruggedness testing in analytical chemistry. TrAC,
Trends Anal. Chem., 1988, 7, 383-389. [75] Nijhuis, A.; vander Knaap, H.C.M.; de Jong, S.; Vandeginste,
B.G.M. Strategy for ruggedness tests in chromatographic method validation. Anal. Chim. Acta, 1999, 391, 187-202.
[76] Vander Heyden, Y.; Massart, D.L.; Zhu, Y.; Hoogmartens, J.; De Beer, J. Ruggedness tests on the high performance liquid chromatography assay of the United States Pharmacopeia 23 for tetracycline·HCl: comparison of different columns in an interlaboratory approach. J. Pharm. Biomed. Anal., 1999, 14, 1313-1326.
[77] Shah, V.P.; Midha, K.K.; Dighe, S.; Mc Gilveray, I.J.; Skelly, F.P.; Yacobi, A.; Layloff, T.; Viswanathan, C.T.; Cooke, C.E. ; Mc Dowall, R.D.; Pittman, K.A. Analytical methods validation: bioavailability, bioequivalence and pharmacokinetic studies. Pharm. Res., 1992, 9, 588-592.
[78] Grimm, W. Storage Conditions for Stability testing in the Ec, Japan and USA; the most important market for drug products. Drug Dev. Ind. Pharm., 1993, 19, 2795-2830.
[79] Cloud, P.A. Validating a refrigerator-freezer, Bio. Pharm., 1998, November, 47-50.
[80] Toennes, S.W.; Kauert, G.F. Importance of Vacutainer selection in forensic toxicological analysis of drugs of abuse. J. Anal. Toxicol., 2001, 25, 339-343.
[81] Rosing, H.; Man, W.Y.; Doyle, E.; Bult, A.; Beijnen, J.H. Bioanalytical Liquid Chromatographic Method Validation. A Review Of Current Practices And Procedures. J. Liq. Chromatogr.
Rel. Technol., 2000, 23, 329-354. [82] Dadgar, D.; Burnett, P.E.; Choc, M.G.; Gallicano, K.; Hooper, J.W.
Application issues in bioanalytical method validation, sample analysis and data reporting. J. Pharm. Biomed. Anal., 1995, 13, 89-97.
[83] Dadgar, D.; Burnett, P.E. Issues in evaluation of bioanalytical method selectivity and drug stability. J. Pharm. Biomed. Anal., 1995, 14, 23-31.
[84] Walz, R.; Knauf, M. Vorgaben und Durchführung von Stabilitätsprüfungen pharmazeutischer Wirkstoffe und Arzneimittel = Requirements for and Performance of Stability Tests with Active Pharmaceutical Ingredients and Finished Drugs. Pharm. Ind., 2008,
70, 1135-1139. [85] Dantus, M.M.; Wells, M.L. Regulatory issues in chromatographic
analysis in the pharmaceutical industry. J. Liq. Chromatogr. Rel. Technol., 2005, 27, 1413-1442.
[86] Braggio, S.; Barnaby, R.J.; Grossi, P.; Cugola, M. A strategy for validation of bioanalytical methods. J. Pharm. Biomed. Anal., 1996, 14, 375-388.
[87] Timm, U.; Wall, M.; Dell, D. A new approach for dealing with the stability of drugs in biological fluids. J. Pharm. Sci., 1985, 74, 972-977.
[88] Buick, A.R.; Doig, M.V.; Jeal, S.C.; Land, G.S.; Mc Dowall, R.D. Textbook of treatment algorithms. Method Validation in the Bioanalytical Laboratory. J. Pharm. Biomed. Anal., 1990, 8, 629-637.
[89] ICH Topic Q1A (R2), Stability Testing of new drug substances and products. August, 2003.
[90] ICH Harmonised Tripartite Guideline. Q1E, Evaluation for stability Data, February, 2003.
[91] Paulson, D.S., Applied Statistical Designs for the Researcher, Marcel-Dekker Inc.; New York, 2003.
[92] Senturk, Z.; Ozkan, S.A.; Ozkan, Y.; Aboul-Enein, H.Y. Voltammetric investigation of oxidation of zuclopenthixol and application to its determination in dosage forms and in drug dissolution studies. J. Pharm. Biomed. Anal., 2000, 22, 315-323.
[93] Ali, A.M.M.; Farghaly, O.A.; Ghandour, M.A.; Determination of thiopentone sodium in aqueous and biological media by cathodic stripping voltammetry. Anal. Chim. Acta, 2000, 412, 99-110.
[94] Sandulescu R.V.; Mirel S.M.; Oprean R.N.; Lotrean S. Comparative electrochemical study of some phenothiazines with carbon paste, solid carbon paste and glass-like carbon electrodes. Collect. Czech. Chem. Commun., 2000, 65, 1014-1028.
[95] De Oliveira, M.F.; Stradiotto N.R. Voltammetric assay of albendazole in pharmaceutical dosage forms. Anal. Lett., 2001, 34, 377-387.
[96] Ali, A.M.M.; Ghandour, M.A.; Abd-El Fattah, M.M. Cathodic adsorptive stripping voltammetric determination of muscle relaxant: gallamine triethiodide (flaxedil) J. Pharm. Biomed. Anal., 2001, 25, 31-37.
[97] Yılmaz, S.; Uslu, B.; Ozkan, S.A. Anodic oxidation of etodolac and its square wave and differential pulse voltammetric determination in pharmaceuticals and human serum. Talanta, 2001, 54, 351-360.
[98] Yılmaz, S. Determination of olsalazine sodium in pharmaceuticals by differential pulse voltammetry. Pharmazie, 2001, 56, 629-632.
[99] Parham, H.; Zargar, B. Determination of isosorbide dinitrate in arterial plasma, synthetic serum and pharmaceutical formulations by linear sweep voltammetry on a gold electrode. Talanta, 2001, 55, 255-262.
[100] Vela, M.H.; Quinaz Garcia, M.B.; Montenegro, M.C.B.S.M. Electrochemical behaviour of sertraline at a hanging mercury drop electrode and its determination in pharmaceutical products. Anal.
Bioanal. Chem., 2001, 369, 563-566. [101] Pournaghi-Azar, M.H.; Razmi-Nerbin, H.; Hafezi, B.
Amperometric determination of ascorbic acid in real samples using an aluminum electrode, modified with nickel hexacyanoferrate films by simple electroless dipping method. Electroanalysis, 2002, 14, 206-212.
[102] Uslu, B.; Ozkan S.A.; Aboul-Enein H.Y. Electrochemical study of s-adenosyl-l-methionine and its differential pulse and square-wave voltammetric determination. Electroanalysis, 2002, 14, 736-740.
[103] Uslu, B. Voltammetric analysis of alfuzosin HCl in pharmaceuticals, human serum and simulated gastric juice. Electroanalysis, 2002, 14, 866-870.
[104] Nigovic, B.; Simunic B. Determination of 5-aminosalicylic acid in pharmaceutical formulation by differential pulse voltammetry. J.
Pharm. Biomed. Anal., 2003, 31, 169-174. [105] Uslu, B.; Ozkan S.A. Electroanalytical characteristics of piribedil
and its differential pulse and square wave voltammetric determination in pharmaceuticals and human serum. J. Pharm.
Biomed. Anal., 2003, 31, 481-489. [106] Nigovic, B.; Simunic, B. Voltametric assay of azithromycin in
pharmaceutical dosage forms. J. Pharm. Biomed. Anal., 2003, 32, 197-202.
[107] Adhoum, N.; Monser, L.; Toumi, M.; Boujlel, K. Determination of naproxen in pharmaceuticals by differential pulse voltammetry at a platinum electrode. Anal. Chim. Acta, 2003, 495, 69-75.
[108] Teixeira, M.F.S.; Marino, G.; Dockal, E.R.; Cavalheiro, E.T.G. Voltammetric determination of pyridoxine (Vitamin B6) at a carbon paste electrode modified with vanadyl(IV)–Salen complex. Anal. Chim. Acta, 2004, 508, 79-85.
[109] Norouzi, P.; Ganjali, M.R.; Akbari-Adergani, B. Sub-second FFT continuous stripping cyclic voltammetric technique as a novel method for pico-level monitoring of imipramine at au microelectrode in flowing solutions. Acta Chim. Slov., 2006, 53, 499-505.
[110] Radi, A.; Abd El-Ghany, N.; Wahdan, T. Voltammetric behaviour of rabeprazole at a glassy carbon electrode and its determination in tablet dosage form. Farmaco, 2004, 59, 515-518.
[111] Radi, A.; Wassel, A.A.; El Ries, M.A. Adsorptive behaviour and voltammetric analysis of propranolol at carbon paste electrode. Chemia Anal. (Warsaw), 2004, 49, 51-58.
[112] Hammam, E.; El-Desoky, H.S.; El-Baradie, K.Y.; Beltagi, A.M. Three validated stripping voltammetric procedures for determination of the anti-prostate cancer drug flutamide in tablets and human serum at a mercury electrode. Can. J. Chem., 2004, 82, 1386-1392.
[113] Radi, A.E.; Bekhiet, G.; Wahdan, T. Electrochemical study of zolpidem at glassy carbon electrode and its determination in a tablet dosage form by differential pulse voltammetry. Chem.
Pharm. Bull., 2004, 52, 1063-1065. [114] Al-Ghamdi, A.H.; Al-Shadokhy, M.A.; Al-Warthan, A.A.
Electrochemical determination of Cephalothin antibiotic by adsorptive stripping voltammetric technique J. Pharm. Biomed.
Anal., 2004, 35, 1001-1009. [115] Radi, A.; El-Sherif, Z.; Wassel, A. Voltammetric determination of
labetalol in pharmaceuticals and spiked human urine. Chem. Pap., 2004, 58, 242-246.
Method Validation in Drug Analysis Using Electroanalytical Techniques The Open Analytical Chemistry Journal, 2011, Volume 5 19
[116] Radi, A.; El-Shahawi, M.S.; Elmogy, T. Differential pulse voltammetric determination of the dopaminergic agonist bromocriptine at glassy carbon electrode J. Pharm. Biomed. Anal., 2005, 37, 195-198.
[117] Zayed, S.I.M.; Habib, I.H.I. Adsorptive stripping voltammetric determination of triprolidine hydrochloride in pharmaceutical tablets. Farmaco, 2005, 60, 621-625.
[118] Sun, N.; Mo, W.M.; Shen, Z.L.; Hu B.X. Adsorptive stripping voltammetric technique for the rapid determination of tobramycin on the hanging mercury electrode. J. Pharm. Biomed. Anal., 2005, 38, 256-262.
[119] Carapuca, H.M.; Cabral, D.J.; Rocha, L.S. Adsorptive stripping voltammetry of trimethoprim: Mechanistic studies and application to the fast determination in pharmaceutical suspensions J. Pharm. Biomed. Anal., 2005, 38, 364-369.
[120] Suslu, I.; Altinoz, S. Electrochemical characteristics of zafirlukast and its determination in pharmaceutical formulations by voltammetric methods J. Pharm. Biomed. Anal., 2005, 39, 535-542.
[121] Golcu, A.; Dogan, B.; Ozkan, S.A. Anodic voltammetric behavior and determination of cefixime in pharmaceutical dosage forms and biological fluids Talanta, 2005, 67, 703-712.
[122] Dogan B.; Ozkan, S.A. Electrochemical behavior of carvedilol and its adsorptive stripping determination in dosage forms and biological fluids. Electroanalysis, 2005, 17, 2074-2083.
[123] Ozkan, S.A.; Uslu, B.; Dogan, B. Voltammetric analysis of the novel atypical antipsychotic drug quetiapine in human serum and urine. Microchim. Acta, 2006, 153, 27-35.
[124] Toito Suarez, W.; Marcolino Jr, L.H.; Fatibello-Filho, O. Voltammetric determination of N-acetylcysteine using a carbon paste electrode modified with copper(II) hexacyanoferrate(III). Microchem. J., 2006, 82, 163-167.
[125] Bergamini, M.F.; Teixeira, M.F.S.; Dockal, E.R.; Bocchi, N.; Cavalheiro, T.G.E. Evaluation of different voltammetric techniques in the determination of amoxicillin using a carbon paste electrode modified with [N,N'-ethylenebis(salicylideneaminato)] oxovanadium(IV). J. Electrochem. Soc., 2006, 153, E94-E98.
[126] Jacques Barbosa, A.M.; Goncalves Trindade, M.A.; Ferreira, V.S. Cathodic stripping voltammetry determination of ceftiofur antibiotic in formulations and bovine serum. Anal. Lett., 2006, 39, 1143-1158.
[127] Golcu, A.; Ozkan, S.A. Electroanalytical determination of donepezil HCl in tablets and human serum by differential pulse and osteryoung square wave voltammetry at a glassy carbon electrode Pharmazie, 2006, 61, 760-765.
[128] Erdurak-Kilic, C.S.; Uslu, B.; Dogan, B.; Ozgen, U.; Ozkan S.A.; Coskun, M. Anodic voltammetric behavior of ascorbic acid and its selective determination in pharmaceutical dosage forms and some Rosa species of Turkey. J. Anal. Chem., 2006, 61, 1113-1120.
[129] Farhadi, K.; Karimpour, A. Electrochemical determination of meloxicam in pharmaceutical preparation and biological fluids using oxidized glassy carbon electrodes. Chem. Pharm. Bull., 2007, 55, 638-642.
[130] Li, C. Voltammetric determination of ethinylestradiol at a carbon paste electrode in the presence of cetyl pyridine bromine. Bioelectrochem., 2007, 70, 263-268.
[131] Shahrokhian, S.; Fotouhi, L. Carbon paste electrode incorporating multi-walled carbon nanotube/cobalt salophen for sensitive voltammetric determination of tryptophan. Sens. Actuators, B., 2007, 123, 942-949.
[132] Ghoneim, M.M.; El-Attar, M.A.; Razeq, S.A. Voltammetric quantitation at the mercury electrode of the anticholinergic drug flavoxate hydrochloride in bulk and in a pharmaceutical formulation. Cent. Eur. J. Chem., 2007, 5, 496-507.
[133] Norouzi, P.; Ganjali, M.R.; Zare, M.; Mohammadi, A. Nano-level detection of naltrexone hydrochloride in its pharmaceutical preparation at Au microelectrode in flowing solutions by fast fourier transforms continuous cyclic voltammetry as a novel detector. J. Pharm. Sci., 2007, 96, 2009-2017.
[134] Al-Ghamdi, A.H.; Al-Ghamdi, A.F.; Al-Omar, M. Electrochemical studies and square-wave adsorptive stripping voltammetry of spironolactone drug. Anal. Lett., 2008, 41, 90-103.
[135] Turhan, E.; Uslu, B. electroanalytical determination of opipramol in pharmaceutical preparations and biological fluids. Anal. Lett. 2008, 41, 2013-2032.
[136] El-Sayed, G.O.; Yasin, S.A.; El-Badawy, A.A. Voltammetric behavior and determination of cinnarizine in pharmaceutical formulations and serum. Anal. Lett., 2008, 41, 3021-3033.
[137] Uslu, B.; Topal, B. D.; Ozkan, S.A. Electroanalytical investigation and determination of pefloxacin in pharmaceuticals and serum at boron-doped diamond and glassy carbon electrodes. Talanta, 2008, 74, 1191-1200.
[138] Ghoneim, M.M.; El-Desoky, H.S.; El-Ries, M.A.; Abd-Elaziz, A.M. Electrochemical determination of muscle relaxant drug tetrazepam in bulk form, pharmaceutical formulation, and human serum. Chem. Pap., 2008, 62, 127-134.
[139] Shahrokhian, S.; Ghalkhania, M. Voltammetric determination of methimazole using a carbon paste electrode modified with a schiff base complex of cobalt. Electroanalysis, 2008, 20, 1061-1066.
[140] Altun, Y.; Uslu, B.; Topal, B. D.; Ozkan, S.A. Anodic behavior of sertindole and its voltammetric determination in pharmaceuticals and human serum using glassy carbon and boron-doped diamond electrodes Electrochim. Acta, 2009, 54, 1893-1903.
[141] Hernandez-Olmos, M.A.; Agui, L.; Yanez-Sedeno, P.; Pingarron, J.M. Analytical voltammetry in low-permitivity organic solvents using disk and cylindrical microelectrodes. Determination of thiram in ethyl acetate. Electrochim. Acta, 2000, 46, 289-296.
[142] Aparicio, I.; Callejon, M.; Jimenez, J.C.; Bello, M.A.; Guiraum A. Electrochemical oxidation at carbon paste electrode of tacrine and 1-hydroxytacrine and differential pulse voltammetric determination of tacrine in pharmaceuticals and human urine. Analyst, 2000, 125, 2016-2019.
[143] Angeles Garcia, M.F.; Teresa Fernandez, A.M.; Costa Garcia A. Determination of buprenorphine in pharmaceuticals and human urine by adsorptive stripping voltammetry in batch and flow systems. Electroanalysis, 2000, 12, 483-489.
[144] Shamsipur, M.; Farhadi, K. Electrochemical behavior and determination of ketoconazole from pharmaceutical preparations. Electroanalysis, 2000, 12, 429-433.
[145] Yardimci, C.; Ozaltin N. Electrochemical studies and differential pulse polarographic analysis of lansoprazole in pharmaceuticals. Analyst, 2001, 126, 361-366.
[146] Uslu, B; Demircigil, B.T.; Ozkan, S.A.; Sentürk, Z.; Aboul-Enein, HY. Simultaneous determination of melatonin and pyridoxine in tablet formulations by differential pulse voltammetry. Pharmazie. 2001, 56, 938-942.
[147] Kasim, E.A. Voltammetric behavior of the anti-inflammatory alkaloid colchicine at a glassy carbon electrode and a hanging mercury electrode and its determination at ppb levels Anal. Lett., 2002, 35, 1987-2004.
[148] Ibrahim, M.S.; Shehatta, I.S.; Sultan, M.R. Cathodic adsorptive stripping voltammetric determination of nalidixic acid in pharmaceuticals, human urine and serum Talanta, 2002, 56, 471-479.
[149] Song, J.F.; He, P.; Guo, W. Study on the polarographic catalytic wave of vitamin p in the presence of persulfate and its application. Anal. Biochem., 2002, 304, 212-219.
[150] Ozkan, S.A.; Uslu, B. Electrochemical study of fluvastatin sodium - analytical application to pharmaceutical dosage forms, human serum, and simulated gastric juice. Anal. Bioanal. Chem., 2002, 372, 582-586.
[151] Wangfuengkanagul, N.; Chailapakul, O. Electrochemical analysis of acetaminophen using a boron-doped diamond thin film electrode applied to flow injection system. J. Pharm. Biomed. Anal., 2002, 28, 841-847.
[152] Hammam, E. Determination of nitrofurantoin drug in pharmaceutical formulation and biological fluids by square-wave cathodic adsorptive stripping voltammetry. J. Pharm. Biomed.
Anal., 2002, 30, 651-659. [153] Fernandez Torres, R.; Callejon Mochon, M.; Jimenez Sanchez,
J.C.; Bello Lopez, M.A.; Guiraum Perez A. Electrochemical behaviour and determination of acrivastine in pharmaceuticals and human urine J. Pharm. Biomed. Anal., 2002, 30, 1215-1222.
[154] Ghoneim, M.M.; Mabrouk, M.M.; Tawfik A. Direct determination of praziquantel in pharmaceutical formulations and human plasma by cathodic adsorptive stripping differential-pulse voltammetry. J.
Pharm. Biomed. Anal., 2002, 30, 1311-1318. [155] Demircigil, B.T.; Uslu, B.; Ozkan, Y.; Ozkan, S.A.; Senturk Z.
Voltammetric oxidation of ambroxol and application to its determination in pharmaceuticals and in drug dissolution studies. Electroanalysis, 2003, 15, 230-234.
20 The Open Analytical Chemistry Journal, 2011, Volume 5 Gumustas and Ozkan
[156] Corujo-Antuna, J.L.; Abad-Villar, E.M.; Fernadez-Abedul, M.T.; Costa-Garcia, A. Voltammetric and flow amperometric methods for the determination of melatonin in pharmaceuticals. J. Pharm.
Biomed. Anal., 2003, 31, 421-429. [157] Arguelho, M.L.P.M.; Andrade, J.F.; Stradiotto, N.R.
Electrochemical study of hydroxychloroquine and its determination in plaquenil by differential pulse voltammetry. J. Pharm. Biomed.
Anal., 2003, 32, 269-275. [158] Reddy, T.M.; Sreedhar, M.; Reddy, S.J. Electrochemical
determination of sparfloxacin in pharmaceutical formulations and urine samples using a -cyclodextrin modified carbon paste electrode. Anal. Lett., 2003, 36, 1365-1379.
[159] Teixeira, M.F.S.; Segnini, A.; Moraes, F.C.; Marcolino-Junior, L.H.; Fatibello-Filho, O.; Cavalheiro, E.T.G. Determination of vitamin B6 (pyridoxine) in pharmaceutical preparations by cyclic voltammetry at a copper(II) hexacyanoferrate(III) modified carbon paste electrode. J. Braz. Chem. Soc., 2003, 14, 316-321.
[160] Raoof, J.B.; Ojani, R.; Hosseinzadeh, R.; Ghasemi, V. Electrocatalytic characteristics of a 1-[4-(ferrocenyl ethynyl)phenyl]-1-ethanone modified carbon-paste electrode in the oxidation of ascorbic acid. Anal. Sci., 2003, 19, 1251-1258.
[161] Siangproh, W.; Wangfuengkanagul, W.N.; Chailapakul, O. Electrochemical oxidation of tiopronin at diamond film electrodes and its determination by amperometric flow injection analysis. Anal. Chim. Acta, 2003, 499, 183-189.
[162] Yardımcı, C.; Ozaltın N. Electrochemical studies and square-wave voltammetric determination of fenofibrate in pharmaceutical formulations. Anal. Bioanal. Chem., 2004, 378, 495-498.
[163] El-Hefnawey, G.B.; El-Hallog, I.S.; Ghoneim, E.M.; Ghoneim, M.M. Voltammetric behavior and quantification of the sedative-hypnotic drug chlordiazepoxide in bulk form, pharmaceutical formulation and human serum at a mercury electrode. J. Pharm. Biomed. Anal., 2004, 34, 75-86.
[164] Ozkan, S.A.; Uslu, B.; Senturk, Z. Electroanalytical characteristics of amisulpride and voltammetric determination of the drug in pharmaceuticals and biological media. Electroanalysis, 2004, 16, 231-237.
[165] Torriero, A.A.J.; Luco, J.M.; Sereno; L. Raba, J. Voltammetric determination of salicylic acid in pharmaceuticals formulations of acetylsalicylic acid. Talanta, 2004, 62, 247-254.
[166] Farghaly, O.A.E.M.; Mohamed, N.A.L. Voltammetric determination of azithromycin at the carbon paste electrode. Talanta, 2004, 62, 531-538.
[167] Hammam, E. Behavior and quantification studies of amiloride drug using cyclic and square-wave adsorptive stripping voltammetry at a mercury electrode. J. Pharm. Biomed. Anal., 2004, 34, 1109-1116,
[168] Hammam, E.; Beltagi, A.M.; Ghoneim, M.M. Voltammetric assay of rifampicin and isoniazid drugs, separately and combined in bulk, pharmaceutical formulations and human serum at a carbon paste electrode. Microchem. J., 2004, 77, 53-62.
[169] Ghoneim, M.M.; Tawfik, A. Assay of anti-coagulant drug warfarin sodium in pharmaceutical formulation and human biological fluids by square-wave adsorptive cathodic stripping voltammetry. Anal.
Chim. Acta, 2004, 511, 63-69. [170] Bonifacio, V.G.; Marcolino, L.H. Jr; Teixeira, M.F.S.; Fatibello-
Filho, O. Voltammetric determination of isoprenaline in pharmaceutical preparations using a copper(II) hexacyanoferrate(III) modified carbon paste electrode. Microchem. J., 2004, 78, 55-59.
[171] Uslu, B.; Ozkan, S.A. Anodic voltammetry of abacavir and its determination in pharmaceuticals and biological fluids. Electrochim. Acta, 2004, 49, 4321-4329.
[172] Teixeira, M.F.S.; Marcolino-Junior, L.H.; Fatibello-Filho, O.; Dockal, E.R.; Cavalheiro E.T.G. Voltammetric determination of dipyrone using a N,N'-ethylenebis(salicylideneaminato)oxova-nadium(IV) modified carbon-paste electrode. J. Braz. Chem. Soc., 2004, 15, 803-808.
[173] Ghoneim, M.M.; Baumann, W.; Hammam, E.; Tawfik, A. Voltammetric behavior and assay of the contraceptive drug levonorgestrel in bulk, tablets, and human serum at a mercury electrode. Talanta, 2004, 64, 857-864.
[174] Xu, M.; Song, J.; Polarographic determination of lovastatin in the presence of H2O2 in pharmaceuticals, human urine and serum. Microchim. Acta, 2004, 148, 183-189.
[175] Gao, W.; Song, J.; Wu, N. Voltammetric behavior and square-wave voltammetric determination of trepibutone at a pencil graphite electrode. J. Electroanal. Chem., 2005, 576, 1-7.
[176] Uslu, B.; Topal, B. D.; Ozkan, S.A. Electrochemical studies of ganciclovir at glassy carbon electrodes and its direct determination in serum and pharmaceutics by square wave and differential pulse voltammetry. Anal. Chim. Acta, 2005, 537, 307-313.
[177] Suryanarayanan, V.; Zhang, Y.; Yoshihara, S.; Shirakashi, T. Voltammetric assay of naproxen in pharmaceutical formulations using boron-doped diamond electrode. Electroanalysis, 2005, 17, 925-932.
[178] Tapsoba, I.; Belgaied, J.E.; Boujlel, K. Voltammetric assay of Guaifenesin in pharmaceutical formulation, J. Pharm. Biomed.
Anal., 2005, 38, 162-165. [179] Ganjali, M.R.; Norouzi, P.; Ghorbani, M.; Sepehri, A. Fourier
transform cyclic voltammetric technique for monitoring ultratrace amounts of salbutamol at gold ultra microelectrode in flowing solutions. Talanta, 2005, 66, 1225-1233.
[180] El-Desoky, H.S.; Ghoneim, M.M. Assay of the anti-psychotic drug haloperidol in bulk form, pharmaceutical formulation and biological fluids using square-wave adsorptive stripping voltammetry at a mercury electrode. J. Pharm. Biomed. Anal., 2005, 38, 543-550.
[181] Shahrokhian, S.; Karimi, M.; Khajehsharifi, H. Carbon-paste electrode modified with cobalt-5-nitrolsalophen as a sensitive voltammetric sensor for detection of captopril. Sens. Actuators, B., 2005, 109, 278-284.
[182] Dogan, B.; Uslu, B.; Suzen, S.; Ozkan, S.A.; Electrochemical evaluation of nucleoside analogue lamivudine in pharmaceutical dosage forms and human serum. Electroanalysis, 2005, 17, 1886-1894.
[183] Nigovic, B. Electrochemical properties and square-wave voltammetric determination of pravastatin. Anal. Bioanal. Chem., 2006, 384, 431-437.
[184] Uslu, B.; Ozkan, S.A.; Z. Senturk, Electrooxidation of the antiviral drug valacyclovir and its square-wave and differential pulse voltammetric determination in pharmaceuticals and human biological fluids. Anal. Chim. Acta, 2006, 555, 341-347.
[185] Raoof, J.B.; Ojani, R.; Beitollahi, H.; Hossienzadeh, R. electrocatalytic determination of ascorbic acid at the surface of 2,7-bis(ferrocenyl ethyl)fluoren-9-one modified carbon paste electrode. Electroanalysis, 2006, 18, 1193-1201.
[186] Alghamdi, A.H.; Belal, F.F.; Al-Omar, M.A. Square-wave adsorptive stripping voltammetric determination of danazol in capsules. J. Pharm. Biomed. Anal., 2006, 41, 989-993.
[187] Jain, R.; Jadon, N.; Radhapyari, K. Determination of antihelminthic drug pyrantel pamoate in bulk and pharmaceutical formulations using electro-analytical methods. Talanta, 2006, 70, 383-386.
[188] Turkoz, E.; Onar, N. Determination of ticlopidine in pharmaceutical products. Anal. Lett., 2007, 40, 2231-2240.
[189] Ghoneim, E.M.; El-Attar, M.A.; Hamam, E.; Khashaba, P.Y. Stripping voltammetric quantification of the anti-diabetic drug glipizide in bulk form and pharmaceutical formulation. J. Pharm.
Biomed. Anal., 2007, 43, 1465-1469. [190] Demircan. S.; Kir, S.; Ozkan, S.A. Electroanalytical
characterization of verapamil and its voltammetric determination in pharmaceuticals and human serum. Anal. Lett., 2007, 40, 1177-1195.
[191] Norouzi, P.; Ganjali, M.R.; Daneshgar, P. A novel method for fast determination of Ranitidine in its pharmaceutical formulations by fast continuous cyclic voltammetry. J. Pharmacol. Toxicol.
Methods, 2007, 55, 289-296. [192] Oliveira, R.T.S.; Salazar-Banda, G.R.; Ferreira, V.S.; Oliveira,
S.C.; Avaca, L.A. Electroanalytical determination of lidocaine in pharmaceutical preparations using boron-doped diamond electrodes. Electroanalysis, 2007, 19, 1189-1194.
[193] Altun, Y.; Dogan, B.; Ozkan, S.A.; Uslu, B. Development and validation of voltammetric techniques for nabumetone in pharmaceutical dosage form, human serum and urine. Acta Chim.
Slov., 2007, 54, 287-294. [194] Dogan, B.; Tuncel, S.; Uslu, B.; Özkan, S.A. Selective
electrochemical behavior of highly conductive boron-doped diamond electrodes for fluvastatin sodium oxidation. Diamond
Relat. Mater., 2007, 16, 1695-1704.
Method Validation in Drug Analysis Using Electroanalytical Techniques The Open Analytical Chemistry Journal, 2011, Volume 5 21
[195] Ozkan, S. A.; Dogan, B.; Uslu, B. Voltammetric analysis of the novel atypical antipsychotic drug quetiapine in human serum and urine. Microchim. Acta, 2006, 153, 27-35.
[196] Uslu, B.; Dogan, B.; Özkan, S.A.; Aboul-Enein, H.Y. Electrochemical behavior of vardenafil on glassy carbon electrode: Determination in tablets and human serum. Anal. Chim. Acta, 2005, 552,127-134.
[197] Golcu, A.; Dogan, B.; Ozkan, S.A. Anodic voltammetric behavior and determination of cefixime in pharmaceutical dosage forms and biological fluids. Talanta, 2005, 67, 703-712.
[198] Ozkan, S.; Uslu, B.; Sentürk, Z. Electroanalytical characteristics of amisulpride and voltammetric determination of the drug in pharmaceuticals and biological media. Electroanalysis, 2004, 16, 231-237.
[199] Demircigil, B.; Uslu, B.; Özkan, Y.; Özkan, S.; Sentürk, Z. Voltammetric oxidation of ambroxol and application to its determination in pharmaceuticals and in drug dissolution studies. Electroanalysis, 2003, 15, 230-234.
[200] Ozkan, S. A.; Uslu, B. Electrochemical study of fluvastatin sodium - Analytical application to pharmaceutical dosage forms, human serum, and simulated gastric juice. Anal. Bioanal. Chem., 2002, 372, 582-586.
[201] Uslu, B.; Dogan, B.; Özkan, S.A. Electrochemical studies of ganciclovir at glassy carbon electrodes and its direct determination in serum and pharmaceutics by square wave and differential pulse voltammetry. Anal. Chim. Acta, 2005, 537, 307-313.
[202] Uslu, B.; Özkan, S.A. Anodic voltammetry of abacavir and its determination in pharmaceuticals and biological fluids. Electrochim. Acta, 2004, 49, 4321-4329.
[203] Uslu, B.; Özkan, S. A. Electroanalytical characteristics of piribedil and its differential pulse and square wave voltammetric determination in pharmaceuticals and human serum. J. Pharm. Biomed. Anal., 2003, 31, 481-489.
[204] Dogan, B.; Uslu, B.; Suzen, S.; Ozkan, S. Electrochemical Evaluation of Nucleoside Analogue Lamivudine in Pharmaceutical Dosage Forms and Human Serum. Electroanalysis, 2005, 17, 1886-1894.
[205] Dogan-Topal, B.; Bozal, B.; Demircigil, B.; Uslu, B.; Ozkan, S. Electroanalytical Studies and Simultaneous Determination of Amlo-dipine Besylate and Atorvastatine Calcium in Binary Mixtures Using First Derivative of the Ratio-Voltammetric Methods. Electroanalysis, 2009, 21, 2427-2439.
[206] Al-Ghamdi, A. F. A study of adsorptive stripping voltammetric behavior of ofloxacine antibiotic in the presence of Fe(III) and its determination in tablets and biological fluids. J. Saudi Chem. Soc., 2009, 13, 235-241.
[207] Ghalkhani, M.; Shahrokhian, S.; Ghorbani-Bidkorbeh, F. Voltammetric studies of sumatriptan on the surface of pyrolytic graphite electrode modified with multi-walled carbon nanotubes decorated with silver nanoparticles. Talanta, 2009, 80, 31-38.
[208] Hegde, R. N.; Hosamani, R. R.; Nandibewoor, S. T. Voltammetric oxidation and determination of cinnarizine at glassy carbon
electrode modified with multi-walled carbon nanotubes. Colloids
Surf. B, 2009, 72, 259-265. [209] Hegde, R. N.; Kumara Swamy, B. E.; Shetti, N. P.; Nandibewoor,
S. T. Electro-oxidation and determination of gabapentin at gold electrode. J. Electroanal. Chem., 2009, 635, 51-57.
[210] Hegde, R. N.; Shetti, N. P.; Nandibewoor, S. T. Electro-oxidation and determination of trazodone at multi-walled carbon nanotube-modified glassy carbon electrode. Talanta, 2009, 79, 361-368.
[211] Mashhadizadeh, M. H.; Akbarian, M. Voltammetric determination of some anti-malarial drugs using a carbon paste electrode modified with Cu(OH)2 nano-wire. Talanta, 2009, 78, 1440-1445.
[212] Yilmaz, S. Adsorptive stripping voltammetric determination of zopiclone in tablet dosage forms and human urine. Colloids Surf. B, 2009, 71, 79-83.
[213] Arvand, M.; Vaziri, M.; Vejdani, M. Electrochemical study of atenolol at a carbon paste electrode modified with mordenite type zeolite. Mater. Sci. Eng. C, 2010, 30, 709-714.
[214] Attia, A.K. Determination of antihypertensive drug moexipril hydrochloride based on the enhancement effect of sodium dodecyl sulfate at carbon paste electrode. Talanta, 2010, 81, 25-29.
[215] El-Sayed, G. O.; Yasin, S. A.; El Badawy, A. A. Determination of secnidazole in tablets and human serum by cathodic adsorptive stripping voltammetry. Arabian J. Chem., 2010, 3, 167-172.
[216] Fotouhi, L.; Alahyari, M. Electrochemical behavior and analytical application of ciprofloxacin using a multi-walled nanotube composite film-glassy carbon electrode. Colloids Surf. B, 2010, 81, 110-114.
[217] Goyal, R. N.; Bishnoi, S. Voltammetric determination of amlodipine besylate in human urine and pharmaceuticals. Bioelectrochemistry, 2010, 79, 234-240.
[218] Jain, R.; Gupta, V. K.; Jadon, N.; Radhapyari, K. Adsorptive stripping voltammetric determination of pyridostigmine bromide in bulk, pharmaceutical formulations and biological fluid. J.
Electroanal. Chem., 2010, 648, 20-27. [219] Kul, D.; Gumustas, M.; Uslu, B.; Ozkan, S. A. Electroanalytical
characteristics of antipsychotic drug ziprasidone and its determination in pharmaceuticals and serum samples on solid electrodes. Talanta, 2010, 82, 286-295.
[220] Santos, K. D.; Braga, O. C.; Vieira, I. C.; Spinelli, A. Electroanalytical determination of estriol hormone using a boron-doped diamond electrode. Talanta, 2010, 80, 1999-2006.
[221] Shahrokhian, S.; Ghalkhani, M. Glassy carbon electrodes modified with a film of nanodiamond-graphite/chitosan: Application to the highly sensitive electrochemical determination of Azathioprine. Electrochim. Acta, 2010, 55, 3621-3627.
[222] Velasco-Aguirre, C.; Álvarez-Lueje, A. Voltammetric behavior of naratriptan and its determination in tablets. Talanta, 2010, 82, 796-802.
[223] Gumustas, M.; Ozkan, S. Electrochemical evaluation and determination of antiretroviral drug fosamprenavir using boron-doped diamond and glassy carbon electrodes. Anal. Bioanal.
Chem., 2010, 397, 189-203.
Received: October 9, 2010 Revised: November 22, 2010 Accepted: December 7, 2010 © Gumustas and Ozkan.; Licensee Bentham Open.
This is an open access article licensed under the terms of the Creative Commons Attribution Non-Commercial License (http://creativecommons.org/licenses/by-nc/ 3.0/) which permits unrestricted, non-commercial use, distribution and reproduction in any medium, provided the work is properly cited.