Embed Size (px)
Citation preview
LIBRARY C.P. No. 844
MINISTRY OF AVIATION
AERONAUTlCAl RESEARCH COUNCIL
CURRENT PAPERS
The Role of Compressive Strain in the
Load and Strain Fatigue Behaviour of
H.46 at Room Temperature
G. P. Ti/!y, &SC., Ph.D., ACG.I, D.I.C.
LONDON: HER MAJESTY’S STATIONERY Of FICE
1966
Price 7s. 6d. net

U0D.C. l!Te. 53g.431:66g.~5.26+4 C.P. No. t&J+
June 1965
The role of compressive stress in the load and strain fatigue behaviour of H.46
at room temperature
- by -
G. P. 'pilly
Constant load amplitude and constant strain amplitude fatigue
tests have been conducted on an 11 per cent Cr steel (3.46) at frequencies
of 7 c/hr and IO c/min at room temperature. The rupture data of the two
tests correlated closely for both frequencies in terms of maximum applied
stress at 50 per cent life, but the constant strain amplitude data
exhibited enhanced endurances in terms of strain range at this life. In
general, constant load amplitude fatigue appeared to be more damaging than
constant strain at this temperature.
The constant load amplitude fatigue tests accumulated tensile strain
in a time dependent manner which was amenable to analysis by a technique
originally developed for elevated temperature creep data. The rate of
strain accumulation of repeated tension load fatigue and static tensile
stress tests was slower than for fully reversed push-pull. Strain con-
tinued to accumulate in a tensile sense during push-@1 tests at 7 c/hr
despite excess compressive stresses which were as much as 8 per cent
greater than the complementary tensile stresses, whilst cycles with
16.5 per cent excess compressive stress produced compressive strain
accumulation. Repootod tcnsion fatigue work-hardoned the material and
it became successively more resistant to deformation, whereas push-g11
fatigue work-softened it and it became successively less resistant to
deformation.
- - - - - - - - 1 - - - - - - - - _ _ - - - - - - - - - - - - - - - - - - -
Replaces N.G.T.E. Report No. a.269 - A.R,C.27 I&.
--
-2-
CONENTS Pago
1.0 Introduction 4
2.0 Zxporimental technique
2.1 Material 5 2.2 Programme 6
3.0 iksults
;:: Constant load amplitude fatigue tests Constant strain amplitude fatigue tests Xffects of compressive mean strossos at 7 c/hr Static constant tensile stress tests
4.0 Discussion
4.1 The accumulation of strain 4.2 The correlation of load and strain rtsngcs with the
rupture data
5.0 Conclusions
55:: :-;z 5:5 5.6 5*7 5.8
List of Symbols
Ac!aowledgements
References
5
6
6 7 ’
8
a
8
8
11
I3
13 13 13 13 13 13 13 13
14
14
45
Detachable abstrsct cards
TATXJEi
Title
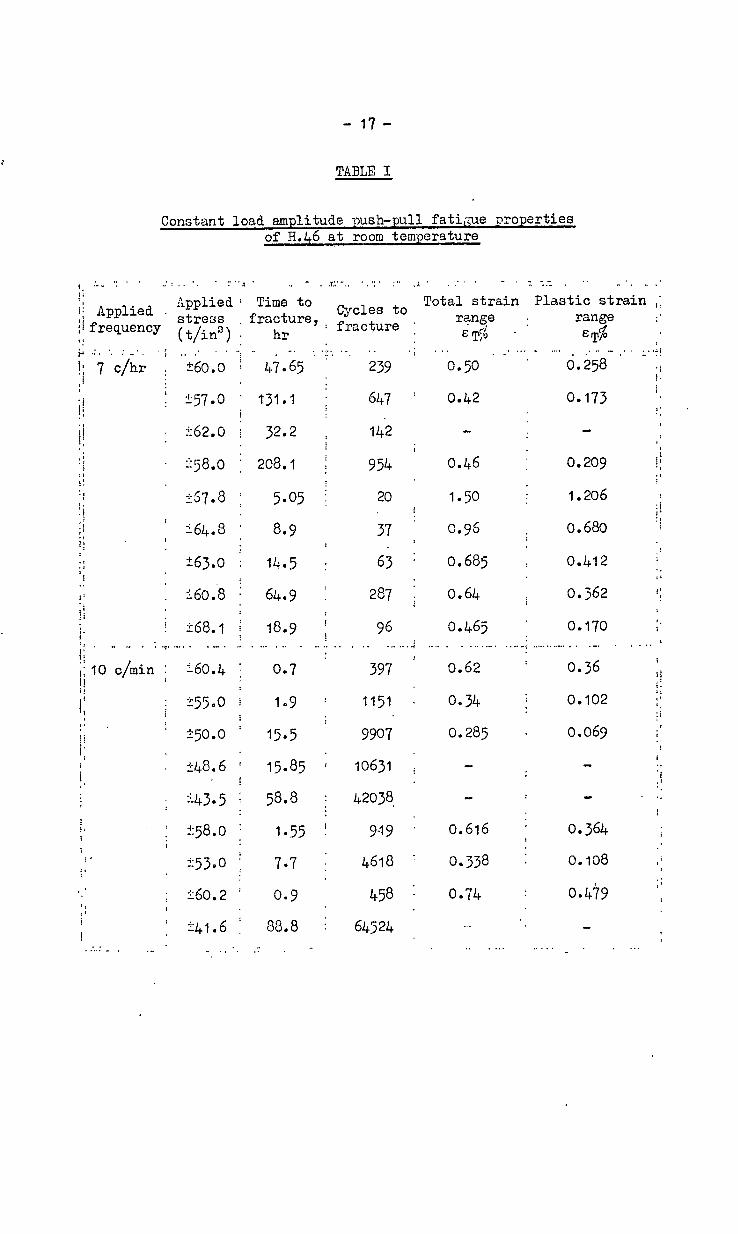
Constant load amplitude push-pull fatigue properties of ~.46 at room temperature 17
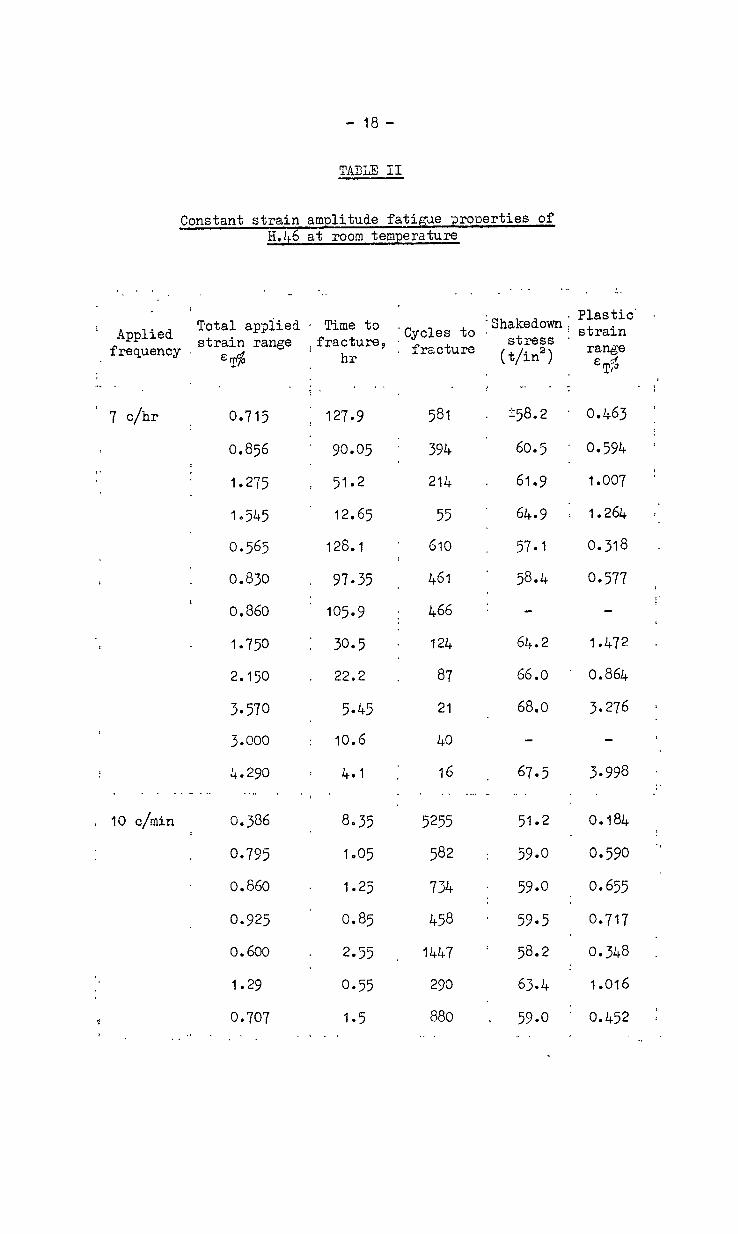
II Constant strain amplitude fatigue properties of ~.46 at room temperature 18
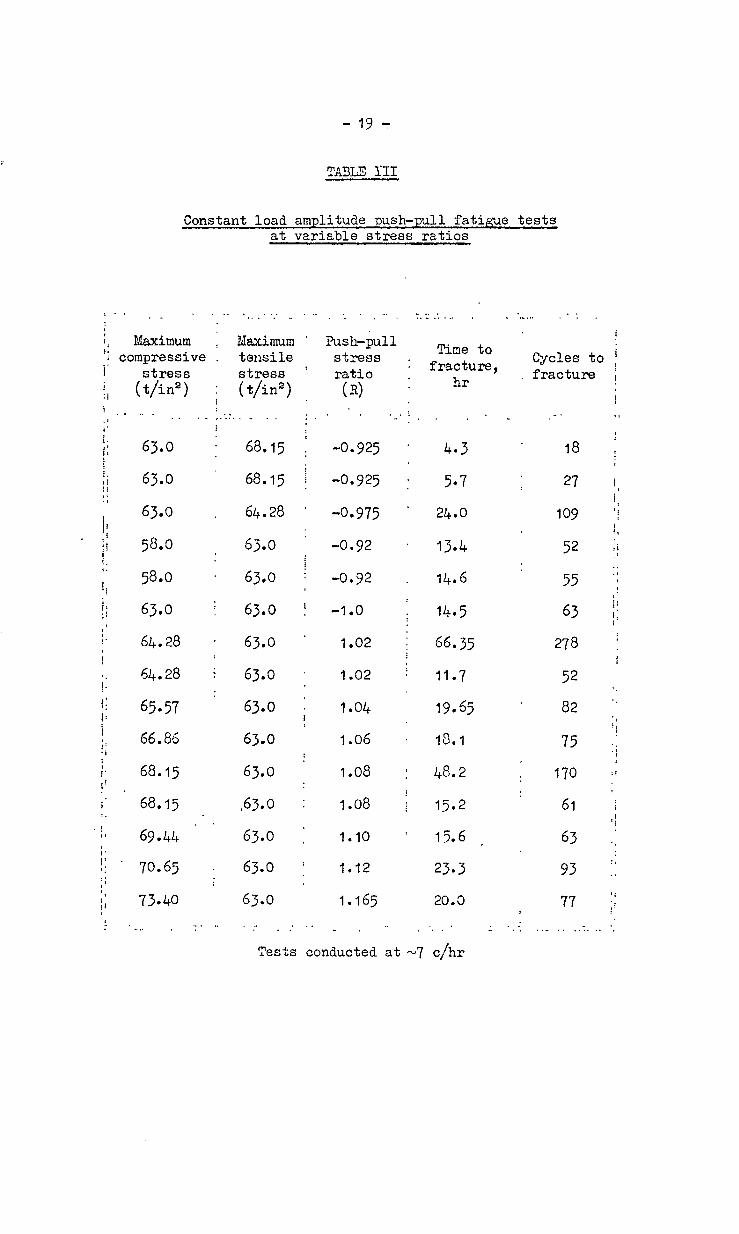
III Constant load amplitudo push-pull fatigue tests at variable stress ratios 19
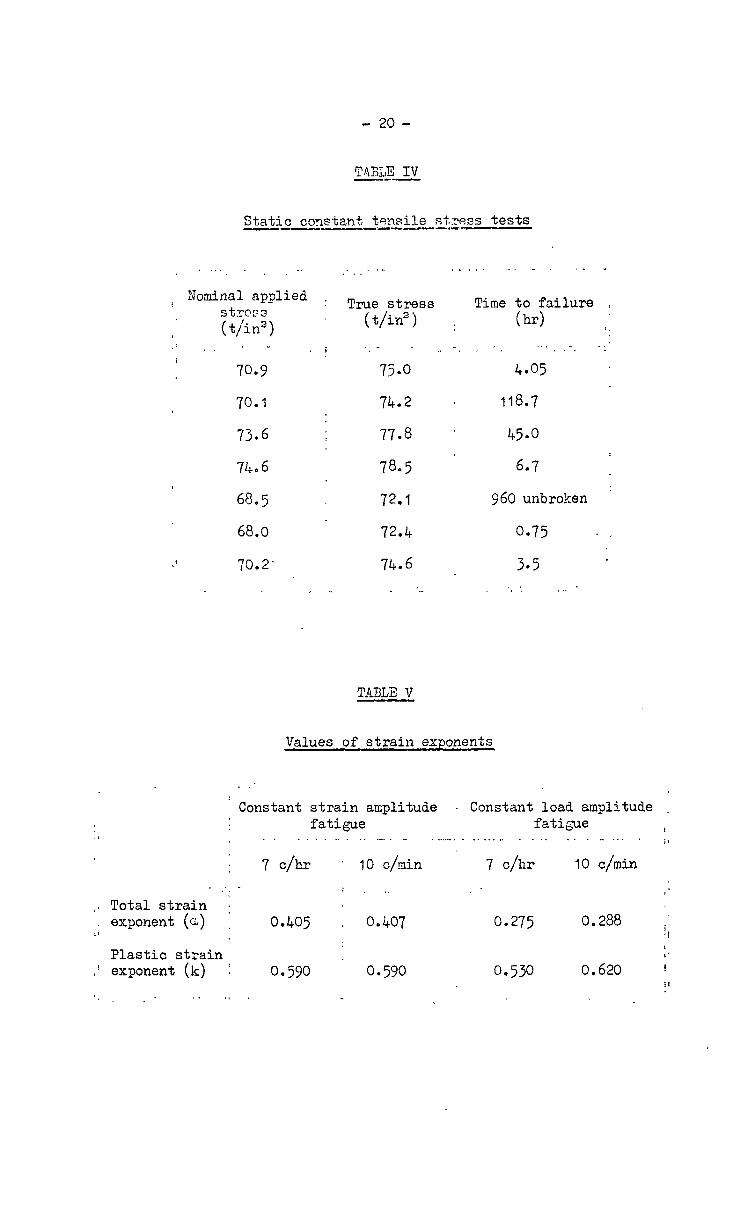
IV Static constant tensile stress tests 20
I--
-:3-
TABiS (cont'd)
Title No.
V
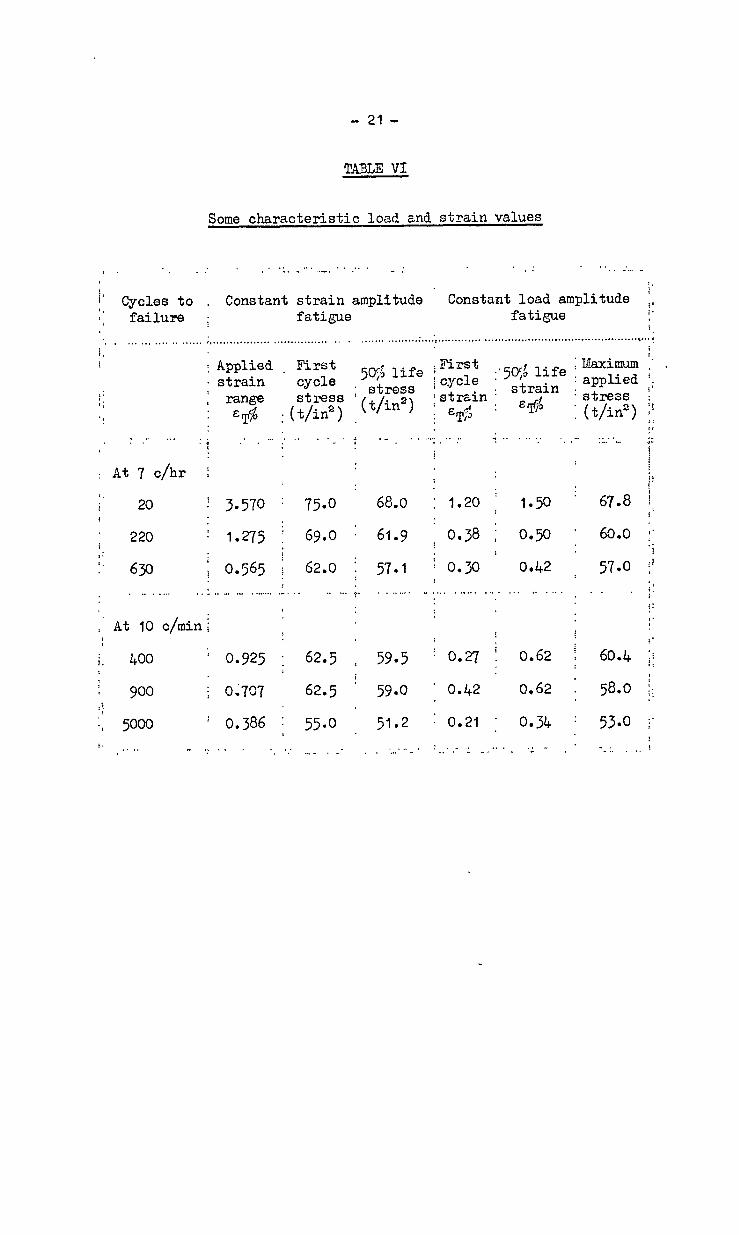
VI
TJO.
I
II
Fig. No.
1
2
3
4
5
6
7
8
9'
10
11
12
13
Values of strain expononts
Somo characteristic load and strain values
- . APPZXDICLS
Title
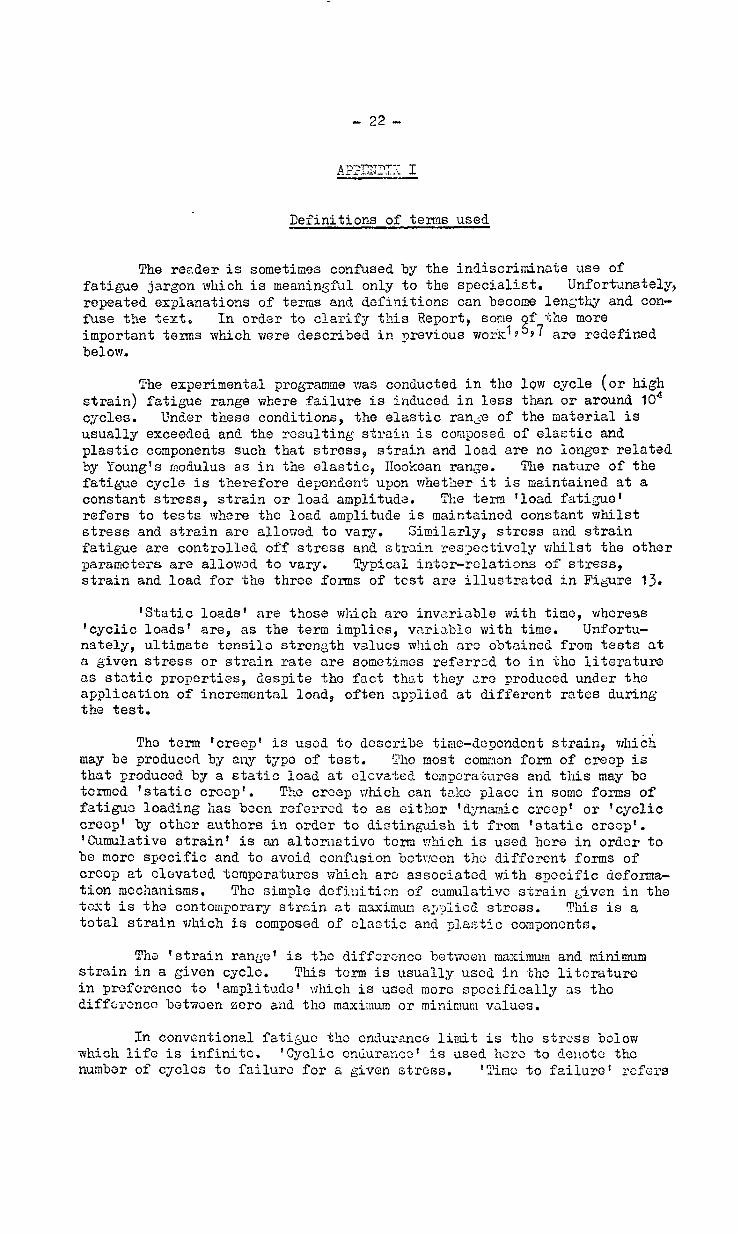
Dofinitions of terms used 22
Stmin/tima arillysis
'ILLUSTRATIONS
Title
Schematic control system and fatigue test-piece
push-pull
Constant load and constant strain amplitude fatigue strcss/timo rupture curves
Cumulative strain/time curves for push-pull fatisuo at 7 c/hr
Total strain ran&e/timo curves for push-pull fatigue at 7 c/hr
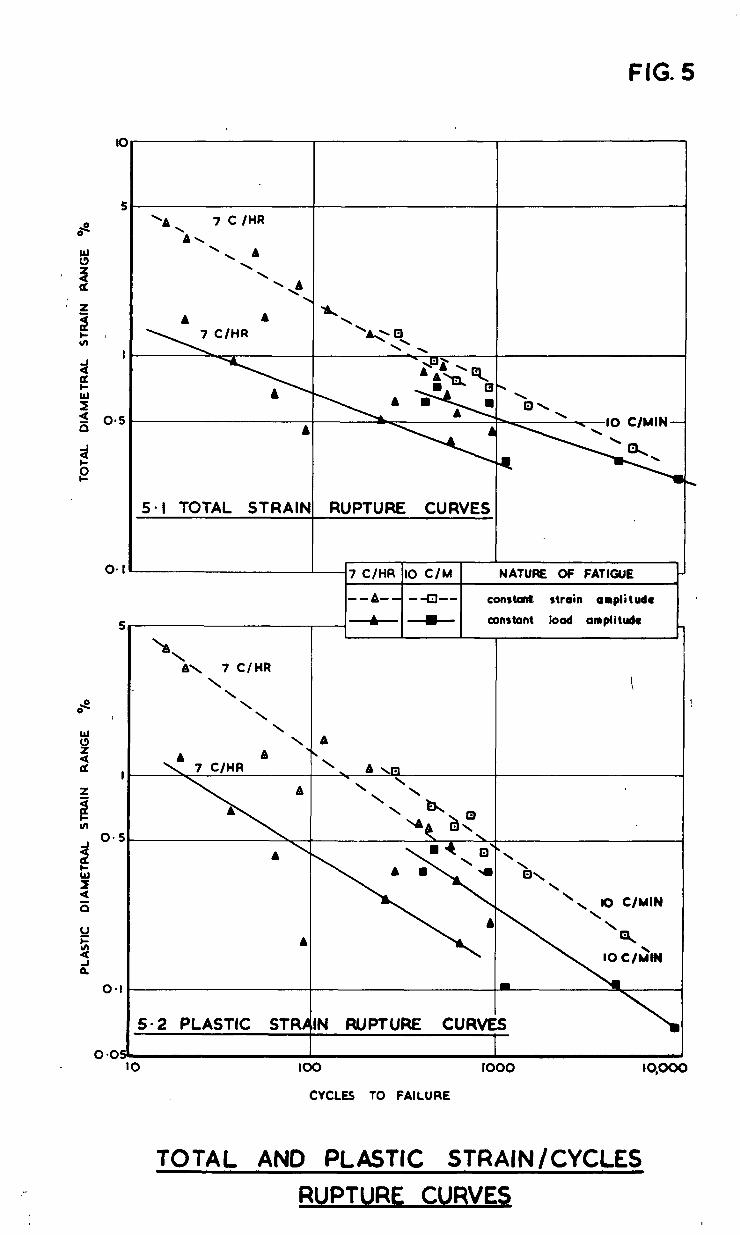
Total and plastic strain/cycles rupture curves
Relaxation of total stress range during constant strain amplitude fatigue tests et c/hr
Effect of variation of push-pull stress riztio on fatigue endurance at 7 c/hr
sffcct of variation of push-pull stress ratio on the cumulative strain/time curves at 7 c/hr
Xffoct of variation of push-pull ratio on total strain mn;e/time curves
6 ts and a0 cross-plot curves
Rogcncratod strain/time curves fittod to experimental data
Croep and fatigue cumulative strain/time curves
Tho behaviour of stress strain and load during high stress fatigue of 11.46
psFc0
20
21
24
-4- \
1.0 Introduction
In recent investigations on an 11 ger cent Cr steel (H.46), strain was shown to accumulate during slow repeated tension fati[,ue and to obey laws similar to those that describe static creep at elevated temperatures'. This has also been shown to take place for either constant stress or con- stant load amplitude fati
!Y e over a range of temperatures in investigations
on a variety of materials 9394 (see Appendix I for definition of terms). The total strain range (ET) of H.46 regented tension data was related to the number of cycles to failure (N) by a power law expression of the form
&TIP = constant
where the exponent EL is dependent on the tosting conditions, which is similar to the extensively reported expression for constant strain ampli- tude fatigue. Fatigue due to repeated thermal shocks at the leading and trailing edgos of gas turbine blades has been considered to bo relevant to constant strain amplitude fatigue because the tompersture differences between the mean value and the eztrcmc values at the respective edges pro- duce strains and stresses that are a function of such properties of the material as its coefficient of thermal expansion, modulus of elasticity, elastic range and plastic flow behaviour. A fatigue cycle is thus applied each time the turbine is operated. Isothermal, constant strain amplitude fatigue date (strain fatigue) has not given very good correlation with laboratory thermal fatigue test data, wiloreas constant load amplitude fatigue data (load fstiguc) has apparently been more promising5.
In cases where it has been necessary to relate load fatigue and strain fatigue data, it has been assumed that the endurance of a sush- 2~11 load test is equal to that of a strain test which shakes down to ~a similar load level. This appears to be a reasonable first approximation, but reqluires closer esamination because the strain and load ranges vary continuously during the two rcsG2ctivc forms of test.
The room tzmpcraturc load fctisuc properties of this material (H.46) have been reported previously in some detail and attention was drawn? to the intcrcsting form that the cumulativa strain/time curves assumed during posh-pull and repoatzd tonsion fatigueG. This sppesrzd important because the SLOW push-pull tests accumulated strain in c tcnsilc sense, ~horaas it is usually assumed that equal tensile and comprcssivc cycles are sclf- cancelling and. result in little or no total strain accumulation. In one of the few relevant investigations to be rogortcd, it was shown* that crcop of an aluminium alloy at 30C°F and :OO°F ws decrcascd by a decrease in the value of the tensile mean stress, and there was no observable creep accumu- lation during fully reversed 1;~1sL-ptill fatigue tosts c;t zOOoF. Detailed push-pull da&a are usually viLVdv -?.-d nith some reserve however, because it is difficult to carry out compressive testing sVhich is free from bucKLing and the resulting compressive instability can produce anomalous affects.
It appears that the conflicting evidence of previous investigations _ requires furthar examination in order to detzrminc whether strain can accumulate during push-pull cyclic fatigue. Fatigue in scrvico conditions is not necessarily fully reversed (zero mean stross) and is dependent upon the operating conditions which may impose a system that is composed of contributions by several forms of loading. The effects of mean stresses on tho cumulative strain/time behaviour and rupture data are thcrcforo of
- 5--
some importance, as also is the relation of push-pull load cycling to con- stant strain amplitude cycling because it is not clear which test (if either) is most relevant to thermal fatigue.
2.0 Zxporimental technique
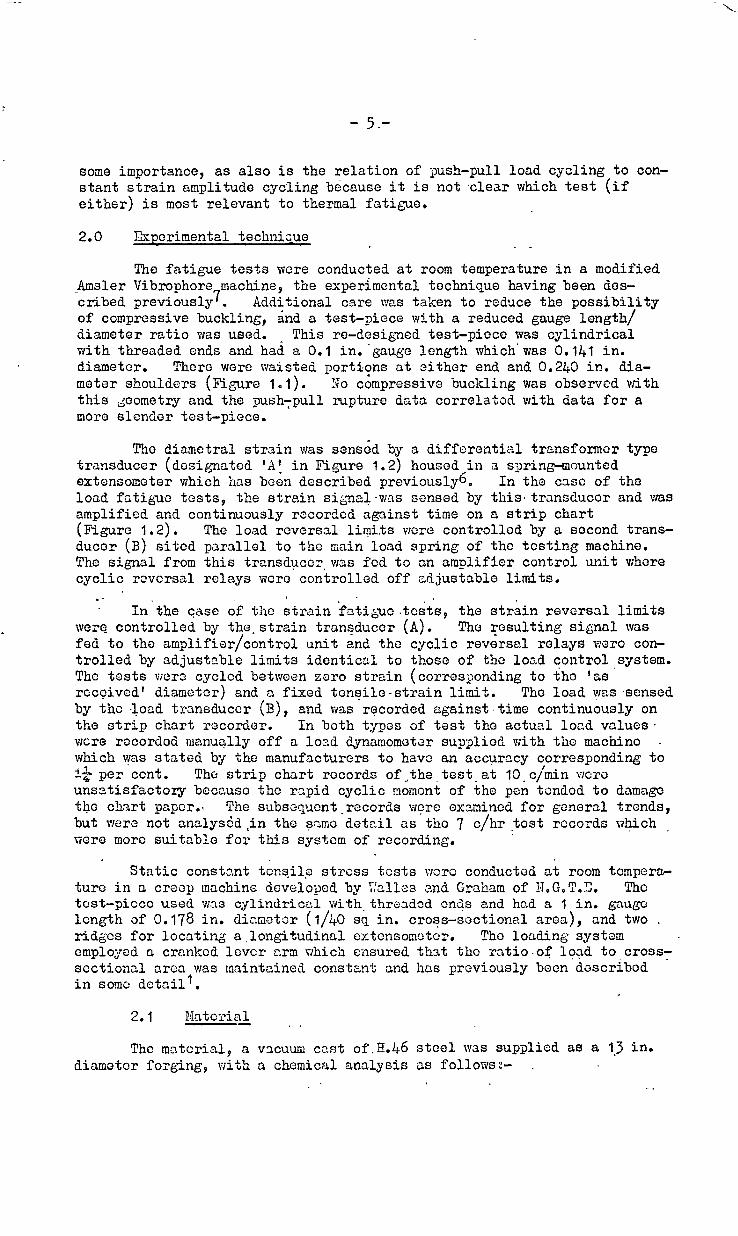
The fatigue tests were conducted at room temperature in a modified Amsler Vibrophore machine, the experimental technique having been des- cribed previously7. Additional care was taken to reduce the possibility of compressive buckling, and a test-piece with a reduced gauge length/ diameter ratio was used. This re-designed test-piece was cylindrical with threaded ends and had a 0.1 in.-gauge length which'was 0.141 in. diameter. There were waisted portions at either end and 0.240 in. dia- meter shoulders (Figure 1.1). 30 compressive buckling was observed with this dcometry and the pushYpull rupture data correlated with data for a more slender test-piece.
Tho diametral strain was sensed by a differential transformor type transducer (designated 'A! in Figze 1.2) housod,in a spring-mounted extonsometer which has been described previously6. In the case of the load fatigue tests, the strain si&nal-was sensed by this.trsnsducor and was amplified and continuously recorded against time on a strip chart (Figure 1.2). The load reversal limits vlcre controlled by a second trans- ducor (B) sited parallel to the main load spring of the testing machine. The signal from this transducer‘ was fed to an amplifier control unit whore cyclic rovcrsal relays were controlled off adjustable limits.
c.
In.the C+S~ df the strain ‘fati~uc.tosts, the strain reversal limits were controlled by the-strain transducer (A). The resulting signal was fed to the amplifier/control unit and the cyclic reversal relays were con- trolled by adjustable limits identica 1 to those of tho load control system. The tests were cycled between zero strain (corresponding to the 'as' received' diameter) and a fixed tensile-strain limit. The load !VCS sensed by the load transducer (B), and was recorded against,time continuously on the strip chart recorder. In both typos of test the actus. load values. were rocordod manually off a losd dynsmomotzr supplied with the machine _ which was stated by the manufacturers to hav o an accuracy corresponding to '4 per cent. The strip chart records of.,the-test-at lO+c/lmin wcro unsatisfactory because the rapid cyclic moment of the pen tondod to dnmago the chart papor.. The subsequent-records wore examined for general trends, but were not anclysdd$n the same detail as tho 7 c/hrtost records which _ nere moro suitable for this system of recording.
Static constant tonqi1.e stross tests wore conducted at room tomper* ture in a creep machine developed by ~~,Ul~s and Graham of U.G.T.2. The test-picco used was cylindrical with.threadod ends and had a 1 in. gauge length of 0.178 in. diauetor (l/40 sq in. cross-sectional area), and two . ridges for locating a.longitudinal extensom&cr. The loading system omployod a cranked lover arm which ensured that tho ratio.of load to cross- sectional area was maintained constant and has previously been doscribod - in SOW d&ail'.
2.1 U:iatCriaL . .
The tnntcrisl, a vacuum L..~~ ,>nt of .H.46 steel was supplied as a l-3 in. diamotor for@ng, with a chemical analysis as follows:- .
Element . $ Composition
Carbon " 0.18
Manganese 0.79
Silicon ' 0.28
Sulphur 0.016
Phosphorus 0.013
Nickel 0.78
Chromium 11.0
Vanadium 0.38
Niobium 0.24
Molybdenum' 0.55
to 0.20
0.90
0.30
0.019
0.017
0.88
11.4
0.41
0;jO
0.64
, Boron 0.0035 0.0040
.Iron Balance
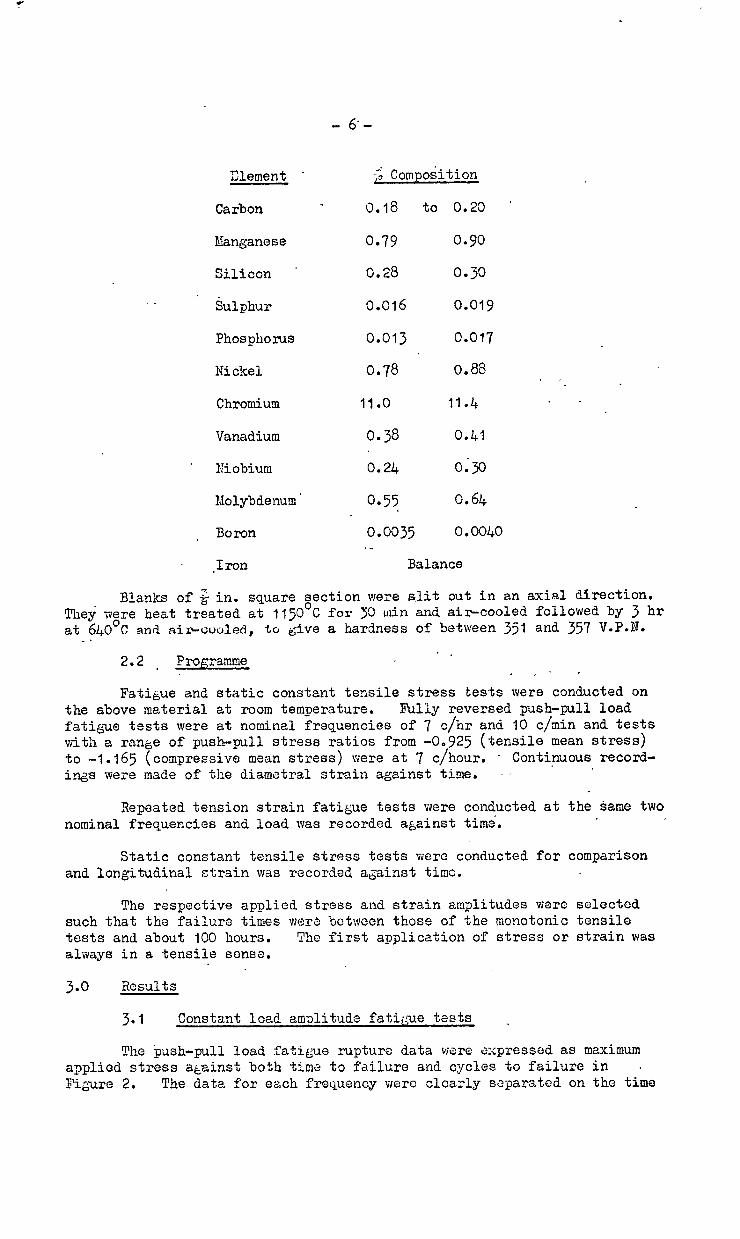
Blan'ks of 2 in. square section were slit out in an axial direction. They were heat treated at 115O'C for 3 '3 ulin and air-cooled followed by 3 hr at 640'~ and air-oooled, to give a hardness of between 351 and 357 V.P.N. - .
2-2. Programme ' . .: r
Fatigue and static constant tensile stress tests iyere conducted on the above material at room temperature. Fully reversed push-pull load fatigue tests were at nominal frequencies of 7 c/hr and IO c/min and tests with a range of push-pull stress ratios from -0,925 (tensile mean stress) to -1.165 (compressive mean stress) were at 7 c/hour. * Contin*uous record-
' ings were made of the diametral strain against time. I .
3epeated tension strain fatigue tests were conducted at the sane two nominal frequencies and load was recorded against time.
Static constant tensile stress tests were conducted for comparison and longitudinal strain was recorded against tine.
The respective applied stress and strain amplitudes were selected such that the failura times werb bctwoen those of the monotonic tensile tests and about 100 hours. The first application of stress or strain was always in a tensile sons2.
3.0 &?su1ts
3.1 Constant load amplitude fatii.W tests "
The j?ush-pull load fatigue rupture data ware expressed as maximum applied stress against both timb 3 to failure and cycles to failure in . FiGure 2. The data for each frequency were clearly saparatod on the time
-7-
base, but exhibited little frequency,effect on the cycle base although the latter comparison was partially obscured because the region of overlap of the two frequencies was limited. (Previous data have shown that there is a small increase in cyclic endurance with increase in frequency under these testing conditions6.) The curves exhibited no tendency to flatten out to a conventional fatigue limit within the range of endurances investigated and could be described adequately by straight lines.
The diametrsl deformation, of the.7 c/hr tests is expressed as cunnrlative diametral strain (the total contemporary strain at maximum tensile stress) and plotted against time in Figure 3. The curves all exhibit an increase in tensile strain accumulation with increasing time and appear to form a regular family with an appearance similar to that of tensile creep. The strain records were examined in further detail and the total strain ranges (or amplitudes) plotted against time (Figure 4). The resulting records are similar to the cumulative strain/time curves and exhibit an increase in strain range with increase in time.
3.2 Constant strain amplitude fatigue tests
The loads required to cycle the to'st-piece betwoen the 'as received' zero snd a g5ven tensile strain wore compressive as well as tensile, because the first tonsile application produced a permanent strain such that it was necessary to apply a compressive load to restore it to its datum length as illustrated schematically in Figure 13. The nature of the sub- sequent cycles quickly reverted to that of a push-pull type load test, the compressive loads being-5 por cent greater than the complementary tensile loads. Repeated tcnsion strain fatigue cycling is usually considered to be effectively the same loading condition as fuliy reversed strain having the same total range, becnuso it has been shovm that both shako down to the same load rang;ds and produce fractures in equal duration&.
The rupture data \'/ere expre ssed logarithmically as total strain range against numbe r of cycles to failure, and as the calculated plastic strain range against number of cycles to failure (Figure 5). This latter value nas calculated from the equation
whore
‘p = ‘T - ; . ...(2)
"P = plastic s-train rango
"T = total strain range
o- = total stress rango at 50 per cent life
E = modulus of olzsticity
usually appliod to this typo of test data. The data v;cro rather scattered and difficult to interpret qucntitxtively but could be represonted by straight linos according to the gonorzlly accoptod power law oxpression (1). Thorc was a limited region of overlap bctwoon test points of tho 7 c/hr and tho 10 c/min applied frequencies, but it was sufficient to rovoal a marked spocd effect vrhoroby an increase in applied frequency at a gtvon total or plastic strain range resulted in an increased cyclic cnduranco. The slopes (o) of tho 'best fit' lines through the total strain data wcro -0.485 and -0.407 for the rospcctivo froquencics whcrcas the slopes (k) of the plastic strain data l;lero both -0.59.
-8-
% The stress data from six of the 7 c/hr tests were expressed as stress-range/cycles curves (Egure 6) and it can be seen that the stress ranges decreased continuously during the fatigue lives.
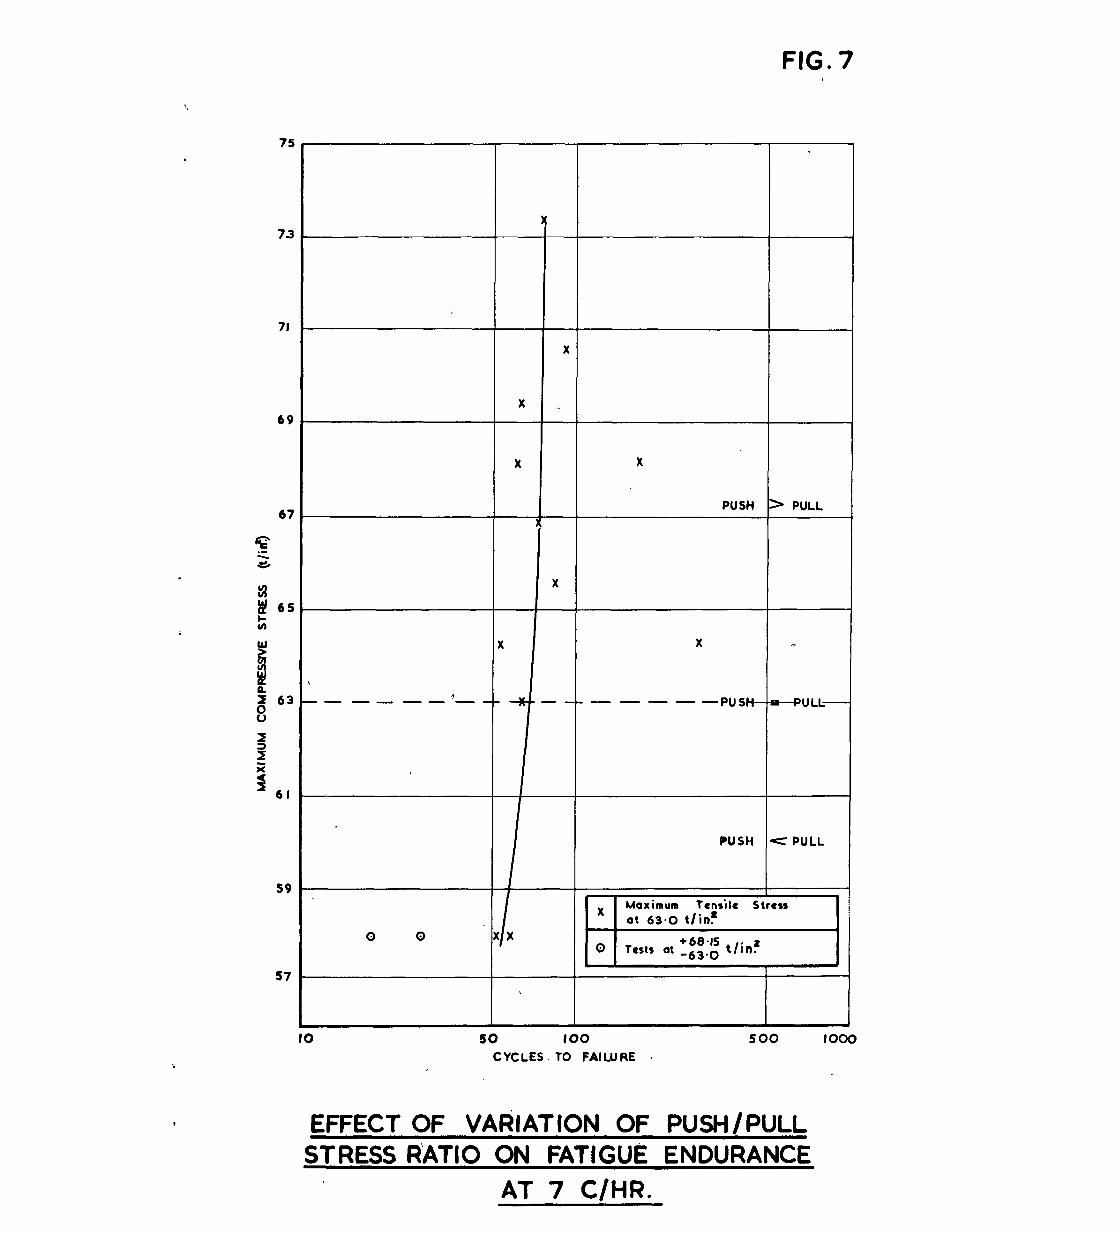
3.3 Xffects of compressive mean stresses at 7 c/hr d
The effect of various compressive mean stresses on the rupture endurance at 7 c/hr is illustrated in Figure 7. Tests conducted with 63.0 t/in= maximum tensile stress; range -38.0 t/ins to -73.4 t/in'
but with compressive stresses in the p produced little effect on the endurance
as compared with a fully reversed test at 263.0 t/inap whereas tests co2lr ducted with a compressive stress of -63.0 t/ins and higher tensile stresses?, exhibited reduced endurances.
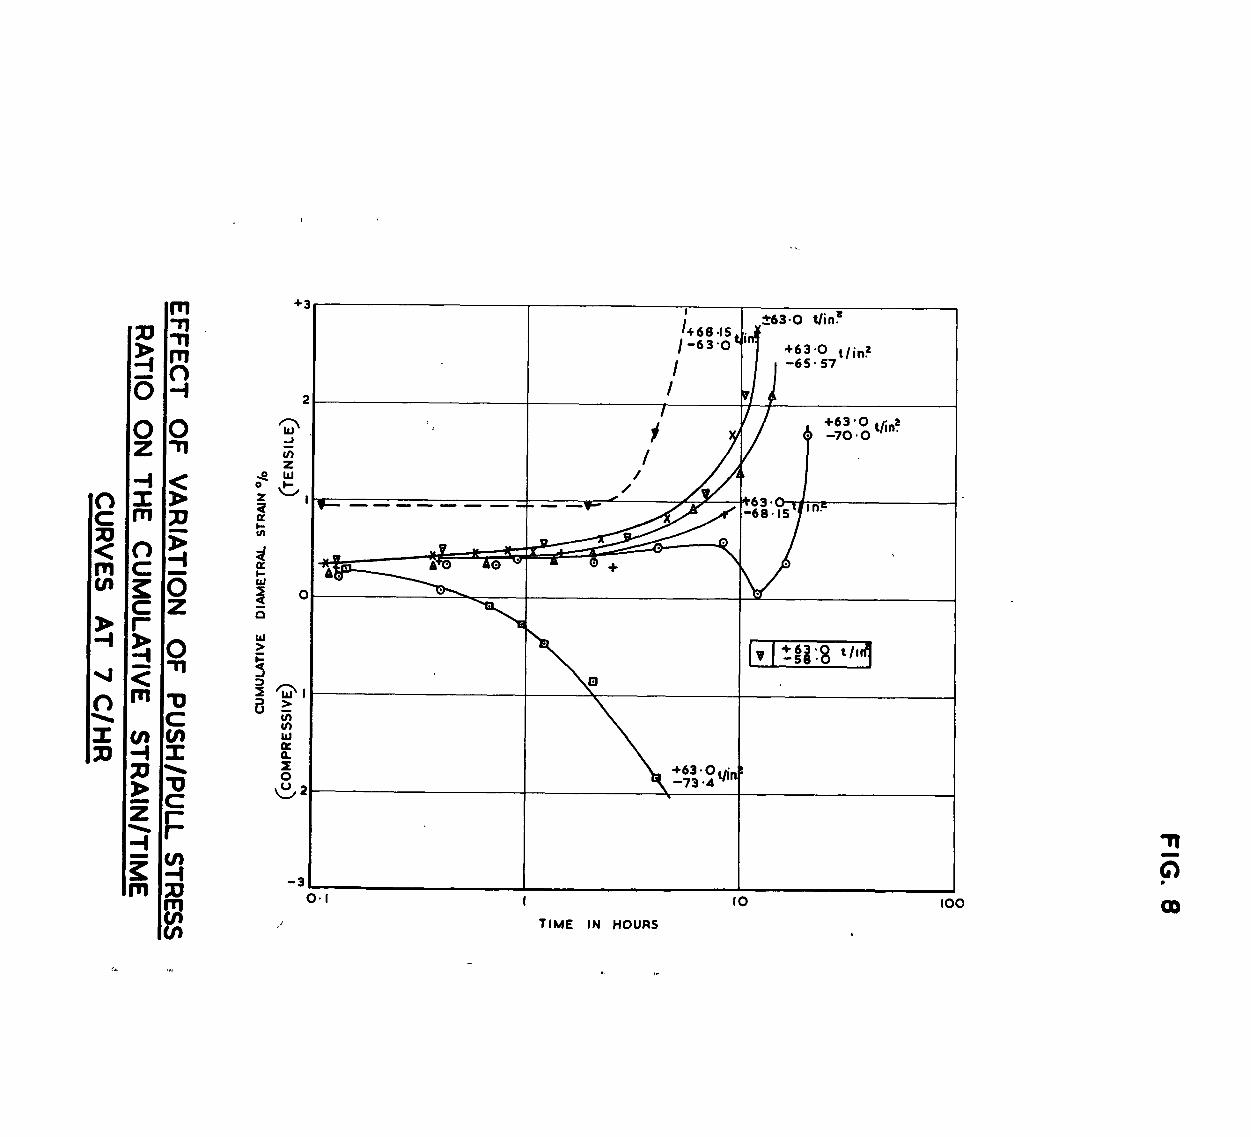
The cumulative strain/time curves are illustrated in l?igure 8. The curves all exhibit a first quarter-cycle strain of -3 per cent because t'his was the valile produced by the common first tensile quarter-cycle load of 63.0 t/in', (the strains in Figure 8 were nlotted against time as opposed to number of cycles, and the first quartepcycle strain was represented by the first point on each curve). -68.15 t/in2
Increases in the compressive stress to progressively decreased the rate of tensile strain accumula--
tion. A test at ~~~'~g t/in" produced an unstablo accumulation with a .
'compressive kink' at about 12 hr, whilst a further increase in compressive
stress to IF;*: t/in" produced an all-compressive strain accumulation. .
Tests with increased tensile stress +68.13 a -63.0 t/in exhibit a high
first quarter-cycle tensile strain and the specimen subsequently accumu- lated strain at a moro rapid rate than for i63.0 t/'in2 whereas tests at a similar stress ratio (-O.92), but with decreased compressive-stress
s exhibit no significant change. The total strain range/time
curves exhibit trends similar to those of tho fully reversed push-pull tests, but arc not separated into a clearly dofinod family as in the former case (Figure 9).
3.4 Static constant tensile stress tests
Static constant tensile stress craeg tests were conducted such that failures were produced between about 1 and 700 hours. The stresses were oxpressed as nominal values i.e., initial load dividod by cross-sectional area, and the longitudinal strains over a 1 in. &au&e length wore plotted against tiue in figure 12.1. True strasaes (contemporary load divided by contemporary cross-sectional area) wore calculated and listed in Table IV.
4.0 Xscussion
411 The accumulation of strain
The cumulative strain/time curves of the 7 c/hr push-pull fatigue tosts exhibit tensile strain accumulations which have a similar appearance to those of tensile creep tests at elcvnted temperatures. Additional evidence of this trend is exhibited by the strain fatigue tests in which
-9-
5 per cent excess compressive load was required to maintain the strain amplikde constant, and by the variable stress ratio tests in which strain accumulation was tensile despite compressive mean stresses.- In the latter case, the strain continued to accumulate tensile-wise for as much as 8 per
cent excess compressive stress i.e., +63.0 -70.65 t/in" and it is interesting to
note that.this is nearly an order of magnitude greater than the excess tensile true stress produced by the changes in cross-sectional area at the maximum tensile and compressive loads. This difference in cross-sectional area is induced by the tensile and compressive strains and is related to the total strain range e.g., a test at 263.0 t/in" nominal stress was cal-
culated to be +83.45 -62.55 t/in" true stress, at 50 ger cent life.
The family of strain/time curves y:ere analysed by a technique originallv developed and applied.to constant stress creep by Graham and Palles991r) (Appendix II). In.this analysis, the curvas were separated into a three-term expression of the form
E = so + at -I- b-t' -43)
and the 1 percent strain intercepts of the ti and tg terms were related to the applied stress by the .exprossion - , -
. . ..(L+)
wh? re E strain _
co first cycle loading strain . .
t time
CT stress
apb9 c constants
The time and stress exponents are members of a discrete series and : the particular numerical values used in Equations (3) and (4) represent the terms which were operative for thin u material and testing condition. The strzin/time curves nere regenerated from these two expressions and compared riith the experimental data (Figure 11). It is clear that the analysis fits very closely for these testing conditions and appears to be a valid and useful method of describing the data.
The strain/time records show that after.the first application of tensile stress, the subsequent equal and op,osite compressive stress ias insufficient to restore the s2ocimon to its original dimensions, and the fully revorscd push-pull cycling cnhsncod the rate of strain accumulation compared with that produced by repeated tension fatipc at an equal maximum applied stress (Figure 12.2). The different behaviour of the gush-2ull * and repeated tension strain accumulations appears to be due to the reversal of stresses producing an onhnncod ductility.' This is supported by tho ' marked difference in behaviour of the total strain ran&o/time curves of the
- 10 -
push-pull and repeated tension tests illustrated in Figure 12.3. The push pull strain range in the example was 1.2 per cent in the first fill cycle and subsequently increased continuously throughout the fatigue life (work- softened) whereas the repeated tension strain range decreased during the first few cycles (work-hardened) from 0.2 per cent to 0.128 per cent, remained fairly constant during most of the test, but markedly increased again immediately prior to fracture. It appears then, that the material work-softens and becomes successively less resistant to deformation during the push-pull fatigue test whereas it work-hardens and becomes successively more resistant during repeated tcnsion fatigue testing.
In general, the application of fatigue cycles may either harden or soften the structure depending upon its initial condition. A material in an initially hard condition e.g., cold rolled, can become softer after the application of a number of fatigue cycles such that the resistance to deformation decreases, whereas a material in an initially soft condition e.g., annealed, becomes progressively harder, and more resistant to deformation49'l. (The H.46 steel used in this investigation was heat treated to give a hardness of 350 to 357 V.?.N. and was therefore in a comparatively hard condition.) The work-softening behaviour in the push- pull fatigue tests may be explained in terms of the Bauschinger effect whereby the application of stress in one direction lowers the yield stress in the o22osite direction. Repeated stress reversals can produce stress/ strain hysteresis 1002s with marked plastic deformation during fatigue tests of ug to 100 hr duration, whereas ropeated stresses in one direction work-harden the material and raise the yield stress in that direction such that there is very little plastic deformation and the stress range becomes almost wholly elastic6. A material subjected to a prior 'history of repeated tension stresses in this manner is therefore more resistant to deformation than one subjected to reversed stresses. Unidirectional load- ing does not prohibit deformation completely however, and it can be sesn that repeated tonsion load fatigue produces clumulativo strain but at a lower rate (Figure 12.2). Repeated tension stress fatigue also Froduces cumulative strain provided the stresses are high enough'.
The tests conducted with a range of mean stresses demonstrate that a comparatively large compressive stress i s required to inhibit tho tensile strain accumulation. The strain fatigue tests exhibit similar behaviour to the extent that tensilc deformation was sroduccd mora easily than com- pressive deformation, i.e., in order to prohibit the accumulation of strain, it was necessary to apply compressive loads which w3re about 5 per cent greatcr than the tensile loads. At the same time, the total stress range decreased continuously as the material viork-softoncd and successively less stress was required in the two respective directions to maintain it constant.
Mathematical analyses of the effects of fatigue loading on the strain accumulation at higher tcmpcratures have usually been based on tensile creep and fatigue dats. Such ap?roachcs ofton assume that a ropeatod tension test produces a creep curve characterised by an equi- valent crocp stress which is loss than the maximum cyclic stress e.g., Rcferoncc 12. This approach is only supportod by data of tosts at the conventional creep temperatures however, and fails to predict tho behaviour at lower temperatures where the stress to produce creep failure in a given time exceeds that to produce fatigue failurc7. In addition, tensile and compressive creep characteristics are often assumed to bo equal and opposite, which is not always true in practice because some materials
- 11 -
exhibit less resistance to tensile creep whereas others exhibit less resistance to compressive creepl3. It is clear that if the strain accumu- lation produced during push-pull fatigue tests is viewed as a balance between tensile and compressive strain, the material in these room tempera- ture tests is significantly less resistant to tensile stress and mathe- matical expressions which successfully described the components of the effect require different constants for tension and compression. The room temperature strain accumulation appears to be a form of creep as defined by the time-dependent deformation because the strain/time curves can be described by the same general equation as that for high temperature constant load creeg, but this does not imply that the deformation mechanisms invoked bg the high and low temperature conditions are identical,
The longitudinal str.Q.n/time curves relevant to static constant tensile stress tests (Figure 12.1) also exhibit strain accumulation, but at a lowor rate than those of push-pull. The values of the stresses required to produce this time-dependent doformation were very high and the stress/time rupture curve had a very loa slope such that a small change in stress produced a very g rent change in the time to failure. The scatter band appeared to exceed the decrease in stress related to this stross/timc slopo and it was difficult to correlate stress and time. The data exhibitod well defined tensile strain accumulation dcs$te the fact that the tests wore at a constant stress (decreasing load). The strain/ time curves appear on inspection to be composed mostly of a very low term
which is probably t&and there arc fairly well defined t& and t t! terms ovidont during tho later stago of the tests. It is possible that for static tests each of the time exponents is identified with a deforma-
t iii tion mode, and the term characterises a basically low temlorature mode whereas the higher terms commonly exhibi* &d by materials in the con- ventional creep rango are characteristic of high temperature behaviour.
4 .2 The correlation of load and strain ranges vvith the rupture data
Tao strain fatigue rupture data are compc,rzd u;ith the load fclti;;uo data in Figure 2, and it is claar that they corrclato fairly closely on either stress/cycles or stressi'time diagrams and can be described by straight lines which are common for tho two forms of test. The rcspcc- tivc slopes aro very flat honevor (-l/32 for the 7 cjhr'data and -l/16 for the 10 c/min data) and tend to oxag&orate tho success of the correlation.
Comparisons of the total strain rango and ccllculatad plastic strain range data of tho res~ectivc tests at 50 por cent of the life to failuro show that they do not correlate very closely on this basis, the strain fatigue exhibiting superior cyclic cndurc',nccs at equal strain ranges (Figure 5). Tho correlation of the rosgectivc tests on a strain range/ cycles basis is deaandont u>on the definition of tho rospectivc total strain ranges 6.1arz.ctcrising tho constant load amplitude tests. Theso are usually calculatzd at 50 ilor cent life on the assumption that the strain ranGc has 'shalcon down' and rGached a more or less constant value at this stage of the tost. F'igura 4 and Table VI illustrate that this is not true for these tests, and the strain ranso to produce failure in some of the shorter cnduranco constant strain ampiitudo tests was never attained in the constant load tosts at the samo cndurnnco, e.g., a fniluro occurrod in a load fatigue tost c,t 54.8 tiir? after 37 cycles during which time the strain rango incrcasod from 0.72 per cant to
-12-
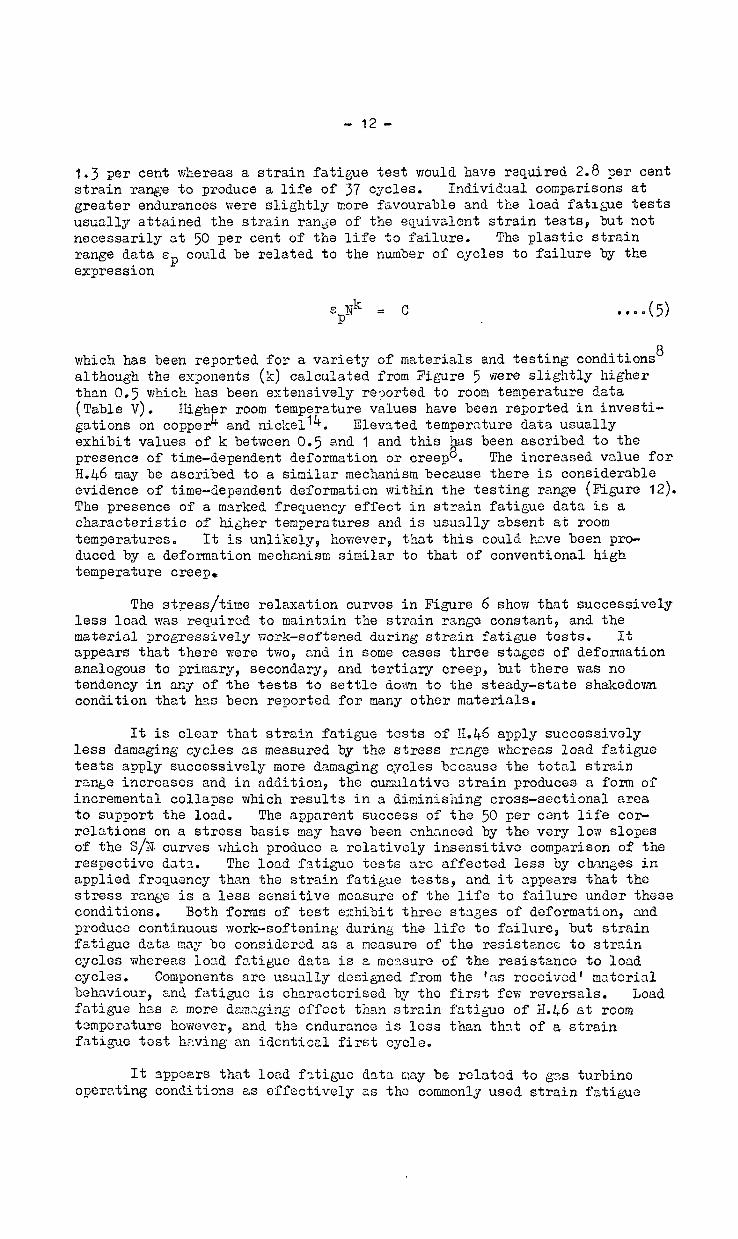
1.3 per cent whereas a strain fatigue test would have required 2.8 per cent strain range to produce a life of 37 cycles. Individual comparisons at greater endurances were siightly more favourable and the load fatigue tests usually attained the strain range of the equivalent strain tests, but not necessarily at 50 per cent of the life to failure. The plastic strain range data E expression
p could be related to the number of cycles to failure by the
which has been reported for a variety of materials and testing conditions 8
although the exponents (k) calculated from Figure 5 were slightly higher than 0.5 which has been extensively reported to room temperature data (Table V). Higher room temperature values have been reported in investi- gations on copper4 and nickel'4. Zlevsted temperature data usually exhibit values of k between 0.5 and 1 and this :h.as been ascribed to the presence of time-dependent deformation or creep8. The increased value for ~.46 may be ascribed to a similar mechanism because there is considerable evidence of time-dependent deformation within the testing range (Figure 12). The presence of a marked frequency effect in strain fatigue data is a characteristic of higher temperatures and is usually absent at room temperatures. It is unlikely, however, that this could hzve been pro- duced by a deformation mechanism similar to that of conventional high temperature creep,
The stress/time relaxation curves in Figure 6 show that successively less load was required to maintain the strain range constant, and the material progressively work-softened during strain fatigue tests. It appears that there were txo, and in some cases three stages of deformation analogous to primary, secondary, and tertiary creep9 but there was no tendency in any of the tests to settle down to the steady-state shakedown condition that has been reported for many other materials.
It is clear that strain fatigue tests of 11.46 apply successively less damaging cycles as measured by the stress range whereas load fatigue tests apply successively more damaging cycles bccauso the total strain raso increases and in addition, the cumulative strain produces a form of incremental collapse which results in a diminishing cross-sectional area to support the load. The apparent success of the 50 per cent life cor- relations on a stress basis may have been enhanced by the very low slopes of the S/X. curves lfhich product a relatively insensitive comparison of the respective data. The load fatigue tests arc affected less by chan&es in applied frequency than the strain fatigue tests, and it appears that the stress range is a less sensitive mcasure of the life to failure under these conditions. Both forms of test exhibit three stages of deformation, and produce continuous work-softening during the life to failure, but strain fatigue data nay be coneidercd 2s a measure of the resistencc to strain cycles whereas load fatigue data is a measure of the resistance to load cycles * Components are usually dosigned from the 'as received' material behaviour, and fatig.lc is chcractcrised by the first few reversals. Load fatigue has a more damaging of'foct than strain fntisuo of X.46 at room temperature however, and the cndurnnca is less than that of a strain fatigue test having an identical first cycle.
It sppcers that load f-tiguc data ~;:a.y be relntod to gas turbine operating conditions as effectively as tho commonly used strain fatigue
- 13-
provided the vnlues of lozd 2nd strain 3re recorded 2nd ?nelysed compre- hensively. Push-ml1 load fatigue possibly hzs some additional merit because it produces more conserv:ttive rupture data as measured by the strain amplitude at either the first cycle or the 50 per cent life con- ditions. The cumulcltive strain or increment21 collapse exhibited by this type of test mny be relev-rnt to the conditions produced by the COW binations of thermnl fclti&ue, interrupted centrifugal creep, and low stress bending vibrations which are present in g.s turbine components but >re not altogether simulated by other tests such OS repe,, q-ted bending or the thermal shock of tapered discs in fluidised beds.
5.0 Conclusions
5.1 Static tensile stress, constant lozd amplitude push-pull 2nd constnnt lozd amplitude repeated tensi:jn fatigue tests on FL46 at room temperature ex'hibited time-dependent tensilo stmin nccumuletion.
5.2 Push-pull tests vIith compressive stresses that were between 0 and 8 ?er cent greater thzn the mcwrimum tensils stresses also exhibited tensile stra:in nccumui2tion. The increases in the excess compression stress dscrozsed t;:o tensile strain, and 16.5 per cent excess compression produced compressive strain accumulation.
5*3 The variations in comprcssivc reversal stress of between -1-16.5 per cent and -8 per cent produced little change in the rupture endurcnce whoress an increase in tensile stross docrezsed it merkedly.
5.4 &pat ed tension f?,tigue testing nork-hardened the matori. end decreased the strain rage whcrees fully reversed push-pull testing produced work-softening and incrczsed the strain mngc. The introduc- tion of compressive revsrszla cnhancod the rzto of tensile strain nccumulation.
5.5 Constant etrzin nmplitudc fatigue ru?turc data exhibited a marked froquoncy offoct aneraby longor cndurancos wcro then at 7 c/hour.
obtcined at IO c/min The constart load emplitudc rupture dntc were con-
siderably less sensitive to frequency ct this temperature.
5=6 Constant lo>d nmy,litude fztiC;u o cycles appozrcd to have a more dcamaging effect thzn constant strc?in f.-tihuo cycles.
5.7 The dF.t:: from both trpcs of fatigue test corrolzted closely on 2 mzuimum tonsilo stress bcsis (zt 50 _ocr cent lift), nhorons compari- sons on c2 strain range basis shov!od that conslznt strain c?mDlitudo fntigus _ tests would give longor lives.
5.3 Compressive stress plsyod (t sig;niPicant role in the fatigue bohzviour of H.46 nt room temperaturs 2nd suggest th.zt study of the role of com2rcssivc stress in tho olcvatcd tcmpcrzture behaviour of gas turbine. mztcrinls is noodod.
- 14 -
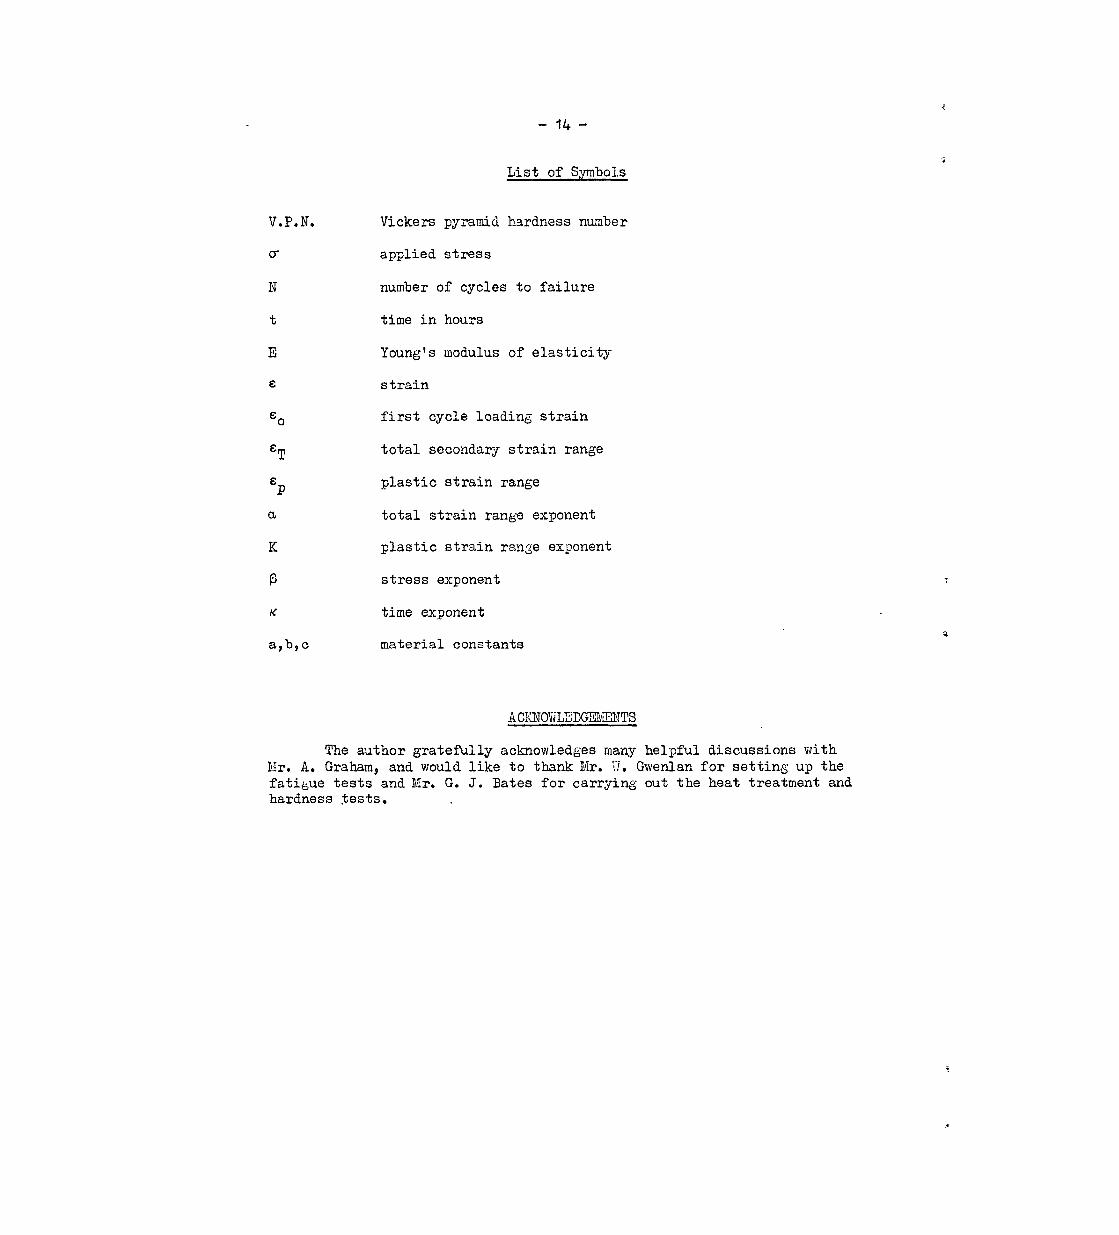
List of S,ymbols
V.P.N.
CT
&O
&T
&I?
a
I<
6
K
aA c
Vickers pyramid hardness number
applied stress
number of cycles to failure
time in hours
Young's modulus of elasticity
strain
first cycle loading strain
total secondarjr strain range
plastic strain range
total strain range exponent
plastic strain range exponent
stress exponent
time exponent
material constants
The author gratefully acknowledges many helpful discussions with Mr. A. Graham, and would like to thank Mr. 7. Gwenlan for setting up the fatigue tests and Xr. G. J. Bates for carrying out the heat treatment and hardness tests.
I
&. Alh..lbr(
1 G. P. Tilly
2 F. W. De Money, B. J. Lazan
3 C. E. Feltner; G. I$. Sinclair
4 P. P. Benhcm
5 J. T; Roberts *
6 G. P. Tilly
7 G. P. Tilly
8 L. F. Coffin
9 A. Graham
10 K. F. A. Walles, A. Graham
TlTY.
Effects of varied loading paths on fatigue endurances Part III - Some stress properties of H.46 at elevated temperatures, A.R.C.26 056. C.P.788. June, 1964.
Dynamic creep and rupture properties of an aluminium alloy under axial, static and fatigue stress. Proc. ASTM Vol. 54, 1954, p.769.
Cyclic strain induced creep 'of close packed metals. Joint U&E-Inst. Wech.E. International Creep Conference, October, 1963.
Low endurance fatigue of mild steel and an aluminium alloy. J. of Inst. of Metals, Vol. 89, 1961, p.328.
Comparative thermal fatigue tests on Nimonid YO tapered disc specimens with and without internal air cooling. N.G.T.E. Memorandum No. M-366. A.R.C.25 322. September, 1963.
Effects of varied loading paths on fatigue endurances Part II - Some load fatigue properties of H.46 at room temperature. l~R~C.26 055. C.P. 787. March, j964.
Effects of varied loading paths on fatigue endurances Part I - Some load fatigue properties of Nimonic YO at elevated temperatures. &R.C.25 880. C.P.786. December, 1963.
Low cycle fatigue: a review. Applied Materials Research Vol, l(S), p.129. October, 1962.
The phenomenological method in rheology. Research (6) ~~62, 1953*
On the extrapolation and scatter of creep data. X.R.C. Current Paper No. C.P.680. 1963.
- 16 -
No. Author(
11 N. H. Polakomski, A. Palchoudhuri
12 G. Vidal
13 0. K. Sclmassy, 0. L. Cnrlson, G. K. hlency
44 H. Majors
15 J. T. P. Yao, W. H. Munse
16 K. F. A. Walles
Title eta.
Softening of certain cold-worked metals under the action of fatigue loads. Proc. ASTM Vol. 54, lY!$t, p.701.
Sur le fluage pgriodique des allisges resistsnts 'a chaud. Rev. Met. Vol. 53, p.485, 1956.
An investigation of the interchange of tensile creep for compressive creep. Unpublished U.S. Report.
Thermal and mechanical fatigue of nickel and titanium. Trans. ASN Vol. 51, p.421, 1959.
Low cycle fatigue of metals - Literature Review. Tdelding Research Supplement Vol. 41 (4), p.1825, 1962.
Contribution to the discussion of the Joint ASME-Inst. Mech.E. International Creep Conference. October, 1563.
- 17-
TABLE I
Constant load amplitude push-pull fatigue properties of H.46 at room temperature
‘I i4 .:. .. : .: , ;
!: 7 c/hr : %! .i . . !i
!i *: !I :C
.: ii
t. 1, . .. .. . : i’
.q.
! : ri 10 c/min : ii !' 11 8' .
j‘
i’
i’
Time to Total strain Plastic strain !; fracture, Cycles to
hr : fracture : . . .; 239
647 :
142
rqge . range CT;4 . - ET%
. . . .,.. I_.. ,.._ . " 0.50 . d.i58
0.42 0.173 231.1 ; i-57.0 .
262.0 ;
457.8 ;
264.8
263.0 :
3&& i
iG8.1 / ,.. . . . . . . . . .
i60.4 1
i-55.0 i
250.0 :
248.6 i
243.5 /
“58.0 i
32.2 :
5.05 ;
8.9
14.5 :
64.9 I
18.9 [ . . . . . . . . . . .
0.7
109 :
15*5
15.85 :
58.8 i
1.55 i
7.7 ;
. . ; 260.2 : 0.9
:: I
i
i : 241.6 f 88.8 :
. .." : ^ , . . . ^ .:. .: "
954
20 i
37 : I
63 :
287 1
96 . . . ,. . . .i
397 :
1151 .
9907
10631 ;
42038,
g-19 :
4618 :
458 :
64524
0.46 : 0.209
1.50 ; 1.206
0.95 0.680
0.685 : 0.412
0.64 ; 0,362
0.465 . 0.170 . . . . . . . . . . . . . . .., ,........-. . .".
0.62 : 0.36
0.34 0.102
0.285 . 0.069
0.616 : 0.364 t
0.338 i 0.108
0.74 : 0.4?9
i:
/
. . ,I !’
. . . . ’
;I ri i: 7: 1. ::
/
2’ !
;;
/
. . .
-18-
TA3LE II
Constant strain amplitude fatigile properties of I-1.1+6 at room temperature
' Applied Total applied . Time to 'Cycles to
frequency . strain range +J$ -
j fracture, fracture hr '
; . .
0.715
0.856
1.275
10545
0.565
0.830
0.860
1.750
2.150
3.570
3.000
tc. 290 . . . .
0.386
0.795
0.860
0.925
0.600
1.29
0.707 : .
127.9
go.05 :
51.2
12.65
128.1
97.35 .
105eg :
30.5 :
22.2 .
5.45
10.6
4.1 :
581
394
214
55
610
461
466
124
87
21
40
16 . . .
5255
582
734
458
1447
230
880 II .
. 158.2 . 0.463 ;
60.5
61.9
64.9 :
57.1
58.4
. . . ..-
, 10 c/min
. . . - . . .
8.35
1.05
1.25
0.85
2.55 .
0.55
1.5
59.0
59.0
59-5
58.2 0.348 :
I . . "
59.0 . -
. . ’ . . . . . . . ..‘I . - :.
-- . I
64.2
66.0
68.0
67.5 3.998 ’
0.184 51.2
63.4 1.016
0.594 :
1.007 :
1.264 1.
0.318
0.577 , i.
1.472 >
0.864
3.276 s
0.590 .8
0.655
0.717
0.452 :
- 19 -7
TABLZ 1'11
Constant load amplitude push-pull fatigue tests at variable stress ratios
i Maximum : Niaximum ' Push-pull Time to Ij compressive . tensile stress I stress stress ' ratio j! (t/in") j (t/in') (3)
fracture, hr
i . . .,
i.
:. . .
63.0
63.0
63.0
58.0
58.0
63.0
64.28
64.28
65.57
66.86
68.15
68.15
69.44
70.65
73.40
,,,. ‘: . .
68.15
68.15
64.28
63.0
63.0
63.0
63.0
63.0
63.0
63.0
63.0
e63.0
63.0
63.0
63.0 ^
. . :
-0.925
-0.925
-0.975
-0.92
-0.92
-1.0
1.02
1.02
1.04
1.06
1.08
1.08
1.10
1.12
1~65
- . ”
4.3 18
5.7 27
24.0 109
13.4 52
14.6 55
14*5 63
66.35 278
11.7 52
19.65 82
18.1 75
48.2 170
15.2 61
15.6 , 63
23.3 93
20.0 77
. : : .._..”
Cycles to f fracture i
,:. . .
Tests conducted at -7 c/hr . ,
- 20 -
TABLE IV --
Static ccmetant tsnsile st32ss tests ------yI---
. . .
Nominal applied _ stre~a True stress
(t/in2) (t/in"> :
.I ., i ‘. - - ., . . .
5
70.9 75.0
70.1 74.2 .
73.6 77.8 .
.’
74.6 78.5
68.5 72.1
68.0 72.4
70.2 74.6
I - ‘“.
TAX.3 V
Time to failure , bd ,:
. . . . '. .-. .:
4.05 .
118.7
45.0
6.7
960 unbroken
0.75 . .
3.5 :
. ‘.‘. .- -
Values of strain exponents
. ,
' Constant strain amplitude . Constant load amplitude . fatigue fatigue 1 . . . . , . . . . . . . . . . . ..,... . . . . . . . " . . . . . . , . . . . . i:
7 c/h . 10 c/min 7 c/hr 10 c/min
:, - .I Total strain 1
exponent (cs) 0.405 ,i
Plastic strain !! exponent (k) 1 0.590
. ,. . ‘.
0.407 0.275 0.288 i. ::
0.590 0.530 0.620 !
ii
- 21 -
TABLE VI
Some characteristic load and strain values
I . . . : . . ‘L. - ... ..,_, - ’ . ..’ _ : . . “..” ”
!: Cycles to . Constant strain amplitude . Constant load amplitude i: failure ; fatigue fatigue /.
1 . .. , . . . .., . . . . . . ..,... ,,..,....,.......,. . . . . . . . . . . . . . . . . . . *...... . . . . ..a..................*.. . . . . . . . . . . . . . . . . . . . . . . . . . . . . . . . . . . . . . . . . . . . . ..~... f i,
3 : Applied . First
,' At 10 c/mini
400 ;
!.
900 i :i :: 5000 ;
: . .” : .’ . . ..I ,_ . . . . . . . . . .; . . . ,. .
- 4 -. I ‘..-- ..‘. . “. .” ;:
j t !
it
3.570 : 75.0 68.0 t : 1.20 1 1.50 : 67.8 1,
1.275 i 69.0 : 61.9 1 0.38 ; 0.50 * 60.0 j;
s
0.565 i 62.0 ; 57.1 i 0.30 0.42 : 57.0 ii
*I -. . . . .” . . . . .- , . . . . . . p. . . . . . . . . I . . . . . . . . . . . . . . . . . . . . . . . . . . ;.
!:
>a
0.925 : 62.5 t 59.5 i 0.27 i 0.62 i 60.4 ;;
I
0 i707 62.5 ' 59.0 . 0.42 0.62 : 58.0 i: :
0.386 ; 55.0 . 51.2 : 0.21 : 0.34 : 53.0 ;’ i. . , . . . . . ._ .
. . . : “._ . _. . . .
_ . . ...-‘. . . : . - - “ . , . ”
. - “_ : . . . .
- 22 -
Definitions of terms used
The reader is sometimes confused by the indiscriminate use of fatigue jargon which is meaningful only to the specialist. Unfortunately' repeated explanations of terms and definitions can become lengthy and con- fuse the text, In order to clarify this Report, some of the more important terms which were described in previous work 9 --l 597 are redefined below.
The experimental prob 'ramme was conducted in the low cycle (or high strain) fatigue range where failure is induced in less than or around 10" cycles. Under these conditions, the elastic ran&e of the naterial is usual?jr exceeded and the resulting strain is composed of elastic and plastic components such that stress, strain and load are no longer related by Young's modulus as in the elastic, IIookean range. The nature of the fatigue cycle is therefore dependent upon whether it is maintained at a constant stress, strain or load amplitude. The term 'load fatigue' refers to tests where the load amplitude is maintained constant whilst stress and strain arc allowed to vary. Similarly, stress and strain fatigue are controlled off stress and strain res-,ectivaly whilst the other j garamcters are alioaad to vary. Typical inter-rolations of stress, strain and load for the three forms of test are illustrntcd in Fi@re 13.
'Static loads' are those wlzich are invAriable with time, whereas 'cyclic loads' are, as the term implies, variable with time. Unfortu- nately, ultimate tcnsilo strength values which are obtained from tests at a given stress or strain rate are sometimes refzrrod to in the literature as static properties, despite the fact that they 2ro produced under the application of incremental load, often appiied at different rates during the test.
'Ihe term *creep' is used to describe time-depondent strain, whi& may be produced by any ty?e of test. 'Zho most common form of troop is that Froduced by a static load at clcvatsd tcmpcratures and this may be tcrmcd 'static troop'. The creep which can take place in some forms of fatigue loading has been roferrcd to as either 'dynamic crocp' or 'cyclic creep' by other authors in order to distinguish it from 'static creep'. 'Ckwlative strain' is an alt oruativo term which is used here in ordor to be more specific and to avoid confusion botnccn the different forms of CrCOp at olovatod tcmpcratures which are associated with specific deforma- tion mechanisms. !I'hc simple definition of cumulative strain Liven in the test is the contcmTorary strain at maximw a~,qii.cd stross. This is a total strain which is composed of cl-~*+'n c+,Juul,, and $e:stlc components.
The 'strain range' is the diffaroncc between maximum and minimum strain in a given cycle. This term is usually used in the literature in proforenco to 'amplituds' :~hich is unod moro specifically as tho difforcnco botwoen zero and tho maximum or minimum v;llues.
In conventional fatihuo the cnduranco limit is the stress boiow which life is infinite. 'Cyclic c&uranca is used hcr2 to dcnotc the numbor of cycles to failure for a given stress. 'Time to faiiure' refers
- 23 -
to the number of hours, and 'endurance' is a general term for describing either time or cycles.
The term 'repeated tension' is used to describe the case of zero minimum load and a tensile maximum load, and fully reversed push-pull is the case where t:le tensile and compressive maxima are equal and opposite. Compressive stresses are negative in sign and tensile stresses are positive. The gush-pull stress ratio is the ratio of maximum compressive stress to maximum tensile stress. The mean stress is the stress midway between the respective stresses. For a mean stress of zero, the push- yul.1 stress ratio is -1, and for a mean stress equal to half the maximum te.naile stress (repeated tension) it is> 0. .
- 24 -
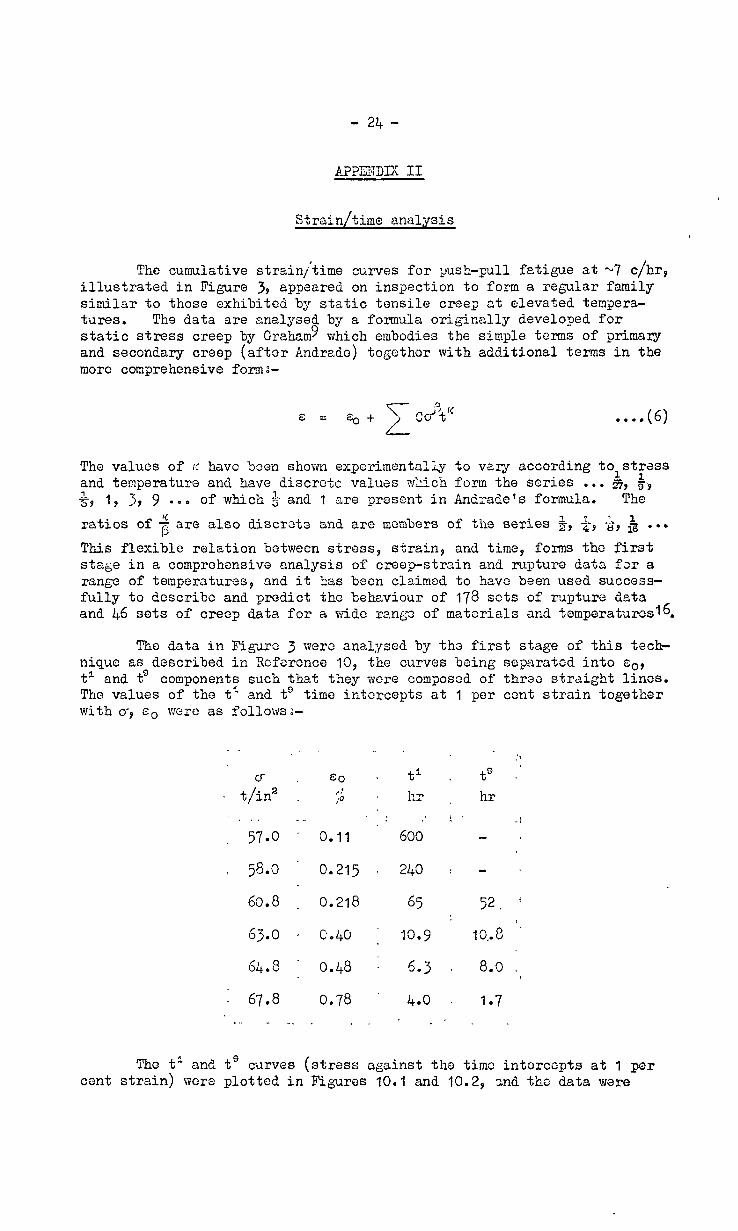
Strain/time analysis
The cumulative strainj'time curves for yush-pull fatigue at -7 c/hr, illustrated in Figure 39 appeared on inssection to form a regular family simiiar to those exhibited by static tensile creep at elevated tempera- tures. The data are analysed by a formula originally developed for static stress creep by Graham 9 which embodies the simple terms of primary and secondary creep (aftor Andredc) together with additional terms in the more comprehensive form:-
. ...(6)
The values of K havo boon shown experimentally to vary according tolstrass and temperature and have discrotc values which form the series ..* 5, $-? & -I9 3, 9 .00 of which 5 and 1 are present in Andrade's formula. The
ratios of 2 are also discroto and are mombers of the series $9 *p -b, $ .*.
This flexible relation between stress, strain, and time, forms tho first stage in a comprehensive analysis of creep-strain and rupture data for a range of temperatures, and it has beon claimed to havo been used success- fully to describe and predict the behaviour of 178 sets of ru@ure data and 46 sets of creep data for a wide ranga of materials and temperaturos 16.
The data in Figure 3 wer o analysed by the first stage of this tech- niquo as described in Roferonce 13, the curves being separatod into so9 t' and tg components such that they were composad of three str&ight lines. The values of the t' and tg time intercepts at 1 per cent strain together with o9 e. were as follows;-
. .-
CT . co - t/in2 . i;J
. . . 57.0 :- 0.11
, 58.0 . 0.215
60.8 _ 0.218
63.0 ’ co40
64.8 ’ 0.48
. 67.8 0.78
. 240 :
65
. 10.9
6.3
4.0 .
.‘s t” .j
hr
52. ’
lo,.8 ” 8.0 ,
1.7
The t1 and ts curve8 (stress against the timo intorcopts at 1 per cent strain) vv'cre plotted in Figures 10.1 and 10.2, and tho data were
- 25-
described by straight lines of slopes x close to -$ (Figure 10). 0 '
The
stresses were plotted against e. (Figure 10.3) and again the data could be described by a straight line, in this case of slope -A0 This curve was of course a section of the virgin stress/strain curve because each numerical value of e. was in fact the tensile strain reached in the first quarter cycle, there tension was always applied first.
The e/t curves were regenerated from the 'theoretical' Eo9 t1 and t9 time intercents from Figures 10.19 10.2 and lC.39 and were repreoented in Figure 11 as broken curves. The accuracy of this analysis may be estimated by comparing the closeness of ths respective experimental saints to the regenerated curves.
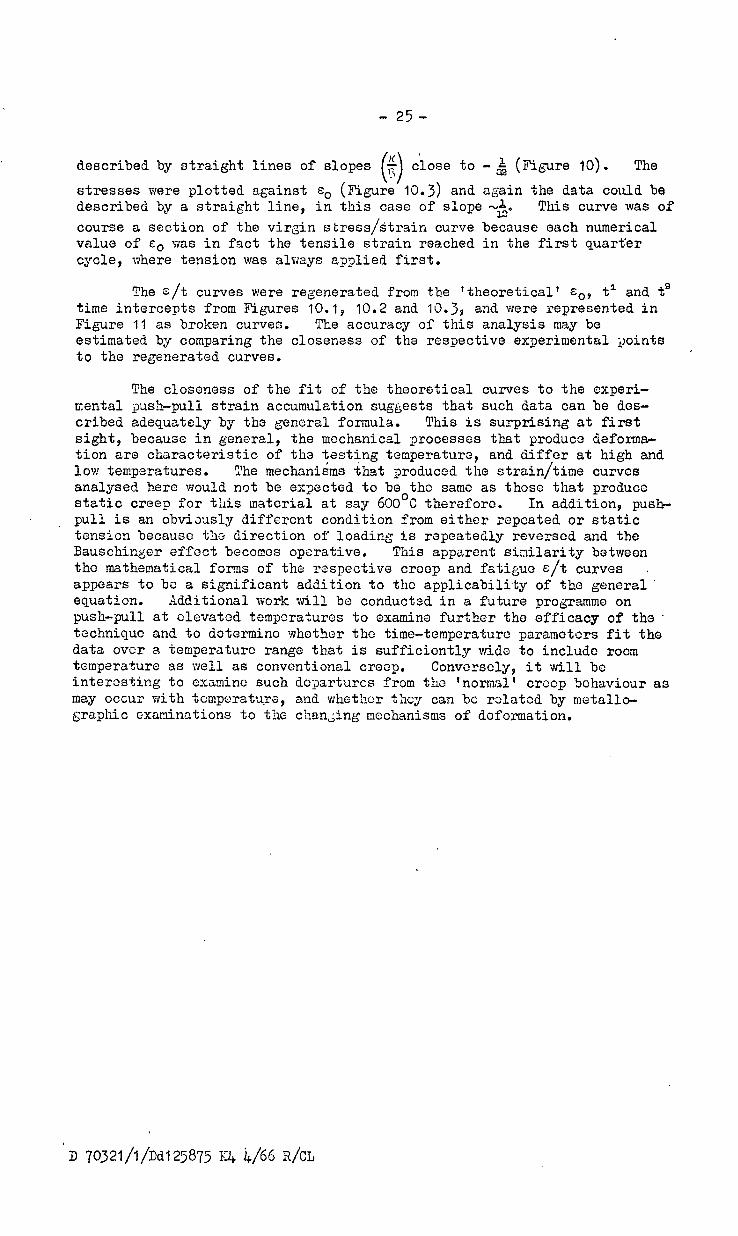
The closeness of the fit of the theoretical curves to the experi- mental gush-pull strain accumulation suggests that such data can be dcs- cribed adequately by the general formula. This is surprising at first sight, because in general, the mechanical processes that produce dsforma- tion are characteristic of the testing temperature, and diffor at high and low temperatures. The mechanisms that produced the strain/time curves analysed here would not be expected to be the same as those that produce static creep for this material at say 600'~ therefore. In addition, push-
. pull is an obviously different condition from either repeated or static tension because the direction of loading is repeatedly reversed and the Bauschinger effect becomes operative. This apparent similarity between the mathematical forms of the respective crocp and fatigue e/t curves + appears to bc a significant addition to the applicability of the general. equation. Additional work will be conducted in a future programme on push-pull at olevatcd temperatures to examine further the efficacy of the . tcchniquc and to determine whether the time-temperature paramotors fit the data over a temperature range that is sufficiently wido to include room temperature as well as conventional troop. Convcrscly, it will be interosting to examine such departures from the 'normal' crocp Sohaviour as may occur with tomporatura, and whether they can bc rolatod by metallo- graphic examinations to the chsn;ing mechanisms of doformation.
'D 70321/1/Dd125875 I$ i+/66 R/CL

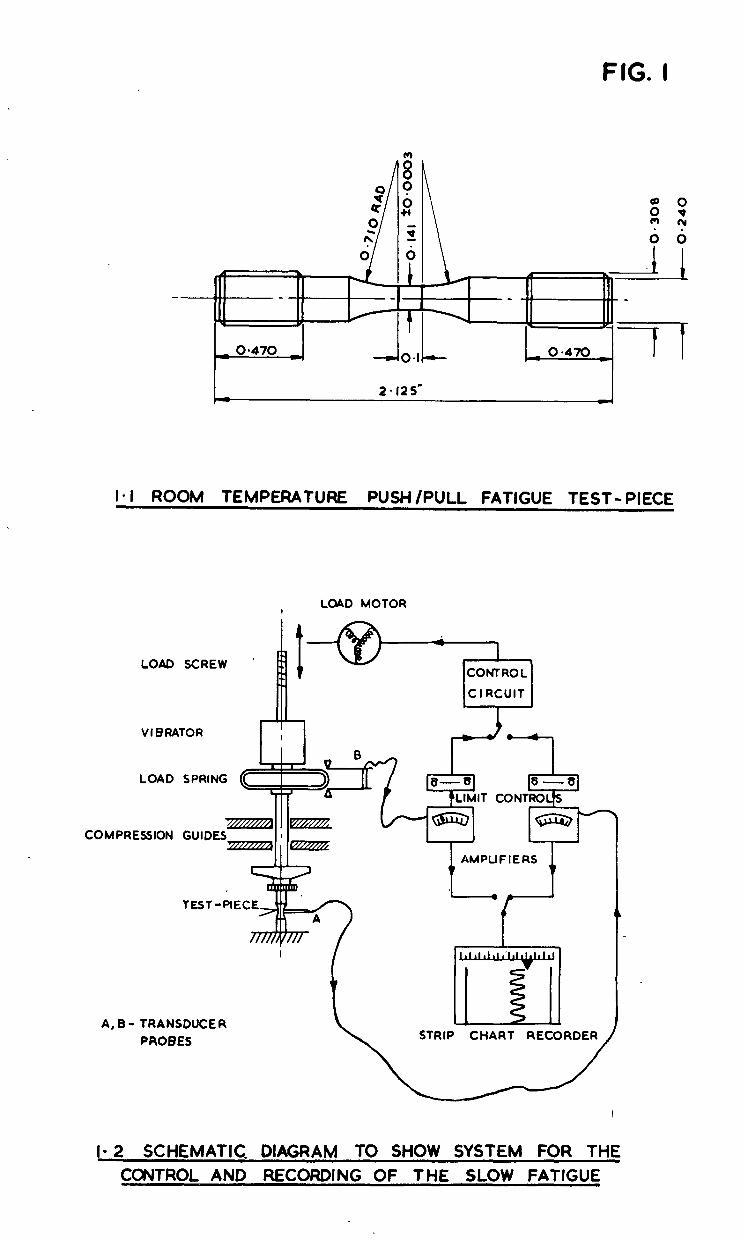
FIG. I
1.1 ROOM TEMPERATURE PUSH /PULL FATIGUE TEST- PIECE
LOAD MOTOR I
LOAD SCREW ’
II*
VI BRATOR
LOAD
COMPRESSION
r-l CONTROL
C I RCUIT
1 AMPUFIERS
A, B - TRANSDUCER
PROBES
I- 2 SCHEMATIC. DIAGRAM TO SHOW SYSTEM FOR THE CONTROL AND RECORDING OF THE SLOW FATIGUE
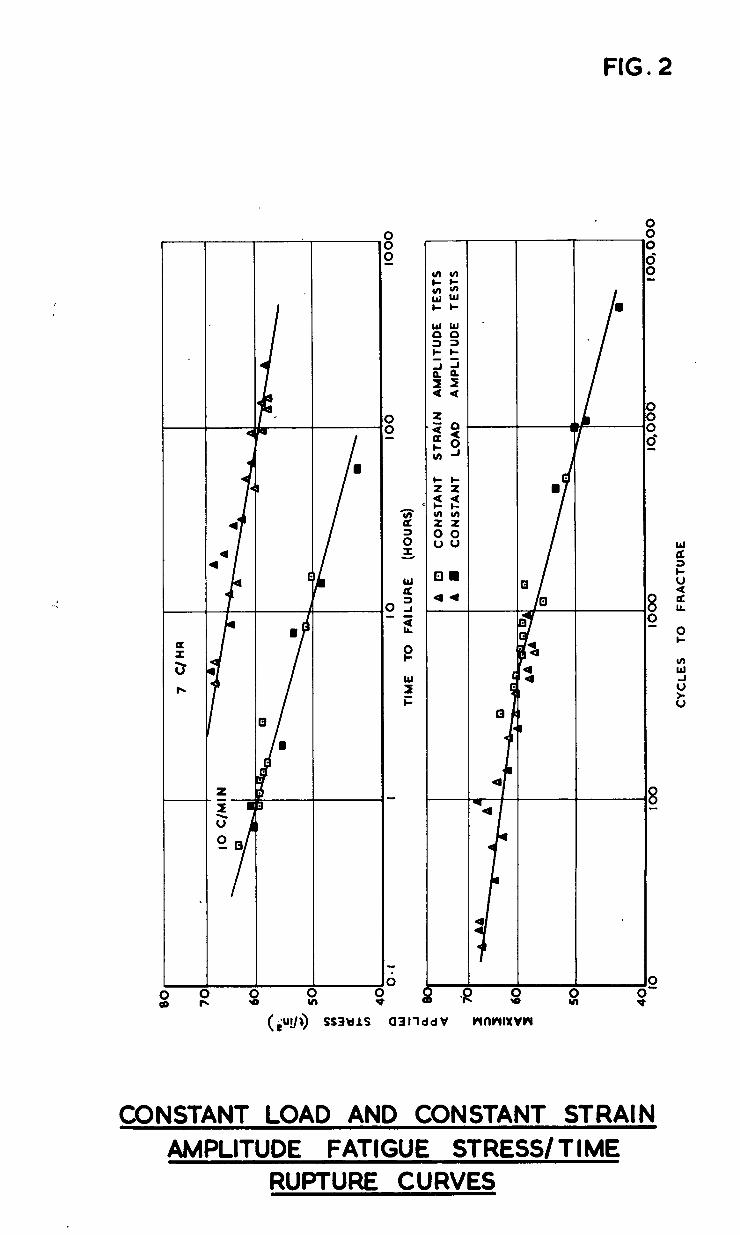
FIG. 2
I I I
I’
I 1 0 1% d
(;u!/Q SS3YlS 0317ddV WflWlXVW
CONSTANT LOAD AND CONSTANT STRAIN AMPLITUDE FATIGUE STRESS/TIME
RUPTURE CURVES
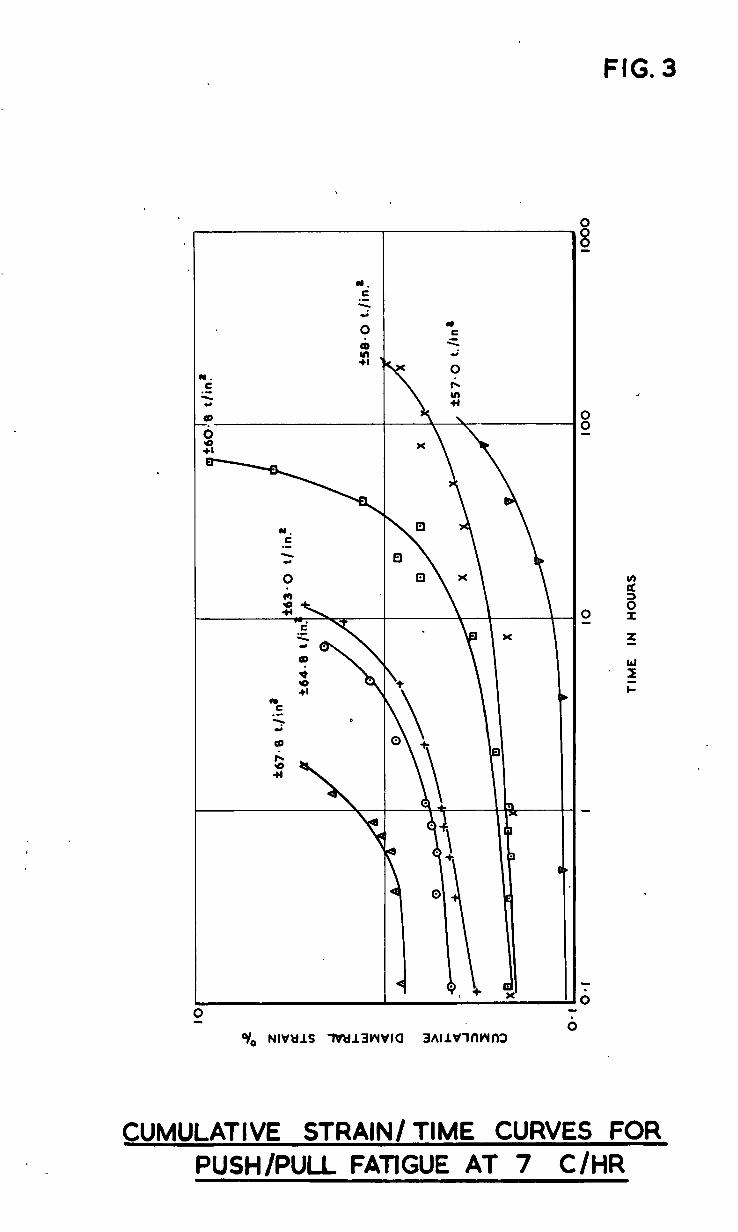
FIG. 3
q,, NIVtllS TVt313WVIO 3hllVlnWfl3
0
-8
-8
-0
l
CUMULATIVE STRAIN/ TIME CURVES FOR PUSH/PULL FAVGUE AT 7 C/HR
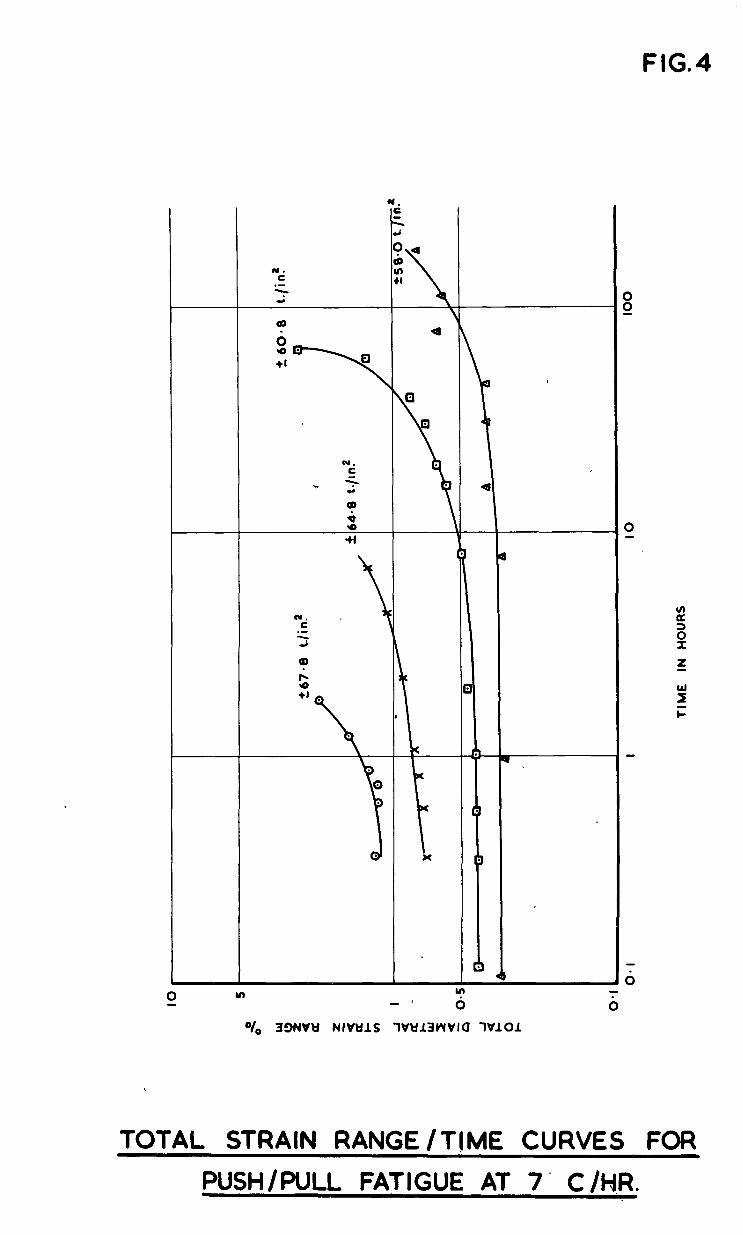
FIG.4
N. 1 c .- 3 OD
t x
Of0 39NVY NfVWlS 1Vtfl3bWVlU lVlO1
TOTAL STRAIN RANGE/TIME CURVES FOR
PUSH/PULL FATIGUE AT 7- C&R.
5
‘A 7 c /HR
‘A.,
’ NA \
’ .A .
5-i TOTAL STRAIN RUPTURE CURVES
NATURE OF FATIGUE
\ \
\ \
\ \ A
7 C/WI
A
?I A
\ A
A
5.2 PLASTIC STRi
-- A-- -4-e COnStand strain amplitude
-4-a- constant load amplitude
N RUPTURE CURVES
0 *O! IO IO0 1000 lOpOO
CYCLE5 TO FAILURE
!
TOTAL AND PLASTIC STRAIN/CYCLES
RUPTURE CURVES
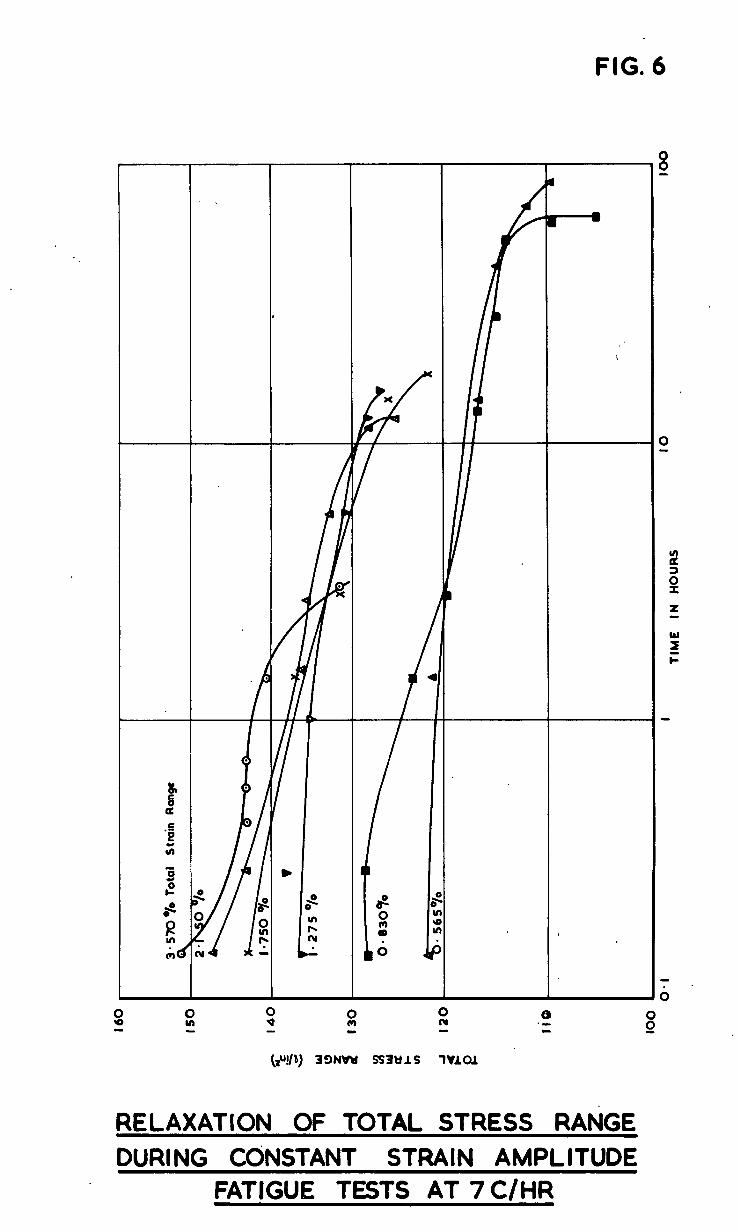
FIG. 6
RELAXATION OF TOTAL STRESS RANGE
DURING CONSTANT STRAIN AMPLITUDE FATIGUE TESTS AT 7C/HR
75
73
69
67
59
57
,
X
X
x .-
X X
PUSH ) PULL 1
X
X X 0
9 -m-----a- ----- - -PUSH I PULL-
,
PUSH e PULL
10 50 100 500 1000 CYCLES. TO FAILURE .
EFFECT OF VAdlATlON OF PUSH/PULL STRESS R’ATIO ON FATIGUE ENDURANCE
AT 7 CIHR.
I I a. I v I I
TIME IN HOURS
IO
. .
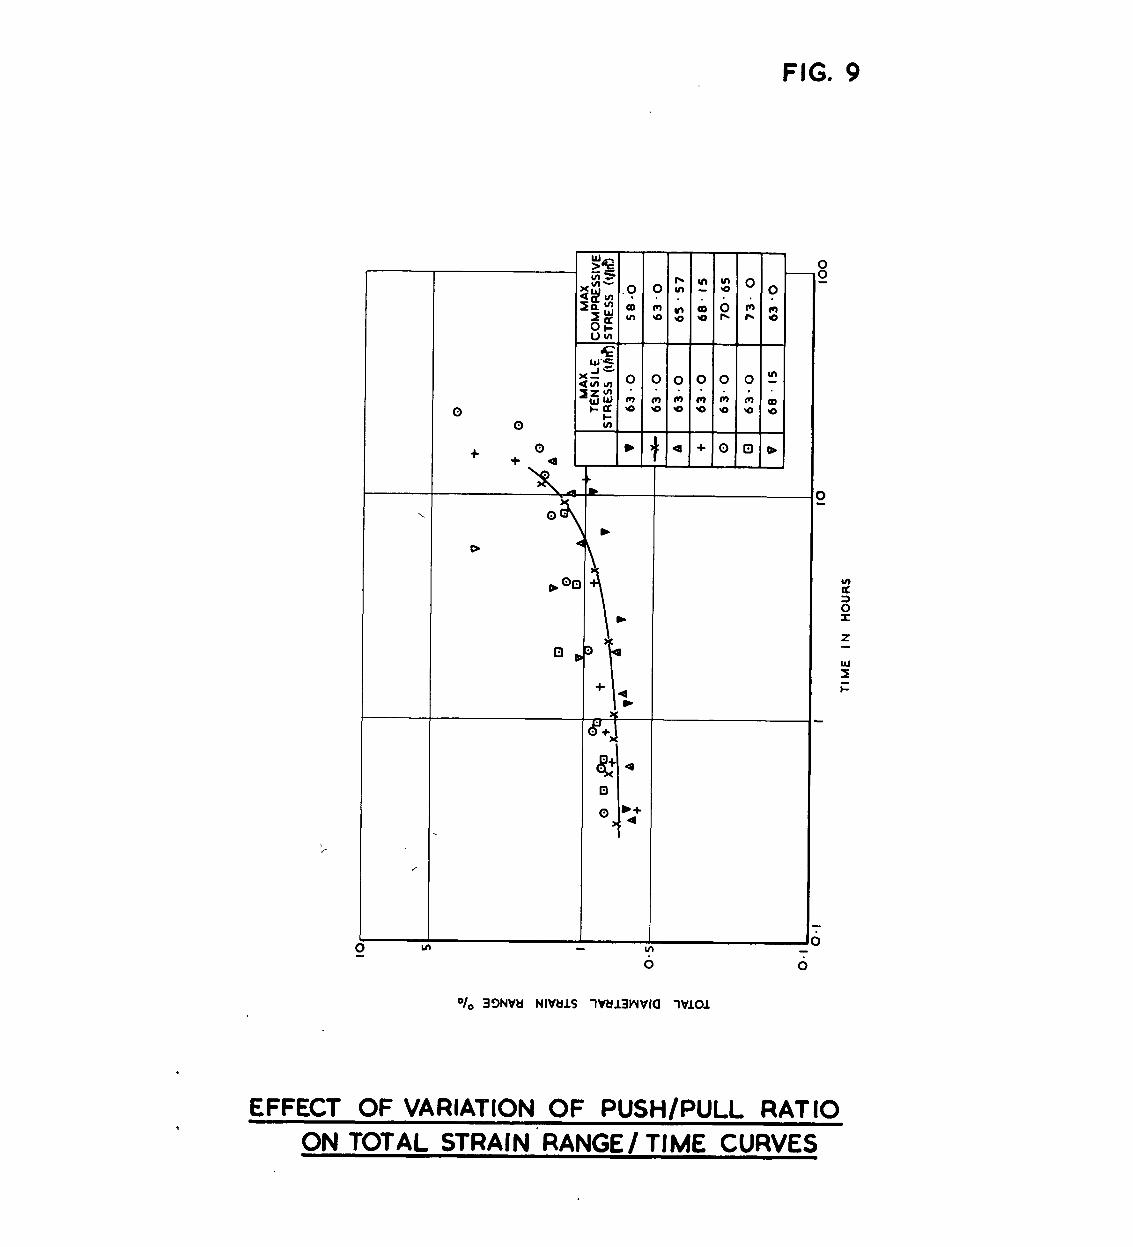
FIG. 9
-
0 0
+ +-O-a
-
I
- -
0
(3 rg
- I 0 t 0
s:
-
l
-
ä
ul s - 0
fz
-
+ -
z E -
0 r; ‘0
-
0
-
0
F-
-
0 .
m a
-
Q
3
0
3
-
In
s
m -
o/o 33NVU NIVULS lVU3yYVlCl lVlO1
EFFECT OF VARIATION OF PUSH/PULL RATIO ON TOTAL STRAIN ‘RANGE/ TIME CURVES
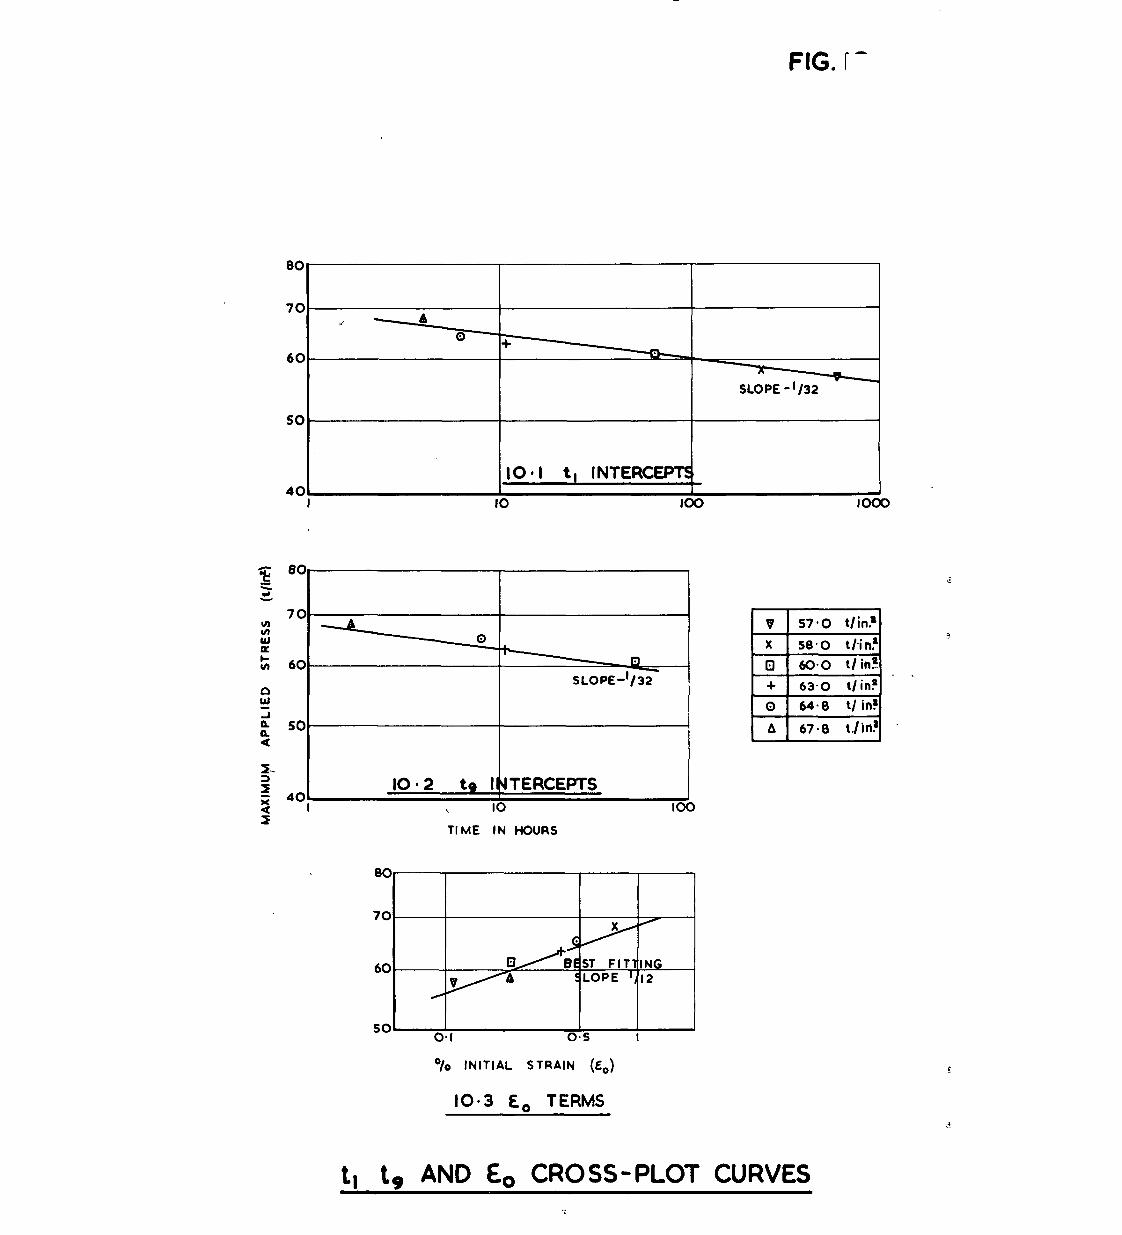
FIG. I-
60
- El SLOPE-l/32
5
z 40 IO.2 tg IIJTERCEPTS
I
z I \ IO IO0
TIME IN HOURS
00
60
so 0-I 0.5 I
O/o INITIAL STRAIN (&o)
IO.3 E, TERMS
t, tg AND E. CROSS-PLOT CURVES
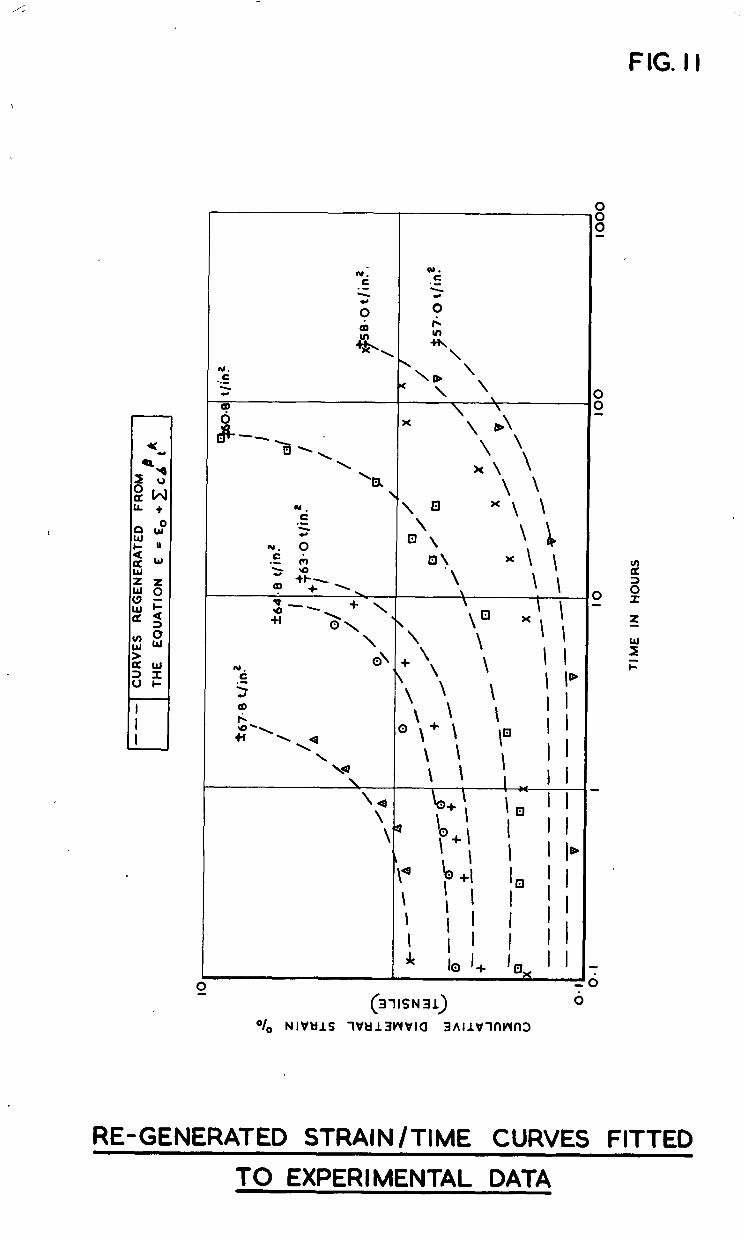
FIG. I l
(3llSN31) i
“10 NIVMlS lVkl13WVICl 3hllVl~W~3
RE-GENERATED STRAIN /TIME CURVES FITTED
TO EXPERIMENTAL DATA
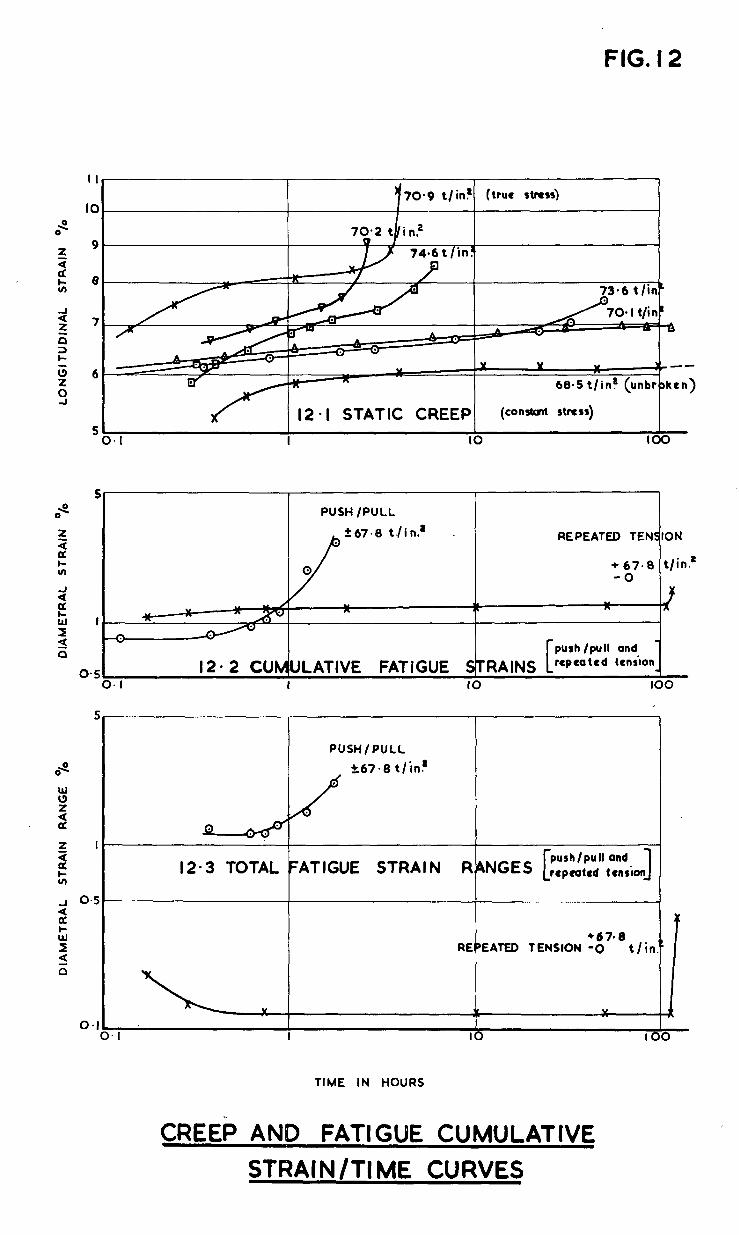
FIG. I2
I I r’70-9 t/in! ttrue stress~
IO
1 I2 - I STATIC CREEP1 (con- r-s)
I
0.5
PUSH /PULL
f67.0 t/in.’ . REPEATED TENSION
+ 67.8 t/in.’ -0
push /pull and
I2* 2 CUMULATIVE FATiGUE STRAINS repeated tension
1. I I IO IO0
12-3 TOTAL
PUSH/PULL
267.8 t/in?
6 l 67*8 RE EATED TENSION -0 t/in
1 ”
IO Ii
TIME IN HOURS
CREEP AND FATIGUE CUMULATIVE
STRAIN /TI ME CURVES
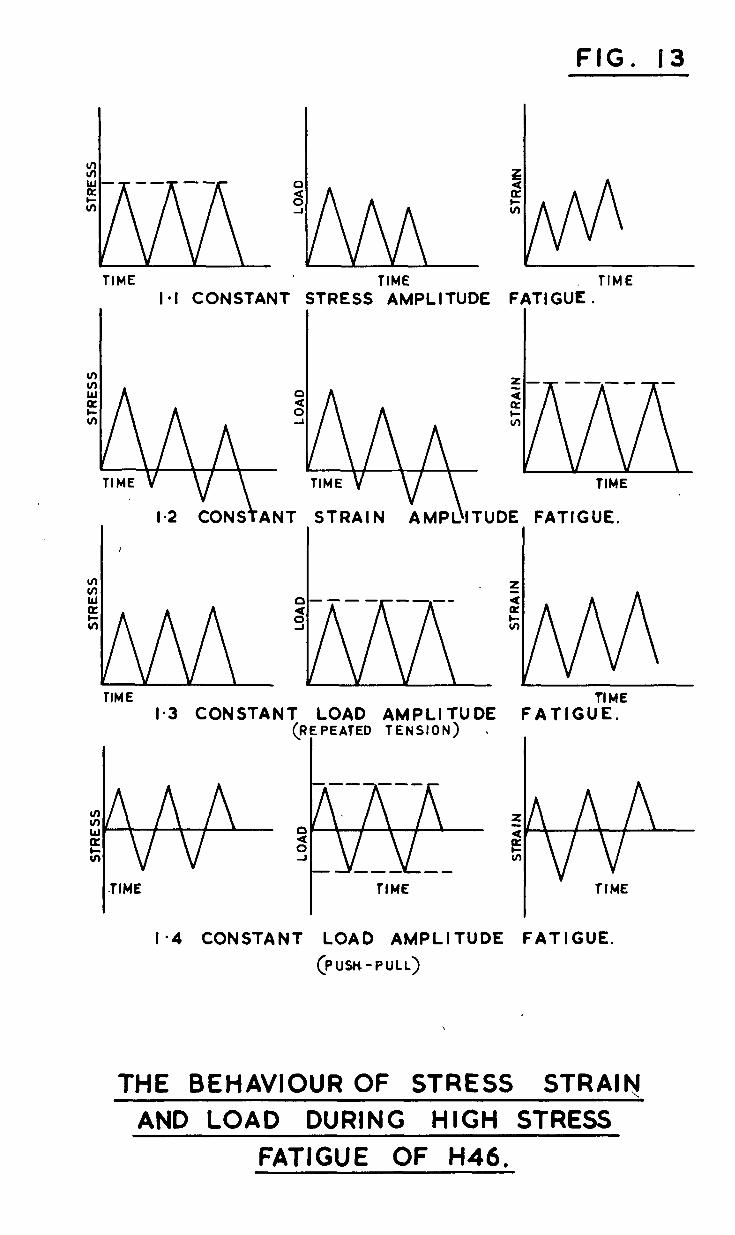
FIG. 13
TIME TIME CONSTANT STRESS AMPLITUDE
I.2 CONSTANT STRAIN AMPL\ITUDE
rTlGUi . TIME
FATIGUE.
l-3 CONSTANT LOAD AMPLITUDE FATIGUE. (REPEATED TENSION) \
I
l-4 CONSTANT LOAD AMPLITUDE FATIGUE.
(PUSH-PULL)
THE BEHAVIOUR OF STRESS STRAIM
AND LOAD DURING HIGH STRESS
FATIGUE OF H46.


C.P. No. 844
0 Crown copyright 1966
Printed and published by
HER MAJESTY’S STATIONERY OFFICE
To be purchased from 49 High Holborn, London w.c.1 423 Oxford Street, London w.1 13A Castle Street, Edinburgh 2
109 St. Mary Street, Cardrff Brazennose Street, Manchester 2
50 Fairfax Street, Bristol 1 35 Smallbrook, Ringway, Birmingham 5
80 Chichester Street, Belfast 1 or through any bookseller
Printed in England
C.P. No. 844
S.0 Code No 23-9016-44