Embed Size (px)
Citation preview
THE ROLE OF CONTACT-DEPENDENT GROWTH
INHIBITION TOXIN SYSTEMS IN BACTERIAL
COMPETITION AND BIOFILM DEVELOPMENT
Andrew David King
PhD
University of York
Biology
April 2015
Abstract
Contact-dependent growth inhibition (CDI) toxins are a recently identified family of polymor-
phic toxins, initially found in Escherichia coli. CDI toxins are found widely spread in Gram-
negative bacterial species, including pathogenic strains, and have been shown to possess a
wide range of toxin types which are effective against other bacteria.
This research shows that the E. coli EC93 CDI system confers a competitive advantage on
bacteria growing in multi strain biofilms with susceptible bacteria. This advantage is due to
two factors, firstly the EC93 CDI toxin was shown to be capable of inhibiting the growth of
susceptible bacteria in a biofilm and secondly the conserved region of the EC93 CdiA protein
was found to increase the rate of biofilm formation.
Analysis of the effects of the EC93 and EC869o11 CDI toxins at the single cell level showed
that different classes of CDI toxins can act at different rates and with varying degrees of re-
versibility. Understanding the variable impact of CDI toxins, in concert with CDI’s role in
enhancing biofilm formation, aids our understanding of bacterial competition in the natural
environment.
2
Contents
Page
Abstract 2
Table of Contents 7
List of Tables 8
List of Figures 10
List of Accompanying Material 11
Acknowledgments 12
Author’s Declaration 13
1 Introduction 14
1.1 Microbial communities . . . . . . . . . . . . . . . . . . . . . . . . . . . . . . . . . . . . . . . . . . 14
1.2 Bacterial biofilms . . . . . . . . . . . . . . . . . . . . . . . . . . . . . . . . . . . . . . . . . . . . . . 14
1.2.1 Role of biofilms in pathogenesis . . . . . . . . . . . . . . . . . . . . . . . . . . . . . . 17
1.3 Eschericia coli biofilms . . . . . . . . . . . . . . . . . . . . . . . . . . . . . . . . . . . . . . . . . . 18
1.4 Biofilm analysis techniques . . . . . . . . . . . . . . . . . . . . . . . . . . . . . . . . . . . . . . . 20
1.5 The role of contact dependent interactions in the action of bacterial toxins . . . . 21
1.5.1 Contact dependent toxin systems . . . . . . . . . . . . . . . . . . . . . . . . . . . . . 22
1.5.2 Contact-dependent growth inhibition toxins . . . . . . . . . . . . . . . . . . . . . 25
1.5.3 CDI species and strain distribution . . . . . . . . . . . . . . . . . . . . . . . . . . . . 25
1.5.4 Classes of CDI toxin . . . . . . . . . . . . . . . . . . . . . . . . . . . . . . . . . . . . . . . 26
1.5.5 Toxin delivery mechanisms of CDI . . . . . . . . . . . . . . . . . . . . . . . . . . . . 27
1.5.6 Orphan CDI toxin tips . . . . . . . . . . . . . . . . . . . . . . . . . . . . . . . . . . . . . 30
1.6 Bacterial competition in biofilms . . . . . . . . . . . . . . . . . . . . . . . . . . . . . . . . . . . 30
1.7 Hypothesis and Aims . . . . . . . . . . . . . . . . . . . . . . . . . . . . . . . . . . . . . . . . . . . 31
2 Methods 32
2.1 Chemicals and media . . . . . . . . . . . . . . . . . . . . . . . . . . . . . . . . . . . . . . . . . . . 32
3
2.2 General culture techniques . . . . . . . . . . . . . . . . . . . . . . . . . . . . . . . . . . . . . . . 32
2.2.1 Bacterial strains and growth conditions . . . . . . . . . . . . . . . . . . . . . . . . . 32
2.2.2 Strain storage and revival . . . . . . . . . . . . . . . . . . . . . . . . . . . . . . . . . . . 33
2.2.3 Antibiotics . . . . . . . . . . . . . . . . . . . . . . . . . . . . . . . . . . . . . . . . . . . . . . 33
2.2.4 Optical density measurement . . . . . . . . . . . . . . . . . . . . . . . . . . . . . . . . 33
2.3 Molecular Biology . . . . . . . . . . . . . . . . . . . . . . . . . . . . . . . . . . . . . . . . . . . . . . 33
2.3.1 Polymerase chain reaction (PCR) . . . . . . . . . . . . . . . . . . . . . . . . . . . . . 33
2.3.2 Restriction digests . . . . . . . . . . . . . . . . . . . . . . . . . . . . . . . . . . . . . . . . 34
2.3.3 Agarose gel electrophoresis . . . . . . . . . . . . . . . . . . . . . . . . . . . . . . . . . . 34
2.3.4 Band excision and DNA extraction . . . . . . . . . . . . . . . . . . . . . . . . . . . . 34
2.3.5 DNA ligation . . . . . . . . . . . . . . . . . . . . . . . . . . . . . . . . . . . . . . . . . . . . 35
2.3.6 Drop dialysis . . . . . . . . . . . . . . . . . . . . . . . . . . . . . . . . . . . . . . . . . . . . 35
2.3.7 Competent cell generation . . . . . . . . . . . . . . . . . . . . . . . . . . . . . . . . . . 35
2.3.8 Classic electrocompetent cell preparation . . . . . . . . . . . . . . . . . . . . . . . 35
2.3.9 Density step electro competent cell preparation . . . . . . . . . . . . . . . . . . 36
2.3.10 Quick electro competent cell preparation . . . . . . . . . . . . . . . . . . . . . . . 36
2.3.11 Electroporation . . . . . . . . . . . . . . . . . . . . . . . . . . . . . . . . . . . . . . . . . . 36
2.3.12 Quick transformation . . . . . . . . . . . . . . . . . . . . . . . . . . . . . . . . . . . . . . 37
2.3.13 DNA purification . . . . . . . . . . . . . . . . . . . . . . . . . . . . . . . . . . . . . . . . . 37
2.3.14 Genomic DNA purification . . . . . . . . . . . . . . . . . . . . . . . . . . . . . . . . . . 37
2.3.15 Plasmid DNA purification . . . . . . . . . . . . . . . . . . . . . . . . . . . . . . . . . . . 37
2.3.16 PCR purification . . . . . . . . . . . . . . . . . . . . . . . . . . . . . . . . . . . . . . . . . 37
2.3.17 Concentration of DNA . . . . . . . . . . . . . . . . . . . . . . . . . . . . . . . . . . . . . 37
2.3.18 Determining DNA concentration . . . . . . . . . . . . . . . . . . . . . . . . . . . . . 37
2.3.19 Genomic integration . . . . . . . . . . . . . . . . . . . . . . . . . . . . . . . . . . . . . . 38
2.3.20 CRIM protocol . . . . . . . . . . . . . . . . . . . . . . . . . . . . . . . . . . . . . . . . . . . 38
2.3.21 Lambda Red protocol . . . . . . . . . . . . . . . . . . . . . . . . . . . . . . . . . . . . . . 38
2.4 Single cell analysis . . . . . . . . . . . . . . . . . . . . . . . . . . . . . . . . . . . . . . . . . . . . . 38
2.4.1 Cell growth conditions . . . . . . . . . . . . . . . . . . . . . . . . . . . . . . . . . . . . . 38
2.4.2 CDI Planktonic competition assay . . . . . . . . . . . . . . . . . . . . . . . . . . . . 39
2.4.3 Casting of agarose pads . . . . . . . . . . . . . . . . . . . . . . . . . . . . . . . . . . . . 39
2.4.4 Microscopy . . . . . . . . . . . . . . . . . . . . . . . . . . . . . . . . . . . . . . . . . . . . . 40
2.4.5 Image analysis . . . . . . . . . . . . . . . . . . . . . . . . . . . . . . . . . . . . . . . . . . . 40
2.5 Initial biofilm flow cell protocol . . . . . . . . . . . . . . . . . . . . . . . . . . . . . . . . . . . . 44
2.5.1 Cell growth conditions . . . . . . . . . . . . . . . . . . . . . . . . . . . . . . . . . . . . . 44
2.5.2 Flow cell assembly . . . . . . . . . . . . . . . . . . . . . . . . . . . . . . . . . . . . . . . . 44
2.5.3 Initial flow cell growth and imaging . . . . . . . . . . . . . . . . . . . . . . . . . . . . 45
4
2.6 Second biofilm flow cell protocol . . . . . . . . . . . . . . . . . . . . . . . . . . . . . . . . . . . 46
2.6.1 Cell growth conditions . . . . . . . . . . . . . . . . . . . . . . . . . . . . . . . . . . . . . 46
2.6.2 Flow cell assembly . . . . . . . . . . . . . . . . . . . . . . . . . . . . . . . . . . . . . . . . 46
2.6.3 Flow cell growth and imaging . . . . . . . . . . . . . . . . . . . . . . . . . . . . . . . . 47
2.6.4 Flow cell growth and time-lapse imaging . . . . . . . . . . . . . . . . . . . . . . . . 48
3 Single cell analysis method development 50
3.1 Introduction . . . . . . . . . . . . . . . . . . . . . . . . . . . . . . . . . . . . . . . . . . . . . . . . . . 50
3.2 Single cell image analysis . . . . . . . . . . . . . . . . . . . . . . . . . . . . . . . . . . . . . . . . 50
3.2.1 Survey of software options for analysis single cell level bacterial images . 50
3.2.2 Identification of software solutions for lineage tracking and analysis . . . 55
3.3 Bacterial sample preparation for single cell image acquisition . . . . . . . . . . . . . . 57
3.4 Identification and implementation of microscopy platform for single cell analysis 64
3.4.1 Development of microscopy setup . . . . . . . . . . . . . . . . . . . . . . . . . . . . 64
3.4.2 Final microscopy set up . . . . . . . . . . . . . . . . . . . . . . . . . . . . . . . . . . . . 66
4 Effect of EC93 toxin on target cells at the single cell level 69
4.1 Introduction . . . . . . . . . . . . . . . . . . . . . . . . . . . . . . . . . . . . . . . . . . . . . . . . . . 69
4.2 Strain generation . . . . . . . . . . . . . . . . . . . . . . . . . . . . . . . . . . . . . . . . . . . . . . 69
4.3 Ec93 strain background does not itself affect growth of target strain . . . . . . . . . 70
4.4 Uniform microcolony growth . . . . . . . . . . . . . . . . . . . . . . . . . . . . . . . . . . . . . 71
4.5 Inhibition prior to cell monolayer growth is not detectable . . . . . . . . . . . . . . . 71
4.6 Assessment of EC93 toxin effect . . . . . . . . . . . . . . . . . . . . . . . . . . . . . . . . . . . . 74
4.6.1 Rationale for choice of fields to be collected and assessed . . . . . . . . . . . 74
4.6.2 Toxin effect occurs in two stages . . . . . . . . . . . . . . . . . . . . . . . . . . . . . . 75
4.7 EC93 CDI growth inhibition effect is entirely contact dependent . . . . . . . . . . . 79
4.8 Effect of EC93 toxin on bacterial morphology . . . . . . . . . . . . . . . . . . . . . . . . . . 79
4.9 Escape from growth inhibition possible if contact broken . . . . . . . . . . . . . . . . . 80
4.10 Conclusion and Discussion . . . . . . . . . . . . . . . . . . . . . . . . . . . . . . . . . . . . . . . 81
5 Effect of EC93 toxin on competition and adhesion during biofilm growth 85
5.1 Introduction . . . . . . . . . . . . . . . . . . . . . . . . . . . . . . . . . . . . . . . . . . . . . . . . . . 85
5.2 Development of flow cell protocol . . . . . . . . . . . . . . . . . . . . . . . . . . . . . . . . . . 85
5.2.1 Generation of strains expressing fluorescent proteins for confocal analysis 85
5.2.2 Flowcell seeding and growth conditions . . . . . . . . . . . . . . . . . . . . . . . . 88
5.2.3 Flow cell design and set up . . . . . . . . . . . . . . . . . . . . . . . . . . . . . . . . . . 91
5.2.4 Confocal z stack data analysis . . . . . . . . . . . . . . . . . . . . . . . . . . . . . . . . 91
5.3 Effect of CDI on competition between coseeded target and inhibitor cells . . . . . 93
5
5.3.1 Cogrowth of target and inhibitor cells occurs initially . . . . . . . . . . . . . . . 93
5.3.2 Ec93 CDI toxin increases strains competitive effectiveness in a biofilm . . 94
5.3.3 Ec93 toxin action alone impacts on biofilm competitive effectiveness . . . 96
5.3.4 Time lapse analysis of competition . . . . . . . . . . . . . . . . . . . . . . . . . . . . 96
5.4 Effect of EC93 CDI system on biofilm formation . . . . . . . . . . . . . . . . . . . . . . . . 98
5.4.1 Deletion of CDI system leads to changes in biofilm robustness . . . . . . . . 98
5.4.2 Hypermotiility modulation of biofilm formation in deletion mutants . . . 101
5.4.3 Conserved CdiA region is sufficent to confer robust biofilm formation . . 101
5.4.4 EC93 effect on adhesion is not sufficent to allow cell capture . . . . . . . . . 106
5.5 Conclusion and Discussion . . . . . . . . . . . . . . . . . . . . . . . . . . . . . . . . . . . . . . . 106
6 Effect of EC869o11 toxin on target cells at the single cell level 111
6.1 Introduction . . . . . . . . . . . . . . . . . . . . . . . . . . . . . . . . . . . . . . . . . . . . . . . . . . 111
6.2 Analysis of the time course of inhibition . . . . . . . . . . . . . . . . . . . . . . . . . . . . . 111
6.2.1 Effect of EC869o11 toxin on cell growth rate and morphology . . . . . . . . . 112
6.2.2 Toxin action appears to be irreversible . . . . . . . . . . . . . . . . . . . . . . . . . 118
6.3 Effect of EC869o11 nuclease expression on nucleoid . . . . . . . . . . . . . . . . . . . . 118
6.3.1 Abnormal nucleoid morphology apparent in intoxicated cells in phase
images . . . . . . . . . . . . . . . . . . . . . . . . . . . . . . . . . . . . . . . . . . . . . . . . . 119
6.3.2 Determination of suitable observation parameters for nucleoid visuali-
sation by DAPI in live cells . . . . . . . . . . . . . . . . . . . . . . . . . . . . . . . . . . 119
6.3.3 EC869o11 induced changes in phase images correlate with DNA location 123
6.4 Conclusion and Discussion . . . . . . . . . . . . . . . . . . . . . . . . . . . . . . . . . . . . . . . 123
7 Discussion 127
7.1 Introduction . . . . . . . . . . . . . . . . . . . . . . . . . . . . . . . . . . . . . . . . . . . . . . . . . . 127
7.2 Effect of the EC93 CDI toxin system on growth within a biofilm . . . . . . . . . . . . . 127
7.2.1 Effect of toxin on biofilm competition . . . . . . . . . . . . . . . . . . . . . . . . . . 127
7.2.2 EC93 CDI system aids the formation of biofilms . . . . . . . . . . . . . . . . . . 130
7.3 Different toxin modes of action lead to a range of inhibition phenotypes at the
single cell level . . . . . . . . . . . . . . . . . . . . . . . . . . . . . . . . . . . . . . . . . . . . . . . . 132
7.3.1 Time course of growth inhibition . . . . . . . . . . . . . . . . . . . . . . . . . . . . . 132
7.3.2 Reversibility of toxin action . . . . . . . . . . . . . . . . . . . . . . . . . . . . . . . . . . 132
7.3.3 Toxin induced changed in cell morphology . . . . . . . . . . . . . . . . . . . . . . 133
7.3.4 Comparison of single cell and planktonic analysis . . . . . . . . . . . . . . . . . 134
7.4 Role for CDI toxins in nature . . . . . . . . . . . . . . . . . . . . . . . . . . . . . . . . . . . . . . 135
7.4.1 Alternate roles other than competition . . . . . . . . . . . . . . . . . . . . . . . . . 137
7.5 Future work . . . . . . . . . . . . . . . . . . . . . . . . . . . . . . . . . . . . . . . . . . . . . . . . . . 137
6

7.6 Conclusion . . . . . . . . . . . . . . . . . . . . . . . . . . . . . . . . . . . . . . . . . . . . . . . . . . . 138
Appendices 139
A Table of E. coli Strains used in this study 139
B Table of Plasmids used in this study 142
C Table of Oligonucleotides used in this study 144
D Final flow cell design 146
Abbreviations 147
References 149
7
List of Tables
Table Page
1 Single cell microscopy equipment . . . . . . . . . . . . . . . . . . . . . . . . . . . . . . . . . . 41
2 MicrobeTracker processing parameters . . . . . . . . . . . . . . . . . . . . . . . . . . . . . . 43
A1 ... Table of Strains used in this study . . . . . . . . . . . . . . . . . . . . . . . . . . . . . . . . . . 139
A2 ... Table of Plasmids used in this study . . . . . . . . . . . . . . . . . . . . . . . . . . . . . . . . . 142
A3 ... Table of Oligonucleotides used in this study . . . . . . . . . . . . . . . . . . . . . . . . . . . 144
8
List of Figures
Figure Page
1 Stages of biofilm growth . . . . . . . . . . . . . . . . . . . . . . . . . . . . . . . . . . . . . . . . . 16
2 Current model of EC93 CDI toxin action . . . . . . . . . . . . . . . . . . . . . . . . . . . . . 29
3 Stages of computerised cell outline assignment using MicrobeTracker software . 54
4 Effect of agar pad desiccation on E. coli . . . . . . . . . . . . . . . . . . . . . . . . . . . . . . 59
5 Comparison of the effects of different experimental conditions on image seg-
mentation by MicrobeTracker software . . . . . . . . . . . . . . . . . . . . . . . . . . . . . . 62
6 Microscopy set up for time-lapse imaging acquisition . . . . . . . . . . . . . . . . . . . 63
7 Schematic showing the analysis workflow for quantifying the effect of CDI toxins
at the single cell level . . . . . . . . . . . . . . . . . . . . . . . . . . . . . . . . . . . . . . . . . . . 68
8 Single cell level measurement of EC93 CDI toxin effect on K12 F+ E. coli growth
rate . . . . . . . . . . . . . . . . . . . . . . . . . . . . . . . . . . . . . . . . . . . . . . . . . . . . . . . . 72
9 Single cell growth, division and ’birth’ plots shows a characteristic sawtooth profile 73
10 Comparison of K12 F+ single cell growth curves with and without contact with
EC93 wild type cells . . . . . . . . . . . . . . . . . . . . . . . . . . . . . . . . . . . . . . . . . . . . 77
11 Growth inhibitory effect of EC93 CDI toxin does not occur immediately . . . . . . 78
12 K12 F+ cells which break contact with EC93 wild type cells due to cell division
can escape growth inhibition . . . . . . . . . . . . . . . . . . . . . . . . . . . . . . . . . . . . . . 82
13 Schematic showing idealised outcome of K12 F+ cell growth breaking contact
with EC93 CDI toxin expressing cells . . . . . . . . . . . . . . . . . . . . . . . . . . . . . . . . 83
14 Schematic showing the organisation of the wild type cdiA region and down-
stream sequence . . . . . . . . . . . . . . . . . . . . . . . . . . . . . . . . . . . . . . . . . . . . . . . 86
15 Inoculation density effects on competition outcomes in flow-cell biofilms . . . . 89
16 Label free imaging using confocal reflection microscopy . . . . . . . . . . . . . . . . . 90
17 EC93 CDI effect on competition within a biofilm . . . . . . . . . . . . . . . . . . . . . . . 95
18 Ec93 CDI toxin effect on competition within a biofilm . . . . . . . . . . . . . . . . . . . 97
19 Confocal time lapse of EC93 wild type and K12 F+ cogrowth in a flowcell biofilm 99
9
Figure Page
20 Packing density of bacterial cells is altered by CdiA expression . . . . . . . . . . . . . 100
21 Expression of EC93 CdiA increase the level of single strain biofilm formation . . . 102
22 Quantification of the effect of hypermotility on EC93 CdiA conserved region
mediated biofilm formation . . . . . . . . . . . . . . . . . . . . . . . . . . . . . . . . . . . . . . 103
23 Effect of hypermotility on EC93 CdiA conserved region mediated biofilm forma-
tion . . . . . . . . . . . . . . . . . . . . . . . . . . . . . . . . . . . . . . . . . . . . . . . . . . . . . . . . 104
24 Conserved region of EC93 CdiA aids biofilm formation independent of CdiA CT
toxin tip . . . . . . . . . . . . . . . . . . . . . . . . . . . . . . . . . . . . . . . . . . . . . . . . . . . . . 105
25 Effect of EC93 CDI and BamA expression on cell interactions with EC93 wild
type biofilm . . . . . . . . . . . . . . . . . . . . . . . . . . . . . . . . . . . . . . . . . . . . . . . . . . 107
26 Quantification of the interaction of EC93 wild type strains with self and mutant
strains . . . . . . . . . . . . . . . . . . . . . . . . . . . . . . . . . . . . . . . . . . . . . . . . . . . . . . 108
27 Schematic of EC869o11 / EC93 chimera . . . . . . . . . . . . . . . . . . . . . . . . . . . . . . 113
28 Comparison of K12 F+ single cell growth curves with and without contact with
EC869o11 toxin . . . . . . . . . . . . . . . . . . . . . . . . . . . . . . . . . . . . . . . . . . . . . . . . 114
29 Effect of contact with cells expressing EC869o11 on K12 F+ E. coli growth rate . . 115
30 EC869 o11 toxin induced changes in phase contrast density of K12 F+ cells . . . . 117
31 Phase contrast imaging of K12 F+ E. coli shows patterning inside cells as micro-
colony growth occurs . . . . . . . . . . . . . . . . . . . . . . . . . . . . . . . . . . . . . . . . . . . 120
32 Identification of nucleoid position by plotting grayscale values . . . . . . . . . . . . . 121
33 Comparison of phase contrast patterning of E. coli cells . . . . . . . . . . . . . . . . . . 124
34 EC93 CDI system aids biofilm formation . . . . . . . . . . . . . . . . . . . . . . . . . . . . . 131
35 Scenarios illustrating different outcomes of competition caused by toxins acting
at different rates . . . . . . . . . . . . . . . . . . . . . . . . . . . . . . . . . . . . . . . . . . . . . . . 136
A1.....Final flowcell design . . . . . . . . . . . . . . . . . . . . . . . . . . . . . . . . . . . . . . . . . . . . 146
10
List of Accompanying Material
One (1) DVD containing two (2) video files of phase contrast video microscopy. Each video
file is of the same image series, one provided in .avi format (for Windows PC’s) and one in
.mov format (for OSX PC’s). This video shows E. coli bacteria after 9 hours of flow cell growth,
illustrating the extent of biofilm growth and the presence of free cells moving with the flow
of media (images acquired at 100msec between frames, 100 frames shown). This material is
referenced in section 5.2.4.
11
Acknowledgments
I would like to thank my supervisor Marjan van der Woude for all of her support, encourage-
ment and inspiration throughout the course of my PhD. I would also like to thank the members
of the van der Woude lab for their help and camaraderie. Thanks are also due to the staff of the
Technology Facility imaging staff for technical advice and troubleshooting discussions around
the microscopy based part of my PhD. I would also like to thank my TAP committee members,
James Chong and Paul Pryor, for useful discussions and advice throughout the course of my
PhD.
Thanks to David Low and Christopher Hayes (University of California) for providing CDI
strains and plasmids from their labs. In particular thanks to Stephanie Aoki and Zachary Ruhe
for supplying CDI strains and Kiel Nikolakakis for supplying CDI cosmids. Thanks to Zachary
Ruhe for sharing of his prepublication results and useful discussions with regards to CDI’s role
in cellular adhesion.
Most of all I would like to thank my wife Gill for her patience and understanding as her
husband became a student again. Finally a thank you to my daughter Rachel for understanding
that Dad’s bugs sometimes needed him to be in the lab through the night.
This research was funded by a BBSRC PhD studentship.
12

Author’s Declaration
The work presented in this thesis is entirely my own except for the following items. Sequencing
analysis which was performed by the Technology Facility (Department of Biology, University
of York). Planktonic assay data on EC93 adhesion which is referred to in the discussion of my
results in Chapter 5, which was the work of Zachary Ruhe. Flow cell design was performed in
collaboration with Mark Bentley (Workshop Manager, Department of Biology, University of
York). This work has not been submitted for examination at this or any other institution for
another award.
13
Chapter 1
Introduction
1.1 Microbial communities
Whilst a tremendous body of knowledge has been obtained using the classic bacteriology tech-
niques of single strain planktonic cultures this situation is vastly different to the environment
experienced outside the laboratory. Much as the traditional view of bacteria as a featureless
cytoplasmic bag has been revised to capture the intricate structures within cells (Kerfeld et al.,
2010; Yao et al., 2014), so the view of bacteria as existing always as individuals responding to
only their own needs has given way to at least some aspects of multicellularity (Shapiro, 1988).
Part of the reason that social responses were not widely studied is that adaption of strains to
the laboratory often leads to loss of social features / behavior’s in the ’domesticated’ bacteria.
Examples of multi cellular behaviour in bacteria extend across a wide range of species and
encompass a variety of degrees of complexity (Claessen et al., 2014). This can be seen in the
germination of Streptomyces spores where program celled death and differentiation of cell
types coordinate to maximise spore production and spreading at times of stress.
Perhaps the most wide spread and medically relevant behaviour is that of bacteria to form
biofilms, a community of bacteria adhered to a surface embedded in a self expressed polymeric
matrix composed of components such as polysaccharides, proteins and DNA (Kostakioti et
al., 2013). This can be thought of as a transient form of multicellularity with the enforced
localisation of clonemates leading to a shared fate and shared benefits.
1.2 Bacterial biofilms
The intimate association of bacteria with surfaces has been known of since the first micro-
scopic observations of bacteria growing as plaque reported by Antonie van Leeuwenhoek.
Some of the first reports of the importance of the growth on surfaces to environmental bacte-
ria come from Zobell’s studies on marine bacteria (Zobell et al., 1935; Zobell et al., 1936) which
elegantly demonstrated how marine bacteria’s ability to proliferate was directly related to the
14
surface they had available to grow on rather than the volume available to grow on seemingly
poised to multiply once such colonisation was possible. Further work in the field continued for
many years focusing on marine and stream ecosystems and the impact that biofilms can have
on industrial processes both negative, biofouling, and positive, improved waste processing.
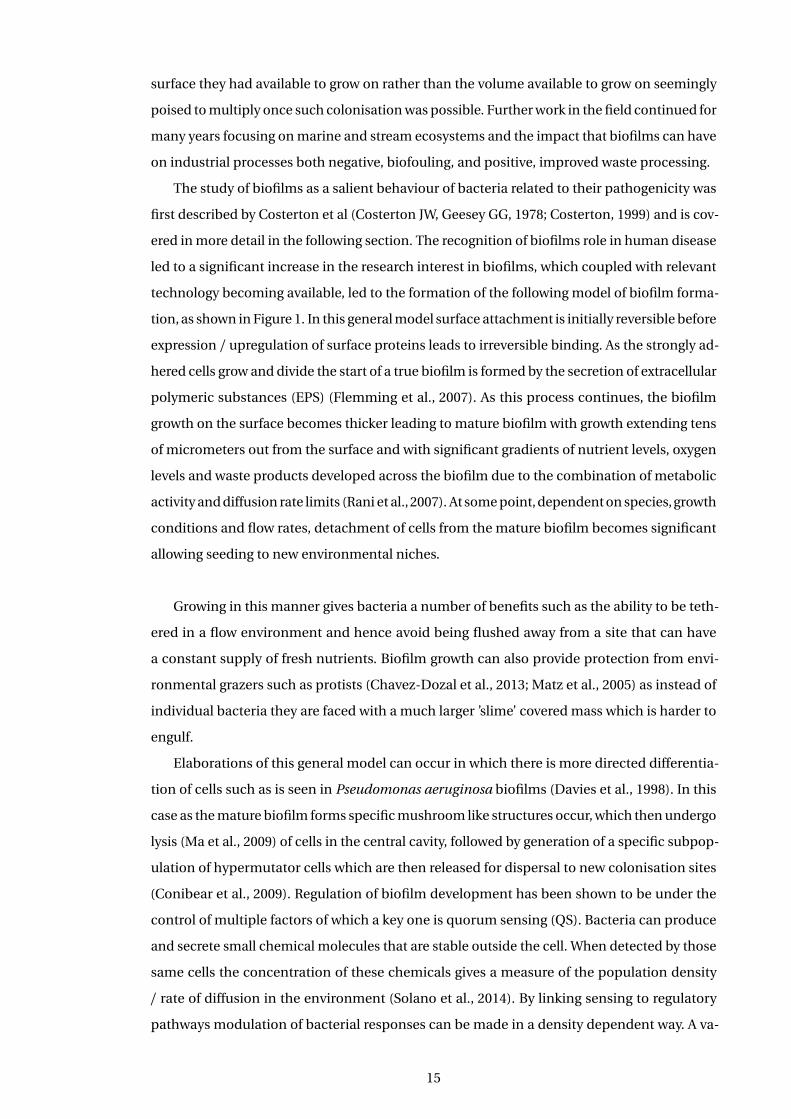
The study of biofilms as a salient behaviour of bacteria related to their pathogenicity was
first described by Costerton et al (Costerton JW, Geesey GG, 1978; Costerton, 1999) and is cov-
ered in more detail in the following section. The recognition of biofilms role in human disease
led to a significant increase in the research interest in biofilms, which coupled with relevant
technology becoming available, led to the formation of the following model of biofilm forma-
tion, as shown in Figure 1. In this general model surface attachment is initially reversible before
expression / upregulation of surface proteins leads to irreversible binding. As the strongly ad-
hered cells grow and divide the start of a true biofilm is formed by the secretion of extracellular
polymeric substances (EPS) (Flemming et al., 2007). As this process continues, the biofilm
growth on the surface becomes thicker leading to mature biofilm with growth extending tens
of micrometers out from the surface and with significant gradients of nutrient levels, oxygen
levels and waste products developed across the biofilm due to the combination of metabolic
activity and diffusion rate limits (Rani et al., 2007). At some point, dependent on species, growth
conditions and flow rates, detachment of cells from the mature biofilm becomes significant
allowing seeding to new environmental niches.
Growing in this manner gives bacteria a number of benefits such as the ability to be teth-
ered in a flow environment and hence avoid being flushed away from a site that can have
a constant supply of fresh nutrients. Biofilm growth can also provide protection from envi-
ronmental grazers such as protists (Chavez-Dozal et al., 2013; Matz et al., 2005) as instead of
individual bacteria they are faced with a much larger ’slime’ covered mass which is harder to
engulf.
Elaborations of this general model can occur in which there is more directed differentia-
tion of cells such as is seen in Pseudomonas aeruginosa biofilms (Davies et al., 1998). In this
case as the mature biofilm forms specific mushroom like structures occur, which then undergo
lysis (Ma et al., 2009) of cells in the central cavity, followed by generation of a specific subpop-
ulation of hypermutator cells which are then released for dispersal to new colonisation sites
(Conibear et al., 2009). Regulation of biofilm development has been shown to be under the
control of multiple factors of which a key one is quorum sensing (QS). Bacteria can produce
and secrete small chemical molecules that are stable outside the cell. When detected by those
same cells the concentration of these chemicals gives a measure of the population density
/ rate of diffusion in the environment (Solano et al., 2014). By linking sensing to regulatory
pathways modulation of bacterial responses can be made in a density dependent way. A va-
15
Surface
Bacteria
Flagella
Adhesins
MatrixA
B
C
D
Figure 1: Stages of biofilm growth
Schematic showing a general model for biofilm formation, see top right for component details.
Panel A shows initial adhesion of bacteria being driven by factors such as cell mobility (flagella)
and expression of adhesins. Panel B shows microcolony growth as surface bound cells start to
divide and express matrix, motility factors are downregulated. Panel C shows maturation of
the biofilm with further cell growth, combined with sufficent expression of matrix to completly
embed the bacteria. Panel D shows release / ’escape’ of bacterial cells from confinement within
the matrix, enabling dispersion of cells.
16
riety of different chemical compounds are utilised by different bacterial species in this way
including acyl homoserine lactones (AHL) and furanosyl borate diesters (auto inducer 2 (AI2)).
Quorum sensing was first shown to be important in the context of biofilms by Davies et al
in Pseudomonas aeruginosa were disruption of (AHL) production was found to block biofilm
development beyond formation of a monolayer (Davies et al., 1998). Further work has shown
that AI-2 mediated QS signaling can also affect biofilm formation (Hardie et al., 2008). In both
cases the particular strain and conditions seem to have a significant effect on outcomes with
quorum sensing having been shown to act at disparate points in biofilm development from
initial formation through to dispersion.
1.2.1 Role of biofilms in pathogenesis
Bacteria can colonise a variety of different surfaces within the body both natural, for example
teeth (Kolenbrander et al., 2010), lung aveoli epithilium (Ciofu et al., 2012) and wounds(Cowan,
2011), and man made, catheters (Reisner et al., 2014), stents and artificial hip joints (Gbejuade
et al., 2014). This has significant implications for management of infections as growth of bac-
teria as biofilms adds a number of complications to clinical management of such infections.
The most well studied example is probably the role that P. aeruginosa plays in chronic lung
infections of cystic fibrosis patients (Mulcahy et al., 2010). In this case despite patients having
a functioning immune system and receiving aggressive treatment regimes, with high doses
of both systemic and ventilated antibiotics, there is a failure to clear the bacterial infection.
These infections exemplify two of the major factors that make biofilms such a medical issue.
Firstly that biofilms can be extremely resistant to antibiotics, failing to be cleared at con-
centrations that wipe out bacteria from the same species growing planktonically. Antibiotic
resistance is due to three main factors, the bacteria growing in the biofilm are often growing
more slowly, or at least the most buried sub population are, due to nutrient limitations, which
means that many antibiotics will not be effective due to their mode of action (Rani et al., 2007).
In addition a population of persister cells, that is cells which have entered a quiescent state
in which they are even more resistant to the action of antibiotics, is generally much higher in
biofilms, possibly due to the more nutrient limited state found in their interior. Therefore even
if concentrations of antibiotic which are therapeutically effective for the bulk of the population
are obtained, a small subpopulation can remain to regrow and maintain infection (Lebeaux
et al., 2014). Thirdly the matrix can act to prevent access of the antibiotic to the bacteria by
sequestering antibiotics due to electrostatic interactions and limiting diffusion (Walters et al.,
2003). Such effects are widely variable between different antibiotics and species and hence
can’t account entirely for the increased antibiotic resistance (Fux et al., 2005).
Secondly biofilms are resistant to the action of the immune system in two main ways, they
cannot be efficiently opsonised as the bacterial surfaces are sequestered withing the biofilm
17
and in a related effect the absence of the typical signal molecules for phagocytosis and the
greater size of the biofilm (much as it is protective against protist grazing) prevents the effective
action of macrophages (Hernández-Jiménez et al., 2013; Hirschfeld, 2014).
In the case of mechanical debridement (Leaper et al., 2012), a standard approach taken
to clean infected wounds / implants, it is the physical property of the biofilm that can lead to
failure to clear infections. The slimy / gelatinous nature of the biofilm means that even after
vigorous removal procedures it can quickly reattach to the surface.
As with infections due to planktonic bacteria, different species of biofilm forming bacteria
are capable of causing different diseases (Lebeaux et al., 2014; Parsek et al., 2003). In the case
of Escherichia coli biofilms have been shown to be involved in the pathogenesis of a number of
diseases , such as urinary tract infections (UTI), bacterial prostatitis (Costerton, 1999), diabetic
foot wounds (Gottrup et al., 2014) and EAEC (Kaper et al., 2004; Croxen et al., 2010).
1.3 Eschericia coli biofilms
E. coli biofilms follow the broad pattern of biofilm formation described above and a brief
outline of the specifics of the E. coli pathway is given below. Initial contact of bacteria with
a surface to commence biofilm formation requires them to overcome hydrodynamic and
electrostatic forces acting against them. In the case of E. coli this is most commonly achieved
due to active motility driven by flagella, although over expression of surface adhesion factors
can compensate for a lack of motility in certain circumstances (Beloin et al., 2008).
After initial contact cells are held by weak non specific interactions between bacteria and
the surface which allow reversible attachment. To convert this to a long term irreversible
interaction E. coli express surface molecules, specifically fimbriae, with three classes having
been shown to have a key role, conjugative pili, type I fimbrae and curli. Conjugative pili, such
as those encoded by the F plasmid, have been shown to be sufficient to confer the ability
to form thick biofilms to laboratory strains by aiding initial cell adhesion (Ghigo, 2001). It is
common for these components to also play a role in later biofilm stages by also promoting
cell to cell adhesion.
The regulation of E. coli is complex and appears to vary across strains and conditions of
growth, however it is possible to pull out some general themes even if they will not apply in
all situations. In order for E. coli cells to transition from the planktonic mode of growth they
need to modulate motility factors, increase for initial adhesion then down regulate, and up
regulate matrix and curli expression once adhered to surfaces. E. coli strains are capable of
quorum sensing via the autoinducer-2 (AI-2) quorum signalling molecule, possessing both
the luxS family of genes for AI-2 production and an lsr-like transport system (Beloin et al.,
2008; Herzberg et al., 2006). Disruption of this system has been shown to affect biofilm growth
18
only under some conditions / strains. One such example is the increase in biofilm formation
on AI-2 addition via the MqsR (motility quorum-sensing regulator) inducing an increase in
cell motility and hence aiding initial biofilm formation as reported by Gonzalez Barrios et al
(González Barrios et al., 2006).
CsgD (transcriptional regulator) has been shown to be a key regulator of biofilm formation
(Ogasawara et al., 2011). It acts in two ways firstly to repress transcription of the genes for flag-
ellum formation /motility both by directly binding to the promoter region and also increasing
expression of AdrA (diguanylate cyclase,) which leads to higher levels of cyclic di-GMP which
also represses flagellum formation. Higher levels of c-di-GMP also act to increase cellulose
production, a biofilm matrix component (Römling et al., 2013). Secondly CsgD directly acts to
activate transcription of genes involved in production of curli which aid attachment to abiotic
surfaces and to other bacteria. CsgD levels in the cell are modified by at least five transcrip-
tional factors in response to a variety of external stress factors, such as changes in osmolarity
which is sensed by the EnvZ/OmpR two component pathway. As osmolarity is often locally
modified at cell surfaces this can act as a marker of initial adhesion having occurred. Other sys-
tems of surface sensing include the cpxRA two-component regulatory system which is thought
to detect adhesion to surfaces due to induced membrane perturbations (Beloin et al., 2008).
Phase variation of surface associated structures such as the adhesin Ag43 can significantly
impact on the biofilm forming competence of E. coli and rates of variation can be modulated
by various mechanisms.
Generation of a mature biofilm, defined as the process of significant thickening of the
biofilm by cell growth, requires two main factors in order to occur, cell to cell adhesins and
matrix production. Adhesins are a class of surface expressed molecules which act to bind
adjacent cells to each other (Da Re et al., 2007). The classic example of which is antigen (Ag43)
(Woude et al., 2008), which has been shown to mediate cell-cell interactions in E. coli biofilms
(Danese et al., 2000) and even within mixed species biofilms (Kjaergaard et al., 2000). A wide
variety of adhesins have been identified and it appears that they are relatively interchangeable
i.e. as long as some adhesins are present to drive cell to cell interactions the specific kind is
not of importance
The matrix produced by E. coli has been shown to be dominated by polysaccharides (Hung
et al., 2013) unlike the biofilms of some other species which are more peptide (Periasamy et
al., 2012) protein based Staphylococcus aureus (Foulston et al., 2014). Specifically cellulose,
Poly-β-1-6-N-acetyl-glucosamine and colanic acid are detectable in E. coli biofilms and their
removal due to gene deletion or degradation has been shown to correlate with loss of biofilm
forming ability. For example treatment of biofilms with cellulase can totally disperse biofilms
(Da Re et al., 2006) and gene deletion of yhjO(cellulose synthase) leads to seriously weakened
biofilms (Hung et al., 2013). It should be noted that the bacteria surface linked polysaccharides
19
of LPS have also been shown to be important in biofilm formation with UPEC536 cells express-
ing truncated LPS having a significant decrease in biofilm formation (Beloin et al., 2006). In
contrast another class of cell tethered polysaccharides, those that form capsules has been
shown (Schembri et al., 2004) to act to block adhesins due to steric interference and also for
group II capsules be released into the environment and also interfere with abiotic attachment.
Clear programs of directed differentiation have not been identified for any E. coli biofilms
(Ghigo, 2003; Lee et al., 2011) to date with responses being generated based on local signals
(detection of surface (Beloin et al., 2004), local nutrient concentration (Beloin et al., 2005))
or general community detection (quorum sensing) rather than the specific developmental
pathways targeting discrete subpopulations of cells seen in some other species (Pseudomonas
hypermotile swarmer release).
1.4 Biofilm analysis techniques
As biofilms present such a pressing medical problem a wide variety of techniques have been
employed to aid our understanding of their formation. These range from the simplest such as
resuspension of biofilms to allow viability quantitation by growth (Ceri et al., 1999) or staining
with dyes such as crystal violet (Genevaux et al., 1996) that can bind to carbohydrate / protein
components of the biofilm matrix and be read spectrophotometrically. An advantage of these
techniques is there suitability for use in 96 well formats allowing higher throughput analysis.
The polysaccharides that compose a significant portion of the matrix of many biofilms
can be chemically extracted and analysed using chromatographic techniques such as high-
performance anion-exchange - pulsed amphometric detection (HPAE-PAD) to give detailed
information on their chemical composition (Denkhaus et al., 2006). Components of biofilm
chemical composition can also be studied using a number of different techniques such as
spectrometry, Raman spectroscopy gives information on matrix polymers, nuclear magnetic
resonance (NMR) (Zhang et al., 2012a) which combined with suitable substrate labeling can
allow metabolite concentration determination which is also possible with magnetic resonance
imaging (MRI) (Cao et al., 2012). Finally mass spectroscopy can also be used to obtain infor-
mation on both small molecule and protein composition. With the use of matrix-assisted laser
desorption ionisation it is possible to raster across a surface to obtain location information in
addition (Lanni et al., 2014).
Direct measurement at locations within biofilms is possible using microsensors capable of
measuring a variety of relevant parameters such as pH and oxygen concentration, dependent
on configuration, and which can be manipulated to measure transepts throughout the full
depth of biofilm growth (Costerton et al., 1995).
Electron microscopy in both scanning or transmission modes can be used to study struc-
20
tural features of biofilms although particular care in interpretation is required due to the
tendency of the biofilm matrix to form artefactual structures due to the harsh preparation
techniques / vacumn conditions that are required.
A critical requirement for clinical analysis of biofilms is to understand the particular species
composition to aid treatment. In this case polymerase chain reaction (PCR) analysis can be
used to type infections (Ren et al., 2013) and recently systems combining PCR and mass spec-
trometry have been released to make such analysis more feasible in the clinical environment
(Ecker et al., 2008).
The analysis of bacteria growing in biofilms presents some unique challenges due to the
three dimensional structure and population heterogeneity inherent in this mode of growth.
Significant advances in our understanding of biofilm structure came about with the advent
of confocal laser scanning microscopy (CLSM) with its ability to provide information in three
dimensions by collecting z stacks of images at defined depths within a sample. In combina-
tion with the ability to engineer the expression of fluorescent proteins by bacterial strains to
be studied, either constitutively or under the control of relevant promoters, information on
strain / species interactions and the expression profile of specific promoters can be obtained.
Importantly this can be done repeatedly to obtain time courses of responses in live cells with
minimal perturbation.
A variety of staining protocols are also suitable in particular the application of fluorescence
in-situ hybridisation (FISH) for the study of natural samples in ecological studies. It has also
proved possible to apply the full range of genomic and proteomic technologies although in
this case it should be borne in mind that spatial patterning will have been lost unless micro
sampling techniques have been employed. These approaches have been particularly useful
in identifying regulatory networks relevant to biofilms (Ogasawara et al., 2011).
1.5 The role of contact dependent interactions in the action of bac-
terial toxins
Bacteria growing in the natural environment face a high degree of competition from other mi-
crobial strains and species. In order to cope with this situation they have evolved to be capable
of expressing a wide range of toxins which act to destroy / damage competing organisms. The
most well known of these systems are the soluble toxins secreted / released by cell lysis to the
environment classified as bacteriocins and microcins on the basis of the size of the protein
toxin. Of these the most widely studied is probably the colicin family of bacteriocins which
target E. coli strains specifically.
Colicins possess a number of characteristics which in further sections discussing CDI will
be seen to have similarities to CDI systems. Colicin molecules are multi domain proteins with
21
the N terminal region containing domains responsible for receptor binding and membrane
translocation and a C terminal toxin domain (Braun et al., 2013). A variety of toxin modes of
action have been identified including pore formation, peptidoglycan degradation and nucle-
ases. In order for the producing cell to avoid self intoxication a cognate immunity protein is
produced which blocks toxic activity till it is removed at the target cell. The toxin and immunity
proteins are expressed from a single operon. It has been shown that colicins are sufficiently
modular in nature that chimeric molecules are functional (Braun et al., 2002).
Each colicin is highly strain specific due to binding only to a certain receptor protein on
the target cell surface, usually one responsible for nutrient uptake, as these receptor types are
diversely distributed the toxin will act only on a small subset of all E. coli strains. Transport
into target cells occurs by subversion of existing target cell molecular import systems, being
either Tol or Ton dependent. The process of translocation or membrane insertion, dependent
on toxin type, is dependent on proton motive force (pmf). In the case of colicin proteins which
act in the cytoplasm proteolysis to cleave the C-terminal tip is required for the toxin to gain
access across the inner membrane.
Despite these similarities there are also a number of significant differences between the
systems which are outlined below. Colicins are expressed from a plasmid background rather
than a genomic context and do not have additional toxin / inhibitor pairs encoded unlike the
polymorphic toxin systems, as defined by Zhang (Zhang et al., 2012b). Export of colicins from
the producing cell is not by a directed pathway but most commonly occurs by induced lysis of
the cell, although some colicins, such as Colicin M escape by cell wall leakage (Cascales et al.,
2007). Colicin toxins, in particular those which form pores in the target cell membrane, are
capable of killing sensitive cells in a single hit process. Which can be seen to be a much more
dramatic outcome than the growth inhibition induced by the EC93 system.
The diffusible nature of these toxins means that their action can spread over a distance
several orders of magnitude larger than the cells that produce the toxin, 5µm length cells vs
zones of clearance that are 1-2 mm in radius (Kerr et al., 2002). The diffusible nature of the
toxins also means that the flow characteristics of the environment will affect how toxins localise
and what concentrations will be acheived. The action of these toxins is typically directly lethal
to targeted cells for example the one hit action of colicin toxins (Johnson et al., 2013).
In contrast to this whole area of action approach to toxin delivery there exist a variety of
more directed bacterial contact systems which are discussed in the following section.
1.5.1 Contact dependent toxin systems
Bacteria are capable of delivering the cytoplasmically synthesised proteins extracellularly us-
ing a wide variety of secretion systems of which four are relevant to contact dependent toxin
systems (Hayes et al., 2010). As contact is an absolute requirement for these systems toxin
22
interactions will be naturally limited to the borders of microcolony interactions and is not de-
pendent on lysis of toxin bearing cells to release toxin as it is already presented / the required
structures for toxin delivery are present on the cell surface.
Type III secretion systems (T3SS) use a repurposed flagella based machinery to deliver
effector molecules (such as the E. coli effector Tir which induces actin polymerisation (Dean,
2011)) to eukaryotic organisms typically in the context of pathogenesis. As they mediate cross
kingdom interactions they will not be discussed further in this thesis.
Type IV secretion systems (T4SS) are based on pili like interactions to deliver DNA to
bacteria to date the delivery of effector protein molecules has only been reported for eukaryotic
systems. Hence they will not be discussed further in this thesis except to note the interaction
of the UPEC 536 toxin and F pilus see section 1.5.5.
Type V secretion systems (T5SS) are transfered through the outer membrane through a
beta barrel protein that is either part of the same molecule, in the case of autotransporters, or
is an accessory protein,in the case of two-partner secretion systems (TPS). Contact Dependent
Inhibition of growth (CDI) toxins belong to this class and are described in detail in section 1.5.2.
Filamentous haemagglutinin (FHA) is the best known example of the T5SS and by assuming
structural homology we would expect CDI toxins to form a β helical fiber (Hayes et al., 2010).
FHA does not have a toxic activity it’s main known role is to increase intercellular adhesion
and this activity has been reported to carry over into cells expressing CDI systems.
CDI is an example of a polymorphic toxin system, that is a system with a diverse range of
possible toxin types that can be encoded at the C-terminal most domain with N-terminal do-
mains involved in trafficking across membranes (both host and target). Toxin types identified
to date include a range of different nucleases and proton motive force disruption (pmf) (Aoki
et al., 2010).
Unlike the other toxin delivery systems described here, which use tubular structures to
deliver effector molecules, CDI toxin is delivered from a single large protein tethered to the
outer membrane. Delivery of CDI toxins is associated with inhibition of growth of target cells
but not cell death. This action is comparable to an induction of a viable but nonculturable
(VNBC) state (Oliver, 2005) in intoxicated target cells. Toxin delivery shows a high level of
species specificity based on heterogeneity of surface displayed proteins (BamA loops) CDI tox-
ins are commonly found with orphan toxins and inhibitor sequences, these can be expressed
leading to a more complex network of immunity and susceptibility than would otherwise be
the case.
Type VI secretion systems (T6SS) use a phage-like injection mechanism to deliver toxins to
target cells. The tube of this structure is composed of multiple hemolysin-coregulated proteins
(Hcp) capped by valine-glycine repeat proteins (VgrG). This system can interact with both bac-
terial and eukaryotic systems (Schwarz et al., 2010) and is discussed in the context of bacterial
23
interactions here. Recent work has identified that when cells both possessing T6SS interact a
dueling mechanism can be induced increasing the likelihood of formation of a functional T6SS
system on the cell membrane adjacent to the other cell(Alteri et al., 2013). T6SS systems have
been shown to be a broad specificity toxin system able to target a range of bacterial species in
contrast to the more specific species / strain focus of bacteriocins or CDI toxins. Toxin action
of T6SS systems is generally lethal to target cells which is in contrast to CDI growth inhibited
cells which maintain membrane viability as judged by propidium iodide exclusion (Aoki et al.,
2005).
T6SS toxins are also capable of self intoxication and therefore express inhibitor proteins
to block this as is also seen with CDI toxins. Orphan inhibitor proteins have been identified
in strains not expressing T6SS toxins but the pairing of orphan CT-toxin tips and inhibitor
proteins has not been reported. T6SS toxin activity is usually delivered by relatively small
effector molecules that can readily traverse the injectisome. As with CDI toxins these cover a
wide range of toxin modes of action such as pore formation, peptidoglycan degradation and
nucleases (Russell et al., 2014). T6SS toxins are not effective in planktonic culture requiring
the presumably more stable conditions of growth on a surface for effective inhibition, this is
in contrast to CDI systems which are effective under planktonic growth conditions.
Rhs systems have recently been identified as toxin systems that appear to use the genric
T6SS injection system (Koskiniemi et al., 2013). Rhs toxin loci are found linked to hcp and vgrG
genes and, as these are required for effective action of the toxin, they are presumed to form
T6SS like injection apparatus. It is not yet clear if such a large toxin molecule, in comparison
to the size of T6SS effectors, is capable of traversing the injection apparatus intact. Significant
growth inhibition is only seen when competition is monitored by growth on surfaces as would
be expected from the similarities with T6SS systems, and again different than the CDI systems.
Rhs toxins were identified, in part, because some Rhs C-terminal toxin tips share significant
homology with some CDI C-terminal toxin tips. This suggests that transfer of toxins as modular
units is possible even across classes of toxin. As in CDI toxins the C-terminal region is defined
by a conserved motif, in this case PxxxxDPxGL. As with CDI systems there are a wide variety
of C-terminal tips found spread across different strains which each have cognate immunity
proteins to avoid auto inhibition. Orphan toxin and immunity proteins are found in some
bacterial strains and Koskiniemi et al have shown that these can recombine to form functional
toxins (Koskiniemi et al., 2014). Rhs toxin systems can in some ways be seen as a hybrid of the
T6SS and CDI toxin systems (Poole et al., 2011). They will not be covered further in this thesis
except where they are illustrative for understanding possible CDI toxin tip recombination, see
section 1.5.6.
24
1.5.2 Contact-dependent growth inhibition toxins
CDI toxins were first reported in 2005 by the Low lab (Aoki et al., 2005) having been identified
as an unexpected contaminant in a rat UTI model. In this case the contaminating strain was
found to be dominating the urinary tract of the rat, out competing the strains that the experi-
mentalists were trying to use. The responsible strain, E. coli EC93 was isolated from the faeces
of the rat used in the experiments. Initial work identified the operon responsible for the ability
to out compete related bacteria, and on the basis that the growth of cocultured bacteria was
stopped in planktonic culture they were assigned as cdi genes, cdiBAI operon.
CdiB and CdiA have been assigned as partner proteins in a two partner secretion system
(TPS / T5SS), based on sequence similarity, with CdiB delivering CdiA to be displayed tethered
on the inhibitor cells surface. The orientation of EC93 CdiA on the cell surface has not been
directly determined but its length of 3132 amino acids suggests it could project a significant
distance from the cell surface. EC93 CDI toxin was shown by biochemical means to act by a
still undefined mechanism to disrupt proton motive force (pmf) and hence disrupt the target
cells energy metabolism (Aoki et al., 2009). Expression of the EC93 toxin system is constitutive
under the range of laboratory conditions tested with slight changes in expression level being
reported on changes in the C source supplied in media (personnel communication, Zachary
Ruhe).
Contact dependence has to date been based on two experimental protocols, firstly by
showing that separation of CDI+ and target cells by a PET membrane blocked the ability of the
CDI toxin when it’s pore size was sufficient to block trans migration of bacteria (0.2µm) but
still permit exchange of media. Which showed that contact was required and that the toxin was
not being dispersed in a soluble form. Secondly, Fluorescence Activated Cell Sorting (FACS)
was performed on cocultures of CDI+ and target cells which showed that the colony forming
ability of target cells which were cosorted with inhibitor cells was reduced.
1.5.3 CDI species and strain distribution
After being initially identified in E. coli, bioinformatic analysis was performed (Aoki et al., 2010)
to identify the extent that the CDI system was present in other E. coli strains and across to other
species. Using the core conserved region of cdiA and cdiB as search criteria standard bioinfor-
matic search techniques revealed that CDI operons were present across a number of species in
the α,β and γ proteobacteria (Hayes et al., 2014), as confirmed by the presence of short ORF’s
immediately following, corresponding to cdiI, that were unannotated/hypothetical protein
annotations. Only sequences that contained the DUF638 domain (in which the VENN motif is
found) and an N-terminal haemagglutination activity domain with associated hemagglutinin
repeats were included in this analysis (Aoki et al., 2010; Ruhe et al., 2013a).
25
A clear distinction can be drawn between the main group of CDI toxins and those which
are found in the Burkholderia species (Nikolakakis et al., 2012; Koskiniemi et al., 2015). Firstly
the operon gene order is different than all other species being BcpAIOB, with the additional
operon component O (Anderson et al., 2012) being hypothesised to be involved in export and
maturation of BcpA. Secondly the junction of the conserved region and the variable C-terminal
tip is delineated by a different sequence motif, NxxLYN instead of VENN. Finally it should be
noted that chimeric CdiA proteins created by swapping of toxin tips between the two CDI
systems leads to proteins that are not capable of growth inhibition of target cells.
Control of the expression of CDI systems is poorly understood with the exception of the
Burkholderia systems were there is evidence for sporadic induction of expression during
biofilm growth (Anderson et al., 2014). Generally CDI systems do not seem to be switched
on at detectable levels under laboratory conditions which has lead to much of the work to
date being performed on strains in which the expression of the CDI system has been placed
under artificial promoters or where a chimeric CdiA molecule is generated with, for exam-
ple, the conserved region of EC93 CdiA and the CT toxin region of the CdiA molecule from
UPEC536. The absence of expression under laboratory conditions is presumably why the CDI
systems had remained unreported until 2005. E. coli strains which have been identified to
contain CDI systems include strains responsible for UPEC and EHEC.
1.5.4 Classes of CDI toxin
The initial toxin activity identified to be present in the EC93 CDI toxin system is currently an
anomaly compared to the classes discovered by further bioinformatics analysis both by the
Hayes and Low labs , focusing on CDI/Rhs systems, and by the Zhang lab (Zhang et al., 2012b;
Zhang et al., 2011) looking at the broadest possible view of toxin families of which CDI is clearly
part of the supergroup of polymorphic toxin systems. This work identified 18 families (Beck
et al., 2014b) of toxins across the identified E. coli CDI loci with a large number of toxins not
showing any significant levels of identity with known toxins. This classification is based on
pair-wise alignments of E. coli CDI sequences aligned the VENN motif (Ruhe et al., 2013a).
While there are significantly more toxin sequence classifications than assigned toxin activities
it is not clear yet whether each class of toxin sequence represents a unique toxin activity.
Those that have been identified to date, excepting the biochemical approach taken with
EC93, are nucleases. In fact the first CDI nuclease activity, ribosomal RNAase (rRNAase), was
noted by (Walker et al., 2004) in three different species prior to the first report of CDI as a
novel toxin system itself. That these classes have been identified to date may be due to the
initial selection bias for nucleic acid degrading folds being readily determined by sequence
analysis, as identified as part of wider polymorphic toxin superfamily (Zhang et al., 2012b).
The structure of part of only two CDI toxin’s has been reported to date with the C-terminal
26
region of the EC869o11 and ECL CdiA molecules being separately determined cocrystalised
with their cognate immunity proteins (Morse et al., 2012; Beck et al., 2014a).
EC93 toxin mode of action was determined using an autoinhibition assay in which cells
expressing the EC93 CDI system had CdiI expression under inducible promoter control. This
assay looked at the effect of loss of CdiI protection in expressing cells rather than solely delivery
of toxin across a membrane. Expression of Pap pili as a control showed that there did seem to be
a significant requirement for cell contact for toxin effectiveness (Aoki et al., 2009), supporting
the relevance of the assay. However the levels of toxin delivered in such a system may represent
a dose of toxin that is not achievable in nature. In addition any statements on recovery from
toxin action are definitely not directly relatable to the natural environment as target cells are
not likely to suddenly begin expressing the relevant CdiI, either they will lack it or they will have
been initially protected. This data however does show that removal of the EC93 CDI toxin does
allow recovery and hence the toxin action hasn’t set in place an irreversible set of molecular
actions.
The UPEC536 is the only example known to date of a CDI toxin which has an additional
requirement of the target cell, beyond factors required for its delivery to the cells cytoplasm.
Growth inhibition absolutely requires that CysK , a non essential biosynthetic enzyme, be
present, a permissive factor, for toxin activity (Diner et al., 2012).
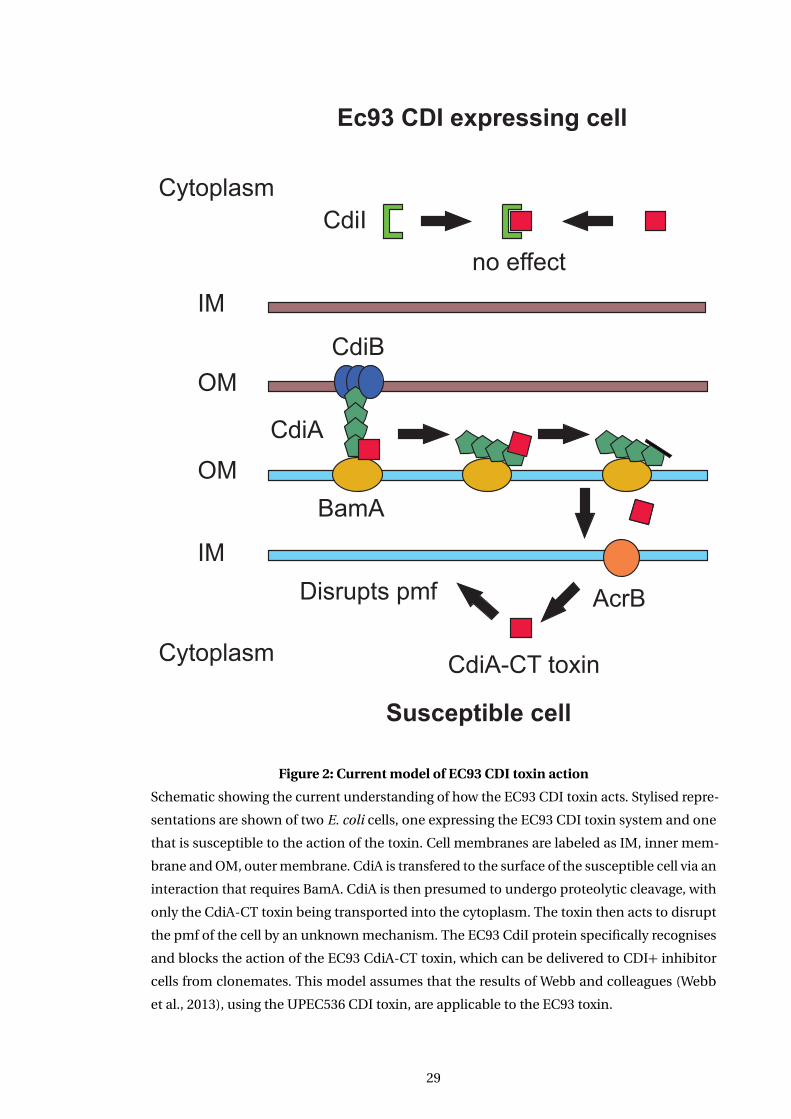
1.5.5 Toxin delivery mechanisms of CDI
The bulk of work looking at the toxin delivery of CDI to target cells has been performed using
the EC93 toxin system and it is not clear how applicable it will be to the broad range of CDI
systems. Although the conservation of core sequences argues for a universal system one ex-
ception / additional route has been identified for the UPEC536 system. The current model of
EC93 CDI toxin action is shown in Figure 2 and described below. This model illustrates the
dependence of the CDI toxin system on cognate receptor molecules on the cell surface to
allow toxin transfer of CdiA. This matches with the requirement of colicin toxins target cells
to express appropriate systems. In contrast T6SS effectors are delivered directly to the cell via
the virus like injection method. Some form of proteolytic cleavage is then required for toxin
activity to be translocated into the periplasm. This is presumably due to the size of a molecule
as large as CdiA’s are, up to 5,600 amino acids in length (Poole et al., 2011), being significantly
more challenging to transport across a membrane than solely the 200 amino acid toxin C-
terminal region. Transfer from the periplasm into the cytoplasm also requires specific inner
membrane proteins to be present dependent on toxin type as is seen for colicins (ftsH appears
to be an example of a shared protein route into the cytoplasm between some CDI systems
and some colicins). Again such a requirement is not seen for T6SS toxins. As is seen for though
as intracellularly produced CdiA will be the whole molecule and it is not known if such still
27
tethered toxins would be active, it is more likely to be toxin delivered from clonemates that
requires protection, as this would deliver cleaved toxin that is known to be active. The current
evidence for this model is discussed below.
Genetic screening for transposon mutagenised target strains resistant to EC93 CDI+ cells
(Aoki et al., 2008) identified two genes whose disruption conferred resistance to EC93 CDI
toxin. AcrB is part of a multidrug efflux complex in the inner membrane (Tikhonova et al.,
2004). Interestingly although this is a multi protein assembly no other components of the
complex were picked up in the screen and specific knockouts of the other components had
no protective effect against the EC93 CDI toxin.
BamA is an essential protein responsible as part of the Bam for the insertion of β barrel
proteins into the outer membrane. As it’s absence is lethal it was picked up in the screen
by a mutant with decreased levels of BamA on the cell surface. Again though this protein is
part of a multi-protein complex disruption of other members of the complex gave only a small
protective effect that was determined to be due to increased levels of capsule production. That
fragments of Ec93 CDI toxin in conditioned media (Aoki et al., 2005) are incapable of inhibition
indicated that the initial interaction of the entire CdiA molecule was a key factor in effective
toxin translocation. It has been shown that the EC93 CDI system is only effective against other
E. coli species (Ruhe et al., 2013b). Further work identified that EC93 CdiA protein recognises
specific extracellular loops of BamA and that this requirement for recognition explains the
species specificity of the EC93 CDI toxin. It has also been shown for the UPEC536 CDI toxin
that the whole of the CdiA molecule can be detected on the surface of target cells, but only the
CdiA C-terminal toxin tip could be detected in the cytoplasm of these cells (Webb et al., 2013).
The purified UPEC536 CDI toxin has recently been identified to be capable of using an
alternate route by interacting with the F pilus (Beck et al., 2014b). However the lack of any
toxic effect of UPEC536 cell supernatants suggests that F pilus binding is not relevant in the
natural environment and has been hypothesised to instead reflect an off target effect of an
alternate mechanism for target cell membrane translocation.
The Ec93 toxin requires AcrB for toxin delivery, however this requirement has not been
found for other CDI toxin systems tested. E. coli ftsH (ATP-dependent zinc metalloprotease)
mutants are resistant to a small subset of CDI toxins yet susceptible to others(Ruhe et al.,
2014), taken together this indicates that their are in fact multiple pathways for different CDI
toxin import into the target cell. Recent work has identified that translocation across the inner
membrane requires the proton motive force (pmf) for a range of toxins other than EC93 which
was not tested for technical reasons (Ruhe et al., 2014).
28
Ec93 CDI expressing cell
OM
Cytoplasm
IM
Susceptible cell
IM
Cytoplasm
OM
CdiB
CdiA
CdiI
BamA
AcrB
CdiA-CT toxin
Disrupts pmf
no effect
Figure 2: Current model of EC93 CDI toxin action
Schematic showing the current understanding of how the EC93 CDI toxin acts. Stylised repre-
sentations are shown of two E. coli cells, one expressing the EC93 CDI toxin system and one
that is susceptible to the action of the toxin. Cell membranes are labeled as IM, inner mem-
brane and OM, outer membrane. CdiA is transfered to the surface of the susceptible cell via an
interaction that requires BamA. CdiA is then presumed to undergo proteolytic cleavage, with
only the CdiA-CT toxin being transported into the cytoplasm. The toxin then acts to disrupt
the pmf of the cell by an unknown mechanism. The EC93 CdiI protein specifically recognises
and blocks the action of the EC93 CdiA-CT toxin, which can be delivered to CDI+ inhibitor
cells from clonemates. This model assumes that the results of Webb and colleagues (Webb
et al., 2013), using the UPEC536 CDI toxin, are applicable to the EC93 toxin.
29
1.5.6 Orphan CDI toxin tips
During the bioinformatic analysis performed in (Aoki et al., 2010) it became apparent that
associated with the main cdiBAI operon in many strains were additional immunity proteins
and C-terminal (CT) only sections of CdiA molecules truncated so as to encode the toxin
region. It is thought on the basis of sequence that expression of the orphan immunity proteins
is possible as they can have an appropriate initiation codon and Shine-Dalgarno sequence
in a properly spaced position. Natural expression of the EC93 orphan CdiI protein has been
demonstrated by RT-PCR detection of mRNA transcripts and protection from the cognate
toxin (Poole et al., 2011). It is not thought that the orphan CT CDI toxin is expressed, even if its
mRNA is transcribed, as it lacks the features required for translation. This would be expected
as it lacks the conserved region of cdiA and hence would not be able to be translocated to the
cell surface to play a functional role.
The conservation of orphan toxin function indicates an evolutionary pressure to main-
tain function and / or a relatively recent transfer. A possible reason for such maintenance of
function is that the orphan pairs of toxin tips and immunity proteins represent two different
reservoirs of competitive advantage for the cell. As it has been shown for at least some orphan
immunity proteins that they are expressed as functional protein (Poole et al., 2011) they can
provide protection from the action of toxin from other species / strains present in the envi-
ronment. This is not the case for orphan toxin tips but they do represent a pool of potential
toxins that could be recombined back to fuse with the conserved region of cdiA and hence be
expressed at the cell surface and effective. Another possibility is that the presence of these or-
phan pairs is a record of toxin transfer from other strains and species rather than the reservoir
from they can be taken.
1.6 Bacterial competition in biofilms
In order to understand what ecological impact CDI systems could have it is useful to under-
stand how they integrate into the existing body of competition theory. Studies in competition
theory have been a fertile field of study fusing the areas of ecology and mathematics since
the seminal studies of Hamilton (Hamilton, 1964). Whilst initially confined jr to experimental
models based on large animals, the field has moved to embrace microbiological approaches
to experimentally addressing competition theory due to the comparative ease with which
experiments can be conducted. One of the classic experiments in this field was performed by
Kerr and colleagues (Kerr et al., 2002) using a colicin toxin system as a probe of competition
in communities expressing varying levels of toxin expression and toxin sensitivity, a system
that was also revisited more recently by Nahum et all (Nahum et al., 2011).
Recent work reported by (Nadell et al., 2015) shows that the nature of growth within a
30
biofilm can provide a competitive advantage against invaders with close cell to cell interactions
acting to block the ability of motile Vibrio cholerae to invade a preexisting biofilm.
One area of competition theory that is likely to be relevant to CDI systems is that of kin
and kind discrimination (Strassmann et al., 2011). The idea of ’green beard’ alleles (Hamilton,
1964; West et al., 2010) is particularly relevant when considering bacterial toxin systems. In
this concept a ’green beard’ trait acts to direct a benefit only to others that carry the same trait.
This benefit can be spiteful, that is it can act to harm others that do not carry the trait and
hence indirectly benefit the trait carrier. The role of CDI toxins as ’green beard’ alleles have
been discussed by Ruhe and colleagues (Ruhe et al., 2013b) in the context of cooperativity. In
addition to these proposed interactions the presence of expressed orphan cdiI’s allows for the
possibility of a mosaic population with a complex web of inhibitor, resistant and susceptible
cells on a per toxin basis.
Traditional approaches to studying these systems are based on the assumption of a cost
to maintenance of systems such as colicins, for example in this case the usual requirement for
release of colicins by cell lysis or the maintenance of plasmids encoding for the required factors.
In the case of CDI systems the presence of the operon on the genome and the expression of
a highly effective immunity protein to avoid self intoxication lead to a situation in which,
at least under standard laboratory conditions, maintenance of functional CDI systems does
not appear to have an impact on CDI+ strains. This can be seen from the lack of reported
differences in growth rate between CDI- strains and both CDI+ strains and strains lacking
only the CT-toxin region . It may be that under environmental conditions different selection
pressures apply which act to limit the spread of CDI systems across more strains.
1.7 Hypothesis and Aims
This research aims to determine if E. coli cells that express CDI toxins have a competitive
advantage when growing in a biofilm and if so can the class of the CDI toxin expressed alter
the extent of this advantage.
Experiments will be carried out to determine if expression of the EC93 CDI toxin gives
a competitive advantage in flow cell biofilms. A quantitative single cell analysis technique
suitable for cell-cell interactions will be established. This assay will be used to measure the
time course of toxin action, combined with the effects on inhibited cells morphology, and
hence define the inhibition phenotype of different classes of CDI toxin.
31
Chapter 2
Methods
2.1 Chemicals and media
General chemicals used were of ACS or Bioreagent grade and were supplied by Sigma or Fisher.
Reagents Stock solutions were stored as autoclaved or 0.2µm filtered solutions at room tem-
perature as appropriate EZ defined rich media was supplied from Teknova and the separate
components stored at -20C until required when 1L of media at x2 concentration would be
prepared without carbon source and aliquoted prior to -20C storage to avoid additional freeze
thaws. This stock was found to be stable for 6 months but longer storage periods led to poor cul-
ture growth. Water used for solutions was deionised grade (>8MΩcm-1, dH2O)if the solutions
were to be autoclaved and ultra high quality grade (>18MΩcm-1, UHQ H2O) if the solutions
were to be filtered.
2.2 General culture techniques
2.2.1 Bacterial strains and growth conditions
E. coli strains used in this study are listed in Appendix A. Appendix B shows the plasmids used
/ generated in the course of this work and all oligonucleotides used are shown in Appendix C.
Three types of liquid growth media were used in this study. LB media contained 20g/L LB
Lennox (Fisher). M9 minimal media contained 1x M9 salts (Sigma Aldrich) supplemented with
0.4% glucose , 1mM MgSO4, 0.1mM CaCl2, 0.001% thiamine and 6x10⁻⁶% iron citrate. EZ rich
defined media (Teknova) is a commercial preparation of the media defined in (Neidhardt et al.,
1974). Solid growth media contained the above media components and either an additional
17.5g/L agar or 15g/L of agarose (standard fraction or low molecular weight). Cells were grown
at 37C as a default temperature. Some plasmids used were temperature sensitive so strains
maintaining these plasmids were grown at 30C when plasmid maintenance was required and
at 42C when plasmids needed to be cured.
32
2.2.2 Strain storage and revival
Strains were laid down for long term storage in LB+ 10% glycerol at -80C in Corning cryogenic
vials. Vials were seeded using a sterile cotton bud swabbed over the surface of a confluent LB
plate, with appropriate antibiotic selection, which had been grown overnight from a single
picked colony spread evenly. Strains were revived from storage by scratching the frozen surface
of the preserved strain and streaking on to LB plate with appropriate antibiotics. This plate was
then sequentially streaked three times, with intermediate flaming of the loop, so that single
colonies grew in the final streak.
2.2.3 Antibiotics
Antibiotics were prepared at stock concentrations at 1000 fold the final concentration to be
used in the appropriate solvent. If the solvent was organic antibiotics were stored and used at
-20C without further processing. If the solvent was aqueous the solutions were syringe filtered
through a 0.2µm filter into sterile 1.5ml eppendorfs and stored at -20C, with in use aliquots
kept at 4 C. Final antibiotic concentrations were prepared by dilution into appropriate me-
dia immediately prior to use. The following antibiotic concentrations were used ampicillin
100µg/ml, kanamycin 30µg/ml, chloramphenicol 34µg/ml and rifampicin 150µg/ml.
2.2.4 Optical density measurement
Measurement of the optical density of cell suspensions were all made using a Jenway 6505
UV/Vis spectrophotometer spectrophotometer at a wavelength setting of 600nm using 1ml
disposable cuvettes. Prior to measurement the spectrophotometer was blanked versus diluent.
2.3 Molecular Biology
2.3.1 Polymerase chain reaction (PCR)
Plasmid and chromosomal sequences were entered into NTI Vector 11 (Invitrogen, Lu et al.,
2004) primers designed using the software. Oligonucleotides for use as primers were ordered
from Sigma Aldrich and were supplied as a lyophilised powder. Long term stocks were held as
100µM stocks in 1mM at -20C with working stocks being made by a further 10 fold dilution
to 10µM. All dilutions were based on the manufacturers supplied assay data.
Primer annealing temperature was calculated based on the nucleotide composition of the
portion of the primer that anneals to the target according to the following formula:
Annealing temperature (C)= (4(no. of G or C nucleotides)+2(no. of A or T nucleotides) -5
33
The lowest annealing temperature of the primer pair was used as the basis for initial PCR
runs, if it was found to be inappropriate a range of annealing temperatures was trialled in
order to determine a suitable temperature empirically. Extension time was varied by product
length based on manufacturers recommendation for the particular DNA polymerase used.
PCR was performed with GoTaq flexi DNA polymerase (Promega) for analytical experi-
ments. The manufacturers GoTaq Green buffer was used supplemented with 3µl 25mM MgCl2
per reaction to give a final volume of 50µl. Reactions that were to be used for cloning used
KOD polymerase (Novagen) or Pfu (Fermentas) proof reading enzymes capable of high fidelity
replication. Again a 50µl was used supplemented with either 1mM MgSO4 or 20mM MgSO4
respectively.
2.3.2 Restriction digests
Restriction endonucleases were sourced exclusively from NEB and the manufacturers instruc-
tions followed for their use in the prescribed buffer. Double digestions were conducted under
the compromise buffer conditions provided by the manufacturer. Digests were carried out in
a volume of 20µl . Diagnostic reactions were performed at the recommended temperature for
1hr 30 minutes. Incubations for cloning were performed at the recommended temperature
overnight with a second volume of restriction enzyme added after 1 hour to ensure complete
digestion. If required restriction enzyme inactivation was performed by heating the sample
to 65C for 20 minutes.
2.3.3 Agarose gel electrophoresis
Samples were prepared for loading on gels by addition of 5x loading dye (York bioscience)
or 6x loading dye (Fermentas) to give a final dye concentration of 1x. DNA electrophoresis
was performed in agarose gels ranging in concentration from 0.8 to 2% agarose buffered with
TAE buffer (0.04M Tris Acetate, 0.01M EDTA) containing either 0.001% ethidium bromide or
1µg/ml Nancy-520 dye (Sigma Aldrich). At least one lane on the gel was run with a DNA molec-
ular weight marker either Q Step 4 (York bioscience) or Generuler 100-10000 (Fermentas).
Electrophoresis was perfomed using voltages in the 22-100V range. Gels were imaged using a
G-Box gel imaging system with Genesnap software (Syngene) with dye excitation by UV tran-
sillumination (ethidium bromide) or a Dark reader blue light transilluminator (Clare Chemical
Research).
2.3.4 Band excision and DNA extraction
Bands to be excised where visualised using the appropriate illumination method for the dye
used. If UV illumination was required then only brief illumination with a hand held UV lamp
34
was performed to minimise UV light induced DNA damage. A fresh sterile disposable scalpel
was used for cutting out of each band with care taken to ensure only the band and immediate
area were removed. DNA was extracted / purified from the cut band using the QIAEX II gel
extraction kit (QIagen) and eluted in 30µl of UHQH2O.
2.3.5 DNA ligation
T4 DNA ligase (Fermantas ) was used with supplied buffers according to manufacturers pro-
tocol. Ligation ratio was determined using the following formula in order to give a molarity of
insert that was three fold greater than that of plasmid:
Ratio of insert to plasmid = 3(insert size x plasmid concentration) / (plasmid size x insert
concentration)
Once mixed samples were incubated at 16C overnight. Samples were then drop dialysed
to remove salts prior to electroporation.
2.3.6 Drop dialysis
Removal of salt from samples, typically prior to electroporation, was performed using drop
dialysis. 0.2µm filter discs (VSWP filters, Millipore) were floated on top of 20ml of UHQH2O
and up to 20µl of sample pipetted on to the center of the disc. Sample was then incubated for
at least 1 hour at room temperature. If required completion of salt removal was confirmed by
DNA concentration analysis.
2.3.7 Competent cell generation
Competent cells were generated using one of the four protocols detailed below dependent on
the level of competence required for the particular application.
2.3.8 Classic electrocompetent cell preparation
Cells to be made competent were grown overnight from a single colony in 5ml LB (with ap-
propriate antibiotics). 2.5ml of this overnight culture was used to inoculate 250ml LB (with
appropriate antibiotics) in baffled flasks that were grown at appropriate temperature (typi-
cally 30 or 37C dependent on plasmid stability) to an OD600 of 0.5-0.7. The culture was then
chilled on wet ice for 20 minutes, all subsequent steps were performed on ice with prechilled
containers. Cells were then centrifuged for 7mins at 3000g , 4C the supernatant discarded
and the cells resuspended in 125ml sterile 10% glycerol in UHQ H2O. This process was then
repeated with two lots of 5 mins spin / 80ml resuspension before a final 5 mins spin. This final
pellet was resuspended in 0.6ml ice cold 10%glycerol and either transformed immediately or
flash frozen and stored at -80C for future use.
35
2.3.9 Density step electro competent cell preparation
Electrocompetent cells were prepared according to a method based on (Warren, 2011) . Overnight
culture grown from single colony in 5ml LB and appropriate antibiotics. 2.5ml of overnight
culture inoculated into 200ml LB ( with antibiotics) in baffled flask and grown at appropriate
temperature (typically 30 or 37C dependent on plasmid stability) to an OD600 of 0.4-0.6. Cul-
ture was then chilled for 10 mins in an ice water bath and all subsequent steps performed on
ice with prechilled containers. Cells were then harvested by centrifugation at 2000g, 4C in
4 x 50ml sterile disposable centrifuge tubes (Corning). After disposal of the supernatant the
pellets obtained were gently resuspended in 1ml UHQ H2O per tube then aggregated into one
tube and made to a final volume of 40ml with UHQ H2O. 20ml of this suspension was then
placed in two fresh tubes and carefully underlayed with 12ml of 20%glycerol / 1.5% mannitol
in UHQ H2O. Centrifuge tubes were then centrifuged immediately at 2000g, 4C using reduced
acceleration / deceleration parameters to avoid disrupting step gradient. Solutions were care-
fully aspirated to leave cell pellet which was then diluted with 200µ of 20% glycerol / 1.5%
mannitol. Competent cells were then transformed immediately or flash frozen and stored at
-80C for future use.
2.3.10 Quick electro competent cell preparation
Quick electrocompetent method was used to generate cells for plasmid transfer in strain back-
grounds that were less efficient at transformation (personnel communication, Erica Kintz).
Electocompetent cells were prepared by scraping 3 colonies of the required cells from a plate
using a sterile pipette tip and resuspending the colonies in 100µl ice cold 10% glycerol. This
suspension was centrifuged at 13000 rpm / 16060g for 1 minute at room temperature and
the supernatant discarded. The pellet was resuspended in 100µl ice cold 10% glycerol and
respun. This final pellet was resuspended in 100µl ice cold 10% glycerol and competent cells
transformed immediately.
2.3.11 Electroporation
Electroporation was performed using electrocompetent cells prepared using the methods
above with a BioRad Micropulser electroporator. 2mm gap sterile disposable electroporation
cuvettes (Molecular Bio Products / Bio Rad) were prechilled on ice before addition of 50µl of
competent cells to 1-2µl of DNA solution in the cuvette. This mixture was held for at least 1
minute on ice before proceeding. Electroporation was performed using program Ec2 on the
electroporator and 1ml of SOC (2%tryptone, 0.5%yeast extract, 10mM NaCl, 2.5mM KCl, 10mM
MgCl2, 10mM MgSO4, 20mM glucose ) added immediately afterwords to the cells which were
then grown for at least 1 hour prior to plating onto LB agar plates with the relevant antibiotic
36
selection.
2.3.12 Quick transformation
The quick transformation method was used to move plasmids between readily transformable
strains. Competent E. coli were generated using the PEG 3350 based protocol described in
(Chung et al., 1989).
2.3.13 DNA purification
DNA purification was performed according to the protocols shown below.
2.3.14 Genomic DNA purification
Genomic DNA was isolated using the CTAB/NaCl method described in (Wilson, 2001). Ex-
traction was performed on 1.5ml of overnight culture grown in LB media with appropriate
antibiotics. Purified DNA was resuspended in 100µl EB buffer (Qiagen)
2.3.15 Plasmid DNA purification
Plasmid DNA was purified using the QIAprep spin miniprep kit (Qiagen) from 4.5ml of overnight
culture grown in LB with appropriate antibiotic. The additional PB wash step recommended by
the manufacturer was used. Plasmids were eluted in 50µl of EB for high copy number plasmids
or 30µl of EB for medium/ low copy number plasmids.
2.3.16 PCR purification
PCR reactions to be used in cloning were cleaned up using QIAquick PCR purification kit
following the manufacturers instructions with the sample eluted in 30µl of EB buffer (Qiagen)
or UHQH2O.
2.3.17 Concentration of DNA
DNA concentration was performed in a MiVac DNA concentrator (Genevac) until the desired
volume was achieved. Drop dialysis was then performed to remove excess salt.
2.3.18 Determining DNA concentration
DNA concentration was determined on 1.2µl samples using a Nanodrop ND-1000 spectropho-
tometer blanked with appropriate diluent / eluent. Purity was assessed on the basis of the A260
/ A280 ratio being greater than 1.8. When appropriate examination of the spectra was also
performed to determine the level of salt present in the sample.
37
2.3.19 Genomic integration
Generation of genomic integrants was performed using one of the two protocols detailed
below.
2.3.20 CRIM protocol
PCR using oMV429 and omV432 was performed to confirm the presence of the attB site in the
EC93 wild type strain. The CRIM protocol defined by Haldimann and colleagues was followed
(Haldimann et al., 2001). Strains in which genomic integration was required firstly had the
pINT-ts helper plasmid introduced by electroporation. Strains with genomic integration were
then obtained by electroporation of plasmid pMV285 or pMV350. Screening for single genomic
integrants was performed as described by Haldimann (Haldimann et al., 2001) using oMV429,
oMV430, oMV432 and oMV656primers. Successful integration was further confirmed by se-
quencing the insert. Please see appendices A,B and C for further details of strains, plasmids
and oligonucleotides used.
2.3.21 Lambda Red protocol
The lambda red protocol defined by Datsenko (Datsenko et al., 2000) and Sawitzke (Sawitzke
et al., 2007) was followed. Strains in which genomic integration was required firstly had the
pKD46 helper plasmid introduced by electroporation. Cassettes for insertion where generated
by PCR either from chromosomal template, MV1213 (oMV935, oMV936 primers), or from plas-
mid template pMV370,pMV371,pMV372 and pMV373 (oMV939, oMV940 primers). Prior to
use the PCR products were purified by gel extraction. pKD46 containing strains then had λ
recombinase genes induced with 0.2% arabinose 1hr prior to harvesting for electrocompetent
cell preparation. The purified PCR products were then electroporated into the competent cells.
Successful integration was confirmed by PCR and by sequencing. Please see appendices A,B
and C for further details of strains, plasmids and oligonucleotides used.
2.4 Single cell analysis
2.4.1 Cell growth conditions
Single colonies were picked from plates and used to inoculate 5ml of EZ defined rich media
+ 0.4% glucose and grown overnight on wheel in 37C incubator. After 16 hours of growth
overnight cultures were diluted 1:100 in to fresh media and grown for a further 5hrs at 37C.
38
2.4.2 CDI Planktonic competition assay
Measurement of the effectiveness of inhibition of CDI systems was performed using a method
based on that reported in (Aoki et al., 2010). E. coli target strains used were susceptible to CDI
(lacking cdiI) but containing a selectable marker present only in the target strain (kanamycin
or chloramphenicol resistance in this work). Inhibitor strains tested were those expressing the
relevant CDI system or controls in which the CDI system was disrupted, typically by deletion
of all or part of the cdiA gene. Inhibitor and target strains were grown overnight from single
colonies in 5ml LB + antibiotic if appropriate at 37C. Inhibitor cultures were then diluted
down 100 fold (0.5ml O/N culture to 50ml LB) in baffled flasks and grown at 37C in a shaking
incubator at 200rpm to an OD600 = 0.3 ( 1h 45 mins growth time). Overnight target cell culture
was then added to give an effective target concentration of OD600 = 0.01 in the flask and growth
continued. Samples of culture were taken at time of addition of target cells and after 3 hours
of cell growth. Target cell colony forming units (cfu) were determined by serial dilution of
samples, plating out on LB agar plates with suitable antibiotic and counting of colonies on
plates in 10-100 colonies/ plate range.
2.4.3 Casting of agarose pads
A variety of different casting methods were trialled with the one described in (Young et al.,
2012) being identified as the most suitable to take forward for the bulk of the analysis. Briefly
the progression was from:
• Pads excised from normal media plates in standard sized petri dishes mounted on stan-
dard lab slides.
• Pads excised from thinner than normal (10ml vs 25ml media/agar volume) placed in
cover slip bottomed petri dish.
• Pads cast using low melting point agarose between glass cover slips place in cover slip
bottomed petri dish.
Fresh EZ defined rich media + 0.4% glucose was prepared by aseptically mixing 5ml of x2
EZ defined rich media stock solution, 4.8ml autoclaved water and 200µl 20% glucose stock
solution. 0.15g of low melt point agarose was added to the 10ml of media in a 50ml sterile dis-
posable plastic centrifuge tube and microwaved in a 800W microwave oven for 20sec medium
setting, 10 sec low setting, 10 sec simmer setting. In between each heating the tube was briefly
vortexed. The solution was then examined to confirm that all of the agarose had dissolved and
an additional 10 sec simmer setting heating performed if required. Once all the agarose was
dissolved a final 3 sec simmer heating was performed with no vortexing to aid elimination of
39
bubbles from the mixture. The solution was then left to cool for 2 minutes at room tempera-
ture on the bench. The required number of 22x22mm cover slips were placed onto parafilm
on the bench and 1ml of 1.5% agarose solution pipetted per cover slip, ensuring no bubbles
were present. This was followed immediately by the careful dropping of a second cover slip
from just above the solution surface so as to create a glass, agarose, glass sandwich which due
to surface tension is perfectly level and even.
2.4.4 Microscopy
A Zeiss Axiovision 200 microscope was equipped with the equipment detailed in Table 1. In-
cubation at 37C was started at least 18 hours prior to the start of the experiment in order
to ensure thermal equilibrium had been reached including ensuring the lens oil was in the
hotbox. At least two hours prior to acquisition a check of microscope bright field alignment
was performed to ensure Köhler illumination was correctly set up, a requirement for high qual-
ity phase images to be obtained. This was performed on an empty coverslip bottomed petri
dish with a pen mark to aid focus which was sufficiently similar to the pad dishes that only
minor adjustment of condensor position was required. Fluorescence source was turned on
30 minutes prior to use to ensure stable emission. Samples were prepared using a lab made
hotbox consisting of a 20cm x 10cm x 10cm sealable plastic container with two 30ml sterilins
to act as thermal mass. Aliquots of samples and dishes were stored in this container and ma-
nipulations performed on the container to minimise thermal shock to the cells. 1µl of each
strain to be studied were pipetted onto the glass cover slip portion of a prewarmed cover slip
glass bottomed petri dish (MatTek P35G-1.5-14-C 35mm petri dish 14mm Microwell, no. 1.5
cover slip (0.16-0.19mm)) so that their surface tension kept them apart. A 5mm x 5mm pad
was freshly cut from a prewarmed pad using a sterile scalpel and carefully placed over the two
droplets so that they spread and mixed as a thin layer between the pad and the cover slip. This
process was then repeated for up to five different pads per dish.
2.4.5 Image analysis
Images stacks acquired in Axiovision zvi format were imported into OMERO and converted to
OME-TIFF format as part of this process. As time lapses were acquired as a series of separate
image stacks the stacks corresponding to the field of view to be analysed were concatenated
in Image J (Schneider et al., 2012). The concatenated image stack containing solely sequen-
tial phase contrast images was then taken forward for processing by two routes. Firstly the
assignment of cell outlines was performed using MicrobeTracker version 0.935 (Sliusarenko
et al., 2011) software running in Matlab R2010b (7.11.0) with the corresponding version of the
Matlab Image Processing Toolbox. Full software processing instructions are available from
the website but in brief the image stack to be processed was imported and aligned using the
40
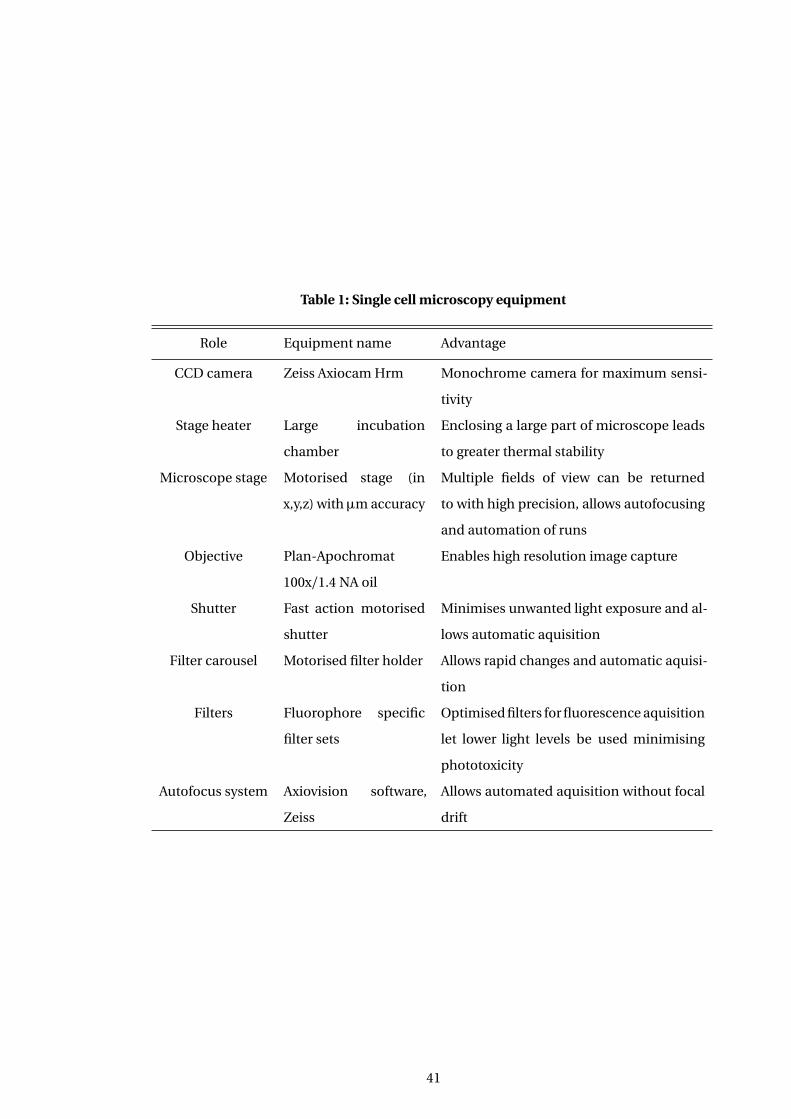
Table 1: Single cell microscopy equipment
Role Equipment name Advantage
CCD camera Zeiss Axiocam Hrm Monochrome camera for maximum sensi-
tivity
Stage heater Large incubation
chamber
Enclosing a large part of microscope leads
to greater thermal stability
Microscope stage Motorised stage (in
x,y,z) with µm accuracy
Multiple fields of view can be returned
to with high precision, allows autofocusing
and automation of runs
Objective Plan-Apochromat
100x/1.4 NA oil
Enables high resolution image capture
Shutter Fast action motorised
shutter
Minimises unwanted light exposure and al-
lows automatic aquisition
Filter carousel Motorised filter holder Allows rapid changes and automatic aquisi-
tion
Filters Fluorophore specific
filter sets
Optimised filters for fluorescence aquisition
let lower light levels be used minimising
phototoxicity
Autofocus system Axiovision software,
Zeiss
Allows automated aquisition without focal
drift
41
built in automatic tool. In some cases purely automatic alignment was not successful and so
an additional MicrobeTracker alignment tool was used which allows for manual marking of
a constant position which is then used as an anchor for image correlation between frames to
generate an aligned image set. As the pads imaged always contain some slight imperfections
from the casting process which are visible in the phase contrast images one of these which
remained outside of the areas of microcolony growth for the time period to be analysed was
chosen as a marker site. Once aligned the alignment was saved as a Matlab file so that it could
be reconstituted at a later date if required, the images were then shifted so that the final outline
assignment would be available as an aligned data set.
Images were processed using the independent frames setting as the time lapse outline
assignment was found not to be robust after the initial period of micro colony growth. Segmen-
tation was assessed using the preview mode so as to ensure clear cell outlines were obtained
and appropriate parameters adjusted if required, see Table 2. Based on the initial fluorescence
images target cell and inhibitor/deletion mutants were identified and regions were interaction
occurred were taken forward for analysis. Automatic assignment of outline was performed and
then reviewed to identify any cells which had incorrect outline assignment for example due
to inappropriate splitting of a cell outline for a cell that had yet to divide. As only the growth
of target cells needed to be followed outline assignment was performed for all target cells in
the region analysed but only for inhibitor / deletion mutant cells were it aided interpretation
as to the contact point of the differing microcolonies.
Cells which had thus been identified were then corrected using the manual options in-
cluded in MicrobeTracker (e.g. Split, Join etc.). This process was repeated for all frames up
until buckling and overriding of the cells was visible in the images as at this point it is no
longer possible to assign areas to the cells lying out of the horizontal plane of view. After cor-
rection the data set was exported to Excel as a matrix of cell numbers per frame with measured
area and length, in addition an image stack of the phase contrast image overlayed with the cell
outline and cell number plus frame reference was exported in preparation for the next stage
of analysis.
Building on the individual cell parameters the next stage performed was to assign this
data to the appropriate cell lineages. Annotation of the overlay image stack was performed
by importing the stack into ImageJ and manually annotating each lineage using differently
coloured dots to represent each unique cell. On cell division the mother cell, cell with old pole
(assigned randomly for cells in first frame of experiment) retains the same coloured dot and the
daughter cell is assigned a new coloured dot. By iterating through all possible lineage branches
of the target cells in the initial frame a complete annotation of lineage is obtained. Comparison
of this annotated image stack is then made to the snapshot fluorescent images taken for strain
assignment to both confirm that target strain lineage has been assigned appropriately and to
42
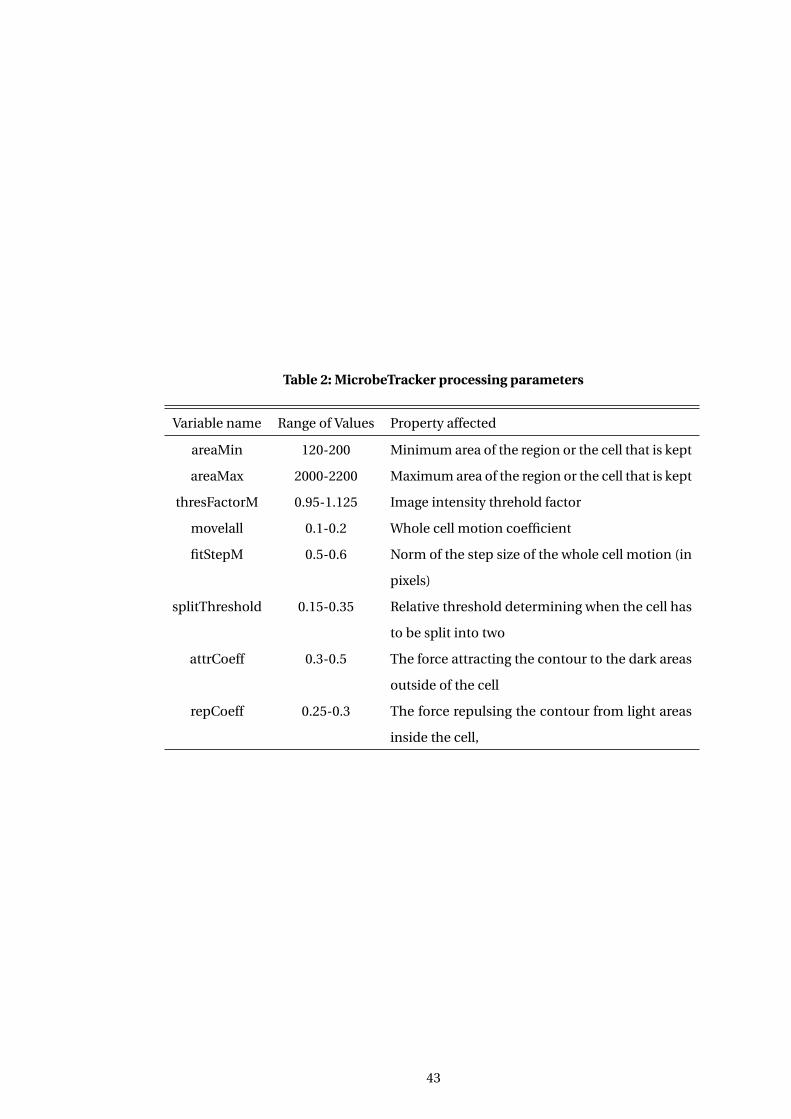
Table 2: MicrobeTracker processing parameters
Variable name Range of Values Property affected
areaMin 120-200 Minimum area of the region or the cell that is kept
areaMax 2000-2200 Maximum area of the region or the cell that is kept
thresFactorM 0.95-1.125 Image intensity threhold factor
movelall 0.1-0.2 Whole cell motion coefficient
fitStepM 0.5-0.6 Norm of the step size of the whole cell motion (in
pixels)
splitThreshold 0.15-0.35 Relative threshold determining when the cell has
to be split into two
attrCoeff 0.3-0.5 The force attracting the contour to the dark areas
outside of the cell
repCoeff 0.25-0.3 The force repulsing the contour from light areas
inside the cell,
43
allow marking of inhibitor/deletion mutant cells when they have come into contact with target
cells. This final annotated image is then used as the basis of manual transcription into an Excel
file of the cell numbers for a given cell lineage through the time course of the experiment with
additional annotation of cell division points, links to daughter cells and contact with inhibitor
cells being recorded. These cell number lists were then correlated with the cell parameters
exported from MicrobeTracker using a custom spreadsheet to automatically transpose the
appropriate data using built in Excel array search functions.
This data was then transposed to a single column format in Excel and further manually
annotated with cell cycle and cell lineage numbers and the resulting data exported as a CSV file.
R (R Core Team, 2013) (ver 2.14,2.15 and 3.02) using Rstudio (RStudio, 2014) with R packages
ggplot2(Wickham, 2009), plyr(Wickham, 2011), lme4(Bates et al., 2013), reshape(Wickham,
2007), scales(Wickham, 2012), devtools(Wickham et al., 2013) was then used to perform a
linear regression fit to the data on a per cell cycle basis with the slope of this graph being taken
as a measure of the growth rate in arbitrary units. This data was also graphed using per cell
cycle and per lineage binning in order to assess the quality of a linear fit to growth rate and to
look for general trends in interactions.
2.5 Initial biofilm flow cell protocol
2.5.1 Cell growth conditions
Single colonies were picked from plates and used to inoculate 5ml of LB broth and grown
overnight on wheel in 37C incubator. After 20 hours of growth overnight cultures were either
used directly for inoculation or diluted down using fresh LB broth to give final OD600 of 0.8 or
0.016 dependent on co seeding conditions required.
2.5.2 Flow cell assembly
All parts were autoclaved prior to use. Assembly was performed in a laminar air flow (LAF)
cabinet as no additional sterilisation procedures were used prior to running the experiment.
To allow co seeding to be performed the flow cell (Model FC 281; Biosurface Technologies,
Bozeman, MT, U.S.A.) was half assembled and initial cell seeding performed, this culture was
then aspirated and the final assembly of the flow cell performed followed by tube and bubble
trap attachment. Media transfer from filtration apparatus was made in the LAF cabinet into
conical flask with bung and appropriate tube vents. The completed apparatus was then trans-
fered to the incubation chamber and peristaltic tubing installed into 205S Watson Marlow
peristaltic pump with the media container being placed in a 37C water bath. Media in its
sealed filtration container was equilibrated to 37C for several hours prior to transfer to the
final media vessel to ensure it was already at a suitable temperature for media flushes.
44
2.5.3 Initial flow cell growth and imaging
Co seeding protocols used a variety of different start inoculation concentrations dependent on
the requirement for how heavy an initial seed cell concentration was required. Heavier initial
inoculums lead to faster cell mass accrual within the time course of experiments. Cells were
inoculated in two stages using different approaches as the flow cell was assembled. Firstly
1ml of 1st cell inoculum dilution was pipetted onto each channel of the half assembled flow
cell in the LAF cabinet. This solution was spread out by pipette to ensure it contacted all of
the cover slip surface then covered with the top half of a sterile plastic petri dish to ensure
the solution was not dried out by the airflow of the LAF cabinet. An incubation of 1 hour at
room temperature was then performed with the inoculum then being aspirated by pipette
to waste with care being taken not to touch the glass surface to which the cells had adhered.
Final assembly and transfer as detailed above was then performed as rapidly as possible to
avoid the cells drying out.
The first media flush was then performed for 5 minutes at 5ml/min/channel after which
the inlet tubing was clamped to avoid any possibility of back flushing on injection. The second
inoculation was then performed via the injection ports built into the flow cell inlets with 1ml
of cell solution being injected using a sterile syringe. Post injection the inlet port was wiped
with 70% ethanol. Incubation of the 2nd seeding was performed for 1hr at room temperature
before the inlet clamp was released and the second media flush performed for 5minutes at
5ml/min/channel. The flow cell was then incubated for the required time at 37C at a flow
rate of 1ml/min.
After an appropriate incubation time (typically 14 hours) the flow was stopped and the
tubing on either side of the flow cell clamped so as to leave 20cm of tubing from the flow cell
to the clamps in order that the weight of the camps would rest on the stage edges and not
catch when the flow cell was maneuvered. The tubing was then cut and sprayed /wiped with
70% ethanol. The separated flow cell was carefully placed on a bed of tissues within a metal
tray with care being taken not to dislodge any bubbles that may have formed during the time
course of the experiment. The flow cell was then taken immediately to the microscope for
imaging with all subsequent steps being performed at room temperature.
Confocal microscopy was performed on a Zeiss LSM 710 /Axio Observer.Z1 invert confocal
microscope using filters and laser lines suitable for the fluorescent proteins used as detailed
by Lakins and colleagues (Lakins et al., 2009). Due to the dimensions of the flow cell used
the microscope set up required some modifications in order to be able to access the optical
surfaces without fouling the surrounding metal frame. All objectives apart from the one used
for imaging (x40 DIC or x63 Ph oil, ). The remaining objective was then mounted on a brass
extension collar. Finally the normal stage holder fitting was removed and a custom made stage
insert fitted. This set up along with warming up of lasers and software parameter configuration
45
was performed prior to terminating the flow cell flow so as to minimise hold time post flow stop.
The flow cell was carefully balanced on top of the stage insert with the cover slip side pointing
downwards and taped into place if required. If required oil was applied onto the objective
and applied across the cover slip surface by manipulating the stage. A second application of
oil was then made to the objective to ensure sufficient oil would be present as the objective
tracked over relatively large distances. Care was taken to ensure the objectives were not crashed
into the frame as there was very little clearance. A mid channel position was used for image
acquisition as the objective could not fit in the cell edges. Images were acquired sequentially
from the two channels as movement between the two channels required the objective to be
fully wound away from the surface and then carefully brought back to the next channel due
to the presence of the metal holding frame between the channels.
After image acquisition was completed the flow cell was reattached to the original tubing
and the whole system flushed with water. On completion of the water flush the system was
dismantled with the flow cell being cleaned of glass and sprayed / wiped with 70% ethanol
prior to autoclaving of all used parts and fresh tubing cut to size as required.
2.6 Second biofilm flow cell protocol
2.6.1 Cell growth conditions
Single colonies were picked from plates and used to inoculate 5mls of LB and grown overnight
on wheel in 37C incubator. After 16 hours of growth overnight cultures were diluted 1:100 in to
fresh media and grown for a further 9hrs at 37C. At this time point OD600 readings were taken
of diluted samples (dilution performed in M9 salts) and assuming samples had an undiluted
OD600 of 3.2 they were diluted in 2mls of fresh media to as to give a final OD600 of 0.016.
2.6.2 Flow cell assembly
All parts were autoclaved prior to use except the polycarbonate flow cell, see Appendix D for
design based on previous work by Pamp, Wolfaardt and colleagues (Pamp et al., 2009; Wolfaardt
et al., 1994), which is not suitable for autoclaving. Then a glass cover slip (22 x 22 mm, no. 1.5,
SLS) required to complete the flow cell was glued over the channels using silicone glue (RS code
no. 692-542) and left to adhere at room temperature for at least 24 hours to ensure curing of the
glue was complete. Tubing and flow cell were assembled on the bench and transfered to 37C
incubator. Sanitisation in place (SIP) was performed in place using 0.5% Sodium hypochlorite
in water with a minimum contact time of 2 hours with 0.175ml/min flow rate. System was filled
and drained at least twice during this procedure to ensure full contact on all areas (no areas
shielded by bubbles of air). After completion of SIP the system was flushed with 0.2µm filtered
water for two hours with multiple flushes of the system and swapping to fresh water containers
46
to ensure complete removal of hypochlorite from system. While this SIP protocol was being
performed a filtered media vessel was fitted with autoclaved piping and prewarmed in a 37C
water bath to give chance for degassing to occur prior to flow commencing. Immediately after
SIP rinse was completed connection was made between media vessel and flow system to
complete the system.
2.6.3 Flow cell growth and imaging
Inoculation of media equilibrated flow cell was performed using needle and syringe. The
tubing area to be injected was first wiped with 70% ethanol solution , the inlet to the flow
cell clamped and the peristaltic tubing/frame released from the pump to allow free flow of
inoculum. The needle was then gently inserted into the tube ensuring that only one wall of
the tube was penetrated and the culture pushed in as gently as possible (1ml in 1min 40 secs).
The peristaltic tubing/frame was then replaced into the pump. The area was then sealed with
a small blob of silicone glue. This process was repeated for each channel with the incubation
time starting once all channels had been inoculated. At the end of the incubation period
the clamps were released and the pump run at 0.875ml/min for 5 minutes in order to flush
non adhered from the flow cell. Once the flush was completed the procedure was repeated
for a second set of inoculation injections. The coseeded flow cell was then incubated for the
required time at 37C with a flow rate of 0.175ml/min.
After an appropriate incubation time (typically 9 hours) the flow was stopped and the
tubing on either side of the flow cell clamped so as to leave 15cm of tubing from the flow
cell to the clamps in order that the weight of the clamps would rest on the stage and not
act to lift the flow cell up. The tubing was then cut and the ends sprayed / wiped with 70%
alcohol so as not to contaminate the microscope with bacteria. The now separated flow cell
was carefully placed on a bed of tissues within a metal tray to protect it and kept at room
temperature from this point forward. The flow cell was immediately transfered to the confocal
microscope which had been previously initialised for use, to ensure there was the minimum
delay in observation time from stopping the flow of media. The flow cell was gently transfered
to the stage holder (standard sized slide adjustable length holder used) and clamped into
place, with care being taken to ensure the cover slip glass bottom was not crushed. The short
distance of the remaining lines were placed so as not to interfere with stage movement and
taped into place if required. Secondary adjustment of flow cell position was performed if initial
observation of confocal stacks indicated that a planar arrangement had not been achieved.
Confocal microscopy was performed using a Zeiss LSM 510 meta / Axiovert 200M confocal
microscope. No exchange of objectives was required with this flow cell design, but the imaging
protocol followed was otherwise as described in Section 2.5.3. As images were acquired across
a large area of the cover slip surface care had to be taken to ensure a sufficient level of lens oil
47
was applied to maintain sufficient contact as the oil immersion lens traversed long distances.
This was achieved by adding oil to the lens and using the stage to move this across the surface
of all the areas to be observed. A second lot of oil was then added to the lens and observations
commenced. As confocal z stacks take a non trivial amount of time to collect and the flow of
media was no longer occurring care was taken with the order of image stack acquisition so
as not to possibly bias results. Images were acquired at the same relative x position in each
channel before moving on to the next x position and so on iterating down the channel. In
this way images from each channel were acquired at similar times so that any effects of hold
time would not skew results between channels. Suitability of confocal acquisition parameters
were checked at the start of each experiment to ensure a signal utilising the full range of the
confocal detector was obtained and that the ramping of laser power and detector sensitivity
with increasing z depth was sufficient to allow cell detection.
After image acquisition was completed the flow cell was reattached to the original tubing
and the whole system SIP’d using the protocol described in the previous section. On comple-
tion of the water flush the system was dismantled with tubing / small parts being immediately
autoclaved with fresh tubing being cut to length and autoclaved as required. The flow cell was
prepared for subsequent work by carefully removing the coverslip and associated glue using
a scalpel to carefully scrape clean the flow cell surface. The surface and built in tubes were
cleaned with 70% ethanol and air dried ready for the next experiment.
2.6.4 Flow cell growth and time-lapse imaging
In order to perform time-lapse imaging analysis a change to the above protocol was required
to allow mounting of the flow cell on the microscope stage with flow of media. . Time-lapse
imaging analysis was performed with amendments to take advantage of the availability of a
confocal microscope with a full stage incubator. The media was preheated to 37C and using
a smaller reservoir vessel, capable of fitting in the incubator itself, a temperature controlled
supply of media could be provided at the microscope. This was then connected to the flow
cell with tubing being carefully secured to the stage by tape at positions which would not
interfere with its operation. The tubing then exited the incubator for the remainder of the
flow path allowing the pump to be situated away from the microscope on a separate part of
the table from the vibration platform to ensure its operation did not affect the stability of the
microscope. In order to avoid the potential leakage of aggressive chemicals onto expensive
equipment the SIP and rinses, which were performed as detailed above, were performed in
the main lab and the assembled apparatus then transfered to the microscope with out any
need for connections to be broken and remade, hence there was no increase in contamination
potential.
The experiment was then conducted in a similar manner to that detailed in section 2.6.3.
48

Sufficient tubing length was used so that the flow cell could be removed from the incubator
enclosure for inoculation both for practically of access and to avoid any chance of getting
glue on the optic path / other parts. Unlike the issues with pulsation reported in (Lakins et
al., 2009) when imaging with the flow on the inversion of pump placement to suck media
through the flow cell resulted in a smooth flow that did not give any artefact’s within the z
stack. Images were acquired at one to three hour intervals dependent on the rate of biofilm
growth to minimise the effects of over exposure to fluorescent light by observing only at points
when significant change will have occurred.
49
Chapter 3
Single cell analysis method
development
3.1 Introduction
In order to perform image based analysis of bacterial cells at the single cell level three different
stages of the protocol must be operating effectively. Firstly software capable of measuring the
size parameters of individual bacterial cells automatically is required. Secondly the prepara-
tion of the bacteria for microscopy must allow growth over several hours while maintaining a
planar field of view that is compatible with phase focus microscopy. Finally the microscope
used must be capable of acquiring high quality images of multiple fields of view during time
lapse experiments. The method development performed to optimise each of these stages is
detailed in the sections below.
3.2 Single cell image analysis
With advances in computational power and software techniques it has become possible to
quantify images rather than simply make qualitative statements on the phenomena they repre-
sent. Commonly available computer hardware is now sufficiently powerful so as to allow image
processing without dedicated high end workstations. Image analysis of bacteria presents a
number of unique challenges due to the small size, rapid movement and the frequency of
cell division under growth under common experimental conditions. A successful option for
analysis must be able to cope with all these different constraints.
3.2.1 Survey of software options for analysis single cell level bacterial images
Three main classes of imaging analysis software can be identified that are relevant to research:
1. Commercial packages which are general in scope, being capable of analysing a wide
50
range of types of images in a variety of ways but also tending to be biased to match
the work flow required for the most popular work flows, for example eukaryotic cell
analysis using confocal microscopy. Examples of these programs would include Imaris
and Volocity (Perkin Elmer). This kind of software while expensive is often provided as a
service by Imaging facilities and has a significant of support available from both vendors
and public forums and colleagues.
2. General academic projects which are multi year funded from technical grants with the
aim of providing free customisable software to aid research groups work. The classic
example of this is ImageJ (Schneider et al., 2012) which contains a core set of imaging
tools useful in almost any image processing situation. In addition due to its ubiquity and
extensible nature, it has a plethora of plugins to allow more specialised analysis which
are widely shared / packaged (e.g. LOCI) within the community. Support is available via
public forums and colleagues.
3. Specific lab software which has been generated in support of work done in a scientific
grant. In this case the software has been written to fill a specific analytical need in the
authors lab e.g. Schnitzcell (Locke et al., 2009) , MicrobeTracker. (Sliusarenko et al., 2011).
As the software was not written for general use it may lack significant documentation,
it will have no ongoing support as the developers have moved onto other projects and
significant bugs / inabilities to run in other computing environments may exist. However
it is likely to be an extremely focused solution to a specific analytical problem that may
not be tractable using the tools available from routes outlined in a) or b).
The image analysis work flows used in this thesis were developed using a blend of all three
kinds of software identified as offering the best solution after trial of the most relevant options
used in the literature.
In order to follow bacterial growth in mono layers the class of image to be followed needs
to be determined with the options being light microscopy or fluorescence microscopy both
of which have their own unique advantages and disadvantages. In order to visualise bacteria
by light microscopy a method to increase the contrast of the bacteria from their background
is required as due to their small size and transparent nature they are otherwise only barely
distinguishable. The historic methods of staining bacteria while capable of revealing even fine
details (e.g flagella staining (Mayfield et al., 1977)) are not compatible with live cell imaging.
Instead physical methods of manipulating the light field can be used of which the most relevant
to bacteria is the use of phase contrast microscopy. This technique uses the difference in
refractive index as a way to introduce contrast with the more commonly used positive phase
contrast giving dark cells on a light grey background. However as the contrast generating
mechanism is dependent on the density differences around samples dense dark cells are only
51
obtained when bacteria are spread singly or in small groups (< 4 cells). As microcolonies grow
in a mono layer rod like cells naturally grow in a raft like manner with adjacent cells closely
opposed (Shapiro et al., 1989). This leads to a marked change in the density surrounding
the cells, from the low density of agarose/media to the high density of a packed bacterial
cell body. During assay development it became apparent that an additional complication
was that interior cells, particularly those growing rapidly, exhibited a mottled appearance, see
section 3.3. This lack of uniformity in the cell interiors greyscale image further complicates
cell assignment.
Furthermore as a time lapse image of cells needs to be analysed there needs to be a method
(either manual or automatic) to follow the growth and splitting of cells into mother and daugh-
ter cells and to link the measured areas to this lineage. Finally as CDI is a contact dependent
phenomenon a method to track when interaction between cells of differing microcolonies
occurs. In order for any of these approaches to be viable excellent quality images must be avail-
able for analysis, that is high resolution with even illumination, minimum of phase artefact’s
due to imperfections in mounting medium. Details of how this was achieved are given in the
appropriate method development section.
In combination these factors present a complicated problem for computational analysis
which requires dedicated software in at least part of the pipeline. The common approach
taken is too generate an outline of each bacterial cell. This cell outline can hence be used to
calculate the length, width and area of the bacterial cell it was derived from. By examining the
same cell in a series of time lapse images a measure of its growth rate can be made by plotting
cell area over time, as the cell grows the area increases up until the point of cell division at
which point the cell area will be assigned to the mother and daughter cells. An additional
level of information can be determined if a grid is superimposed across the cell shape to allow
determination of positioning of secondary imaging data, commonly focal fluorescent signals
originating from labeled or tagged proteins.
The first step that is taken by all the laboratory software that has been reported in the
literature is to perform a watershed transformation of the image from greyscale to black/white
with transition parameters defined so as to pick a greyscale cut off that leaves filled cell blocks.
This simplified image is then amenable to outlining by computational analysis. Programs
such as Schnitzcell (Young et al., 2012) leave the refinement of cell outlines at this point. Some
groups have however focused on questions which required more precise localisation within
a cell framework and/or application to cells with an elongated phenotype. In these cases
as simple thresholding will not lead to an assignment of cell shape with sufficient accuracy.
MicrobeTracker software (Sliusarenko et al., 2011) takes a more sophisticated approach to
allow refining of cell outlines based on the initial water shedding analysis. In this case for
each individual cell an iterative force based refinement is performed see Figure 3 with a wide
52
variety of parameters being used to model attraction to areas of an image that represent the
cell and repulsion from areas of the image that represent areas outside the cell. Once this
refinement is confirmed cell areas are compared and overlapping cell areas assessed for joining
and elongated cells checked for splitting, based on areas within outline that represent ’pinch
points’ in cell outline. Once completed on the whole of area of an analysed image this approach
can cope with cells that are elongated and with cells that do not exhibit a uniform interior level
of contrast. Whichever approach is taken it is common for a manual method of cell outline
assignment to be included as perfect assignment rarely occurs for all cells in a crowded field.
To assign lineage a comparison between images in a time lapse must be made, as the
lineage is of the cells being observed this is in fact done on the processed image. In order
for this approach to be practical it is essential that the images to be worked on are correctly
aligned. That is any shift in the field of view is taken into account. Ways to minimise shift are
discussed in the relevant section but even with those approaches some degree of shift will
always have occurred when working at the high magnifications required to study bacteria.
Correct alignment can be recovered in three possible ways.
• Manually : shifting of image alignment using minor defects in the agar the cells are
embedded in is possible for small numbers of images but quickly becomes impracticable
• Semi automatically : Time lapse series of images are marked with a cardinal point which
represents a known same point. This can be added deliberately for example by including
a low level of beads in cell mix (Young et al., 2012). But practically there is always a minor
defect that can be picked out on the agarose surface. Once this known good position
has been marked in all frames or at least those before and after any significant shifts it
is a simple matter for a computer program to use this data to correct alignment.
• Fully automatically : Algorithms exist to automatically calculate alignment and are gen-
erally effective however due to the nature of the images where significant changes across
the field are occurring with a large number of similarly shaped objects it is possible for
them to become ’confused’ and miss assign frames in which case the semi automatic
method can be used as a fall back.
These options are all based on shifts of the whole image frame (i.e. same manipulations
for each x,y position) rather than the approach taken for example in correcting lens defects
were the transform applies across the image would vary by position.
For lineage assignment two different approaches have been taken in the literature, firstly
the simplest approach is to take each image as an independent frame generate cell assign-
ments for all these frames then use comparative algorithms to assign the most probable cell
location in the following frame based on previous location and extent of shift. When the pre-
dicted position of a cell now contains two cells a cell division event can be assigned. The
53
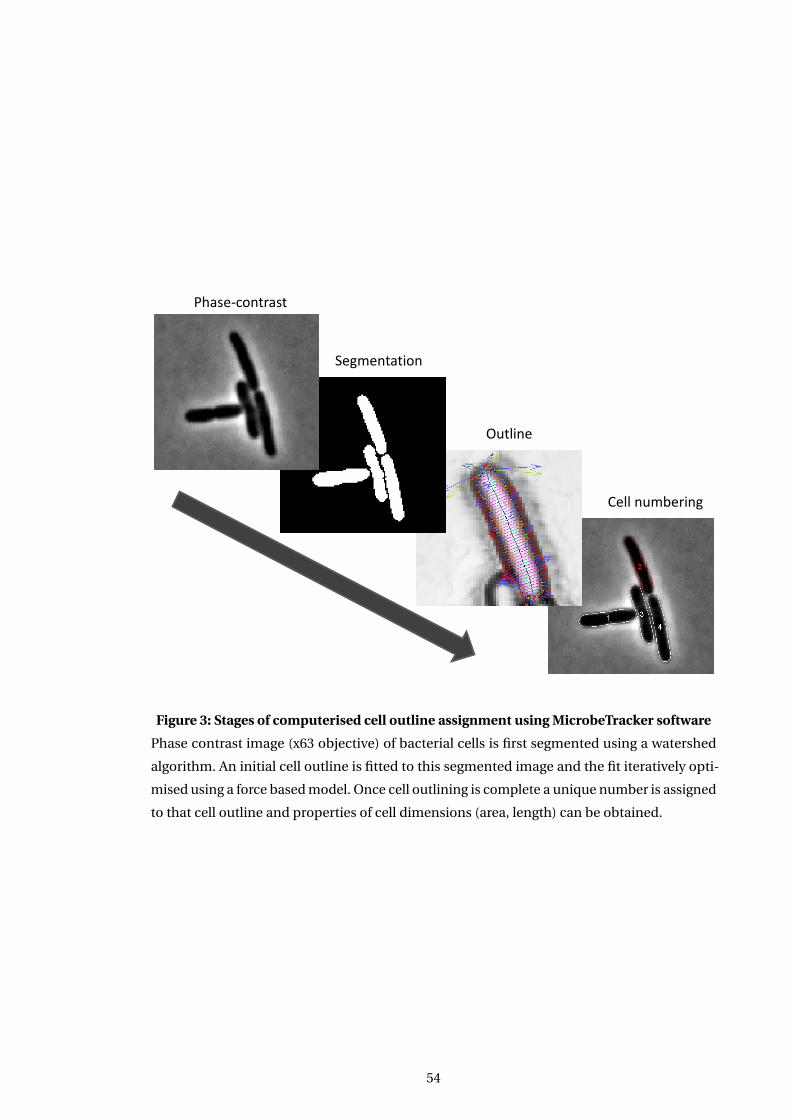
Phase-contrast
Segmentation
Outline
Cell numbering
Figure 3: Stages of computerised cell outline assignment using MicrobeTracker software
Phase contrast image (x63 objective) of bacterial cells is first segmented using a watershed
algorithm. An initial cell outline is fitted to this segmented image and the fit iteratively opti-
mised using a force based model. Once cell outlining is complete a unique number is assigned
to that cell outline and properties of cell dimensions (area, length) can be obtained.
54
second approach is to use the information that the individual images are related in time to
systematically work through from the start of image acquisition using the previous images cell
assignments as the basis for analysing the watershed image of the next frame. This approach
is potentially more robust as it should be able to generate cell assignments ready for lineage
assignment that are more likely to reflect the actual biological lineage that is being measured.
Both of these approaches rely on there being sufficient information in the images to un-
ambiguously assign cell lineage. In terms of growth of bacteria in mono layers this equates to
having sufficiently frequent observations (~3mins for log phase growth E. coli based on the
literature, (Campos et al., 2014)) that the movement of cells between frames is not too large.
Even with a short time frame of observation the cumulative effects of cell growth can lead to
relatively large shifts in cells position within a micro colony so often the ability to manually
intervene in assignment of cell lineage is included.
Once analysed data is then available as an array of cells per frame with relevant parameters
and if lineage has been assigned information on unique arbitrary cell identifying number and
number of divisions plus which cells that cell is related too as mother / daughter.
3.2.2 Identification of software solutions for lineage tracking and analysis
Initial work looked at the commercially available software packages but it quickly became
apparent that the generic approaches were more suitable to analysis of eukaryotic cell move-
ments which tend to be better separated and of a different character to the bacterial images.
Attempts to use with bacterial images failed to extract biologically relevant assignments.
ImageJ was then used and the variety of plugins examined to determine if a suitable option
existed. It was found that some parts of a complete work flow were possible but critical capa-
bilities were lacking as detailed below. A number of water shedding solutions are available to
enable initial segmentation of the images to a suitable level. Tools also exist to allow image
alignment of time lapse images. However ways of assigning outlines to the water shedded
images that were robust in rejecting any stray pixels that have been assigned from the back-
ground were not available, with outlines tending to follow the contours of the water shedding
cutoff. In addition while a variety of particle tracking plugins are available they are focused
on dealing with tracking point sources within images from frame to frame (e.g. chemotaxing
bacteria, beads in solution) and are not appropriate for use with mono layer bacterial images.
Hence there is no appropriate automated tool for lineage assignment in ImageJ.
As the generalist tools I had previous experience of were not capable of analysing the
images I was generating I reviewed the literature on bacterial image analysis and identified
two pieces of academic laboratory software that were stated to be publicly available with some
level of documentation and had been used in multiple laboratories in the field. These were
Schnitcell from the Elowitz laboratory and MicrobeTracker from the Jacobs-Wagner laboratory.
55
Firstly I trialled the Schnitzcells software as it comes from the laboratory of one of the
key exponents of bacterial imaging quantification and has been widely cited in studies in
other labs (Adiciptaningrum et al., 2009; Locke et al., 2009). The code is publicly available and
is partly open source but comes with no support and is not maintained. The software runs
analysis in a modular manner and I was able to successfully use the first part of the analysis
pipeline. Unfortunately I was unable to get the later stages of the analysis software to run at all
despite testing on a wide variety of software platforms / versions. The error traced to the closed
source portion of the program and hence I wasn’t able to proceed further with troubleshooting
and had to move onto another option.
Secondly I trialled the MicrobeTracker software which is actively maintained and fully open
sourced. MicrobeTracker is built on top of MatLab and its add on package Imaging Toolbox
and consists of a main Graphical User Interface (GUI) interface for cell outline and lineage
assignment a secondary GUI for image frame alignment. Its standard output is a Matlab array
of cell dimensions and lineage if analysed. This can however be converted to a Excel (.xls) file
format if that is more convenient for work flow. In my hands MicrobeTracker has been a stable
and useful piece of software.
Initial trials were performed using the supplied example data and with reference to the
supplied documentation could be readily completed. Moving onto the data that I was generat-
ing there was initially less success in obtaining reasonable cell outline assignments. Extensive
iteration through the analysis algorithm options was made, guided by a clear understanding of
what each parameter was affecting. Initially this had limited success but as technical improve-
ments were made in image quality (see section 3.3) reproducible cell outline assignment with
only minimal manual intervention was achieved using the parameters detailed in Table 2. One
area that did require manual intervention was the selection of the micro colony area per frame
due to the water shedding algorithm being very dependent on the extent of background (i.e.
cell free) included in the image. It would appear this occurs due to the mottling in micro colony
interiors discussed elsewhere. Despite success in assigning cell outlines it proved impossible
to get correct lineage assignment beyond about 20 frames into the time lapse (equating to 60
mins of growth). It is unclear why assignment fails to work further into micro colony growth im-
ages in this study. A comparison of my data sets with those published as examples or included
in paper data sets does not yield any obvious difference beyond a slightly stronger mottling
effect in my data. Images are captured at equivalent µm / pixel pitches and post software
calibration are very well spatially calibrated. While there are no lineage specific parameters
exposed in the program, trials of different image processing parameters were undertaken to
determine if an alteration in these would improve lineage assignment, no such combination
was found.
While MicrobeTracker provided a solution that could robustly assign cell outlines and cal-
56
culate cell parameters on a per frame basis a solution was still required to assign lineage. As
no other automated options could be identified it was decided to implement a manual lin-
eage tracking work flow. While this does reduce the number of cells which can be practicably
measured it at least has the benefit of linking with the annotation of contact which would
probably require manual assignment in any case. ImageJ was chosen as the software to per-
form the tracking in as it has a flexible range of tools for working with image stacks allowing
cutting, cropping and image annotation. Cell lineage tracking could be performed by stepping
through the images marking each cell and iterating through to include daughter cells in later
frames. The cell numbers could then be manually transcribed and linked within excel to the
corresponding cell data using macros. As part of this process annotation of when cell contact
occurred between target and inhibitor cells was performed. Once completed this spread sheet
contained a full record of micro colony growth and interactions ready for statistical analysis.
3.3 Bacterial sample preparation for single cell image acquisition
An ideal acquisition protocol would be able to follow the growth of bacteria over several hours
at a rapid growth rate, due to CDI being effective only at log phase growth in planktonic assays,
with cells constrained to grow only in two dimensions (x,y) in order to allow unambiguous
observation of cellular positions. In addition multiple fields must be observable with high
clarity and excellent spatial accuracy and reproducibility. Phase contrast imaging quality must
be high and there should be a low background fluorescence level and no impediment to fluo-
rescence illumination.
Following on from work performed in my masters (King, 2010) I started with the most basic
methods available to observe bacteria, spreading on glass (free / immobilised) or sandwiching
of cells between glass cover slip and thick agar pads. Following bacteria on glass has a number
of significant limitations. If plain glass is used cells will show minimal levels of interaction with
the glass, unless significant pretreatment times are used. Those cells which are adherent will
tend to attach, at least initially, by flagella and hence the cells are in motion. In order to follow
interactions growth of the cells is required so a nutrient media must be supplied if this is solely
in the liquid phase only a thin layer is held by the cells limiting nutrient availability. In addition
the act of observing the bacteria using a microscope leads to a reasonable degree of heating
of the glass and solutions due to the high levels of illumination required when observing with
high power objectives (x63, x100). This heating induces convection flows which are significant
when working on the scale of bacteria leading to removal of the bacteria from the glass surface,
flowing freely in solution. Finally while the opposition of two high quality glass surfaces (cover
slip and glass slide in this case) is very close it is insufficient to hold bacteria in place or even
aligned to the plane of observation. Presumably this is because the hard surfaces are held
57
apart by any slight imperfections / environmental contaminations as they lack any give and
at the micron scale of bacteria the size of any such defects needs to be only very minor to have
an effect. It was however possible to use this approach to verify that bacteria were motile and
that fluorescent proteins introduced into strains were functional.
The next protocol trialled was to use slabs of agar cut from normally cast LB agar plates.
25ml of LB agar in a standard sized petri dish gives a depth of 7.5mm which was cut to approxi-
mately the size of a glass slide using a sterile scalpel. 5µl of overnight culture was then pipetted
onto the surface and spread by applying a cover slip. This approach gave a significant improve-
ment in images obtained as the soft surface of the agar adapts closely to the opposing glass
cover slip surface effectively surrounding the bacteria and pressing them against the cover slip.
As a uniform pressure is applied across the surface rod like bacteria will automatically orient
so that they lie flat against the glass, that is the length of the bacteria is parallel to the plane
of the cover slip. As the depth of the agar retains the LB it was cast with there are significant
levels of nutrients which can be maintained by diffusion through the pad available to the cells,
just as is the case during colony growth under the normal conditions agar plates are used.
By experimenting with a range of dilutions a suitable concentration of bacteria was iden-
tified which contained a significant number of cells but not so many that clumps of bacteria
were observed. If the concentration of bacteria was too high then a mono layer of cells was not
obtained and individual cells could not be observed. Observations were initially made across
multiple time points by transferring the bacterial slides between an incubator and the micro-
scope. As the sides of the slide were not covered this left a significant area open to evaporation.
In order to mitigate this slides were incubated in slide holders initially just as is but when this
proved to be inadequate to prevent dehydration with the addition of moist tissue to maintain
humidity. This combination provided a limited ability to observe growth as shown in Figure 4.
Problems encountered using this technique were:
1. The adherence between the cover slip and the top of the agar pad was limited which
combined with the use of high powered oil objectives which have to come extremely
close to the surface led to skewing of the cover slip across the surface dragging bacteria
from where they had been embedded.
2. LB has a significant level of fluorescence associated with it leading to high background
levels of fluorescence. In addition the depth of LB agar lends a significant colour cast
to light images but more significantly contains imperfections that are amplified under
observation using phase contrast objectives.
3. Evaporation could not be completely countered leading to eventual dehydration of the
cells (as shown by rounding up of cells) and prior to this distortion of the agar due to the
dehydration.
58
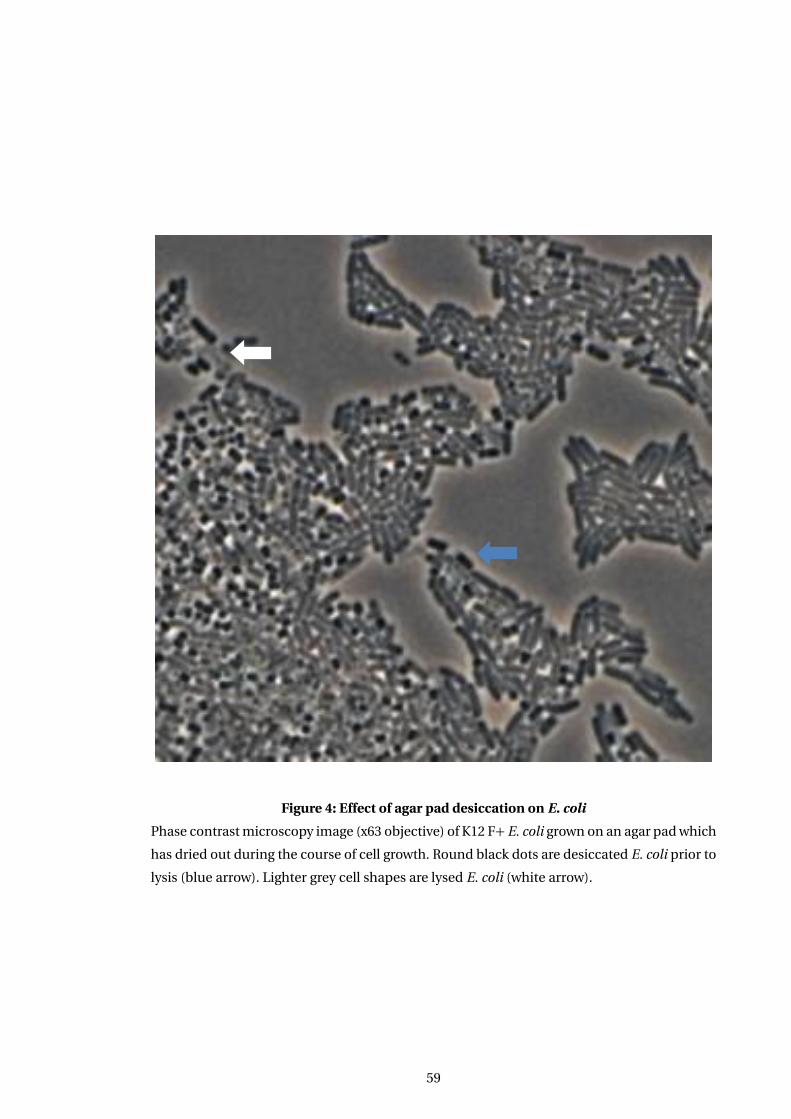
Figure 4: Effect of agar pad desiccation on E. coli
Phase contrast microscopy image (x63 objective) of K12 F+ E. coli grown on an agar pad which
has dried out during the course of cell growth. Round black dots are desiccated E. coli prior to
lysis (blue arrow). Lighter grey cell shapes are lysed E. coli (white arrow).
59
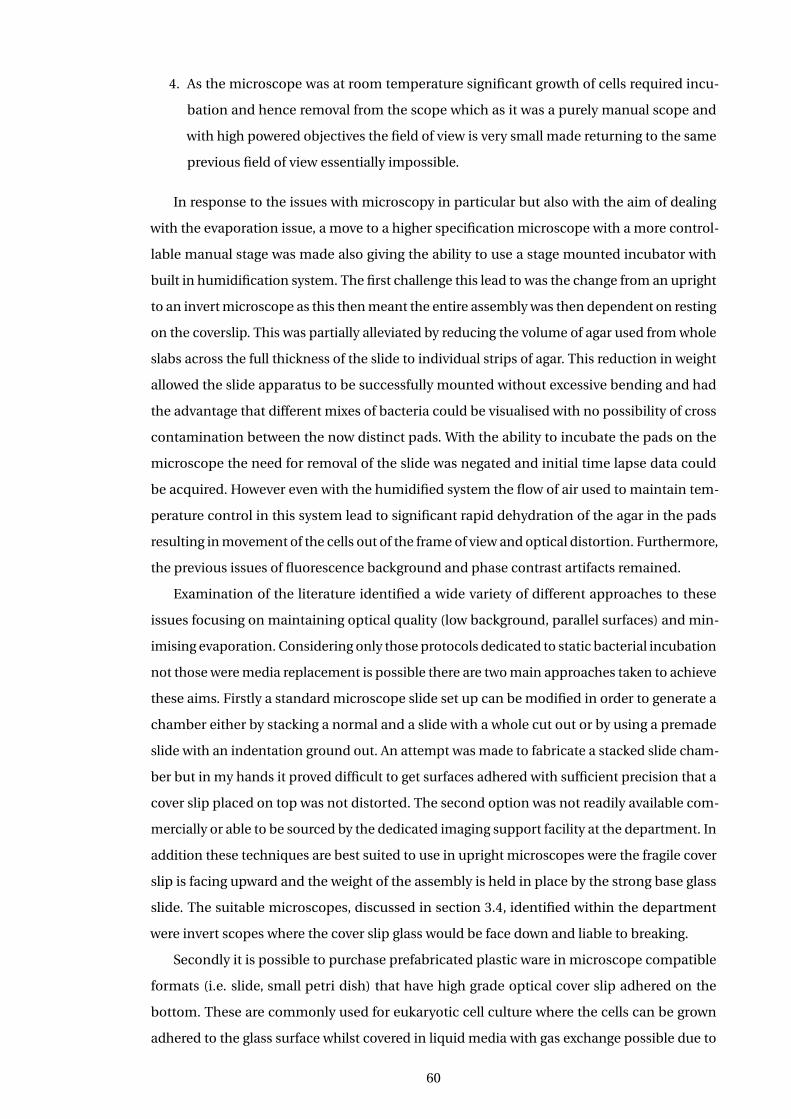
4. As the microscope was at room temperature significant growth of cells required incu-
bation and hence removal from the scope which as it was a purely manual scope and
with high powered objectives the field of view is very small made returning to the same
previous field of view essentially impossible.
In response to the issues with microscopy in particular but also with the aim of dealing
with the evaporation issue, a move to a higher specification microscope with a more control-
lable manual stage was made also giving the ability to use a stage mounted incubator with
built in humidification system. The first challenge this lead to was the change from an upright
to an invert microscope as this then meant the entire assembly was then dependent on resting
on the coverslip. This was partially alleviated by reducing the volume of agar used from whole
slabs across the full thickness of the slide to individual strips of agar. This reduction in weight
allowed the slide apparatus to be successfully mounted without excessive bending and had
the advantage that different mixes of bacteria could be visualised with no possibility of cross
contamination between the now distinct pads. With the ability to incubate the pads on the
microscope the need for removal of the slide was negated and initial time lapse data could
be acquired. However even with the humidified system the flow of air used to maintain tem-
perature control in this system lead to significant rapid dehydration of the agar in the pads
resulting in movement of the cells out of the frame of view and optical distortion. Furthermore,
the previous issues of fluorescence background and phase contrast artifacts remained.
Examination of the literature identified a wide variety of different approaches to these
issues focusing on maintaining optical quality (low background, parallel surfaces) and min-
imising evaporation. Considering only those protocols dedicated to static bacterial incubation
not those were media replacement is possible there are two main approaches taken to achieve
these aims. Firstly a standard microscope slide set up can be modified in order to generate a
chamber either by stacking a normal and a slide with a whole cut out or by using a premade
slide with an indentation ground out. An attempt was made to fabricate a stacked slide cham-
ber but in my hands it proved difficult to get surfaces adhered with sufficient precision that a
cover slip placed on top was not distorted. The second option was not readily available com-
mercially or able to be sourced by the dedicated imaging support facility at the department. In
addition these techniques are best suited to use in upright microscopes were the fragile cover
slip is facing upward and the weight of the assembly is held in place by the strong base glass
slide. The suitable microscopes, discussed in section 3.4, identified within the department
were invert scopes where the cover slip glass would be face down and liable to breaking.
Secondly it is possible to purchase prefabricated plastic ware in microscope compatible
formats (i.e. slide, small petri dish) that have high grade optical cover slip adhered on the
bottom. These are commonly used for eukaryotic cell culture where the cells can be grown
adhered to the glass surface whilst covered in liquid media with gas exchange possible due to
60

loose fitting lids. Both formats of plastic ware were trialled but the difficult of maneuvering
agar pads into the tight confines of the slide based format led to that being abandoned in
favour of the small petri dish style format. This has the advantage of much greater accessibility
for working with the small liquid volumes /mm pad sizes this technique requires. Initial work
used a large pad agar pad size cut directly from a normal petri dish cast to a lower than usual
level to give thinner pads. This work was also done with no seal on the pad lid. This approach
showed that even with the lid on the chamber there was still sufficient moisture exchange to
dehydrate the agar. In addition the image quality was not yet at the quality of the best examples
in the literature.
In order to improve image quality a trial of using low molecular weight agarose with a rich
defined media was performed as this was used by several labs in the field. This change lead to
a marked improvement in phase contrast image quality, see Figure 5 presumably due to the
combination of several factors:
1. The different plasticity of the low molecular weight agarose which may be better able to
envelop the bacteria
2. The loss of impurities from the cruder LB preparation which can be significantly magni-
fied in appearance due to the nature of phase contrast imaging
3. The loss of colour cast to the image moving from the yellow-brown cast of LB to the
visually clear defined media.
The move to a defined media also reduced the level of background fluorescence as the contri-
bution from autofluorescence of the complex mix of components in LB is absent.
In coordination with this change pad size used was reduced to 3mm x 3mm so as to be able
to fit several separate pads in one petri dish which were sufficiently separated so as to avoid
cross contamination of different strains, see Figure 6. To avoid the agarose drying out the petri
dish was sealed with a thin strip of Parafilm. The included air volume represents a significant
reservoir of oxygen for the quantity of bacteria being cultured over the experimental time of
observation and hence should not be limiting.
Experiments with this set up showed a consistent improvement in image quality but it was
still not quite at the level of previously published images. Also on occasion it was found that
the Parafilm seal would fail leading to desiccation of pads. The final changes to the protocol to
address these issues were to move to a new casting protocol, based on the work of Young and
colleagues (Young et al., 2012), in which the media/agarose mix was cast between two cover
slips relying on surface tension to give a very smooth parallel pad finish which contributed to
getting the image quality to a level which matches the best published images in the literature.
At the same time the sealing procedure was changed to use a thick bead of vacuum grease
61
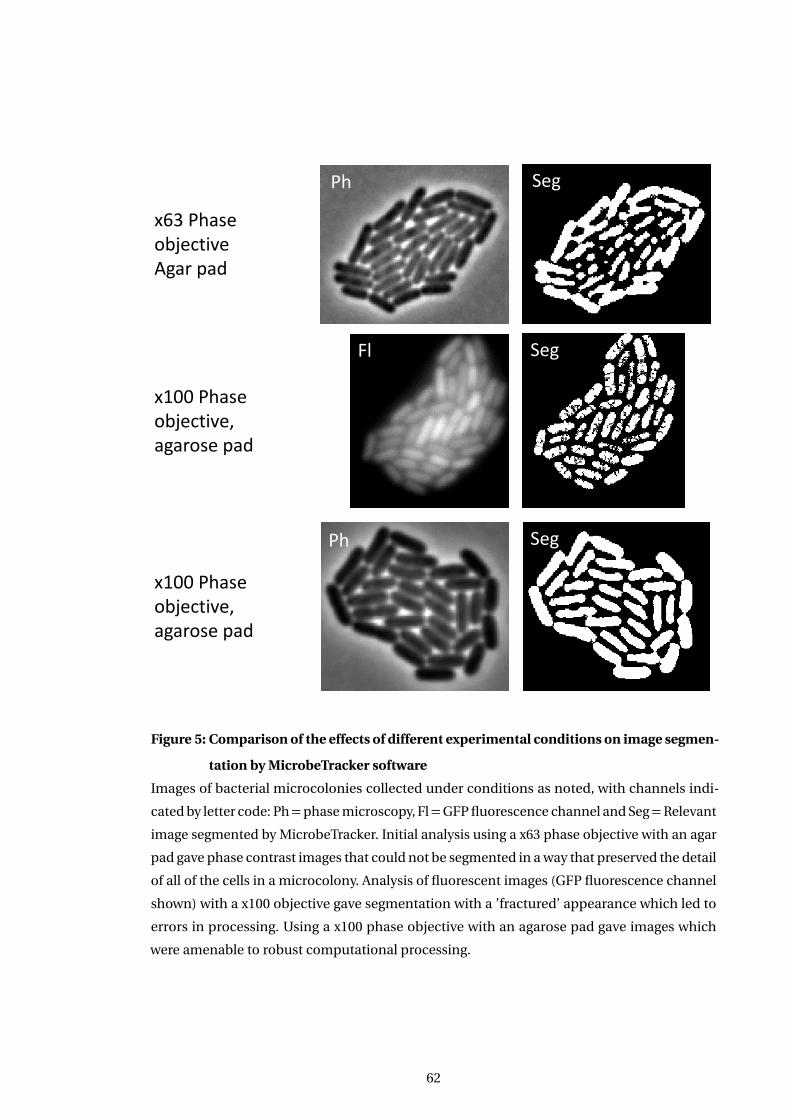
x63 Phase objective Agar pad
x100 Phase objective, agarose pad
x100 Phase objective, agarose pad
Ph Seg
Ph Seg
Seg Fl
Figure 5: Comparison of the effects of different experimental conditions on image segmen-
tation by MicrobeTracker software
Images of bacterial microcolonies collected under conditions as noted, with channels indi-
cated by letter code: Ph=phase microscopy, Fl=GFP fluorescence channel and Seg=Relevant
image segmented by MicrobeTracker. Initial analysis using a x63 phase objective with an agar
pad gave phase contrast images that could not be segmented in a way that preserved the detail
of all of the cells in a microcolony. Analysis of fluorescent images (GFP fluorescence channel
shown) with a x100 objective gave segmentation with a ’fractured’ appearance which led to
errors in processing. Using a x100 phase objective with an agarose pad gave images which
were amenable to robust computational processing.
62
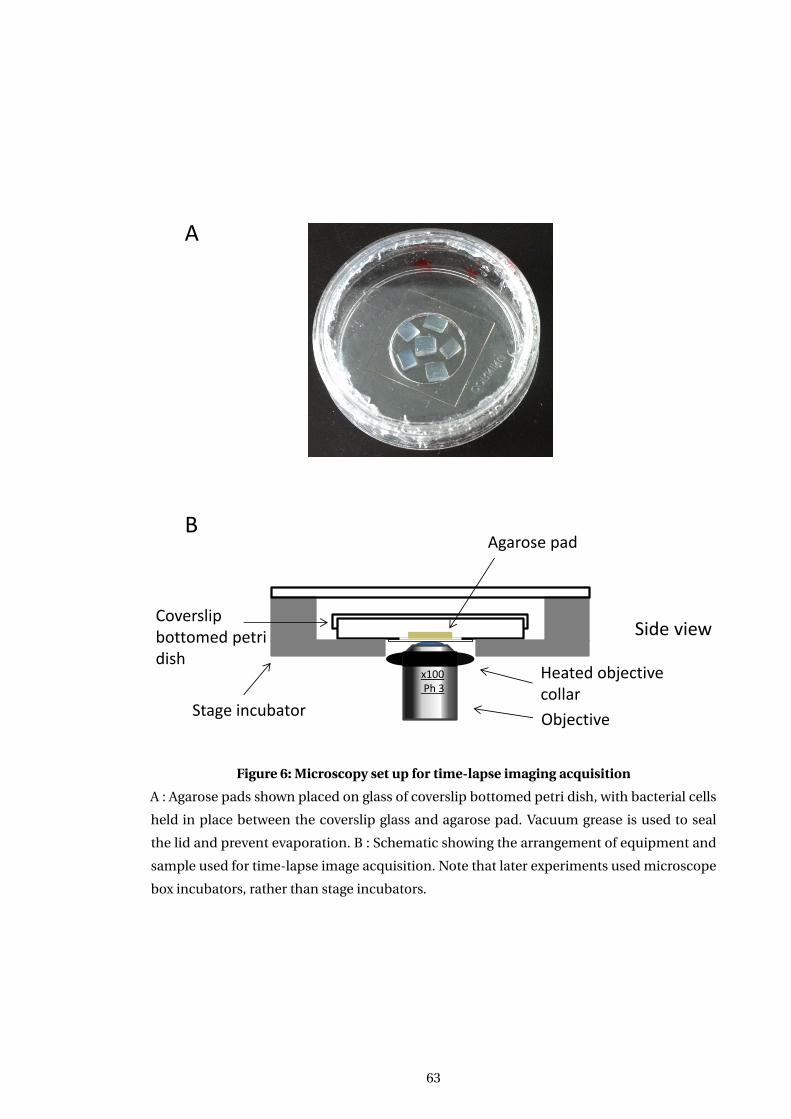
Side view
x100 Ph 3
Agarose pad
Objective Stage incubator
Coverslip bottomed petri dish
A
B
Heated objective collar
Figure 6: Microscopy set up for time-lapse imaging acquisition
A : Agarose pads shown placed on glass of coverslip bottomed petri dish, with bacterial cells
held in place between the coverslip glass and agarose pad. Vacuum grease is used to seal
the lid and prevent evaporation. B : Schematic showing the arrangement of equipment and
sample used for time-lapse image acquisition. Note that later experiments used microscope
box incubators, rather than stage incubators.
63
around the rim of the petri dish which was found to give a robust seal much less prone to
leaking.
3.4 Identification and implementation of microscopy platform for
single cell analysis
Initial work was performed on a Zeiss Axioplan microscope and Optronics camera which is a
manually controlled microscope with a low resolution / low sensitivity camera. While this was
sufficient to obtain images of bacteria they were not of a suitable quality for computational
analysis and the stage set up lacked fine control of xyz positioning or any way to temperature
control the set up which are critical for live cell time lapse microscopy of E. coli.
3.4.1 Development of microscopy setup
The next microscope, Zeiss Axiovision 200M, to be trialled again had a manual stage but this
time one with a high quality mechanism making fine manipulations of field xy position / focus
possible. Control of temperature was possible using a stage mounted incubation chamber and
objective heating collar.The technical aspects of the microscope and the improvements they
enabled are detailed below.
The key part of any microscope is the quality of the microscope light path which is largely
determined by the quality of the objective lenses. The new system had planar corrected optics
with additional adaptations to make them suitable for fluorescent imaging . In addition the
illumination system was capable of being adjusted to give correct Köhler illumination at high
magnification (x63 Ph objective used). Adjustments to such illumination particularly using
high magnification require a light system that can be finely adjusted and is not in turn warped
by the adjustments made and holds the changed position, these characteristics had not been
found in the previous microscope. During initial experiments it was found that in order to ob-
tain the best quality phase images not only must the Köhler illumination be perfectly aligned
but the level of illumination controlled by the aperture stop must be adjusted to avoid over
illumination of the image, too much light washes out the contrast in the image, leading to grey-
ing out of areas of the image that should be black. It was found that this adjustment needed to
be performed, or at least rechecked, on the pad to be imaged itself as stand in surfaces or pads
of even slightly different thickness could require different adjustments. Theses changes gave
planar images with high contrast phase images and fluorescent images with crisp delineation
of fluorescence area (as no smearing due to changes in how lens focuses different wavelengths
of light were occurring)
Another key part of the microscope system is the image capture system which in modern
normal mode microscopes is a digital Charge Coupled Device (CCD) system. The key parame-
64
ters of a camera system are the sensitivity to the light being detected in the wavelengths being
observed (as sensitivity can vary markedly across wavelength ranges), the resolution of the
camera image both in terms of the pixels acquired in a field of view and how the original op-
tical image is mapped to those pixels which is a function of sensor size and the microscopes
optical magnification/light path and the acquisition time. A Zeiss Axiocam Hrc camera which
is a peltier cooled CCD capable of colour image acquisition using a Bayer sensor mask. The
presence of this mask does lead to some light loss and hence a reduction in camera sensitivity.
Acquisition time is a factor when imaging live cells for two reasons. Firstly while bacte-
ria trapped by the pad are not motile in the sense of swimming they do undergo significant
movement due to the rapidity of their growth both at the level of the single cell but more sig-
nificantly due to the sum effect of all those growing movements leading to bulk movement
within a micro colony. If the camera acquisition time is of the same order as the movement
rate of the cells being observed significant blurring will occur and acceptable images will not
be obtained. With a reasonable level of normal light illumination acquisition times of 25msec
where obtained, which meant that crisp phase images could readily be obtained. Secondly
there is a need to ensure that the live cells are not affected by the illumination either by excess
sample heating (normal light) or by direct photo toxicity (fluorescent light). For fluorescence
images the signal level in this experimental system is as expected much lower which means
that a trade off must be made between acquiring enough light for a decent image, with the
three factors involved being illumination intensity, camera sensitivity and time set for acquisi-
tion. These factors can be traded off in various ways but for live cell imaging it is best to use a
longer acquisition time, which does not lead to blurring, with a lower level of illumination in
order to reduce the photo toxic effects of the intense illumination. In the context of a standard
CCD camera the sensitivity is a fixed value dependent on that particular unit but different
cameras can have significant differences in sensitivity.
Manual operation of the camera xyz alignment meant that observation of only a single
field was possible due to the lack of any register for a given position and the very small field of
view of a uniform looking sample making tracking back to other fields very challenging and
hence not a practical option for 10’s of observations of each field. Manual operation of the filter
shutter wheel and light filter was also required which both further made multi field observation
impossible due to the time to effect the required changes in microscope configuration and
also meant that light exposure of the sample was greater than required solely for exposure.
This is a particular issue for fluorescent light illumination which is far more toxic.
Finally the use of a stage mounted incubation has limitations in the accuracy of temper-
ature control. In particular the entrance of the objective to the chamber is prone to conden-
sation even with an objective heater in place. Even when this was successful there are still
temperature gradients across the stage area from the unheated to heated areas which cause
65
issues for stability when working at high magnification with bacteria where the slightest drift
causes a loss of focus from the 1µm plane containing the bacteria. These drifts meant that
minor manual corrections in focus were regularly required (every other frame) in combination
with accidental movement / knocks due to all the manual operations of filters / lights which
affected xy position and also required extremely careful manipulation to restore correct posi-
tion meant that operation of a time lapse was an extremely intensive and skillful operation in
order to obtain useful results for a single field.
The outcome of this work was that a time lapse of phase images with a few snapshot flu-
orescence frames could be acquired for one field of view of bacterial microcolonies growing
and interacting. This was sufficient to provide proof of principle for this analysis mode, but it
was clear that changes to the microscope would be required in order to obtain a robust exper-
imental system. During operation of this protocol it was noticed that there was a significant
lag in growth of bacteria transfered from log planktonic growth at 37C to pad growth on the
microscope. Manipulations to assemble bacterial pads were performed as quickly as possible
but at room temperature so it was assumed that some degree of heat shock on temperature
downshift was responsible for this growth lag. Therefore to minimise temperature changes
a ’hot box’ was constructed from a plastic container containing water filled sterilins to pro-
vide thermal mass. This was held at 37C when not being used and all containers and pads
prewarmed prior to dilutions being performed. With these changes any temperature change
induced lag was greatly reduced to only 10 minutes.
3.4.2 Final microscopy set up
With a proof of principle demonstrated a list of additional equipment required to upgrade
the available microscopes was made and checked against the results of a literature review of
equipment used in labs specialising in this area of imaging. After a successful funding appli-
cation experimental work was continued on a microscope using this upgraded equipment,
see Table 1. Again each specific improvement in the microscope will be described and the
improvements they enable identified.
The upgraded microscope was fully automated so that no manual intervention was re-
quired for changes of the filter wheel or control of the light shutters. In particular a high speed
filter shutter was fitted to enable light exposure only when required eliminating excess illu-
mination which could have photo toxic effects. The automation also extended to the stage
which had full xyz control and which was capable of µm positional accuracy. This allowed for
both multi position acquisition as stage positions could be identified manually (e.g. to ensure
appropriate initial cell distribution to increase chances of useful observations being made)
and then returned to with high accuracy during the time course of time lapse acquisition. Ini-
tially the slight changes in z axis position during the experiment meant that manual focusing
66
was still intermittently required to ensure fields didn’t drift out of focus. But as z axis control
was available the chance to use the Zeiss Axiovision software auto focus module was possible,
this normally uses fluorescent images as an input (which represent a much clearer signal for
computational analysis), but it was found that it was also suitable for use with phase contrast
images as an input. Therefore by specifying that before each frame auto focusing should be
performed using the phase input, and this identified position also used for any appropriate
fluorescent images, fully automated acquisition could occur eliminating the possibility of any
manual errors prematurely ending the experiment.
In order to achieve greater thermal stability (which aids the stage accuracy mentioned
above) a full microscope light tight incubation chamber with full temperature control was used.
Including more of the microscope, such as the objectives and the whole stage area, gives a more
stable temperature environment preventing minor changes in dimensions due to fluctuations
in temperature. This change also lead to less lag in cell growth on transfer presumably due to
more rapid equilibration of temperature as the larger unit has greater thermal mass and also
to the ability to hold the sample hotbox withing the microscope incubation chamber during
final set up.
A change to the camera was made to improve image sensitivity, with a switch made to the
Hrm camera, the mono version of the Hrc previously used, which lacks the colour sensor and
hence avoids the light loss mentioned previously. In combination an increased magnification
objective, x100 Ph, was used so as to increase the pixels per µm in order to allow oversampling
of the bacteria in the final image which can aid computational analysis of an image.
This final protocol was capable of acquiring high quality phase images of multiple fields of
view during several hours of time lapse microscopy. These images were then analysed using
MicrobeTracker to obtain measurements of single cells and this data then linked manually us-
ing ImageJ to generate lineages, see Figure 7. This data was then processed in excel to generate
single cell growth curves for further analysis, see Chapter 4.
67
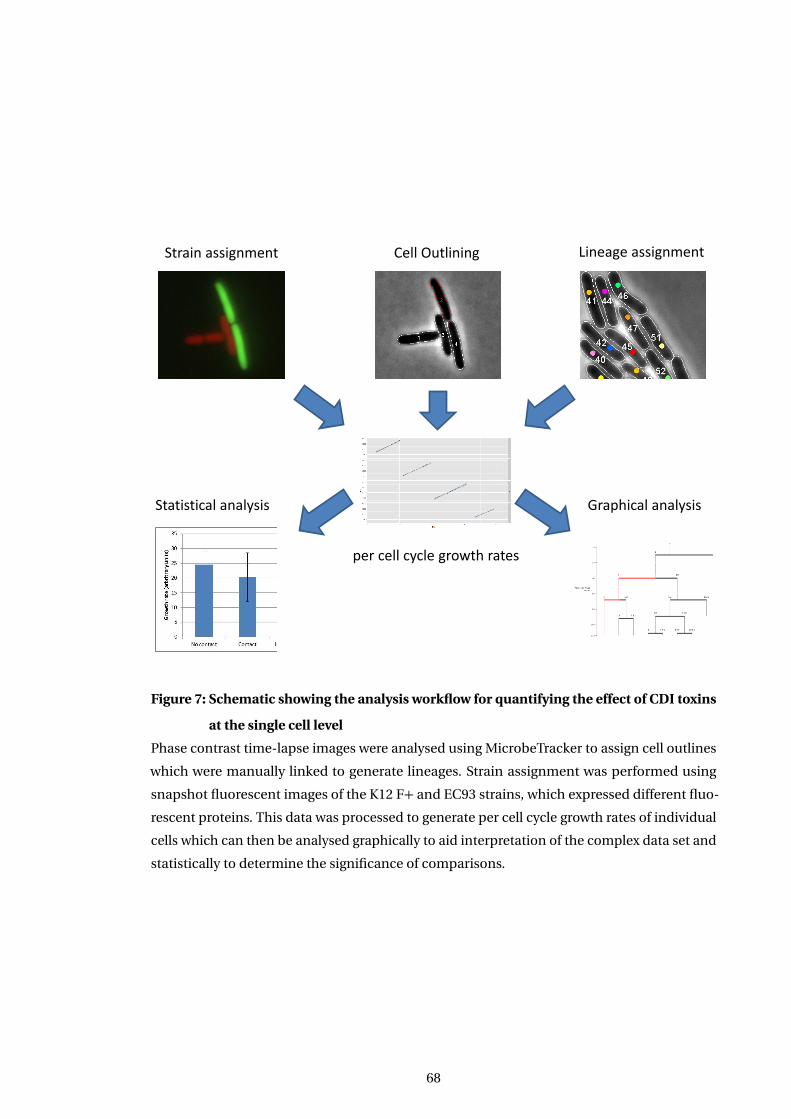
Cell Outlining Lineage assignment
Graphical analysis Statistical analysis
Strain assignment
per cell cycle growth rates
Figure 7: Schematic showing the analysis workflow for quantifying the effect of CDI toxins
at the single cell level
Phase contrast time-lapse images were analysed using MicrobeTracker to assign cell outlines
which were manually linked to generate lineages. Strain assignment was performed using
snapshot fluorescent images of the K12 F+ and EC93 strains, which expressed different fluo-
rescent proteins. This data was processed to generate per cell cycle growth rates of individual
cells which can then be analysed graphically to aid interpretation of the complex data set and
statistically to determine the significance of comparisons.
68
Chapter 4
Effect of EC93 toxin on target cells at
the single cell level
4.1 Introduction
Assays of CDI toxins looking at the mechanism of toxin action have to date only been per-
formed on planktonic cultures. Analysis of bulk suspensions of cells does not allow for the
number and timing of CDI interactions with susceptible cells to be determined, and can only
give averaged measures of cell response using indirect outputs such as reductions in cfu/ml.
Important parameters relevant to understanding how CDI toxins act in nature, and in particu-
lar what the impact of the different classes of toxin may be, can only be measured by performing
analysis at the single cell level.
4.2 Strain generation
In order to best understand the natural role of the EC93 toxin system the wild type strain
was used, and hence has the CDI cdiBAI system in its native genomic context under natural
promoter control rather than a cosmid based system / one under artificial promoter control.
Strain MV1394 (Aoki et al., 2005) which is the wild type strain apart from experimentally se-
lected rifampicin resistance was used in all experiments as the CDI+ / inhibitor strain. As a
control strain an EC93∆ cdiA deletion strain MV1395 completely lacking the CDI toxin was
used. As it is not possible to differentiate between strains on the basis of phase contrast images
expression of different fluorescent proteins in each strain was required. Cells from Ec93 In-
hibitor / control strains were transformed with plasmid pMV371, which codes for constitutive
expression of mCherry fluorescent protein using the chemical competence protocol.
Strain MV1257 (Lakins et al., 2009; Da Re et al., 2007) was used as the target strain having
a K12 F+ background and hence being susceptible to CDI. The presence of the F’ plasmid
means that this strain is capable of robust biofilm growth and was therefore able to be used
69
in biofilm work, see Chapter 5, allowing direct comparison of results on the same strain in
the two different experimental set ups. Strain MV1257 has the pZE21-gfp plasmid coding for
constitutive expression of GFPmut3.1 (Cormack et al., 1996), which is suitable for use in the
same imaging experiments as mCherry (Shaner et al., 2004) with minimal unwanted spectral
overlap.
Transformed strains were tested for robust fluorescent protein expression / plasmid main-
tenance by microscopy of overnight cultures and log phase cultures. No cells lacking fluores-
cent protein expression, compared to the phase contrast image, could be seen and there was
a significant level of fluorescent protein expression as judged by ability to clearly detect flu-
orescence in cell cytoplasm with minimal levels of excitation illumination (data not shown).
Strains with multi copy plasmids grow at the same rate as cells lacking these components
and have identical sizes and morphology (data not shown). This indicates that there are no
significant impacts on cell physiology in maintaining fluorescent protein expression.
4.3 Ec93 strain background does not itself affect growth of target
strain
The Ec93 E. coli strain used is a wild type strain isolated from mouse faeces and therefore has
the potential to harbor additional factors that would enable it to affect other strains growth.
Examples of such systems include colicins (Cascales et al., 2007) and Type VI secretion systems
(Kapitein et al., 2013). In order to determine if this was occurring experiments in both plank-
tonic and micro colony culture were performed using the EC93∆cdiA strain. If no additional
growth inhibitory factors are present in the strain background then cogrowth of this strain and
target strain should show no difference to that of target strain with itself.
Planktonic assays were performed using the method defined in (Aoki et al., 2005; Aoki et
al., 2010). The expected 106 fold reduction in cfu/ml was seen when target cells (both F+ and
F-, data not shown) were competed with wild type Ec93 cells whilst there was no significant
difference between K12 F+ / K12 F+ cogrowth and that of ∆cdiA / target cell strains. In all
reported data to date on the EC93 toxins effect on planktonic systems a small proportion of
cells appear to be unaffected by growth inhibition even when incubated with a large excess of
CDI+ cells over a significant period of time.
As the situation in growth at the monolayer microcolony level is markedly different (fewer,
longer contacts) compared to liquid culture lack of growth inhibition also needed to be demon-
strated using the K12 F+ / ∆cdiA strains co cultured on agarose pads, as for example T6SS
systems have been reported to be effective in growth on surfaces but not in planktonic culture
(Hood et al., 2010; Lossi et al., 2012; Russell et al., 2014).
In order to give the maximum chance for any growth effects to be detected micro colonies
70
of ∆cdiA and K12 F+ cells which were adjacent from the beginning of the experiment were
selected . This way any potential toxins had the maximum possible time to affect growth. As
the point of this analysis was to detect if any possible effects were occurring only the K12 F+
cells in contact with∆cdiA cells were analysed (As noted in section 4.4 growth rate using this
protocol was found to be highly reproducible). As shown in Figure 8 (two bars on the right)
there is no significant difference between growth of target cells interacting with clone mates
or with cells of the EC93 strain which lack a functional CDI system. Taken together this data
shows that there is no detectable effect of the EC93 strain background on K12 target cell growth
in the absence of a functional CDI system.
4.4 Uniform microcolony growth
It was not clear at the start of this work what the level of growth heterogeneity between individual bacterial cells in micro
colonies would be in our experimental system. Variability could arise within microcolonies
due to self generated gradients in nutrient density, due to diffusion rate limits from the agarose
pad, or excretion of waste products from colony mates.
In order to test this, growth of individual cells representative of the whole colony was
followed, including cells which had not made contact with inhibitor cells. Cells from strain
MV1257 (K12 F+) and strain MV1586 (EC93 wild type) were grown together but for this analysis
only the subset of MV1257 cells which did not make contact with inhibitor cells were consid-
ered. As shown in Figure 9 a plot of cell area over time leads to a characteristic sawtooth profile
as cells grow then divide. With the mother cells area being reduced after the daughter cell ’birth’
as the undivided mother cell’s area is now assigned to the daughter cell. It can be seen from the
plot that the gradients of growth are parallel and the volume at which cell division occurs are
very similar in mother and daughter cells. Any changes over time, note the subtle decrease in
volume at division occurring over time, happens to all cells within the microcolony to a similar
extent. The level of variation in cell division times is small enough that the microcolony as a
whole is dividing in synchronicity when not under any other influences. This demonstrates
that the experimental conditions obtained using this protocol give steady state cell growth
and hence provide a suitable background for picking out potentially subtle toxin effects.
4.5 Inhibition prior to cell monolayer growth is not detectable
The protocol used for seeding the agarose pads for monolayer growth relies on rapid spread-
ing of separate dilute cultures by physical application of the pad. While this is performed as
rapidly as practicable with liquid spreading occurring in under a second it is still theoretically
possible that there could be some contact of inhibitor and target cells in the liquid phase prior
71
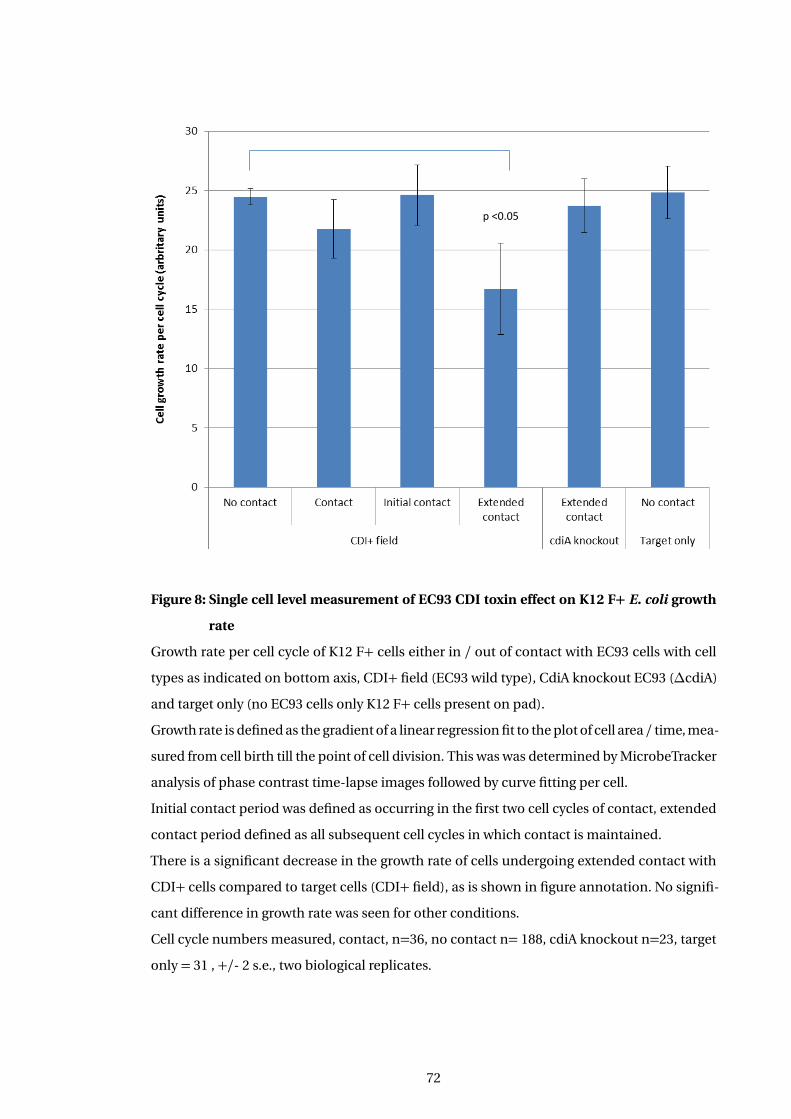
p <0.05
Figure 8: Single cell level measurement of EC93 CDI toxin effect on K12 F+ E. coli growth
rate
Growth rate per cell cycle of K12 F+ cells either in / out of contact with EC93 cells with cell
types as indicated on bottom axis, CDI+ field (EC93 wild type), CdiA knockout EC93 (∆cdiA)
and target only (no EC93 cells only K12 F+ cells present on pad).
Growth rate is defined as the gradient of a linear regression fit to the plot of cell area / time, mea-
sured from cell birth till the point of cell division. This was was determined by MicrobeTracker
analysis of phase contrast time-lapse images followed by curve fitting per cell.
Initial contact period was defined as occurring in the first two cell cycles of contact, extended
contact period defined as all subsequent cell cycles in which contact is maintained.
There is a significant decrease in the growth rate of cells undergoing extended contact with
CDI+ cells compared to target cells (CDI+ field), as is shown in figure annotation. No signifi-
cant difference in growth rate was seen for other conditions.
Cell cycle numbers measured, contact, n=36, no contact n= 188, cdiA knockout n=23, target
only = 31 , +/- 2 s.e., two biological replicates.
72
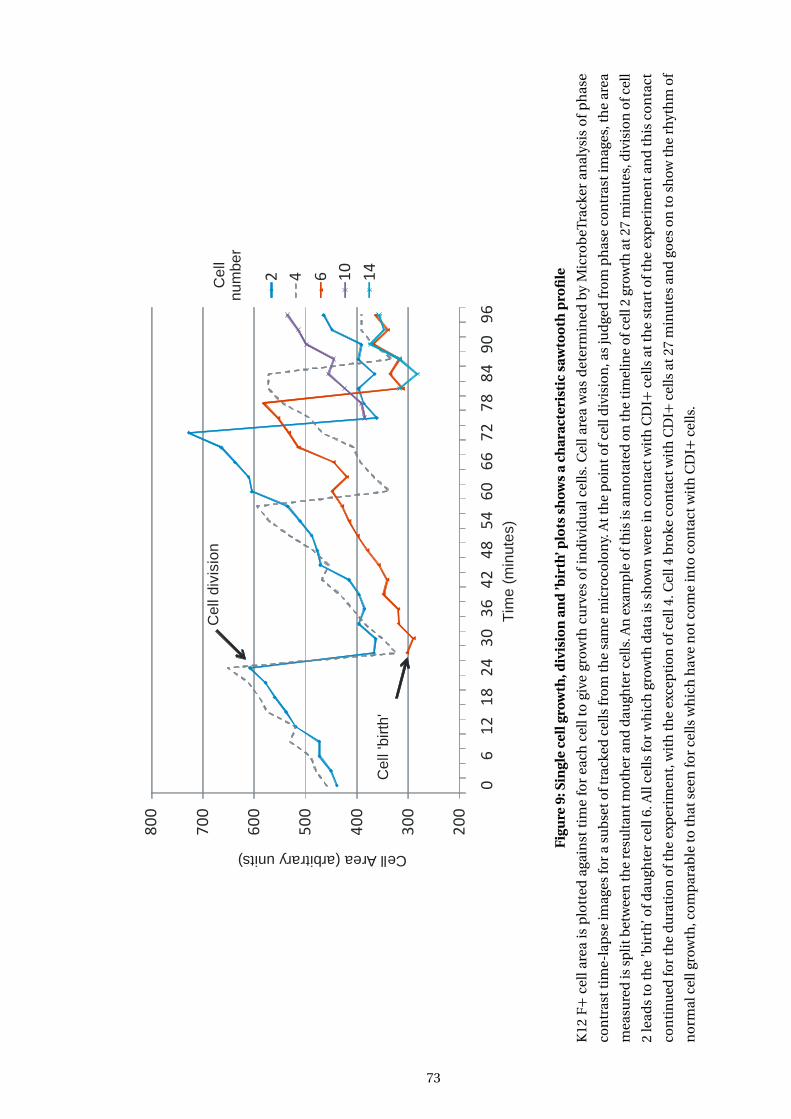
20
0
30
0
40
0
50
0
60
0
70
0
80
0
06
12
18
24
30
36
42
48
54
60
66
72
78
84
90
96
C
Tim
e (
min
ute
s)
Cell Area (arbitrary units)
20
0
30
0
40
0
50
0
60
0
70
0
80
0
06
12
18
24
30
36
42
48
54
60
66
72
78
84
90
96
4 8 12
16
20
24
28
32
BC
ell
num
ber
Tim
e (
min
ute
s)
Cell Area (arbitrary units)
End o
f in
hib
itor
cell
conta
ct
Cell
16 c
onta
cts
in
hib
itor
cell
Cell Area (arbitrary units)
20
0
30
0
40
0
50
0
60
0
70
0
80
0
06
12
18
24
30
36
42
48
54
60
66
72
78
84
90
96
2 4 6 10
14
Ce
ll
nu
mb
er
A
Ce
ll d
ivis
ion
Ce
ll 'b
irth
'
Tim
e (
min
ute
s)
Figu
re9:
Sin
gle
cell
grow
th,d
ivis
ion
and
’bir
th’p
lots
show
sa
char
acte
rist
icsa
wto
oth
pro
file
K12
F+
cell
area
isp
lott
edag
ain
stti
me
for
each
cell
togi
vegr
owth
curv
eso
fin
div
idu
alce
lls.C
ella
rea
was
det
erm
ined
by
Mic
rob
eTra
cker
anal
ysis
of
ph
ase
con
tras
ttim
e-la
pse
imag
esfo
ra
sub
seto
ftra
cked
cells
fro
mth
esa
me
mic
roco
lon
y.A
tth
ep
oin
tofc
elld
ivis
ion
,as
jud
ged
fro
mp
has
eco
ntr
asti
mag
es,t
he
area
mea
sure
dis
split
bet
wee
nth
ere
sult
antm
oth
eran
dd
augh
ter
cells
.An
exam
ple
oft
his
isan
no
tate
do
nth
eti
mel
ine
ofc
ell2
grow
that
27m
inu
tes,
div
isio
no
fcel
l
2le
ads
toth
e’b
irth
’ofd
augh
ter
cell
6.A
llce
llsfo
rw
hic
hgr
owth
dat
ais
show
nw
ere
inco
nta
ctw
ith
CD
I+ce
llsat
the
star
to
fth
eex
per
imen
tan
dth
isco
nta
ct
con
tin
ued
for
the
du
rati
on
oft
he
exp
erim
ent,
wit
hth
eex
cep
tio
no
fcel
l4.C
ell4
bro
keco
nta
ctw
ith
CD
I+ce
llsat
27m
inu
tes
and
goes
on
tosh
owth
erh
yth
mo
f
no
rmal
cell
grow
th,c
om
par
able
toth
atse
enfo
rce
llsw
hic
hh
ave
no
tco
me
into
con
tact
wit
hC
DI+
cells
.
73
to immobilisation between the cover slip glass and the pad. As the basis of the experiment as-
sumes that CDI exposure will only occur as cells come into contact due to microcolony growth
it is important to be able to rule an effect of prior exposure out.
This was done by comparing the growth rate of target cells growing on a pad without any
inhibitor cells being seeded on the same pad, and hence there being no possibility of contact
with inhibitor cells giving the natural uninhibited growth rate, with the growth rate of target
cells that were classified as having no contact with inhibitor cells, post pad application, on a
mixed strain pad. If prior contact of toxin cells was able to skew the experimental results we
would predict that the target cells on the mixed pad that had never come into contact with an
inhibitor cell during the period of observation would have a lower growth rate than those on
the single strain pad.
This data is shown in Figure 8 where the no contact target only cells represent the result of
the single strain pad and the no contact CDI+ column results show the results for the mixed
pad. There is no significant difference in per cell cycle growth rate between the two populations
of cells and hence there is no measurable effect of prior contact on the relevant experimental
parameter.
4.6 Assessment of EC93 toxin effect
4.6.1 Rationale for choice of fields to be collected and assessed
In order to determine the effect of the EC93 CDI toxin, K12 F+ and EC93 wild type cells were
observed growing and interacting in monolayers of cells by phase contrast and epi fluores-
cence microscopy. Full method details are shown in Chapters 2 and 3 but the key parameters
controlled in order to obtain biologically meaningful data are discussed below.
K12 target cells and EC93 inhibitor cells were coseeded under agaraose pads 37C at a low
seeding density so that approximately 4 cells of each strain type would be in a field of view.
Fields for timelapse acquisition were assigned on the following basis:
1. Examination of the phase contrast image to ensure that only a few, relatively closely
placed microcolonies were present in the field of view (and that a heavier than average
seeding density was not present immediately out of frame as this would lead to rapid
overgrowth mid experiment)
2. A field of view that contained microcolonies from target and inhibitor/control strains
that were not in contact but were in close proximity (approximately 10µm). A single
exposure at each excitation wavelength was performed, in order to determine the strain
type of each microcolony present in the frame. In order to avoid multiple exposures,
74
due to out of frame illumination by excitation light, a significant translation between
assessed frames.
This procedure was repeated so that a suitable field of view was found on each pad to be
observed in the experiment. Time-lapse acquisition was then performed with phase contrast
images being acquired at three minute intervals, fluorescent images were acquired at every
approximately sixty minutes to minimise phototoxic effects of excitation light illumination.
Images at each position were captured using the Axiovision software multiacquistion tool and
hence were always acquired in the same order with the same spacing of timing. With the rapid
growth rate of E. coli, observations for 4-5 hours were sufficient to follow growth through to
the point of confluence and/or the stage when bacteria would start to overgrow each other
and hence no longer be uniquely identifiable.
The acquired phase contrast timelapse images were converted to contiguous TIFF image
stacks per pad and examined to determine if they were suitable for further analysis on the basis
of the following criteria, using the snapshot fluorescent images as a guide to assign strain type
to cells:
1. Was the drift between frames within a correctable range?
2. Had the predicted interaction of microcolonies occurred? If so had the interaction oc-
curred early within the observation period so as to present a significant set of interaction
observations?
3. Had growth continued as a continuous monolayer up until the end of the experiment?
Note that these objective criteria make no prejudgment as to the presence or absence of
any toxin effect. For each combination of strains studied an image stack which matched the
above criteria, was quantitatively analysed from each of two biological replicate experiments
performed on different days.
4.6.2 Toxin effect occurs in two stages
An overview of an example data set from K12 F+ and EC93 wild type CDI+ cells interacting
is shown in Figure 10. By splitting the data set on the basis of lineage, the initial target cells
present at the start of the time lapse, and cell cycle number, which growth cycle the cell is in
as measured from the start of the experiment. Starting from the single cells in the top panels
division and subsequent growth for mother and daughter cells is then shown in the panel
beneath and so on. It can be seen that lineage does not have any obvious effect on cell growth
patterns, as would be predicted for pads seeded from a clonal population.
Contact with EC93 wild type cells, indicated by blue colour, can be seen to not immediately
lead to growth arrest as the cells continue growing at the same rate hence giving a similar
75
gradient in this plot. However within the time range of the quantitative experiment it can
be seen that intoxicated cells go on to either halt growth or exhibit a reduced level of growth
(shallower gradient). Presenting the data in this way clearly shows the disruption of intoxicated
cell growth against the background of the regular pattern of normal cellular growth.
Further analysis of the time course of K12 F+ cells growing in contact with CDI+ cells,
see Figure 11 which shows a small representative portion of a microcolony lineage, highlights
the biphasic nature of inhibition. It can be seen that cells growing without contact with EC93
wild type cells divide regularly (black, right). The intoxicated K12 F+ cell (red, left) comes into
contact at 36mins and continues growing with a normal cell cycle length in that cell cycle and
the next, as judged by comparison with its clone mates. Only after two ’normal’ cell cycles
have been completed does the third cell cycle show significant changes being significantly
longer due to slowed growth rate.
Quantitation of this effect was performed by fitting a linear regression curve to each indi-
vidual cell cycle of growth independently. The gradient of each of these linear fits was then
taken as the measure of cell growth rate for that cell cycle with the measure being reported
in arbitrary units as it was to be used for comparative purposes only, although it would be
possible to convert to an area increase/second value. Each cell cycle was categorised on the
basis of what contact the target cell had had with inhibitor/control cells either just in that cell
cycle or within a defined number of cell cycles as appropriate.
As shown in Figure 8 there was no significant difference between the averaged growth
rate of all cells in contact and those not in contact with inhibitors. However from the previous
observation we know that the time course of inhibition is biphasic and that this averaging
therefore obscures the biological reality that there is a time delay before the EC93 CDI toxin
has its effect.
Whilst there is some variability in the time before growth inhibition occurs, examination
of the data, such as Figure 11, supports a definition of the delay as occurring after contact
with an inhibitor cell over two cell cycles. When the growth data is analysed using this way of
splitting the data then there is no significant difference between target cells growing on their
own and those growing in the initial stages of contact, see Figure 8. In contrast a statistically
significant reduction in growth rate is seen for cells which have been in contact for over two cell
cycles. That the fate of these cells is complete growth arrest has been confirmed qualitatively
by manually following the growth of inhibited cells at later time points. In these later images,
that weren’t amenable to computational image analysis, it can be seen that the quantified
slowed growth was a prelude to complete growth arrest (data not shown).
76
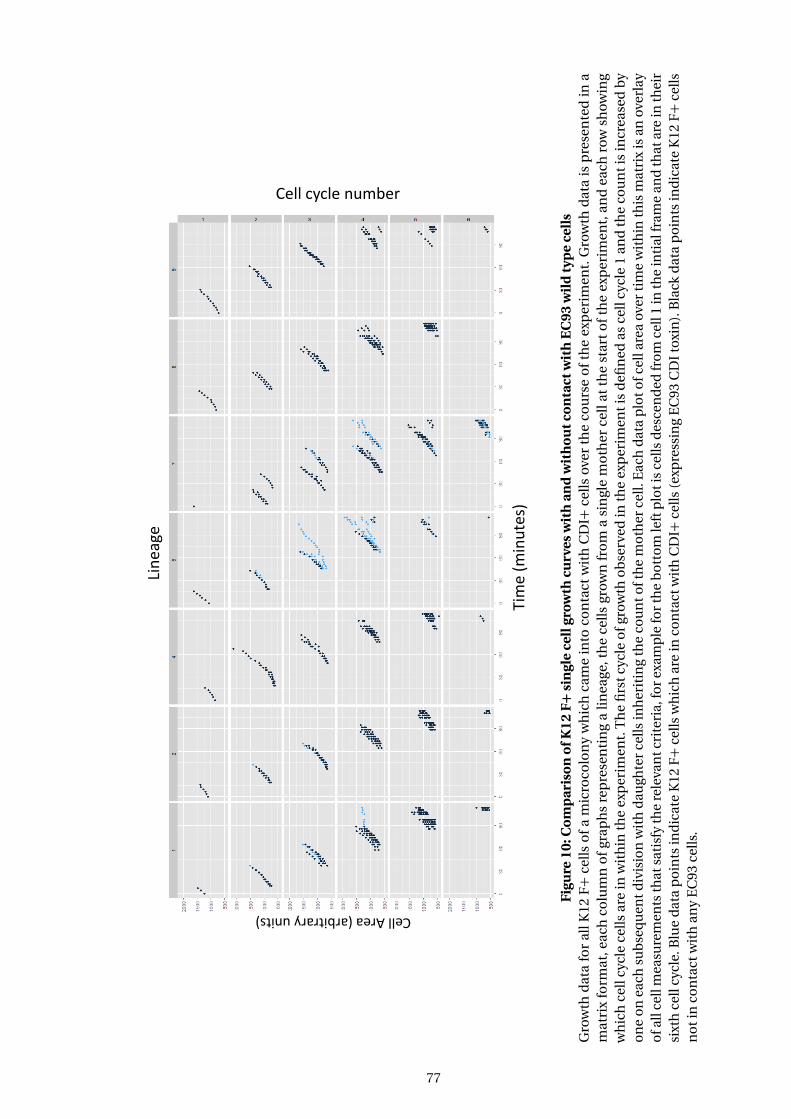
Cell Area (arbitrary units) Cell cycle number
Tim
e (m
inu
tes)
Lin
eage
Figu
re10
:Co
mp
aris
on
ofK
12F+
sin
gle
cell
grow
thcu
rves
wit
han
dw
ith
ou
tco
nta
ctw
ith
EC
93w
ild
typ
ece
lls
Gro
wth
dat
afo
ral
lK12
F+
cells
of
am
icro
colo
ny
wh
ich
cam
ein
toco
nta
ctw
ith
CD
I+ce
llsov
erth
eco
urs
eo
fth
eex
per
imen
t.G
row
thd
ata
isp
rese
nte
din
am
atri
xfo
rmat
,eac
hco
lum
no
fgr
aph
sre
pre
sen
tin
ga
lin
eage
,th
ece
llsgr
own
fro
ma
sin
gle
mo
ther
cell
atth
est
art
of
the
exp
erim
ent,
and
each
row
show
ing
wh
ich
cell
cycl
ece
llsar
ein
wit
hin
the
exp
erim
ent.
Th
efi
rst
cycl
eo
fgro
wth
ob
serv
edin
the
exp
erim
ent
isd
efin
edas
cell
cycl
e1
and
the
cou
nt
isin
crea
sed
by
on
eo
nea
chsu
bse
qu
entd
ivis
ion
wit
hd
augh
ter
cells
inh
erit
ing
the
cou
nto
fth
em
oth
erce
ll.E
ach
dat
ap
loto
fcel
lare
aov
erti
me
wit
hin
this
mat
rix
isan
over
lay
ofa
llce
llm
easu
rem
ents
that
sati
sfy
the
rele
van
tcri
teri
a,fo
rex
amp
lefo
rth
eb
ott
om
left
plo
tis
cells
des
cen
ded
fro
mce
ll1
inth
ein
tial
fram
ean
dth
atar
ein
thei
rsi
xth
cell
cycl
e.B
lue
dat
ap
oin
tsin
dic
ate
K12
F+
cells
wh
ich
are
inco
nta
ctw
ith
CD
I+ce
lls(e
xpre
ssin
gE
C93
CD
Ito
xin
).B
lack
dat
ap
oin
tsin
dic
ate
K12
F+
cells
no
tin
con
tact
wit
han
yE
C93
cells
.
77
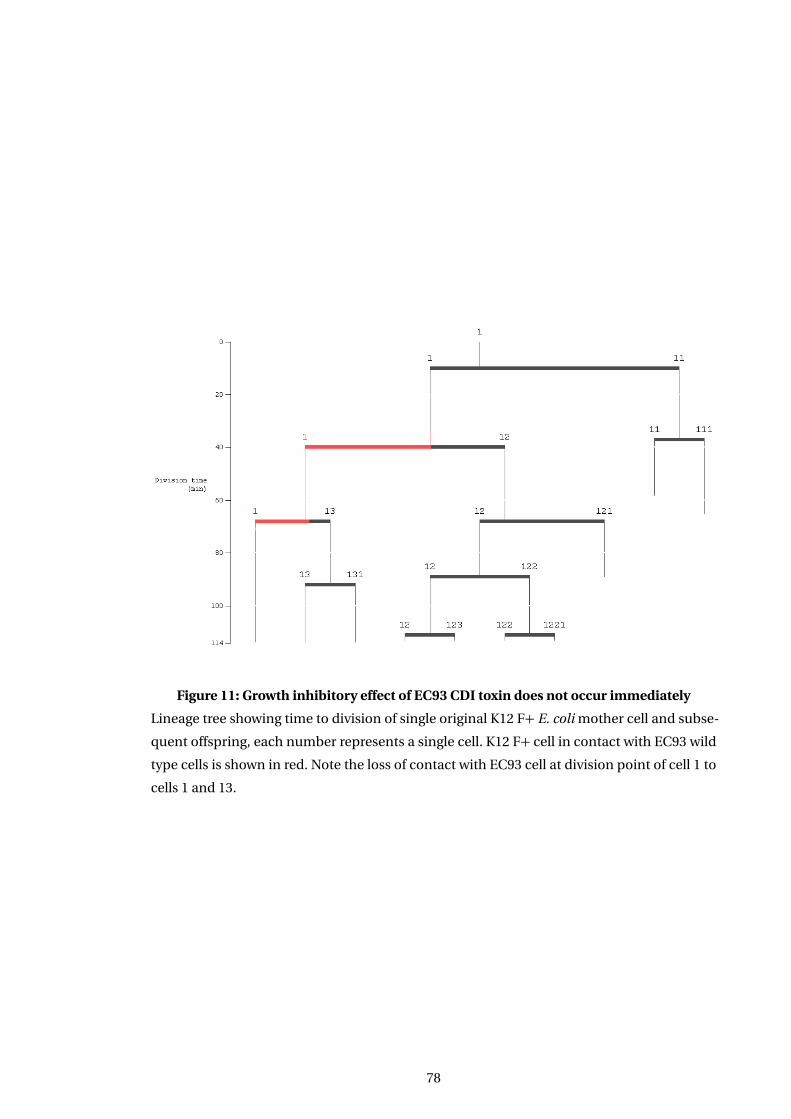
Figure 11: Growth inhibitory effect of EC93 CDI toxin does not occur immediately
Lineage tree showing time to division of single original K12 F+ E. coli mother cell and subse-
quent offspring, each number represents a single cell. K12 F+ cell in contact with EC93 wild
type cells is shown in red. Note the loss of contact with EC93 cell at division point of cell 1 to
cells 1 and 13.
78
4.7 EC93 CDI growth inhibition effect is entirely contact dependent
CDI toxin systems are so named on the basis of the work of Aoki et al (Aoki et al., 2005) with
the contact dependence having been demonstrated using a filter based approach at the pop-
ulation level. Briefly cells were separated by membranes that had pores wide enough to allow
cells through, 8µm, or block cells, 0.4µm. On this basis contact dependence can be assigned if
a growth inhibition effect is seen only when physical passage of CDI+ cells is possible through
the membrane. However the membranes themselves are 10µm thick so a short range effect
from an unstable diffusible toxin would not be detectable using this system. However using a
single cell approach we have the data to definitively address this question as cell growth can
be followed for cells both at a range of distances from inhibitor cells and also in contact with
cells that are being directly inhibited. This allows both the possibility of short range effects to
be observed but also to see if transport of toxin on the outer membrane to other cells could
occur.
As the whole of target cell microcolonies growth is quantified on a cell by cell basis it would
be predicted that any effect of toxin at a distance, and/or mediated by membrane contact,
would lead to a significant heterogeneity in the growth rate of cell cycles assigned as no contact
in CDI+ fields (see Figure 8). This is because the no contact classification includes cells which
are at a wide range of distances from inhibitor cells. If toxin was active at a distance from
inhibitor cells the populations growth would be differentially affected leading to a wide range
of growth rates.
In fact the data in Figure 8 shows that the 188 no contact cell cycles measured show a tight
distribution of values. Hence we can see that there is no diffusible toxin induced variability
in target cells growth rates. Using this single cell approach we can conclude that direct cell to
cell contact is absolutely required for CDI toxin action.
4.8 Effect of EC93 toxin on bacterial morphology
Growth rate is not the sole measure of cell state that can be derived from these observations,
length and width are also recorded for each data point and allow statements to be made as
to the changes in bacterial morphology. A constant cell width is robustly maintained by E.
coli across a variety of growth conditions/ situations in contrast to the significant variations
in average cell length which occur under such conditions (Volkmer et al., 2011). Significant
perturbations such as antibiotics which target cell wall synthesis leading to degradation /
abnormal synthesis of the cell wall are generally required to alter cell width although it has
also been reported that extreme spatial confinement can reversibly alter morphology (Männik
et al., 2012).
E. coli target cell width was found to be constant across target cells under all conditions
79
studied. This is consistent with the current understanding of the EC93 toxins mode of action
being to disrupt the cellular proton motive force (Aoki et al., 2009) which would not be pre-
dicted to impact on cell wall rigidity / induce abnormal cell wall synthesis. In contrast length
of target cells prior to septation was found to be increased in a significant proportion of in-
toxicated cells prior to complete growth arrest. Affected target cells either undergo a gradual
halt in growth after the initial delay in toxin effect or they proceed into a period of unusually
elongated growth and then cease to grow further. The filamented growth phenomena was
captured during the quantitative portion of the experiment, see Figure 10, and the growth
arrest confirmed by manually following the growth of these cells through the remainder of
the experiment. It should be noted that even cultures of E. coli K12 will show a low frequency
of elongated cells (Wang et al., 2010), that is even in the presence of no other factors such as
plasmid maintenance, fluorescent protein expression or toxin action some cells will elongate.
These are then seen to be able to bud off new ’normal’ cells capable of further division, a be-
haviour which is not seen for EC93 CDI toxin affected cells: recovery and normal septation
was not seen on any occasion.
4.9 Escape from growth inhibition possible if contact broken
In addition to the quantitative analysis presented above, extensive qualitative checks of the
data by visually tracking target / inhibitor interactions were made during processing. As bacte-
rial cells grow in a monolayer they naturally form ’rafts’ of cells which push and jostle against
each other in unpredictable ways. This means that when microcolonies merge together, in
these experiments target and inhibitor cells come into contact, target cells which have been
in contact and exposed to toxin can be pushed by the movement of the microcolony such
that this contact is broken. In addition as E. coli grows by division it is possible for one of the
resultant cells to no longer be in contact with an inhibitor cell as the continuous cytoplasmic
link between cells is broken by septation.
It was identified that in the few observed cases where movement of the microcolony broke
contact between target and CDI+ cells the target cell was capable of continued growth. This is
illustrated in Figure 12 where the fate of two cells derived from the same intoxicated mother cell
is shown. The outlined cell has initially not had any contact with inhibitor cells and goes onto
divide at which point one of the resultant cells comes into contact with inhibitor cells (Panels
A,B). As reported in section 4.6.2 growth is not immediately inhibited and the intoxicated cell
goes on to divide. At this division point one cell is left in contact with inhibitor cells whilst
contact is broken for the other one, see Panels C,D, as completion of cell division interrupts
the contiguous cytoplasm /membranes of mother / daughter cells.
The cell which broke contact can be seen to divide normally and carries on growing whilst
80
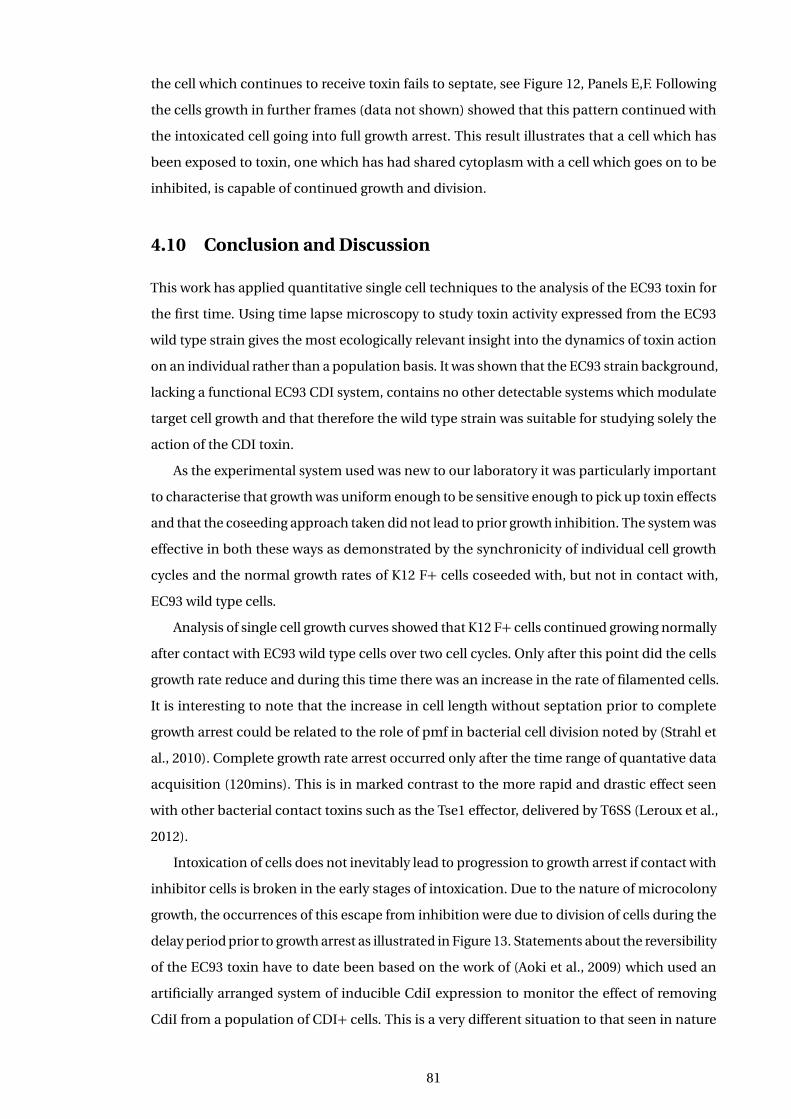
the cell which continues to receive toxin fails to septate, see Figure 12, Panels E,F. Following
the cells growth in further frames (data not shown) showed that this pattern continued with
the intoxicated cell going into full growth arrest. This result illustrates that a cell which has
been exposed to toxin, one which has had shared cytoplasm with a cell which goes on to be
inhibited, is capable of continued growth and division.
4.10 Conclusion and Discussion
This work has applied quantitative single cell techniques to the analysis of the EC93 toxin for
the first time. Using time lapse microscopy to study toxin activity expressed from the EC93
wild type strain gives the most ecologically relevant insight into the dynamics of toxin action
on an individual rather than a population basis. It was shown that the EC93 strain background,
lacking a functional EC93 CDI system, contains no other detectable systems which modulate
target cell growth and that therefore the wild type strain was suitable for studying solely the
action of the CDI toxin.
As the experimental system used was new to our laboratory it was particularly important
to characterise that growth was uniform enough to be sensitive enough to pick up toxin effects
and that the coseeding approach taken did not lead to prior growth inhibition. The system was
effective in both these ways as demonstrated by the synchronicity of individual cell growth
cycles and the normal growth rates of K12 F+ cells coseeded with, but not in contact with,
EC93 wild type cells.
Analysis of single cell growth curves showed that K12 F+ cells continued growing normally
after contact with EC93 wild type cells over two cell cycles. Only after this point did the cells
growth rate reduce and during this time there was an increase in the rate of filamented cells.
It is interesting to note that the increase in cell length without septation prior to complete
growth arrest could be related to the role of pmf in bacterial cell division noted by (Strahl et
al., 2010). Complete growth rate arrest occurred only after the time range of quantative data
acquisition (120mins). This is in marked contrast to the more rapid and drastic effect seen
with other bacterial contact toxins such as the Tse1 effector, delivered by T6SS (Leroux et al.,
2012).
Intoxication of cells does not inevitably lead to progression to growth arrest if contact with
inhibitor cells is broken in the early stages of intoxication. Due to the nature of microcolony
growth, the occurrences of this escape from inhibition were due to division of cells during the
delay period prior to growth arrest as illustrated in Figure 13. Statements about the reversibility
of the EC93 toxin have to date been based on the work of (Aoki et al., 2009) which used an
artificially arranged system of inducible CdiI expression to monitor the effect of removing
CdiI from a population of CDI+ cells. This is a very different situation to that seen in nature
81
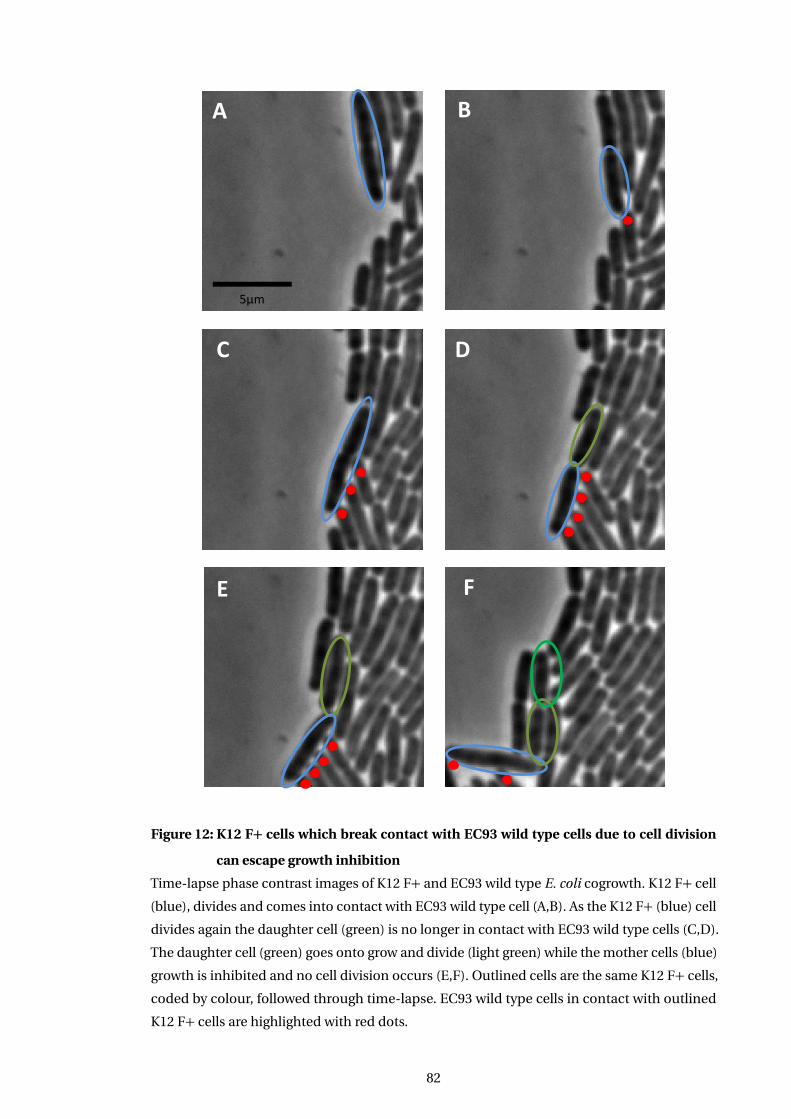
5µm
A B
C D
E F
Figure 12: K12 F+ cells which break contact with EC93 wild type cells due to cell division
can escape growth inhibition
Time-lapse phase contrast images of K12 F+ and EC93 wild type E. coli cogrowth. K12 F+ cell
(blue), divides and comes into contact with EC93 wild type cell (A,B). As the K12 F+ (blue) cell
divides again the daughter cell (green) is no longer in contact with EC93 wild type cells (C,D).
The daughter cell (green) goes onto grow and divide (light green) while the mother cells (blue)
growth is inhibited and no cell division occurs (E,F). Outlined cells are the same K12 F+ cells,
coded by colour, followed through time-lapse. EC93 wild type cells in contact with outlined
K12 F+ cells are highlighted with red dots.
82
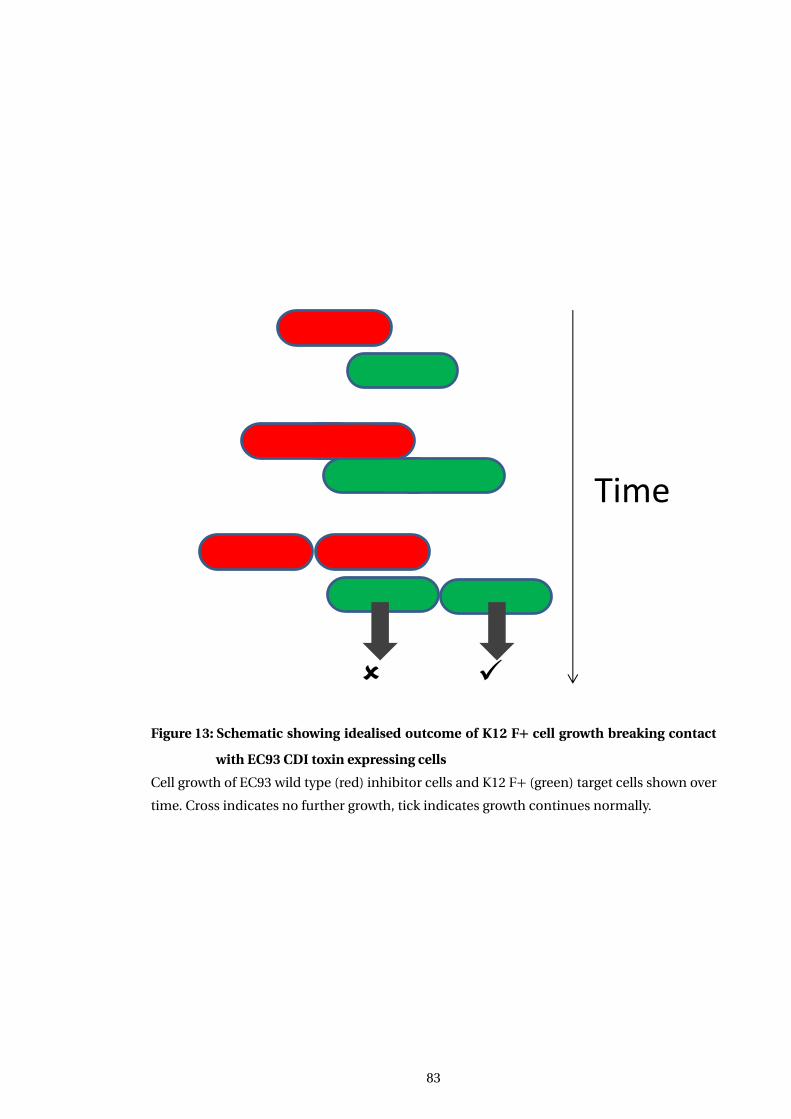
Time
Figure 13: Schematic showing idealised outcome of K12 F+ cell growth breaking contact
with EC93 CDI toxin expressing cells
Cell growth of EC93 wild type (red) inhibitor cells and K12 F+ (green) target cells shown over
time. Cross indicates no further growth, tick indicates growth continues normally.
83
where susceptible target cells will be receiving toxin trans-located across their membranes
from adjacent CDI+ cells. In this case two key factors are different:
1. Under natural conditions the cells susceptible to the EC93 CDI toxin will never have CdiI
present in their cytoplasm. So recovery under the conditions tested in this thesis show
that even in the absence of a cognate antitoxin molecule the cell can clear/tolerate the
level of toxin already delivered.
2. It is not clear if EC93 CdiA toxin produced intracellularly in a cell lacking CdiI is capable
of inhibition. Levels and the nature of inhibition could potentially be different in this ar-
tificial situation. This could be tested by performing similar experiments but in a strain
background which was immune to self intoxication by virtue of having a BamA molecule
which would not interact with CdiA for example expressing chimeric salmonella extra-
cellular loops. In this case interaction between clonemates to deliver toxin would not
be possible only and potential intracellular effects would be seen.
It should be emphasised that one of the benefits of this single cell analysis approach is
that the toxin effect can be monitored in a system where the normal growth state of the cell
prior to toxin analysis is known and that comparison of an intoxicated cell with a clone mate
of identical growth history, that had until very recently contiguous cytoplasm is possible.
Previous approaches taken to assign the CDI toxins as contact dependent left open the
possibility that a very short range effect could still be occurring (<10µm). Quantification of
the effect of the EC93 CDI toxin at the single cell level has demonstrated that the presence of
EC93 wild type cells near, but not in contact with, K12 F+ cells had no detectable effect on the
growth of those K12 F+ cells. If a short range effect was occurring then K12 F+ cells ’behind’
the line of clone mates in direct contact with EC93 CDI toxin or growing near to a separate
EC93 microcolony would be expected to have reduced growth rates. In neither case is any
such effect seen hence these results support EC93 CDI toxin has no short range effects and is
completely contact dependent.
These results represent the first detailed description of the action of the EC93 CDI toxin at
the single cell level, under natural conditions of expression. They show that the reversibility
of the EC93 CDI toxin action, seen under artificial conditions, can apply under more native
conditions to allow escape of intoxicated cells from growth inhibition. In addition they demon-
strate that direct contact between EC93 wild type and K12 F+ cells is absolutely required for
the EC93 CDI toxin to act.
84
Chapter 5
Effect of EC93 toxin on competition
and adhesion during biofilm growth
5.1 Introduction
Specific detail on the small scale action of toxins is important in determining mechanisms
of action (Sochacki et al., 2011; Leroux et al., 2012; Choi et al., 2015), but will not present the
whole picture of the role of CDI’s ecological relevance. In order to assess this population level
studies are required in a state that is relevant to growth in the natural /medical environment,
that is growing as a biofilm expressing significant levels of matrix. This is most readily achieved
in the laboratory using flow cells in which bacteria are grown on surfaces amenable to further
study, glass in the case of microscopy, with a constant flow of nutrients to allow cell growth and
which acts to remove non adhered cells. This work looks at the contribution of the different
regions of the EC93 CdiA toxin molecule when E. coli are growing in a biofilm.
In order to isolate the effect of different regions strains capable of expressing either the
wild type CdiA molecule, only the conserved CdiA (no toxin activity) or no CdiA at all were
used to separate out the effects of the two main functional regions of the protein, see Figure 14.
5.2 Development of flow cell protocol
5.2.1 Generation of strains expressing fluorescent proteins for confocal analysis
Initial experimental work indicated that one of the strains previously used in the laboratory
(King, 2010; Lakins et al., 2009) had issues with variable expression levels of GFP / tdTomato
(Shaner et al., 2005) under the flow cell conditions to be used for biofilm analysis. In addition it
was considered desirable to try to obtain a strain with genomic integration of fluorescent pro-
tein expression as this would be predicted to avoid loss of fluorescent protein expression due
to failure of plasmid maintenance and would allow more freedom to use other constructs for
85
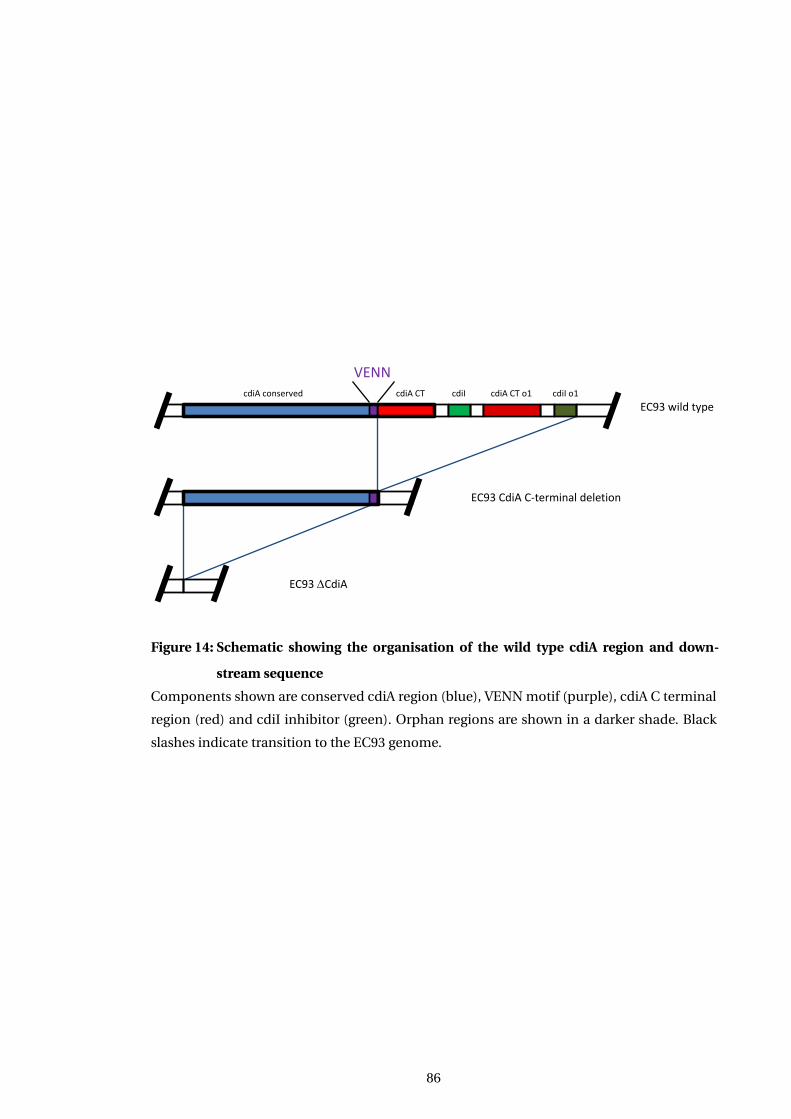
EC93 wild type
EC93 CdiA C-terminal deletion
EC93 CdiA
cdiA conserved cdiA CT cdiI cdiA CT o1 cdiI o1
VENN
Figure 14: Schematic showing the organisation of the wild type cdiA region and down-
stream sequence
Components shown are conserved cdiA region (blue), VENN motif (purple), cdiA C terminal
region (red) and cdiI inhibitor (green). Orphan regions are shown in a darker shade. Black
slashes indicate transition to the EC93 genome.
86
example cosmid system for expression of alternative CDI toxins in the same strain background.
These points were addressed in two ways.
Firstly the pool of fluorescent proteins used in the laboratory was expanded from the ini-
tial two, GFP and tdTomato to include YFP, CFP and mCherry. These proteins were examined
for suitability based on factors such as significant expression levels, maintenance of signifi-
cant expression during rapid cell growth and robustness to multiple rounds of exposure to
excitation light during imaging. Based on these assessments mCherry was taken forward as a
suitable replacement for tdTomato and one which was spectrally compatible with the already
used GFP.
Secondly significant efforts were made to establish a system for achieving fluorescent
protein expression from a genomic location in the EC93 strain background. In the first instance
the CRIM system (Haldimann et al., 2001) was used to obtain integration of a fluorescent
protein expression cassette into the attB site present within K12 and EC93 bacteria (confirmed
by PCR). This was successful at the sequence level with integration confirmed by sequencing
in both strain backgrounds. However there was no detectable fluorescence present above
background autofluorescence levels despite significant production from the plasmid used as
template. While a higher level of production would be predicted from the multi copy plasmid
the single copy under the control of a highly effective promoter should have been sufficient to
achieve detectable levels of fluorescent protein based on reports in the literature (Batchelor
et al., 2006) the ready detection of fluorescence in single copy genomic integrants that had
been provided to the lab for other projects. It may be that gene silencing is occurring, as has
been reported by Lucchini and colleagues (Lucchini et al., 2006), due to the histone-like nu-
cleoid-structuring protein (H-NS) acting to neutralise ’foreign’ DNA inserted into the bacterial
genome. H-NS molecules have been shown to bind preferentially to regions of DNA which are
AT-rich in comparison to the rest of the bacterial genome in which they reside, a trait charac-
teristic of xenogenic DNA. The increased levels of H-NS binding can lead to interference with
the action of RNA polymerases, either by exclusion of RNA polymerase from binding sites due
to steric hinderance (Navarre et al., 2007; Ali et al., 2012) or by trapping of RNA polymerase at
promoters by blocking the formation of initiation competent open promoter complexes (Shin
et al., 2012).
The next step taken was to switch integration system to the lambda red system (Murphy,
1998) (Datsenko et al., 2000), and even though it was targeted to integrate into the same attB
site used with the CRIM approach, using the same promoter driving fluorescent protein ex-
pression, significant levels of fluorescent protein expression were observed. This could be
due to differences in the inserted sequence, linear DNA with only required sequence for the
lambda red system compared to the additional vector sequence incorporated when using the
87
CRIM system. Unfortunately whilst this system was successful in obtaining integrants in K12
and EC93∆cdiA strain backgrounds it proved impossible to obtain integrants in the wild type
EC93 strain despite multiple attempts. This is presumably due to the known recalcitrance to
transformation of some wild type strains of E. coli (Murphy et al., 2003). As no system capable
of achieving genomic integration in all of the required strains was successfully implemented
it was decided to proceed using plasmid based systems with the EC93 strain.
5.2.2 Flowcell seeding and growth conditions
Initial experimental work was performed using a set up essentially as detailed in (Lakins et al.,
2009), but while this was capable of growing a very thick biofilm, required for that particular
set of work it had a number of drawbacks for use in the particular experiments required for
later work.
In order to obtain uniform expression of fluorescent protein with the amended pairing
changes were made to both the seeding density and growth time prior to image acquisition.
The initial protocol called for 14hour incubations with a high seed density of 1.0 OD600. In my
hands this lead to a very thick biofilm ill suited to studying the nature of strain interaction
and also more importantly showing a very variable level of functional fluorescent protein in
cells particularly those expressing proteins other than GFP. In order to overcome this the seed
density was reduced to 0.016 OD600 so that excessive growth had not occurred at the 14 hour
time point used. This gave acceptably uniform levels of fluorescent protein expression for GFP
but not other fluorescent proteins.
On the basis that likely factors to be affecting levels of functional fluorescent protein would
be the growth stage of cells and the presence of sufficient oxygen to ensure fluorescent protein
maturation, a shorter growth time before imaging was trialled. Growing cells for nine hours
prior to imaging still lead to significant levels of biofilm formation but with uniform levels of
fluorescent signal from both proteins used to mark cells.
A final modification to seeding densities was required when the CDI toxin negative strain
was altered from ∆cdiA to the C terminal cdiA mutant for reasons detailed in section 5.4.
The significant difference in inherent biofilm formation ability meant that an equal level of
coseeding lead to overgrowth of target cells even in the absence of toxin. Increasing the seeding
level of the target strain by 20 fold (from OD600 0.016 to 0.32) resulted in significant levels of
target cell growth when coseeded with cells with an EC93 strain background but only in the
absence of toxin, see Figure 15.
Confirmation that all cells were accounted for and that there had been no loss of fluores-
cence expression due to plasmid loss or other factors was obtained using confocal reflection
microscopy (Yawata et al., 2010) which shows cell positions independent of any markers, see
Figure 16.
88
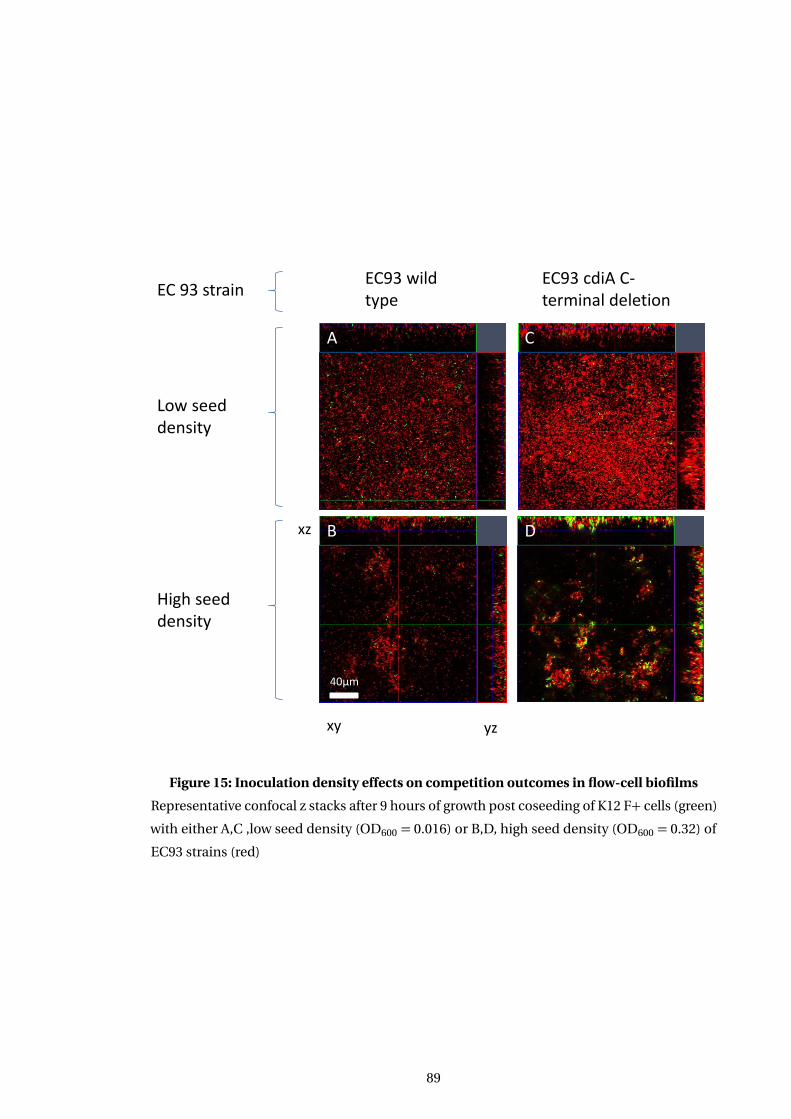
EC93 wild type
EC93 cdiA C-terminal deletion
EC 93 strain
Low seed density
High seed density
40µm
xz
yz xy
A
B
C
D
Figure 15: Inoculation density effects on competition outcomes in flow-cell biofilms
Representative confocal z stacks after 9 hours of growth post coseeding of K12 F+ cells (green)
with either A,C ,low seed density (OD600 = 0.016) or B,D, high seed density (OD600 = 0.32) of
EC93 strains (red)
89
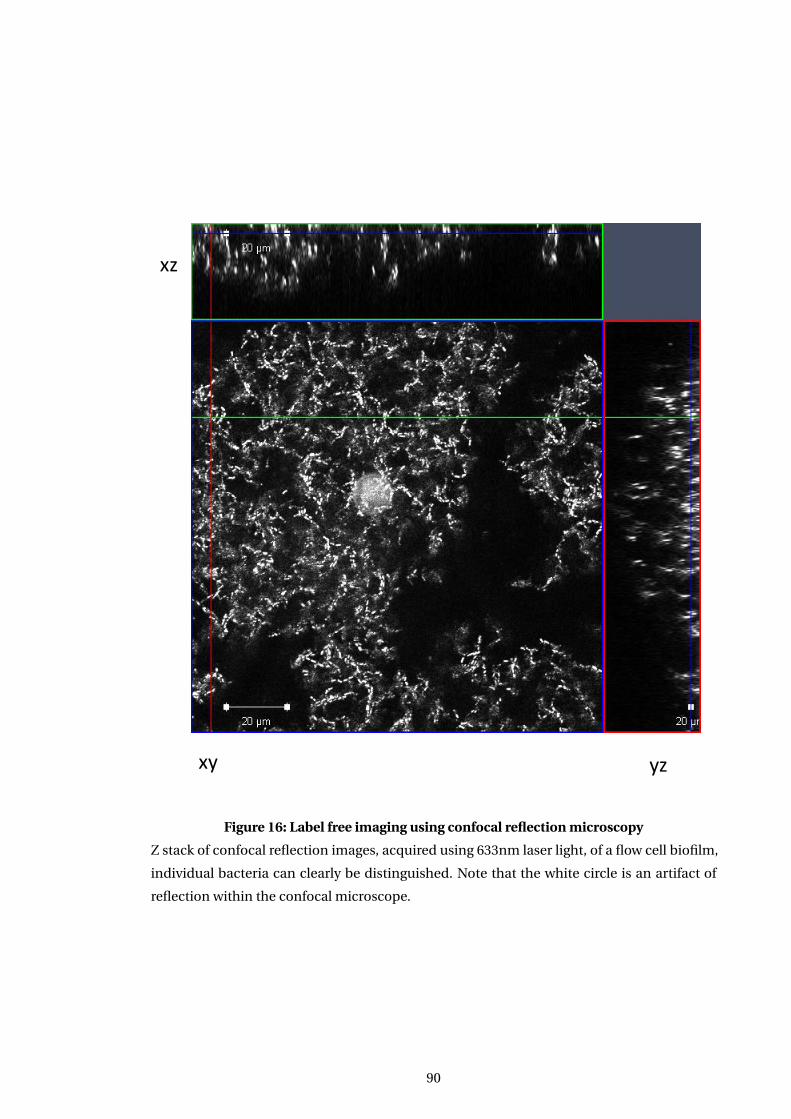
xz
yz xy
Figure 16: Label free imaging using confocal reflection microscopy
Z stack of confocal reflection images, acquired using 633nm laser light, of a flow cell biofilm,
individual bacteria can clearly be distinguished. Note that the white circle is an artifact of
reflection within the confocal microscope.
90
5.2.3 Flow cell design and set up
In addition to the protocol changes detailed in the previous section the flow cell and pumping
apparatus setup initially used (also based on the work of Lakins and colleagues (Lakins et al.,
2009)) were altered for the purposes of this work. In brief the flow cell used was changed from a
commercially available model (Model FC281, Biosurface Technologies, Bozeman, MT, U.S.A.)
to a custom fabricated flow cell. This flow cell was a redesign by Mark Bentley and myself of the
design reported in (Pamp et al., 2009) which itself was based on the work of (Wolfaardt et al.,
1994). The main design changes made were taken so as to make the design of the flow cell
suitable for use in an invert microscope, with precise position control and without catching
media tubing on the microscope apparatus during operation. The final design obtained after
three iterations is shown in Appendix D.
The set up of the media and pump were also inverted similar to the method of (Crusz et al.,
2012) but without inversion of the media container which was found not to be necessary in
my hands to reduce bubble formation. Moving to pulling media through the apparatus avoids
bubble formation due to the action of the pump and avoids positive pressure in the system
which can cause leaks / glass cracking. Instead negative pressure is applied which ensures that
leaks from the system cannot occur, instead in the event of a leak air is sucked into the system.
When the system is installed on a microscope for time-lapse acquisition this is a much safer
failure mode to avoid equipment damage as media cannot be pumped onto the microscope
itself. Additionally it was noted that the flow obtained in this configuration was smoother than
that with a push configuration. This allowed for confocal z stack acquisition without stopping
the media flow during time-lapse acquisition something which had not been possible using
the (Lakins et al., 2009) protocol.
5.2.4 Confocal z stack data analysis
When assigning fluorescent signal as being a component of the biofilm a number of different
approaches can be taken. Comstat / Comstat2 (Heydorn et al., 2000) (Vorregaard, 2008) use a
conservative approach to assignment of fluorescent signal as cellular biovolume by assigning
any volume that cannot be connected back to the substratum as not part of the biofilm. This
approach has the draw back of being likely to underestimate the true level of biofilm. This is
due to the fact that the confocal z stack will almost always be a small part of the total biofilm,
hence any biofilm which is part of the field of view but connected to the substratum outside of
the imaged volume will be falsely assigned as not part of the biofilm. Given the often complex
and varied nature of biofilm formation this is potentially quite a common occurrence.
In order to appropriately analyse and assign the confocal z stacks obtained from flow cell
experiments assessment of the actual biovolume of cells embedded in matrix, and hence part
91
of the ’true’ biofilm, was performed with and without media flow.
Firstly with media flow stopped the mobility of cells was assessed in three ways using
confocal microscopy:
1. Repeat observation of the same position within the flow cell at widely spaced time points,
in this way any free floating cells will most likely have moved in the interim time period
as there will be no restraining matrix to maintain there position
2. Monitoring for ’tracking’ of cells across adjacent z planes. Confocal microscopy has a
significant acquisition time compared to rates of cell drifting / motility driven move-
ment. As bacterial cells will typically be detected in multiple frames any cells which are
moving will not be seen in the predicted position in adjacent z stacks. Instead they will
be displaced to the position they had moved to when the next frame has been acquired.
3. Monitoring for cell movement after perturbing the flow cell system by administering
a rapid move and return ’knock’, by rapidly moving the stage. This induces sufficient
movement in the media to make non adhered /matrix embedded cells move.
Secondly with flow maintained during image acquisition it is possible to observe which
cells are being moved by the force applied by the flow across the biofilm as visualised using
phase contrast video microscopy (see List of Accompanying Material, pg 11). This shows that
there are four classes of cells observed:
1. Firmly embedded biofilm
2. Loosely attached biofilm which can be seen ’fluttering’ as pushed by flow of media
3. Cells free in solution but undergoing ’tumbling’ transient interactions with cell surface
4. Cells completely in solution following bulk liquid flow with no additional interactions
In summary these approaches both showed that the vast majority of biovolume signal im-
aged is from cells which are completely immobile. As bacteria in free solution even when not
actively swimming will still move this is sufficient evidence to assign this fluorescent signal as
biovolume due to bacteria embedded in matrix and hence part of a biofilm. These observa-
tions also demonstrated that the hold time during acquisition did not lead to any significant
dissolution of the biofilm, unlike the situation seen with other bacterial species (McDougald
et al., 2011; Thormann et al., 2005).
As very few cells were not assignable to the biofilm the decision was made to assign the
total fluorescence measured as biofilm. An attempt was made to use the erode function of
Volocity’s quantitaion analysis software with the aim of reducing small level signals most likely
to be due to the few free cells but this was found to also reduce signal from cells embedded in
92
the matrix. The data presented in this work will therefore be a slight overestimate of biofilm
biovolumes but will not have falsely rejected actual biofilm signal.
5.3 Effect of CDI on competition between coseeded target and in-
hibitor cells
In order to study the effect of CDI within biofilm growth cells of target and inhibitor / control
cells were grown in flow cells so as to obtain biofilms with significant levels of matrix produc-
tion. The outcome of competition between cells growing from this initially well mixed seeding
position was assayed by measuring the biovolume of each strain after 9 hours using CLSM,
once the media flow had been stopped . As individual randomly chosen fields within the flow
cell will be variable in the extent of biofilm formation the ratio of target cell biovolume to
inhibitor cell biovolume was calculated for each field and this ratio value used for comparison
between fields.
5.3.1 Cogrowth of target and inhibitor cells occurs initially
As the coseeding protocol was a novel one it needed to be confirmed that the initially seeded
target cells were viable for biofilm formation and had not been preinhibited. Previous work
by Aoki et al (Aoki et al., 2005) showed that for planktonic inhibition to occur inhibitor cells
needed to be in log growth phase. Also assays used a large excess of inhibitor cells over target
cells with significant incubation times, typically 3 hours to achieve the significant levels of
growth arrest reported. There was also evidence for reversibility of the action of the EC93 CDI
toxin (Aoki et al., 2009) albeit in an artificial situation. Taken together these factors would
predict minimal opportunities for the CDI expressing inhibitor cells to act on target cells using
a protocol where the CDI+ cells are seeded first. As the majority of inhibitor cells will have
been washed off prior to target cell addition, the cells present are not in log phase growth as
there is significant growth lag as they adapt to changes in nutrient availability in media (LB
to M9) and growth mode (planktonic to biofilm). If any effective intoxication has occurred
then it will only have been transient as cells post coseeding flushing are seen to be separate
so further intoxication will not be occurring and any growth inhibition would be reversible.
Viability of coseeded target cells was checked by two methods - evidence of motility and
evidence of growth in the initial stages of biofilm formation, prior to microcolony contact.
1) This could be seen by a visual check of seeded cells where motility was still present in
spinning target cells at the end of the coseeding protocol. These cells are being rotated by there
flagella which are interacting with the glass coverslip surface and acting to tether the bacteria
in position. The motor action is still however driving rotation as the flagella are fixed this leads
to movement of the cell, much as is seen in some experimental set ups (Berg et al., 1993). As a
93
cell with a significant proton motive force is required for motor movement this demonstrates
that at least a proportion of the cells had not been affected
2) In addition while only individual cells were observed on initial seeding it could be seen
that even when CDI toxin activity was inhibiting significant growth there was some expansion
of the population of target cells which existed at the start of the flow cell incubation period.
See also Section 5.3.4 for microscopy showing growth of initially seeded target cells over time.
5.3.2 Ec93 CDI toxin increases strains competitive effectiveness in a biofilm
Competitive effectiveness of the EC93 toxin was judged by comparing the biovolume ratio of
target to Ec93 strain cells grown in the presence or either CDI+wild type cells or CDI-∆cdiA
cells. It can be seen in Figure 17 panel A that expression of a functional EC93 CDI system leads
to growth inhibition of the target cells and hence to overgrowth by the wild type EC93 strain.
This is a novel demonstration of the effectiveness of the EC93 CDI toxin when cells are growing
in a biofilm. Isolated target cells up to small microcolonies of ~10 cells can be identified in the
larger body of inhibitor cells. The presence of target cells spread through the biofilm is most
likely due to the pushing action of cell growth/matrix production. This effect was quantified by
calculating the ratio of K12 F+ cells (target cells, that is susceptible to CDI toxin) to EC93 strain
cells using biovolume, calculated from appropriate fluorescent signal. The greater the ability
of the EC93 strain to grow relative to the target strain the lower the value of this competitive
index.
As shown in Figure 17 panel A target cells are able to grow in the presence of the EC93
∆cdiA strain showing that, as found in Chapter 4, the EC93 strain background did not stop
target cell growth, this time in the context of biofilm growth. The result is that starting from a
random arrangement of cells a well mixed two strain biofilm is formed in the absence of CDI
toxin.
Expression of different fluorescent proteins could theoretically alter the growth rates of
strains, even though no such effect was seen in planktonic growth, or beii detected to different
extents, although confocal settings were adjusted to give comparable responses. This was
tested for by analysing flow cells with both options for expression of GFP or mCherry. There
was no significant difference in the response of target cells to CDI+ cells when they were
expressing either of the fluorescent proteins used as a complementary pair in experiments
see Figure 17.
It was noted that there seemed to be a more variable, and overall lower, absolute level of
biofilm formation in flow cells in which∆ cdiA cells were grown. This lead to the work shown
in section 5.3 looking solely at biofilm formation of single strain biofilms.
94
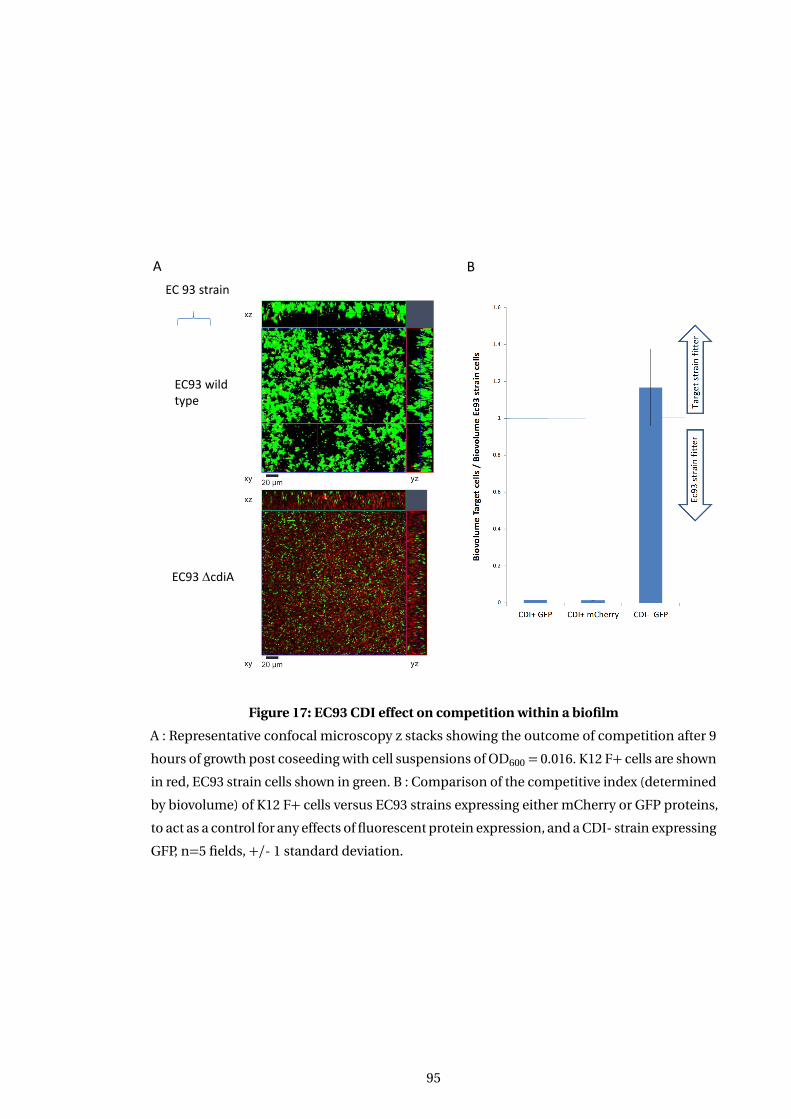
A B
EC93 wild type
EC93 cdiA
EC 93 strain
Figure 17: EC93 CDI effect on competition within a biofilm
A : Representative confocal microscopy z stacks showing the outcome of competition after 9
hours of growth post coseeding with cell suspensions of OD600 = 0.016. K12 F+ cells are shown
in red, EC93 strain cells shown in green. B : Comparison of the competitive index (determined
by biovolume) of K12 F+ cells versus EC93 strains expressing either mCherry or GFP proteins,
to act as a control for any effects of fluorescent protein expression, and a CDI- strain expressing
GFP, n=5 fields, +/- 1 standard deviation.
95
5.3.3 Ec93 toxin action alone impacts on biofilm competitive effectiveness
To demonstrate the effectiveness of only the toxin portion of CdiA, coseeding experiments
with the C-terminal cdiA deletion strain were performed. As covered in Section 5.4 the core
conserved region of CdiA has a role in biofilm formation so in order to isolate the increased
rate of biofilm formation effects from the toxin growth inhibition of target effects an EC93
CdiA C-terminal deletion strain, which has only the toxin portion missing, was used. As this
lacks the toxin there will be no growth inhibition but it should retain comparable levels of
biofilm formation ability. As shown in panels B and D of Figure 15 and quantified in Figure 18
the change in strain leads to biofilm formation which shows comparable levels and character-
istics, degree of ’clumping’, between each strain indicating that there was indeed a significant
difference being seen when the∆cdiA control had been used previously, see Section 5.3.2.
As is common with biofilm analysis there is variation in absolute values of biofilm reported
between replicates but the same conclusion can be drawn, that there is a statistically signifi-
cant reduction in competitive fitness within a biofilm on loss of the C terminal toxin portion
only. Therefore it can be concluded that the change to strains with comparable levels of biofilm
production has not removed the effect of CDI toxin on biofilm competitive ability. It can how-
ever be seen that the magnitude of the effect has decreased, compare Figure 17 panel B with
Figure 18, indicating that there was previously a significant contribution of growth differences
to the measured levels of competition.
5.3.4 Time lapse analysis of competition
In order to obtain an insight on the dynamics of competition between target and inhibitor
cells in a biofilm, and also to confirm that no inhibition prior to biofilm growth was occuring
with the coseeding protocol used, timelapse analysis of biofilm growth was performed. In this
case the protocol was modified so that rather than taking a single set of measurements at 9
hours multiple observations across the period up until 13 hours of growth were obtained.
As shown in Figure19 the initially widely spaced and randomly positioned single cells seen
at t=0 hour show growth of both inhibitor cells and target cells after three hours of growth.
Correlating the two z slices of the same field of view shows that the bulk of cells present in the
0hr image are still present at the 3 hour time point, the others have presumably been lost to
the bulk media flow due to insufficient adhesion. Of the cells which remained the majority of
them appear to have undergone growth / division. This demonstrates that the target cells are
capable of growth after the coseeding protocol and hence that prior inhibition by CDI cells
has not occurred.
Comparison of later time points (10 through to 13 hours) shows no change in the levels
of target cells present but a change in position of the non growing target cells as they appear
96
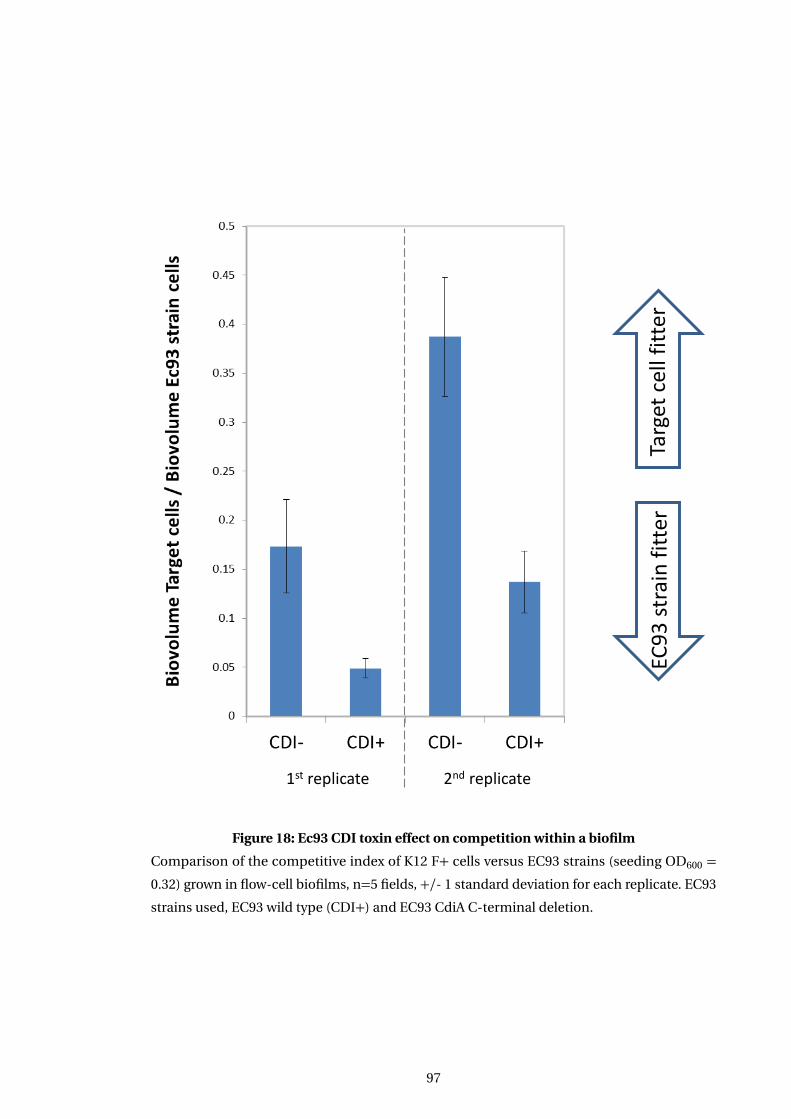
1st replicate 2nd replicate
Targ
et c
ell f
itte
r EC
93
str
ain
fit
ter
Figure 18: Ec93 CDI toxin effect on competition within a biofilm
Comparison of the competitive index of K12 F+ cells versus EC93 strains (seeding OD600 =
0.32) grown in flow-cell biofilms, n=5 fields, +/- 1 standard deviation for each replicate. EC93
strains used, EC93 wild type (CDI+) and EC93 CdiA C-terminal deletion.
97
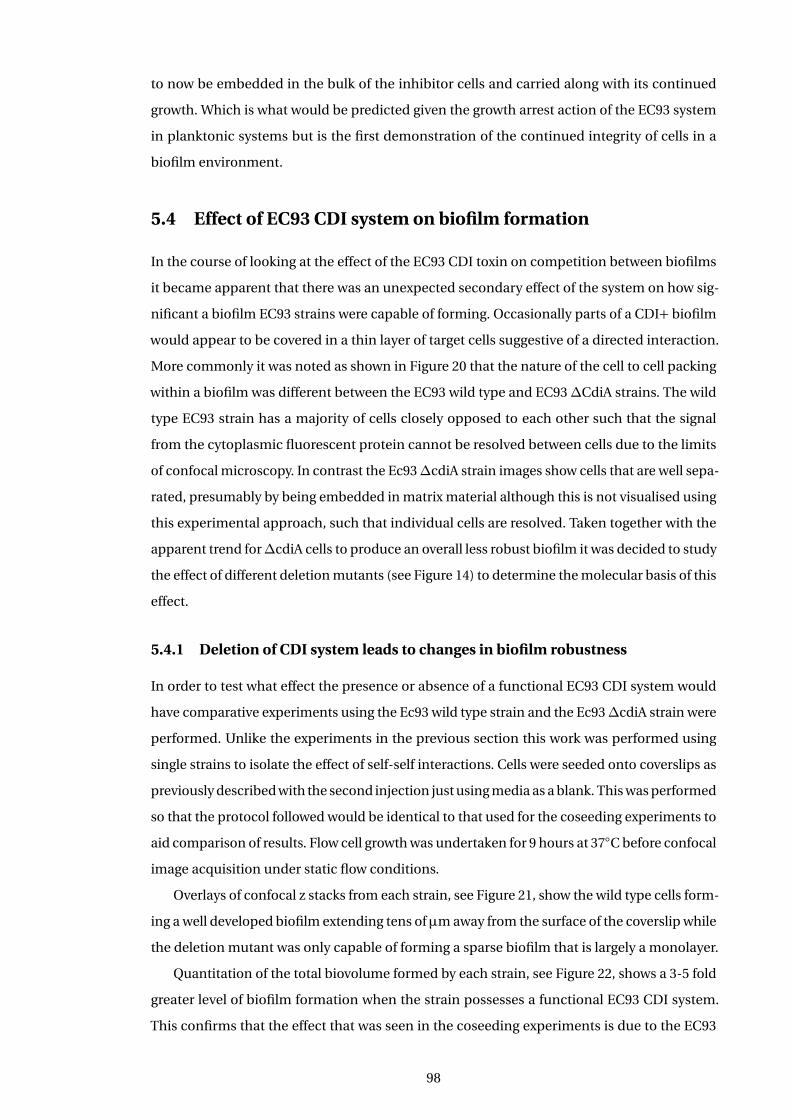
to now be embedded in the bulk of the inhibitor cells and carried along with its continued
growth. Which is what would be predicted given the growth arrest action of the EC93 system
in planktonic systems but is the first demonstration of the continued integrity of cells in a
biofilm environment.
5.4 Effect of EC93 CDI system on biofilm formation
In the course of looking at the effect of the EC93 CDI toxin on competition between biofilms
it became apparent that there was an unexpected secondary effect of the system on how sig-
nificant a biofilm EC93 strains were capable of forming. Occasionally parts of a CDI+ biofilm
would appear to be covered in a thin layer of target cells suggestive of a directed interaction.
More commonly it was noted as shown in Figure 20 that the nature of the cell to cell packing
within a biofilm was different between the EC93 wild type and EC93∆CdiA strains. The wild
type EC93 strain has a majority of cells closely opposed to each other such that the signal
from the cytoplasmic fluorescent protein cannot be resolved between cells due to the limits
of confocal microscopy. In contrast the Ec93∆cdiA strain images show cells that are well sepa-
rated, presumably by being embedded in matrix material although this is not visualised using
this experimental approach, such that individual cells are resolved. Taken together with the
apparent trend for∆cdiA cells to produce an overall less robust biofilm it was decided to study
the effect of different deletion mutants (see Figure 14) to determine the molecular basis of this
effect.
5.4.1 Deletion of CDI system leads to changes in biofilm robustness
In order to test what effect the presence or absence of a functional EC93 CDI system would
have comparative experiments using the Ec93 wild type strain and the Ec93∆cdiA strain were
performed. Unlike the experiments in the previous section this work was performed using
single strains to isolate the effect of self-self interactions. Cells were seeded onto coverslips as
previously described with the second injection just using media as a blank. This was performed
so that the protocol followed would be identical to that used for the coseeding experiments to
aid comparison of results. Flow cell growth was undertaken for 9 hours at 37C before confocal
image acquisition under static flow conditions.
Overlays of confocal z stacks from each strain, see Figure 21, show the wild type cells form-
ing a well developed biofilm extending tens ofµm away from the surface of the coverslip while
the deletion mutant was only capable of forming a sparse biofilm that is largely a monolayer.
Quantitation of the total biovolume formed by each strain, see Figure 22, shows a 3-5 fold
greater level of biofilm formation when the strain possesses a functional EC93 CDI system.
This confirms that the effect that was seen in the coseeding experiments is due to the EC93
98
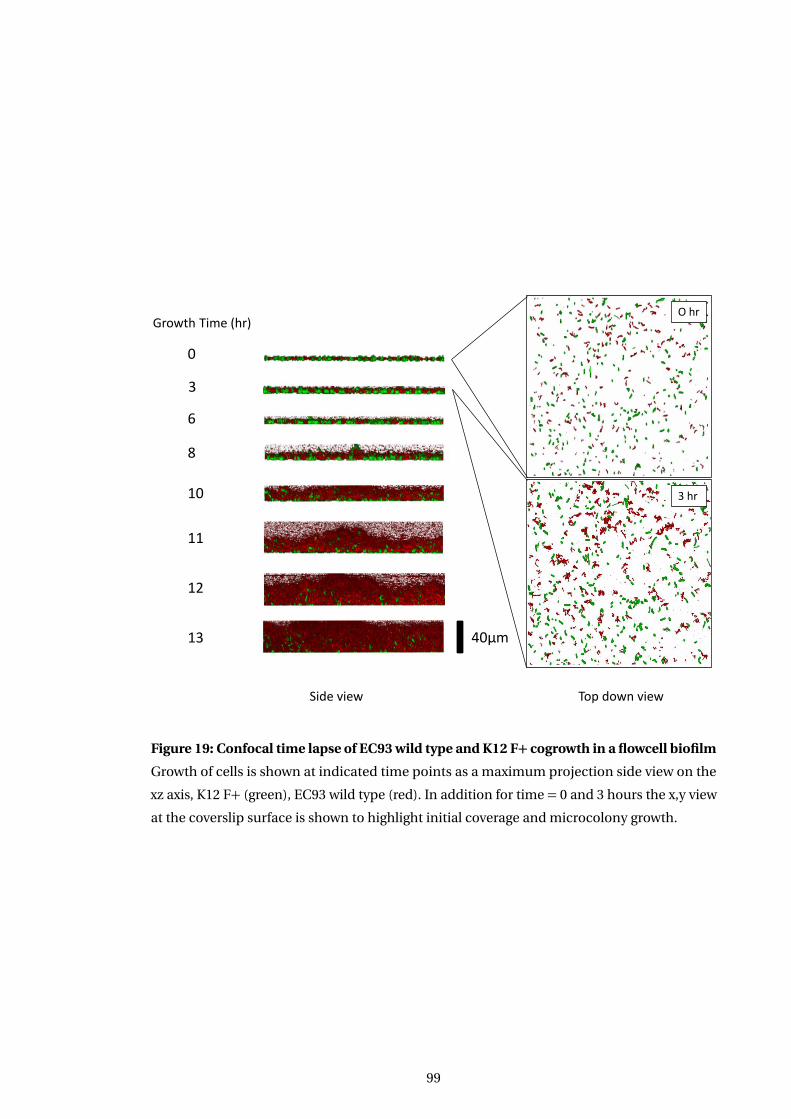
40µm
Growth Time (hr)
0
3
6
8
10
11
12
13
Side view Top down view
O hr
3 hr
Figure 19: Confocal time lapse of EC93 wild type and K12 F+ cogrowth in a flowcell biofilm
Growth of cells is shown at indicated time points as a maximum projection side view on the
xz axis, K12 F+ (green), EC93 wild type (red). In addition for time = 0 and 3 hours the x,y view
at the coverslip surface is shown to highlight initial coverage and microcolony growth.
99
A B
Figure 20: Packing density of bacterial cells is altered by CdiA expression
Confocal xy slices showing packing density of strains after 14 hours of growth : A) EC93 wild
type close packing was predominantly seen in towers extending from substratum b) EC93∆
cdiA cells were seen to be more widely separated.
100
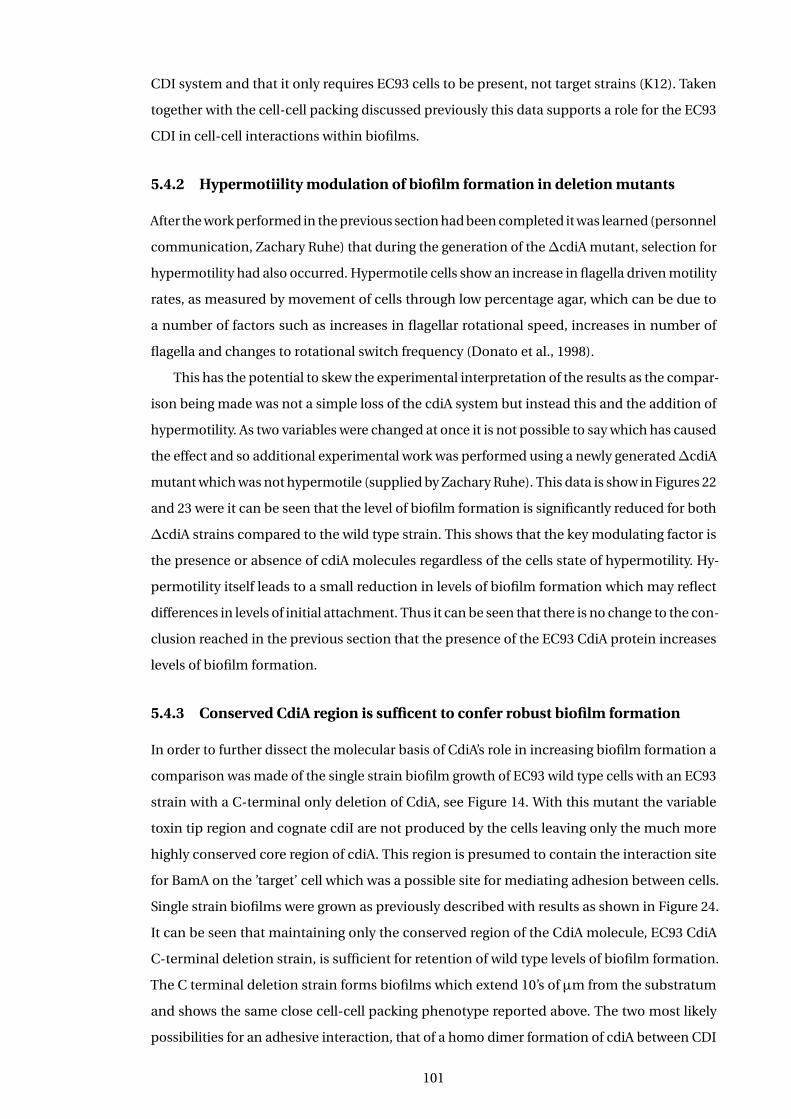
CDI system and that it only requires EC93 cells to be present, not target strains (K12). Taken
together with the cell-cell packing discussed previously this data supports a role for the EC93
CDI in cell-cell interactions within biofilms.
5.4.2 Hypermotiility modulation of biofilm formation in deletion mutants
After the work performed in the previous section had been completed it was learned (personnel
communication, Zachary Ruhe) that during the generation of the∆cdiA mutant, selection for
hypermotility had also occurred. Hypermotile cells show an increase in flagella driven motility
rates, as measured by movement of cells through low percentage agar, which can be due to
a number of factors such as increases in flagellar rotational speed, increases in number of
flagella and changes to rotational switch frequency (Donato et al., 1998).
This has the potential to skew the experimental interpretation of the results as the compar-
ison being made was not a simple loss of the cdiA system but instead this and the addition of
hypermotility. As two variables were changed at once it is not possible to say which has caused
the effect and so additional experimental work was performed using a newly generated∆cdiA
mutant which was not hypermotile (supplied by Zachary Ruhe). This data is show in Figures 22
and 23 were it can be seen that the level of biofilm formation is significantly reduced for both
∆cdiA strains compared to the wild type strain. This shows that the key modulating factor is
the presence or absence of cdiA molecules regardless of the cells state of hypermotility. Hy-
permotility itself leads to a small reduction in levels of biofilm formation which may reflect
differences in levels of initial attachment. Thus it can be seen that there is no change to the con-
clusion reached in the previous section that the presence of the EC93 CdiA protein increases
levels of biofilm formation.
5.4.3 Conserved CdiA region is sufficent to confer robust biofilm formation
In order to further dissect the molecular basis of CdiA’s role in increasing biofilm formation a
comparison was made of the single strain biofilm growth of EC93 wild type cells with an EC93
strain with a C-terminal only deletion of CdiA, see Figure 14. With this mutant the variable
toxin tip region and cognate cdiI are not produced by the cells leaving only the much more
highly conserved core region of cdiA. This region is presumed to contain the interaction site
for BamA on the ’target’ cell which was a possible site for mediating adhesion between cells.
Single strain biofilms were grown as previously described with results as shown in Figure 24.
It can be seen that maintaining only the conserved region of the CdiA molecule, EC93 CdiA
C-terminal deletion strain, is sufficient for retention of wild type levels of biofilm formation.
The C terminal deletion strain forms biofilms which extend 10’s of µm from the substratum
and shows the same close cell-cell packing phenotype reported above. The two most likely
possibilities for an adhesive interaction, that of a homo dimer formation of cdiA between CDI
101
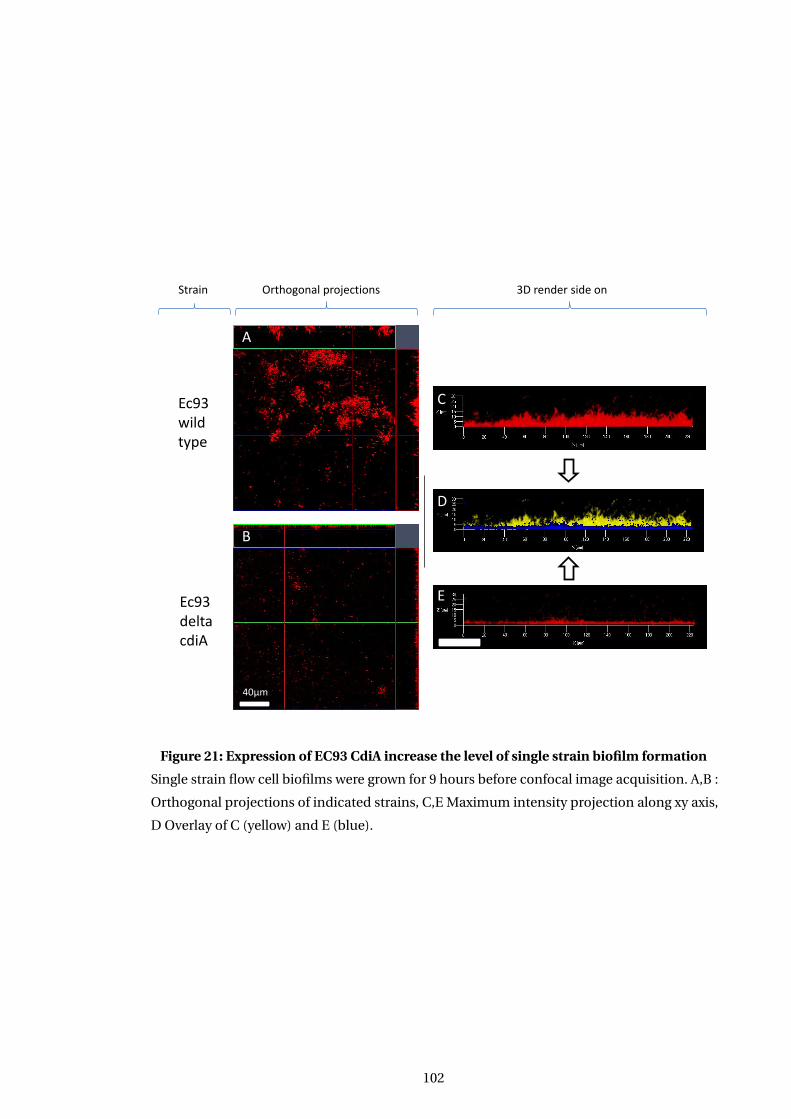
Ec93 wild type
Ec93 delta cdiA
Orthogonal projections 3D render side on Strain
A
D
E
C
B
40µm
Figure 21: Expression of EC93 CdiA increase the level of single strain biofilm formation
Single strain flow cell biofilms were grown for 9 hours before confocal image acquisition. A,B :
Orthogonal projections of indicated strains, C,E Maximum intensity projection along xy axis,
D Overlay of C (yellow) and E (blue).
102
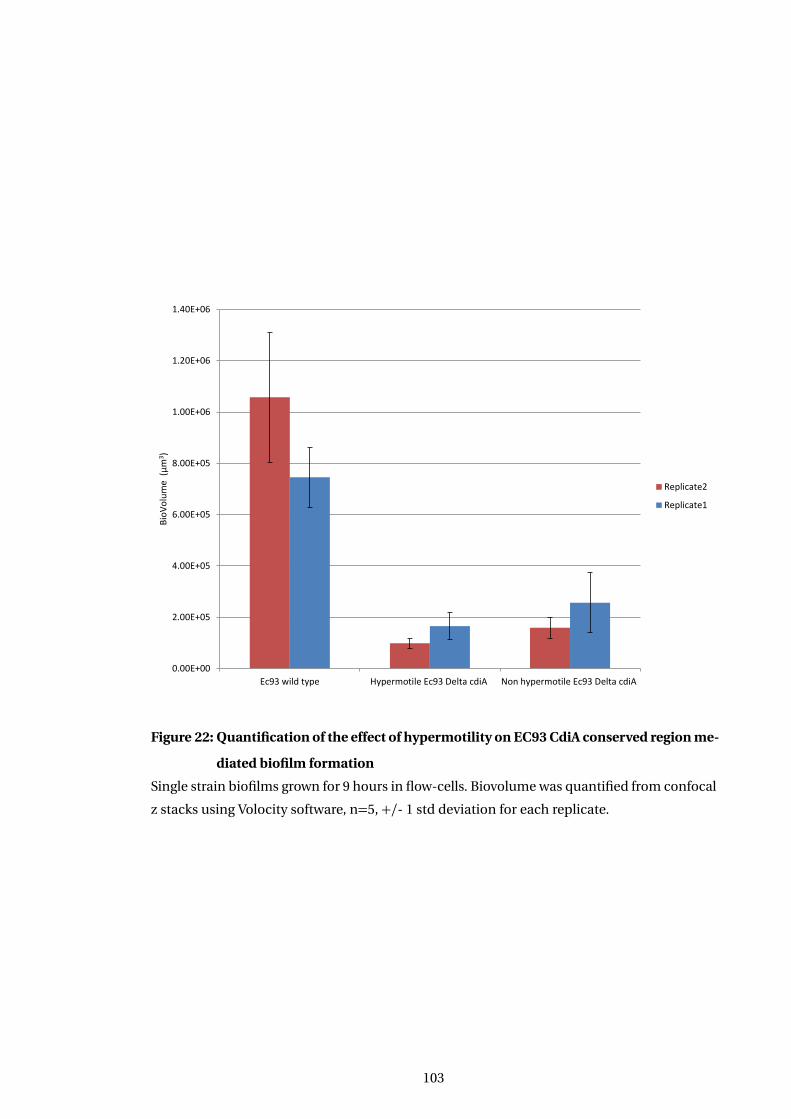
0.00E+00
2.00E+05
4.00E+05
6.00E+05
8.00E+05
1.00E+06
1.20E+06
1.40E+06
Ec93 wild type Hypermotile Ec93 Delta cdiA Non hypermotile Ec93 Delta cdiA
Bio
Vo
lum
e (
µm
3 )
Replicate2
Replicate1
Figure 22: Quantification of the effect of hypermotility on EC93 CdiA conserved region me-
diated biofilm formation
Single strain biofilms grown for 9 hours in flow-cells. Biovolume was quantified from confocal
z stacks using Volocity software, n=5, +/- 1 std deviation for each replicate.
103
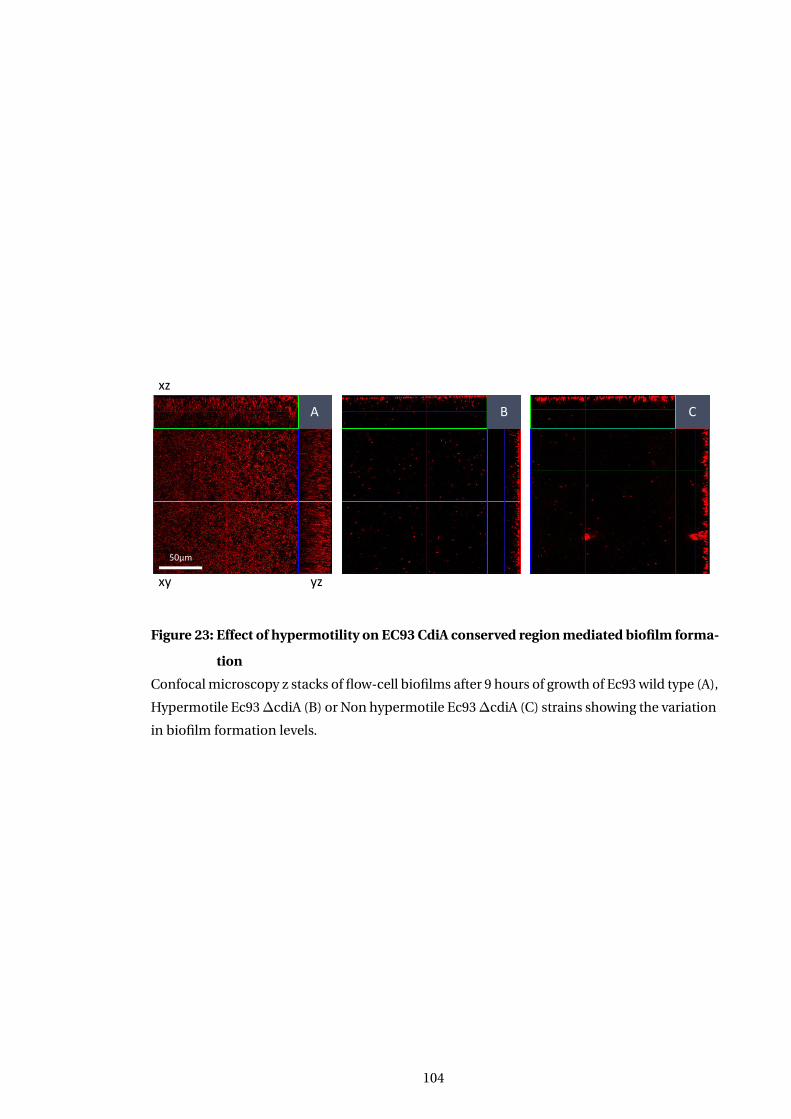
xz
yz xy
50µm
A B C
Figure 23: Effect of hypermotility on EC93 CdiA conserved region mediated biofilm forma-
tion
Confocal microscopy z stacks of flow-cell biofilms after 9 hours of growth of Ec93 wild type (A),
Hypermotile Ec93∆cdiA (B) or Non hypermotile Ec93∆cdiA (C) strains showing the variation
in biofilm formation levels.
104
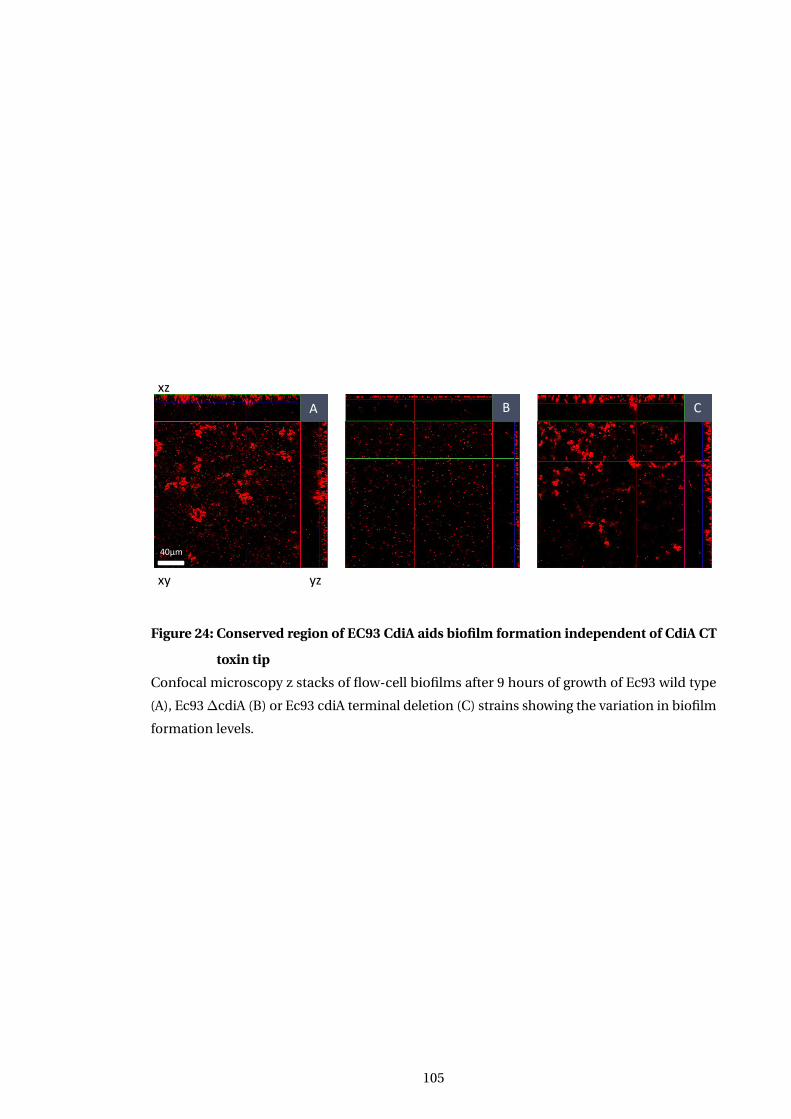
40µm
xz
yz xy
A B C
Figure 24: Conserved region of EC93 CdiA aids biofilm formation independent of CdiA CT
toxin tip
Confocal microscopy z stacks of flow-cell biofilms after 9 hours of growth of Ec93 wild type
(A), Ec93∆cdiA (B) or Ec93 cdiA terminal deletion (C) strains showing the variation in biofilm
formation levels.
105
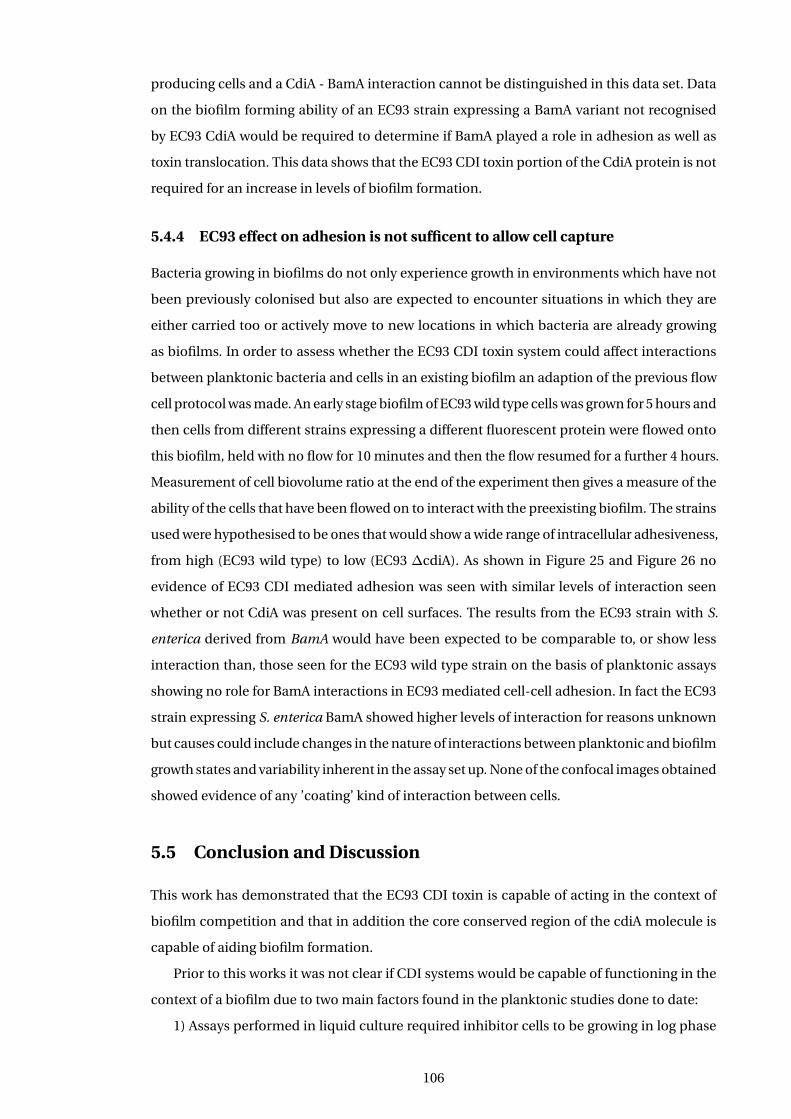
producing cells and a CdiA - BamA interaction cannot be distinguished in this data set. Data
on the biofilm forming ability of an EC93 strain expressing a BamA variant not recognised
by EC93 CdiA would be required to determine if BamA played a role in adhesion as well as
toxin translocation. This data shows that the EC93 CDI toxin portion of the CdiA protein is not
required for an increase in levels of biofilm formation.
5.4.4 EC93 effect on adhesion is not sufficent to allow cell capture
Bacteria growing in biofilms do not only experience growth in environments which have not
been previously colonised but also are expected to encounter situations in which they are
either carried too or actively move to new locations in which bacteria are already growing
as biofilms. In order to assess whether the EC93 CDI toxin system could affect interactions
between planktonic bacteria and cells in an existing biofilm an adaption of the previous flow
cell protocol was made. An early stage biofilm of EC93 wild type cells was grown for 5 hours and
then cells from different strains expressing a different fluorescent protein were flowed onto
this biofilm, held with no flow for 10 minutes and then the flow resumed for a further 4 hours.
Measurement of cell biovolume ratio at the end of the experiment then gives a measure of the
ability of the cells that have been flowed on to interact with the preexisting biofilm. The strains
used were hypothesised to be ones that would show a wide range of intracellular adhesiveness,
from high (EC93 wild type) to low (EC93 ∆cdiA). As shown in Figure 25 and Figure 26 no
evidence of EC93 CDI mediated adhesion was seen with similar levels of interaction seen
whether or not CdiA was present on cell surfaces. The results from the EC93 strain with S.
enterica derived from BamA would have been expected to be comparable to, or show less
interaction than, those seen for the EC93 wild type strain on the basis of planktonic assays
showing no role for BamA interactions in EC93 mediated cell-cell adhesion. In fact the EC93
strain expressing S. enterica BamA showed higher levels of interaction for reasons unknown
but causes could include changes in the nature of interactions between planktonic and biofilm
growth states and variability inherent in the assay set up. None of the confocal images obtained
showed evidence of any ’coating’ kind of interaction between cells.
5.5 Conclusion and Discussion
This work has demonstrated that the EC93 CDI toxin is capable of acting in the context of
biofilm competition and that in addition the core conserved region of the cdiA molecule is
capable of aiding biofilm formation.
Prior to this works it was not clear if CDI systems would be capable of functioning in the
context of a biofilm due to two main factors found in the planktonic studies done to date:
1) Assays performed in liquid culture required inhibitor cells to be growing in log phase
106
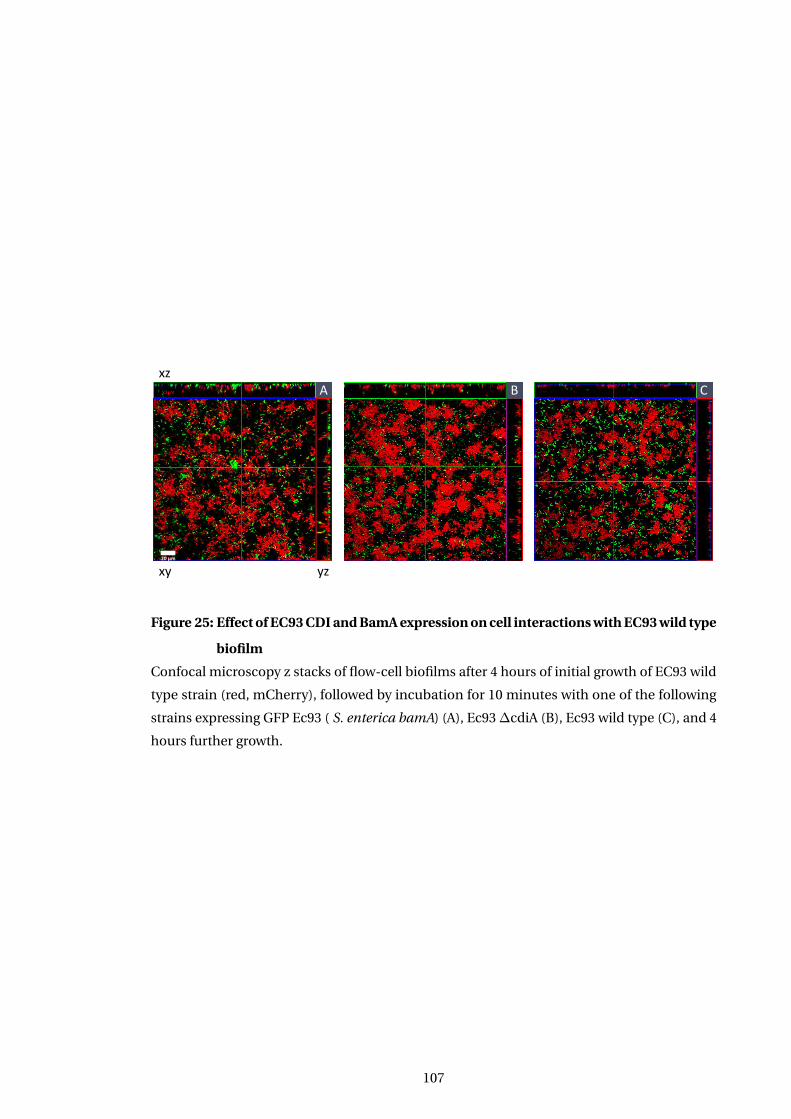
20 µm
xz
yz xy
A B C
Figure 25: Effect of EC93 CDI and BamA expression on cell interactions with EC93 wild type
biofilm
Confocal microscopy z stacks of flow-cell biofilms after 4 hours of initial growth of EC93 wild
type strain (red, mCherry), followed by incubation for 10 minutes with one of the following
strains expressing GFP Ec93 ( S. enterica bamA) (A), Ec93∆cdiA (B), Ec93 wild type (C), and 4
hours further growth.
107
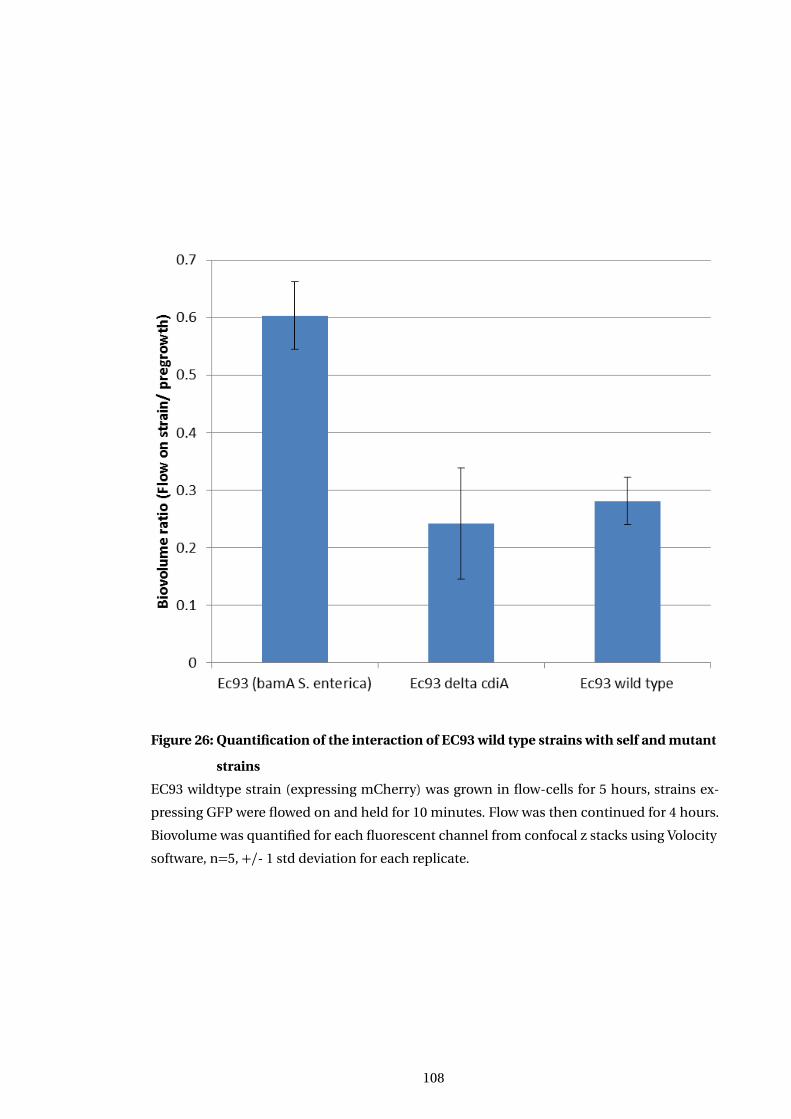
Figure 26: Quantification of the interaction of EC93 wild type strains with self and mutant
strains
EC93 wildtype strain (expressing mCherry) was grown in flow-cells for 5 hours, strains ex-
pressing GFP were flowed on and held for 10 minutes. Flow was then continued for 4 hours.
Biovolume was quantified for each fluorescent channel from confocal z stacks using Volocity
software, n=5, +/- 1 std deviation for each replicate.
108
for the growth inhibitory effect of CDI to be seen. They also commonly used a large excess of
inhibitor to target cells which would be consistent with many opportunities for toxin delivery
which would not be available in the more structured environment of a biofilm.
2) It was already reported by Aoki et al (Aoki et al., 2005) that bacterial surface components
such as pili could act to protect cells from the action of EC93 CDI toxin. Biofilms classically
contain a significant matrix component surrounding and separating cells which could easily
be envisaged to also act to block cells coming together or make such contacts infrequent
enough to have a negligible effect on overall biofilm competition.
The results of the coseeding flow cell analysis show that at growth rates attainable in a
biofilm, albeit one with constant fresh media flow at 37C and hence likely to represent near
maximal biofilm growth rates, the EC93 CDI system is effective. The presence of significant
levels of matrix, as judged by the amount / spacing of immobilised cells did not stop the action
of CDI. This is presumably due to the significant levels of cell mixing on biofilm growth, see
Figure 19 that were seen using this protocol, which would give increased opportunities for
inhibitor - target cell interactions. It would be interesting to see if the effect was as pronounced
under different biofilm growth conditions, such as different flow rates (static), lower growth
rate, or with strains which naturally have a more monoclonal growth pattern.
Based on the action of other bacterial toxin systems such as colicins (Chao et al., 1981; Kerr
et al., 2002; Prado et al., 2008; Nahum et al., 2011) it had initially been thought that the action
of EC93 CDI system could result in the generation of spatial structure in populations. Under
the conditions tested it was however found that even though the toxin has an absolute contact
requirement (see Chapter 4) a mixed population of cells resulted, with the action of the toxin
resulting in CDI+ cells dominating the environment with growth halted K12 F+ target cells
carried along in the bulk. This is likely in part to be due to the particular growth conditions
used as variation in growth rates, cell shape (Rudge et al., 2013) and motility (Houry et al., 2012)
can all impact on degrees of cell mixing even in the absence of toxin activity.
Recently published work by the Foster lab (Kim et al., 2014) highlights the role that factors
other than toxin action can play in competition between strains in a biofilm, in that case
positioning due to matrix production. It is interesting to compare this finding with the ability
of the EC93 CDI system to not only be effective in biofilm competition by explicitly blocking
growth of competitors but also by enabling more rapid self biofilm assembly. This ability to
form a thicker biofilm than K12 cells at nine hours but not at 14 hours gives EC93 cells a second
competitive advantage by enabling more rapid colonisation of new environmental niches in
which biofilm formation is of benefit to the cells. It is possible that there may have been an
evolutionary drive to link biofilm forming ability with toxin activity to block the growth of
any ’non self’ cells which were capable of interaction with a proto adhesion molecule. In this
model the CDI system acts to both to build and recruit self cells to multicellular structures while
109
simultaneously stopping other closely related strains from growing in the same environmental
niche. Tethering the toxin to the same point as that required for interaction can then be seen
as a very efficient way to out compete non self cells.
The work shown in this chapter taken in conjunction with the planktonic results reported
by Zachary Ruhe, show that the CdiA protein in the EC93 CDI system plays two roles, the ex-
pected delivery of a toxin moiety to target cells to block their growth and a previously unknown
role in aiding biofilm formation. This is probably related to the data reported in (Ruhe et al.,
2013b) showing a requirement for specific extracellular loop sequences for CdiA and BamA to
interact a model of CdiA with not only a C terminal toxin region but also two, presumably in-
dependent regions, responsible for binding interactions. The precise molecular motifs within
the protein responsible for the non toxin interactions remain to be identified.
While this work was being performed the Cotter group ((Garcia et al., 2013; Anderson
et al., 2014)) identified a similar link between CDI systems and biofilm production for the
Burkholderia CDI systems which are closely related to the rest of the CDI family but show a
different operon organisation. For the Burkholderia CDI systems expression of CDI molecules
in only a small subset of cells and the presence of extracellular DNA is required for increased
biofilm formation indicating that there may be a significant difference in the mechanism of
operation between the two types of CDI systems.
110
Chapter 6
Effect of EC869o11 toxin on target cells
at the single cell level
6.1 Introduction
E. coli CDI toxins have been classified into at least 18 sequence types (Ruhe et al., 2013a; Beck
et al., 2014b) only a few of which have been assigned a specific function (Aoki et al., 2010). In
order to better understand if this variety of toxin classes is capable of changing the nature of
CDI effects on target cells it is important to contrast the effects of different toxin types. Insight
into this area may increase our understanding of the variety of possible roles that the CDI
systems could play in bacterial ecology. As the previously examined EC93 toxin was shown
to have a reversible action which only occurred after a delay post contact a toxin which was
likely to show more dramatic effects was looked for in order to provide an informative contrast
in effects. One class of those which has been given a defined function is the EC869o11 toxin
which by sequence similarity and then experimental analysis was identified as a nuclease
toxin capable of degrading double stranded DNA (Morse et al., 2012). It was hypothesised that
this can be seen as a more aggressive mode of toxin action, that is degradation of genomic
DNA, which would more quickly lead to growth inhibition which was irreversible. As this is
a markedly different toxin activity compared to the effect of the EC93 toxin on metabolism it
presents an interesting candidate for comparative examination of CDI toxins effects on the
single cell level.
6.2 Analysis of the time course of inhibition
Toxin analysis was undertaken with the protocol developed in Chapter 3 and used successfully
for analysis of the EC93 CDI toxin at the single cell level in Chapter 4. The EC869 strain from
which the o11 toxin is derived is a sub strain of the O157:H7 EHEC E. coli strain which was
identified as containing a CDI sequence (Eppinger et al., 2011) and in further studies (Nou
111
et al., 2013) was shown to contain 11 orphan toxin sequences in addition to the main cdiA
gene. This parent strain was shown to be capable of inhibiting the growth of another O157:H7
strain (Nou et al., 2013) presumably due to the action of the main CdiA toxin molecule. This
study also identified that a K12 strain expressing a chimeric EC869o11 CdiA protein from a
cosmid was capable of inhibiting the growth of K12 strains but interestingly not the O157:H7
strain inhibited by the parent strain.
As EC869o11 is an orphan toxin in the strain background it was originally identified in and
is hence not expressed / functional in that strain. Therefore in order to analyse the effect of
the EC869o11 toxin a chimeric protein has been used in previously published work, (Morse
et al., 2012; Nou et al., 2013). This protein is generated by fusing the conserved region of the
EC93 cdiA gene with the sequence for the C terminal toxin portion of EC869o11, see Figure 27.
This sequence allows a cell to generate a functional chimeric CdiA molecule which has the
levels of expression and ability to display toxin on the cell surface of the EC93 CdiA molecule
but which delivers the toxin activity of EC869o11 instead of its usual payload. This construct
was used for the work described in this chapter, and was provided by Zachary Ruhe.
6.2.1 Effect of EC869o11 toxin on cell growth rate and morphology
Based on the previous work on general CDI toxins and analysis specifically of EC869o11 in
planktonic assays (Morse et al., 2012) it was hypothesised that intoxication of target cells would
lead to growth arrest in a manner broadly similar to the EC93 toxin. That is on contact with
inhibitor cells, after an initial delay, target cell growth rate would decrease and eventually halt.
However as can be seen in Figure 28 what was instead observed for target cells in contact with
inhibitor cells (coloured blue) was a steady increase in growth rate, measured as increase in
cell area per unit time, as intoxication continued see Figure 29.
Indeed if the data shown in Figure 29 is grouped in a similar manner as that used for the
analysis of the EC93 toxin system then unlike the case for the EC93 toxin, extended contact
with inhibitor cells leads to faster growth rates. Note that as cell division was not observed
for cells affected by the EC869o11 toxin, the average time of the initial period from the EC93
analysis was used as the point at which to split the growth curve. As this increase in growth rate
occurs when cells are longer, sufficiently long that their length extends outside the expected
range for normal cell growth, consideration must be made as to how comparable the increase
in gradient over time is between intoxicated cells and normal target cells. This is because as
the cell volume increases, assuming comparable levels of cytoplasmic components such as
ribosomes and mRNA, the biosynthetic capacity of the cell should also increase proportionally.
Therefore while an apparently greater growth rate may be assigned to these cells this could
be a normal growth rate for the given biovolume, that is simply being summed for a larger
area/length. This was corrected for by dividing growth rate by the length of the cell to get a
112
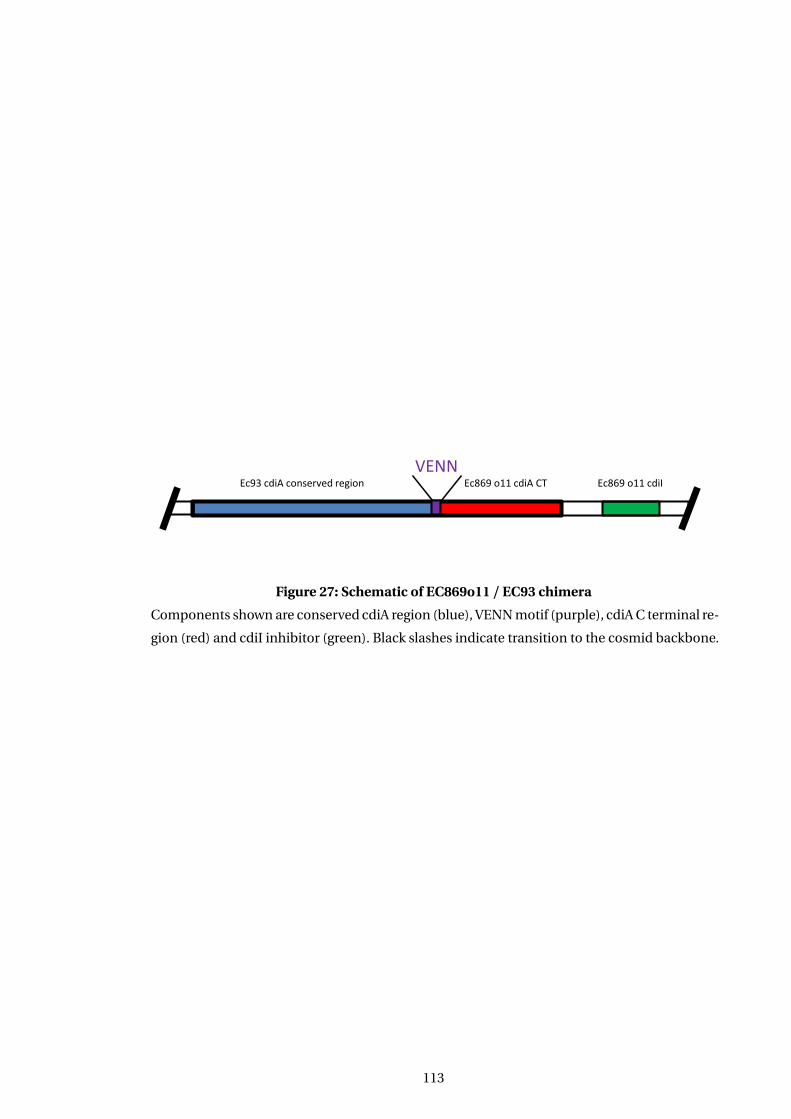
Ec93 cdiA conserved region Ec869 o11 cdiA CT Ec869 o11 cdiI
VENN
Figure 27: Schematic of EC869o11 / EC93 chimera
Components shown are conserved cdiA region (blue), VENN motif (purple), cdiA C terminal re-
gion (red) and cdiI inhibitor (green). Black slashes indicate transition to the cosmid backbone.
113
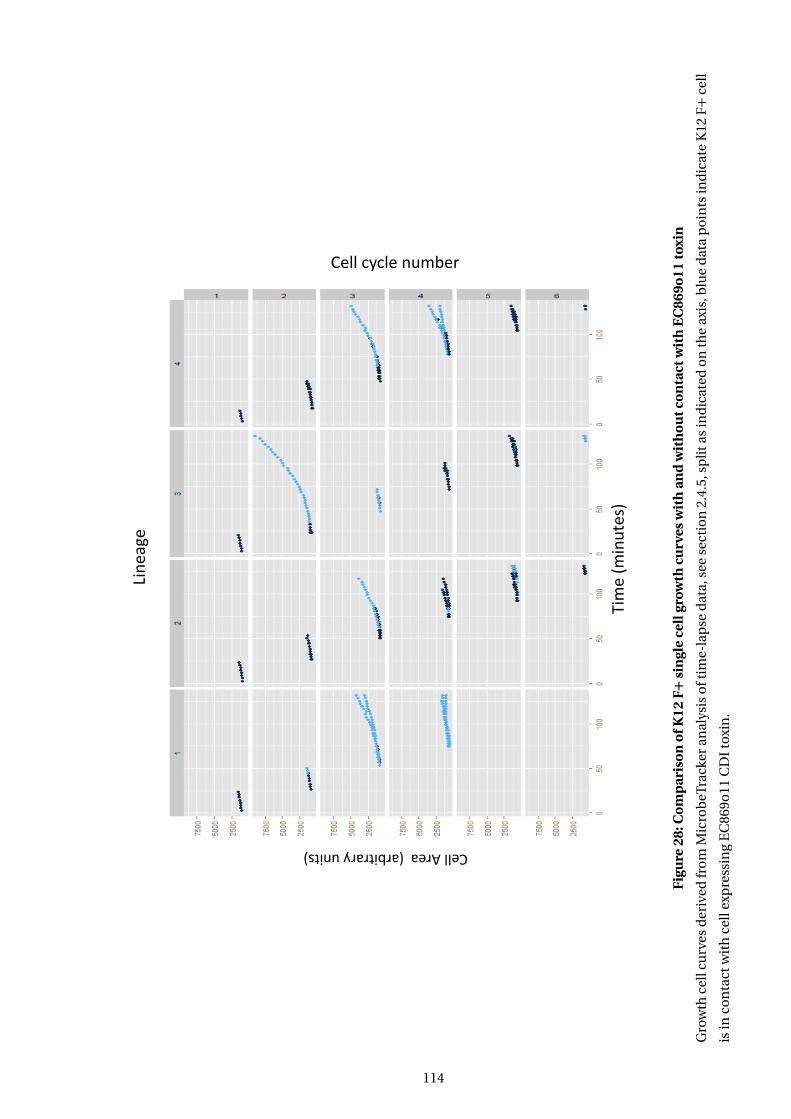
Cell Area (arbitrary units) Cell cycle number
Tim
e (m
inu
tes)
Lin
eage
Figu
re28
:Co
mp
aris
on
ofK
12F+
sin
gle
cell
grow
thcu
rves
wit
han
dw
ith
ou
tco
nta
ctw
ith
EC
869o
11to
xin
Gro
wth
cell
curv
esd
eriv
edfr
om
Mic
rob
eTra
cker
anal
ysis
oft
ime-
lap
sed
ata,
see
sect
ion
2.4.
5,sp
litas
ind
icat
edo
nth
eax
is,b
lue
dat
ap
oin
tsin
dic
ate
K12
F+
cell
isin
con
tact
wit
hce
llex
pre
ssin
gE
C86
9o11
CD
Ito
xin
.
114
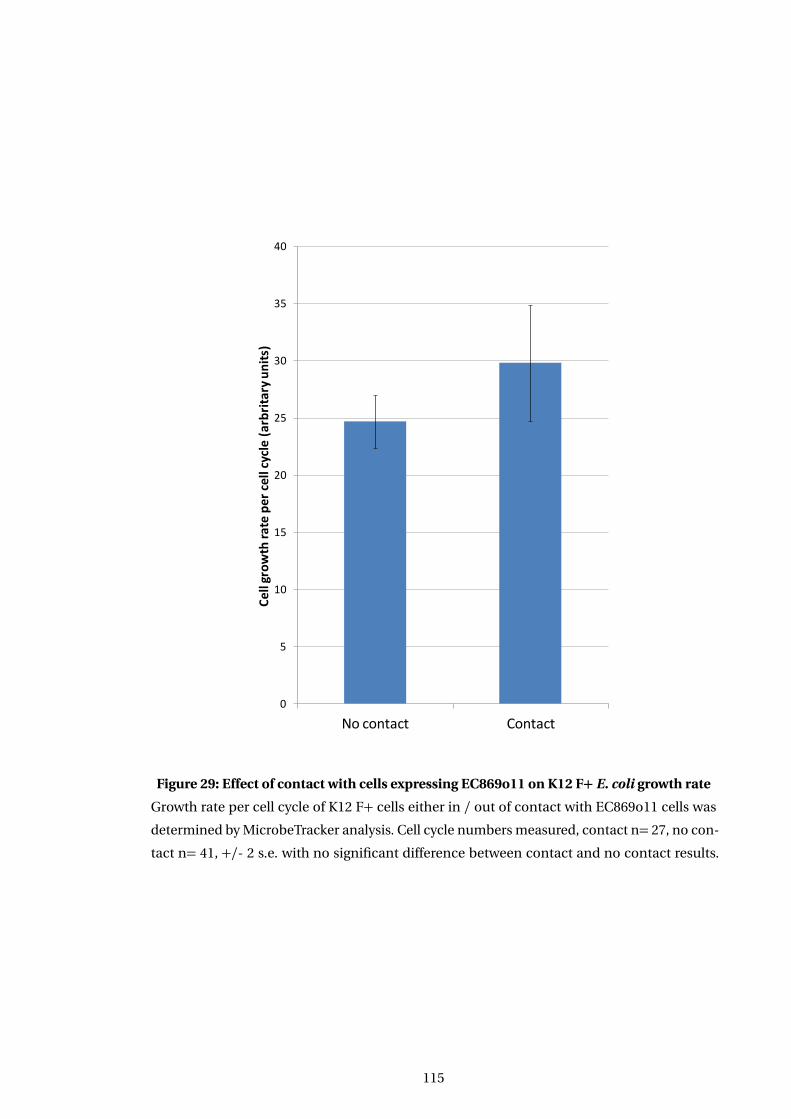
0
5
10
15
20
25
30
35
40
No contact Contact
Cel
l gro
wth
rat
e p
er c
ell c
ycle
(ar
bri
tary
un
its)
Figure 29: Effect of contact with cells expressing EC869o11 on K12 F+ E. coli growth rate
Growth rate per cell cycle of K12 F+ cells either in / out of contact with EC869o11 cells was
determined by MicrobeTracker analysis. Cell cycle numbers measured, contact n= 27, no con-
tact n= 41, +/- 2 s.e. with no significant difference between contact and no contact results.
115
standardised value, note this will be an approximation due to complicating factors such as
no end caps needing to be produced and possibly (see section 6.3.3 ) less DNA production.
This value was found to be comparable (data not shown) between uninhibited and intoxicated
target cells indicating that the per cell growth rate increase is due to the cells being longer and
hence possessing greater biosynthetic capabilities. An effect of cell length on growth rate can
be detected for normal cells as a slight bias in plot points around the approximation of linear
growth rate at normal cell sizes, but is not significant enough to affect the usefulness of the fit.
This was linked with a failure to septate at the expected cell size, as compared to target
cells not in contact with CDI+ cells. The effect on septation was so pronounced that for all
cells observed to become intoxicated, no further cell division was observed during the time
course of the experiment leading to exceptionally long cells, >40µm in length compared to
5µm for normal cells, see Figure 30 Panels B,D. This morphology is different to the occasional
lengthened cell that can be observed in standard cell cultures e.g. MG1655 strain, as in this
case after a period of growth to a longer length prior to division the cell then rapidly septates
off multiple cells that go on to grow normally. The latter behaviour presumably relates to the
mechanisms behind UPEC E. coli filamentous stage of growth in cell invasion (Justice et al.,
2006).
The effect of the EC869o11 toxin can be seen to be rapid as there is no division of cells post
contact despite the time point in the cell cycle when contact is made with inhibitor cells being
random. If there was any significant delay in toxin effect it would be predicted that those cells
which where about to divide prior to contact with inhibitors would have sufficient time to
complete that division cycle before the toxin could act. The absence of any such cell divisions
therefore shows that the time for the initial effects of the toxin to act to block cell division must
be less than the three minute gap between observations.
Target K12 cells are constitutively expressing GFP during the course of the experiment in
order to allow strain types to be distinguished. As cells are growing during the experiment
there will be a diluting effect on fluorescent protein levels unless cellular protein production
keeps pace (Adiciptaningrum et al., 2009; Helaine et al., 2010). In addition the excitation light
required for fluorescent imaging of cells, even when used infrequently as it was in this protocol,
results in some level of bleaching of fluorescent proteins and hence loss of signal. Hence the
ability of a cell to maintain it’s level of functional GFP protein while growing can be taken as a
measure of its ability to still synthesise significant levels of functional proteins.
As shown in Figure 30 Panels A,B, and Figure 33 Panel A levels of GFP in intoxicated cells
are maintained at comparable levels to target cells not in contact with inhibitor cells. This
shows that sufficient protein synthetic capacity must be present in the cell to allow synthesis
of enough new GFP molecules to counteract the loss of fluorescence signal from the reasons
detailed above. Indeed in some intoxicated cells, see Figure 30 Panel B, it can be seen that even
116
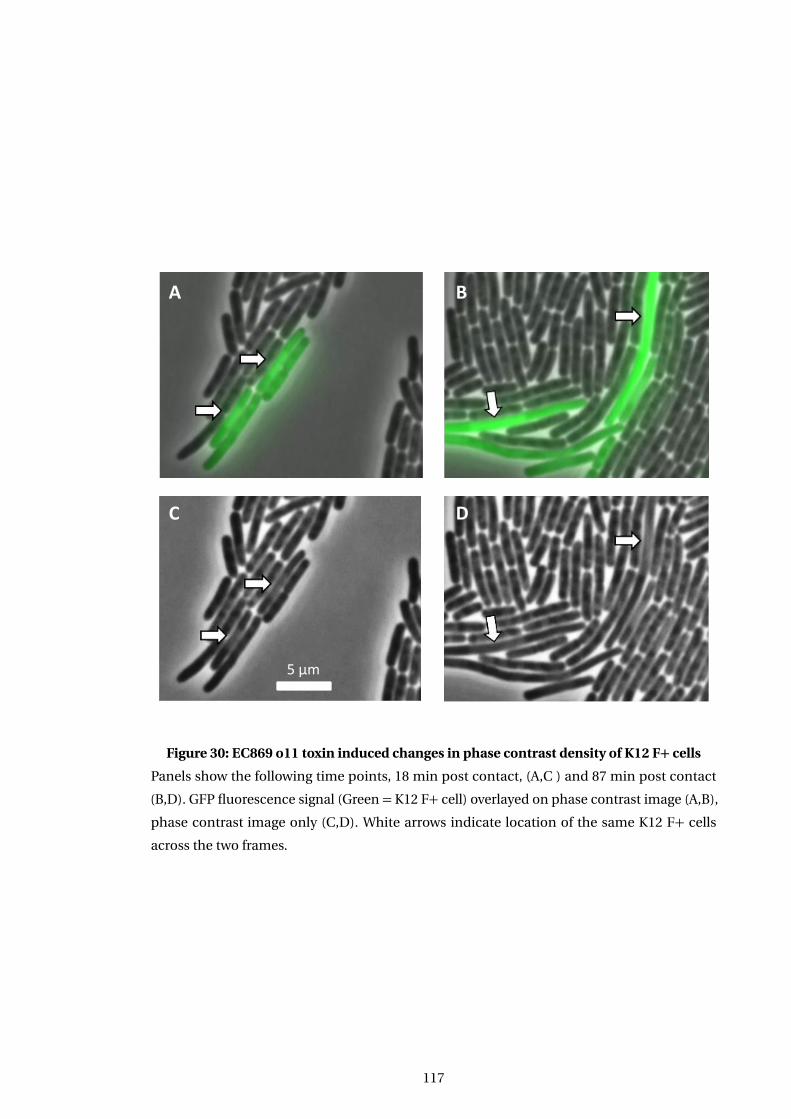
A
C
B
D
5 µm
Figure 30: EC869 o11 toxin induced changes in phase contrast density of K12 F+ cells
Panels show the following time points, 18 min post contact, (A,C ) and 87 min post contact
(B,D). GFP fluorescence signal (Green = K12 F+ cell) overlayed on phase contrast image (A,B),
phase contrast image only (C,D). White arrows indicate location of the same K12 F+ cells
across the two frames.
117
higher levels of GFP production have occurred as the fluorescent signal from those cells has
increased compared to uninhibited cells. As discussed above this is not due to a slower growth
rate on intoxication as within the time course of the experiment growth rates are comparable.
These higher rates of protein expression may be due to the failure of the normal regulation
mechanisms present in E. coli cells due to DNA damage caused by the EC869o11 toxin.
6.2.2 Toxin action appears to be irreversible
For all of the cells that were observed in the two biological replicates on no occasion was a
return to normal growth rates or septation of elongated cells of any kind either erroneously or
to normal cell sizes seen. It should be noted that due to the rapid nature of inhibition and the
growth of long cells with no division there were fewer occasions when cells broke contact than
in the EC93 experiments. This is because as cells fail to divide some area of the cell membrane
will remain in contact with inhibitor cells. In addition in the monolayer situation enforced in
this experimental set up the very long cells act as a barrier preventing contact of inhibitor cells
with the remaining cells of the microcolony behind it.
6.3 Effect of EC869o11 nuclease expression on nucleoid
During growth analysis of the EC869o11 toxin system it became apparent that the light / dark
patterning of cells present in phase contrast images of E. coli monolayers, first noted in the
EC93 experiments in Chapter 4, was different in intoxicated target cells. This was investigated
further as the patterning correlated with cell growth in a manner suggesting it was related
to genome replication, which was supported by it being perturbed by the action of a known
nuclease toxin.
Patterning in microcolony phase images correlates with predicted nucleoid posi-
tions
During cell growth E. coli must replicate and segregate the nucleoid material of the mother and
daughter cells. While prokaryotes do not have a nuclear envelope segregating their DNA from
the cytoplasm the DNA is sufficently closely associated with itself for their to be a significant
difference in density between the nucleoid and cytoplasm even in the absence of a defined
physical barrier. This density difference has been exploited in the historic (Mason et al., 1956)
and modern (Wang et al., 2005) literature to visualise nucleoid positions by embedding cells
in a high percentage gelatin matrix. Using a media that more closely matches the cytoplasmic
density allows more subtle changes in refractive index to be visualised. In the case of positive
phase contrast microscopy this gives a cell image in which the higher density cytoplasm (Eltsov
et al., 2006) is dark with the nucleoid visible as a lower density lighter, white region.
118
Whilst other techniques reliant on manipulating the density of the environment of single
cells have been reported (Kellenberger et al., 1994; Valkenburg et al., 1984) an extensive litera-
ture search failed to find any mention of the phenomena described above in cell monolayers
grown on standard media allowing full microcolony growth. As can be seen in Figure 31 in-
dividual cells are initially completely black as they grow (Panels A,B). As small microcolonies
form the fact that cells are growing closely together starts to change the density gradient sur-
rounding cells, and patterning starts to emerge (Panel C). As larger microcolonies form it can
be seen that the majority of cells show patterning and that as they grow this patterning corre-
lates with the position that is predicted for nucleoid positions at a given stage of bacterial cell
division (Panels D,E and F). That is immediately after cell division there is a centrally located
nucleiod that then grows as replication occurs, with the two genomes segregated to the proto
mother and daughter regions of the cytoplasm prior to septation generating two separate cells.
6.3.1 Abnormal nucleoid morphology apparent in intoxicated cells in phase im-
ages
The regular patterning noted in the previous section was clearly altered when target cells
came into contact with cells expressing the EC869o11 CdiA molecule. After initial contact had
occurred between inhibitor and target cells the nucleoid remained in a central position as
the cell grew showing no signs of separation of the two genomes, see Figure 32 Panel B. No
K12 F+cells which came into contact with EC869o11 toxin were observed to divide or have a
normal nuclear morphology with nucleoids adopting an unusual ’squared off’ morphology
and maintaining their central position within the cell, whilst increasing in size. In contrast a
K12 F+ cell growing normally prior to division, see Figure 32A, can be seen to have two well
separated nucleoids with a clear region of cytoplasm in between. Target cells affected by the
EC93 toxin, either before or after growth arrest, did not show a significant difference in nucleoid
morphology from that of unaffected target cells. Analysis in ImageJ of transects across targets
cells growing normally and cells growing while intoxicated, see Figure 32 show that the phase
image can be analysed to highlight nucleoid location.
6.3.2 Determination of suitable observation parameters for nucleoid visualisa-
tion by DAPI in live cells
While the phase images were strongly indicative of an effect on nucleoid morphology use of a
DNA specific stain would provide conclusive proof that this was occurring. DAPI is a widely
used nuclear stain for both prokaryotes and eukaryotes which shows a 20 fold increase in
fluoresence on binding to double stranded DNA. It has been previously reported (Fishov et al.,
1999; Bakshi et al., 2014) that in E. coli that viable cells will take up sufficient dye for imaging
without any permeabilisation of cell membranes being required. As the dye had not been used
119
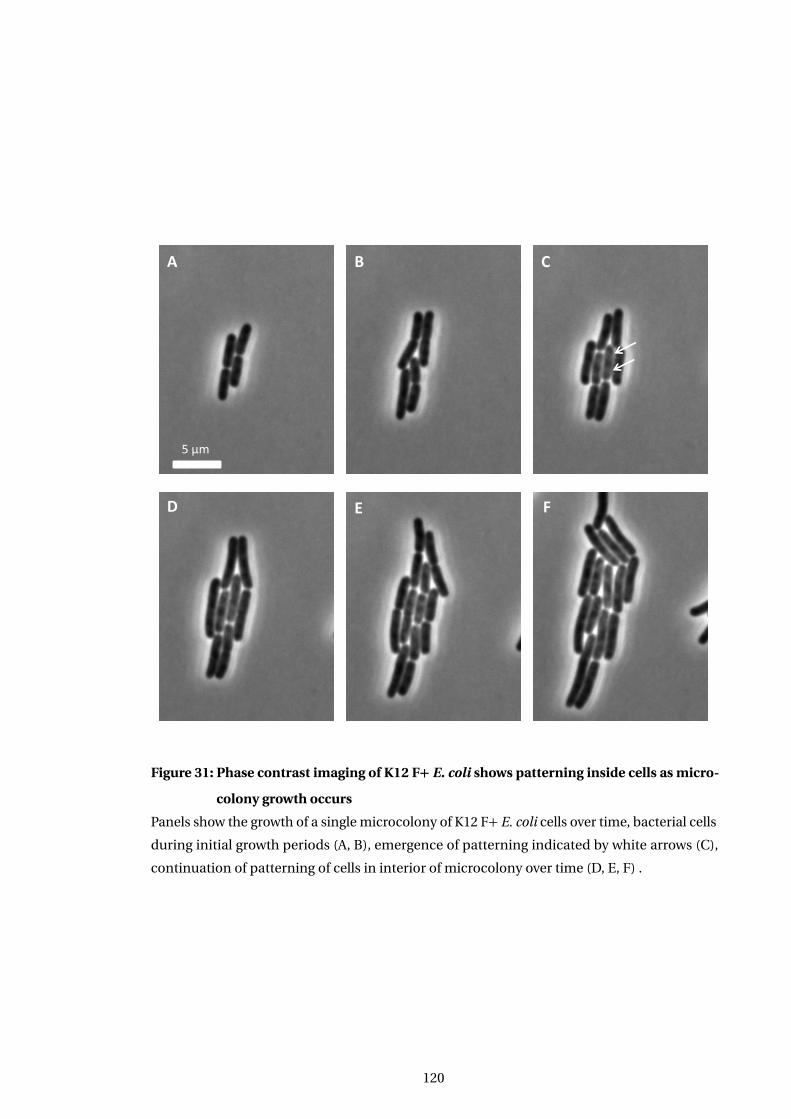
A B C
D E F
5 µm
Figure 31: Phase contrast imaging of K12 F+ E. coli shows patterning inside cells as micro-
colony growth occurs
Panels show the growth of a single microcolony of K12 F+ E. coli cells over time, bacterial cells
during initial growth periods (A, B), emergence of patterning indicated by white arrows (C),
continuation of patterning of cells in interior of microcolony over time (D, E, F) .
120
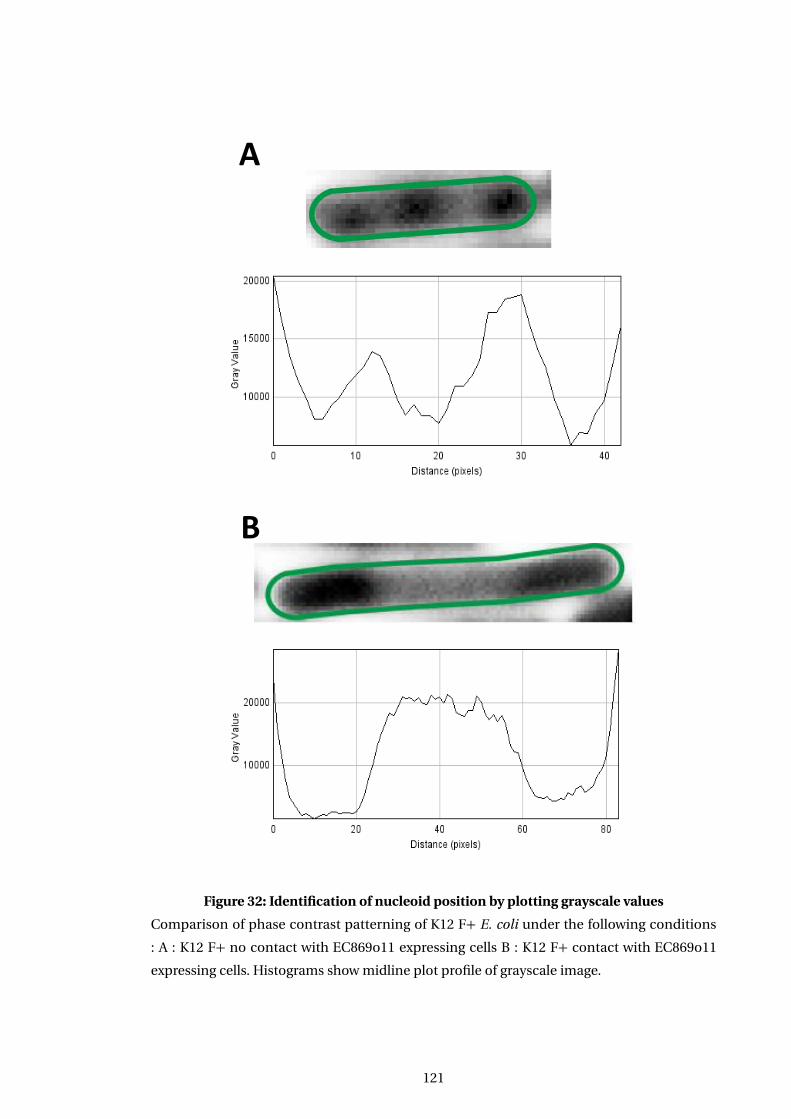
A
B
Figure 32: Identification of nucleoid position by plotting grayscale values
Comparison of phase contrast patterning of K12 F+ E. coli under the following conditions
: A : K12 F+ no contact with EC869o11 expressing cells B : K12 F+ contact with EC869o11
expressing cells. Histograms show midline plot profile of grayscale image.
121
previously in this lab / protocol its cytotoxicity and photoxicity needed to be assessed.
Sufficiently high levels of DAPI have cytotoxic effects which can lead to a reduction or
complete arrest of cell growth. At what concentration this cytotoxic effect occurs was assessed
by growing bacteria on pads across a 20 fold range of concentrations, 0.1-2µg/µl, on agarose
pads. Suitable concentrations were deemed to be those which cells grew at comparable rates
to cells on media only pads. This work identified that the range 0.1-0.25µg/µl, was suitable
with regards to its cytotoxic effects.
Phototoxic effects can occur during live cell fluoresence microscopy due to the excitation
light required for visualisation of fluorophores. In the case of the DAPI fluorophore, excitation
requires light in the region of 358nm which is sufficently high energy that it can readily reduce
cell viability. A balance of sufficent illumination power to obtain sufficent image signal over
background noise versus minimising potentially damaging light flux through the sample.
Technical advice from the Dept of Biology Technology Facility from experience working
with eukaryotic organisms was that lower levels of illumination over longer periods of time are
much better tolerated than the equivalent total light flux over shorter time periods. However
with live cell imaging there can be a limit to the possible exposure time due to movement of
cells during acquistion, leading to smearing in the resultant image, which results in a signifi-
cant loss of resolution. In the case of E. coli growing under these conditions this time equates to
125mseconds based on previous fluorescent protein analysis before cell movement becomes
too excessive.
This exposure time was then used as a basis for assessing the effects of different exctia-
tion light levels on cells growing on pads which contained 0.1-0.25µg/µl DAPI concentrations
which had been shown not to be cytotoxic. A suitable illumination protocol was defined as one
which captured the natural state of the nucleiod and for which normal cell growth had occured
up to that point. It was found that higher levels of DAPI lead to increased background signal
without a significant increase in nucleoid specific signal so the lowest level of DAPI, 0.1µg/µl
was used so as to minimise any possibly more subtle effects on cell physiology. During this
process it was noted that even when using the lowest light levels spread over the longest prac-
tical time period there was a significant difference in DAPI signal from the nucleoid between
the first ’naive’ image and a second image taken immediately afterwards. Exposure to imaging
light induces an apparent ’contraction’ of the nucleoid DAPI signal with a highly patterned
appearance resulting on subsequent exposures. Recovery of the nucleoid to a normal state
was not observed in the time course followed, 15 minutes, and cell growth rate was drasti-
cally reduced / arrested even using minimal illumination levels. Higher illumination levels for
shorter time periods where also trialled with similar effects on nucleoid state and cell growth
being seen.
As using the gentlest possible imaging parameters for this experimental setup induced
122
significant changes in cell growth rate and nucleoid state it was decided to proceed with end
point imaging using DAPI rather than following growth over time as a timelapse.
6.3.3 EC869o11 induced changes in phase images correlate with DNA location
Using the protocol defined in the previous section the interaction of target and inhibitor cells
was followed in the presence of 0.1µg/µl DAPI. After incubation had continued for 3 hours,
sufficient time for separate microcolonies of inhibitor and target cells to grow together and
interact, DAPI imaging was performed as the end point of the experiment for the reasons
discussed in the previous section.
As was previously observed in timelapse experiments elongated target cells in contact with
inhibitor cells had formed with a central pale region visible in phase images, see Figure 33
Panel B. This shows that the presence of DAPI in the agarose pads has not affected the ability
of the EC869o11 toxin to inhibit target cells. Examining the Ph/DAPI image, Panel A, it can
be seen that no inhibitor cells had signs of unusual nucleoid morphology showing that this
concentration of DAPI has not affected their growth. All target cells that have been in contact
with inhibitor cells for a significant period of time show an enlarged nucleoid, as seen in DAPI
channel, which increases in size the longer the intoxicated cell has grown.
That the DAPI signal corresponds to a high degree with the pale areas of the phase im-
age, in particular for the higher contrast situation where target cells show abnormal nucleoid
morphology, is confirmation that the phase patterning is indeed due to the position of the
nucleiod and not other cellular factors / imaging artefacts.
6.4 Conclusion and Discussion
This work has shown that the EC869o11 system acts to disrupt the normal cellular division
process leading to cells that are extremely elongated and incapable of nucleoid division. This
disruption is presumably due to the inability of the normal cellular DNA repair processes to
cope with the extent of DNA damage caused by the presence of constitutive DNAase activity in
the cytoplasm. This would in turn lead to arrest of normal cellular processes related to growth
and division by standard cellular checkpoints. That no segregation of nucleoids is seen in the
extended cell indicates a failure of the normal seperation systems as might be expected with
multiple double stranded breaks. It does however appear that DNA synthesis continues as
the nucleoid region expands over time, although as the fluorescent signal is not linear this
could be wholly or partly attributable to increased diffusion of the nucleoid over time. This
can be also be seen with the lack of septation leading to anomalously long cells which would
be predicted to be due to the action of SlnA blocking the initiation of septation due to the
presence of the central nucleoid.
123
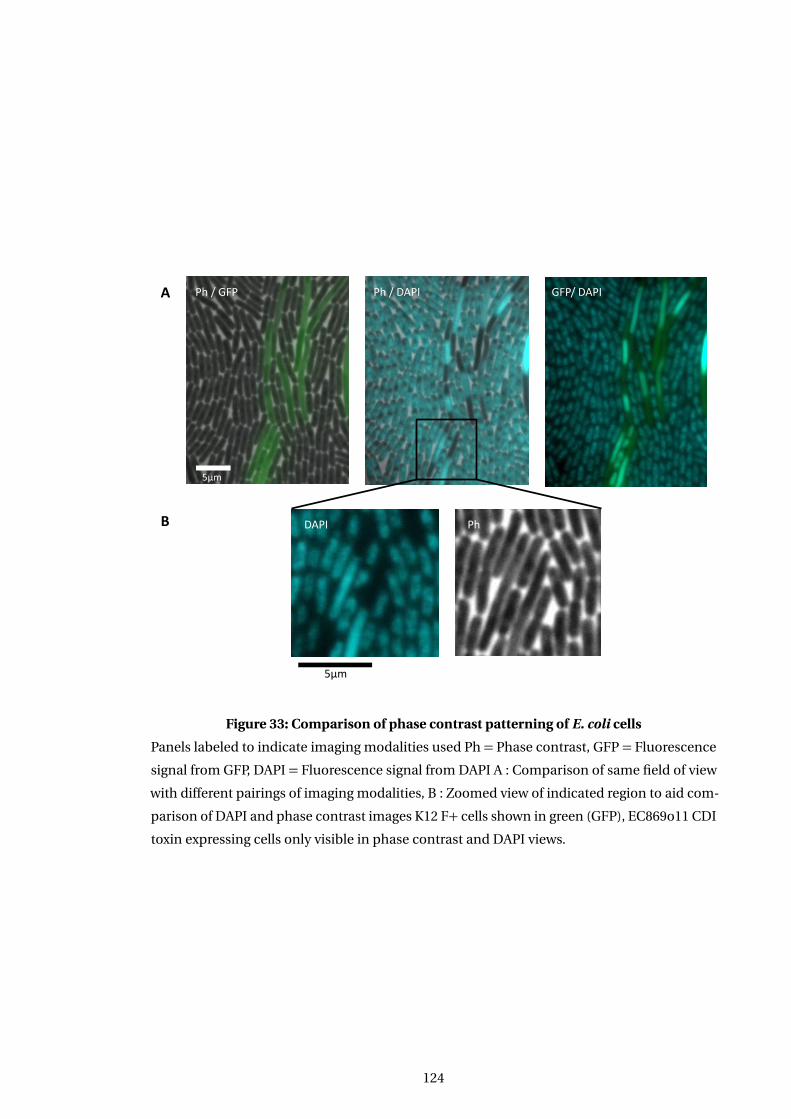
5µm
5µm
5µm
Ph / GFP Ph / DAPI GFP/ DAPI
DAPI Ph
A
B
Figure 33: Comparison of phase contrast patterning of E. coli cells
Panels labeled to indicate imaging modalities used Ph = Phase contrast, GFP = Fluorescence
signal from GFP, DAPI = Fluorescence signal from DAPI A : Comparison of same field of view
with different pairings of imaging modalities, B : Zoomed view of indicated region to aid com-
parison of DAPI and phase contrast images K12 F+ cells shown in green (GFP), EC869o11 CDI
toxin expressing cells only visible in phase contrast and DAPI views.
124
That cells are capable of growing, at least over the first several hours, in the presence of DNA
damage indicates that the normal cellular machinery for biosynthesis (peptidoglycan, lipids
etc.) and energy generation are broadly intact. This is confirmed by the ability of intoxicated
cells to maintain levels of GFP expression that are at least a match for those seen in unaffected
target cells.
Target cells exposed to EC869o11 toxin do not show a decrease in growth rate, at least
within the time course of this experiment, a finding which is in apparent contradiction to the
’inhibition of growth’ portion of the CDI systems definition. However while the intoxicated cells
are not seen to stop growth within the time course of the experiment they are clearly destined
to be non viable over longer time periods as the levels of DNA damage / abnormal nucleoid
morphology are inconsistent with a cell capable of reproducing itself. Final growth halt will
presumably occur when insufficient genetic material remains for essential cell components to
be renewed and/or malformed / truncated cellular products are produced which ’poison’ the
cell. It should be noted that abnormally long E. coli cells can be viable under certain situations,
(El-Hajj et al., 2015; Justice et al., 2004) , but in those cases at least part of the filamentous
bacteria contains correctly segregated intact nucleoids.
This situation contrasts to the population level observations on growth rate made from
planktonic studies were two factors are likely to result in a more pronounced effect. Firstly that
multiple rapid contacts with inhibitor cells will be possible in this situation and secondly that in
a freely mixed solution all target cells are available for contact with inhibitor cells. This should
result in high levels of toxin delivered to all cells in the culture and hence a more pronounced
effect. Images of target cells incubated for 6 hours planktonically shown in (Morse et al., 2012)
show elongated cells which are either anucleate or show only a small DAPI signal compared
to uninhibited cells. The measurement of growth in this case is the ability to form colonies
rather than the growth of cells at the time of incubation.
It should also be noted that loss of nucleoids from cells due to the action of CDI toxin has
been observed in contexts unrelated to the action of nucleases. It was shown for the EC93 CDI
system that induction of toxin activity intracellularly lead to generation of a population of cells
which were anucleate (Aoki et al., 2009). In this case the abnormal morphology is presumably
due to the loss of ∆pmf as a result of EC93 CDI activity, leading to errant septation which
generates the anucleate cells.
Being able to probe anomalous nucleoid structure at the single cell level provides a very
sensitive probe of EC869o11 CDI toxin effects. As the toxin has a rapid irreversible effect, see
previous sections, it can be thought of as acting as a more sensitive probe for any non contact
meditated effects of CDI. As an absolute contact dependence has now been demonstrated for
two CDI toxins with different toxin activities it is likely that this characteristic will be present
throughout the CDI family.
125
The ability to observe the EC869 toxin effects at the single level has enabled the time course
of inhibition to be followed for the first time and shown that it has a much more rapid effect
than that seen with the EC93 toxin and one which is not reversible. In this case the bulk scale
growth inhibition is not linked to a straight forward arrest of cell growth due to lack of energy as
seen for EC93 but to a diversion of cells into a non viable pathway where growth can continue
for significant periods of time but without the capability for cellular division.
The cosmid based system used for this work is a good mimic for the natural system in that
the cosmid is maintained as a single copy per cell with the chimeric CDI operon present in
only a single copy as would be found when present in the genome. In addition the expression
of the CDI proteins is driven from natural operators which taken together should lead to a
level of CDI expression which is relevant to growth in the natural environment.
126
Chapter 7
Discussion
7.1 Introduction
This discussion will give an overview of the findings presented in this thesis and how the
conclusions drawn from this work contribute to the model of our understanding of CDI. The
results of the biofilm work and then the single cell level data will be set in the context of previous
work. Implications for our understanding of the role of CDI in natural systems will then be
discussed. Finally, conclusions on the state of our model of CDI toxin action in light of these
results and suggestions for future work in this area will be made.
7.2 Effect of the EC93 CDI toxin system on growth within a biofilm
Initial expectations of the effect of the EC93 CDI system were that it might allow a strain ex-
pressing the system to out compete other strains due to the growth inhibition mediated by
toxin expression. During the course of experimental work to test this hypothesis it became
apparent that expression of the EC93 CDI system had a significant ability to increase the rate
of biofilm formation. These two different aspects are discussed below.
7.2.1 Effect of toxin on biofilm competition
The work shown in Chapter 5 demonstrates that the presence of the EC93 CDI toxin when cells
are grown co-seeded gives a significant competitive advantage to CDI inhibitor cells growing
in the context of a biofilm. Such a strong impact of CDI on competitive fitness shows that
sufficient contact must be occurring between K12 F+ cells and EC93 wild type cells so that an
effective dose of toxin is delivered.
However it is known from planktonic studies that contact alone is not sufficient, the EC93
wild type cells must also be in log phase for growth inhibition to occur, although the factors
driving this requirement are not understood. That inhibition occurs within biofilms, which
are generally seen to be a nutrient limited environment supporting slower growth, indicates
127
that log phase growth may not be a requirement in this situation. It is possible that the state of
growth of EC93 wild type cells in biofilms is such that, while the absolute growth rate is lower,
sufficient cells in the biofilm are in an exponential, log like, growth phase for EC93 CDI toxin
to be effective.
If a state analogous to planktonic log phase growth is not occurring in the biofilms then
other factors inherent to biofilm growth are presumably compensating to allow efficient inhi-
bition. One candidate difference would be the marked increase in exposure time to CDI toxin
expressing cells due to the sessile nature of biofilm communities. An alternative explanation
is that there could be a difference in the susceptibility to CDI toxin when K12 F+ cells are
growing in a biofilm, although the ability of log phase EC93 wild type cells to inhibit K12 cells
independent of their growth phase (Aoki et al., 2005) would argue that this was not a signifi-
cant factor. However multiple additional changes to the way that bacterial cells are growing
occur in biofilms, which mean that the situation is not exactly analogous to similar growth
rates in planktonic culture and so a difference in susceptibility cannot be completely ruled
out. This could be tested further by flow-cell experiments at lower temperatures / using less
amenable C-sources , e.g. glycerol, to see if EC93 CDI toxin remained effective, this would also
be informative as to which environmental niches CDI could be relevant in.
Due to the doubling increase in bacterial numbers as they grow by binary fission even a
small impact on growth rate / growth halt for a subset of the population early in the coloni-
sation process can be sufficient to lead to a significant growth advantage for the competing
strain. Combined with the known competition / stratification effects of biofilm formation due
to the generation of nutrient gradients which have been shown in model and experimental
systems to be able to lead to domination of environments once a certain level of overgrowth
has occurred (Lardon et al., 2011). It is also possible that initial shedding / tumbling behavior
(Anderson et al., 2007) as the mixed strain biofilm is forming could lead to increased oppor-
tunities for inter-strain contacts. This could be further investigated by phase contrast video
acquisition at earlier stages of biofilm formation, which was shown to be successful at observ-
ing shed cells free in solution / rolling cells interacting with the biofilm surface at the mature
stage of biofilm formation. Such a mechanism of interactions might also be expected to lead
to a gradient in competitive effectiveness across the length of the flow cell, as the nearer to
the outlet the higher the level of tumbling cells would be expected to be from the greater area
of cells available upstream, no such gradient was observed in this work. Which suggest that
the effect is not significant or that rolling interactions are occurring only over relatively short
distances.
On the basis that previous work has shown that target cell surface structures, pili (Aoki
et al., 2005) and capsule (Aoki et al., 2008), are protective against the action of CDI it would not
have been unexpected for the biofilm matrix to interfere with the action of CDI. That matrix ex-
128
pression has not inhibited CDI toxin action could be due to a number of factors, firstly that the
expression of capsule components, shown previously to reduce CDI’s effectiveness (Aoki et al.,
2008) is down regulated within biofilms (Beloin et al., 2008). Due to its lack of cell attachment
the biofilm matrix represents a more fluid barrier (Houry et al., 2012) between cells compared
to the more closely tethered capsule components. There is also recent evidence to support
phase separation of matrix and cells acting to drive cells to cluster preferentially (Ghosh et al.,
2015). Finally there will also be a difference in the dynamics of interactions between cells free
in solution that would not be able to generate significant forces against adjacent cells without
sliding past. In contrast when growing in the more constrained environment of a biofilm a
greater potential for forces between cells exists.
CDI molecules are large and potentially extend from the cell surface a sufficient distance
to aid overcoming barriers of steric hindrance. Whilst the only structure available for CDI pro-
teins (Morse et al., 2012; Beck et al., 2014a) are for the C-terminal toxin tip alone it is possible
to make size estimates on the basis of structural homology. The structure of the homologous
filamentous haemaglutin (FHA) protein has been determined with this 220kDa rod like pro-
tein having a length of 50nm. Given the known mass range 180-650kDa of CdiA molecules
a length estimate of 40-150nm can be made based on the naive assumptions of a linear size
length relationship and that the molecules behave as rigid rods projecting directly from the
cell surface . These sizes are significantly smaller than the 1000nm length scales of pili and
capsule, including Type I pili which does not affect EC93 CDI toxins effectiveness (Mulvey,
2002). Taken together these calculations / observations suggest both that CDI molecules are
not long enough to ’reach past’ / through blocking structures such as capsule and that steric
interference isn’t solely responsible for how these structures affect CDI effectiveness (Aoki
et al., 2005).
Secondly the timing of interactions may occur before levels of matrix expression in the
biofilm are significant enough to interfere with CDI have formed. The preliminary time-lapse
confocal microscopy data indicates that this may explain part of the effect, with initial of target
cell growth halted at the point of micro-colony interaction, with little evidence of cell growth
at later dates. If shorter range rolling interactions are occurring they could act to increase
the rate of potential interactions over those that would occur through microcolony growth
alone. Given the potential reversibility of the EC93 toxin action it would be expected that
continued inhibition and hence contact would be required to prevent regrowth. The lack of
such escape indicates that even at later stages of biofilm growth with significant matrix levels
contact between cells is still occurring.
129
7.2.2 EC93 CDI system aids the formation of biofilms
Constitutive expression of the EC93 CDI system led to an increase in the rate of biofilm for-
mation but not in overall levels of biofilm formation compared to K12 F+ cells, as illustrated
in Figure 34, even in the absence of the CDI toxin tip. This significant increase in the rate of
biofilm formation confers a large competitive advantage independent of toxin activity
The increased ability to form biofilms has been shown to be dependent solely on the
presence of the conserved region of the CdiA molecule by comparing the levels of biofilm
growth between wild type and CdiA-CT deletion mutants. This region could either act as an
auto-adhesin or bind to a different partner molecule on the partner cell. So expression of
CDI could lead either to recruitment specifically of cells expressing CDI or a more general
population of cells dependent on which option is correct. Work performed by Zachary Ruhe
(personnel communication) has shown that adhesion is not dependent on the BamA molecule
in planktonic systems but that does not rule out that an unidentified surface target for adhesion
exists or that situation could be different in biofilms. Additional information on the nature of
how the EC93 CDI system increases the rate of biofilm formation can be seen in differences
in cell packing. Close packing of cells was noted more commonly in parts of the biofilm with
cells expressing the conserved region of CdiA, compared to the less dense more uniform cell
packing seen with E. coli K12 F+ Figure 20. Though in a few rare cases towers composed almost
completely of inhibitor cells with a covering of target cells were seen this was the exception.
In contrast FACS analysis of CDI cells has shown an association between target and inhibitor
cells which would support an interaction between different molecules.
The finding that the EC93 toxin system was capable of acting to increase the rate of biofilm
formation occurred in my work at the same time as the first published reports of a similar
behavior in Burkholderia systems (Garcia et al., 2013). In contrast to my findings in E. coli it
is reported that Burkholderia biofilms show a structural change in their biofilms when CDI
systems are expressed, with an increase in clonal ’tower’ formation being seen as well as a
competitive advantage.
The differences that are seen between the two systems may relate to the level of CDI expres-
sion, with the Burkholderia systems being thought to be restricted to a subset of cells within a
biofilm while the EC93 strain has constitutive expression throughout all the cells of the biofilm.
Although given the systems are in different species the inherent differences in biofilm forma-
tion must be also be born in mind. In addition the data reported for the Burkholderia systems
to date is for colony ’biofilms’ or static biofilms in contrast to the flow cell work reported in this
thesis, meaning that the different nutrient / flow conditions could also account for differences.
Intercellular adhesion is a factor which could potentially alter the effectiveness of toxin
delivery, by increasing the time cells are in contact, and was considered as a possible explana-
tion for the discrepancy in effectiveness in planktonic culture between E. coli CDI and T6SS
130
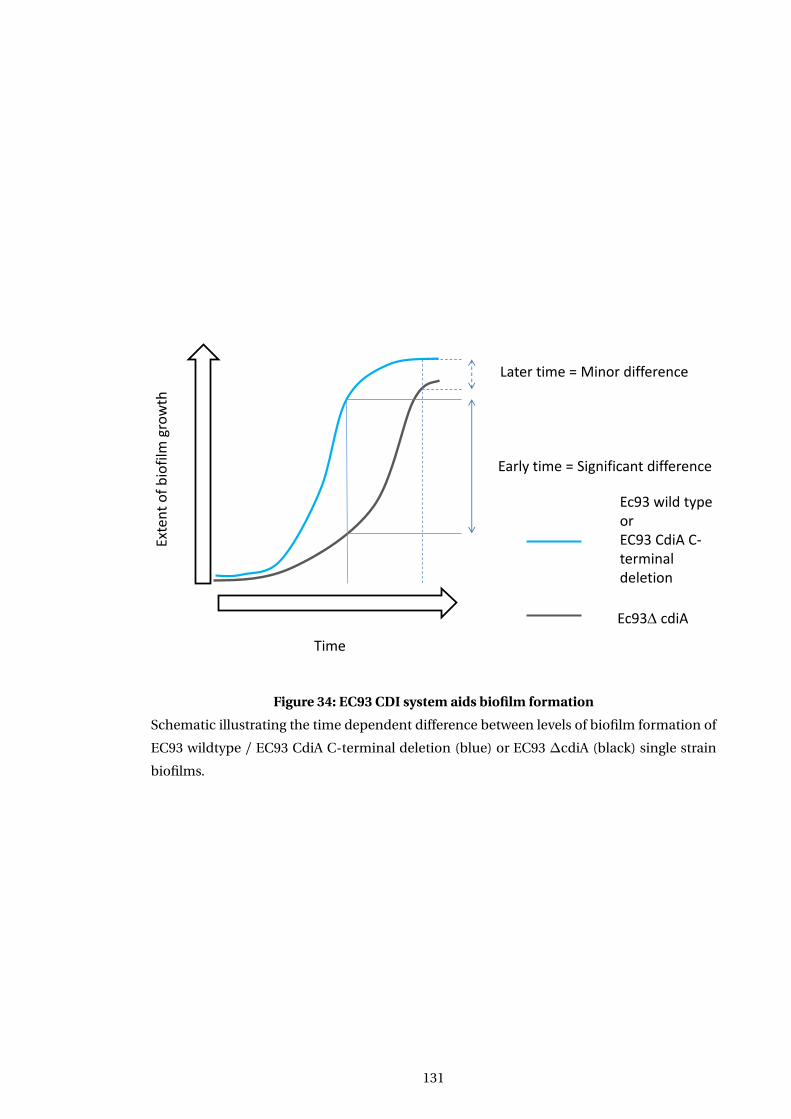
Time
Exte
nt
of
bio
film
gro
wth
Early time = Significant difference
Later time = Minor difference
Ec93 wild type or EC93 CdiA C- terminal deletion
Ec93 cdiA
Figure 34: EC93 CDI system aids biofilm formation
Schematic illustrating the time dependent difference between levels of biofilm formation of
EC93 wildtype / EC93 CdiA C-terminal deletion (blue) or EC93 ∆cdiA (black) single strain
biofilms.
131
which are effective and inactive respectively. In this case the model would be that intercellular
adhesion stabilised what would otherwise be transient interactions, in the freely mixed envi-
ronment of planktonic culture, leading to more effective toxin interactions. However the fact
that Burkholderia CDI systems show increased adhesion but are not effective in competition
in planktonic culture argues against this interpretation.
7.3 Different toxin modes of action lead to a range of inhibition phe-
notypes at the single cell level
One of the key questions raised by the wide range of toxin types is how does this impact on
their ability to affect target cells and if there are significant differences in action how would
they impact on ecologically relevant situations such as competition during colonisation of
new surfaces. In order to determine this detail studies at the single cell level are required as
only then can the levels of toxin delivery be determined and the outcome of target inhibitor
interactions be followed over time rather than being sampled as an end point result.
7.3.1 Time course of growth inhibition
There is a marked difference seen between the time course of effects on the EC93 and EC869o11
toxins over the period which can be studied by the techniques used in this study. The EC93
toxin has a significant delay in action before growth inhibition of the intoxicated cell occurs
while in comparison the EC869o11 toxin induces an abnormal nucleoid morphology more
rapidly but did not show growth arrest during the time course of the experiment. This is a novel
observation as all previous work has been conducted using assays reporting at the population
level and/or in experiments were the levels and timing of toxin delivery cannot be monitored.
7.3.2 Reversibility of toxin action
The action of toxins can be classified as irreversible, e.g. colicin, one hit one kill paradigm
(Johnson et al., 2013), or reversible as indicated by the work of (Aoki et al., 2009) on the EC93
CDI toxin using inducible degradation of CdiI to study cytoplasmic self intoxication.
The work in this thesis demonstrates for the first time that the action of the EC93 toxin
is reversible under natural conditions where toxin is delivered through the normal transport
pathways and recovery occurs without the presence of cognate CdiI molecules being present
in the affected cells cytoplasm. It also indicates that reversibility is not a characteristic of all
CDI toxins as no recovery from inhibition was seen for the EC869o11 toxin. This difference is
presumably due to the nature of the toxin action, DNA damage vs membrane potential. DNA
damage where both strands have been destroyed by the action of a nuclease will be impossible
to repair effectively as no template strand will exist, so even if the chromosome is ligated to
132
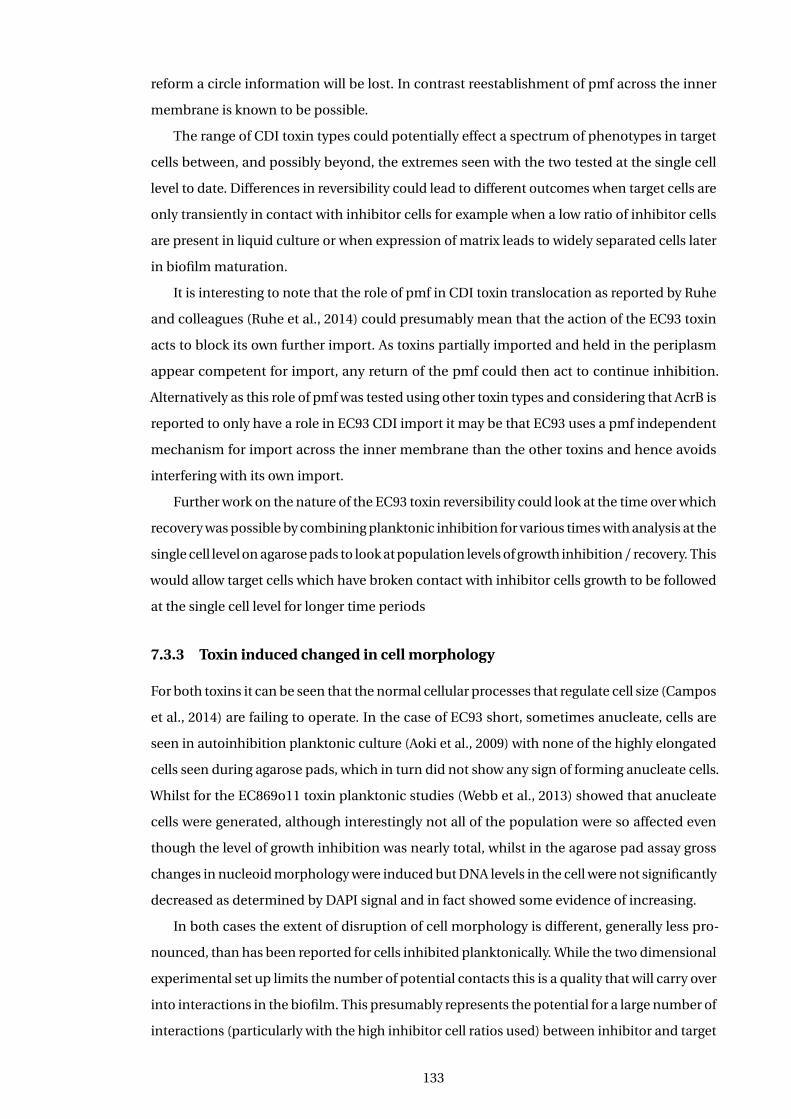
reform a circle information will be lost. In contrast reestablishment of pmf across the inner
membrane is known to be possible.
The range of CDI toxin types could potentially effect a spectrum of phenotypes in target
cells between, and possibly beyond, the extremes seen with the two tested at the single cell
level to date. Differences in reversibility could lead to different outcomes when target cells are
only transiently in contact with inhibitor cells for example when a low ratio of inhibitor cells
are present in liquid culture or when expression of matrix leads to widely separated cells later
in biofilm maturation.
It is interesting to note that the role of pmf in CDI toxin translocation as reported by Ruhe
and colleagues (Ruhe et al., 2014) could presumably mean that the action of the EC93 toxin
acts to block its own further import. As toxins partially imported and held in the periplasm
appear competent for import, any return of the pmf could then act to continue inhibition.
Alternatively as this role of pmf was tested using other toxin types and considering that AcrB is
reported to only have a role in EC93 CDI import it may be that EC93 uses a pmf independent
mechanism for import across the inner membrane than the other toxins and hence avoids
interfering with its own import.
Further work on the nature of the EC93 toxin reversibility could look at the time over which
recovery was possible by combining planktonic inhibition for various times with analysis at the
single cell level on agarose pads to look at population levels of growth inhibition / recovery. This
would allow target cells which have broken contact with inhibitor cells growth to be followed
at the single cell level for longer time periods
7.3.3 Toxin induced changed in cell morphology
For both toxins it can be seen that the normal cellular processes that regulate cell size (Campos
et al., 2014) are failing to operate. In the case of EC93 short, sometimes anucleate, cells are
seen in autoinhibition planktonic culture (Aoki et al., 2009) with none of the highly elongated
cells seen during agarose pads, which in turn did not show any sign of forming anucleate cells.
Whilst for the EC869o11 toxin planktonic studies (Webb et al., 2013) showed that anucleate
cells were generated, although interestingly not all of the population were so affected even
though the level of growth inhibition was nearly total, whilst in the agarose pad assay gross
changes in nucleoid morphology were induced but DNA levels in the cell were not significantly
decreased as determined by DAPI signal and in fact showed some evidence of increasing.
In both cases the extent of disruption of cell morphology is different, generally less pro-
nounced, than has been reported for cells inhibited planktonically. While the two dimensional
experimental set up limits the number of potential contacts this is a quality that will carry over
into interactions in the biofilm. This presumably represents the potential for a large number of
interactions (particularly with the high inhibitor cell ratios used) between inhibitor and target
133
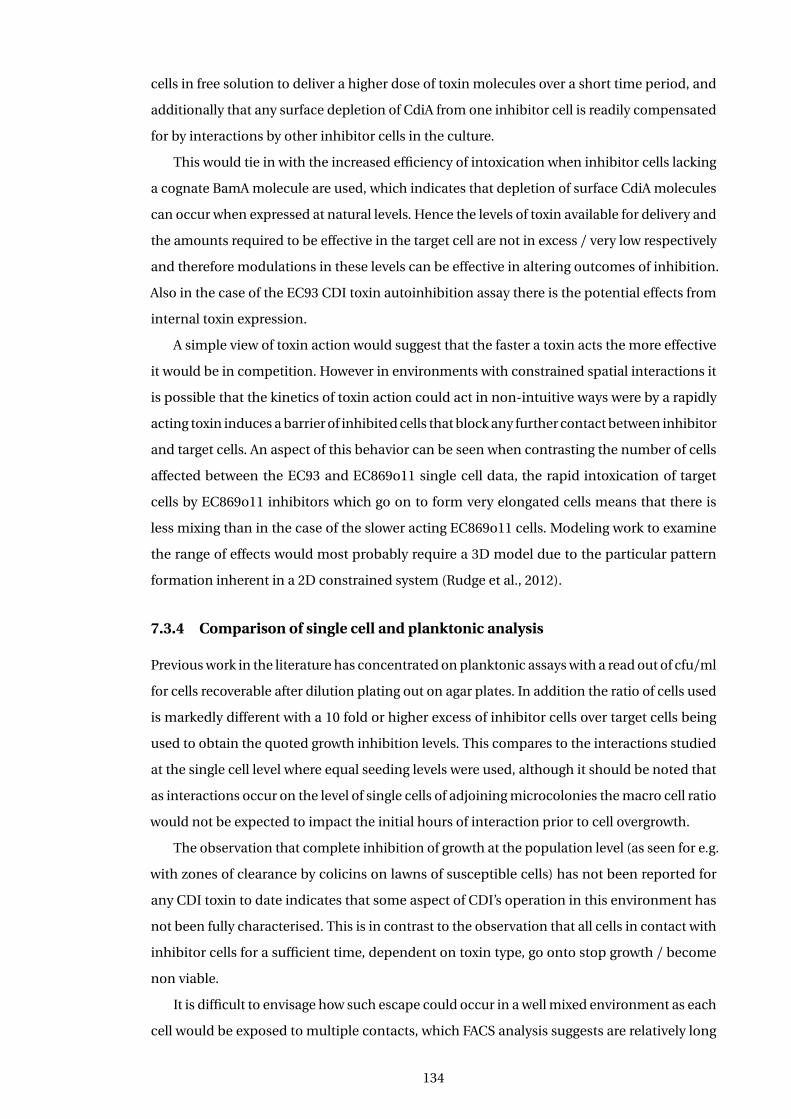
cells in free solution to deliver a higher dose of toxin molecules over a short time period, and
additionally that any surface depletion of CdiA from one inhibitor cell is readily compensated
for by interactions by other inhibitor cells in the culture.
This would tie in with the increased efficiency of intoxication when inhibitor cells lacking
a cognate BamA molecule are used, which indicates that depletion of surface CdiA molecules
can occur when expressed at natural levels. Hence the levels of toxin available for delivery and
the amounts required to be effective in the target cell are not in excess / very low respectively
and therefore modulations in these levels can be effective in altering outcomes of inhibition.
Also in the case of the EC93 CDI toxin autoinhibition assay there is the potential effects from
internal toxin expression.
A simple view of toxin action would suggest that the faster a toxin acts the more effective
it would be in competition. However in environments with constrained spatial interactions it
is possible that the kinetics of toxin action could act in non-intuitive ways were by a rapidly
acting toxin induces a barrier of inhibited cells that block any further contact between inhibitor
and target cells. An aspect of this behavior can be seen when contrasting the number of cells
affected between the EC93 and EC869o11 single cell data, the rapid intoxication of target
cells by EC869o11 inhibitors which go on to form very elongated cells means that there is
less mixing than in the case of the slower acting EC869o11 cells. Modeling work to examine
the range of effects would most probably require a 3D model due to the particular pattern
formation inherent in a 2D constrained system (Rudge et al., 2012).
7.3.4 Comparison of single cell and planktonic analysis
Previous work in the literature has concentrated on planktonic assays with a read out of cfu/ml
for cells recoverable after dilution plating out on agar plates. In addition the ratio of cells used
is markedly different with a 10 fold or higher excess of inhibitor cells over target cells being
used to obtain the quoted growth inhibition levels. This compares to the interactions studied
at the single cell level where equal seeding levels were used, although it should be noted that
as interactions occur on the level of single cells of adjoining microcolonies the macro cell ratio
would not be expected to impact the initial hours of interaction prior to cell overgrowth.
The observation that complete inhibition of growth at the population level (as seen for e.g.
with zones of clearance by colicins on lawns of susceptible cells) has not been reported for
any CDI toxin to date indicates that some aspect of CDI’s operation in this environment has
not been fully characterised. This is in contrast to the observation that all cells in contact with
inhibitor cells for a sufficient time, dependent on toxin type, go onto stop growth / become
non viable.
It is difficult to envisage how such escape could occur in a well mixed environment as each
cell would be exposed to multiple contacts, which FACS analysis suggests are relatively long
134
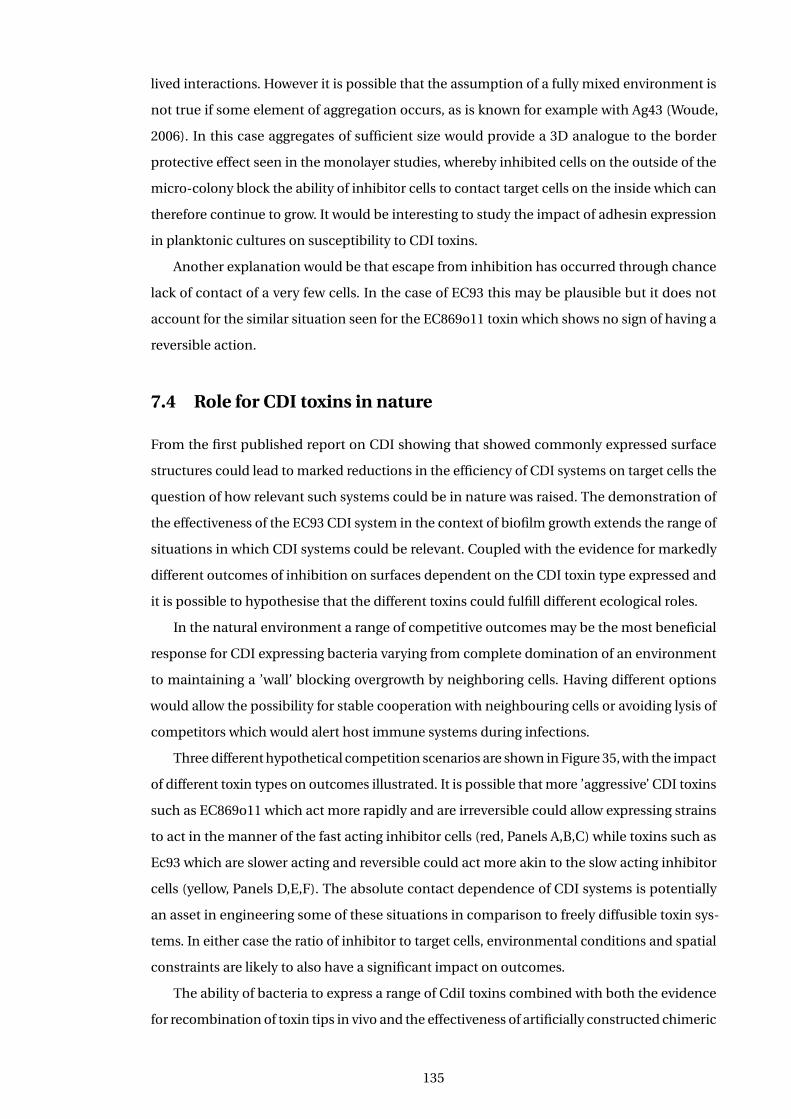
lived interactions. However it is possible that the assumption of a fully mixed environment is
not true if some element of aggregation occurs, as is known for example with Ag43 (Woude,
2006). In this case aggregates of sufficient size would provide a 3D analogue to the border
protective effect seen in the monolayer studies, whereby inhibited cells on the outside of the
micro-colony block the ability of inhibitor cells to contact target cells on the inside which can
therefore continue to grow. It would be interesting to study the impact of adhesin expression
in planktonic cultures on susceptibility to CDI toxins.
Another explanation would be that escape from inhibition has occurred through chance
lack of contact of a very few cells. In the case of EC93 this may be plausible but it does not
account for the similar situation seen for the EC869o11 toxin which shows no sign of having a
reversible action.
7.4 Role for CDI toxins in nature
From the first published report on CDI showing that showed commonly expressed surface
structures could lead to marked reductions in the efficiency of CDI systems on target cells the
question of how relevant such systems could be in nature was raised. The demonstration of
the effectiveness of the EC93 CDI system in the context of biofilm growth extends the range of
situations in which CDI systems could be relevant. Coupled with the evidence for markedly
different outcomes of inhibition on surfaces dependent on the CDI toxin type expressed and
it is possible to hypothesise that the different toxins could fulfill different ecological roles.
In the natural environment a range of competitive outcomes may be the most beneficial
response for CDI expressing bacteria varying from complete domination of an environment
to maintaining a ’wall’ blocking overgrowth by neighboring cells. Having different options
would allow the possibility for stable cooperation with neighbouring cells or avoiding lysis of
competitors which would alert host immune systems during infections.
Three different hypothetical competition scenarios are shown in Figure 35, with the impact
of different toxin types on outcomes illustrated. It is possible that more ’aggressive’ CDI toxins
such as EC869o11 which act more rapidly and are irreversible could allow expressing strains
to act in the manner of the fast acting inhibitor cells (red, Panels A,B,C) while toxins such as
Ec93 which are slower acting and reversible could act more akin to the slow acting inhibitor
cells (yellow, Panels D,E,F). The absolute contact dependence of CDI systems is potentially
an asset in engineering some of these situations in comparison to freely diffusible toxin sys-
tems. In either case the ratio of inhibitor to target cells, environmental conditions and spatial
constraints are likely to also have a significant impact on outcomes.
The ability of bacteria to express a range of CdiI toxins combined with both the evidence
for recombination of toxin tips in vivo and the effectiveness of artificially constructed chimeric
135
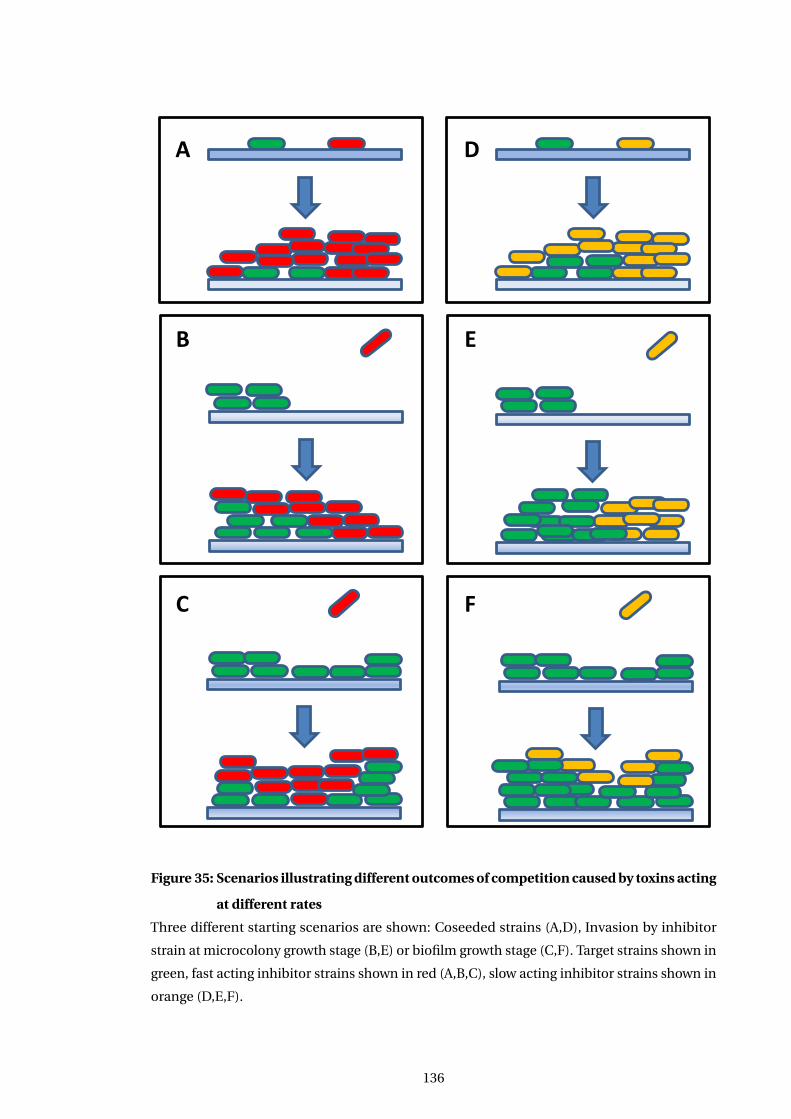
A
B
C
D
E
F
Figure 35: Scenarios illustrating different outcomes of competition caused by toxins acting
at different rates
Three different starting scenarios are shown: Coseeded strains (A,D), Invasion by inhibitor
strain at microcolony growth stage (B,E) or biofilm growth stage (C,F). Target strains shown in
green, fast acting inhibitor strains shown in red (A,B,C), slow acting inhibitor strains shown in
orange (D,E,F).
136
CdiA molecules indicates that the competitive situation in nature may be quite complex with
some strains being resistant to multiple toxins while also having the capability to generate
additional diversity.
The situation in nature is likely to be even more complex as not only can strains express the
CDI variants discussed above but the T6SS are another recent example of contact dependent
toxins capable of affecting inter-bacterial competition.
CDI systems can be thought of as acting to demonstrate both kin and kind discrimination
in a manner reminiscent of the so called ’green beard’ genes (Strassmann et al., 2011; Ruhe
et al., 2013b). The linking of toxin activity with aggregation provides a means for cells to screen
recruitment of cells to a biofilm in two ways firstly the interaction between cells expressing
CdiA which is a way to discriminate ’kind’, similar but not necessarily directly related, while the
toxin element allows discrimination again on the basis of ’kind’ but on a much more restricted
level with only those cells expressing the relevant cognate CdiI molecule. In both cases of
selection, as the CDI allele is sufficient to confer ’recognition’, kinship is not being recognised
but practically in the environment the bulk of cells interacting in this way are likely to be the
clonal kin mates of the interacting cell. As described previously this competitive environment
will necessarily be limited to cells expressing
7.4.1 Alternate roles other than competition
It is possible that for some CDI systems, as has been proposed in some cases for antibiotics
(Yim et al., 2007; Boehm et al., 2009), that rather than effecting domination of a niche they
act in a subtler way to modulate other cells behavior. In particular the requirement of the
UPEC536 toxin for the target cell to express the protein CysK (Diner et al., 2012) is hard to
reconcile with an effective toxin action as escape of a population of cells could presumably be
readily achieved by down regulating / losing the non essential protein.
As switching of toxin tips appears to occur in nature a situation reminiscent of that pro-
posed for toxin-antitoxin systems induction of persistence could occur within an initially
clonal population. In this scenario a cell undergoes a CDI toxin tip switching event that leaves
it able to inhibit its surrounding clonemates as it is expressing a toxin which they are not im-
mune too. In this way heterogeneity in cell state could be achieved in an initially uniform
population.
7.5 Future work
In order to further investigate the hypothesis that the mode of action of CDI toxins leads to
different outcomes in competition between bacteria the effect of EC869o11 toxin expression
on competition within a biofilm could be studied. As this would allow comparison of both
137
single cell and biofilm population level data for two toxin types, thus enabling any impact of
the different effects seen in mono-layers of cells on biofilm competition to be measured.
The effectiveness of the other classes of toxin for which functions are known could be
analysed at the single cell level for representative examples of the rRNAase (ECL (Beck et al.,
2014a)) and tRNAase (UPEC536 (Aoki et al., 2010)) classes of CDI toxin. Having a knowledge
of the dynamics of a wider range of toxin types would aid in understanding the breadth of
possible effects of CDI systems.
Use of computational modeling of bacterial interactions may aid better understanding
of the implications of the variability of CDI toxins effects as experimental approaches are
necessarily limited in the range of parameters that can be assessed in a practical manner.
It is interesting to note that the phenotype of EC869o11 inhibition visible in microscope
images with DAPI staining is comparable to the action of DNA replication inhibitors such as
Daunorubicin as seen in (Nonejuie et al., 2013). This suggests that it may be possible to apply
the principal component analysis (PCA) of image approach outlined in the Nonejuie paper to
broadly classify the effects of the many CDI toxin tips which do not show sequence homology
to known proteins. In this way it maybe be possible to assign mechanisms of toxin action
purely on single cell level image phenotypes.
7.6 Conclusion
This work has shown that the archetypal CDI toxin system of E. coli strain EC93 is effective
when bacteria are growing in a biofilm and that the conserved portion of the EC93 CdiA
molecule increases the rate of biofilm formation. The linkage of CDI toxin activity with an
increased ability to form biofilms ensures that only closely related bacteria are able to benefit
from growth within the biofilm. Single cell level analysis of the EC93 and EC869o11 CDI toxins
has shown that different toxin mechanisms induce different inhibition phenoypes in suscep-
tible cells. The time course of action and the degree to which the toxin action was reversible
were both shown to be affected by the class of toxin. The discovery of this difference suggests
that the class of CDI toxin could affect competition outcomes. Taken together these two main
findings support a model in which CDI toxin systems could play a variety of different roles in
interbacterial competition within biofilms.
138
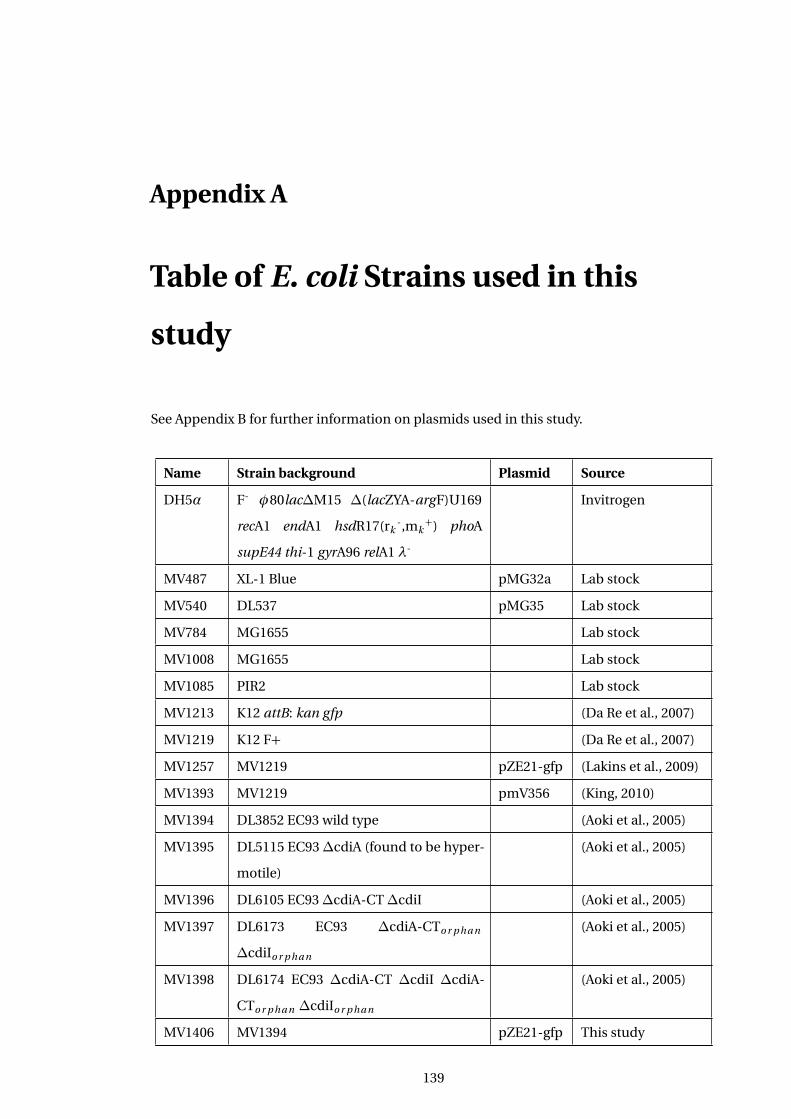
Appendix A
Table of E. coli Strains used in this
study
See Appendix B for further information on plasmids used in this study.
Name Strain background Plasmid Source
DH5α F- φ80lac∆M15 ∆(lacZYA-argF)U169
recA1 endA1 hsdR17(rk-,mk
+) phoA
supE44 thi-1 gyrA96 relA1 λ-
Invitrogen
MV487 XL-1 Blue pMG32a Lab stock
MV540 DL537 pMG35 Lab stock
MV784 MG1655 Lab stock
MV1008 MG1655 Lab stock
MV1085 PIR2 Lab stock
MV1213 K12 attB: kan gfp (Da Re et al., 2007)
MV1219 K12 F+ (Da Re et al., 2007)
MV1257 MV1219 pZE21-gfp (Lakins et al., 2009)
MV1393 MV1219 pmV356 (King, 2010)
MV1394 DL3852 EC93 wild type (Aoki et al., 2005)
MV1395 DL5115 EC93∆cdiA (found to be hyper-
motile)
(Aoki et al., 2005)
MV1396 DL6105 EC93∆cdiA-CT∆cdiI (Aoki et al., 2005)
MV1397 DL6173 EC93 ∆cdiA-CTo r p ha n
∆cdiIo r p ha n
(Aoki et al., 2005)
MV1398 DL6174 EC93 ∆cdiA-CT ∆cdiI ∆cdiA-
CTo r p ha n ∆cdiIo r p ha n
(Aoki et al., 2005)
MV1406 MV1394 pZE21-gfp This study
139
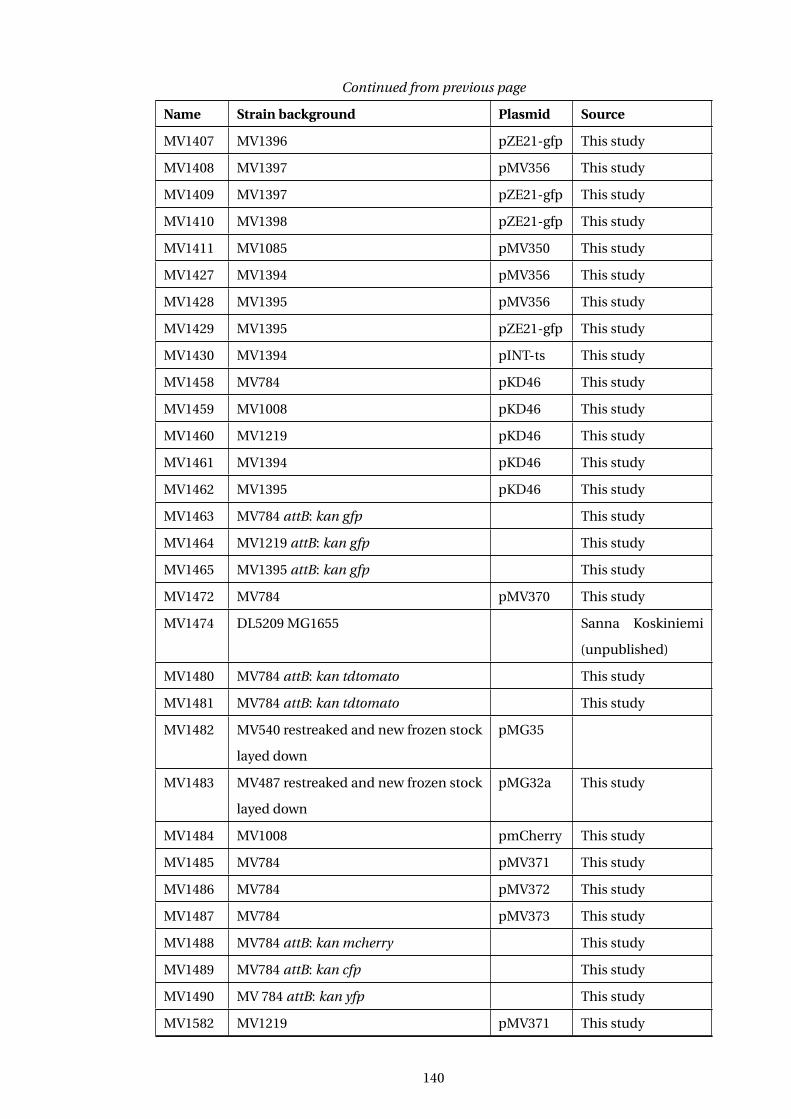
Continued from previous page
Name Strain background Plasmid Source
MV1407 MV1396 pZE21-gfp This study
MV1408 MV1397 pMV356 This study
MV1409 MV1397 pZE21-gfp This study
MV1410 MV1398 pZE21-gfp This study
MV1411 MV1085 pMV350 This study
MV1427 MV1394 pMV356 This study
MV1428 MV1395 pMV356 This study
MV1429 MV1395 pZE21-gfp This study
MV1430 MV1394 pINT-ts This study
MV1458 MV784 pKD46 This study
MV1459 MV1008 pKD46 This study
MV1460 MV1219 pKD46 This study
MV1461 MV1394 pKD46 This study
MV1462 MV1395 pKD46 This study
MV1463 MV784 attB: kan gfp This study
MV1464 MV1219 attB: kan gfp This study
MV1465 MV1395 attB: kan gfp This study
MV1472 MV784 pMV370 This study
MV1474 DL5209 MG1655 Sanna Koskiniemi
(unpublished)
MV1480 MV784 attB: kan tdtomato This study
MV1481 MV784 attB: kan tdtomato This study
MV1482 MV540 restreaked and new frozen stock
layed down
pMG35
MV1483 MV487 restreaked and new frozen stock
layed down
pMG32a This study
MV1484 MV1008 pmCherry This study
MV1485 MV784 pMV371 This study
MV1486 MV784 pMV372 This study
MV1487 MV784 pMV373 This study
MV1488 MV784 attB: kan mcherry This study
MV1489 MV784 attB: kan cfp This study
MV1490 MV 784 attB: kan yfp This study
MV1582 MV1219 pMV371 This study
140
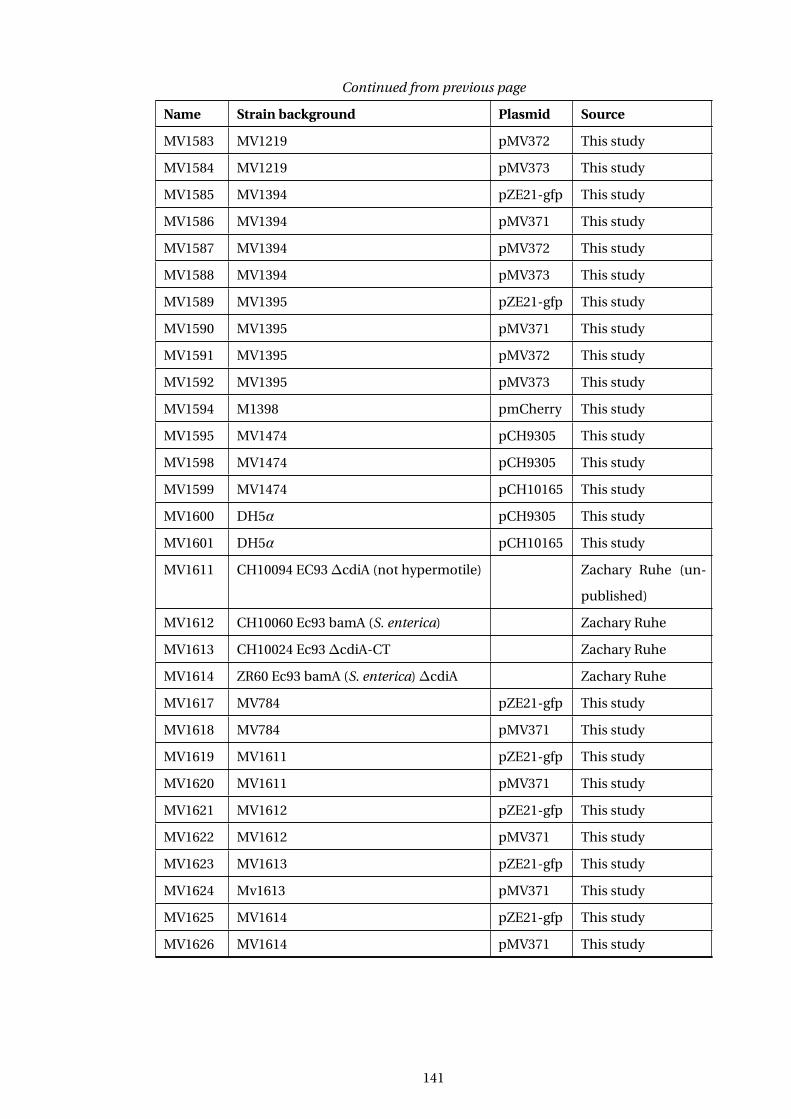
Continued from previous page
Name Strain background Plasmid Source
MV1583 MV1219 pMV372 This study
MV1584 MV1219 pMV373 This study
MV1585 MV1394 pZE21-gfp This study
MV1586 MV1394 pMV371 This study
MV1587 MV1394 pMV372 This study
MV1588 MV1394 pMV373 This study
MV1589 MV1395 pZE21-gfp This study
MV1590 MV1395 pMV371 This study
MV1591 MV1395 pMV372 This study
MV1592 MV1395 pMV373 This study
MV1594 M1398 pmCherry This study
MV1595 MV1474 pCH9305 This study
MV1598 MV1474 pCH9305 This study
MV1599 MV1474 pCH10165 This study
MV1600 DH5α pCH9305 This study
MV1601 DH5α pCH10165 This study
MV1611 CH10094 EC93∆cdiA (not hypermotile) Zachary Ruhe (un-
published)
MV1612 CH10060 Ec93 bamA (S. enterica) Zachary Ruhe
MV1613 CH10024 Ec93∆cdiA-CT Zachary Ruhe
MV1614 ZR60 Ec93 bamA (S. enterica)∆cdiA Zachary Ruhe
MV1617 MV784 pZE21-gfp This study
MV1618 MV784 pMV371 This study
MV1619 MV1611 pZE21-gfp This study
MV1620 MV1611 pMV371 This study
MV1621 MV1612 pZE21-gfp This study
MV1622 MV1612 pMV371 This study
MV1623 MV1613 pZE21-gfp This study
MV1624 Mv1613 pMV371 This study
MV1625 MV1614 pZE21-gfp This study
MV1626 MV1614 pMV371 This study
141
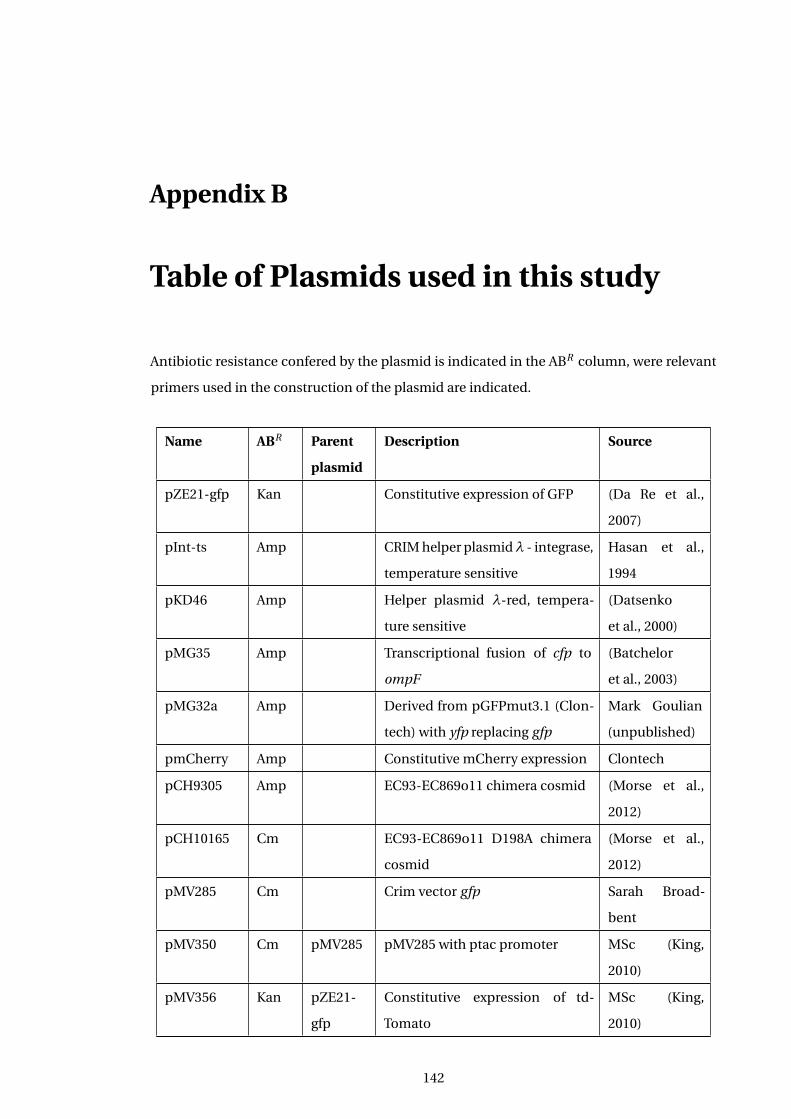
Appendix B
Table of Plasmids used in this study
Antibiotic resistance confered by the plasmid is indicated in the ABR column, were relevant
primers used in the construction of the plasmid are indicated.
Name ABR Parent
plasmid
Description Source
pZE21-gfp Kan Constitutive expression of GFP (Da Re et al.,
2007)
pInt-ts Amp CRIM helper plasmidλ - integrase,
temperature sensitive
Hasan et al.,
1994
pKD46 Amp Helper plasmid λ-red, tempera-
ture sensitive
(Datsenko
et al., 2000)
pMG35 Amp Transcriptional fusion of cfp to
ompF
(Batchelor
et al., 2003)
pMG32a Amp Derived from pGFPmut3.1 (Clon-
tech) with yfp replacing gfp
Mark Goulian
(unpublished)
pmCherry Amp Constitutive mCherry expression Clontech
pCH9305 Amp EC93-EC869o11 chimera cosmid (Morse et al.,
2012)
pCH10165 Cm EC93-EC869o11 D198A chimera
cosmid
(Morse et al.,
2012)
pMV285 Cm Crim vector gfp Sarah Broad-
bent
pMV350 Cm pMV285 pMV285 with ptac promoter MSc (King,
2010)
pMV356 Kan pZE21-
gfp
Constitutive expression of td-
Tomato
MSc (King,
2010)
142
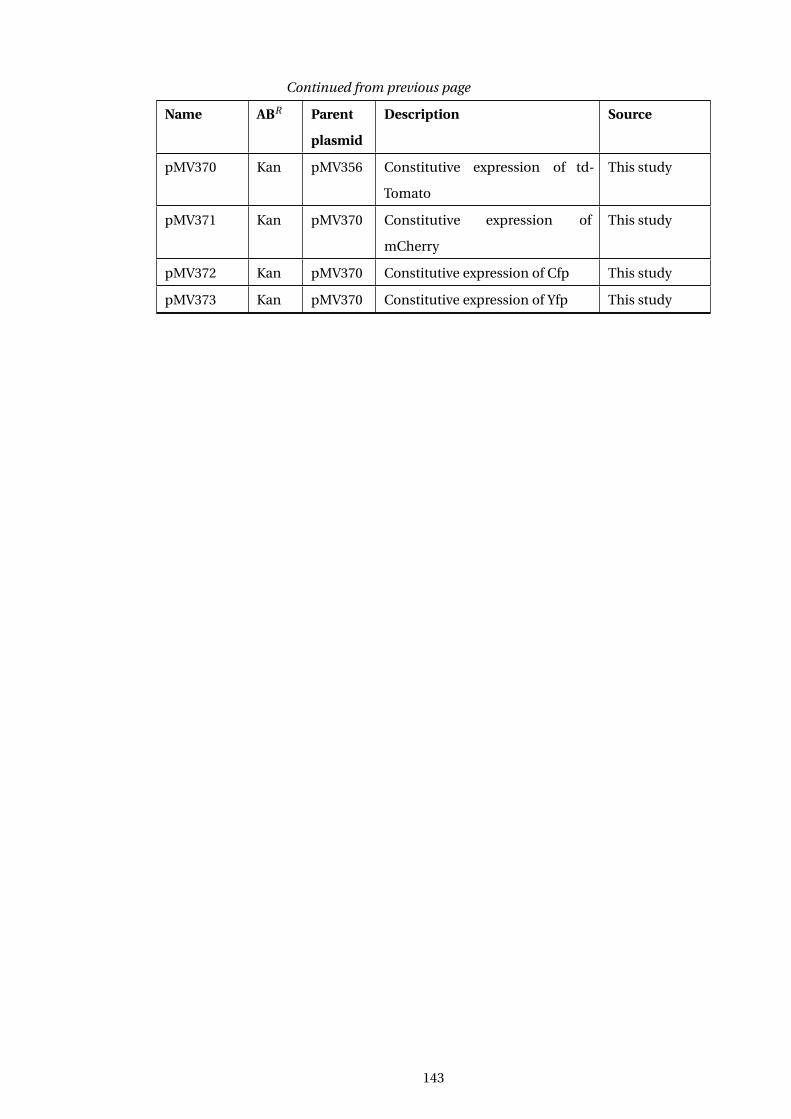
Continued from previous page
Name ABR Parent
plasmid
Description Source
pMV370 Kan pMV356 Constitutive expression of td-
Tomato
This study
pMV371 Kan pMV370 Constitutive expression of
mCherry
This study
pMV372 Kan pMV370 Constitutive expression of Cfp This study
pMV373 Kan pMV370 Constitutive expression of Yfp This study
143
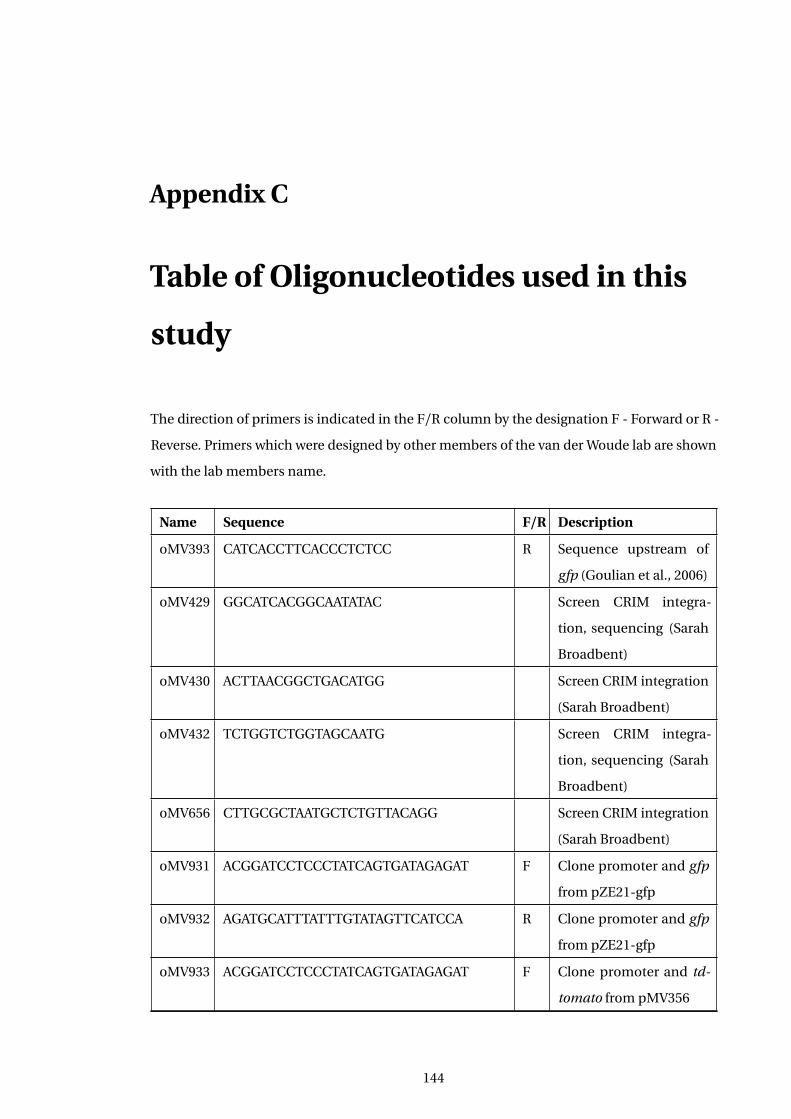
Appendix C
Table of Oligonucleotides used in this
study
The direction of primers is indicated in the F/R column by the designation F - Forward or R -
Reverse. Primers which were designed by other members of the van der Woude lab are shown
with the lab members name.
Name Sequence F/R Description
oMV393 CATCACCTTCACCCTCTCC R Sequence upstream of
gfp (Goulian et al., 2006)
oMV429 GGCATCACGGCAATATAC Screen CRIM integra-
tion, sequencing (Sarah
Broadbent)
oMV430 ACTTAACGGCTGACATGG Screen CRIM integration
(Sarah Broadbent)
oMV432 TCTGGTCTGGTAGCAATG Screen CRIM integra-
tion, sequencing (Sarah
Broadbent)
oMV656 CTTGCGCTAATGCTCTGTTACAGG Screen CRIM integration
(Sarah Broadbent)
oMV931 ACGGATCCTCCCTATCAGTGATAGAGAT F Clone promoter and gfp
from pZE21-gfp
oMV932 AGATGCATTTATTTGTATAGTTCATCCA R Clone promoter and gfp
from pZE21-gfp
oMV933 ACGGATCCTCCCTATCAGTGATAGAGAT F Clone promoter and td-
tomato from pMV356
144
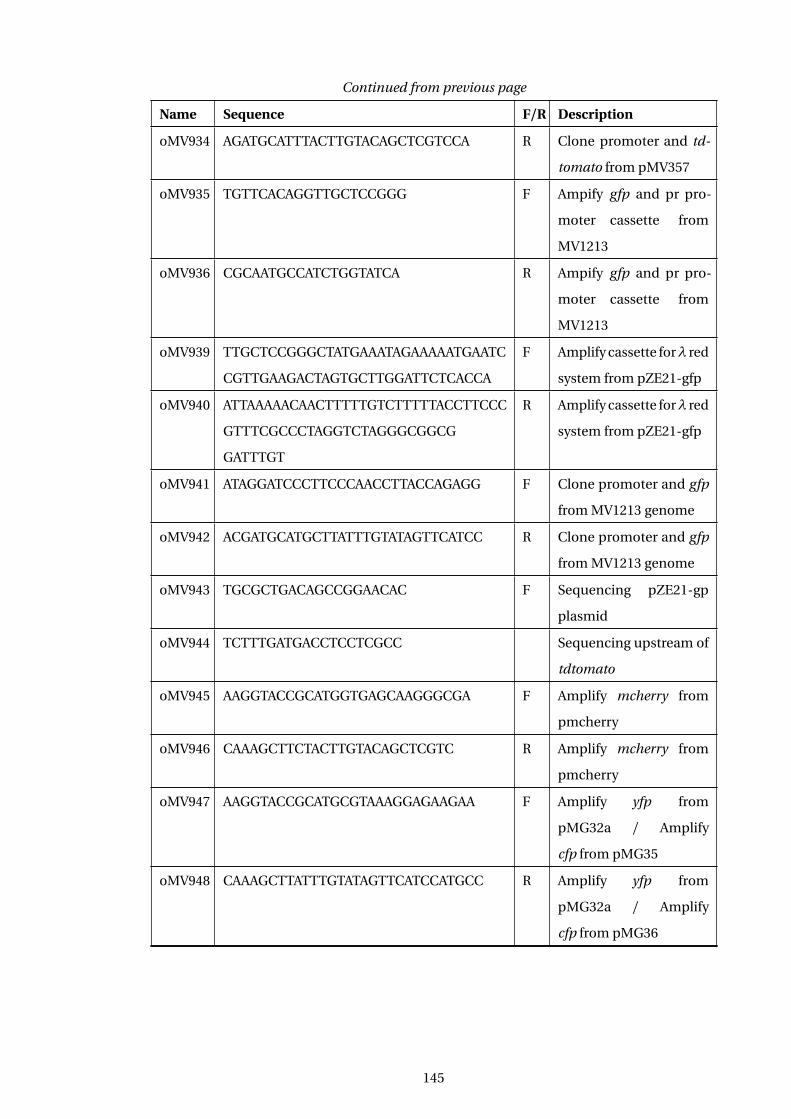
Continued from previous page
Name Sequence F/R Description
oMV934 AGATGCATTTACTTGTACAGCTCGTCCA R Clone promoter and td-
tomato from pMV357
oMV935 TGTTCACAGGTTGCTCCGGG F Ampify gfp and pr pro-
moter cassette from
MV1213
oMV936 CGCAATGCCATCTGGTATCA R Ampify gfp and pr pro-
moter cassette from
MV1213
oMV939 TTGCTCCGGGCTATGAAATAGAAAAATGAATC
CGTTGAAGACTAGTGCTTGGATTCTCACCA
F Amplify cassette forλ red
system from pZE21-gfp
oMV940 ATTAAAAACAACTTTTTGTCTTTTTACCTTCCC
GTTTCGCCCTAGGTCTAGGGCGGCG
GATTTGT
R Amplify cassette forλ red
system from pZE21-gfp
oMV941 ATAGGATCCCTTCCCAACCTTACCAGAGG F Clone promoter and gfp
from MV1213 genome
oMV942 ACGATGCATGCTTATTTGTATAGTTCATCC R Clone promoter and gfp
from MV1213 genome
oMV943 TGCGCTGACAGCCGGAACAC F Sequencing pZE21-gp
plasmid
oMV944 TCTTTGATGACCTCCTCGCC Sequencing upstream of
tdtomato
oMV945 AAGGTACCGCATGGTGAGCAAGGGCGA F Amplify mcherry from
pmcherry
oMV946 CAAAGCTTCTACTTGTACAGCTCGTC R Amplify mcherry from
pmcherry
oMV947 AAGGTACCGCATGCGTAAAGGAGAAGAA F Amplify yfp from
pMG32a / Amplify
cfp from pMG35
oMV948 CAAAGCTTATTTGTATAGTTCATCCATGCC R Amplify yfp from
pMG32a / Amplify
cfp from pMG36
145
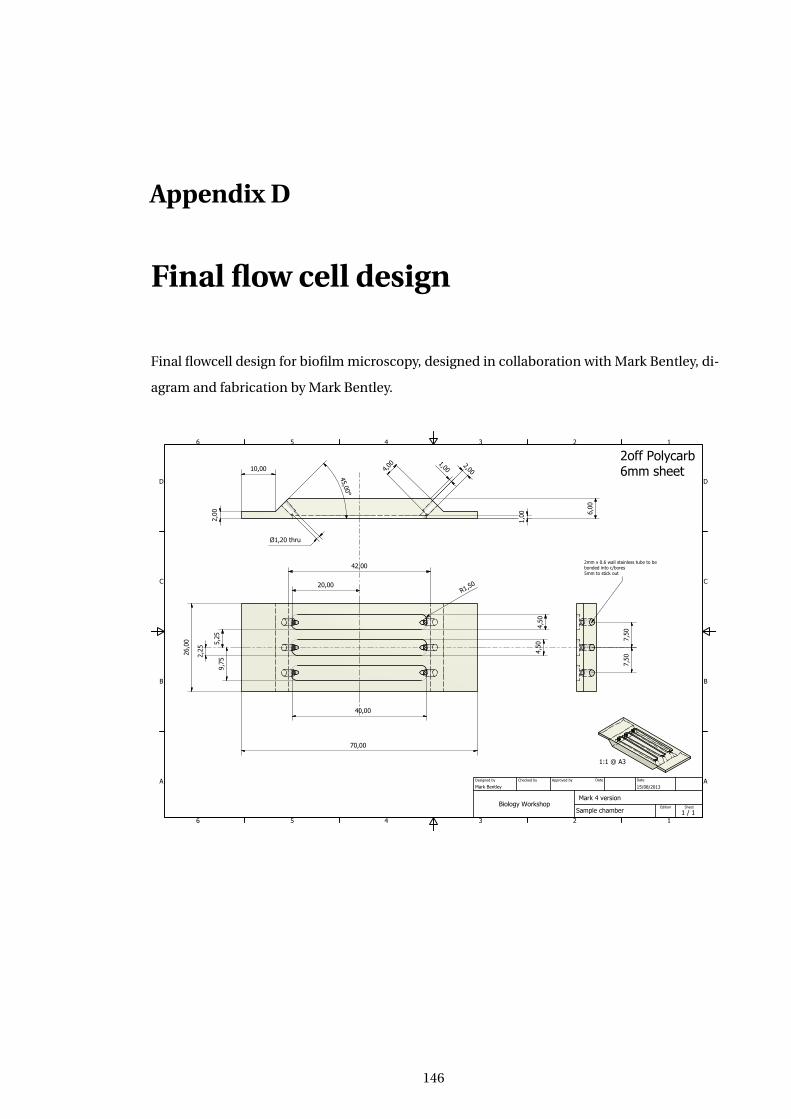
Appendix D
Final flow cell design
Final flowcell design for biofilm microscopy, designed in collaboration with Mark Bentley, di-
agram and fabrication by Mark Bentley.
1
1
2
2
3
3
4
4
5
5
6
6
A A
B B
C C
D D
Sample chamber
Mark Bentley 15/08/2013
Designed by Checked by Approved by Date
1 / 1 Edition Sheet
Date
2off Polycarb6mm sheet
70,00
26,0
0
10,00
45,00°
42,00
20,00
5,25
2,25
9,75
40,00
4,50
R1,50
1,002,00
2,004,00 1,00
1,20Ø thru
6,00
7,50
7,50
4,50
Mark 4 versionBiology Workshop
2mm x 0.6 wall stainless tube to bebonded into c/bores5mm to stick out
1:1 @ A3
146
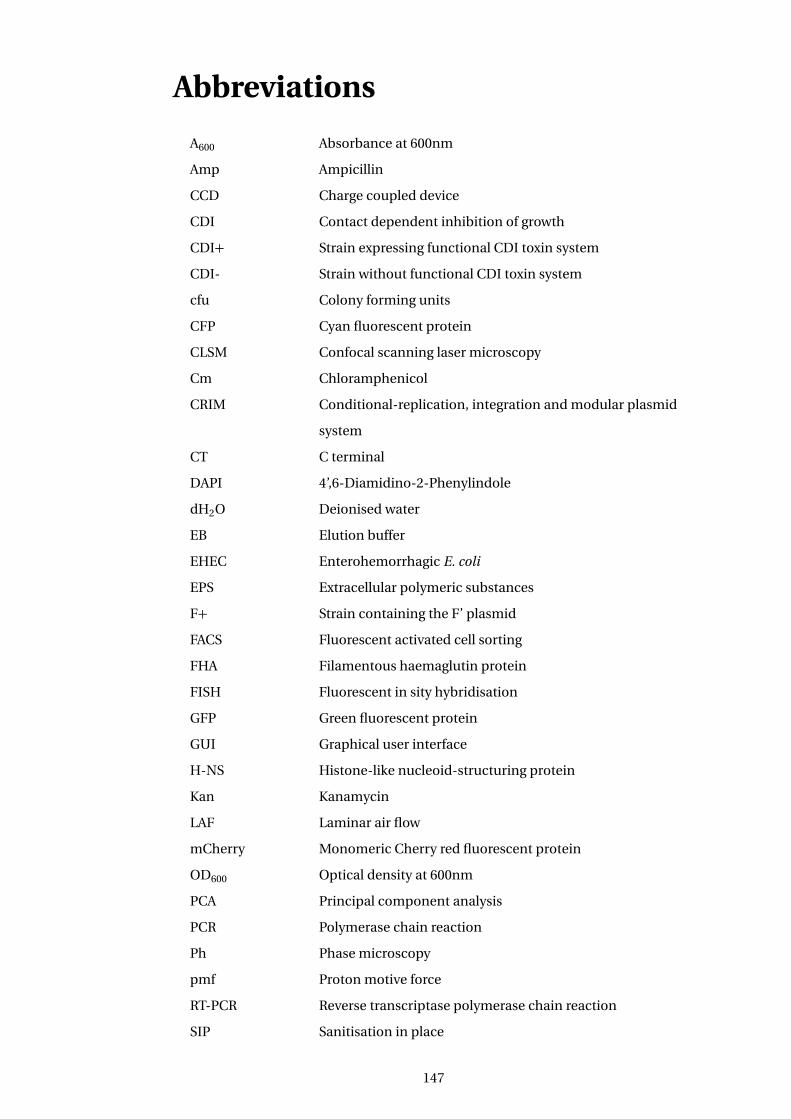
Abbreviations
A600 Absorbance at 600nm
Amp Ampicillin
CCD Charge coupled device
CDI Contact dependent inhibition of growth
CDI+ Strain expressing functional CDI toxin system
CDI- Strain without functional CDI toxin system
cfu Colony forming units
CFP Cyan fluorescent protein
CLSM Confocal scanning laser microscopy
Cm Chloramphenicol
CRIM Conditional-replication, integration and modular plasmid
system
CT C terminal
DAPI 4’,6-Diamidino-2-Phenylindole
dH2O Deionised water
EB Elution buffer
EHEC Enterohemorrhagic E. coli
EPS Extracellular polymeric substances
F+ Strain containing the F’ plasmid
FACS Fluorescent activated cell sorting
FHA Filamentous haemaglutin protein
FISH Fluorescent in sity hybridisation
GFP Green fluorescent protein
GUI Graphical user interface
H-NS Histone-like nucleoid-structuring protein
Kan Kanamycin
LAF Laminar air flow
mCherry Monomeric Cherry red fluorescent protein
OD600 Optical density at 600nm
PCA Principal component analysis
PCR Polymerase chain reaction
Ph Phase microscopy
pmf Proton motive force
RT-PCR Reverse transcriptase polymerase chain reaction
SIP Sanitisation in place
147

T3SS Type III secretion system
T4SS Type IV secretion system
T5SS Type V secretion system
T6SS Type VI secretion system
tdTomato Tandem dimer Tomato red fluorescent protein
TPS Two partner secretion system
UHQ H2O Ultra high quality water
UPEC Uropathogenic E. coli
UTI Urinary tract infection
YFP Yellow fluorescent protein
148
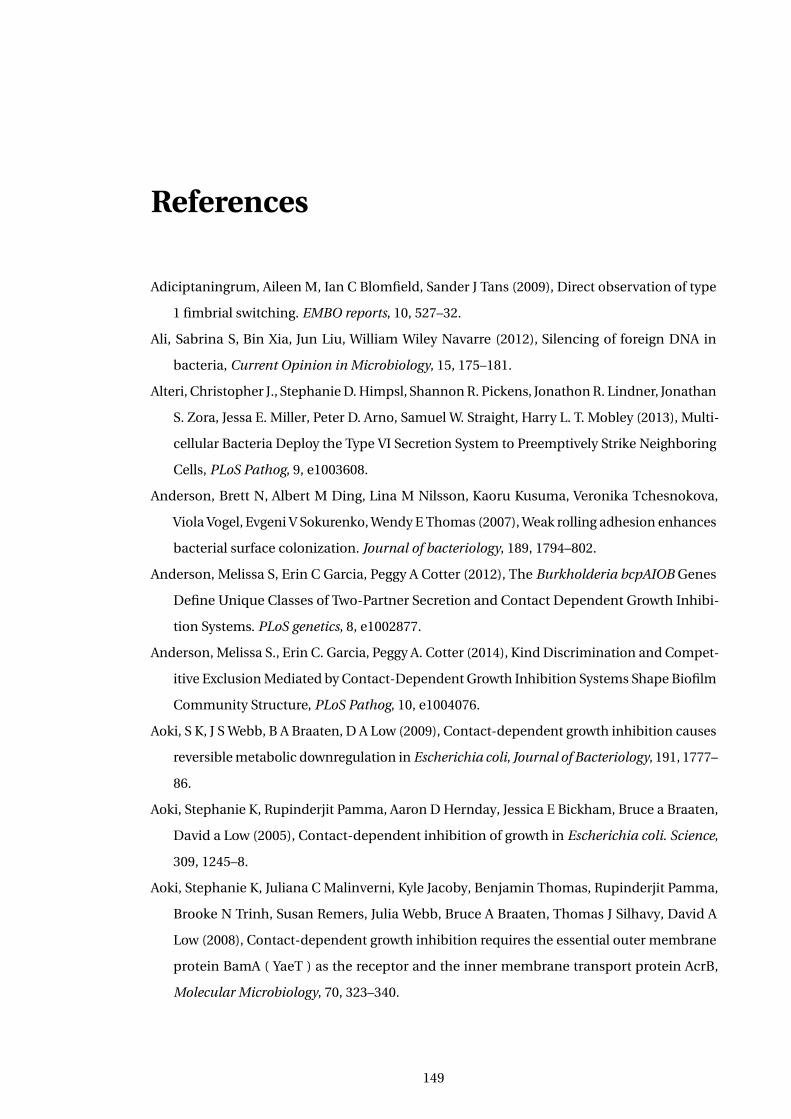
References
Adiciptaningrum, Aileen M, Ian C Blomfield, Sander J Tans (2009), Direct observation of type
1 fimbrial switching. EMBO reports, 10, 527–32.
Ali, Sabrina S, Bin Xia, Jun Liu, William Wiley Navarre (2012), Silencing of foreign DNA in
bacteria, Current Opinion in Microbiology, 15, 175–181.
Alteri, Christopher J., Stephanie D. Himpsl, Shannon R. Pickens, Jonathon R. Lindner, Jonathan
S. Zora, Jessa E. Miller, Peter D. Arno, Samuel W. Straight, Harry L. T. Mobley (2013), Multi-
cellular Bacteria Deploy the Type VI Secretion System to Preemptively Strike Neighboring
Cells, PLoS Pathog, 9, e1003608.
Anderson, Brett N, Albert M Ding, Lina M Nilsson, Kaoru Kusuma, Veronika Tchesnokova,
Viola Vogel, Evgeni V Sokurenko, Wendy E Thomas (2007), Weak rolling adhesion enhances
bacterial surface colonization. Journal of bacteriology, 189, 1794–802.
Anderson, Melissa S, Erin C Garcia, Peggy A Cotter (2012), The Burkholderia bcpAIOB Genes
Define Unique Classes of Two-Partner Secretion and Contact Dependent Growth Inhibi-
tion Systems. PLoS genetics, 8, e1002877.
Anderson, Melissa S., Erin C. Garcia, Peggy A. Cotter (2014), Kind Discrimination and Compet-
itive Exclusion Mediated by Contact-Dependent Growth Inhibition Systems Shape Biofilm
Community Structure, PLoS Pathog, 10, e1004076.
Aoki, S K, J S Webb, B A Braaten, D A Low (2009), Contact-dependent growth inhibition causes
reversible metabolic downregulation in Escherichia coli, Journal of Bacteriology, 191, 1777–
86.
Aoki, Stephanie K, Rupinderjit Pamma, Aaron D Hernday, Jessica E Bickham, Bruce a Braaten,
David a Low (2005), Contact-dependent inhibition of growth in Escherichia coli. Science,
309, 1245–8.
Aoki, Stephanie K, Juliana C Malinverni, Kyle Jacoby, Benjamin Thomas, Rupinderjit Pamma,
Brooke N Trinh, Susan Remers, Julia Webb, Bruce A Braaten, Thomas J Silhavy, David A
Low (2008), Contact-dependent growth inhibition requires the essential outer membrane
protein BamA ( YaeT ) as the receptor and the inner membrane transport protein AcrB,
Molecular Microbiology, 70, 323–340.
149
Aoki, Stephanie K, Elie J. Diner, Claire T’Kint de Roodenbeke, Brandt R. Burgess, Stephen J.
Poole, Bruce A. Braaten, Allison M. Jones, Julia S. Webb, Christopher S. Hayes, Peggy A.
Cotter, David A. Low (2010), A widespread family of polymorphic contact-dependent toxin
delivery systems in bacteria, Nature, 468, 439–442.
Bakshi, Somenath, Heejun Choi, Nambirajan Rangarajan, Kenneth J. Barns, Benjamin P. Brat-
ton, James C. Weisshaar (2014), Nonperturbative Imaging of Nucleoid Morphology in Live
Bacterial Cells during an Antimicrobial Peptide Attack, Applied and Environmental Micro-
biology, 80, 4977–4986.
Batchelor, Eric, Mark Goulian (2003), Robustness and the cycle of phosphorylation and dephos-
phorylation in a two-component regulatory system. Proceedings of the National Academy
of Sciences of the United States of America, 100, 691–6.
— (2006), Imaging OmpR localization in Escherichia coli. Molecular microbiology, 59, 1767–
78.
Bates, Douglas, Martin Maechler, Ben Bolker, Steven Walker (2013), lme4: Linear mixed-effects
models using Eigen and S4.
Beck, Christina M, Robert P Morse, David A Cunningham, Angelina Iniguez, David A Low, Celia
W Goulding, Christopher S Hayes (2014a), CdiA from Enterobacter cloacae Delivers a Toxic
Ribosomal RNase into Target Bacteria, Structure (London, England: 1993), 22, 707–718.
Beck, Christina M., Elie J. Diner, Jeff J. Kim, David A. Low, Christopher S. Hayes (2014b), The F
pilus mediates a novel pathway of CDI toxin import, Molecular Microbiology, 276–290.
Beloin, C, J Valle, P. Latour-Lambert, P Faure, M Kzreminski, D Balestrino, J.A.J. Haagensen,
S. Molin, G. Prensier, B. Arbeille, Others (2004), Global impact of mature biofilm lifestyle
on Escherichia coli K-12 gene expression, Molecular microbiology, 51, 659–674.
Beloin, C, A Roux, J Ghigo (2008), “Escherichia coli Biofilms”, in: Bacterial Biofilms, Microbi-
ology and Immunology 322, ed. by T. Romeo, Springer-Verlag Berlin Heidelberg, pp. 249–
289.
Beloin, Christophe, Jean-Marc Ghigo (2005), Finding gene-expression patterns in bacterial
biofilms. Trends in microbiology, 13, 16–9.
Beloin, Christophe, Kai Michaelis, Karin Lindner, Paolo Landini, Jörg Hacker, Jean-Marc Ghigo,
Ulrich Dobrindt (2006), The Transcriptional Antiterminator RfaH Represses Biofilm For-
mation in Escherichia coli, Journal of Bacteriology, 188, 1316–1331.
Berg, H C, L Turner (1993), Torque generated by the flagellar motor of Escherichia coli. Bio-
physical Journal, 65, 2201–2216.
Boehm, Alex, Samuel Steiner, Franziska Zaehringer, Alain Casanova, Fabienne Hamburger,
Daniel Ritz, Wolfgang Keck, Martin Ackermann, Tilman Schirmer, Urs Jenal (2009), Second
messenger signalling governs Escherichia coli biofilm induction upon ribosomal stress.
Molecular microbiology, 72, 1500–16.
150
Braun, Volkmar, Silke I Patzer, Klaus Hantke (2002), Ton-dependent colicins and microcins:
modular design and evolution, Biochimie, 84, 365–380.
Braun, Volkmar, Silke I. Patzer (2013), Intercellular communication by related bacterial pro-
tein toxins: colicins, contact-dependent inhibitors, and proteins exported by the type VI
secretion system, FEMS Microbiology Letters, 345, 13–21.
Campos, Manuel, Ivan Surovtsev, Setsu Kato, Ahmad Paintdakhi, Bruno Beltran, Sarah Ebmeier,
Christine Jacobs-Wagner (2014), A Constant Size Extension Drives Bacterial Cell Size Home-
ostasis, Cell, 159, 1433–1446.
Cao, Bin, Paul D. Majors, Bulbul Ahmed, Ryan S. Renslow, Crystal P. Silvia, Liang Shi, Staffan
Kjelleberg, Jim K. Fredrickson, Haluk Beyenal (2012), Biofilm shows spatially stratified
metabolic responses to contaminant exposure, Environmental Microbiology, no–no.
Cascales, Eric, Susan K Buchanan, Denis Duché, Colin Kleanthous, Roland Lloubès, Kathleen
Postle, Margaret Riley, Stephen Slatin, Danièle Cavard (2007), Colicin biology. Microbiology
and molecular biology reviews : MMBR, 71, 158–229.
Ceri, H, M E Olson, C Stremick, R R Read, D W Morck, A G Buret (1999), The Calgary Biofilm
Device: new technology for rapid determination of antibiotic susceptibilities in bacterial
biofilms, J. Clin. Microbiol. 37, 1771–1776.
Chao, L., Bruce R Levin (1981), Structured Habitats and the Evolution of Anticompetitor Toxins
in Bacteria, Proceedings of the National Academy of Sciences, 78, 6324–6328.
Chavez-Dozal, Alba, Clayton Gorman, Martina Erken, Peter D Steinberg, Diane McDougald,
Michele K Nishiguchi (2013), Predation Response of Vibrio fischeri Biofilms to Bacterivorus
Protists. Applied and environmental microbiology, 79, 553–8.
Choi, Heejun, Zhilin Yang, James C. Weisshaar (2015), Single-cell, real-time detection of oxida-
tive stress induced in Escherichia coli by the antimicrobial peptide CM15, Proceedings of
the National Academy of Sciences, 112, E303–E310.
Chung, C T, S L Niemela, R H Miller (1989), One-step preparation of competent Escherichia
coli: transformation and storage of bacterial cells in the same solution. Proceedings of the
National Academy of Sciences of the United States of America, 86, 2172–5.
Ciofu, Oana, Lotte F Mandsberg, Henzuang Wang, Niels Hø iby (2012), Phenotypes selected
during chronic lung infection in cystic fibrosis patients: implications for the treatment of
Pseudomonas aeruginosa biofilm infections. FEMS immunology and medical microbiology,
65, 215–25.
Claessen, Dennis, Daniel E. Rozen, Oscar P. Kuipers, Lotte Søgaard-Andersen, Gilles P. van
Wezel (2014), Bacterial solutions to multicellularity: a tale of biofilms, filaments and fruiting
bodies, Nature Reviews Microbiology, 12, 115–124.
Conibear, Tim C R, Samuel L Collins, Jeremy S Webb (2009), Role of mutation in Pseudomonas
aeruginosa biofilm development. PloS one, 4, ed. by Angus Buckling, e6289.
151
Cormack, B P, R H Valdivia, S Falkow (1996), FACS-optimized mutants of the green fluorescent
protein (GFP). Gene, 173, 33–8.
Costerton, J. W. (1999), Bacterial Biofilms: A Common Cause of Persistent Infections, Science,
284, 1318–1322.
Costerton, J W, Z Lewandowski, D E Caldwell, D R Korber, H M Lappin-Scott (1995), Microbial
biofilms. Annual review of microbiology, 49, 711–45.
Costerton JW, Geesey GG, Cheng K-J (1978), How bacteria stick, Scientific American, 238, 86–
95.
Cowan, T (2011), Biofilms and their management: from concept to clinical reality. Journal of
wound care, 20, 220–30.
Croxen, Matthew A, B Brett Finlay (2010), Molecular mechanisms of Escherichia coli pathogenic-
ity. Nature reviews. Microbiology, 8, 26–38.
Crusz, Shanika A, Roman Popat, Morten Theil Rybtke, Miguel Cámara, Michael Givskov, Tim
Tolker-Nielsen, Stephen P Diggle, Paul Williams (2012), Bursting the bubble on bacterial
biofilms: a flow cell methodology. Biofouling, 28, 835–42.
Da Re, Sandra, Jean-Marc Ghigo (2006), A CsgD-independent pathway for cellulose production
and biofilm formation in Escherichia coli, Journal of Bacteriology, 188, 3073–3087.
Da Re, Sandra, Benjamin Le Quéré, Jean-Marc Ghigo, Christophe Beloin (2007), Tight mod-
ulation of Escherichia coli bacterial biofilm formation through controlled expression of
adhesion factors. Applied and Environmental Microbiology, 73, 3391–403.
Danese, P N, L a Pratt, S L Dove, R Kolter (2000), The outer membrane protein, antigen 43,
mediates cell-to-cell interactions within Escherichia coli biofilms. Molecular microbiology,
37, 424–32.
Datsenko, K A, B L Wanner (2000), One-step inactivation of chromosomal genes in Escherichia
coli K-12 using PCR products. Proceedings of the National Academy of Sciences of the United
States of America, 97, 6640–5.
Davies, D. G., M. R. Parsek, J. P. Pearson, B. H. Iglewski, J. W. Costerton, E P Greenberg (1998),
The Involvement of Cell-to-Cell Signals in the Development of a Bacterial Biofilm, Science,
280, 295–298.
Dean, Paul (2011), Functional domains and motifs of bacterial type III effector proteins and
their roles in infection, FEMS microbiology reviews, 35, 1100–1125.
Denkhaus, Evelin, Stefan Meisen, Ursula Telgheder, Jost Wingender (2006), Chemical and phys-
ical methods for characterisation of biofilms, Microchimica Acta, 158, 1–27.
Diner, Elie J, Christina M Beck, Julia S Webb, David A Low, Christopher S Hayes (2012), Identifi-
cation of a target cell permissive factor required for contact-dependent growth inhibition
(CDI). Genes & development, 26, 515–25.
152
Donato, Gina M., Thomas H. Kawula (1998), Enhanced Binding of Altered H-NS Protein to
Flagellar Rotor Protein FliG Causes Increased Flagellar Rotational Speed and Hypermotility
in Escherichia coli, Journal of Biological Chemistry, 273, 24030–24036.
Ecker, David J, Rangarajan Sampath, Christian Massire, Lawrence B Blyn, Thomas A Hall, Mark
W Eshoo, Steven A Hofstadler (2008), Ibis T5000: a universal biosensor approach for mi-
crobiology. Nature reviews. Microbiology, 6, 553–8.
El-Hajj, Ziad W., Elaine B. Newman (2015), An Escherichia coli Mutant That Makes Exception-
ally Long Cells, Journal of Bacteriology, 197, 1507–1514.
Eltsov, Mikhail, Benoît Zuber (2006), Transmission electron microscopy of the bacterial nu-
cleoid, Journal of Structural Biology, 156, 246–254.
Eppinger, Mark, Mark K Mammel, Joseph E Leclerc, Jacques Ravel, Thomas A Cebula (2011),
Genome Signatures of Escherichia coli O157:H7 Isolates from the Bovine Host Reservoir.
Applied and environmental microbiology, 77, 2916–25.
Fishov, I, C L Woldringh (1999), Visualization of membrane domains in Escherichia coli. Molec-
ular microbiology, 32, 1166–72.
Flemming, Hans-Curt, Thomas R Neu, Daniel J Wozniak (2007), The EPS matrix: the "house
of biofilm cells". Journal of bacteriology, 189, 7945–7.
Foulston, Lucy, Alexander K. W. Elsholz, Alicia S. DeFrancesco, Richard Losick (2014), The
Extracellular Matrix of Staphylococcus aureus Biofilms Comprises Cytoplasmic Proteins
That Associate with the Cell Surface in Response to Decreasing pH, mBio, 5, e01667–14.
Fux, C a, J W Costerton, P S Stewart, P Stoodley (2005), Survival strategies of infectious biofilms.
Trends in microbiology, 13, 34–40.
Garcia, Erin C., Melissa S. Anderson, Jon A. Hagar, Peggy A. Cotter (2013), Burkholderiae BcpA
mediates biofilm formation independently of interbacterial contact-dependent growth
inhibition, Molecular Microbiology, 89, 1213–1225.
Gbejuade, Herbert O., Andrew M. Lovering, Jason C. Webb (2014), The role of microbial biofilms
in prosthetic joint infections, Acta Orthopaedica, 86, 147–158.
Genevaux, P, S Muller, P Bauda (1996), A rapid screening procedure to identify mini-Tn10 inser-
tion mutants of Escherichia coli K-12 with altered adhesion properties. FEMS microbiology
letters, 142, 27–30.
Ghigo, J (2003), Are there biofilm-specific physiological pathways beyond a reasonable doubt?,
Research in Microbiology, 154, 1–8.
Ghigo, J M (2001), Natural conjugative plasmids induce bacterial biofilm development. Nature,
412, 442–5.
Ghosh, Pushpita, Jagannath Mondal, Eshel Ben-Jacob, Herbert Levine (2015), Mechanically-
driven phase separation in a growing bacterial colony, Proceedings of the National Academy
of Sciences, 201504948.
153
González Barrios, Andrés F, Rongjun Zuo, Yoshifumi Hashimoto, Li Yang, William E Bent-
ley, Thomas K Wood (2006), Autoinducer 2 controls biofilm formation in Escherichia coli
through a novel motility quorum-sensing regulator (MqsR, B3022). Journal of bacteriology,
188, 305–16.
Gottrup, Finn, Jan Apelqvist, Thomas Bjarnsholt, Rose Cooper, Zena Moore, Edgar J. G. Peters,
Sebastian Probst (2014), Antimicrobials and Non-Healing Wounds. Evidence, controversies
and suggestions-key messages, Journal of Wound Care, 23, 477–482.
Goulian, Mark, Marjan van der Woude (2006), A simple system for converting lacZ to gfp re-
porter fusions in diverse bacteria. Gene, 372, 219–26.
Haldimann, Andreas, Barry L Wanner (2001), Conditional-Replication , Integration , Excision
, and Retrieval Plasmid-Host Systems for Gene Structure-Function Studies of Bacteria,
Journal of Bacteriology, 183, 6384–6393.
Hamilton, W. D. (1964), The genetical evolution of social behaviour. I, Journal of Theoretical
Biology, 7, 1–16.
Hardie, Kim Rachael, Karin Heurlier (2008), Establishing bacterial communities by ’word of
mouth’: LuxS and autoinducer 2 in biofilm development. Nature reviews. Microbiology, 6,
635–43.
Hasan, N., M. Koob, W. Szybalski (1994), Escherichia coli genome targeting, I. Cre-lox-mediated
in vitro generation of ori- plasmids and their in vivo chromosomal integration and retrieval,
Gene, 150, 51–56.
Hayes, Christopher S, Stephanie K Aoki, David a Low (2010), Bacterial contact-dependent
delivery systems. Annual review of genetics, 44, 71–90.
Hayes, Christopher S., Sanna Koskiniemi, Zachary C. Ruhe, Stephen J. Poole, David A. Low
(2014), Mechanisms and Biological Roles of Contact-Dependent Growth Inhibition Sys-
tems, Cold Spring Harbor Perspectives in Medicine, 4, a010025.
Helaine, Sophie, Jessica A. Thompson, Kathryn G. Watson, Mei Liu, Cliona Boyle, David W.
Holden (2010), Dynamics of intracellular bacterial replication at the single cell level, Pro-
ceedings of the National Academy of Sciences, 107, 3746–3751.
Hernández-Jiménez, Enrique, Rosa Del Campo, Victor Toledano, Maria Teresa Vallejo-Cremades,
Aurora Muñoz, Carlota Largo, Francisco Arnalich, Francisco García-Rio, Carolina Cubillos-
Zapata, Eduardo López-Collazo (2013), Biofilm vs. planktonic bacterial mode of growth:
which do human macrophages prefer?, Biochemical and biophysical research communi-
cations, 441, 947–952.
Herzberg, Moshe, Ian K Kaye, Wolfgang Peti, Thomas K Wood (2006), YdgG (TqsA) controls
biofilm formation in Escherichia coli K-12 through autoinducer 2 transport. Journal of
bacteriology, 188, 587–98.
154
Heydorn, A, A T Nielsen, M Hentzer, C Sternberg, M Givskov, B K Ersbø ll, S Molin (2000), Quan-
tification of biofilm structures by the novel computer program COMSTAT. Microbiology
(Reading, England), 146 ( Pt 1, 2395–407.
Hirschfeld, Josefine (2014), Dynamic interactions of neutrophils and biofilms, Journal of Oral
Microbiology, 6, 26102.
Hood, Rachel D, Pragya Singh, Fosheng Hsu, Tüzün Güvener, Mike a Carl, Rex R S Trinidad, Julie
M Silverman, Brooks B Ohlson, Kevin G Hicks, Rachael L Plemel, Mo Li, Sandra Schwarz,
Wenzhuo Y Wang, Alexey J Merz, David R Goodlett, Joseph D Mougous (2010), A type VI
secretion system of Pseudomonas aeruginosa targets a toxin to bacteria. Cell host & microbe,
7, 25–37.
Houry, A., M. Gohar, J. Deschamps, E. Tischenko, S. Aymerich, A. Gruss, R. Briandet (2012), Bac-
terial swimmers that infiltrate and take over the biofilm matrix, Proceedings of the National
Academy of Sciences, 109, 13088–93.
Hung, Chia, Yizhou Zhou, Jerome S Pinkner, Karen W Dodson, Jan R Crowley, John Heuser,
Matthew R Chapman, Maria Hadjifrangiskou, Jeffrey P Henderson, Scott J Hultgren (2013),
Escherichia coli biofilms have an organized and complex extracellular matrix structure,
mBio, 4, e00645–00613.
Johnson, Christopher L., Helen Ridley, Robert J. Pengelly, Mohd Zulkifli Salleh, Jeremy H. Lakey
(2013), The unstructured domain of colicin N kills Escherichia coli, Molecular Microbiology,
89, 84–95.
Justice, Sheryl S, Chia Hung, Julie a Theriot, Daniel a Fletcher, Gregory G Anderson, Matthew J
Footer, Scott J Hultgren (2004), Differentiation and developmental pathways of uropathogenic
Escherichia coli in urinary tract pathogenesis. Proceedings of the National Academy of Sci-
ences of the United States of America, 101, 1333–8.
Justice, Sheryl S, David a Hunstad, Patrick C Seed, Scott J Hultgren (2006), Filamentation by
Escherichia coli subverts innate defenses during urinary tract infection. Proceedings of the
National Academy of Sciences of the United States of America, 103, 19884–9.
Kaper, James B, James P Nataro, Harry L Mobley (2004), Pathogenic Escherichia coli. Nature
reviews. Microbiology, 2, 123–40.
Kapitein, Nicole, Axel Mogk (2013), Deadly syringes: type VI secretion system activities in
pathogenicity and interbacterial competition, Current Opinion in Microbiology, 16, 52–58.
Kellenberger, E, C Kellenberger-Van der Kamp (1994), Unstained and in vivo fluorescently
stained bacterial nucleoids and plasmolysis observed by a new specimen preparation
method for high-power light microscopy of metabolically active cells, Journal of microscopy,
176, 132–142.
Kerfeld, Cheryl A, Sabine Heinhorst, Gordon C Cannon (2010), Bacterial microcompartments.
Annual review of microbiology, 64, 391–408.
155
Kerr, Benjamin, Margaret a Riley, Marcus W Feldman, Brendan J M Bohannan (2002), Local
dispersal promotes biodiversity in a real-life game of rock-paper-scissors. Nature, 418, 171–
4.
Kim, Wook, Fernando Racimo, Jonas Schluter, Stuart B. Levy, Kevin R. Foster (2014), Impor-
tance of positioning for microbial evolution, Proceedings of the National Academy of Sci-
ences, 111, E1639–E1647.
King, Andrew (2010), “Advantages and limitations of the use of fluorescent protein expression
systems in microscopy based studies of bacterial biofilms at the single cell level”, Unpub-
lished MSc report, University of York.
Kjaergaard, K, M a Schembri, C Ramos, S Molin, P Klemm (2000), Antigen 43 facilitates forma-
tion of multispecies biofilms. Environmental microbiology, 2, 695–702.
Kolenbrander, Paul E, Robert J Palmer, Saravanan Periasamy, Nicholas S Jakubovics (2010),
Oral multispecies biofilm development and the key role of cell-cell distance. Nature reviews.
Microbiology, 8, 471–80.
Koskiniemi, Sanna, James G. Lamoureux, Kiel C. Nikolakakis, Claire t’Kint de Roodenbeke,
Michael D. Kaplan, David A. Low, Christopher S. Hayes (2013), Rhs proteins from diverse
bacteria mediate intercellular competition, Proceedings of the National Academy of Sci-
ences, 110, 7032–7037.
Koskiniemi, Sanna, Fernando Garza-Sánchez, Linus Sandegren, Julia S. Webb, Bruce A. Braaten,
Stephen J. Poole, Dan I. Andersson, Christopher S. Hayes, David A. Low (2014), Selection of
Orphan Rhs Toxin Expression in Evolved Salmonella enterica Serovar Typhimurium, PLoS
Genet, 10, e1004255.
Koskiniemi, Sanna, Fernando Garza-Sánchez, Natasha Edman, Swarnava Chaudhuri, Stephen
J. Poole, Colin Manoil, Christopher S. Hayes, David A. Low (2015), Genetic Analysis of the
CDI Pathway from Burkholderia pseudomallei 1026b, PLoS ONE, 10, e0120265.
Kostakioti, Maria, Maria Hadjifrangiskou, Scott J Hultgren (2013), Bacterial biofilms: devel-
opment, dispersal, and therapeutic strategies in the dawn of the postantibiotic era, Cold
Spring Harbor perspectives in medicine, 3, a010306.
Lakins, M A, J L Marrison, P J O’Toole, M W van Der Woude (2009), Exploiting advances in
imaging technology to study biofilms by applying multiphoton laser scanning microscopy
as an imaging and manipulation tool. Journal of Microscopy, 235, 128–37.
Lanni, Eric J., Rachel N. Masyuko, Callan M. Driscoll, Jordan T. Aerts, Joshua D. Shrout, Paul W.
Bohn, Jonathan V. Sweedler (2014), MALDI-guided SIMS: Multiscale Imaging of Metabo-
lites in Bacterial Biofilms, Analytical Chemistry.
Lardon, Laurent A, Brian V Merkey, Sónia Martins, Andreas Dötsch, Cristian Picioreanu, Jan-
Ulrich Kreft, Barth F Smets (2011), iDynoMiCS: next-generation individual-based mod-
elling of biofilms. Environmental microbiology, 13, 2416–2434.
156
Leaper, David J, Gregory Schultz, Keryln Carville, Jacqueline Fletcher, Theresa Swanson, Re-
becca Drake (2012), Extending the TIME concept: what have we learned in the past 10
years?, International wound journal, 9 Suppl 2, 1–19.
Lebeaux, David, Jean-Marc Ghigo, Christophe Beloin (2014), Biofilm-Related Infections: Bridg-
ing the Gap between Clinical Management and Fundamental Aspects of Recalcitrance
toward Antibiotics, Microbiology and Molecular Biology Reviews, 78, 510–543.
Lee, Jin-Hyung, Yong-Guy Kim, Moo Hwan Cho, Thomas K. Wood, Jintae Lee (2011), Tran-
scriptomic analysis for genetic mechanisms of the factors related to biofilm formation in
Escherichia coli O157:H7, Current Microbiology, 62, 1321–1330.
Leroux, Michele, Justin A De Leon, Nathan J Kuwada, Alistair B Russell, Delia Pinto-Santini,
Rachel D Hood, Danielle M Agnello, Stephen M Robertson, Paul A Wiggins, Joseph D Mougous
(2012), Quantitative single-cell characterization of bacterial interactions reveals type VI
secretion is a double-edged sword. Proceedings of the National Academy of Sciences of the
United States of America, 109, 19804–19809.
Locke, James C W, Michael B Elowitz (2009), Using movies to analyse gene circuit dynamics
in single cells. Nature reviews. Microbiology, 7, 383–92.
Lossi, Nadine S., Eleni Manoli, Pete Simpson, Cerith Jones, Kailyn Hui, Rana Dajani, Sarah J.
Coulthurst, Paul Freemont, Alain Filloux (2012), The archetype Pseudomonas aeruginosa
proteins TssB and TagJ form a novel subcomplex in the bacterial type VI secretion system,
Molecular Microbiology, 86, 437–456.
Lu, Guoqing, Etsuko N. Moriyama (2004), Vector NTI, a balanced all-in-one sequence analysis
suite, Briefings in Bioinformatics, 5, 378–388.
Lucchini, Sacha, Gary Rowley, Martin D Goldberg, Douglas Hurd, Marcus Harrison, Jay C D
Hinton (2006), H-NS mediates the silencing of laterally acquired genes in bacteria. PLoS
pathogens, 2, e81.
Ma, Luyan, Matthew Conover, Haiping Lu, Matthew R Parsek, Kenneth Bayles, Daniel J Wozniak
(2009), Assembly and development of the Pseudomonas aeruginosa biofilm matrix. PLoS
pathogens, 5, e1000354.
Männik, Jaan, Fabai Wu, Felix J. H. Hol, Paola Bisicchia, David J. Sherratt, Juan E. Keymer, Cees
Dekker (2012), Robustness and accuracy of cell division in Escherichia coli in diverse cell
shapes, Proceedings of the National Academy of Sciences, 109, 6957–6962.
Mason, D J, D M Powelson (1956), Nuclear division as observed in live bacteria by a new tech-
nique. Journal of Bacteriology, 71, 474–9.
Matz, Carsten, Staffan Kjelleberg (2005), Off the hook - how bacteria survive protozoan grazing,
Trends in Microbiology, 13, 302–307.
Mayfield, C I, W E Inniss (1977), A rapid, simple method for staining bacterial flagella. Canadian
journal of microbiology, 23, 1311–3.
157
McDougald, Diane, Scott A Rice, Nicolas Barraud, Peter D Steinberg, Staffan Kjelleberg (2011),
Should we stay or should we go: mechanisms and ecological consequences for biofilm
dispersal. Nat. Rev. Microbiol. 10, 39–50.
Morse, Robert P, Kiel C Nikolakakis, Julia L E Willett, Elias Gerrick, David A Low, Christopher
S Hayes, Celia W Goulding (2012), Structural basis of toxicity and immunity in contact-
dependent growth inhibition (CDI) systems. Proceedings of the National Academy of Sci-
ences of the United States of America, 109, 21480–21485.
Mulcahy, Lawrence R, Jane L Burns, Stephen Lory, Kim Lewis (2010), Emergence of Pseu-
domonas aeruginosa strains producing high levels of persister cells in patients with cystic
fibrosis. Journal of bacteriology, 192, 6191–9.
Mulvey, Matthew A. (2002), Adhesion and entry of uropathogenic Escherichia coli, Cellular
Microbiology, 4, 257–271.
Murphy, K C (1998), Use of bacteriophage lambda recombination functions to promote gene
replacement in Escherichia coli. Journal of bacteriology, 180, 2063–71.
Murphy, Kenan C, Kenneth G Campellone (2003), Lambda Red-mediated recombinogenic
engineering of enterohemorrhagic and enteropathogenic E. coli. BMC molecular biology,
4, 11.
Nadell, Carey D., Knut Drescher, Ned S. Wingreen, Bonnie L. Bassler (2015), Extracellular
matrix structure governs invasion resistance in bacterial biofilms, The ISME journal, is-
mej.2014.246.
Nahum, J. R., B. N. Harding, B. Kerr (2011), Evolution of restraint in a structured rock-paper-
scissors community, Proceedings of the National Academy of Sciences, 108, 10831–10838.
Navarre, William Wiley, Michael McClelland, Stephen J. Libby, Ferric C. Fang (2007), Silencing
of xenogeneic DNA by H-NS-facilitation of lateral gene transfer in bacteria by a defense
system that recognizes foreign DNA, Genes & Development, 21, 1456–1471.
Neidhardt, F C, P L Bloch, D F Smith (1974), Culture medium for enterobacteria. Journal of
bacteriology, 119, 736–47.
Nikolakakis, Kiel, Saba Amber, J Scott Wilbur, Elie J Diner, Stephanie K Aoki, Stephen J Poole,
Apichai Tuanyok, Paul S Keim, Sharon Peacock, Christopher S Hayes, David A Low (2012),
The toxin/immunity network of Burkholderia pseudomallei contact-dependent growth
inhibition (CDI) systems. Molecular microbiology, 84, 516–529.
Nonejuie, Poochit, Michael Burkart, Kit Pogliano, Joe Pogliano (2013), Bacterial cytological
profiling rapidly identifies the cellular pathways targeted by antibacterial molecules, Pro-
ceedings of the National Academy of Sciences, 110, 16169–16174.
Nou, Xiangwu, Jonathan Jones, Christopher Hayes, David Low (2013), “Contact dependent
growth inhibition of E. coli O157:H7 by EC869 CDI system”, in: Environmental Microbial
158
and Food Safety Laboratory Meeting Abstract 2013, retrieved from iapreview.ars.usda.gov
on 06OCT2014.
Ogasawara, Hiroshi, Kaneyoshi Yamamoto, Akira Ishihama (2011), Role of the Biofilm Master
Regulator CsgD in Cross-Regulation between Biofilm Formation and Flagellar Synthesis,
Journal of Bacteriology, 193, 2587–97.
Oliver, James D (2005), The viable but nonculturable state in bacteria. Journal of microbiology
(Seoul, Korea), 43 Spec No, 93–100.
Pamp, Sünje Johanna, Claus Sternberg, Tim Tolker-Nielsen (2009), Insight into the microbial
multicellular lifestyle via flow-cell technology and confocal microscopy. Cytometry. Part A
: the journal of the International Society for Analytical Cytology, 75, 90–103.
Parsek, Matthew R, Pradeep K Singh (2003), Bacterial biofilms: an emerging link to disease
pathogenesis. Annual review of microbiology, 57, 677–701.
Periasamy, Saravanan, Hwang-Soo Joo, Anthony C Duong, Thanh-Huy L Bach, Vee Y Tan, Som S
Chatterjee, Gordon Y C Cheung, Michael Otto (2012), How Staphylococcus aureus biofilms
develop their characteristic structure. Proceedings of the National Academy of Sciences of
the United States of America, 109, 1281–6.
Poole, Stephen J, Elie J Diner, Stephanie K Aoki, Bruce A Braaten, Claire T’kint de Roodenbeke,
David A Low, Christopher S Hayes (2011), Identification of Functional Toxin/Immunity
Genes Linked to Contact-Dependent Growth Inhibition (CDI) and Rearrangement Hotspot
(Rhs) Systems. PLoS genetics, 7, e1002217.
Prado, Federico, Benjamin Kerr (2008), The evolution of restraint in bacterial biofilms under
nontransitive competition. Evolution; international journal of organic evolution, 62, 538–
48.
R Core Team (2013), R: A Language and Environment for Statistical Computing, R Foundation
for Statistical Computing, Vienna, Austria.
Rani, Suriani Abdul, Betsey Pitts, Haluk Beyenal, Raaja Angathevar Veluchamy, Zbigniew Lewandowski,
William M Davison, Kelli Buckingham-Meyer, Philip S Stewart (2007), Spatial patterns of
DNA replication, protein synthesis, and oxygen concentration within bacterial biofilms
reveal diverse physiological states. Journal of Bacteriology, 189, 4223–33.
Reisner, Andreas, Mario Maierl, Michael Jörger, Robert Krause, Daniela Berger, Andrea Haid,
Dijana Tesic, Ellen L Zechner (2014), Type 1 fimbriae contribute to catheter-associated
urinary tract infections caused by Escherichia coli, Journal of bacteriology, 196, 931–939.
Ren, Dawei, Jonas Stenløkke Madsen, Claudia I de la Cruz-Perera, Lasse Bergmark, Søren J
Sørensen, Mette Burmølle (2013), High-Throughput Screening of Multispecies Biofilm For-
mation and Quantitative PCR-Based Assessment of Individual Species Proportions, Useful
for Exploring Interspecific Bacterial Interactions, Microbial ecology.
159
Römling, Ute, Michael Y. Galperin, Mark Gomelsky (2013), Cyclic di-GMP: the First 25 Years
of a Universal Bacterial Second Messenger, Microbiology and Molecular Biology Reviews,
77, 1–52.
RStudio (2014), RStudio, RStudio, RStudio.
Rudge, Timothy J., Paul J. Steiner, Andrew Phillips, Jim Haseloff (2012), Computational Mod-
eling of Synthetic Microbial Biofilms, ACS Synthetic Biology, 1, 345–352.
Rudge, Timothy J., Fernán Federici, Paul J. Steiner, Anton Kan, Jim Haseloff (2013), Cell Polarity-
Driven Instability Generates Self-Organized, Fractal Patterning of Cell Layers, ACS Synthetic
Biology, 2, 705–714.
Ruhe, Zachary C, David A Low, Christopher S Hayes (2013a), Bacterial contact-dependent
growth inhibition, Trends in microbiology, 21, 230–237.
Ruhe, Zachary C, Adam B Wallace, David A Low, Christopher S Hayes (2013b), Receptor poly-
morphism restricts contact-dependent growth inhibition to members of the same species,
mBio, 4, e00480–13.
Ruhe, Zachary C., Josephine Y. Nguyen, Christina M. Beck, David A. Low, Christopher S. Hayes
(2014), The proton-motive force is required for translocation of CDI toxins across the inner
membrane of target bacteria, Molecular Microbiology, 94, 466–481.
Russell, Alistair B., S. Brook Peterson, Joseph D. Mougous (2014), Type VI secretion system
effectors: poisons with a purpose, Nature Reviews Microbiology, 12, 137–148.
Sawitzke, James A., Lynn C. Thomason, Nina Costantino, Mikhail Bubunenko, Simanti Datta,
Donald L. Court (2007), “Recombineering: In Vivo Genetic Engineering in E. coli, S. enterica,
and Beyond”, in: Methods in Enzymology, ed. by Kelly T. Hughes and Stanley R. Maloy,
vol. Volume 421, Advanced Bacterial Genetics: Use of Transposons and Phage for Genomic
Engineering, Academic Press, pp. 171–199.
Schembri, Mark A., Dorte Dalsgaard, Per Klemm (2004), Capsule Shields the Function of Short
Bacterial Adhesins, Journal of Bacteriology, 186, 1249–1257.
Schneider, Caroline A, Wayne S Rasband, Kevin W Eliceiri (2012), NIH Image to ImageJ: 25
years of image analysis, Nature Methods, 9, 671–675.
Schwarz, Sandra, T Eoin West, Frédéric Boyer, Wen-Chi Chiang, Mike A Carl, Rachel D Hood,
Laurence Rohmer, Tim Tolker-Nielsen, Shawn J Skerrett, Joseph D Mougous (2010), Burkholde-
ria type VI secretion systems have distinct roles in eukaryotic and bacterial cell interactions.
PLoS pathogens, 6, e1001068.
Shaner, Nathan C, Robert E Campbell, Paul A Steinbach, Ben N G Giepmans, Amy E Palmer,
Roger Y Tsien (2004), Improved monomeric red, orange and yellow fluorescent proteins
derived from Discosoma sp. red fluorescent protein. Nature biotechnology, 22, 1567–72.
Shaner, Nathan C, Paul A Steinbach, Roger Y Tsien (2005), A guide to choosing fluorescent
proteins, Nature Methods, 2, 905–909.
160
Shapiro, J a, C Hsu (1989), Escherichia coli K-12 cell-cell interactions seen by time-lapse video.
Journal of bacteriology, 171, 5963–74.
Shapiro, J.A. (1988), Bacterua as multicellular organisms, Scientific American, 256, 82–89.
Shin, Minsang, Arvin Cesar Lagda, Jae Woong Lee, Abhay Bhat, Joon Haeng Rhee, Jeong-Sun
Kim, Kunio Takeyasu, Hyon E. Choy (2012), Gene silencing by H-NS from distal DNA site,
Molecular Microbiology, 86, 707–719.
Sliusarenko, Oleksii, Jennifer Heinritz, Thierry Emonet, Christine Jacobs-Wagner (2011), High-
throughput, subpixel precision analysis of bacterial morphogenesis and intracellular spatio-
temporal dynamics. Molecular Microbiology, 80, 612–27.
Sochacki, Kem A, Kenneth J Barns, Robert Bucki, James C Weisshaar (2011), Real-time attack
on single Escherichia coli cells by the human antimicrobial peptide LL-37. Proceedings of
the National Academy of Sciences of the United States of America, 108, E77–81.
Solano, Cristina, Maite Echeverz, Iñgo Lasa (2014), Biofilm dispersion and quorum sensing,
Current Opinion in Microbiology, Cell regulation, 18, 96–104.
Strahl, H., L. W. Hamoen (2010), Membrane potential is important for bacterial cell division,
Proceedings of the National Academy of Sciences, 107, 12281–12286.
Strassmann, Joan E., Owen M. Gilbert, David C. Queller (2011), Kin Discrimination and Coop-
eration in Microbes, Annual Review of Microbiology, 65, 349–367.
Thormann, Kai M., Renée M. Saville, Soni Shukla, Alfred M. Spormann (2005), Induction of
Rapid Detachment in Shewanella oneidensis MR-1 Biofilms, Journal of Bacteriology, 187,
1014–1021.
Tikhonova, Elena B., Helen I. Zgurskaya (2004), AcrA, AcrB, and TolC of Escherichia coli Form
a Stable Intermembrane Multidrug Efflux Complex, The Journal of Biological Chemistry,
279, 32116–32124.
Valkenburg, J A, C L Woldringh (1984), Phase separation between nucleoid and cytoplasm in
Escherichia coli as defined by immersive refractometry. Journal of Bacteriology, 160, 1151–
1157.
Volkmer, Benjamin, Matthias Heinemann (2011), Condition-Dependent Cell Volume and Con-
centration of Escherichia coli to Facilitate Data Conversion for Systems Biology Modeling,
PLoS ONE, 6, e23126.
Vorregaard, Martin (2008), “Comstat2 - a modern 3D image analysis environment for biofilms”,
MSc, Informatics and Mathematical Modelling, Technical University of Denmark, DTU.
Walker, Daniel, Lorna Lancaster, Richard James, Colin Kleanthous (2004), Identification of the
catalytic motif of the microbial ribosome inactivating cytotoxin colicin E3, Protein Science
: A Publication of the Protein Society, 13, 1603–1611.
Walters, Marshall C., Frank Roe, Amandine Bugnicourt, Michael J. Franklin, Philip S. Stewart
(2003), Contributions of antibiotic penetration, oxygen limitation, and low metabolic ac-
161
tivity to tolerance of Pseudomonas aeruginosa biofilms to ciprofloxacin and tobramycin,
Antimicrobial Agents and Chemotherapy, 47, 317–323.
Wang, Ping, Lydia Robert, James Pelletier, Wei Lien Dang, Francois Taddei, Andrew Wright,
Suckjoon Jun (2010), Robust Growth of Escherichia coli, Current Biology, 20, 1099–1103.
Wang, Xindan, Christophe Possoz, David J Sherratt (2005), Dancing around the divisome: asym-
metric chromosome segregation in Escherichia coli. Genes & development, 19, 2367–77.
Warren, David J (2011), Preparation of highly efficient electrocompetent Escherichia coli using
glycerol/mannitol density step centrifugation. Analytical biochemistry, 413, 206–7.
Webb, Julia S., Kiel C. Nikolakakis, Julia L. E. Willett, Stephanie K. Aoki, Christopher S. Hayes,
David A. Low (2013), Delivery of CdiA Nuclease Toxins into Target Cells during Contact-
Dependent Growth Inhibition, PLoS ONE, 8, e57609.
West, Stuart A., Andy Gardner (2010), Altruism, Spite, and Greenbeards, Science, 327, 1341–
1344.
Wickham, Hadley (2007), Reshaping Data with the reshape Package, 12, pp. 1–20.
— (2009), ggplot2: elegant graphics for data analysis, Springer New York.
— (2011), The Split-Apply-Combine Strategy for Data Analysis, 1, pp. 1–29.
— (2012), scales: Scale functions for graphics.
Wickham, Hadley, Winston Chang (2013), devtools: Tools to make developing R code easier.
Wilson, Kate (2001), “Preparation of Genomic DNA from Bacteria”, in: Current Protocols in
Molecular Biology, John Wiley & Sons, Inc.
Wolfaardt, GM, JR Lawrence, RD Robarts, SJ Caldwell, DE Caldwell (1994), Multicellular orga-
nization in a degradative biofilm community, Applied and environmental microbiology,
60, 434.
Woude, Marjan W van der (2006), Re-examining the role and random nature of phase variation.
FEMS microbiology letters, 254, 190–7.
Woude, Marjan W. van der, Ian R. Henderson (2008), Regulation and Function of Ag43 (Flu),
Annual Review of Microbiology, 62, 153–169.
Yao, Zhizhong, Rut Carballido-López (2014), Fluorescence Imaging for Bacterial Cell Biology:
From Localization to Dynamics, From Ensembles to Single Molecules, Annual Review of
Microbiology, 68, 459–476.
Yawata, Yutaka, Kensuke Toda, Erika Setoyama, Junji Fukuda, Hiroaki Suzuki, Hiroo Uchiyam,
Nobuhiko Nomura (2010), Monitoring biofilm development in a microfluidic device using
modified confocal reflection microscopy. Journal of bioscience and bioengineering, 110,
377–80.
Yim, Grace, Helena Huimi Wang, Julian Davies Frs (2007), Antibiotics as signalling molecules,
Philosophical Transactions of the Royal Society of London B: Biological Sciences, 362, 1195–
1200.
162
Young, Jonathan W, James C W Locke, Alphan Altinok, Nitzan Rosenfeld, Tigran Bacarian, Peter
S Swain, Eric Mjolsness, Michael B Elowitz (2012), Measuring single-cell gene expression
dynamics in bacteria using fluorescence time-lapse microscopy. Nature protocols, 7, 80–8.
Zhang, Bo, Robert Powers (2012a), Analysis of bacterial biofilms using NMR-based metabolomics.
Future medicinal chemistry, 4, 1273–306.
Zhang, Dapeng, Lakshminarayan M Iyer, L Aravind (2011), A novel immunity system for bacte-
rial nucleic acid degrading toxins and its recruitment in various eukaryotic and DNA viral
systems. Nucleic acids research, 39, 4532–4552.
Zhang, Dapeng, Robson F de Souza, Vivek Anantharaman, Lakshminarayan M Iyer, L Aravind
(2012b), Polymorphic toxin systems: comprehensive characterization of trafficking modes,
processing, mechanisms of action, immunity and ecology using comparative genomics.
Biology direct, 7, 18.
Zobell, C E, E C Allen (1935), The Significance of Marine Bacteria in the Fouling of Submerged
Surfaces. Journal of bacteriology, 29, 239–51.
Zobell, E, D Quentin, La Jolla (1936), Observations on the multiplication of bacteria in differ-
ent volumes of stored seawater and the influence of oxygen tension and solid surfaces,
Biological Bulletin Woods Hole, 71, 324–342.
163