Embed Size (px)
Citation preview

BY:
The Role of Geochemistry in Mineral Systems
Carl BrauhartPrincipal Consultant

Setting out to be Creative
“If you want to end up somewhere different, you need to start somewhere different”
Brian Eno
Music Producer

In Mineral Exploration there are THREE main things that whole-rock geochemistry can help us with
1. Lithology (Mostly Immobile Element Geochemistry)
2. Alteration (All About Mineralogy)
3. Metal Signatures (Direct Detection of Mineralisation With Multielement Geochemistry)
Take-Home Messages

Mineral Systems = Context
VHMS: ga.gov.au
Granite-related: ga.gov.au
1. Immobile Element Geochemistry

Immobile Element RATIOS Define Rock Types
• Immobile elements neither enter, nor leave a rock
mass during alteration or weathering
• Concentrations may change, ratios remain constant
• Key elements include Th, Nb, REE, Zr, Ti and Sc

Immobile Elements

Immobile-Incompatible Element Classification
Th
Zr
Th
C
B
A
P
Eu
Ti
Co
mp
atib
le E
lem
en
t
Incompatible element pairs maintain very similar ratios across a wide range of compositions
That makes them very useful for discriminating different magma series

Lithogeochem Calculator
Th/Nb
Gd/Yb
Er/YbGd/Dy Dy/Er
Th Nb Ta La Ce Pr Nd Zr Hf P Sm Eu Ti Gd Tb Dy Y Ho Er Tm Yb Lu V Sc
Pri
mit
ive
Man
tle
No
rmal
ise
d
100
10
1
0.1
Primitive Mantle
Lithogeochem Calculator compares 13 element ratios to quantify difference between profiles for two samples
Compatible elements: are avoided because they vary according to fractionation

Discriminating Magma Series
Use incompatible element ratios to discriminate between magma series Use compatible elements to discriminate within a magma series
Panorama VHMS DistrictUpper Volcanic Series

Lithogeochem Calculator
www.csaglobal.com
Panorama VHMS District
440 rock chip samples classified using Lithogeochem Calculator
Spatially coherent domains result
0 5kilometres

Panorama VHMS: Rapidly Classify Bi-plots
www.csaglobal.com
Th-Zr Th-Yb
Nb-Zr Nb-Th
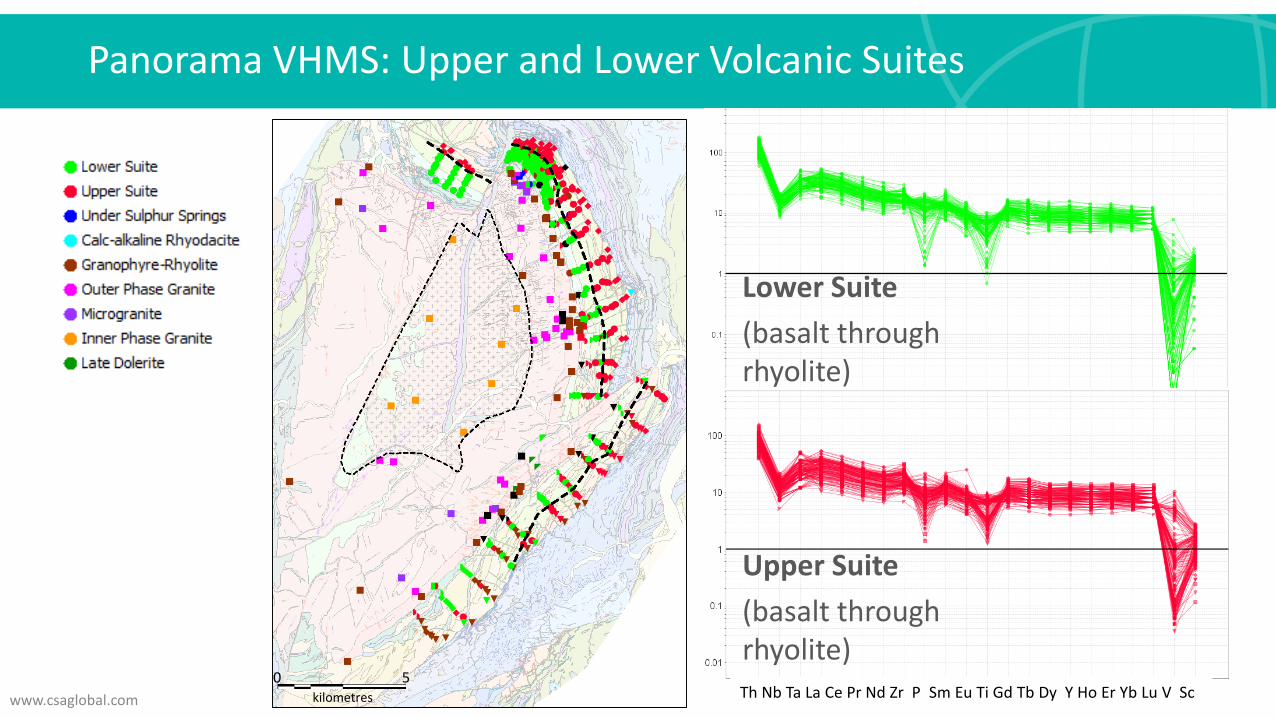
Panorama VHMS: Upper and Lower Volcanic Suites
www.csaglobal.com
Lower Suite
(basalt through rhyolite)
0 5kilometres
Upper Suite
(basalt through rhyolite)Th Nb Ta La Ce Pr Nd Zr P Sm Eu Ti Gd Tb Dy Y Ho Er Yb Lu V Sc

Panorama VHMS: Upper and Lower Volcanic Suites
www.csaglobal.com
0 5kilometres
Average Profiles
Look identical but see Th-Zr plot
Th Nb Ta La Ce Pr Nd Zr P Sm Eu Ti Gd Tb Dy Y Ho Er Yb Lu V Sc
Th-Zr

0 5kilometres
Volcanic and
granite
Third suite has
subtly higher
Th/Yb & La/Yb
Previously Unrecognised Suite
www.csaglobal.com Th Nb Ta La Ce Pr Nd Zr P Sm Eu Ti Gd Tb Dy Y Ho Er Yb Lu V Sc

0 5kilometres
Panorama VHMS: Outer and Inner Phase Granite
www.csaglobal.com Th Nb Ta La Ce Pr Nd Zr P Sm Eu Ti Gd Tb Dy Y Ho Er Yb Lu V Sc
Granophyre-RhyoliteOuter Phase GraniteMicrogranite
Inner Phase Granite

Panorama VHMS: Rapidly Classify Bi-plots
www.csaglobal.com
Th-Zr Th-Yb
Nb-Zr Nb-Th

• Ti-Zr has been used to validate
mapping of compositions basalt
through to rhyolite
• Detailed immobile element
geochemistry defines a break in
volcanic stratigraphy – VHMS
implications
• Four major magma series helps
unravel the order of events in the
mineral system
How Has This Helped?
0 5kilometres

2. Alteration Geochemistry

Alteration Diagrams
www.csaglobal.com
On any diagram, ask “What minerals are likely to be driving trends on my diagram?”. It’s all about minerals

Alteration Elements
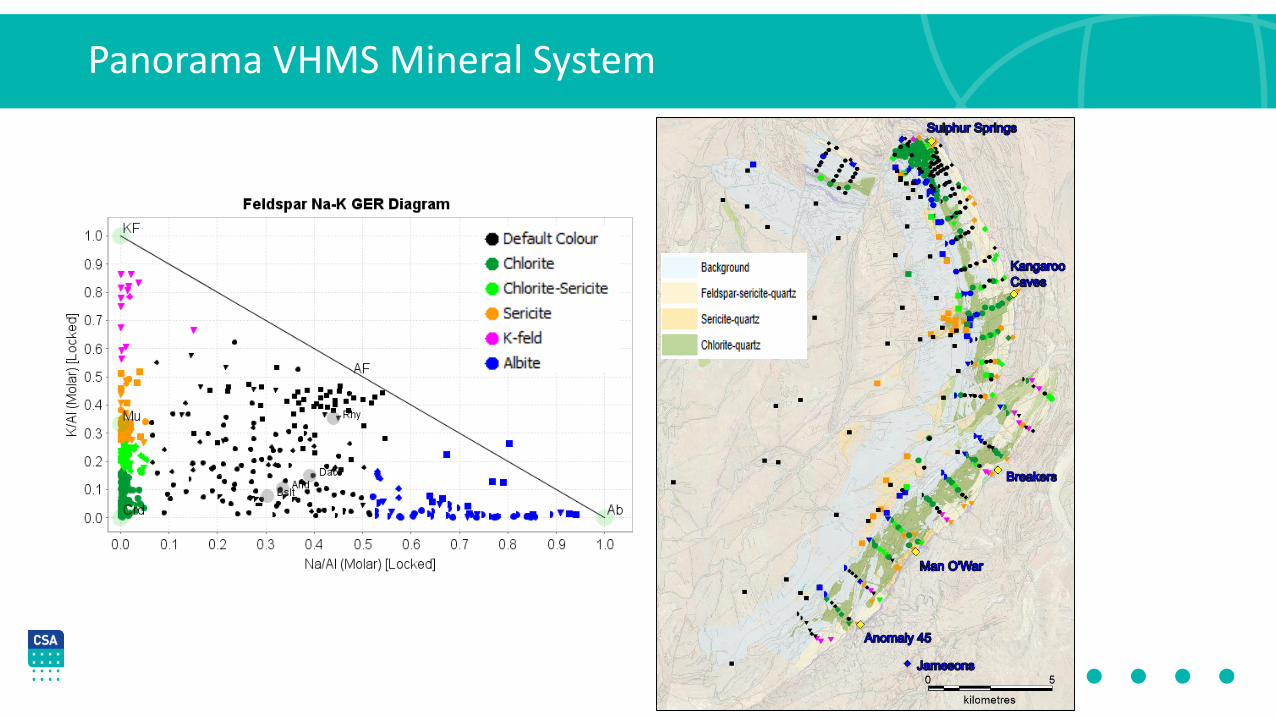
Panorama VHMS Mineral System
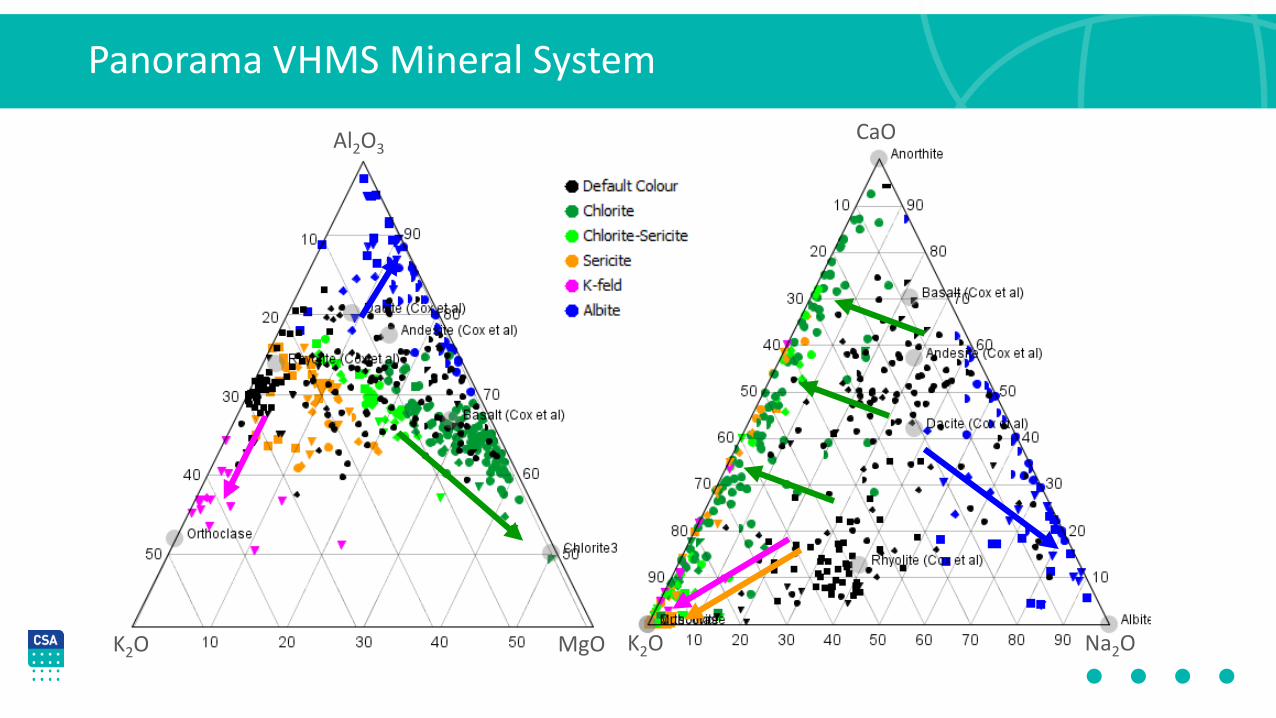
Al2O3
K2O MgO
CaO
K2O Na2O
Panorama VHMS Mineral System

Panorama VHMS Mineral System: Mass Transfer Maps
MgO Cu

• Na/Al versus K/Al molar ratio plot
confirms alteration mapping
• Architecture of alteration map can be
interpreted as a convective
hydrothermal system: discharge
zones are targets
• Albite alteration coincides with zone
of strong metal leaching = high
temperature reaction zone
How Has This Helped?

Choose Diagrams Appropriate to Your Mineral System
Halley (2016)
S_pct
Fe_p
ct
Tl_p
pm
K_pct
Ca_
pp
m
Mg_ppm
V_p
pm
Sc_ppm
K Na
Ca
Fe S
Cu
py
cc
bn
cp

3. MineralisationSignatures

Principal Component Analysis
• PCA is very useful to identify multielement associations: Mineralisation
• Rather than 40, or 60 individual elements, a handful of ranked scaled eigenvectors
• The proportion of variation owing to each element association (process) is defined
Single element maps mix all these processes together
Data Cloud in 3D

PCA Step 1: What to Include?
86 RC Drill Chip Samples from Orogenic Au Project

PCA Step 2: Centred Log Ratio Transform
Let’s leave that for now

PCA Step 3: Calculate PCA
1. Eigenvector: How much X plus how much Y, plus ….. (What direction?)
2. Eigenvalue: What proportion of overall variation (How long?)
3. Scaled Eigenvector: Scaled by eigenvalue. Most useful output of all. Sum of squares for each variable sums to 1.
4. PC Score: Principal component score for individual samples

PCA Step 4: Interpret Ranked Scaled Eigenvectors

Two Orogenic Gold Signatures
Examples of Gold 1 and Gold 2 ore element signatures on OSNACA Enrichment Diagrams
Note: Co, Re, Pd, Pt, In, Tl, U assays not provided
Gold 1: Au-Cu-Te-Ag-W-(Pb-Mo-Bi)
Gold 2: Au-As-Te

How Has This Helped?
We have rapidly assessed data for 80-odd RC samples from an orogenic gold project and have the following leads to follow up:
• Mafic, felsic and sedimentary host rock signatures have been defined
• Two different styles of gold mineralisation have been identified, one “oxidised”, the other “reduced”. Should we target where these two systems meet?
• White mica alteration may also have been defined and requires follow-up

Scavenging

Pb-Ag-Sb-As-Zn-Cd-(Tl-Rb-S-W-K-Bi)As-Au-(Sb-Cu)
Scale Dependence
Exploration geologists want to isolate metal associations related to mineralisation from everything else. They vary according to scale.
• If detectable in a regional dataset, a mineralisation signal will feature on a lower order PC (e.g., PC5)
• A single point (or maybe a few) will not define a metal association in PCA at all. You must ALSO look carefully at probability plots.
• However, within a deposit, a metal signature will feature on PC1
REGIONAL: PC3 or lower LOCAL: PC1

Additive Indices
10 km
Do NOT use raw values: See also Weighted Sum function in ioGAS

How Has This Helped?
The use of multielement geochemistry to define mineralisationsignatures isolates mineralisation from competing processes like regolith and lithology
You should always follow up a Au anomaly with pathfinder support ahead of a Au-only anomaly
The use of multielement geochemistry helps to eliminate false positive and provides more confidence to follow up subtle anomalies that are related to mineralisation
Target ranking is greatly improved

Conclusion
In Mineral Exploration there are THREE main things that whole-rock geochemistry can help us with
1. Lithology
2. Alteration
3. Metal Signatures
1. is for a more accurate stratigraphic framework → better structure
2. is for mapping hydrothermal fluid flow → better predicts deposit sites
3. is for more reliably identifying mineralisation, and having found it, understanding the range of signatures present


BY:
Integrating Structural Geology to Understand Mineral Systems
Rob Holm
Consultant Geologist
20 August 2019

Mineral Systems
Peters et al., 2017; Knox-Robinson and Wyborn, 1997

Components of Mineral Systems
Ford et al., 2019; Knox-Robinson and Wyborn, 1997

Lithospheric-Scale Structure and Fluid Migration
44
Hronsky and Kreuzer, 2019; Grauch et al., 2003Hronsky and Kreuzer, 2019; McCuaig and Hronsky, 2014
e.g. Carlin province, Nevada Bouguer Gravity

45
Cox & Ruming, 2004; Groves et al., 1989
Blewett et al., 2010; Goleby et al., 2003
Blewett et al., 2010

Terrane to Local-Scale Fluid Migration and Trapping
46
Bierlein et al., 2006 Bierlein et al., 2006Weinberg et al., 2005
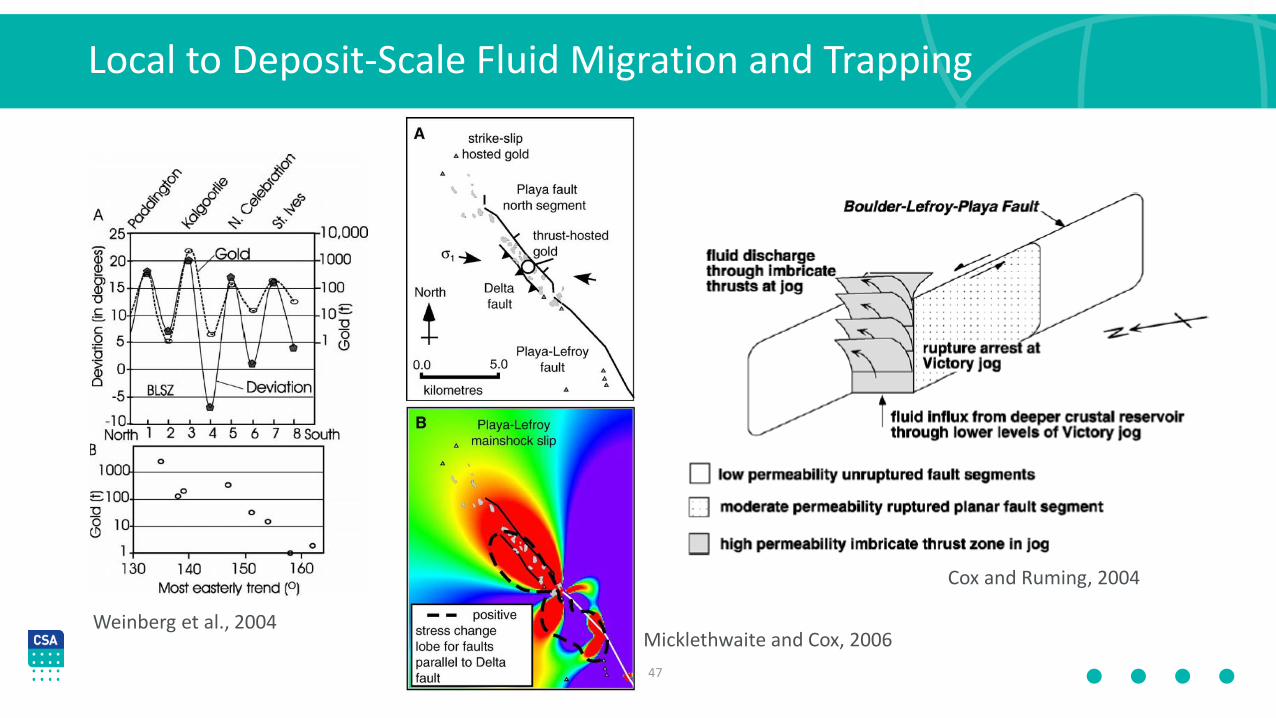
Local to Deposit-Scale Fluid Migration and Trapping
47
Cox and Ruming, 2004
Weinberg et al., 2004Micklethwaite and Cox, 2006

Deposit-Scale Events and Traps?
48 Doublier et al., 2014Blewett et al., 2010
Blewett et al., 2010

Deposit-Scale Events and Traps?
49
We cant rely on orientation alone to distinguish important structures and orientations.
We need more than this from our data collection.
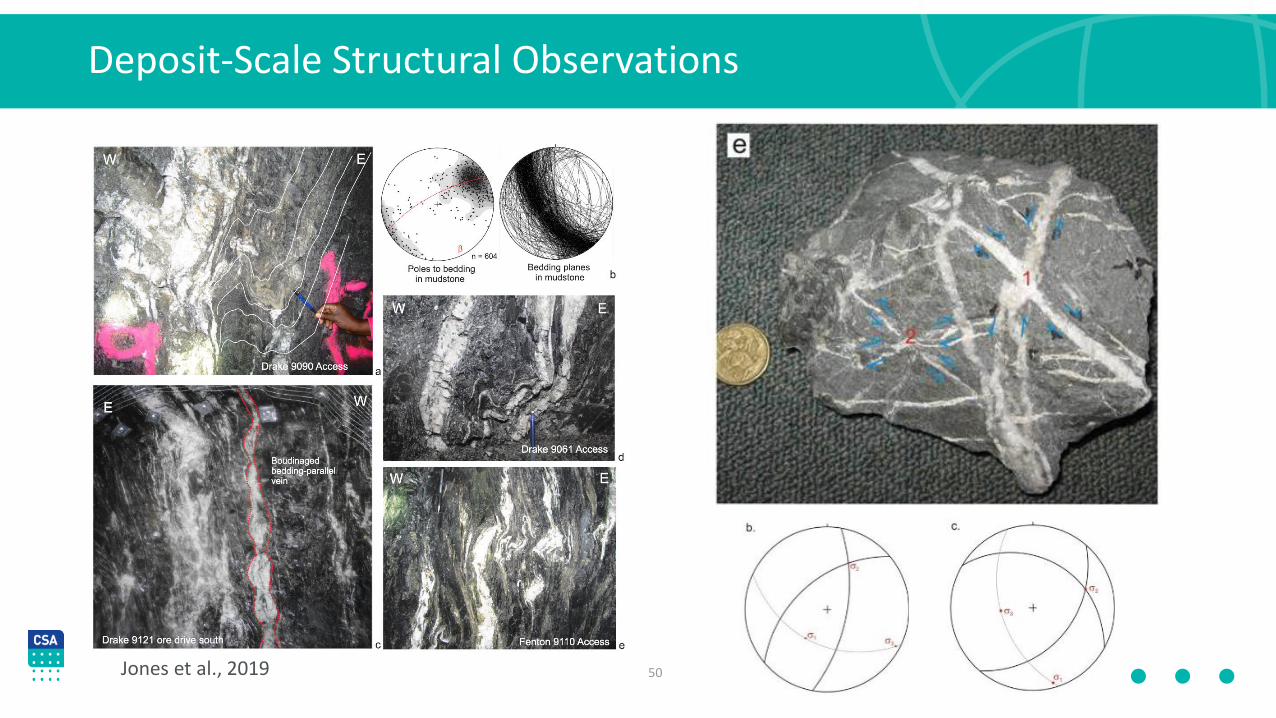
Deposit-Scale Structural Observations
50Jones et al., 2019

• Focus on observations rather than interpretation.
• What are the key characteristics of structures we can use to classify and interpret them.
• Make observations "Queryable“.
• Get observations out of the comments field and into the data fields.
• Recording of cross-cutting relationships are key to interpret timing.
Deposit-Scale Structural Observations
51

In all stages of core orientation, mark up and measurement, accuracyis key. Record the confidence associated with different workflows.
The accumulation of small errors over multiple stages can result insignificant errors that can affect the quality of results.
Quality Control of Structural Observations
52
Filtered, good bedding dataNon filtered bedding dataApparent folding (which is not real!)

Veins need to be separated for structural analysis by theircharacteristics, as well as their orientation and mineralogy.
For example, the vein characteristic could describe:
• What does the vein look like internally?
• What is the shape of the vein?
• How does the vein relate to other similar veins?
Vein abundance is important, but you don't have tomeasure every vein. Quantify similar veins by recordingfrequency.
Is a Vein Just a Vein?
53
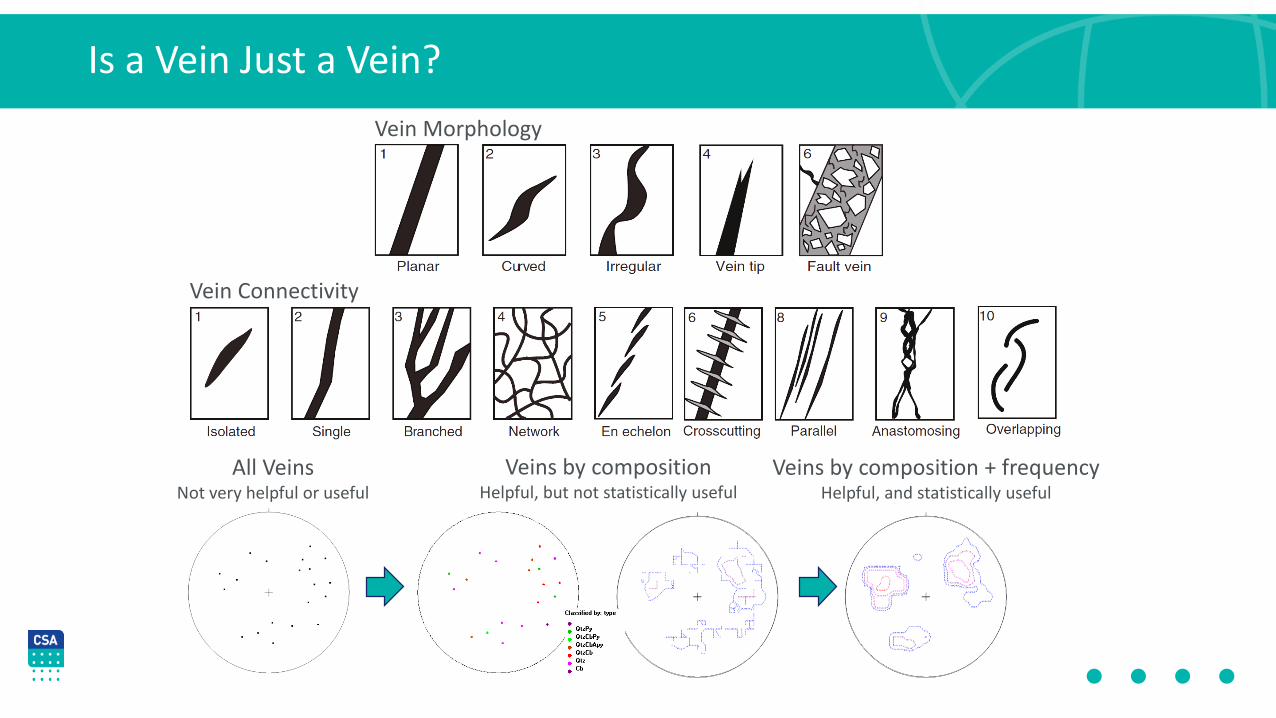
Is a Vein Just a Vein?
54
All VeinsNot very helpful or useful
Veins by compositionHelpful, but not statistically useful
Veins by composition + frequencyHelpful, and statistically useful
Vein Morphology
Vein Connectivity
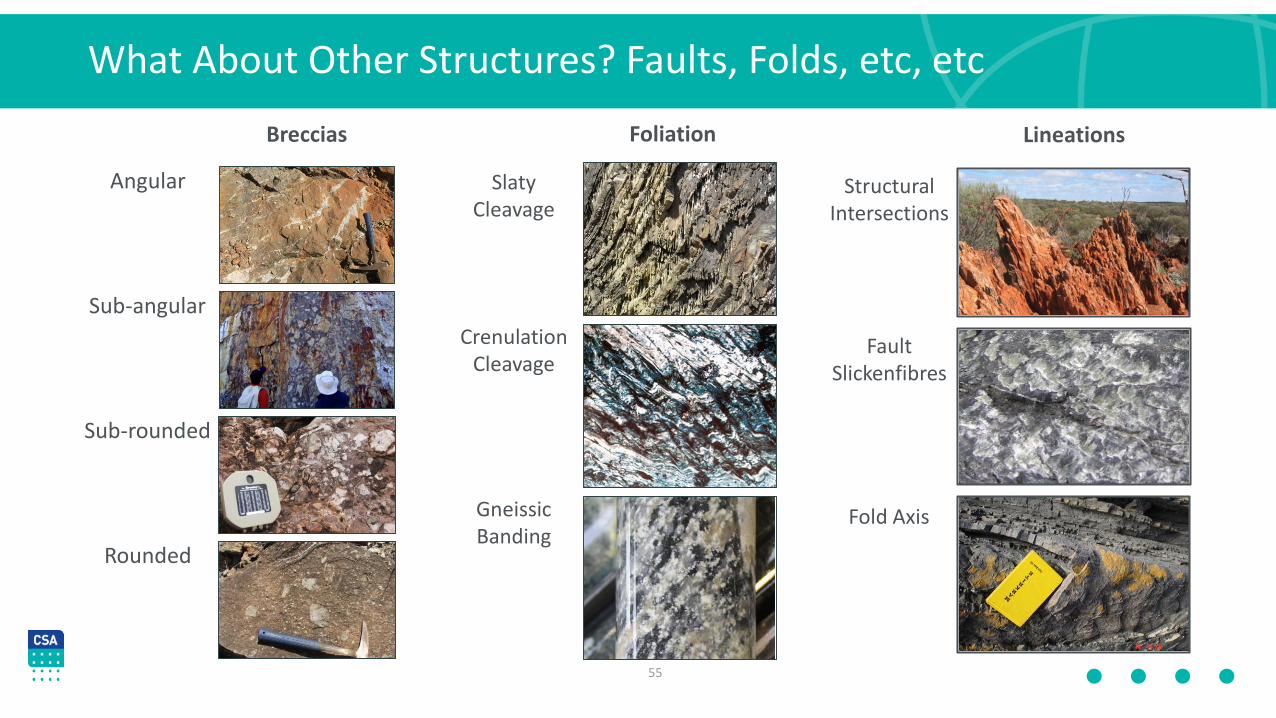
What About Other Structures? Faults, Folds, etc, etc
55
Breccias
Angular
Sub-angular
Rounded
Sub-rounded
StructuralIntersections
FaultSlickenfibres
Fold Axis
LineationsFoliation
SlatyCleavage
CrenulationCleavage
GneissicBanding
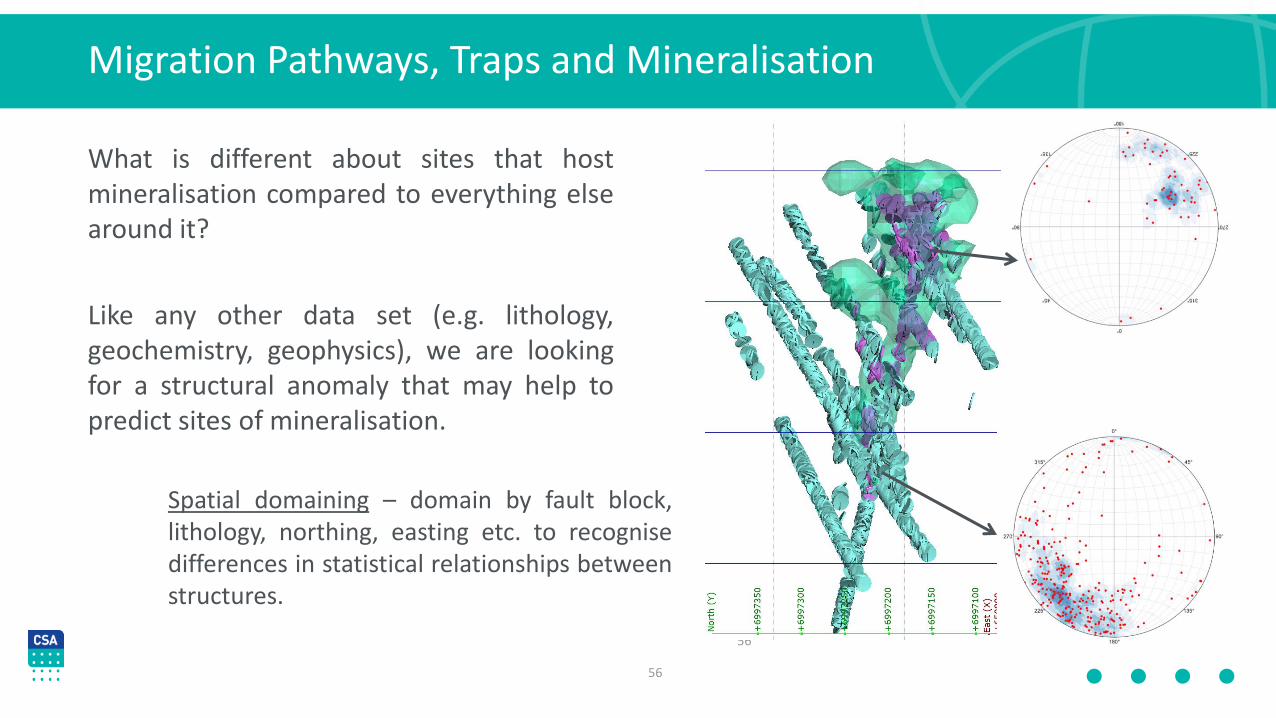
What is different about sites that hostmineralisation compared to everything elsearound it?
Like any other data set (e.g. lithology,geochemistry, geophysics), we are lookingfor a structural anomaly that may help topredict sites of mineralisation.
Migration Pathways, Traps and Mineralisation
56
56
Spatial domaining – domain by fault block,lithology, northing, easting etc. to recognisedifferences in statistical relationships betweenstructures.

57
ppm
ppm
ppm
ppm
ppm
ppm
ppm ssays interval above and
below grade cuto
Structural point data Structural point data
domained by grade cut o
ll data
Within domain
Outs ide domain
Migration Pathways, Traps and Mineralisation

Once you have a dataset interpretations can be undertaken for mineral systems understanding:
Working Towards a Mineral System Understanding
58
Pre-Mineralisation Architecture
Syn-Mineralisation dilation/fluid focussing
Post-Mineralisation deformation/
dismemberment
Fold architectureFault architecture
Faulting/shearingFault BendsFault stepoversStructural intersections
FoldingFaulting/shearing
ExampleVein populations
Lode related
Overprinting veins
Folds• Plunge and plunge
direction• Position around folds
(vergence)• Style of folding
Faults and shearing• Sense of movement• Characteristics to
recognise sets

Structural Geology in Mineral Systems
Peters et al., 2017; Knox-Robinson and Wyborn, 1997

Principles of Structural Data Collection and Controls
60
Ask me about our
CSA Global Short Course