Embed Size (px)
Citation preview

THE ROLE OF GROUNDWATER RECHARGE IN THE WATER BUDGET OF LOWLAND WATERSHEDS
Timothy J. Callahan1, C. Guinn Garrett2, Vijay M. Vulava1 AUTHORS: 1Associate Professor, Dept of Geology and Environmental Geosciences, College of Charleston, 66 George Street, Charleston, SC 29424; 2Research Assistant, Environmental Studies Graduate Program, College of Charleston, 66 George Street, Charleston, SC 29424; 3Assistant Professor, Dept of Geology and Environmental Geosciences, College of Charleston, 66 George Street, Charleston, SC 29424 REFERENCE: Proceedings of the 2010 South Carolina Water Resources Conference, held October 13-14, 2010 at the Columbia Metropolitan Convention Center.
Abstract. Our objective in this study was to estimate groundwater recharge at sites with three different soil series at the Turkey Creek watershed, Santee Experimental Forest near Charleston, South Carolina, as well as the vertical hydraulic gradients during periods between storms at the larger watershed. We used two methods, a modified version of the water table fluctuation (WTF) method by comparing depth of the water table following storm events in wells. Groundwater recharge potential was also estimated by comparing static water levels during dry periods in a water table well and a shallow piezometer 4.2 m below ground. We modified the WTF method by measuring the water table recession behavior for three different soil types, which can easily be done for any site at which water table data have been collected in a continual time series (daily or more frequent). The annual recharge value from the WTF method ranged from only 5 mm for a fine sandy soil in the drought year of 2007 to 38 mm for a loamy sand during the normal rain year of 2008 (approximately 0.4 - 3% of the average annual precipitation for the region); the average annual recharge potential from vertical hydraulic gradient data was 110 mm. The difference in the two methods is most likely due to soil storage capacity and evapotranspiration demand not accounted for in the water-table fluctuation method, whereas the hydraulic gradient method simply indicates the potential vertical flux of groundwater. Little attention has been given to the role of groundwater in the water budget of lowland watersheds and the potential impact of land use change on shallow groundwater resources. Using a basic accounting of impervious coverage increase associated with urbanization, groundwater recharge is estimated to be reduced by 14%; this value is similar to more detailed predictive models used in other studies.
INTRODUCTION One empirical method to estimate groundwater recharge is to track the response of shallow water tables
to storm events. The water table fluctuation method is based on monitoring water levels in wells (Rasmussen and Andreasen, 1959; Coes et al., 2006; Delin et al., 2007; Lewandowski et al., 2009). Other methods include monitoring soil moisture changes over time (Nachabe et al., 2005), measuring geochemical indicators and/or environmental isotope concentrations in groundwater and surface water (Genereux, 2004; Coes et al., 2006; Genereux and Jordan, 2006; Delin et al., 2007), hydrograph separation of storm flow and baseflow (Coes et al., 2006; Slattery et al., 2006; Delin et al., 2007), and using heat as a tracer for groundwater flux (Anderson, 2005; Cox et al., 2007; Foulquier et al., 2009). Studies in the Southeast U.S. coastal plain region at sites with poorly-drained soils and/or shallow water table conditions in lowland watersheds of the lower coastal plain produce storm event runoff similar to those seen in steep-gradient watersheds (Sun et al., 2002; Sun et al., 2005; Harder et al., 2007). Conversely, minimal runoff (and thus considerable replenishment of soil moisture and/or groundwater recharge) can occur in watersheds dominated by sandy soils and with a deeper average water table, due to the small topographic relief (Coes et al., 2006; Pyzoha et al., 2008). Following the estimations of groundwater recharge presented for other sites in the lower (outer) coastal plain of the Southeast U.S. (e.g., Coes et al., 2006), we investigated groundwater recharge dynamics in a low-gradient watershed dominated by poorly-drained soils. Many of the sites investigated in previous studies of shallow groundwater recharge (Coes et al., 2006; Slattery et al., 2006) were dominated by higher-permeability soils (and thus saturation-excess runoff may have been a limiting factor on groundwater recharge during shallow water table conditions). In watersheds dominated by clay-rich soils, infiltration-excess runoff may be an important hydrological process; Sun et al. (2002) reported watershed runoff in forested coastal plain watersheds to be on the order of that measured in forested upland sites of western North Carolina. The objective of this study was to estimate storm-related recharge flux and potential recharge based on
vertical hydraulic gradients for shallow unconfined aquifers of lowland watersheds by inspecting water level data collected in wells and piezometers in three soils series at a watershed in the lower coastal plain of the southeastern U.S. We also estimated watershed-scale recharge under the existing land use scenarios for a lower coastal plain site and present conjectures of water budget changes in response to changes in land use.
METHODS Site Description The surficial aquifer system in coastal South Carolina is a water-table aquifer, approximately 5-20 m thick, and comprised of coastal terrace deposits (Aucott and Speiran, 1985; Newcome, 1989). Where present, the Oligocene to Eocene-aged, clay-rich Cooper Formation is between the surficial aquifer and the water-bearing Santee Limestone (middle Eocene Epoch) and Black Mingo Formation (lower Eocene to Paleocene Epoch) (Miller, 1986; Meadows, 1987). Gardner (1981) provides background information on South Carolina coastal plain watersheds, soils, and stratigraphy. The Turkey Creek watershed (WS 78, Hydrologic Unit Code 03050201), is a third-order watershed, approximately 7,000 ha (70 km2) in size, located in southern Berkeley County about 50 km northeast of Charleston, South Carolina, U.S.A. (Figure 1). The watershed is within the boundaries of the Francis Marion National Forest and is adjacent to the US Forest Service’s Santee Experimental Forest, a research forest demarcated in 1936 and managed by the Center for Forested Wetlands Research in Cordesville, SC. Vegetated cover type in the watershed is 40% pine forest, 35% thinned forest, 17% forested wetlands, 5% mixed forest and 3% developed as agricultural lands, roads and open areas (Amatya and Trettin, 2007; La Torre Torres, 2008). The stream channel length of Turkey Creek is 15.7 km. Elevations in WS 78 range from 3 to 15 m above mean sea level (msl), typical of a low-lying coastal plain watershed. At the study site, near the headwaters of Turkey Creek, the stream is a bottomland hardwood wetland, consisting of a small (approximately 3 m wide and 0.5 m deep) channel and riparian wetland corridor about 10-12 m wide. The predominance of poorly drained soils and the development of roads and open/agricultural lands have been identified as contributors to the relatively high average runoff in Turkey Creek. According to the Natural Resource Conservation Service (NRCS) there are 20 different soil series found within the Turkey Creek watershed. Soil series inspected for groundwater recharge behavior in this study were thermic Aeric Paleaquults of the somewhat poorly
drained Lenoir series, thermic Typic Paleaquults of the very poorly drained Rains series, and thermic Aquic Paleudults of the moderately well-drained Goldsboro Series (Soil Survey of Berkeley County SC, 1980).
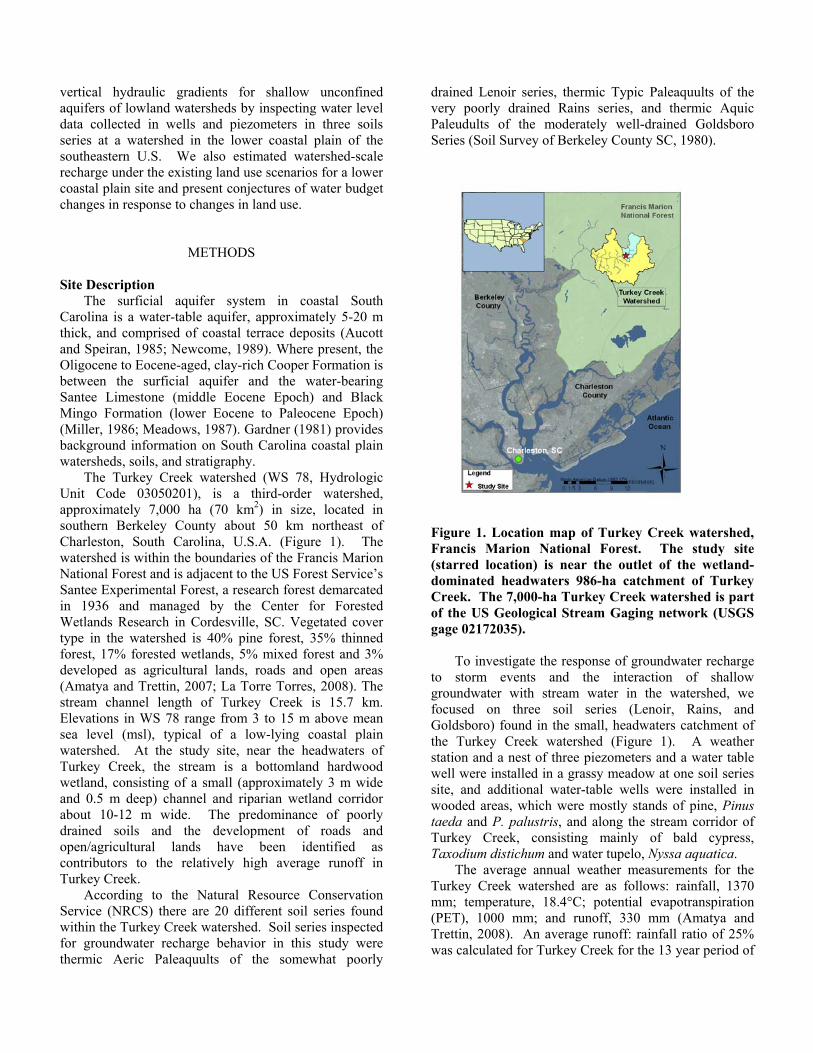
Figure 1. Location map of Turkey Creek watershed, Francis Marion National Forest. The study site (starred location) is near the outlet of the wetland-dominated headwaters 986-ha catchment of Turkey Creek. The 7,000-ha Turkey Creek watershed is part of the US Geological Stream Gaging network (USGS gage 02172035). To investigate the response of groundwater recharge to storm events and the interaction of shallow groundwater with stream water in the watershed, we focused on three soil series (Lenoir, Rains, and Goldsboro) found in the small, headwaters catchment of the Turkey Creek watershed (Figure 1). A weather station and a nest of three piezometers and a water table well were installed in a grassy meadow at one soil series site, and additional water-table wells were installed in wooded areas, which were mostly stands of pine, Pinus taeda and P. palustris, and along the stream corridor of Turkey Creek, consisting mainly of bald cypress, Taxodium distichum and water tupelo, Nyssa aquatica. The average annual weather measurements for the Turkey Creek watershed are as follows: rainfall, 1370 mm; temperature, 18.4°C; potential evapotranspiration (PET), 1000 mm; and runoff, 330 mm (Amatya and Trettin, 2008). An average runoff: rainfall ratio of 25% was calculated for Turkey Creek for the 13 year period of

1964-1976 (Amatya and Radecki-Pawlik, 2007). Variability in annual runoff was shown to be much higher than that of rainfall in the study; the coefficients of variation (quotient of standard deviation and average value) for runoff and rainfall were 45% and 18%, respectively. For the study period July 2006 through December 2008, total rainfall was monitored at monthly intervals using rain gauges (Productive Alternatives, Fergus Falls, MN USA); rainfall intensity data were collected using a tipping bucket rain gauge (Texas Electronics, Dallas, TX USA). Total rainfall during the years 2006, 2007, and 2008 was 1122 mm, 994 mm, and 1464 mm, respectively. Due to the abnormally dry conditions of 2007, there were extended periods in which negligible rain was recorded, such as a six-week period in November-December 2007. Groundwater response analysis Water table wells were installed following standard field methods (Fitts, 2002) at locations of different soil series. Total well depths varied depending on location; screens were at least 1 m below the expected water table maximum depth (approximately 4 - 4.5 m below ground surface). Piezometers with 0.61-m long screens were also installed at a meadow in the upper Turkey Creek watershed, in three individual holes 0.10 m in diameter to a depth of 4.2 m, 9.4 m, and 14.5 m, respectively. Automatically-recording pressure transducers were installed in the wells and piezometers to monitor water levels at a one-hour interval in the water table wells and shallow piezometer, and at a four-hour interval in both the middle and deep piezometer. Two approaches were used to estimate groundwater recharge flux. First, a one-dimensional form of Darcy’s Law provided estimates of the vertical flux (qz) through the surficial aquifer
zhhKq PWT
zz1 (1)
Head measurements were compared between the water table well (hWT) and the shallow piezometer (hP1) at the Lenoir soil site, which was at a grassy field about 150 m SE of Turkey Creek. At depth, the separation distance ( z) between screen mid-points (1.5-m screen length for water-table well, 0.6-m for the piezometers) was 0.86 m. Twenty-four events were selected for analysis from the water level data obtained from the well and shallow piezometer. Separately, for the three sites of different soils (Lenoir, as above, Rains, and Goldsboro), an innovative improvement to the water table fluctuation (WTF) method was developed to calculate the groundwater
recharge to the water table. The WTF method is based on the premise that rises in groundwater levels in unconfined aquifers are due to recharge water arriving at the water table (Healy and Cook, 2002),
m ay
h hR St
(2)
where R [m d-1] is the recharge rate, hm [m] is the water table maximum caused by the event, Sy [unitless] is the effective specific yield of the unsaturated zone above an unconfined aquifer; and t [d] is the time duration of the recharge event. The parameter ha in Equation 2 above was estimated using a new approach, based on Zhang and Schilling (2006). This parameter ha, the maximum expected water-table recession in the absence of precipitation, is described by an exponential decay relationship. We also summarized all water table rises on a monthly basis for the period July 2006 - June 2008, following a similar approach by Rasmussen and Andreasen (1959) who estimated groundwater recharge as part of a water budget analysis for a coastal plain watershed in Maryland, USA. In order to estimate groundwater recharge from water-table fluctuation behavior, specific yield was estimated using a subset of water table data by comparing water table change to total precipitation for individual storm events (Williams, 1978; Harder et al., 2007).
RESULTS AND DISCUSSION Saturated zone Darcy flux The average horizontal hydraulic conductivity (Kh) for the upper portion of the aquifer was 2.7 x 10⁻⁶ m s-1 (230 mm d-1), determined from interpretation of slug test data collected from two water-table wells at nearby sites in the Turkey Creek watershed. The vertical hydraulic conductivity (Kv) for the Lenoir soil at the study site was 2.2 x 10⁻⁸ m s-1 (1.9 mm day-1) as determined from a falling head permeameter experiment (Fetter, 2001) conducted on a sample of Lenoir soil in the laboratory. Using the Darcy’s Law approach, the average rate of potential vertical groundwater flow between the water table and the screen of the shallow piezometer was 0.31 ± 0.15 mm day-1, or expressed at an annual scale, 110 ± 55 mm yr-1. This method assumes vertical, uniform, laminar flow in the shallow aquifer between the water table screen and the screen of the shallow piezometer. However, the subsoil and sediments were not homogeneous with respect to the hydraulic conductivity. At the Lenoir soil site, a grassy meadow upland, rooting depth was observed to be less than about 0.3 m, yet it is possible that macropore structures existed to allow preferential fluid flow. Nonetheless, this simple model provides a potential groundwater recharge rate when

comparing hydraulic head data during dry periods, as was done in this study. The vertical hydraulic gradient between the water table and the deeper groundwater as measured at three separate depths by the piezometers during the study period was always positive (Figure 2), indicating the potential for downward flow in the shallow aquifer. Water-table fluctuation model Using our modified water-table fluctuation method, groundwater recharge for the Turkey Creek watershed was 0 - 8.6 mm month-1 (maximum value for August 2008); the annual totals were 14 - 38 mm (Goldsboro soil; drought year of 2007 and near-normal rain year of 2008, respectively). Annual recharge values for Rains and Lenoir soils were similar in range to Goldsboro soils. Overall, these values are substantially less than those found by Coes et al. (2006), who reported a range in recharge values using the WTF method of 22 - 100 mm month-1 (260 - 1200 mm yr-1) for sites in the Coastal Plain of North Carolina, USA. The soil types at Turkey Creek watershed are mostly poorly-drained to moderately well-drained. During our study period, especially the drought year of 2007, there were several storm events that did not affect the water table position, particularly for the Goldsboro soil because of the larger drainable porosity (similar to specific yield) for this soil, apparent from the increased depth to the water table (Figure 2). Most infiltrating water was stored at a short time scale in the unsaturated zone and was not sequestered in the shallow aquifer. Previous studies usually tabulated the water budget for lowland watersheds at the seasonal or annual time scales (e.g., Harder et al., 2007), and groundwater recharge is equated to the imbalance between precipitation, evapotranspiration, and runoff. In this study we have made use of high-resolution water table and piezometer water level data to estimate groundwater recharge, both the sudden groundwater response to storm events and the longer-term dry-down behavior. This approach captures the behavior of groundwater recharge as a function of soil type, antecedent soil moisture condition, and storm volume. The Darcy flux and WTF methods provide a range in recharge estimates that can be applied to similar soil types in lowland watersheds with shallow water table conditions using any precipitation data, assuming data collection is conducted at an appropriate frequency. Hourly data were collected in this study; this was required for the low specific yield soils (clay loams of the Rains and Lenoir series) yet for sandy loams of Goldsboro and Wando soil series, water level data collected at a four- or six-hourly basis would have been sufficient.
Implications of a developing landscape on groundwater recharge The Southeast U.S. is expected to lose 12 million hectares of forest between 1992 and 2020 (Wear and Greis, 2002) and the ongoing water stress in this region is expected to increase in the future (Sun et al., 2005), thus it is important to understand how hydrological processes within coastal watersheds may be affected by land use change. The forested watershed of Turkey Creek is
0
20
40
60
80
100
120
140
160
180
200-300
-250
-200
-150
-100
-50
0
6/06
8/06
10/0
6
12/0
6
2/07
4/07
6/07
8/07
10/0
7
12/0
7
2/08
4/08
6/08
8/08
10/0
8
12/0
8
Dai
ly ra
in, m
m
Wat
er le
vel,
cm b
gs
Lenoir WTRains WTGoldsboro WTRainfall
Figure 2. Daily rainfall and water table position in cm below ground surface at three sites of different soil series, for the period June 2006 - Dec. 2008, upper Turkey Creek watershed. Water table data at Rains and Goldsboro soil sites and precipitation data provided by D.M. Amatya and C.A. Harrison, USDA-Forest Service. nearly all public land owned and managed by the US Department of Agriculture Forest Service. However, estimating the potential impacts of development on groundwater recharge at Turkey Creek can be used as a proxy to understand how urbanization impacts lowland watersheds of the lower coastal plain. To do this, we scaled up the point estimations of groundwater recharge by assuming a similar water table response (100 mm yr-1) would occur following storm events for all soil classes in Turkey Creek. This approach will give at best an order of magnitude approximation of watershed-scale recharge, but such values are important to gather when testing watershed-scale hydrology models for management purposes. The fraction of the watershed that has the potential to be developed was based upon the drainage class present. Excessively well-drained (less than 1% of watershed), well-drained (1%), moderately well-drained (11%), and somewhat poorly drained soils (34%) were considered likely for development while poorly (30%) and very poorly drained soils (24%) were not. Using these assumptions, 46% of a forested

watershed similar to the Turkey Creek watershed could be considered potential areas for development.
We used 30% as an estimate of impervious coverage for suburban developments (based on regional approximations) and calculated the volume of water generated from storms as potential groundwater recharge for the Turkey Creek watershed given current and future urbanized scenarios. Using a groundwater recharge value of 100 mm yr-1 and the present-day area of pervious surface coverage in Turkey Creek watershed (assuming uniform recharge across such area), approximately 7.3 x 10⁶ m3 yr-1 could be contributed to groundwater as recharge. For the urbanized scenario, if approximately 30% of the developable land (about one-half of the watershed) is converted to a land use consisting of impervious coverage similar to that noted in the developed communities, recharge would be reduced by 14% as a result of a smaller area of pervious cover available for infiltration. This crude estimate based on smaller area available to infiltration is comparable to the predictive methods reported in Amatya and Trettin (2007), who showed a range of 12.5% to 19% reduction of evapotranspiration for the equivalent land use change of 30%, in their case the deforestation that could occur ahead of urbanization. While our approach simply accounts for the potential removal of land area available to groundwater recharge (and thus the resulting return flows to streams as baseflow), the methods compared in Amatya and Trettin (2007) more accurately estimate the perturbations in the water budget due to specific land use changes such as loss of forest cover.
However, indirect sources (e.g., leakage from sewer and pipe systems and focused domestic irrigation of lawns and gardens) can act as significant sources of groundwater recharge to watersheds and can exceed the volume of recharge contributed prior to development (Lerner, 2002). It can be argued that indirect recharge in areas of new development would be low as the new water and sewer infrastructure would experience minimal leakage, at least in the near-term, however establishing ornamental vegetation and other new plantings may result in considerable water consumption and infiltration in new subdivisions. Other modifications to surface water sources as a result of urbanization, such as the straightening or containment of stream channels, may have an impact; as stream flow is altered, water is exported at a faster rate from the watershed and the availability of time for recharge to occur is reduced (Foster, 1990; O’Driscoll, 2010). The influence of these factors of urban land use should be considered in any long-term impact analysis of development on recharge.
ACKNOWLEDGEMENTS
This research was conducted in collaboration with Dr. D.M. Amatya of the US Forest Service at the Santee Experimental Forest, Cordesville, SC. The authors also thank D.R. Hitchcock and T.M. Williams of Clemson University for their collaborations and helpful discussion on this project. This work was prepared as part of a work sponsored by the S.C. Sea Grant Consortium with NOAA financial assistance award NA06OAR4170015. The statements, findings, conclusions, and recommendations are those of the authors and do not necessarily reflect the views of SC Sea Grant or NOAA.
LITERATURE CITED Amatya, D.M., Radecki-Pawlik, A., 2007. Flow dynamics of three experimental forested watersheds in Coastal South Carolina (USA). Acta Sci. Pol., Formatio Circumiectus 6(2), 3-17.
Amatya, D.M., Trettin, C.C., 2007. Annual evapotranspiration of a forested wetland watershed, SC. In: Proceedings, ASABE Annual International Meeting. Minneapolis, MN, 17-20 June 2007. Paper No. 072222.
Amatya, D.M., Trettin, C.C., 2007. Development of watershed hydrologic research at Santee Experimental Forest, Coastal South Carolina. In: Advancing the Fundamental Sciences: Proceedings of the Forest Service National Earth Sciences Conference. San Diego, CA, 18-22 October 2007; pp.180-190.
Amatya, D.M., Trettin, C.C., 2008. An eco-hydrological project on Turkey Creek watershed, South Carolina, USA. In: Integrated Water Management: Practical Experiences and Case Studies, Meire P et al. (eds). Springer Netherlands. pp 115-126.
Anderson, M.P., 2005. Heat as a groundwater tracer. Ground Water 43(6), 951-968.
Aucott, W.R., Speiran, G.K., 1985. Ground-water flow in the coastal plain aquifers of South Carolina. Ground Water 23(6), 736-745.
Coes, A.L., Spruill, T.B., Thomasson, M.J., 2006. Multiple-method estimation of recharge rates at diverse locations in the North Carolina Coastal Plain, USA. Hydrogeol. J. doi: 10.1007/s10040-006-0123-3.
Cox, M.H., Su, G.W., Constantz, J., 2007. Heat, chloride, and specific conductance as ground water tracers near streams. Ground Water 45(2), 187-195.
Delin, G.N., Healy, R.W., Lorenz, D.L., Nimmo, J.R., 2007. Comparison of local- to regional-scale estimates of ground-water recharge in Minnesota, USA. J. Hydrol. 334, 231-249.
Fetter, C.W., 2001. Applied Hydrogeology (4th edition). Prentice-Hall, Inc. Upper Saddle River, NJ.
Fitts, C.R., 2002. Groundwater Science. Academic Press, New York.
Foulquier, A., Malard, F., Barraud, S., Gibert, J., 2009. Thermal influence of urban groundwater recharge from

stormwater infiltration basins. Hydrol. Process. 23, 1701-1713. DOI:10.1002/hyp.7305.
Foster, S.S.D., 1990. Impacts of Urbanization on Groundwater. In: Hydrological Processes and Water Management in Urban Areas (Massing H, Packman J, Zuiderma F, eds). Papers from UrbanWater 1988 Symposium at Duisburg, Germany, April 1988, pp. 187-207.
Gardner, L.R., 1981. Element mass balances for South Carolina Coastal Plain watersheds. Water, Air, and Soil Poll. 15(3), 271-284.
Genereux, D., 2004. Comparison of naturally-occurring chloride and oxygen-18 as tracers of interbasin groundwater transfer in lowland rainforest, Costa Rica. J. Hydrol. 295, 17-27.
Genereux, D.P., Jordan, M., 2006. Interbasin groundwater flow and groundwater interaction with surface water in a lowland rainforest, Costa Rica: A review. J. Hydrol. 320, 385-399.
Harder, S.V., Amatya, D.M., Callahan, T.J., Trettin, C.C., Hakkila, J., 2007. Hydrology and water budget for a forested Atlantic coastal plain watershed, South Carolina. J. Amer. Water Resour. Assoc. 43(3), 563-575.
Healy, R.W., Cook, P.G., 2002. Using groundwater levels to estimate recharge. Hydrogeol. J. 10, 91-109.
LaTorre Torres, I.B. 2008. Seasonal relationships between precipitation and stream flow patterns related to watershed characteristics of two third-order coastal plain watersheds in South Carolina. College of Charleston M.S. thesis. 206 pp.
Lerner, D.N., 2002. Identifying and quantifying urban recharge: a review. Hydrogeo. J. 10(1), 143-152.
Lewandowski, J., Lischeid, G., Nützmann, G., 2009. Drivers of water level fluctuations and hydrological exchange between groundwater and surface water at the lowland River Spree (Germany): field study and statistical analyses. Hydrol. Process. 23, 2117-2128. DOI:10.1002/hyp.7277.
Meadows, J.K., 1987. Ground-water conditions in the Santee Limestone and Black Mingo Formation near Moncks Corner, Berkeley County, South Carolina. Water Resources Commission Report #156. State of South Carolina, Columbia, SC.
Miller, J.A., 1986. Hydrogeologic framework of the Floridan aquifer system in Florida and in parts of Georgia, Alabama, and South Carolina. U.S. Geological Survey Professional Paper 1403-B. United States Government Printing Office, Washington DC.
Nachabe, M., Shah, N., Ross, M., Vomacka, J., 2005. Evapotranspiration of two vegetative covers in a shallow water table environment. Soil Sci. Soc. of Amer. J. 69, 492-499.
Newcome, R., Jr., 1989. Ground-water resources of South Carolina’s coastal plain – 1988. Water Resources
Commission Report #167. State of South Carolina, Columbia, SC.
O’Driscoll, M. 2010. Stable isotopes to quantify urban alterations to stream-groundwater interactions in the coastal plain. North Carolina Water Resources Research Institute Annual Conference, 30-31 March 2010. http://www.ncsu.edu/wrri/conference/2010ac/index.html
Pyzoha, J.E., Callahan, T.J., Sun, G., Trettin, C.C., Miwa, M., 2008. A conceptual hydrologic model for a forested Carolina bay depressional wetland on the Coastal Plain of South Carolina, USA. Hydrol. Process. 22(14), 2689-2698. doi:10.1002/hyp.6866.
Rasmussen WC, Andreasen GE. 1959. Hydrologic budget of the Beaverdam Creek Basin. US Geol. Surv. Water Suppl Paper 1472: 106 pp.
Slattery, C.M., Gares, A.P., Phillips, D.J., 2006. Multiple models of storm runoff generation in a North Carolina coastal plain watershed. Hydrol. Process. 20:2953-2969.
Sun, G., McNulty, S.G., Amatya, D.M., Skaggs, R.W., Swift, Jr, L.W., Shepard, J.P., Riekerk, H., 2002. A comparison of the watershed hydrology of coastal forest wetlands and the mountainous uplands in the Southern U.S. J. Hydrol. 263, 92-104.
Sun, G., McNulty, S.G., Lu, J., Amatya, D.M., Liang, Y., Kolka, R.K., 2005. Regional annual water yield from forest lands and its response to potential deforestation across the southeastern United States. J. Hydrol. 308, 258-268.
Wear, D.N., Greis, J.G., 2002. Southern Forest Resource Assessment. General Technical Report SRS-53. USDA Forest Service, Southern Research Station. Asheville, NC, 635 pp.
Williams, T.M., 1978. Response of shallow water tables to rainfall. In: Proceedings of the Soil Moisture and Site Productivity Symposium, W Balmer (ed.), Myrtle Beach, South Carolina, pp. 363-370.
Zhang, Y.K., Schilling, K.E., 2006. Effects of land cover on water table, soil moisture, evapotranspiration, and groundwater recharge: a field observation and analysis. J. Hydrol. 319, 328-338.