Embed Size (px)
Citation preview
THE ROLE OF HEMOZOIN IN DISEASE:
OXIDATIVE STRESS
By
Vanessa Jean Scott
Thesis
Submitted to the Faculty of the
Graduate School of Vanderbilt University
in partial fulfillment of the requirements
for the degree of
MASTER OF SCIENCE
in
Chemistry
December, 2009
Nashville, Tennessee
Approved:
Professor David W. Wright
Professor John A. McLean
ii
TABLE OF CONTENTS
Page
LIST OF FIGURES ........................................................................................................... iii
Chapter
I. HEMOZOIN IN SCHISTOSOMIASIS ...................................................................1
Introduction ..............................................................................................................1
Lifecycle of Schistosoma mansoni...........................................................................2
Hemoglobin Catabolism and Hemozoin Formation ................................................4
Structure of Hemozoin .............................................................................................6
Beta Hematin ...........................................................................................................6
Immune Response to Schistosomiasis .....................................................................7
Aims .........................................................................................................................8
II. SCHISTOSOMA MANSONI INFECTION IN A MURINE MODEL .....................9
Introduction ..............................................................................................................9
Experimental ..........................................................................................................10
Results and Discussion ..........................................................................................12
Time study of course of infection in murine model ...................................12
Isolation and characterization of hemozoin from host tissues ...................13
Conclusions ............................................................................................................16
III. DEMONSTRATION OF OXIDATIVE STRESS .................................................17
Introduction ............................................................................................................17
Experimental ..........................................................................................................17
Results and Discussion ..........................................................................................22
Proposed mechanisms of BH-mediated lipid peroxidation .......................23
BH-mediated isoketal (IsoK) formation ....................................................23
BH-mediated isoprostane (isoP) and isofurane (isoF) production .............24
Signs of stress in host tissues .....................................................................25
Demonstration of HNE in host tissues .......................................................27
Conclusions ............................................................................................................27
Appendix
A. ALTERNATIVELY ACTIVATED MACROPHAGES (AAM) ..........................28
B. MEASUREMENT OF UREA LEVELS ...............................................................31
C. PDTC INHBITION OF NO PRODUCTION ........................................................32
D. STANDARD FOR QUANTIFYING ISOK ..........................................................33
E. IMMS ANALYSIS OF HEME COMPOUNDS....................................................35
REFERENCES ..................................................................................................................37
iii
LIST OF FIGURES
Figure Page
1. Distribution of Schistosomiasis infection ................................................................1
2. Human exposure to schistosome-infected water at Lake Taabo ..............................2
3. Life cycle of Schistosoma spp..................................................................................3
4. Stacked dimers of HZ ..............................................................................................5
5. Comparison of S. mansoni infected hosts and host tissues by weight ...................13
6. UV/visible spectrum of hemozoin isolated from host liver ...................................14
7. Comparison of HZ accumulation in murine host tissues .......................................14
8. FT-IR spectrum of HZ ...........................................................................................14
9. XRD spectrum of HZ .............................................................................................14
10. SEM images of HZ ................................................................................................15
11. IsoK-pyridoxamine-lactam adduct formation ........................................................24
12. Isoprostane and Isofuran isolated from BH reactions ............................................25
13. Anti-HNE and H&E stains of host livers ...............................................................26
14. Anti-HNE and H&E stains of host spleens ............................................................26
15. Arginase pathway...................................................................................................29
16. PDTC inhibition of NO production .......................................................................32
17. BH and hemin chloride ion mobility. ....................................................................35
1
CHAPTER I
HEMOZOIN IN SCHISTOSOMIASIS
Introduction
Considered one among a number of neglected tropical diseases, schistosomiasis
continues to be one of the most widespread parasitic infections and has considerable
economic and public health consequences.1, 2
Among parasitic diseases, schistosomiasis
is second only to malaria when ranked by the number of people it kills or chronically
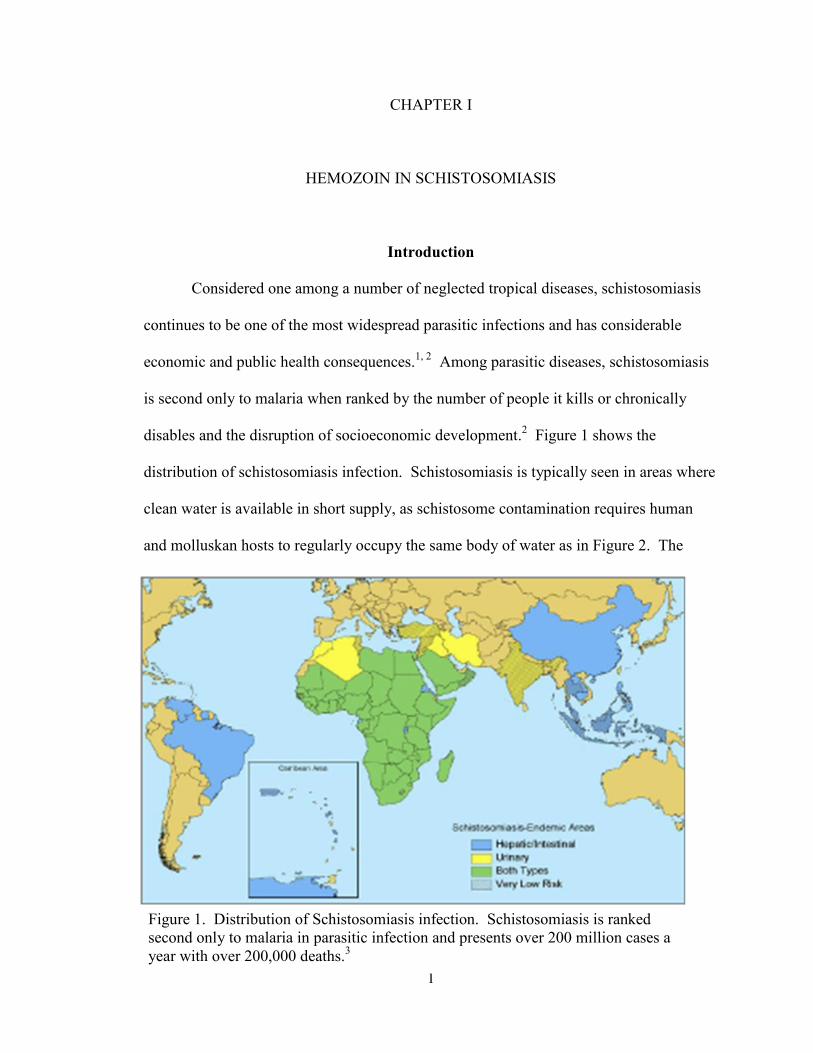
disables and the disruption of socioeconomic development.2 Figure 1 shows the
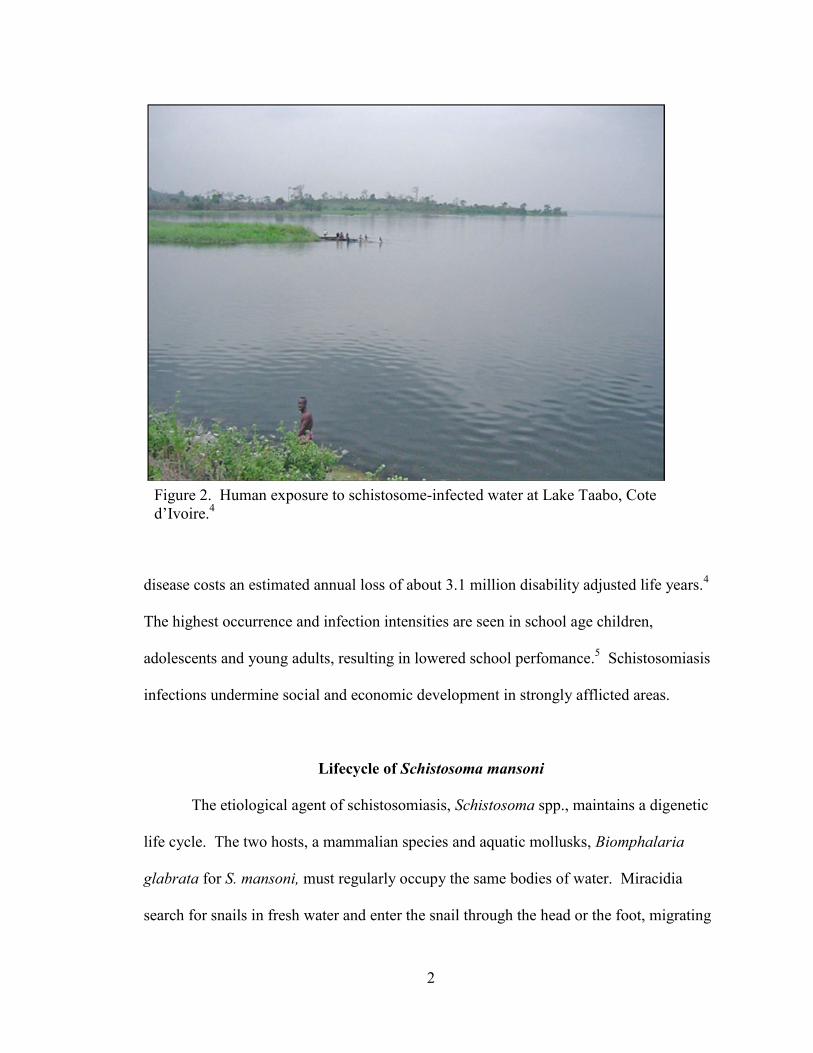
distribution of schistosomiasis infection. Schistosomiasis is typically seen in areas where
clean water is available in short supply, as schistosome contamination requires human
and molluskan hosts to regularly occupy the same body of water as in Figure 2. The
Figure 1. Distribution of Schistosomiasis infection. Schistosomiasis is ranked
second only to malaria in parasitic infection and presents over 200 million cases a
year with over 200,000 deaths.3
2
disease costs an estimated annual loss of about 3.1 million disability adjusted life years.4
The highest occurrence and infection intensities are seen in school age children,
adolescents and young adults, resulting in lowered school perfomance.5 Schistosomiasis
infections undermine social and economic development in strongly afflicted areas.
Lifecycle of Schistosoma mansoni
The etiological agent of schistosomiasis, Schistosoma spp., maintains a digenetic
life cycle. The two hosts, a mammalian species and aquatic mollusks, Biomphalaria
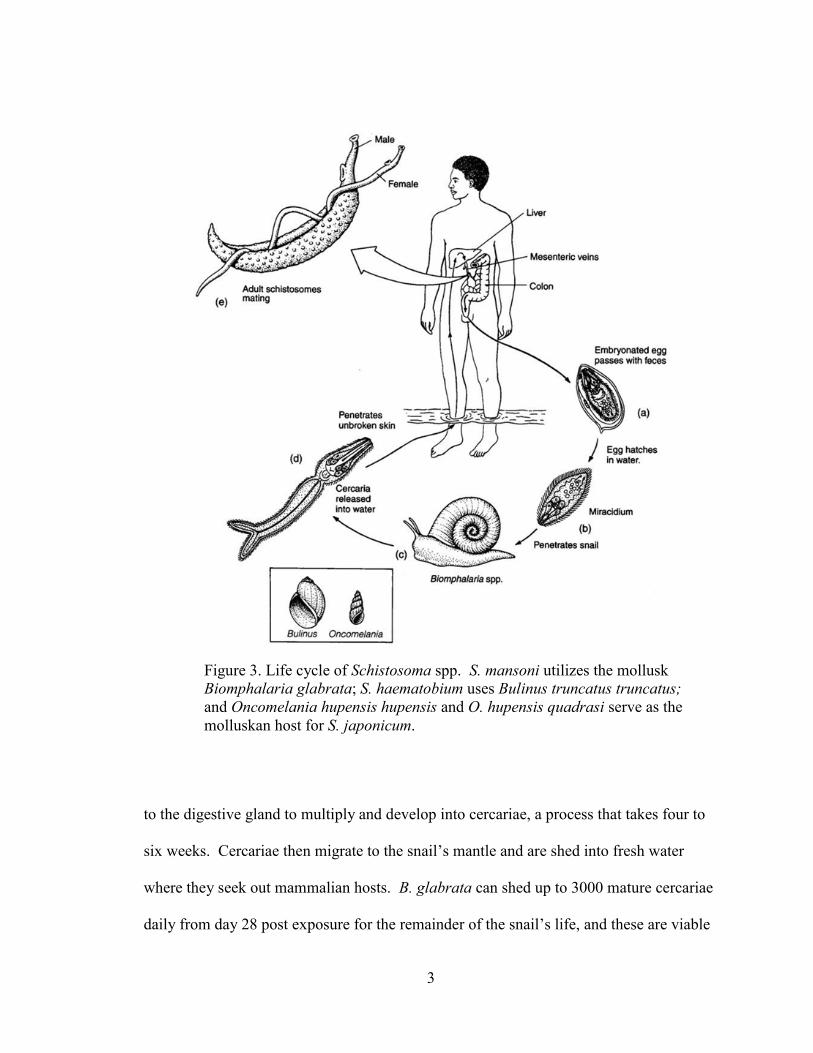
glabrata for S. mansoni, must regularly occupy the same bodies of water. Miracidia
search for snails in fresh water and enter the snail through the head or the foot, migrating
Figure 2. Human exposure to schistosome-infected water at Lake Taabo, Cote
d’Ivoire.4
3
to the digestive gland to multiply and develop into cercariae, a process that takes four to
six weeks. Cercariae then migrate to the snail’s mantle and are shed into fresh water
where they seek out mammalian hosts. B. glabrata can shed up to 3000 mature cercariae
daily from day 28 post exposure for the remainder of the snail’s life, and these are viable
Figure 3. Life cycle of Schistosoma spp. S. mansoni utilizes the mollusk
Biomphalaria glabrata; S. haematobium uses Bulinus truncatus truncatus;
and Oncomelania hupensis hupensis and O. hupensis quadrasi serve as the
molluskan host for S. japonicum.
4
in fresh water for up to 48 hours. Cercariae enter their mammalian host through
unbroken skin, losing their tails and becoming schistosomulae. The process of host
penetration is directed by chemokines and skin surface lipids.6, 7
Schistosomulae then
migrate through the vascular system to mature and take up residence in the hepatic portal
vein. Mature blood flukes of Schistosoma spp. catabolize host hemoglobin from red
blood cells at a rate of about 330,000 red blood cells (RBC) per hour for female worms
and 39,000 RBC per hour for males in order to obtain required amino acids.8 Free heme
released in this process is biomineralized to hemozoin (HZ). The stored HZ is visible in
the guts of the adult worms. Excess HZ is regurgitated into the host vasculature and
engulfed by professional phagocytes. The adult worms pair and lay eggs, up to 300 day
per female,9, 10
and these are either deposited in tissue or shed in feces. About half of the
eggs released become lodged in tissue and are responsible for damage done to those
tissues. Eggs that are excreted in fresh water release miracidia which then seek out B.
glabrata to perpetuate the parasites’ life cycle. This process is depicted in Figure 3.
Hemoglobin Catabolism and Hemozoin Formation
Hematophagous organisms, which catabolize hemoglobin for amino acids, must
evolve a mechanism to contain or detoxify free heme released during this process, as free
heme can lead to oxidative stress.11, 12
The malarial Plasmodium spp., kissing bugs of the
species Rhodnius prolixus, and blood flukes of the genus Schistosoma employ a similar
solution to this challenge. These organisms sequester free heme, ferriprotoporphyrin IX
(Fe(III)PPIX), into a biomineral consisting of centrosymmetric dimers. These dimers
form through reciprocal coordination of the propionate side chain of the individual
5
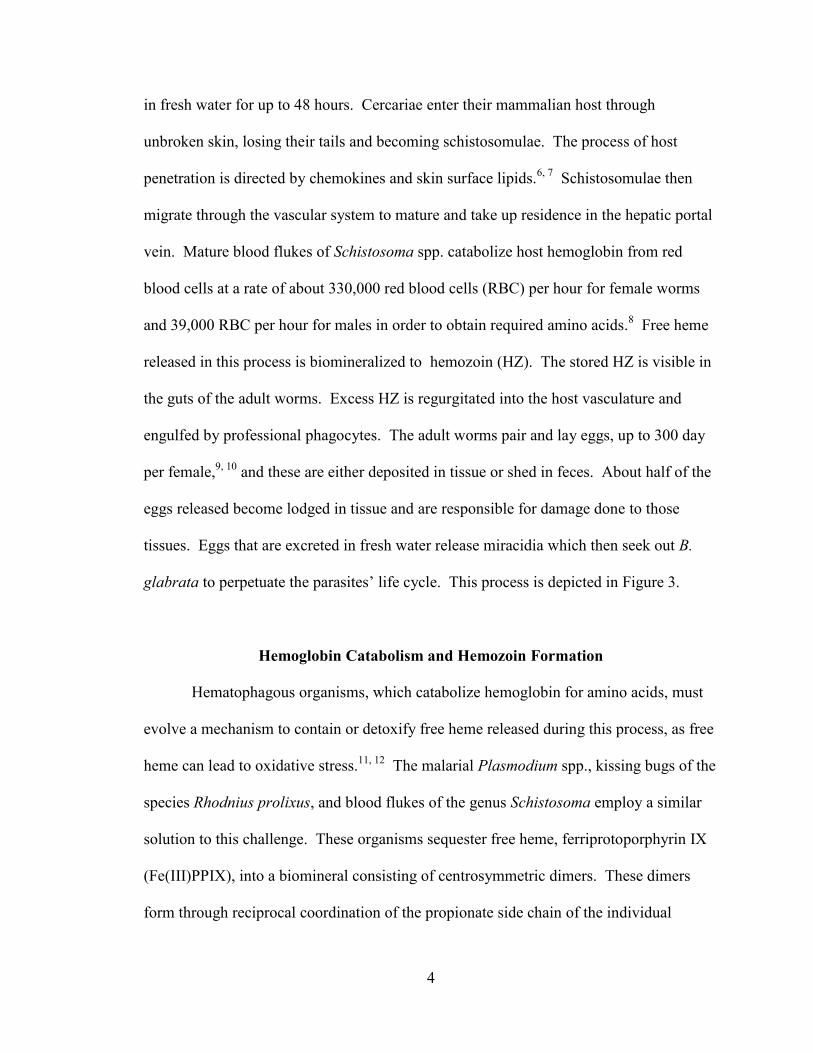
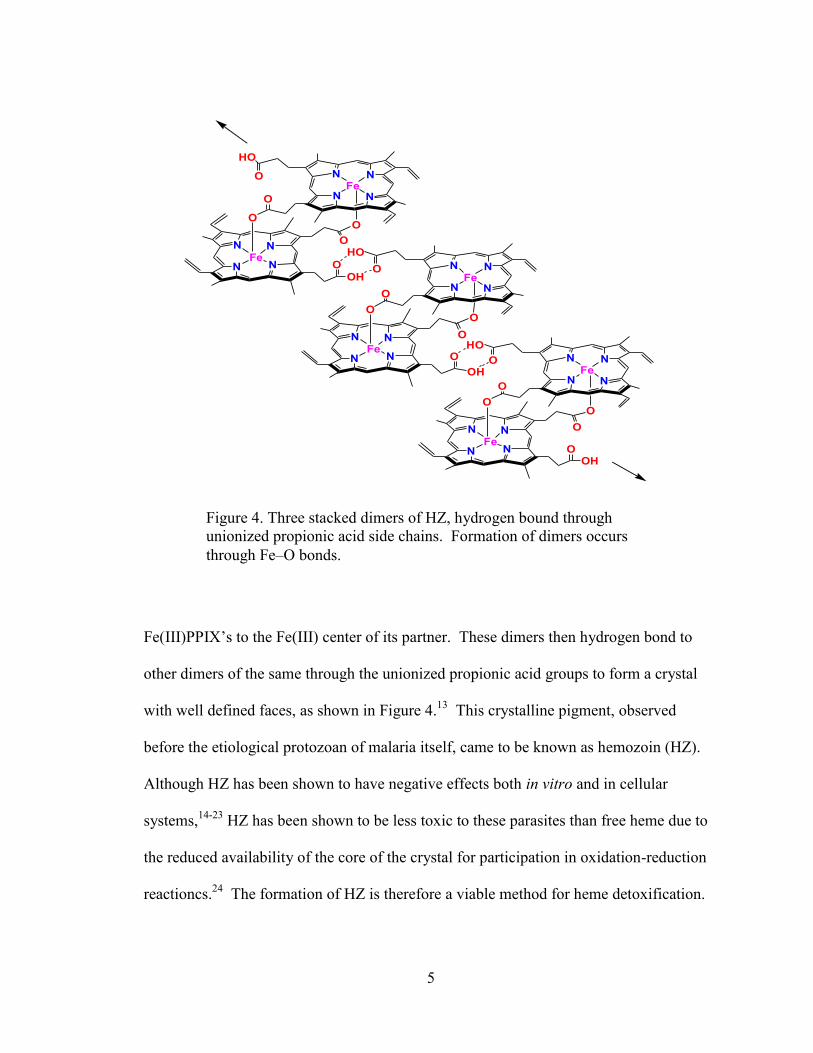
Fe(III)PPIX’s to the Fe(III) center of its partner. These dimers then hydrogen bond to
other dimers of the same through the unionized propionic acid groups to form a crystal
with well defined faces, as shown in Figure 4.13
This crystalline pigment, observed
before the etiological protozoan of malaria itself, came to be known as hemozoin (HZ).
Although HZ has been shown to have negative effects both in vitro and in cellular
systems,14-23
HZ has been shown to be less toxic to these parasites than free heme due to
the reduced availability of the core of the crystal for participation in oxidation-reduction
reactioncs.24
The formation of HZ is therefore a viable method for heme detoxification.
NN
N NO
O
FeO
N N
NN O
O
FeO
HO
OH
NN
N NO
O
FeO
N N
NN O
O
FeO
HO
OH
NN
N NO
O
FeO
N N
NN O
O
FeO
HO
OH
Figure 4. Three stacked dimers of HZ, hydrogen bound through
unionized propionic acid side chains. Formation of dimers occurs
through Fe–O bonds.
6
Structure of Hemozoin
The malarial pigment HZ was erroneously described as a hemoprotein until a
study by Fitch and Kanjananggulpan in which it was shown by extensive purification to
consist of only Fe(III)PPIX.25
This was confirmed by Slater et al. in 1991. Using
UV/visible spectroscopy, infrared spectroscopy, and extended x-ray absorption fine
structure, Slater et al. were able to show that the structure of HZ is identical to that of β-
hematin (BH), a synthetic product made from precipitation of Fe(III)PPIX in aqueous
solution with acetic acid.26
This description led to the proposal of a heme polymer,
which in turn directed the futile search for a heme polymerase. Six years later, Bohle et
al. provided further evidence that BH is indeed identical to HZ and suggested a structure
of antiparallel polymer chains.27
Finally in 2000, Pagola et al. were able to show that HZ
and BH are not polymers, but dimers bound through reciprocal iron-carboxylate linkages
of the propionate side chains of each Fe(III)PPIX.13
β-Hematin
As native hemozoin (HZ) is available in exceptionally limited quantities and only
at a cost of organism life or health, synthetic hemozoin or β-hematin, is utilized in many
studies. Crude HZ is defined as pigment that is isolated from parasitized erythrocytes
and, although it may be washed to remove cellular debris, the lipid coat adsorbed onto the
hydrophobic porphyrin plane is left intact; whereas purified hemozoin is that which has
had the lipid coat removed during more intense washing with a detergent or organic
solvent.26, 28, 29
Finally, synthetic hemozoin, BH is synthesized in vitro from hemin
chloride and is devoid of all biologically derived components.22, 30
Characterization of
7
BH has demonstrated that the material is chemically, spectroscopically, and
crystallographically identical to HZ.13, 25-27
Immune Response to Schistosomiasis
While the contribution of HZ to pathology in malaria has proposed,14-17, 20, 22, 31-33
its role in schistosomiasis has been largely overlooked. Studies of pathology in
schistosomiasis have concentrated mostly on egg deposition, granuloma formation, and
adaptive immune response. The role of HZ in schistosomiasis pathology has been
minimally examined. It is the goal of this research to show that HZ has pathological
implications in schistosomal infection.
HZ has been shown in malaria to act as a potent immunomodulatory agent. When
HZ is phagocytosed by monocytes, these cells become impaired, their ability to
accomplish subsequent phagocytic challenges hindered.14, 15, 20, 34
Phagocytes also have
difficulty breaking down HZ; indeed, it can be detected in tissue for at least nine months
post parasite clearance.15, 35
HZ fed monocytes remain viable cells, but become unable to
generate oxidative burst with appropriate stimulation14, 15
and show decreased aptitude for
killing ingested microbes.36
These cells produce less reactive oxygen and nitrogen
species, whose purpose is to attack invading particles.15, 22, 23, 37
HZ has been shown to
reduce function of protein kinase C in human monocytes.16, 17, 32
It has also been shown
to affect MHC class II expression16
and damage dendritic cell function.38, 39
The presence
of HZ has been shown to coincide with products of lipid oxidation.17, 19, 40
One of the most examined sources of pathology in schistosomiasis is granuloma
formation.41
A mild type 1 helper T cell (Th1) response occurs in response to adult
8
parasite antigens. However, when oviposition occurs, this is overshadowed by a vigorous
type 2 helper (Th2) response to egg-derived antigen, resulting in fibrogenesis.42-44
The
chronic form of schistosomiasis is characterized by this persistent inflammatory Th2 type
reaction leading to granuloma formation.45, 46
Granulomas form when eggs laid by adult
worm pairs get trapped in the microvasculature of the liver. The embryonic miracidium
secrete antigens through microscopic pores in the rigid shell of the egg.47
These egg-
derived antigens elicit a response from T helper cells (Th).44, 48
Phagocytes attack these
egg depositions. These phagocytes are too small to engulf whole schistosome eggs, and
usually die trying to attack these eggs. More phagocytes attend the site of infection, and
the area around the egg becomes dense with expired immune cells. These granulomas
demonstrate inflammation, tissue eosinophilia, and collagen deposition, leading to portal
hypertension and severe hepatic fibrosis.41, 42
Thus, granuloma formation during
schistosomiasis is generally looked upon as the fundamental pathological event; however,
it has also been shown that granulomas also function to protect tissues from oxidative
damage.49
Aims
It is the goal of this work to demonstrate that hemozoin contributes to the
pathology of Schistosomiasis through the addition of oxidative stress. Chapter II
examines the course of the disease using a murine model. Chapter III details products
indicative of oxidative stress that can be made in vitro in the presence of BH or that have
been found in infected tissues.
9
CHAPTER II
SCHISTOSOMA MANSONI INFECTION IN A MURINE MODEL
Introduction
The murine model offers a uniquely qualified examination of the course of
infection of Schistosomiasis and the immune response that is in many ways reflective of
these features in human infection. A murine model has been used previously to
demonstrate the ability of S. mansoni to induce hepatic oxidative stress via the production
of reactive oxygen species50
and reduce antioxidant defense mechanisms of host tissue.51
Because the course of infection in mice is similar to that in man, it is a useful tool for
studying the disease. Thus a time study was embarked upon in order to investigate
physiological changes and HZ accumulation over the course of infection by S. mansoni.
Native HZ and its synthetic analogue, β-hematin (BH) are identical in structure,
but differ dramatically in their availability for collection and surrounding chemical
environment. Until recently, the chemical environment of HZ in the parasite and its host
remained a mystery largely due to the rigors of extraction and limited sample sizes.
Furthermore, BH does not show the same immunomodulatory effects that native HZ does
and so, although easier to obtain, is less reliable for HZ host-pathogen studies.40
Schistosomal HZ has previously been isolated from worms perfused from the hepatic
portal vein of host Swiss Webster mice.52, 53
Methods of isolation of HZ from host liver
tissue have been described by Pandey et. al.54
and from host blood by Deegan and
Maegraith.55, 56
10
Experimental
Materials
Schistosoma mansoni infected Swiss Webster mice were obtained from the
Biomedical research instituted in Rockville, MD. Sodium bicarbonate, monobasic
sodium phosphate, dibasic sodium phosphate, sodium hydroxide and dimethyl sulfoxide
(DMSO) were obtained from Fisher. Sodium dodecyl sulfate and lipopolysaccharide
(LPS) were obtained from Sigma. Anhydrous methyl alcohol, and 2,6-lutidine were
obtained from Acros. Dulbecco’s phosphate buffered saline (PBS) and RPMI 1640
media with 2 g/L sodium bicarbonate were obtained from Gibco. 4-hydroxy-2-nonenal
(HNE) was purchased from Calbiochem. All chemicals were used as received unless
otherwise noted.
Time Study
A time study was performed in which 60 Swiss Webster mice were infected by
tail exposure to 150 cercariae. Mice were euthanized and examined at 4, 5, 6, 7, and 8
weeks post infection. Control mice were euthanized and examined at the same time as
week 8 mice. The adult schistosomes were perfused from the hepatic portal vein,
separated by sex and counted. HZ was later extracted from the worms. At the time of
perfusion, host spleens and livers were removed, rinsed, weighed, flash frozen in liquid
nitrogen and stored at -80°C. Tissues were homogenized and examined for HZ content.
Thin tissue sections were stained with hematoxylin and eosin (H&E) and analyzed for
lipoxidation products.
11
Isolation, Characterization, and Measuring of HZ from tissues
HZ was extracted from the livers and spleens collected in the time study. Organs
were individually homogenized using Wheaton 15 mL glass homogenizers. The
homogenate was rinsed with deionized water into individual 50 mL polypropylene tubes
and centrifuged at 1000 x g for 1 minute. The supernatant was removed and centrifuged
at 3900 x g for 2 hours. The supernatant was discarded and the pellet rinsed in 1 mL of
150 mM phosphate buffer, pH 7.4 (28.5 mL of 0.2 M monobasic sodium phosphate,
NaH2PO4•H2O, with 121.5 mL of 0.2 M dibasic sodium phosphate, Na2H2PO4•7H2O,
diluted to 200 mL). The pellet was vortexed slightly and light colored tissue was
removed along with phosphate buffer. 500 μL of 150 mM phosphate buffer and 500 μL
of ethyl acetate were added to the remaining dark pellet. The pellet was vortexed,
centrifuged at 1000 x g for 1 min, and the supernatant removed. This last step was
repeated until supernatant appeared clear. The alleged HZ pellet was dried under
nitrogen gas and confirmed via UV/visible spectroscopy (UV/vis), Fourier-transform
infrared spectroscopy (FT-IR), powder x-ray diffraction (XRD) and scanning electron
microscopy (SEM).
Dried HZ from host organs was ground using mortar and pestle, mixed with dry
KBr and pelleted using a hydraulic press for FT-IR. Dried HZ from host organs was
ground using mortar and pestle and analyzed by XRD on a Scintag X1 h/h automated
powder diffractometer with a copper target, a Peltier-cooled solid-state detector and a
zero-background silica (510) sample support. in a 12 hour run. SEM samples were
dissolved in ethanol, dried to SEM mounts, and gold-sputtered for 200 seconds before
imaging on a Hitachi S-4200 SEM.
12
HZ collected from the time study was quantified using a method based on that
described by Sullivan.57
HZ was scraped from 50 mL polypropylene tube into a mortar
and pestle where it was ground to a fine powder. The sample was then rinsed back into
the same polypropylene tube with 10 mL of 150 mM phosphate buffer, pH 7.4. The
mixture was then sonicated and vortexed immediately before pipetting 500 μL of solution
into 500 μL of 20 mM NaOH, 2%SDS to dissolve HZ into individual heme units. The
mixture was allowed to sit for 1 hour before the absorbance was read at λ = 400 nm. The
resultant concentration of heme was determined using Beer’s law and ε = 10,000 for
heme. This was repeated for 5 livers and spleens from hosts for weeks 4 through 8 of the
time study.
Results and Discussion
Time study of course of infection in murine model
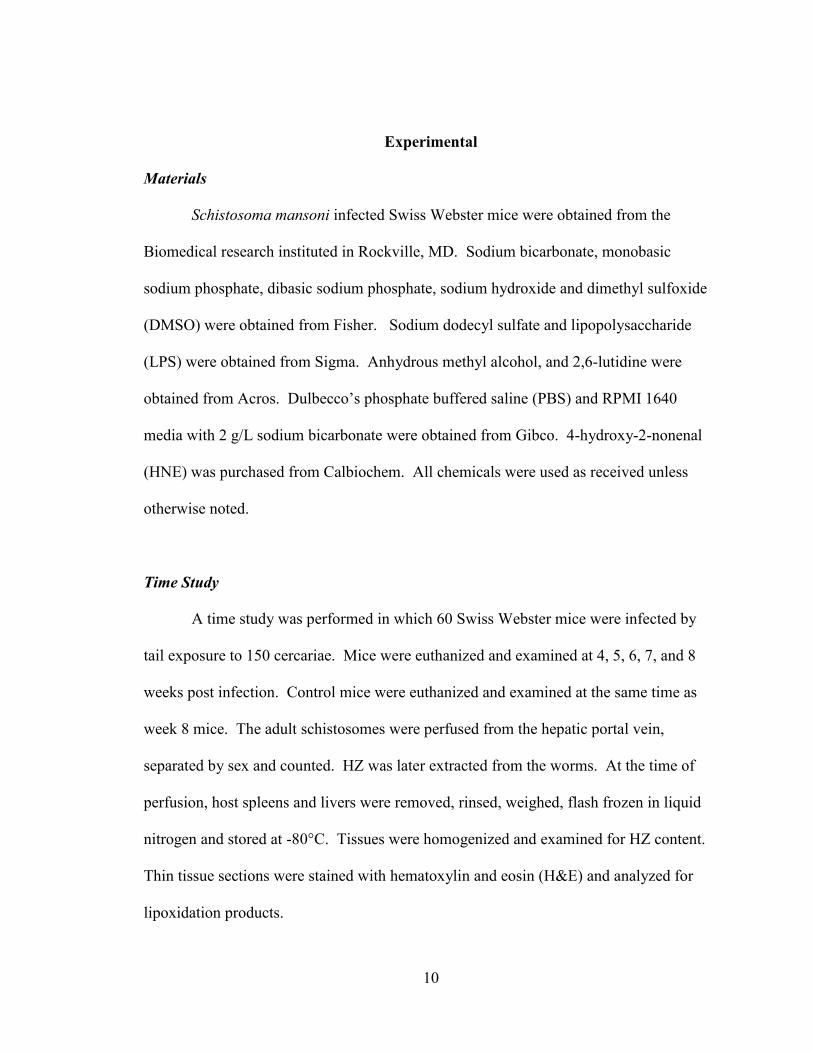
Over the eight weeks encompassed by the time study, the livers of infected mice
were shown to more than double in size, increasing from 5% of body weight for
uninfected mice to more than 15% of total body weight by week 8 of infection. The size
of the spleen increased in a similar manner from 0.4% to about 3% of the total body
weight. The overall body weight of the infected mice was the same or lower than control
mice at eight weeks, indicating that the increased weight of the inflamed organs was
accompanied by decreased overall mouse body weight. Worm recovery via perfusion of
the hepatic portal vein averaged about 22% of cercarial infection, with a peak worm
recovery seen at week six.
13
Isolation and characterization of hemozoin from host tissues
Structurally, chemically, and spectroscopically, the HZ isolated from murine
tissues appears identical to all previously identified forms, including BH and malarial
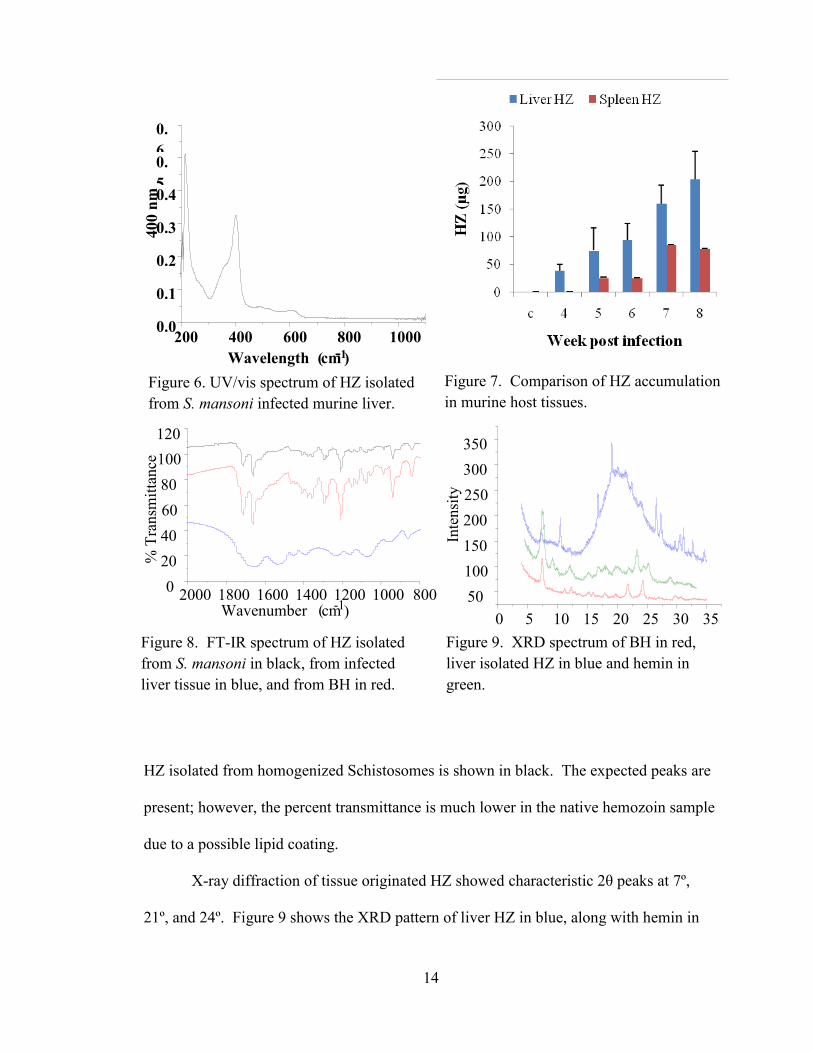
pigment. The UV/vis spectrum of liver isolated HZ in Figure 6 shows the characteristic
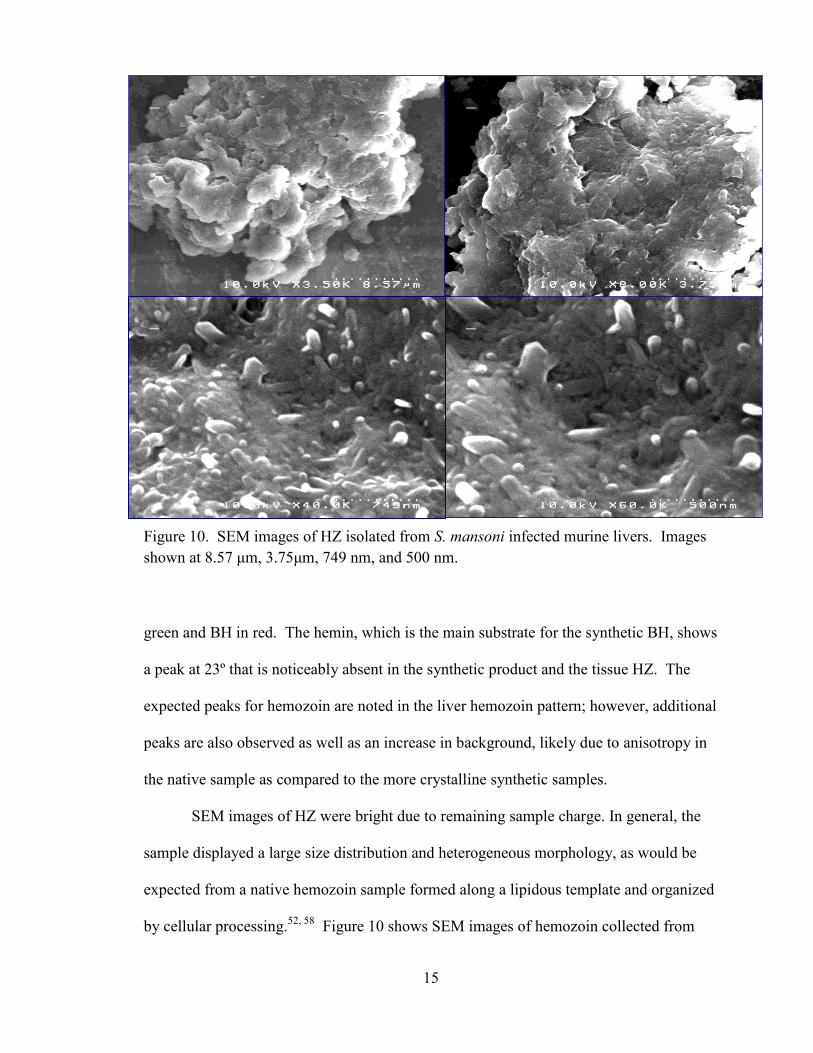
Soret band at 400 nm for heme. Average HZ content per organ per week is compared in
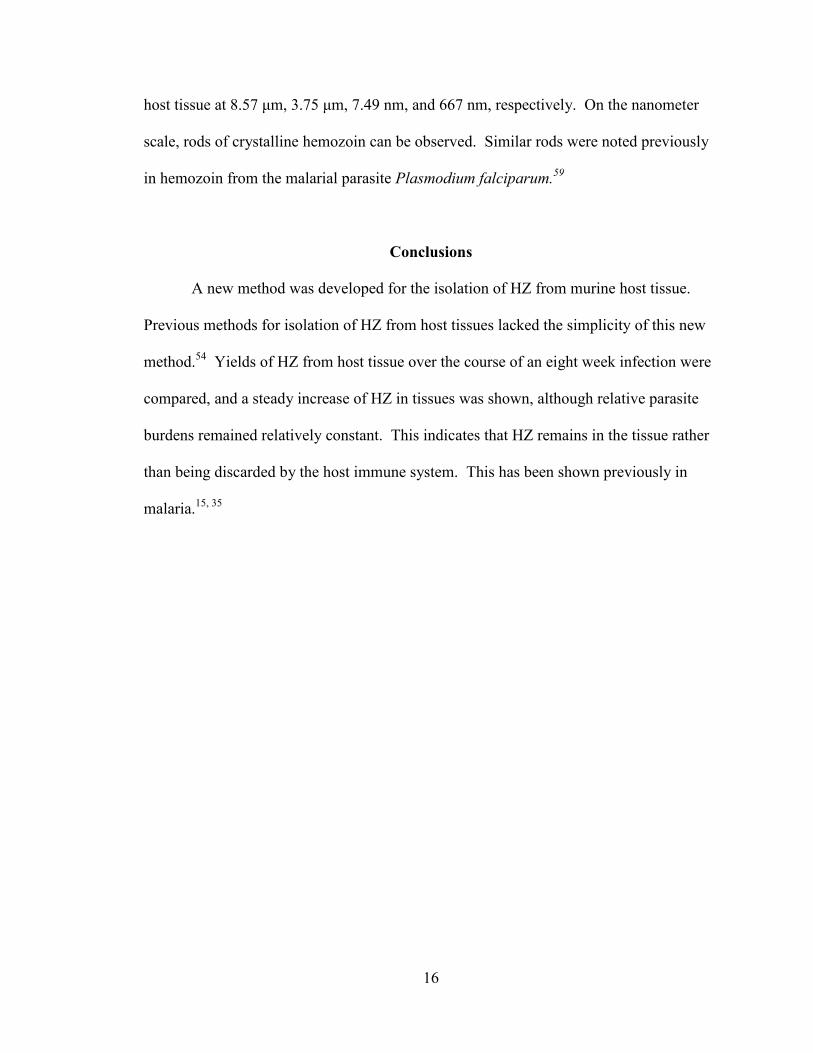
Figure 7. The FT-IR spectrum, depicted in Figure 8, showed stretches at 1659 cm-1
and
1235 cm-1
; the accepted values are 1664 and 1211 cm-1
for C=O and C—O, respectively.
In Figure 8, the liver homogenate hemozoin is shown in blue, BH is shown in red, and
C 4 5 6 7 8
0.0
0.5
1.0
1.5
Week Post-Infection
Sp
leen
Wei
gh
t (g
)
Week Post-Infection
C 4 5 6 7 8
0
2
4
6
8
Liv
er W
eigh
t (g
)
Figure 5. Comparison of S. mansoni infected hosts and host tissues by weight over course
of infection.
0 4 5 6 7 8
0
10
20
30
40
50
Week Post-Infection
Mou
se W
eigh
t (g
)
14
HZ isolated from homogenized Schistosomes is shown in black. The expected peaks are
present; however, the percent transmittance is much lower in the native hemozoin sample
due to a possible lipid coating.
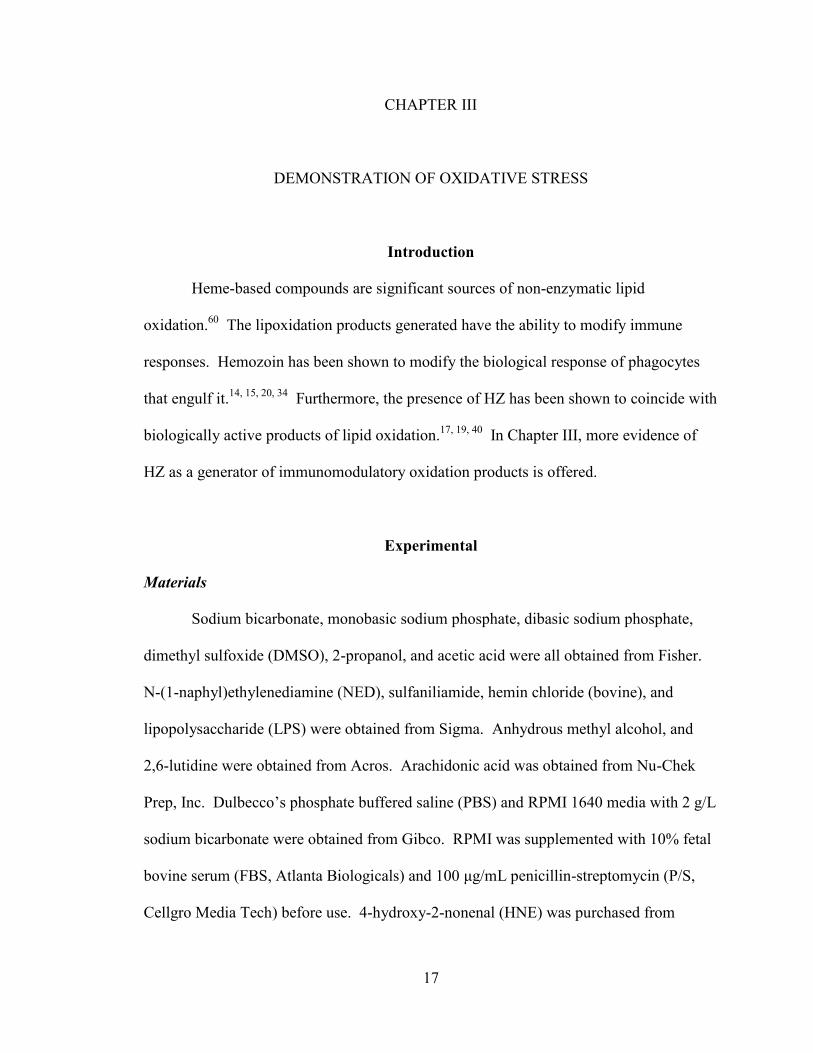
X-ray diffraction of tissue originated HZ showed characteristic 2θ peaks at 7º,
21º, and 24º. Figure 9 shows the XRD pattern of liver HZ in blue, along with hemin in
200 400 600 800 1000 0.0
0.1
0.2
0.3
0.4
0.
5
0.
6 400 n
m
Wavelength ( cm -1 )
Figure 6. UV/vis spectrum of HZ isolated
from S. mansoni infected murine liver.
Figure 7. Comparison of HZ accumulation
in murine host tissues.
2000 1800 1600 1400 1200 1000 800 0
20
40
60
80
100
120
% T
ransm
itta
nce
Wavenumber ( cm -1
Figure 8. FT-IR spectrum of HZ isolated
from S. mansoni in black, from infected
liver tissue in blue, and from BH in red.
) 0 5 10 15 20 25 30 35
50
100
150
200
250
300
350 In
tensi
ty
Figure 9. XRD spectrum of BH in red,
liver isolated HZ in blue and hemin in
green.
15
green and BH in red. The hemin, which is the main substrate for the synthetic BH, shows
a peak at 23º that is noticeably absent in the synthetic product and the tissue HZ. The
expected peaks for hemozoin are noted in the liver hemozoin pattern; however, additional
peaks are also observed as well as an increase in background, likely due to anisotropy in
the native sample as compared to the more crystalline synthetic samples.
SEM images of HZ were bright due to remaining sample charge. In general, the
sample displayed a large size distribution and heterogeneous morphology, as would be
expected from a native hemozoin sample formed along a lipidous template and organized
by cellular processing.52, 58
Figure 10 shows SEM images of hemozoin collected from
Figure 10. SEM images of HZ isolated from S. mansoni infected murine livers. Images
shown at 8.57 μm, 3.75μm, 749 nm, and 500 nm.
16
host tissue at 8.57 μm, 3.75 μm, 7.49 nm, and 667 nm, respectively. On the nanometer
scale, rods of crystalline hemozoin can be observed. Similar rods were noted previously
in hemozoin from the malarial parasite Plasmodium falciparum.59
Conclusions
A new method was developed for the isolation of HZ from murine host tissue.
Previous methods for isolation of HZ from host tissues lacked the simplicity of this new
method.54
Yields of HZ from host tissue over the course of an eight week infection were
compared, and a steady increase of HZ in tissues was shown, although relative parasite
burdens remained relatively constant. This indicates that HZ remains in the tissue rather
than being discarded by the host immune system. This has been shown previously in
malaria.15, 35
17
CHAPTER III
DEMONSTRATION OF OXIDATIVE STRESS
Introduction
Heme-based compounds are significant sources of non-enzymatic lipid
oxidation.60
The lipoxidation products generated have the ability to modify immune
responses. Hemozoin has been shown to modify the biological response of phagocytes
that engulf it.14, 15, 20, 34
Furthermore, the presence of HZ has been shown to coincide with
biologically active products of lipid oxidation.17, 19, 40
In Chapter III, more evidence of
HZ as a generator of immunomodulatory oxidation products is offered.
Experimental
Materials
Sodium bicarbonate, monobasic sodium phosphate, dibasic sodium phosphate,
dimethyl sulfoxide (DMSO), 2-propanol, and acetic acid were all obtained from Fisher.
N-(1-naphyl)ethylenediamine (NED), sulfaniliamide, hemin chloride (bovine), and
lipopolysaccharide (LPS) were obtained from Sigma. Anhydrous methyl alcohol, and
2,6-lutidine were obtained from Acros. Arachidonic acid was obtained from Nu-Chek
Prep, Inc. Dulbecco’s phosphate buffered saline (PBS) and RPMI 1640 media with 2 g/L
sodium bicarbonate were obtained from Gibco. RPMI was supplemented with 10% fetal
bovine serum (FBS, Atlanta Biologicals) and 100 μg/mL penicillin-streptomycin (P/S,
Cellgro Media Tech) before use. 4-hydroxy-2-nonenal (HNE) was purchased from
18
Calbiochem. HNE immunohistochemical staining reagents were purchased from R&D
Systems. Packed red blood cells (RBC) were a donation from the VUMC Blood Bank.
All chemicals were used as received unless otherwise noted.
β-Hematin (BH) synthesis and characterization
BH was synthesiszed via a dehdrohalgenation reacton as previously described.30,
40 Purified hemin chloride (Fluka, 3.0 g) was dissolved in 5 mL of 2,6-lutidine with
stirring under an inert atmosphere. Forty mL of 1:1 dimethylsulfoxide (DMSO)
/anhydrous methanol was added to the flask with stirring. The flask was sealed, covered
in foil, and left undisturbed for ninety days. The solution was then removed from the
glove box and crude BH was collected via vacuum filtration with a 0.45 μm filter. BH
was washed with methanol (MeOH), DMSO 0.1 M sodium bicarbonate (NaHCO3, pH
9.0), and deionized water. BH purity was monitored with UV-visible spectroscopy
established by baseline absorption of the Soret band for heme in the supernatant of the
washes. BH was then dried for 48 hours at 150˚C. Product was confirmed by powder X-
ray diffraction (XRD), Fourier Transform Infrared Spectroscopy (FT-IR), and scanning
electron microscopy (SEM). XRD studies were performed with a Scintag X1 h/h
automated powder diffractometer with a copper target, a Peltier-cooled solid-state
detector and a zero-background silica (510) sample support. XRD study parameters were
as follows: 0.02 step size, 25 second preset time, scan range 4 to 35˚ 2θ. FT-IR
spectroscopy was performed on an ATI Mattson Genesis Series FT-IR spectrophotometer
using KBr pellets prepared with dried BH. A Hitachi S4200 SEM was used to image BH.
BH was suspended in ethanol, sonicated, applied to a polished aluminum specimen
19
mount, and dried at 25˚ C overnight. The sample was sputter-coated with gold for 20
seconds prior to imaging.
BH-mediated isoketal (IsoK) formation
Arachidonic acid (AA, 10 mM) was oxidized in 1.25 mL of 100 mM phosphate
buffer (chelexed, pH 7.4) in the presence of BH at concentrations of 0.48, 0.36, 0.24, 0.12
and 0.00 mM. 250 μL of ethanol was added to the reaction mixture to aid in solublizing
AA. The reaction was stirred for two hours at room temperature before 100 μM
pyridoxamine dihydrochloride was added. The reaction continued to stir at room
temperature for two more hours. Reaction mixtures were extracted with diethyl ether.
The organic layers of each sample were combined and dried down. The samples were
then redisovled in 50μL of acetonitrile.
Liquid chromatography-tandem mass spectrometry (LC-MS/MS)
LC-MS/MS analysis of isoketal products was performed using a ThermoFinnigan
TSQ Quantum triple quadruple equipped with a ThermoFinnigan Surveyor LC. Products
were separated on a Magic Bullet C18AQ micro column (3 μm, 100 Å, Michrom
BioResources, Auburn, CA) with the gradient programmed from 100% solvent A (5 mM
ammonium acetate with 0.1% acetic acid) to 100% solvent B (acetonitrile/methanol 95:5)
from 0.5 minutes to 3 minutes and then continuing at 100% B for an additional 1.5
minutes. The column was then equilibrated to 100% A for 2.5 minutes. The flow rate
was set to 190 μL/min and the injection volume was 5 μL. The mass spectrometer was
operated in positive ion mode with a spray voltage of 3.7 kV, a capillary temperature of
20
210˚C, a capillary voltage of 35 V, source CID of 5 V, and collision energy of 30 eV.
Product scan spectra of the isoketal-pyridoxamine-lactam adduct ([M+H+]) m/z 501 were
acquired from 50 m/z to 520 m/z. Selective reaction monitoring (SRM) was used to
confirm m/z 501→m/z 152 and m/z 332 transitions, calculated as -17 Da from the parent
isoketal-pyridoxamine-lactam mass. Data was acquired and analyzed using Thermo-
Finnigan Xcalibur software.
Isoprostanes from BH-mediated ghost membrane peroxidation
RBC ghosts were prepared from expired whole blood obtained from the
Vanderbilt Medical Center Blood Bank. Whole blood was kept at 4˚C until use and
mixed inside the bag before use. A 22 gauge needle fitted to a disposable syringe was
used to draw 3 mL of whole blood which was then expelled into a 15 mL polypropylene
centrifuge tube. 11 mL of phosphate buffered saline (PBS) was added and the tube was
gently inverted to mix. The solution was then centrifuged on a Beckman Coulter Allegra
x-22R centrifuge at 1000 xg for 10 minutes in the Beckman SX4250 swing bucket rotor.
The supernatant was discarded in bleach, and this wash was repeated until the supernatant
appeared clear. The RBCs were then lysed by dissolving the pellet in 0˚C 5 mM sodium
phosphate buffer in 50 mL polypropylene tubes and vortexing. The solution was then
centrifuged at 10,000 xg using the fixed angle Beckman C0650 rotor. The supernatant
was discarded, and this wash was repeated until no trace of red could be seen in the
membrane pellet. The pellet was then dissolved in a minimum amount of PBS and
aliquoted to be stored at -80˚C. A Biorad assay was used to determine the protein content
of the final solution. Briefly, standards were made with bovine serum albumin from 1.5
21
mg/mL to 0.2 mg/mL. 5 μL of standards and samples were pippetted into a clean, dry 96
well plate. 25 μL of Bio-rad reagent A, an alkaline copper tartrate solution, were added
to each sample followed by 200 μL of reagent B, a dilute 1,2-naphthoquinone-4-sulfonate
solution. The plate was allowed to sit for 15 minutes, after which the absorbance was
read at 750 nm. RBC ghosts were used for reactions at protein concentrations of 1
mg/mL, as determined by the Biorad Protein assay.
RBC ghosts were stirred in the presence of oxygen with ethanol, 10 mM BH,
arachidonic acid, and phosphate buffer quantity sufficient to 800 μL for four hours before
the reaction was stopped with 50 μL of 1 M HCl. The samples were then immediately
delivered to the lab of L. Jackson Roberts for isoprostane analysis.
Stains of S. mansoni infected murine tissues
Livers and spleens from the time study mentioned above were affixed to glass
slides by the Vanderbilt University Immunohistochemistry core. Thin sections were
sliced at a thickness of 5 μm. Two stains were made, hematoxylin and eosin (H&E)
stains were used to examine cell morphology. 4-hydroxy-2-nonenal (HNE) stains were
used to verify the presence of elevated levels of HNE in infected tissue. Staining for 4-
hydroxynonenal was done using an anti-HNE monoclonal antibody from R & D Systems
and a R & D Systems cell and tissue staining kit. The sample was covered with 2 drops
of a 3% peroxide solution to block peroxidase. The reagent did not readily sit on the
paraffin sealed tissue section and so was held in place with a glass cover slide. The
sample sat in peroxidase blocking reagent for 5 minutes followed by a 5 minute wash
with phosphate buffered saline solution (PBS). The slide was then incubated with 2
22
drops of serum blocking reagent for 15 minutes. The slide was drained, but not rinsed,
and then incubated with 2 drops of an avidin solution containing 0.1% sodium azide. The
slide was then rinsed with sterile PBS, drained and excess buffer blotted from the sample.
The slide was then incubated with 2 drops of a biotin blocking reagent for 15 minutes at
room temperature. The slide was then rinsed with buffer and incubated at 37°C with 25
μL of the primary antibody, monoclonal anti-4-hydroxynonenal, at 25 μg/mL for 1 hour.
The sample was rinsed with buffer 3 times for 15 minutes each wash. The slide was then
incubated with 2 drops of biotinylated secondary antibody for 60 minutes at 37°C.
Following another 3 fifteen minute washes with PBS, the slide was incubated with 2
drops of a high sensitivity streptavidin horse radish peroxidase conjugate for 30 minutes
at 37°C. After another 3 cycle PBS wash, 2 minute each wash, the slide was then blotted
to remove excess buffer. The slide was then treated with 25 μL of a chromogen, a 2% 3-
amino-9-ethylcarbazole solution mixed with a 0.1% peroxide solution to activate. The
slide was incubated with this chromogen for 1 hour and 20 minutes at 37°C. This process
was repeated for livers and spleens collected from the time study for weeks 4, 5, 6, 7, and
8 post infection as well as controls. Images were obtained on an Olympus BH2-RFCA
light microscope coupled with and Olympus DP70 camera.
Results and Discussion
This thesis seeks to implement hemozoin as a source of oxidative stress in
schistosomiasis. To that effect, the ability of HZ to generate oxidative stress markers in
vitro was examined. Also the detection of an oxidative stress marker in host tissues
coinciding with HZ tissue deposits is disclosed.
23
Proposed mechanisms of BH-mediated lipid peroxidation
Mechanisms associated with non-enzymatic arachidonic acid peroxidation result
in primary hydroperoxide species which differ by the location of that group along the
carbon backbone. These are known as n-hydroperoxyeicosatetraenonic acids (n-
HPETEs), where the number replacing n identifies the position of the hydroperoxide
moiety. These primary peroxidation products are generally short lived and lead to many
secondary peroxidation products, including notably isoprostanes, isoketals, and 4-
hydroxynonenal, along with many others.
BH-mediated isoketal (IsoK) formation
IsoKs are 1,4-dicarbonyl compounds that are known markers of oxidative stress.61
They readily adduct to proteins at lysine residues, resulting in pyrrole, lactam, and
hydroxylactam adducts. Due to their labile nature, isoKs are short-lived as products. To
that effect, the scavenger molecule pyridoxamine was added to these reactions for the
purpose of detection via LC-MS/MS. Pyridoxamine has been shown to react quickly and
selectively with isoKs.62
The isoK-pyridoxamine-lactam adduct was observed as a parent
501 m/z with transitions to 152 m/z and 332 m/z products.
24
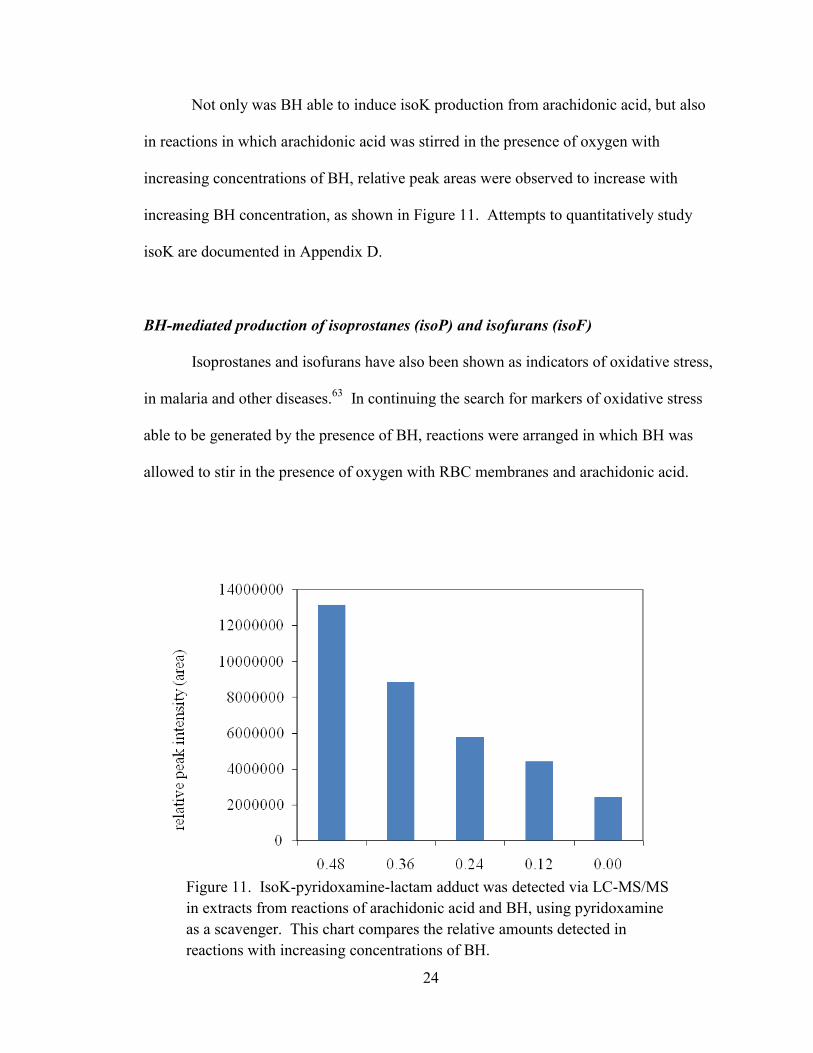
Not only was BH able to induce isoK production from arachidonic acid, but also
in reactions in which arachidonic acid was stirred in the presence of oxygen with
increasing concentrations of BH, relative peak areas were observed to increase with
increasing BH concentration, as shown in Figure 11. Attempts to quantitatively study
isoK are documented in Appendix D.
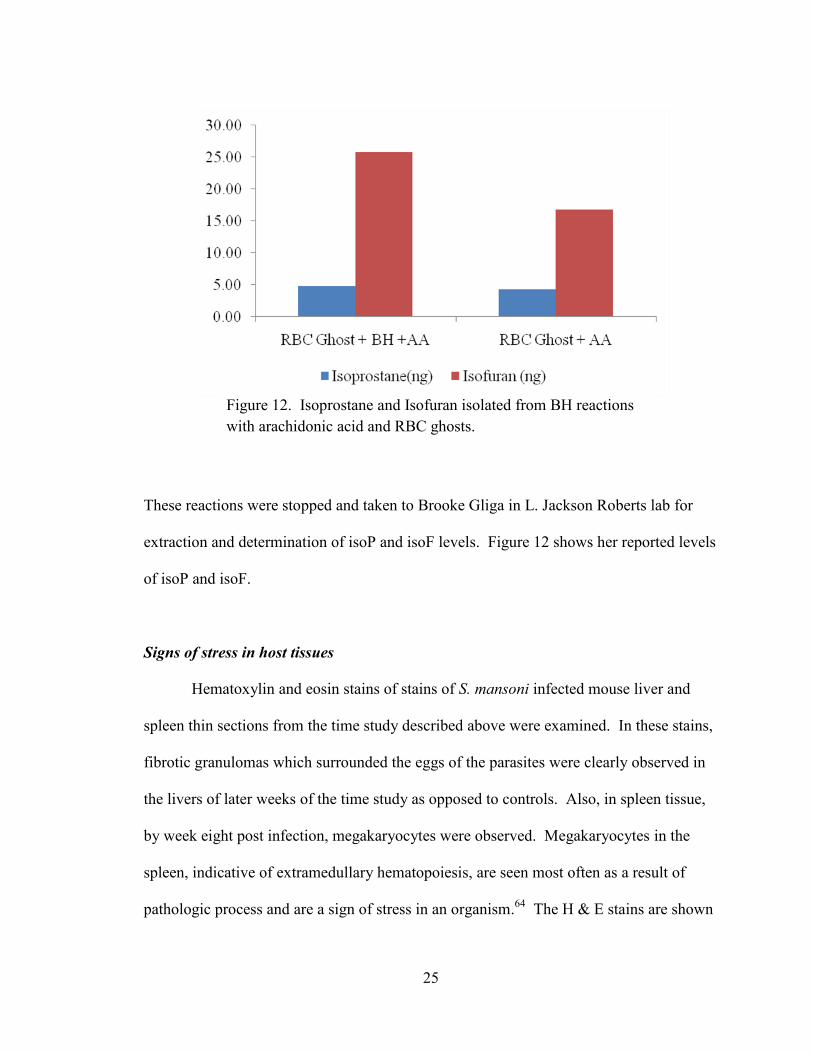
BH-mediated production of isoprostanes (isoP) and isofurans (isoF)
Isoprostanes and isofurans have also been shown as indicators of oxidative stress,
in malaria and other diseases.63
In continuing the search for markers of oxidative stress
able to be generated by the presence of BH, reactions were arranged in which BH was
allowed to stir in the presence of oxygen with RBC membranes and arachidonic acid.
Figure 11. IsoK-pyridoxamine-lactam adduct was detected via LC-MS/MS
in extracts from reactions of arachidonic acid and BH, using pyridoxamine
as a scavenger. This chart compares the relative amounts detected in
reactions with increasing concentrations of BH.
25
These reactions were stopped and taken to Brooke Gliga in L. Jackson Roberts lab for
extraction and determination of isoP and isoF levels. Figure 12 shows her reported levels
of isoP and isoF.
Signs of stress in host tissues
Hematoxylin and eosin stains of stains of S. mansoni infected mouse liver and
spleen thin sections from the time study described above were examined. In these stains,
fibrotic granulomas which surrounded the eggs of the parasites were clearly observed in
the livers of later weeks of the time study as opposed to controls. Also, in spleen tissue,
by week eight post infection, megakaryocytes were observed. Megakaryocytes in the
spleen, indicative of extramedullary hematopoiesis, are seen most often as a result of
pathologic process and are a sign of stress in an organism.64
The H & E stains are shown
Figure 12. Isoprostane and Isofuran isolated from BH reactions
with arachidonic acid and RBC ghosts.
26
alongside HNE immunohistochemical stains for comparison in Figure 13 for livers and
Figure 14 for spleens.
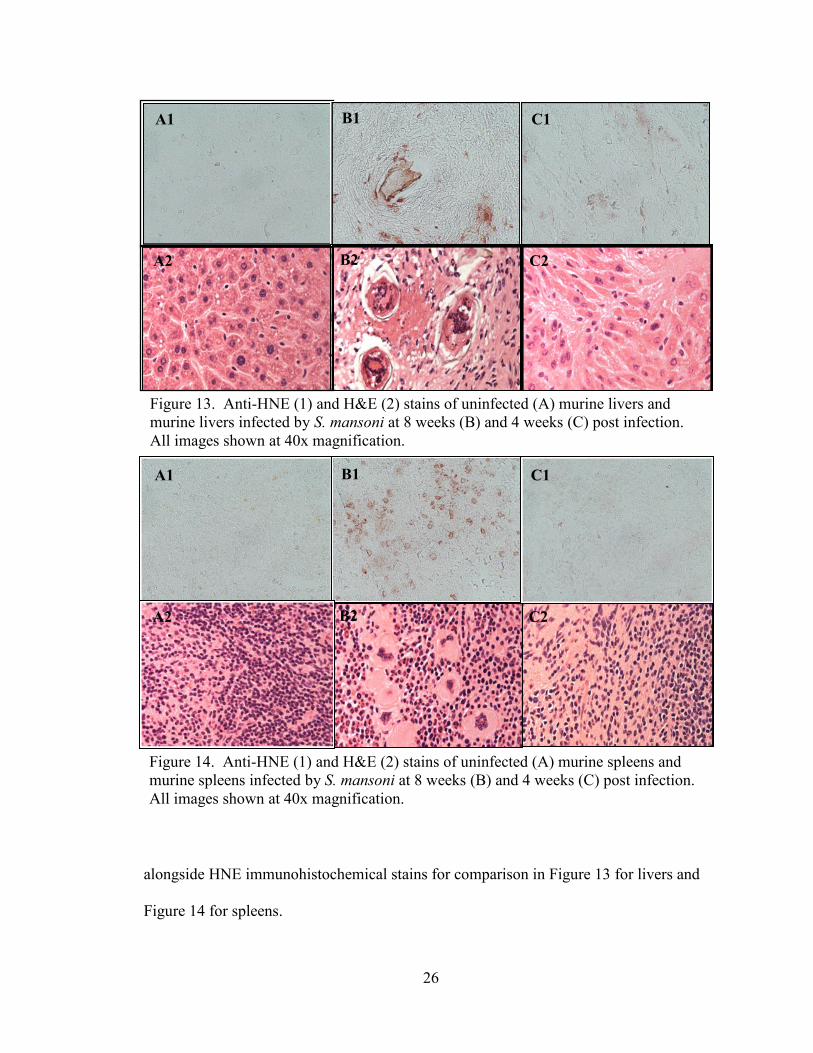
Figure 13. Anti-HNE (1) and H&E (2) stains of uninfected (A) murine livers and
murine livers infected by S. mansoni at 8 weeks (B) and 4 weeks (C) post infection.
All images shown at 40x magnification.
A1
1
A2
B1
B2
C1
C2
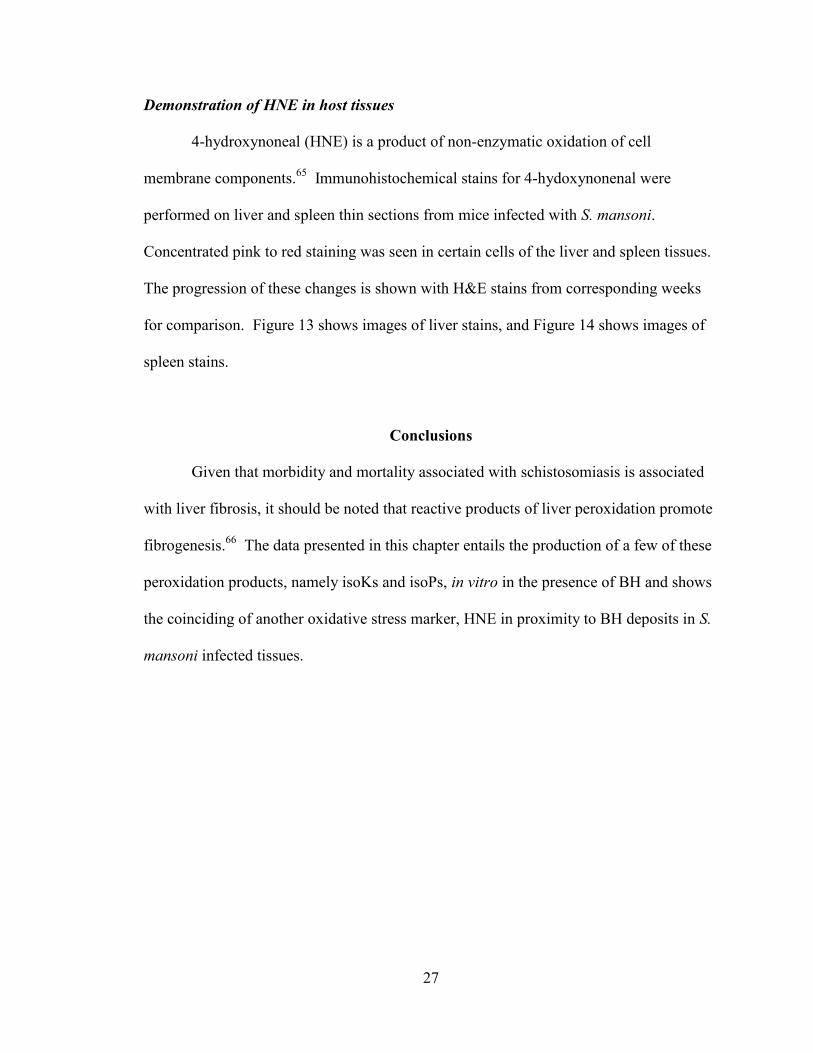
Figure 14. Anti-HNE (1) and H&E (2) stains of uninfected (A) murine spleens and
murine spleens infected by S. mansoni at 8 weeks (B) and 4 weeks (C) post infection.
All images shown at 40x magnification.
A1
1
A2
B1
B2
C1
C2
27
Demonstration of HNE in host tissues
4-hydroxynoneal (HNE) is a product of non-enzymatic oxidation of cell
membrane components.65
Immunohistochemical stains for 4-hydoxynonenal were
performed on liver and spleen thin sections from mice infected with S. mansoni.
Concentrated pink to red staining was seen in certain cells of the liver and spleen tissues.
The progression of these changes is shown with H&E stains from corresponding weeks
for comparison. Figure 13 shows images of liver stains, and Figure 14 shows images of
spleen stains.
Conclusions
Given that morbidity and mortality associated with schistosomiasis is associated
with liver fibrosis, it should be noted that reactive products of liver peroxidation promote
fibrogenesis.66
The data presented in this chapter entails the production of a few of these
peroxidation products, namely isoKs and isoPs, in vitro in the presence of BH and shows
the coinciding of another oxidative stress marker, HNE in proximity to BH deposits in S.
mansoni infected tissues.
28
APPENDIX A
ALTERNATIVELY ACTIVATED MACROPHAGES AS A MODEL FOR
SCHISTOSOME-INDUCED IMMUNE RESPONSE
Alternatively activated macrophages (AAMs) were attempted in murine RAW
264.7 cells.67-69
Activated macrophages are used to study innate immune responses while
AAMs provide a model to study humoral immunity including repair processes.
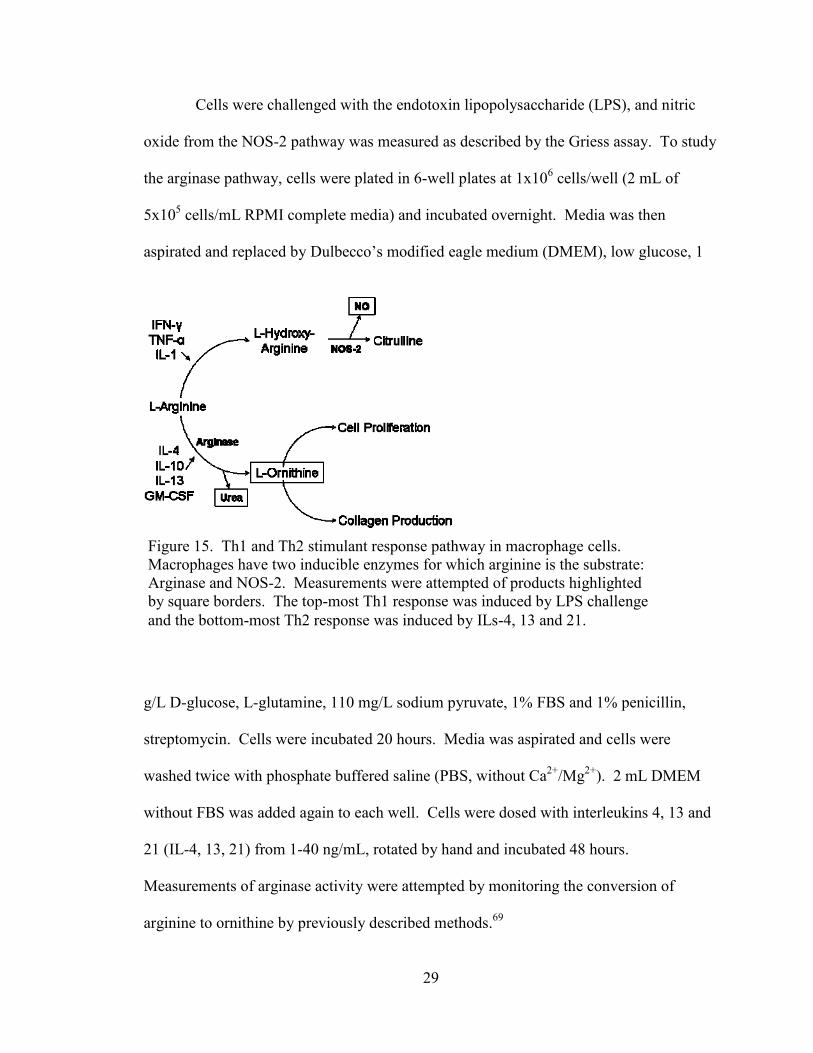
Macrophages, which are a major feature of egg-induced granulomas, possess two
enzymes, nitric oxide syntase-2 (NOS-2) and arginase-I (Arg-I) that compete for a single
substrate, L-arginine. NOS-2 transforms L-arginine to nitric oxide and L-
hydroxyarginine, which can inhibit Arg-I. This is part of the classical macrophage
activation pathway, the purpose of which is to destroy pathogens. Arg-I converts L-
arginine to L-ornithine, which is then converted by ornithine decarboxylase to
polyamines leading to cell proliferation or by ornithine aminotransferase to proline for
collagen production. Cell proliferation and collagen production lead to cell growth and
connective tissue formation. This arginase pathway contributes to alternative
macrophage activation, the purpose of which is to repair tissue.70
Whether a macrophage
is classically activated to up regulate NOS-2 or alternatively activated to up regulate Arg-
I depends on the interplay of Th1 and Th2 type cytokines. Inflammatory cytokines,
such as IFN-γ, IL-12 or TNF-α will classically activate macrophages.71
Alternatively
activated macrophages may be stimulated by IL-4, IL-13, or IL-21.71, 72
These pathways
are depicted in Figure 15. The presence of the eggs themselves, and the antigens they
give off, skew the immune reaction to a Th2 type response.73-76
29
Cells were challenged with the endotoxin lipopolysaccharide (LPS), and nitric
oxide from the NOS-2 pathway was measured as described by the Griess assay. To study
the arginase pathway, cells were plated in 6-well plates at 1x10⁶ cells/well (2 mL of
5x10⁵ cells/mL RPMI complete media) and incubated overnight. Media was then
aspirated and replaced by Dulbecco’s modified eagle medium (DMEM), low glucose, 1
g/L D-glucose, L-glutamine, 110 mg/L sodium pyruvate, 1% FBS and 1% penicillin,
streptomycin. Cells were incubated 20 hours. Media was aspirated and cells were
washed twice with phosphate buffered saline (PBS, without Ca2+
/Mg2+
). 2 mL DMEM
without FBS was added again to each well. Cells were dosed with interleukins 4, 13 and
21 (IL-4, 13, 21) from 1-40 ng/mL, rotated by hand and incubated 48 hours.
Measurements of arginase activity were attempted by monitoring the conversion of
arginine to ornithine by previously described methods.69
Figure 15. Th1 and Th2 stimulant response pathway in macrophage cells.
Macrophages have two inducible enzymes for which arginine is the substrate:
Arginase and NOS-2. Measurements were attempted of products highlighted
by square borders. The top-most Th1 response was induced by LPS challenge
and the bottom-most Th2 response was induced by ILs-4, 13 and 21.
30
Cells were harvested and lysed with lysis buffer containing 0.5% triton solution
with trypsin-chymotrypsin inhibitor (0.1 mg/mL), leupeptin (0.05 mg/mL), aprotinin
(0.05 mg/mL) and pheynylmethonylsulfonyl fluoride (PMSF, 0.2 mM). After lysis, 25
µL of 10 mM MnCl2 was added to 25 µL of lysate from each sample. Samples were
incubated at 55°C for 20 minutes. Carbonate buffer (150 µL of 0.1 M) was added to each
sample. Half of the samples received 50 µL of 100 mM L-arginine, incubated at 25°C 1
hour and the reaction stopped with addition of 750 µL of glacial acetic acid. A 250 µL
aliquot of 2.5 g/L ninhydrin solution (in ethanol) was added to all samples and brought to
a boil for 1 hour. Ornithine production was measured at 560 nm. Significant distinction
between control and experimental samples was not established due to interference with
unreacted substrate. It was then that arginase activity monitoring was attempted by
measurement of urea levels in preference to ornithine. This effort is outlined in appendix
B.
31
APPENDIX B
MEASUREMENT OF ARGINASE ACTIVITY VIA UREA PRODUCTION
Another measurable product of Arginase activity is urea. An assay to detect urea
based on a method by Munder et al. was developed.77
Cells were plated and treated as
described in Appendix A. In a 96 well plate 25 μL of lysate was treated with 2.5 μL of
10 mM MnCl2 and heated for 10 minutes at 56˚C to activate enzyme. 25 μL of 0.5 M L-
arginine, pH 9.7, substrate was then added and incubated for 120 minutes. 200 μL
H2SO4/H3PO4/H2O (1/3/7, v/v/v/) was used to stop the reaction. 10 μL of 9% (w/v) α-
isonitrosopropiophenone in 100% ethanol (ISPF) was added and the solution was heated
at 95˚C for 30 minutes. The plate was then read at λ=540 nm. A calibration curve of
urea was incorporated in the same plate and treated the same as samples. Should the
calibration curve fail on any given plate, the whole plate was discarded. This assay was
tried with lysate saved from previous cell experiments described in Appendix A and also
with the cell treatment repeated. The urea levels produced from the cell experiments
appeared to be below the detection limit of the assay.
32
APPENDIX C
PDTC INHBITION OF NITRIC OXIDE PRODUCTION
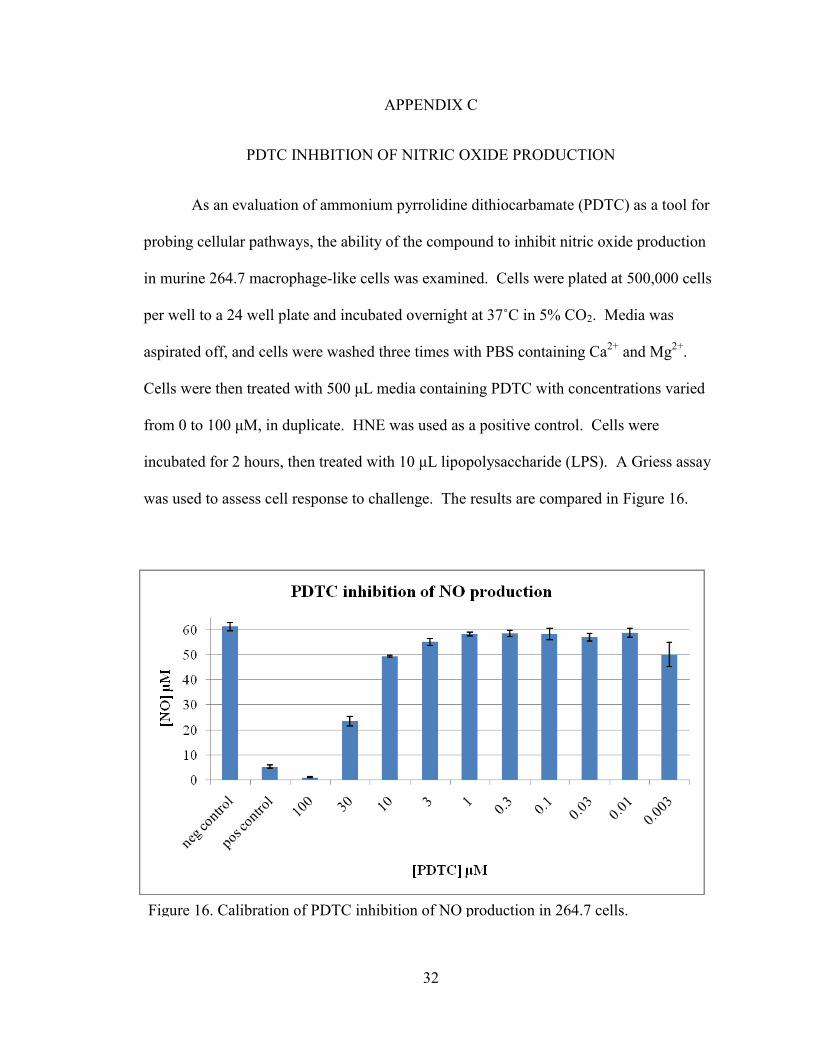
As an evaluation of ammonium pyrrolidine dithiocarbamate (PDTC) as a tool for
probing cellular pathways, the ability of the compound to inhibit nitric oxide production
in murine 264.7 macrophage-like cells was examined. Cells were plated at 500,000 cells
per well to a 24 well plate and incubated overnight at 37˚C in 5% CO2. Media was
aspirated off, and cells were washed three times with PBS containing Ca2+
and Mg2+
.
Cells were then treated with 500 μL media containing PDTC with concentrations varied
from 0 to 100 μM, in duplicate. HNE was used as a positive control. Cells were
incubated for 2 hours, then treated with 10 μL lipopolysaccharide (LPS). A Griess assay
was used to assess cell response to challenge. The results are compared in Figure 16.
Figure 16. Calibration of PDTC inhibition of NO production in 264.7 cells.
33
APPENDIX D
QUANTIFICATION OF ISOKETAL FORMATION FROM ARACHIDONIC ACID
AND BETA HEMATIN REACTION
In order to quantify isoK-pyridoxamine adduct from reaction of BH with AA, an
isoK-4-aminomethylpyridine adduct was prepared for use as an internal standard. 4-
Aminomethylpyridine (4-AMPy) is of lower molecular weight than pyridoxamine (PM),
and so may be distinguished from PM via MS. 4-AMPy also has a strong affinity for
isoK. The two compounds are of similar structure and elute from the described HPLC at
the same time. 4-AMPy-isoK standard was prepared and cleaned by previously
described methods for preparation of PM-isoK78
by combining 25 μL of 10 mM isoK
(from the lab of L. Jackson Roberts) with 20 μL of 4-AMPy in 955 μL 100 mM sodium
phosphate buffer (chelexed, pH 7.4). At the same time, synthesis and cleaning of PM-
isoK was set up for comparison: 25 μL of 10 mM isoK with an excess of PM in quantity
sufficient 100 mM sodium phosphate to 1.000 mL. Both reactions shaken overnight at 55
rpm, 37˚C. PM-isoK and 4-AMPy-isK were cleaned on a Waters Sep-Pak C18 cartridge
preconditioned with 10 mL methanol. Reaction mixtures were added to the cartridge via
syringe at a flow rate of no faster than 1 mL/min. Samples were then washed at no more
than 4 mL/min with 10 mL water, 10 mL methanol/water (15:85), 10 mL heptane, and 10
mL heptane/ ethyl acetate (1:1). Product was then eluted with 5 mL methanol/ ethyl
acetate (1:1) at about 2 mL/min. Eluent was dried under N2, resuspended in 400 μL of
HPLC solvent A, and stored at <-20˚C until HPLC became available. HPLC solvent A
was 20 mM ammonium acetated with 0.1% v/v acetic acid. Solvent B was 5 mM
ammonium acetate/methanol (1:9) with 0.1% acetic acid. A Phenomenex Luna 5u C18
column was used to clean the products with the following gradient at 0.2 mL/min: 5
34
minutes at 100% A, ramp up to 100% B until 45 minutes, hold at 100% B until 60
minutes, gradient back to 100% A by 65 minutes, and equilibrate with 100% A until 85
minutes. Runs were monitored at λ = 320 nm, 250 nm, and 220 nm. Samples were
collected in 0.5 dram glass vials and labeled with time, product and HPLC run number.
Standards were then analyzed via LC-MS/MS. Tune files were created for PM-isoK with
a parent ion of 501 m/z, and for 4-AMPy-isoK with a parent ion of 441 m/z. It was
determined that using the column and gradient described above, both types of products
eluted chiefly at 61-64 minutes.
The concentration of the 4-AMPy-isoK internal standard was approximated by
UV/vis spectrometry by determining the molar absorptivity coefficient for 4-
(ethylaminomethyl)pyridine. The constant was determined to be 2558.2 at 259 nm.
Reactions between BH and AA were set up as described above with increasing
concentrations of BH. These reactions were spiked with 4-AMPy-isoK as an internal
standard and extracted with ether as described above and taken for LC-MS/MS analysis.
No data was acquired due to an undiscovered leak in the column while samples were
running.
35
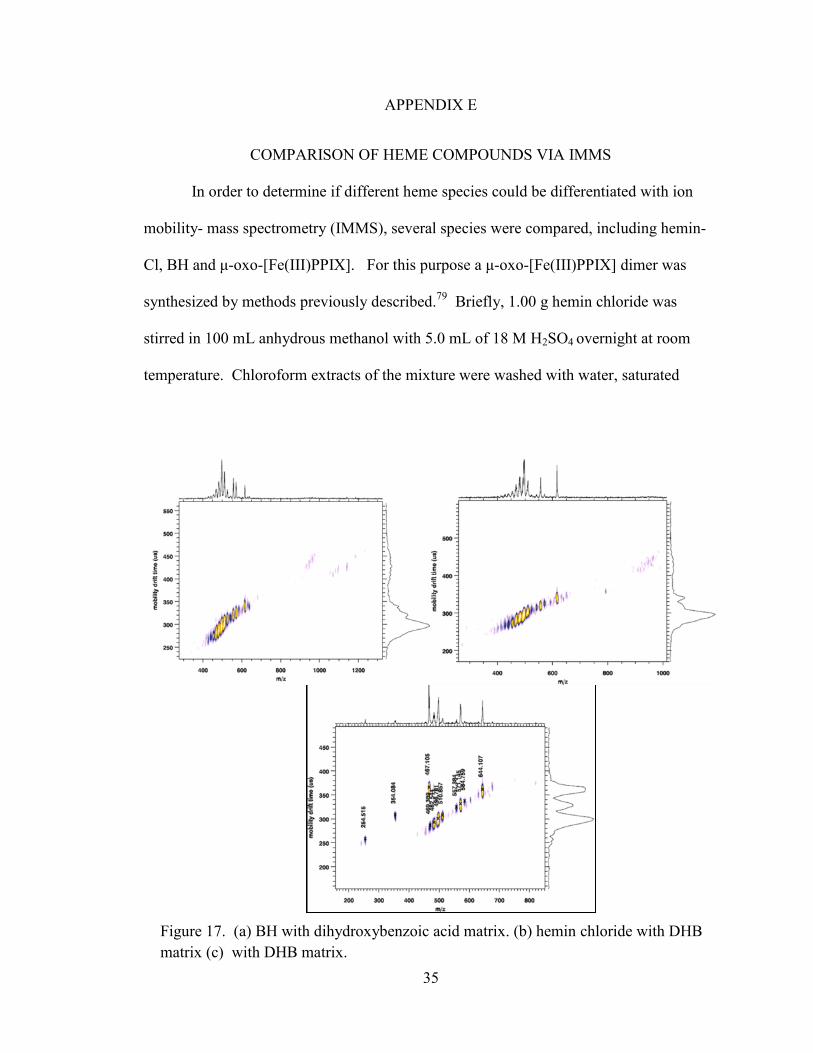
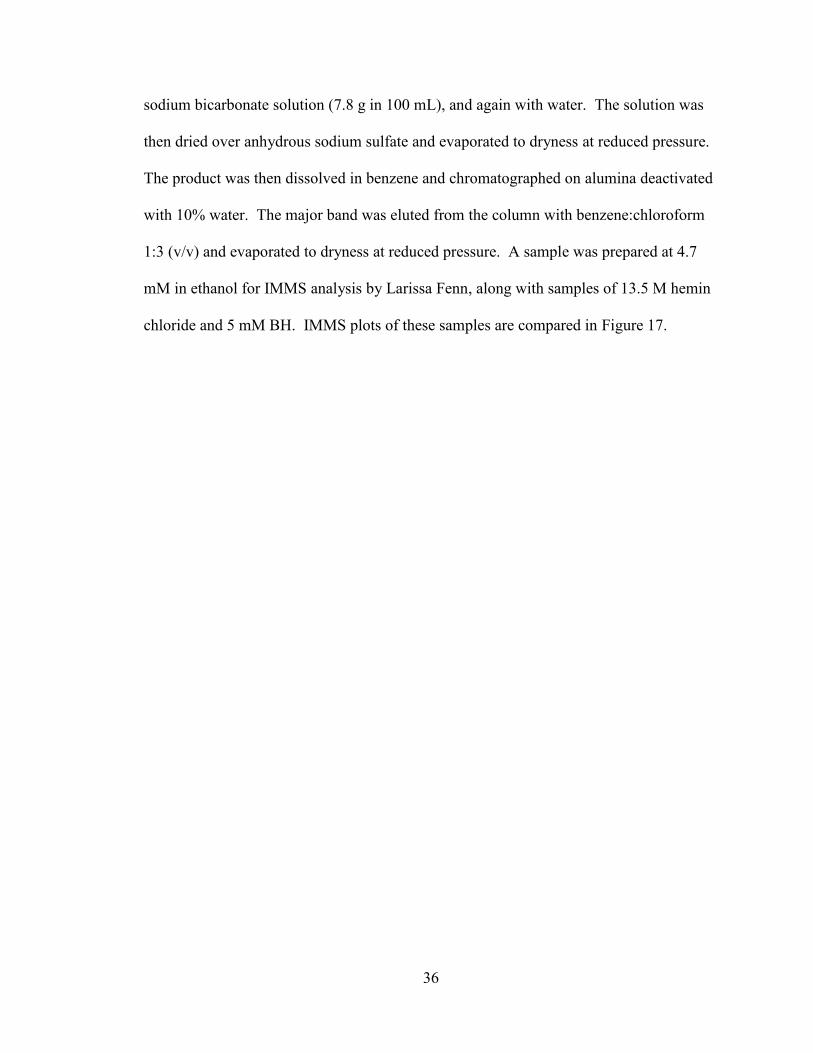
APPENDIX E
COMPARISON OF HEME COMPOUNDS VIA IMMS
In order to determine if different heme species could be differentiated with ion
mobility- mass spectrometry (IMMS), several species were compared, including hemin-
Cl, BH and μ-oxo-[Fe(III)PPIX]. For this purpose a μ-oxo-[Fe(III)PPIX] dimer was
synthesized by methods previously described.79
Briefly, 1.00 g hemin chloride was
stirred in 100 mL anhydrous methanol with 5.0 mL of 18 M H2SO4 overnight at room
temperature. Chloroform extracts of the mixture were washed with water, saturated
Figure 17. (a) BH with dihydroxybenzoic acid matrix. (b) hemin chloride with DHB
matrix (c) with DHB matrix.
36
sodium bicarbonate solution (7.8 g in 100 mL), and again with water. The solution was
then dried over anhydrous sodium sulfate and evaporated to dryness at reduced pressure.
The product was then dissolved in benzene and chromatographed on alumina deactivated
with 10% water. The major band was eluted from the column with benzene:chloroform
1:3 (v/v) and evaporated to dryness at reduced pressure. A sample was prepared at 4.7
mM in ethanol for IMMS analysis by Larissa Fenn, along with samples of 13.5 M hemin
chloride and 5 mM BH. IMMS plots of these samples are compared in Figure 17.
37
REFERENCES
1. Hotez, P. J.; Molyneux, D. H.; Fenwick, A.; Ottesen, E.; Sachs, S. E.; Sachs, J.
D., Pl o S Medicine 2006, 3 (5), 576(9).
2. Chitsulo, L.; Engels, D.; Montresor, A.; Savioli, L., Acta Tropica 2000, 77 (1),
41-51.
3. Roberts, L. S.; Janovy, J., Foundations of Parasitology. 2000.
4. Steinmann, P.; Keiser, J.; Bos, R.; Tanner, M.; Utzinger, J., The Lancet Infectious
Diseases 2006, 6 (7), 411-425.
5. Woolhouse, M. E. J., Parasitology Today 1998, 14 (10), 428-434.
6. Salafsky, B.; Wang, Y. S.; Kevin, M. B.; Hill, H.; Fuscuo, A. C., Journal of
Parasitology 1984, 70 (4), 584-591.
7. Salafsky, B.; Wang, Y. S.; Fusco, A. C.; Antonacci, J., Journal of Parasitology
1984, 70 (5), 656-660.
8. Lawrence, J. D., The Journal of Parasitology 1973, 59 (1), 60-63.
9. Boros, D. L., Clin. Microbiol. Rev. 1989, 2 (3), 250-269.
10. Farah, I. O.; Nyindo, M.; Suleman, M. A.; Nyaundi, J.; Kariuki, T. M.; Blanton,
R. E.; Elson, L. H.; King, C. L., Experimental Parasitology 1997, 86 (2), 93-101.
11. Gutteridge, J. M.; Smith, A., Biochem. J. 1988, 256 (3), 861-865.
12. Halliwell, B., Free Radical Biology and Medicine 1989, 7 (6), 645-651.
13. Pagola, S.; Stephens, P. W.; Bohle, D. S.; Kosar, A. D.; Madsen, S. K., Nature
2000, 404 (6775), 307-310.
14. Schwarzer, E.; Arese, P., Biochimica et Biophysica Acta (BBA) - Molecular Basis
of Disease 1996, 1316 (3), 169-175.
15. Schwarzer, E.; Turrini, F.; Ulliers, D.; Giribaldi, G.; Ginsburg, H.; Arese, P.,
Journal of Experimental Medicine 1992, 176 (4), 1033-1041.
16. Schwarzer, E.; Alessio, M.; Ulliers, D.; Arese, P., Infect. Immun. 1998, 66 (4),
1601-1606.
17. Schwarzer, E.; Muller, O.; Arese, P.; Siems, W. G.; Grune, T., FEBS Letters
1996, 388 (2,3), 119-122.
18. Omodeo-Salè, F.; Monti, D.; Olliaro, P.; Taramelli, D., Biochemical
Pharmacology 2001, 61 (8), 999-1009.
19. Green, M. D.; Xiao, L.; Lal, A. A., Molecular and Biochemical Parasitology
1996, 83 (2), 183-188.
20. Scorza, T.; Magez, S.; Brys, L.; De Baetselier, P., Parasite Immunology 1999, 21
(11), 545-554.
21. Pichyangkul, S.; Saengkrai, P.; Webster, H. K., Am J Trop Med Hyg 1994, 51 (4),
430-435.
22. Taramelli, D.; Basilico, N.; Pagani, E.; Grande, R.; Monti, D.; Ghione, M.;
Olliaro, P., Experimental Parasitology 1995, 81 (4), 501-511.
23. Taramelli, D.; Recalcati, S.; Basilico, N.; Olliaro, P.; Cairo, G., Lab Invest 2000,
80 (12), 1781-1788.
24. Oliveira, M. F.; Timm, B. L.; Machado, E. A.; Miranda, K.; Attias, M.; Silva, J.
R.; Dansa-Petretski, M.; de Oliveira, M. A.; de Souza, W.; Pinhal, N. M.; Sousa,
J. J. F.; Vugman, N. V.; Oliveira, P. L., FEBS Letters 2002, 512 (1-3), 139-144.
38
25. Fitch, C. D.; Kanjananggulpan, P., Journal of Biological Chemistry 1987, 262
(32), 15552-15555.
26. Slater, A. F.; Swiggard, W. J.; Orton, B. R.; Flitter, W. D.; Goldberg, D. E.;
Cerami, A.; Henderson, G. B., Proceedings of the National Academy of Sciences
of the United States of America 1991, 88 (2), 325-329.
27. Bohle, D. S.; Dinnebier, R. E.; Madsen, S. K.; Stephens, P. W., J. Biol. Chem.
1997, 272 (2), 713-716.
28. Yamada, K. A.; Sherman, I. W., Experimental Parasitology 1979, 48 (1), 61-74.
29. Goldie, P.; Roth, E. F., Jr.; Oppenheim, J.; Vanderberg, J. P., Am J Trop Med Hyg
1990, 43 (6), 584-596.
30. Bohle, D. S.; Helms, J. B., Biochemical and Biophysical Research
Communications 1993, 193 (2), 504-508.
31. Schwarzer, E.; Kuhn, H.; Valente, E.; Arese, P., Blood 2003, 101 (2), 722-728.
32. Schwarzer, E.; Turrini, F.; Giribaldi, G.; Cappadoro, M.; Arese, P., Biochimica et
Biophysica Acta (BBA) - Molecular Basis of Disease 1993, 1181 (1), 51-54.
33. Turrini, F.; Schwarzer, E.; Arese, P., Parasitology Today 1993, 9 (8), 297-300.
34. Brown, A. E.; Webster, H. K.; Teja-Isavadharm, P.; Keeratithakul, D., Clinical
and Experimental Immunology 1990, 82 (1), 97-101.
35. Levesque, M. A.; Sullivan, A. D.; Meshnick, S. R., The Journal of Parasitology
1999, 85 (3), 570-573.
36. Fiori, P. L.; Rappelli, P.; Mirkarimi, S. N.; Ginsburg, H.; Cappuccinelli, P.;
Turrini, F., Parasite Immunology 1993, 15 (12), 647-655.
37. Prada, J.; Malinowski, J.; Muller, S.; Bienzle, U.; Kremsner, P. G., Am J Trop
Med Hyg 1996, 54 (6), 620-624.
38. Millington, O.; Di Lorenzo, C.; Phillips, R.; Garside, P.; Brewer, J., Journal of
Biology 2006, 5 (2), 5.
39. Urban, B.; Todryk, S., Journal of Biology 2006, 5 (2), 4.
40. Carney, C. K.; Schrimpe, A. C.; Halpenny, K.; Harry, R. S.; Miller, C. M.;
Broncel, M.; Sewell, S. L.; Schaff, J. E.; Deol, R.; Carter, M. D.; Wright, D. W.,
JBIC 2006, 11 (7), 917-929.
41. Wynn, T. A.; Thompson, R. W.; Cheever, A. W.; Mentink-Kane, M. M.,
Immunological Reviews 2004, 201 (1), 156-167.
42. Wilson, M. S.; Mentink-Kane, M. M.; Pesce, J. T.; Ramalingam, T. R.;
Thompson, R.; Wynn, T. A., Immunol Cell Biol 2006, 85 (2), 148-154.
43. Kaplan, M. H.; Whitfield, J. R.; Boros, D. L.; Grusby, M. J., J Immunol 1998, 160
(4), 1850-1856.
44. Pearce, E. J.; MacDonald, A. S., Nat Rev Immunol 2002, 2 (7), 499-511.
45. Cheever, A. W.; Williams, M. E.; Wynn, T. A.; Finkelman, F. D.; Seder, R. A.;
Cox, T. M.; Hieny, S.; Caspar, P.; Sher, A., J Immunol 1994, 153 (2), 753-759.
46. Reiman, R. M.; Thompson, R. W.; Feng, C. G.; Hari, D.; Knight, R.; Cheever, A.
W.; Rosenberg, H. F.; Wynn, T. A., Infect. Immun. 2006, 74 (3), 1471-1479.
47. Stenger, R. J.; Warren, K. S.; Johnson, E. A., Experimental and Molecular
Pathology 1967, 7 (1), 116-132.
48. Phillips, S. M.; DiConza, J. J.; Gold, J. A.; Reid, W. A., J Immunol 1977, 118 (2),
594-599.
39
49. Hanna, S.; Gharib, B.; Lepidi, H.; Montet, J.-C.; Dumon, H.; de Reggi, M.,
Parasitology Research 2005, 96 (1), 6-11.
50. Abdallahi, O. M. S.; Hanna, S.; Reggi, M.; Gharib, B., Liver 1999, 19 (6), 495-
500.
51. Gharib, B.; Abdallahi, O. M. S.; Dessein, H. l.; Reggi, M. D., Journal of
hepatology 1999, 30 (4), 594-602.
52. Carter, M. D.; Reese Harry, S.; Wright, D. W., Biochemical and Biophysical
Research Communications 2007, 363 (3), 867-872.
53. Oliveira, M. F.; d'Avila, J. C. P.; Torres, C. R.; Oliveira, P. L.; Tempone, A. J.;
Rumjanek, F. D.; Braga, C. M. S.; Silva, J. R.; Dansa-Petretski, M.; Oliveira, M.
A.; de Souza, W.; Ferreira, S. T., Molecular and Biochemical Parasitology 2000,
111 (1), 217-221.
54. Pandey, A. V.; Tekwani, B. L.; Pandey, V. C., Biomedical Research 1995, 16 (2),
115-120.
55. Deegan, T.; Maegraith, B., Ann Trop Med Parasitol 1956, 50 (2), 194-211.
56. Deegan, T.; Maegraith, B., Ann Trop Med Parasitol 1956, 50 (2), 212-222.
57. Sullivan, D. J.; Gluzman, I. Y.; Russell, D. G.; Goldberg, D. E., Proceedings of
the National Academy of Sciences of the United States of America 1996, 93 (21),
11865-11870.
58. Oliveira, M. F.; Kycia, S. W.; Gomez, A.; Kosar, A. J.; Bohle, D. S.;
Hempelmann, E.; Menezes, D.; Vannier-Santos, M. A.; Oliveira, P. L.; Ferreira,
S. T., FEBS Letters 2005, 579 (27), 6010-6016.
59. Noland, G. S.; Briones, N.; Sullivan, D. J., Molecular and Biochemical
Parasitology 2003, 130 (2), 91-99.
60. Brown, W. D.; Harris, L. S.; Olcott, H. S., Archives of Biochemistry and
Biophysics 1963, 101, 14-20.
61. Davies, S. S.; Brantley, E. J.; Voziyan, P. A.; Amarnath, V.; Zagol-Ikapitte, I.;
Boutaud, O.; Hudson, B. G.; Oates, J. A.; Roberts, L. J., Biochemistry 2006, 45
(51), 15756-15767.
62. Amarnath, V.; Amarnath, K.; Amarnath, K.; Davies, S.; Roberts, L. J., Chemical
Research in Toxicology 2004, 17 (3), 410-415.
63. Kubata, B. K.; Eguchi, N.; Urade, Y.; Yamashita, K.; Mitamura, T.; Tai, K.;
Hayaishi, O.; Horii, T., J. Exp. Med. 1998, 188 (6), 1197-1202.
64. El-Sokkary, G. H.; Omar, H. M.; Hassanein, A.-F. M. M.; Cuzzocrea, S.; Reiter,
R. J., Free Radical Biology and Medicine 2002, 32 (4), 319-332.
65. Esterbauer, H.; Schaur, R. J.; Zollner, H., Free Radical Biology and Medicine
1991, 11 (1), 81-128.
66. Bedossa, P.; Houglum, K.; Trautwein, C.; Holstege, A.; Chojkier, M., Hepatology
1994, 19 (5), 1262-1271.
67. Konarska, L.; Tomaszewski, L., Clinica Chimica Acta 1986, 154, 7-18.
68. Chinard, F. P., Journal of Biological Chemistry 1952, 199, 91-95.
69. Chinard, F. P., J. Biol. Chem. 1952, 199 (1), 91-95.
70. Stein, M.; Keshav, S.; Harris, N.; Gordon, S., J. Exp. Med. 1992, 176 (1), 287-
292.
71. Gordon, S., Nat Rev Immunol 2003, 3 (1), 23-35.
40
72. Pesce, J.; Kaviratne, M.; Ramalingam, T. R.; Thompson, R. W.; Urban, J. F.;
Cheever, A. W.; Young, D. A.; Collins, M.; Grusby, M. J.; Wynn, T. A., Journal
of Clinical Investigation 2006, 116 (7), 2044-2055.
73. Faveeuw, C.; Angeli, V.; Fontaine, J.; Maliszewski, C.; Capron, A.; Van Kaer, L.;
Moser, M.; Capron, M.; Trottein, F., J Immunol 2002, 169 (2), 906-912.
74. Wynn, T. A.; Eltoum, I.; Cheever, A. W.; Lewis, F. A.; Gause, W. C.; Sher, A., J
Immunol 1993, 151 (3), 1430-1440.
75. Chensue, S. W.; Terebuh, P. D.; Warmington, K. S.; Hershey, S. D.; Evanoff, H.
L.; Kunkel, S. L.; Higashi, G. I., J Immunol 1992, 148 (3), 900-906.
76. Pearce, E. J.; Caspar, P.; Grzych, J. M.; Lewis, F. A.; Sher, A., J. Exp. Med. 1991,
173 (1), 159-166.
77. Munder, M.; Eichmann, K.; Modolell, M., The Journal of Immunology 1998, 160
(11), 5347-5354.
78. Davies, S. S.; Amarnath, V.; Brame, C. J.; Boutaud, O.; Roberts, L. J., Nat.
Protocols 2007, 2 (9), 2079-2091.
79. O'Keeffe, D. H.; Barlow, C. H.; Smythe, G. A.; Fuchsman, W. H.; Moss, T. H.;
Lilienthal, H. R.; Caughey, W. S., Bioinorganic Chemistry 1975, 5 (2), 125-147.