Embed Size (px)
Citation preview
1
THE ROLE OF INFORMAL SECTOR IN ALLEVIATING
YOUTH UNEMPLOYMENT IN HAWASSA CITY, ETHIOPIA
Abstract
Informal sector plays an important role in reducing urban unemployment, crime and
violence, and serving as a breeding ground for new entrepreneurs. This study is aimed at
assessing the role of informal sector in reducing youth unemployment. Data are gathered
from a sample of 264 youth informal sector operators in Hawassa city. Ordinary logistic
regression is used to determine the factors that can contribute to the livelihood
improvement of the operators. Nearly, 90 percent of the operators have witnessed that their
livelihood has improved after they joined the sectors. Operators who are more educated,
natives to the city, more profitable, stayed longer in the activity, and have a culture of
saving, have depicted better livelihood improvement vis-à-vis their counterparts. However,
lack of working capital, working premises, adequate market and raw materials were
reported as the major impediments for the operators. Given the immense contribution that
the sector has, therefore, the government needs to consider the sector as one of the
fundamental pillar to combat youth unemployment. Thus, operators should be encouraged
to join the formal sector by lessening the bureaucracy to get license, minimizing entry cost
such as lowering registration or licensing cost, and providing tax-holidays for sometimes.
Key words: Informal sector, formal sector, livelihood, youth, unemployment.
2
1. Introduction
There are more than 1.2 billion youth people (15 to 24 years of age) in the world. Of
which, about 90 percent are leaving in developing countries. The proportion of youth
population in Sub-Saharan Africa is 14 percent (UN 2011), in Ethiopia it was about 21
percent and 30 percent in the study area, Hawassa city (CSA 2008).
In 2011, nearly 75 million youth were unemployed around the world. Besides, youth were
three times more likely to be unemployed than adults. The youth unemployment rate in
Sub-Saharan Africa was 11.5 percent (ILO 2012); and this figure was about 28 percent in
Ethiopia, and 23 percent in Hawassa city (CSA 2011). Thus, youth unemployment
becomes a serious threat to the social, economic, and political stability of a nation (ILO
2012).
Several factors aggravated the high youth unemployment rate in Africa. Among the factors
high proportion of youths population (slightly more than 20 percent); underdevelopment of
the economies which leads to low job creation; small private sectors to employ the
growing youth population; low quality of education contributing mismatch of skills needed
by the labour market; lack of general and job-related skills; and limited formal work
experience are notable (Semboja 2007; UNECA 2005). Unemployment has been driving
many African youths to engage in violence and criminal activities, young women and girls
into sex work, sexual violence, substance and drug abuse, victims of HIV/AIDS etc.
Informal sector refers to a home based or an individual establishment or an activity
operated by the owner with a few or no employees. Informal sector operators have little or
no access to organized markets, credit institutions, modern technologies, formal trainings,
and public services. Besides, they do not have a fixed place to work; as a result they often
carry out their business in small shops, streets, outlets or home-based activities (CSA
2004).
Informal sector plays an important role in urban poverty alleviation through creating jobs
and reducing unemployment (Lal and Raj 2006; Reddy, Vijay and Manoranjan 2002). In
urban areas of Africa, for example, the employment in informal sector is estimated to be 60
3
percent (World Bank 2008); this figure is about 37 percent in Ethiopia, and 26 percent in
Hawassa city (CSA 2011). The sector also provides a wide range of services, and produces
a variety of basic goods that can be used by all classes of consumers, especially by the low
income groups (Asmamaw 2004). Besides, the sector can serve as a breeding ground for
new entrepreneurs, and absorbs the labour force that is left out from the formal sector
employment (UNCHS 2006). In addition, the sector contributes a lot in reducing urban
crime and violence (Reddy, Vijay and Manoranjan 2002).
Informal sector is a dynamic sector, and not a transitory phenomenon in the development
process. It is rather, to be absorbed soon by the formal sector (Ruffer and Knight 2007).
The 2006 United Nations Center for Human Settlement document has regarded informal
sector as a transitional stage in the move to formal sector (UNCHS 2006).
Poverty alleviation and its eventual elimination occupy an innermost position in the
development agenda of many developing countries, including Africa (Dhemba 1999).
Now-a-days, it seems that developing countries are giving more emphasis on improving
socio-economic status of underprivileged groups (including youth) of the society to open-
up better opportunities for employment and income generation (Asmamaw 2004).
Development could be negatively affected if high rate of youth unemployment persist.
Thus, many African countries are placing greater emphasis on youth development.
It is well documented that informal sector is the major provider of job for the youth in
Africa (ILO 2012). For instance, about 38 percent of youths were engaged in informal
sector businesses in Ethiopia (CSA 2011). Besides, the informal economy gives youth
opportunities to legal work by offering experiences and self-employment opportunities.
Thus, understanding the contribution of informal sector employment in reducing youth
unemployment is crucial for the success of economic development policies and poverty
reduction strategies.
However, studies in the area of informal sector nexus with youth unemployment are
limited in Ethiopia, particularly in the study area. This study is, thus, aimed at assessing the
role of informal sector in reducing youth unemployment in Hawassa city. Specifically, the
study intended to identify the problems facing the youth informal sector operators, assess
4
the improvements in livelihood of the operators after joining the sector, and suggest
appropriate policy recommendations.
2. Methodology
2.1 Sampling and Method of Data Collection
The study area, Hawassa city, is the capital of the SNNP region that is located about 275
kilometer South of Addis Ababa, the capital of Ethiopia. It is the main administrative,
commercial, industrial and tourist center in the Southern region. The city is one of the
fastest growing urban centers in the country. According to the 2007 Ethiopian Population
and Housing Census, the youth population of Hawassa city was 23,116; of which 47.2
percent were males and 52.8 percent were females (CSA 2008).
Multistage sampling method is employed to identify the informal sectors operated by
youths. Hawassa city is subdivided into eight sub-cities (kifle ketemas). In the first stage
eight clusters were formed using the eight sub-cities. Then using simple random sampling
method, four of the sub-cities were selected. The selected sub-cities are: Tabor, Meneharia,
Misrak and Haike-dar. The selected sub-cities have twelve kebeles (the smallest political
and administrative unit in Ethiopia). In the second stage, sample of nine kebeles were
selected from the sub-cities using simple random sampling technique. Then a central
position within a kebele is located and a random direction is then chosen by spinning a
pen. Following, every fifth informal sector activities operated by youths were selected in
that direction from the central position to the end of the kebele.
The Central Statistics Agency (CSA) of Ethiopia’s definition is used to identify whether
the enterprise is informal sector enterprise or not. Accordingly, the enterprise/business is
informal if it does not have a license, and full written book of account that shows monthly
income statement and balance sheet (CSA 2011).
The sample size is determined using the formula (Cochran 1977)
5
)1(
2
2 ppe
zn −
=
α
where e is the level of precision (= 6%); α is level of significance (= 5%); p is estimated
proportion of youths in the informal sector. According to urban employment
unemployment survey of Ethiopia, among currently employed youth population in the
urban areas about 38 percent are employed in the informal sector (CSA 2011). Hence, p =
0.38 is used to calculate the sample size. By substituting the values in the above formula
and adding 5 percent contingency, sample of size ( =n 264) informal sectors operated by
youths were selected. Following, the sample size is distributed among the selected kebeles
based on the proportion (size) of informal sectors in the kebeles. Finally, data is gathered
using structured questionnaire. The data collection was undertaken from April 11 – 24,
2011.
2.2 Variables in the study
The dependent variable of the study is the livelihood improvement of the youth informal
sector operators. It is categorized in to four ordered responses: no improvement,
satisfactory improvement, good improvement, and very good improvement in livelihood.
The explanatory variables included in the study are age, sex, educational level, migration
status, saving status, initial capital, monthly profit, marital status, religion, and length of
stay in the activity.
2.3 Methods of Data Analysis
The ordinal logistic regression method is used to model the relationship between ordinal
response variable and different explanatory variables. Models with terms that reflect
ordinal characteristics, such as monotone trend can improve model parsimony and power
(Agresti 2002). The ordinal regression analysis takes into account the ordinal nature of the
dependent variable (Green 2003). Thus, this study uses ordinal logistic regression to
determine factors that affect livelihood improvements of the operators.
6
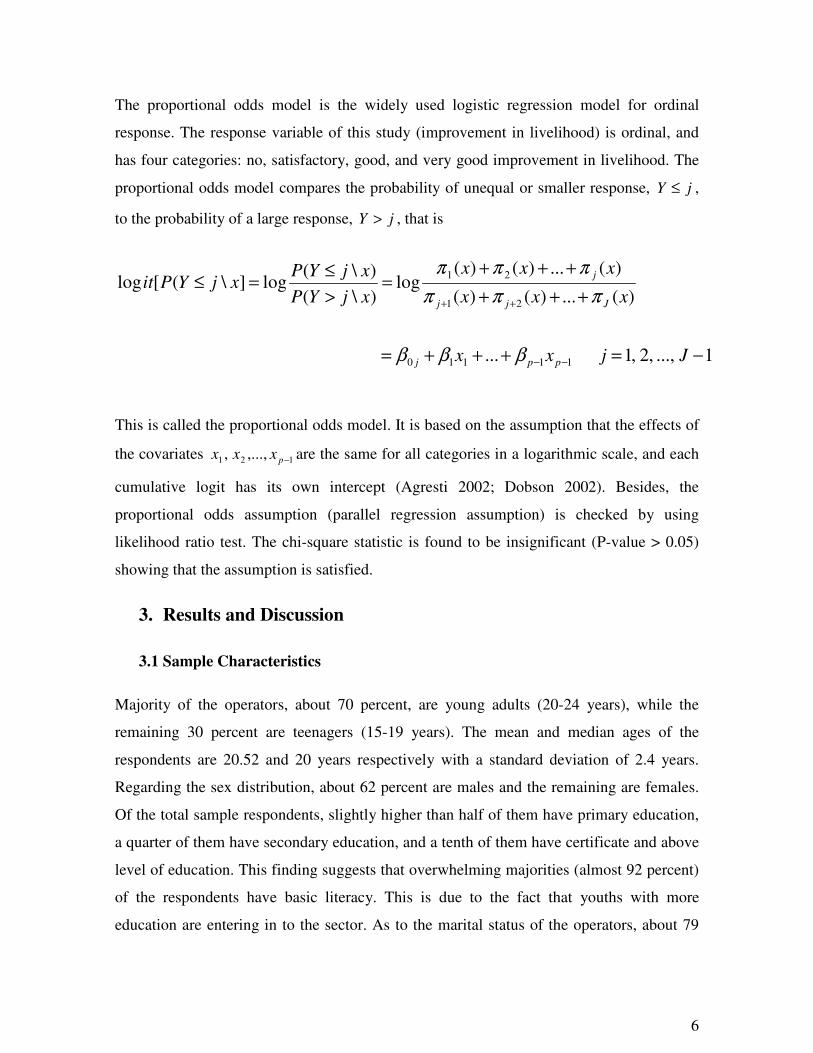
The proportional odds model is the widely used logistic regression model for ordinal
response. The response variable of this study (improvement in livelihood) is ordinal, and
has four categories: no, satisfactory, good, and very good improvement in livelihood. The
proportional odds model compares the probability of unequal or smaller response, jY ≤ ,
to the probability of a large response, jY > , that is
1...,,2,1...
)(...)()(
)(...)()(log
)\(
)\(log]\([log
11110
21
21
−=+++=
+++
+++=
>
≤=≤
−−
++
Jjxx
xxx
xxx
xjYP
xjYPxjYPit
ppj
Jjj
j
βββ
πππ
πππ
This is called the proportional odds model. It is based on the assumption that the effects of
the covariates 121 ,...,, −pxxx are the same for all categories in a logarithmic scale, and each
cumulative logit has its own intercept (Agresti 2002; Dobson 2002). Besides, the
proportional odds assumption (parallel regression assumption) is checked by using
likelihood ratio test. The chi-square statistic is found to be insignificant (P-value > 0.05)
showing that the assumption is satisfied.
3. Results and Discussion
3.1 Sample Characteristics
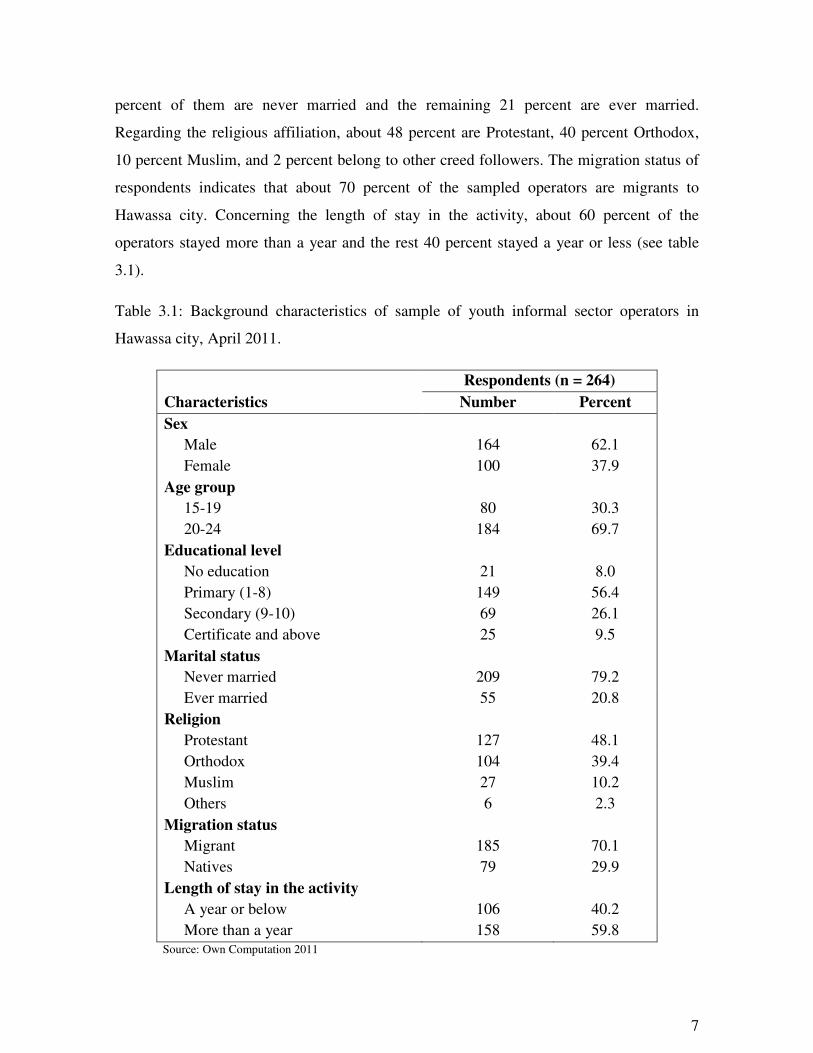
Majority of the operators, about 70 percent, are young adults (20-24 years), while the
remaining 30 percent are teenagers (15-19 years). The mean and median ages of the
respondents are 20.52 and 20 years respectively with a standard deviation of 2.4 years.
Regarding the sex distribution, about 62 percent are males and the remaining are females.
Of the total sample respondents, slightly higher than half of them have primary education,
a quarter of them have secondary education, and a tenth of them have certificate and above
level of education. This finding suggests that overwhelming majorities (almost 92 percent)
of the respondents have basic literacy. This is due to the fact that youths with more
education are entering in to the sector. As to the marital status of the operators, about 79
7
percent of them are never married and the remaining 21 percent are ever married.
Regarding the religious affiliation, about 48 percent are Protestant, 40 percent Orthodox,
10 percent Muslim, and 2 percent belong to other creed followers. The migration status of
respondents indicates that about 70 percent of the sampled operators are migrants to
Hawassa city. Concerning the length of stay in the activity, about 60 percent of the
operators stayed more than a year and the rest 40 percent stayed a year or less (see table
3.1).
Table 3.1: Background characteristics of sample of youth informal sector operators in
Hawassa city, April 2011.
Characteristics
Respondents (n = 264)
Number Percent
Sex
Male 164 62.1
Female 100 37.9
Age group
15-19 80 30.3
20-24 184 69.7
Educational level
No education 21 8.0
Primary (1-8) 149 56.4
Secondary (9-10) 69 26.1
Certificate and above 25 9.5
Marital status
Never married 209 79.2
Ever married 55 20.8
Religion
Protestant 127 48.1
Orthodox 104 39.4
Muslim 27 10.2
Others 6 2.3
Migration status
Migrant 185 70.1
Natives 79 29.9
Length of stay in the activity
A year or below 106 40.2
More than a year 158 59.8 Source: Own Computation 2011
8
3.2 Informal Sectors Covered in the Survey
The informal sector covers a wide range of activities. Some of the activities includes
selling fruits and vegetables, clothes and shoes, various items in kiosk, food processing and
sale, small manufacturing, production, construction and repair of goods, coolies, money
changing, domestic works, prostitution, drug peddling, small-scale artisans, barberry and
shoeshine (UNESC 2006; Yuki 2007; Reddy, Vijay and Manoranjan 2002).
In this study, however, only seven informal sector activities are selected, namely: selling
cooked foods/drinks (23.5 percent), selling clothes/shoes (16.7 percent), bicycle/motor
bicycle repairing (16.3 percent), vegetable/fruit vending (12.5 percent), beauty work (12.1
percent), shoes polishing (11.0 percent), and the rest 8.0 percent engaged in selling various
items in kiosk (see table 3.2).
Table 3.2: Types of informal sector activities captured in the survey in Hawassa city, April
2011.
Activities Number of operators Percents
Selling cooked foods/drinks 62 23.5
Selling clothes/shoes 44 16.7
Bicycle/motor bicycle repair 43 16.3
Vegetable/fruit vending 33 12.5
Beauty work 32 12.1
Shoes polishing 29 11.0
Selling various items in kiosk 21 8.0
Total 264 100
3.3 Nature of the Informal Sector
3.3.1 Skills Acquired to Apply in the Job
Informal sector workers usually acquire necessary skills through either on job training or
traditional apparent-ship system (UNESC 2006). The survey result shows that majority of
the operators (82.5 percent) have learned the skills by self thought, 11.4 percent through
9
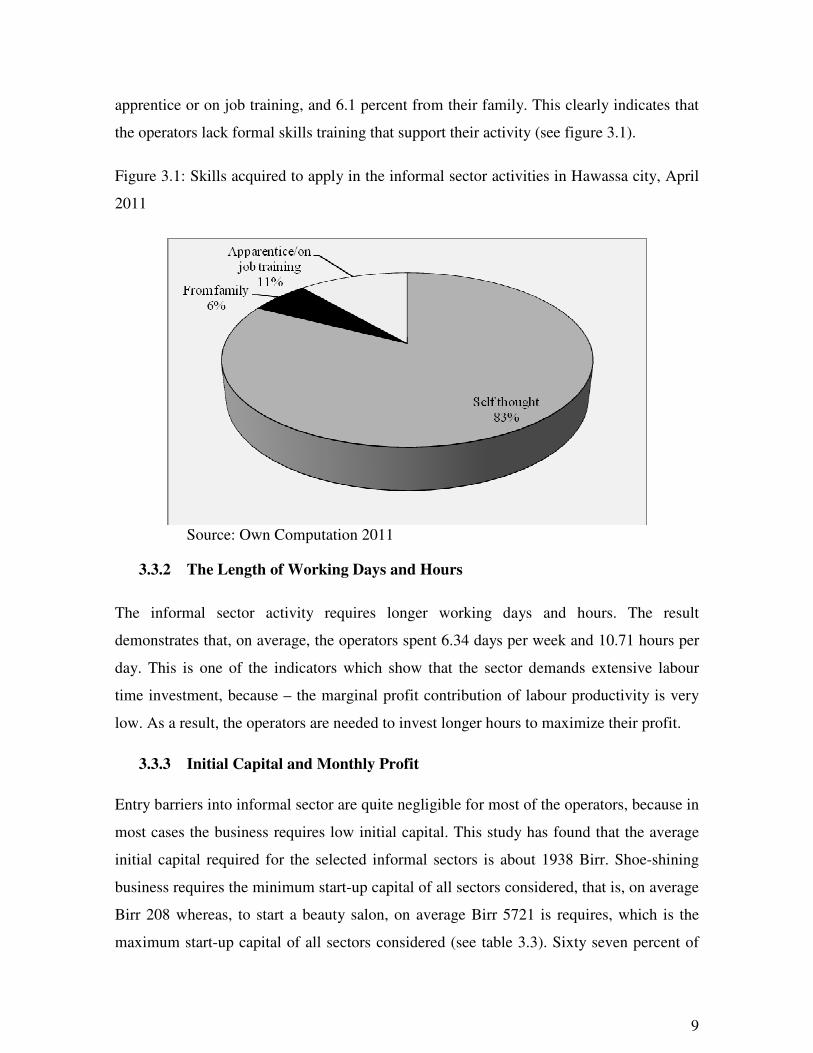
apprentice or on job training, and 6.1 percent from their family. This clearly indicates that
the operators lack formal skills training that support their activity (see figure 3.1).
Figure 3.1: Skills acquired to apply in the informal sector activities in Hawassa city, April
2011
Source: Own Computation 2011
3.3.2 The Length of Working Days and Hours
The informal sector activity requires longer working days and hours. The result
demonstrates that, on average, the operators spent 6.34 days per week and 10.71 hours per
day. This is one of the indicators which show that the sector demands extensive labour
time investment, because – the marginal profit contribution of labour productivity is very
low. As a result, the operators are needed to invest longer hours to maximize their profit.
3.3.3 Initial Capital and Monthly Profit
Entry barriers into informal sector are quite negligible for most of the operators, because in
most cases the business requires low initial capital. This study has found that the average
initial capital required for the selected informal sectors is about 1938 Birr. Shoe-shining
business requires the minimum start-up capital of all sectors considered, that is, on average
Birr 208 whereas, to start a beauty salon, on average Birr 5721 is requires, which is the
maximum start-up capital of all sectors considered (see table 3.3). Sixty seven percent of
10
the operators indicated that their source of start-up capital came from own rotary saving
mechanism called “Equb”. While 17 percent have borrowed from friends/relatives, 13
percent have obtained assistance from friends/ relatives, 2 percent have borrowed from
micro finance institutions, and the rest 1 percent have utilized inheritance or assistance
from governmental and non-governmental organizations to start their business. This
finding clearly indicates that only a slim portion of the operators are getting support from
formal financial institutions.
Profit level in the informal sector is generally low (UNESC 2006). However, in this study
the average monthly profit is found to be about Birr 1033, which is almost equal to the
monthly salary of a bachelor’s degree holder in Ethiopia’s civil service salary scale. Yet
the average profit ranges from Birr 500 for shoeshine workers to Birr 1821 per month for
vegetable/fruit vendors. There is large variation in the monthly profit which ranges from
Birr 100 to 7560 (see table 3.3).
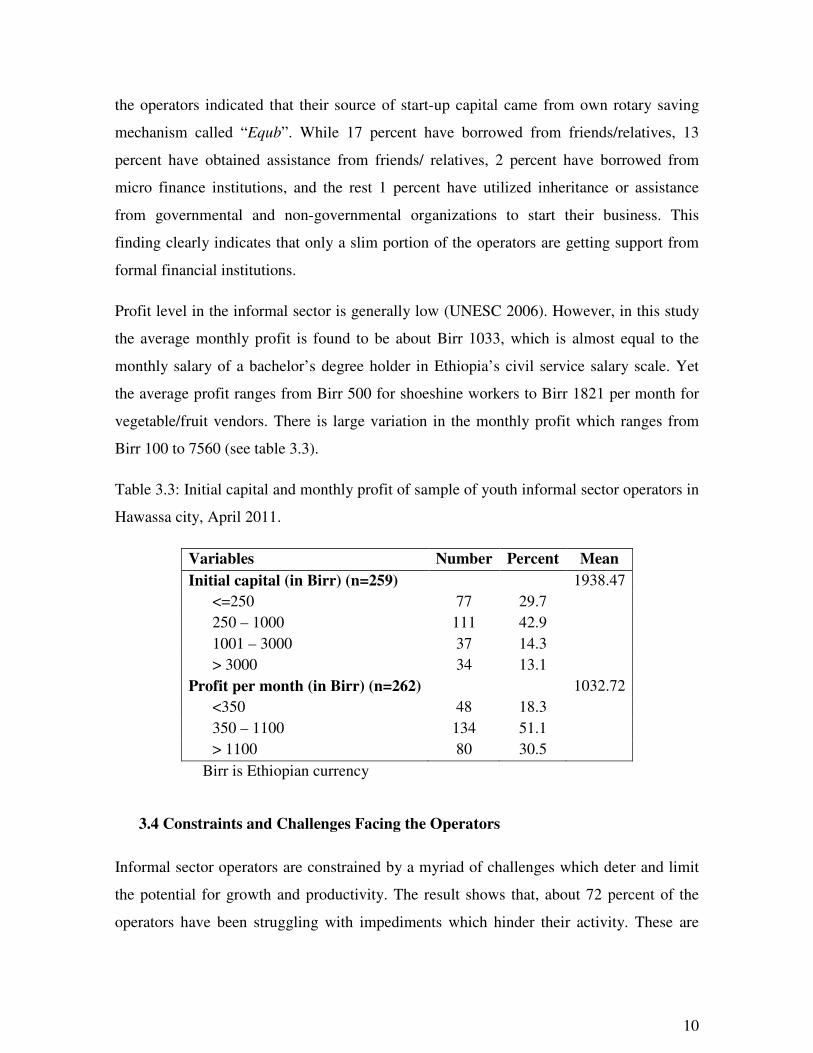
Table 3.3: Initial capital and monthly profit of sample of youth informal sector operators in
Hawassa city, April 2011.
Variables Number Percent Mean
Initial capital (in Birr) (n=259) 1938.47
<=250 77 29.7
250 – 1000 111 42.9
1001 – 3000 37 14.3
> 3000 34 13.1
Profit per month (in Birr) (n=262) 1032.72
<350 48 18.3
350 – 1100 134 51.1
> 1100 80 30.5
Birr is Ethiopian currency
3.4 Constraints and Challenges Facing the Operators
Informal sector operators are constrained by a myriad of challenges which deter and limit
the potential for growth and productivity. The result shows that, about 72 percent of the
operators have been struggling with impediments which hinder their activity. These are
11
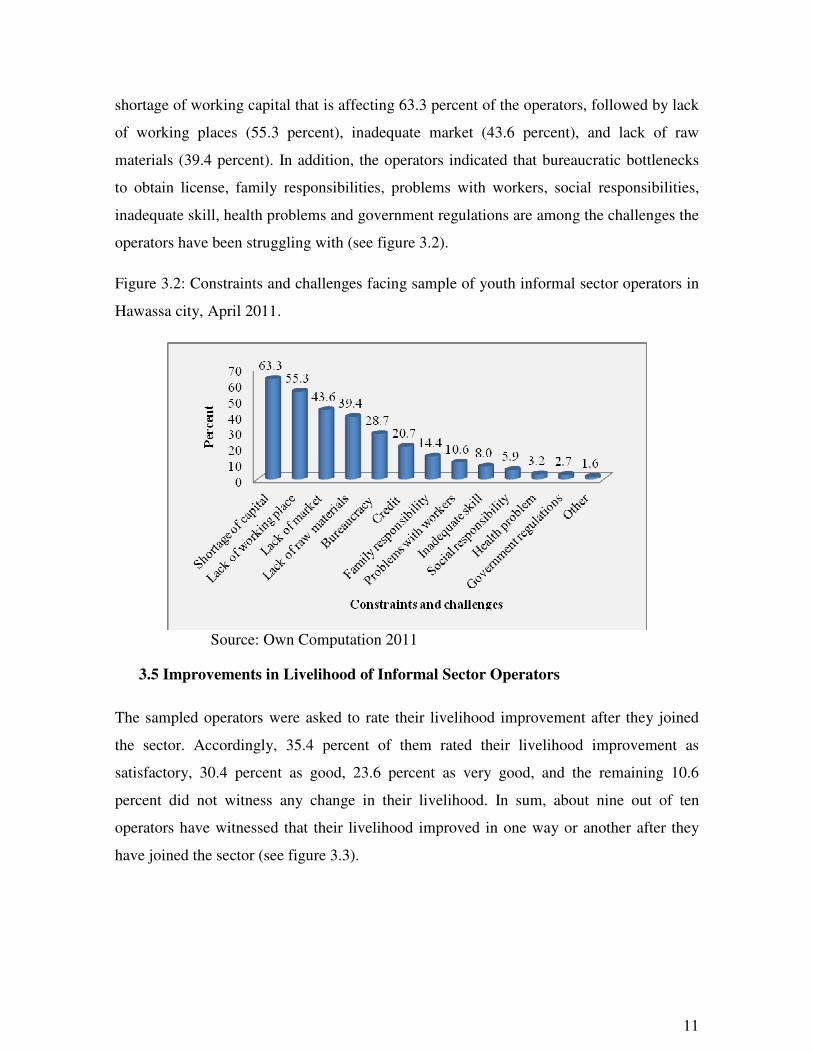
shortage of working capital that is affecting 63.3 percent of the operators, followed by lack
of working places (55.3 percent), inadequate market (43.6 percent), and lack of raw
materials (39.4 percent). In addition, the operators indicated that bureaucratic bottlenecks
to obtain license, family responsibilities, problems with workers, social responsibilities,
inadequate skill, health problems and government regulations are among the challenges the
operators have been struggling with (see figure 3.2).
Figure 3.2: Constraints and challenges facing sample of youth informal sector operators in
Hawassa city, April 2011.
Source: Own Computation 2011
3.5 Improvements in Livelihood of Informal Sector Operators
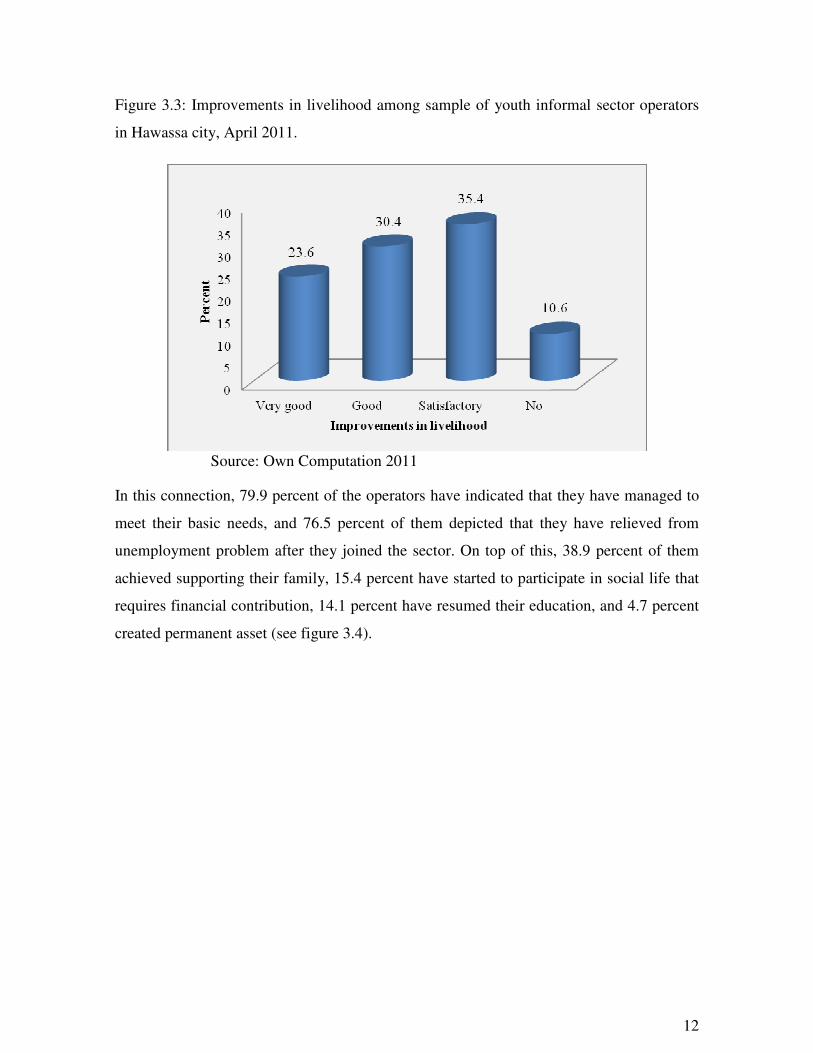
The sampled operators were asked to rate their livelihood improvement after they joined
the sector. Accordingly, 35.4 percent of them rated their livelihood improvement as
satisfactory, 30.4 percent as good, 23.6 percent as very good, and the remaining 10.6
percent did not witness any change in their livelihood. In sum, about nine out of ten
operators have witnessed that their livelihood improved in one way or another after they
have joined the sector (see figure 3.3).
12
Figure 3.3: Improvements in livelihood among sample of youth informal sector operators
in Hawassa city, April 2011.
Source: Own Computation 2011
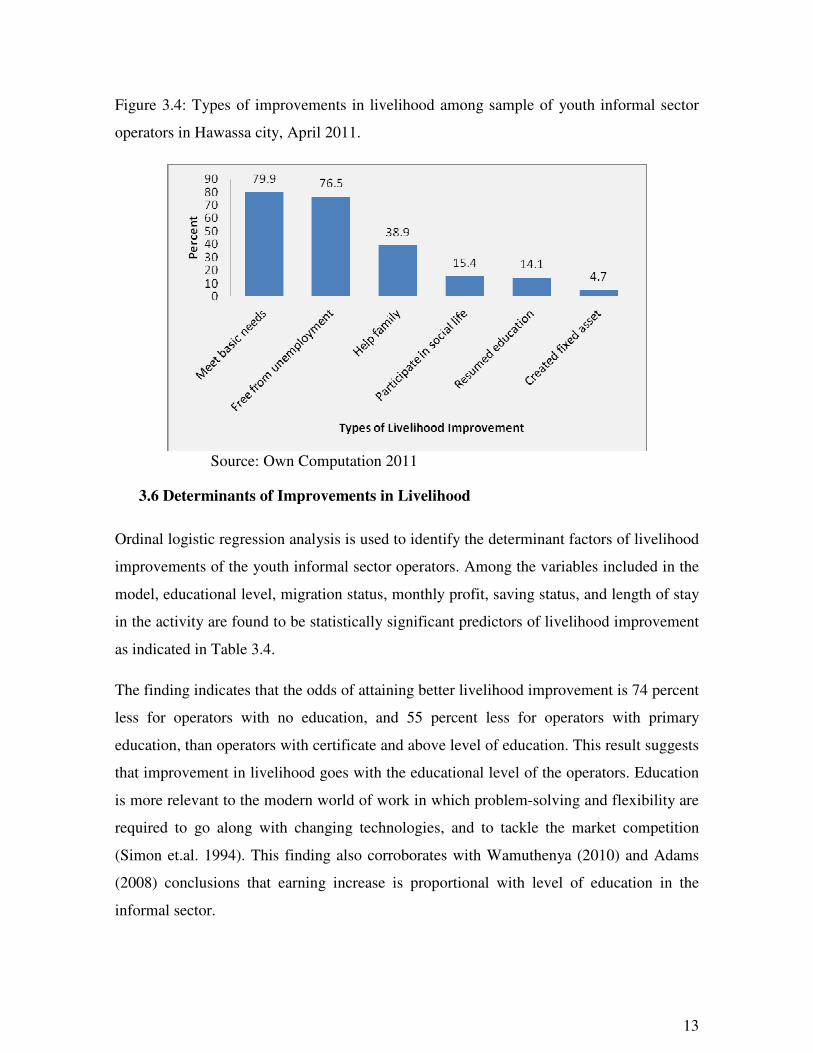
In this connection, 79.9 percent of the operators have indicated that they have managed to
meet their basic needs, and 76.5 percent of them depicted that they have relieved from
unemployment problem after they joined the sector. On top of this, 38.9 percent of them
achieved supporting their family, 15.4 percent have started to participate in social life that
requires financial contribution, 14.1 percent have resumed their education, and 4.7 percent
created permanent asset (see figure 3.4).
13
Figure 3.4: Types of improvements in livelihood among sample of youth informal sector
operators in Hawassa city, April 2011.
Source: Own Computation 2011
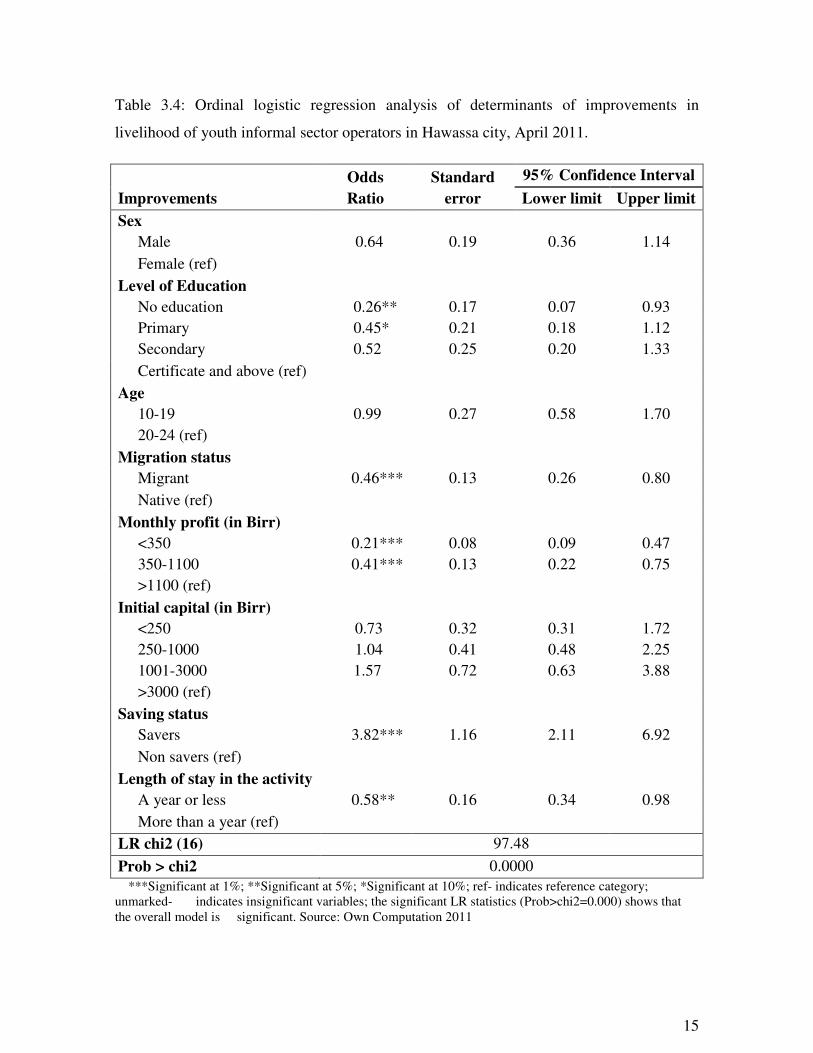
3.6 Determinants of Improvements in Livelihood
Ordinal logistic regression analysis is used to identify the determinant factors of livelihood
improvements of the youth informal sector operators. Among the variables included in the
model, educational level, migration status, monthly profit, saving status, and length of stay
in the activity are found to be statistically significant predictors of livelihood improvement
as indicated in Table 3.4.
The finding indicates that the odds of attaining better livelihood improvement is 74 percent
less for operators with no education, and 55 percent less for operators with primary
education, than operators with certificate and above level of education. This result suggests
that improvement in livelihood goes with the educational level of the operators. Education
is more relevant to the modern world of work in which problem-solving and flexibility are
required to go along with changing technologies, and to tackle the market competition
(Simon et.al. 1994). This finding also corroborates with Wamuthenya (2010) and Adams
(2008) conclusions that earning increase is proportional with level of education in the
informal sector.
14
Migrant operators are 54 percent less odds of livelihood improvement compared to the
native operators of the city. This may be because migrants move to the city with high
expectation of livelihood improvement. However, they are obviously confronted with a
host of challenges and difficulties while struggling to adjust themselves with the city life
style. Partly, also migrants might be treated partially when looking for working premises,
and access to finance to expand their business.
The odds of gaining better improvement in livelihood is 79 percent and 59 percent lower
for operators who earn an average monthly profit of less than Birr 350, and Birr 350 –
1100, respectively than those operators who earn an average monthly profit of more than
1100 Birr. This means operators who are generating higher profit are enjoying better
improvement in their livelihood. It is obvious that improvement in livelihood is associated
with more profit generating capacity.
Saving can boost the odds of livelihood improvement by over 3 folds when the operators
have a saving culture than when they do not have the culture. Saving helps people to plan
for future expense, cope with stochastic crises and cover unanticipated expenses (Bamlaku
2006).
The longer the operators stayed in the business, the better the operators have improvement
in their livelihood compared to the operators who stayed short in the business.
Accordingly, those operators who stayed in the sector for a year or less have shown a
chance of improvement in livelihood by 42 percent less than those operators who stayed in
the sector for more than a year. This shows that longer stay in the business is associated
with better improvement. With longer stay in the business, the operators familiarize
themselves with the business environment and generate more profit which helps them to
improve their livelihood.
15
Table 3.4: Ordinal logistic regression analysis of determinants of improvements in
livelihood of youth informal sector operators in Hawassa city, April 2011.
Improvements
Odds
Ratio
Standard
error
95% Confidence Interval
Lower limit Upper limit
Sex
Male 0.64 0.19 0.36 1.14
Female (ref)
Level of Education
No education 0.26** 0.17 0.07 0.93
Primary 0.45* 0.21 0.18 1.12
Secondary 0.52 0.25 0.20 1.33
Certificate and above (ref)
Age
10-19 0.99 0.27 0.58 1.70
20-24 (ref)
Migration status
Migrant 0.46*** 0.13 0.26 0.80
Native (ref)
Monthly profit (in Birr)
<350 0.21*** 0.08 0.09 0.47
350-1100 0.41*** 0.13 0.22 0.75
>1100 (ref)
Initial capital (in Birr)
<250 0.73 0.32 0.31 1.72
250-1000 1.04 0.41 0.48 2.25
1001-3000 1.57 0.72 0.63 3.88
>3000 (ref)
Saving status
Savers 3.82*** 1.16 2.11 6.92
Non savers (ref)
Length of stay in the activity
A year or less 0.58** 0.16 0.34 0.98
More than a year (ref)
LR chi2 (16) 97.48
Prob > chi2 0.0000
***Significant at 1%; **Significant at 5%; *Significant at 10%; ref- indicates reference category;
unmarked- indicates insignificant variables; the significant LR statistics (Prob>chi2=0.000) shows that
the overall model is significant. Source: Own Computation 2011
16
4. Conclusion and Recommendations
Informal sector plays a crucial role in urban poverty alleviation through creating jobs and
reducing unemployment. Consequently, many developing countries are recognizing the
sector’s importance in their economy and trying to put appropriate policies in place to
encourage the sector (Reddy, Vijay and Manoranjan 2002). In view of its contribution to
socio-economic development, an enabling environment has to be created for operators in
order to facilitate the transition of the sector to formality (Asmamaw 2004).
Shortage of working capital is the major impediment that the operators have indicated in
the sector. In this respect, the policy makers need to design imperative measures to solve
this hindrance factor, such as through providing access to microcredit and/or special credit
services. Lack of working premises is the other challenge that the operators are confronted
with, which deserves an immediate attention by the government. Similarly, it is also vital
to tackle the problems of an inadequate market and a shortage of raw materials.
Better educated operators enjoyed improvement in livelihood, which in turn has a direct
policy implication to improve and/or upgrade the educational level of the operators.
Moreover, supporting the operators by providing business trainings may help them to
generate better profit. It is essential to cultivate and beef up the culture of saving in order to
improve the livelihood of the operators. On the other hand, migrants are not enjoying
better livelihood improvement compared to their counterparts, because migrants are
partially treated in terms of getting working premises, and financial assistance. The policy
implication is that there is a need to give equal opportunities to the migrants, and to resolve
the attitude of partiality towards them.
To sum, the operators should be encouraged to join the formal sector by lessening the
bureaucracy to get license, minimizing entry cost such as lowering registration or licensing
cost, providing tax-holidays for sometimes etc.
17
References
Adams, Arvil V. 2008. Skills development in the informal sector of sub-Saharan Africa.
World Bank. http://siteresources.worldbank.org/INTLM/Resources/39004111411
41801867/2275364-1213970047519/Skills_for_Informal_Sector-6042008.pdf
(accessed June 03, 2011).
Agresti, Alan. 2002. Categorical data analysis. 2nd
edition, A John Wiley & Sons, Inc.,
Publication. Hoboken, New Jersey.
Asmamaw, Enquobahrie. 2004. Some controversies on informal sector operation in
Ethiopia: problems and prospects for development strategies.
http://homepages.wmich.edu/~asefa/Conference%20and%20Seminar/Papers/2003
%20papers/E nquobahirie,%20Asmamaw%20(delete).pdf (accessed November 10,
2010).
Bamlaku, Alamirew. 2006. Micro financing and poverty reduction in Ethiopia. A paper
prepared under the internship program of IDRC, ESARO, Nairobi.
http://www.acsi.org.et/case%20study.pdf (accessed July 07. 2011).
Central Statistics Agency (CSA). 2004. Report on urban informal sector sample survey.
Addis Ababa, Ethiopia.
______. 2008. Summary and statistical report of the 2007 population and housing census.
Addis Ababa, Ethiopia.
______. 2011. Statistical report on the 2011 urban employment unemployment survey.
Addis Ababa, Ethiopia.
Cochran, Williams G. 1977. Sampling techniques. 3rd
edition, John Wiley and Sons Inc.
Dhemba, J. 1999. Informal sector development: A strategy for alleviating urban poverty
in Zimbabwe. Journal of Social Development in Africa, 14(2), pp. 5-19.
18
Dobson, J. A. 2002. An introduction to generalized linear models. 2nd
edition, Chapman
and Hall/CRC.
Green, William H. 2003. Econometric analysis. 5th
edition, Upper Saddle River, New
Jersey.
International Labour Organization (ILO). 2012. Global employment trends for youth 2012.
International Labour Office, Geneva, Switzerland.
International Labour Organization (ILO). 2012. The youth employment crisis 2012.
International Labour Office, Geneva, Switzerland.
Lal, N. and Shiu R. 2006. The informal economy in small island developing state. case
study: Fuji island. Expert Group on Informal Sector Statistics (Delhi Group), 11th
& 12th
May 2006, New Delhi, India. http://www.mospi.nic.in/GDP%2005.doc
(accessed November 29, 2009).
Reddy, M., Vijay, N., and Manoranjan M. 2002. The urban informal sector in fuji:
Result from a survey. Fujian Studies, 1(1), pp. 127-154.
Ruffer, T. and John K. 2007. Informal sector labor markets in developing countries.
Oxford Policy Management, United Kingdom. http://www.opml.co.uk/sites/opml/
files/Informal%20sector%20labour%20markets%20i %20developing%20countries
0.pdf (accessed November 12, 2009).
Semboja, Haji Hatibu Haji. 2007. The youth employment in East Africa: An integrated
labour market perspective. African Integration Review. Vol. 1, No. 2.
Simon, M., Kenneth, K., Fiona, L., and Roy, C. 1994. Education and training for the
informal sector. Education Research Paper No. 11, 1994, pp. 332.
The Word Bank. 2008. African development indicators 2007. Washington, D.C., U.S.A.
United Nations. 2011. World Population Prospects 2010 Revised Dataset. http://esa.un.org/
unpd/wpp/unpp/panel_population.htm.
19
United Nations Center for Human Settlement (UNCHS) (Habitat). 2006. Supporting the
informal sector in low-income settlements. UN-HABITAT, Nairobi, Kenya.
http://www.eukn.org/E_library/Economy_Knowledge_Employment/Urban_Econo
my/Urban_Economy/Supporting_the_Informal_Sector_in_Low_Income_Settlemen
ts (accessed June 13, 2011).
United Nations Economic Commission for Africa (UNECA). 2005. Youth, education,
skills and employment. Poverty and Social Policy Team Economic and Social
Policy Division.
United Nations Economic and Social Council (UNESC). 2006. Poverty and the informal
sector: Role of the informal sector in poverty reduction. Economic and Social
Commission for Asia and the Pacific (ESCAP), 29 November – 1 December
2006, Bangkok. http://www.unescap.org/pdd/CPR/CPR2006/English/CPR31E.pdf
(accessed May 17, 2010).
Wamuthenya, R. W. 2010. Determinants of employment in the formal and informal
sectors of the urban areas of Kenya. AERC Research Paper 194 African
Economic Research Consortiums, Nairobi, April 2010.http://www.aercafrica.org/
documents/RP194.pdf (accessed June 13, 2011).
Yuki, K. 2007. Urbanization, informal sector, and development. Journal of Development
Economics, 84 (2007), pp. 76–103.


![The ILO and the informal sector: an institutional history · on the informal sector¨] [IOE Seminar on the informal sector] ILC debat on "The Dilemma of the Informal Sector" ICLS](https://img.pdfslide.net/doc/110x75/5cb8488988c993af7a8b66d0/the-ilo-and-the-informal-sector-an-institutional-history-on-the-informal-sector.jpg)