Embed Size (px)
Citation preview
University of Central Florida University of Central Florida
STARS STARS
HIM 1990-2015
2014
The Role of Intestinal Sweet Taste Receptors (STRS) in the The Role of Intestinal Sweet Taste Receptors (STRS) in the
Regulation of Glucose Absorption: Effects of Short Term High Regulation of Glucose Absorption: Effects of Short Term High
Sucrose Diet (HSD) Sucrose Diet (HSD)
Tania Hussain University of Central Florida, [email protected]
Part of the Microbiology Commons, and the Molecular Biology Commons
Find similar works at: https://stars.library.ucf.edu/honorstheses1990-2015
University of Central Florida Libraries http://library.ucf.edu
This Open Access is brought to you for free and open access by STARS. It has been accepted for inclusion in HIM
1990-2015 by an authorized administrator of STARS. For more information, please contact [email protected].
Recommended Citation Recommended Citation Hussain, Tania, "The Role of Intestinal Sweet Taste Receptors (STRS) in the Regulation of Glucose Absorption: Effects of Short Term High Sucrose Diet (HSD)" (2014). HIM 1990-2015. 1839. https://stars.library.ucf.edu/honorstheses1990-2015/1839
THE ROLE OF INTESTINAL SWEET TASTE RECEPTORS (STRS) IN
THE REGULATION OF GLUCOSE ABSORPTION: EFFECTS OF SHORT
TERM HIGH SUCROSE DIET (HSD)
by
TANIA HUSSAIN
A thesis submitted in partial fulfillment of the requirements
for the Honors in the Major Program in Biomedical Sciences
in the College of Medicine
and in The Burnett Honors College
at the University of Central Florida
Orlando, Florida
Fall Term 2014
Thesis Chair: Dr. Robert Borgon
ii
ABSTRACT
Sweet taste receptors are primarily found in the oral cavity of the mammalian species.
However, recent studies have shown that sweet taste receptors can be found in extraoral tissues
such as the pancreas, intestines, and adipose tissue. Our lab has previously found that sweet taste
receptors are down-regulated on the pancreas in the presence of high plasma glucose levels. In
order to assess the possibility that sweet taste receptors respond to high levels of glucose by
suppressing its expression, we wanted to see if they reacted similarly on the intestines. We found
that intestinal sweet taste receptors are down regulated in the presence of a 24 hour high sucrose
diet (60% sucrose), and a 7 day high sucrose diet in both wild type (WT) mice on the high
sucrose diet, and T1R2-KO (lacking sweet taste receptors) mice. We also examined their glucose
excursion levels, and found that these mice are lacking a normal response to dietary glucose via
an oral glucose tolerance test (OGTT). This led us to conclude that the mice lacking sweet taste
receptor expression exhibit abnormal glucose absorption, possibly indicating that sweet taste
receptors regulate glucose absorption in the intestines.
iii
ACKNOWLEDGEMENTS
I would like to express my gratitude to those who have helped make this thesis possible. Thank
you to Dr. George Kyriazis for being my mentor throughout this process and helping me
tremendously with all aspects of my thesis. From editing my thesis to helping me interpret data, I
appreciate all the help he has given me. I would also like to thank Kathleen Smith for helping me
perform some of the experiments and for teaching me a great deal of laboratory techniques
during my time at the Sanford Burnham Medical Research Institute at Lake Nona. I would also
like to thank Dr. Richard Pratley for allowing me to work on this project in his lab, and for
taking me in as an intern two and a half years ago. The experience I’ve gained is worth more
than I hoped for.
I would also like to thank Dr. Robert Borgon for supporting me during this process, and from the
time I sat in his QBM course. I appreciate what he did for me as a student by giving me the
opportunity to grow by continuing this thesis, and recognizing that I had what it takes to be a part
of his PILOT program. Thank you to those that were also a part of my committee, without Dr.
William Self, Dr. Dinender Singla, and Dr. Laurence Vonkalm this thesis would not be possible.
I appreciate all the time they’ve taken out of their busy schedules to review it.
I would like to thank my friend, Anna Cruz, for making the illustrations for this thesis. I
appreciate the time she took to try to understand a topic that was foreign to her, and being one of
my biggest supporters throughout this process. Thank you to my friend, David Abergel, for
supporting me throughout this process. Also, allowing me to repeat and explain this information
countless times leading up to my defense. Lastly, I would like to thank all my friends and family
members who have helped me get through these past years at the University of Central Florida.
iv
TABLE OF CONTENTS
CHAPTER 1: INTRODUCTION ......................................................................................................................... 1
Taste Receptors on the Tongue ................................................................................................................ 1
STR Ligand Binding and Signaling .......................................................................................................... 2
STRs on Extra-oral Tissues ......................................................................................................................... 4
STRs in the Intestine.................................................................................................................................. 6
Intestinal glucose absorption and its regulation .................................................................................. 6
Digestion of Glucose ............................................................................................................................. 6
Glucose Transport ................................................................................................................................. 7
Regulation of intestinal glucose absorption ....................................................................................... 10
Overview of Study ................................................................................................................................... 14
CHAPTER 2: RESULTS ................................................................................................................................... 15
Intestinal Sweet Taste Receptors Are Down-Regulated in Response to Short Term High Sucrose Diet
(HSD) ....................................................................................................................................................... 15
T1R3 Receptor is Down-Regulated in T1R2-KO Mice in Response to Short Term High Sucrose Diet
(HSD) ....................................................................................................................................................... 17
A Short Term High Sucrose Diet (HSD) in T1R2-KO Mice Does Not Alter Plasma Glucose Excursions
during an Oral Glucose Tolerance Test (OGTT) ....................................................................................... 18
Glucose Transporters are Down-Regulated in T1R2-KO Mice Compared to WT Mice ........................... 20
STR Expression is Suppressed in 7 Day HSD-WT and HSD- T1R2 Mice ................................................... 21
Long Term (7-Day) HSD Causes Glucose Intolerance in WT and T1R2-KO Mice .................................... 23
Glucose Oxidation May Account for the Reduced Glucose Absorption in WT and T1R2-KO mice on 24
hour HSD ................................................................................................................................................. 25
CHAPTER 3: MATERIALS AND METHODS .................................................................................................... 27
Animals and Mouse Intestine Isolation .................................................................................................. 27
Quantitative real-time PCR ..................................................................................................................... 27
Oral Glucose Tolerance Tests .................................................................................................................. 28
Surgical Catheterization of Mice ............................................................................................................. 28
Plasma Analysis ....................................................................................................................................... 29
v
CHAPTER 4: DISCUSSION ............................................................................................................................. 30
Limitations .............................................................................................................................................. 33
Summary ................................................................................................................................................. 33
APPENDIX A: IACUC PROTOCOL APPROVAL FORM ................................................................................... 35
APPENDIX B: AALAS ANIMAL CARE AND USE COURSES TRANSCRIPT........................................................ 37
APPENDIX C: LABORATORY ANIMAL ALLERGY COMPLETION CERTIFICATE ................................................ 39
APPENDIX D: POST-PROCEDURE CARE OF MICE AND RATS IN RESEARCH COMPLETION CERTIFICATE .... 41
APPENDIX E: WORKING WITH THE IACUC COMPLETION CERTIFICATE ..................................................... 43
APPENDIX F: WORKING WITH THE LABORATORY MOUSE COMPLETION CERTIFICATE ............................. 45
LIST OF REFERENCES ................................................................................................................................... 47
vi
LIST OF FIGURES
Figure 1 - 1: A representation of the sweet taste receptor.. ............................................................ 1
Figure 1 - 2: An Illustration depicting the signaling cascade of a lingual sweet taste receptor. .... 4
Figure 1 - 3: Depiction of GLUT2 translocation during fasted (left) and fed (right) states. .......... 8
Figure 1 - 4: The effects that GLP-1 has on various tissues. ........................................................ 12
Figure 2- 1: mRNA expression of 24 hour HSD fed WT mice.. .................................................. 16
Figure 2- 2: mRNA expression of 24 hour HSD fed T1R2-KO mice. ........................................ 17
Figure 2- 3: OGTT performed on T1R2-KO mice on CON and 24 hour HSD.. .......................... 18
Figure 2- 4: Absolute mRNA expression of 24 CON fed WT and T1R2-KO.. .......................... 20
Figure 2- 5: mRNA expression of 7 day HSD and CON fed WT and T1R2-KO.. ...................... 22
Figure 2- 6: OGTT of 7 day HSD and CON fed WT and T1R2-KO. ......................................... 24
Figure 2- 7: OGTT of 24 hour CON or HSD fed WT and T1R2-KO mice using metabolizable
(13C-6 glucose) and nonmetabolizable (3-O-methyl-glucose) glucose analogs.. ........................ 26
1
CHAPTER 1: INTRODUCTION
Taste Receptors on the Tongue
Humans use their taste buds to help them distinguish between the types of food they are
consuming, whether it is delicious, toxic, or unpleasant. There are five taste sensations: sour,
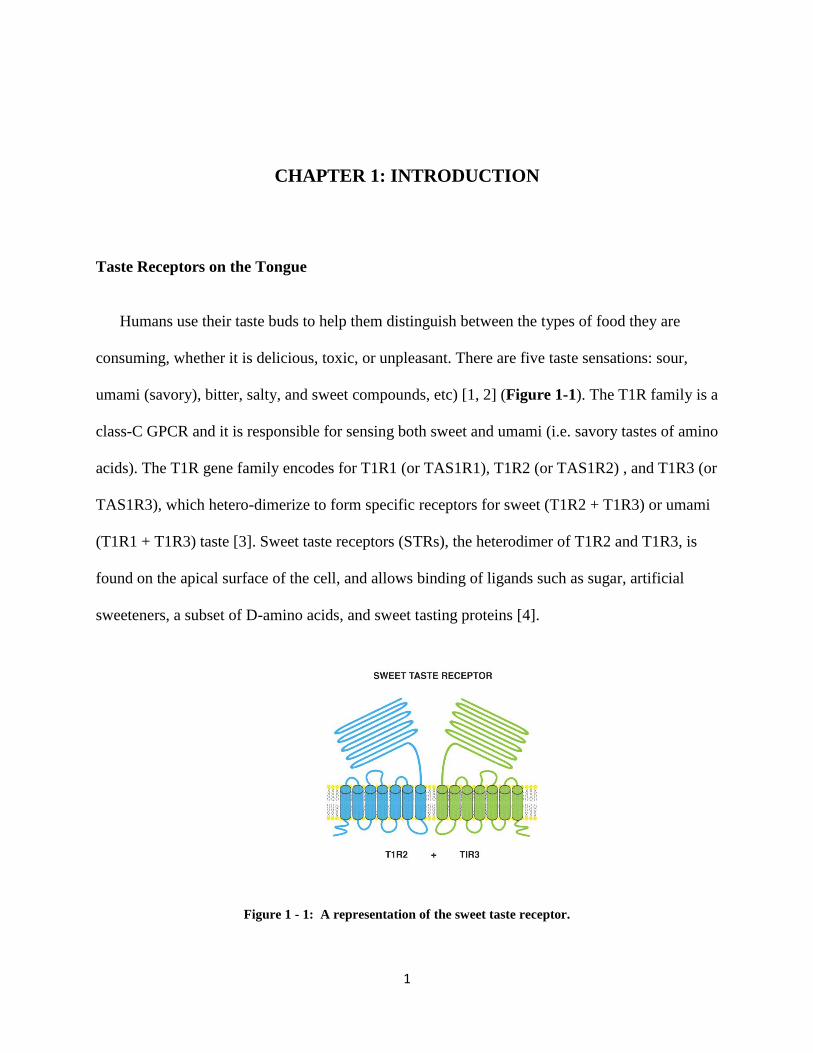
umami (savory), bitter, salty, and sweet compounds, etc) [1, 2] (Figure 1-1). The T1R family is a
class-C GPCR and it is responsible for sensing both sweet and umami (i.e. savory tastes of amino
acids). The T1R gene family encodes for T1R1 (or TAS1R1), T1R2 (or TAS1R2) , and T1R3 (or
TAS1R3), which hetero-dimerize to form specific receptors for sweet (T1R2 + T1R3) or umami
(T1R1 + T1R3) taste [3]. Sweet taste receptors (STRs), the heterodimer of T1R2 and T1R3, is
found on the apical surface of the cell, and allows binding of ligands such as sugar, artificial
sweeteners, a subset of D-amino acids, and sweet tasting proteins [4].
Figure 1 - 1: A representation of the sweet taste receptor.
2
STR Ligand Binding and Signaling
STRs bind a variety of ligands that vary across mammalian species. For example, in
rodents, aspartame is not sucrose-like, and they avoid it. Cats don’t express T1R2 because it is
deemed a pseudo gene, and in humans the sweet inhibitor, lactisole, is ineffective in the rat.
Therefore, when conducting these studies, sugar preferences were taken into account [4].
STRs contain four different ligand binding domains on both the T1R2 and T1R3 subunits.
Three noteworthy domains include the large extracellular venus flytrap domain (VFTD), which
is linked to the heptahelical transmembrane domain (TMD) via the short cysteine rich domain
(CRD)[5, 6]. It has been discovered that the CRD contains nine highly conserved cysteines, and
the VFTM contains a conserved cysteine that is important for signal transduction once a ligand is
bound [6]. Each domain has been shown to bind to different ligands, such as glucose, fructose,
sweet proteins such as brazzein, cyclamate, and some artificial sweeteners. Agonists can bind to
the VFD of hT1R2 (human) and stabilize the closed conformation, or the agonist can bind to
either the TMD of either T1R2 or T1R3 [5]. Residues located on the CRD of hT1r3 have been
found to bind to sweet proteins. There are also positive allosteric modulators (PAMs) that are
tasteless for human STRs, but are able to enhance the activity of an orthosteric agonist [5]. These
PAMs bind to the TMD of the receptors and can enhance the activity of the receptor binding,
and/or affinity of the ligand [5].
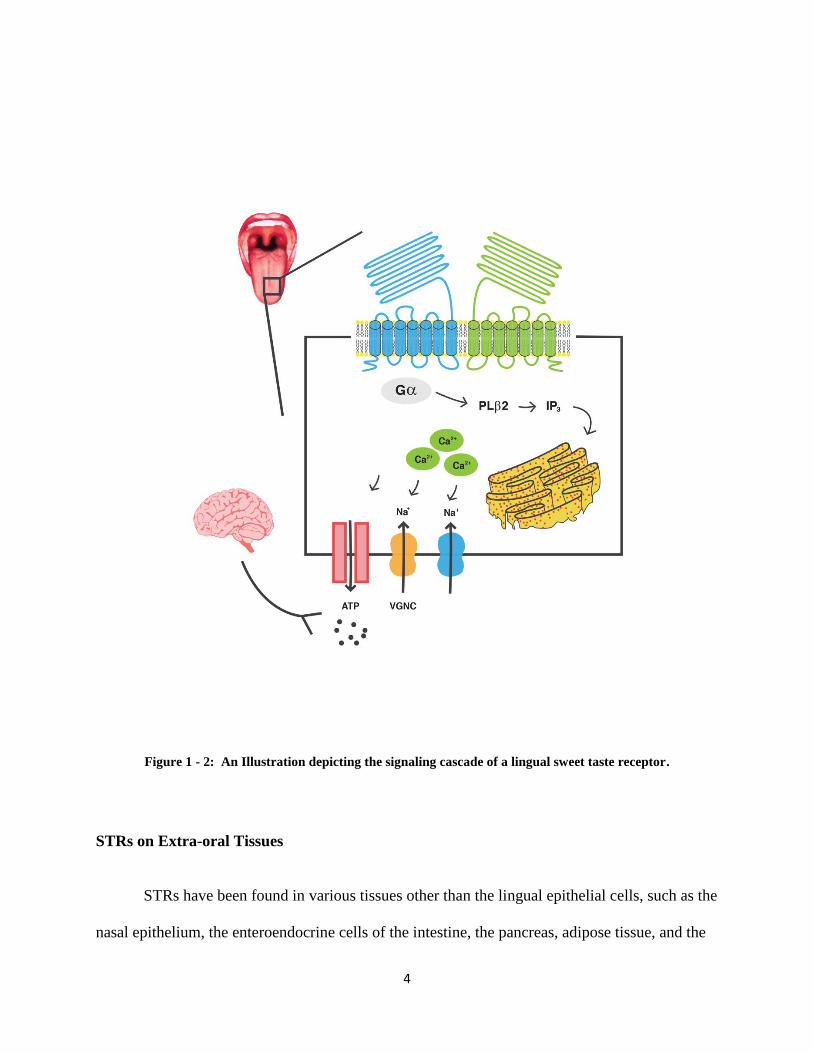
Signal transduction begins with the ingestion of chemicals/nutrients (tastants), and a
signal cascade is mediated via taste receptor cells responsible for umami, sweet, and bitter taste
when bound to its tastant. When taste receptors are stimulated, the cells becomes depolarized
3
which leads to increased calcium levels within the cell, which in turn leads to exocytosis of a
neurotransmitter and the activation of afferent taste neurons (9).
Ligand binding to STRs activates phosphatidylinositol-4,5-bisphosphate
phosphodiesterase beta-2 (PLC2) causing the hydrolysis of phosphatidynlinositol 4,5-
bisphosphate (PIP2) to inositol triphosphate (IP3 )and diacylglycerol (DAG). IP3 binding to IP3-
receptors (IP3-Rs) on the endoplasmic reticulum (ER) stimulates calcium release. Calcium then
activates the transient receptor potential cation channel subfamily M member 5 (TRPM5)
channels on the cell-surface, allowing sodium influx and cell membrane depolarization. The
resulting voltage-dependent calcium channel (VDCC) activation leads to calcium influx, and
elevated intracellular calcium concentrations ([Ca2+
]i) triggers exocytosis of ATP. In taste cells,
the release of ATP acts as a paracrine signal to gustatory afferent axons (Figure 1-2). Loss-of-
function studies targeting TRPM5 or PLC2 eliminate all sweet and umami taste responses in
mice [7, 8].
4
Figure 1 - 2: An Illustration depicting the signaling cascade of a lingual sweet taste receptor.
STRs on Extra-oral Tissues
STRs have been found in various tissues other than the lingual epithelial cells, such as the
nasal epithelium, the enteroendocrine cells of the intestine, the pancreas, adipose tissue, and the

5
brain [4, 9]. Unlike their known function in the mouth, the functions of STRs in nongustatory
tissues are still elusive.
STRs of pancreatic beta-cells were found to be activated by fructose and exhibit
synergistic effects with glucose to amplify insulin secretion in both mice and human islets [10].
By using T1R2-KO mice, Kyriazis et al was able to determine that circulating fructose and
saccharin (an artificial sweetener) potentiate insulin secretion in mice and in vitro mediated by
STRs on beta-cells. A STR inhibitor, lactisole, was used in isolated human islets, showing
diminished fructose induced insulin secretion by the human islets [10].
STRs on white adipocytes are expressed during adipogenesis of mouse and human
precursors upon treatment of artificial sweeteners such as saccharin and acesulfame potassium
(AceK) [11].
STRs on the enteroendocrine cells of the intestines have been found to play a role in both
glucose absorption and the incretin effect. STR signaling promotes insertion of GLUT2 to the
apical surface of the enterocytes, and up regulation of SGTL-1, which are both glucose
transporters [7]. They also promote secretion of GLP-1 and GIP, the two incretin hormones.
STRs has been purposed to play a role as a gut carbohydrate sensor [8]. Studies in mice lacking
STR signaling show defective GLP-1 secretion in response to luminal glucose, compared to the
wild type mice [12]. Collectively, these data suggest that STRs function to coordinate adaptive
responses of the intestine, beta cells and adipocytes to changes in nutrient availability,
optimizing energy absorption, metabolism and storage.
6
STRs in the Intestine
Intestinal glucose absorption and its regulation
The gastrointestinal (GI) tract detects many nutrients, non-nutrients, mechanical factors,
microorganisms, drugs, and toxic chemicals when ingested. Detection of such factors allows the
organ to react appropriately through stimulation of sensory nerves, or hormonal response. These
responses help to regulate some of the most important pathways in our system, from nutrient
digestion and storage, to the many important metabolic pathways needed to keep our body in
homeostasis.
Digestion of Glucose
Glucose is an energy source for all tissues in the body. Therefore, it is important to be
properly transported where it is needed. Before their absorption carbohydrates must be digested
by salivary and pancreatic amylases, and by dissacharidases on the brush border of the
enterocytes of the small intestine. These complex sugars are digested to monosaccharides and
now in their proper state to be absorbed by mature enterocytes of the small intestine [13].
Sucrose is a common dietary source of carbohydrates, and is digested to both glucose and
fructose by the enzyme sucrase. These monosaccharides are absorbed into the bloodstream via
specialized receptors on the brush border membrane facing the lumen. Glucose is a polar
molecule that requires specialized receptors in order to cross the lipid bilayer of the enterocytes.
7
Two receptors that transport glucose across the cell membrane are the sodium-glucose
cotransporter-1 (SGLT-1) and the glucose transporter 2 (GLUT2).
Glucose Transport
SGLT-1 is the primary glucose transporter across the brush border membrane and into
the enterocytes. However, it has been seen that not all glucose transport into the cytoplasm of the
cell is halted when SGLT-1 is not present. It has been shown that GLUT2 (a glucose transporter)
is also present and brought to the apical membrane of the cell when glucose is sensed inside the
cell [14]. SGLT-1 is a low capacity, high affinity transporter, and the only transporter capable of
moving glucose against its concentration gradient [15]. SGLT-1 is a symport transporter that is
mediated by the energy produced from a Na+ electrochemical potential gradient across the brush
border membrane. This sodium gradient is produced by a sodium/potassium ATPase at the
basolateral membrane of the enterocyte, which is responsible for pumping three sodium ions out
of the cells as they are being transported into the cell via SGLT-1. As sodium is being pumped
out, two potassium ions are being pumped in to maintain the appropriate potential within the cell.
Two sodium ions are attached to SGLT-1 and allow one glucose molecule to adhere to the
transporter. Sodium binding allows conformational change of the protein and subsequent binding
of glucose. The molecules are then transported into the cell, and dissociation is promoted by low
intracellular sodium concentrations and low affinity sodium and glucose binding within the
cell[16]. To keep iso-osmolarity within the cell, as SGLT-1 is importing sodium and glucose,
8
water is also taken into the cell leading to the conclusion that water absorption is glucose
dependent within the upper and mid-intestine [16].
GLUT2 is a facilitative glucose transporter that is mainly found in the intestines, liver,
kidney, and pancreatic beta cells and helps mediate glucose homeostasis [17]. GLUT2 is a low
affinity, and high capacity glucose transporter, and is responsible for the transportation of
glucose between the enterocyte and the plasma. GLUT2 is also apically translocated via glucose-
induced membrane depolarization triggered by SGLT-1 [17].
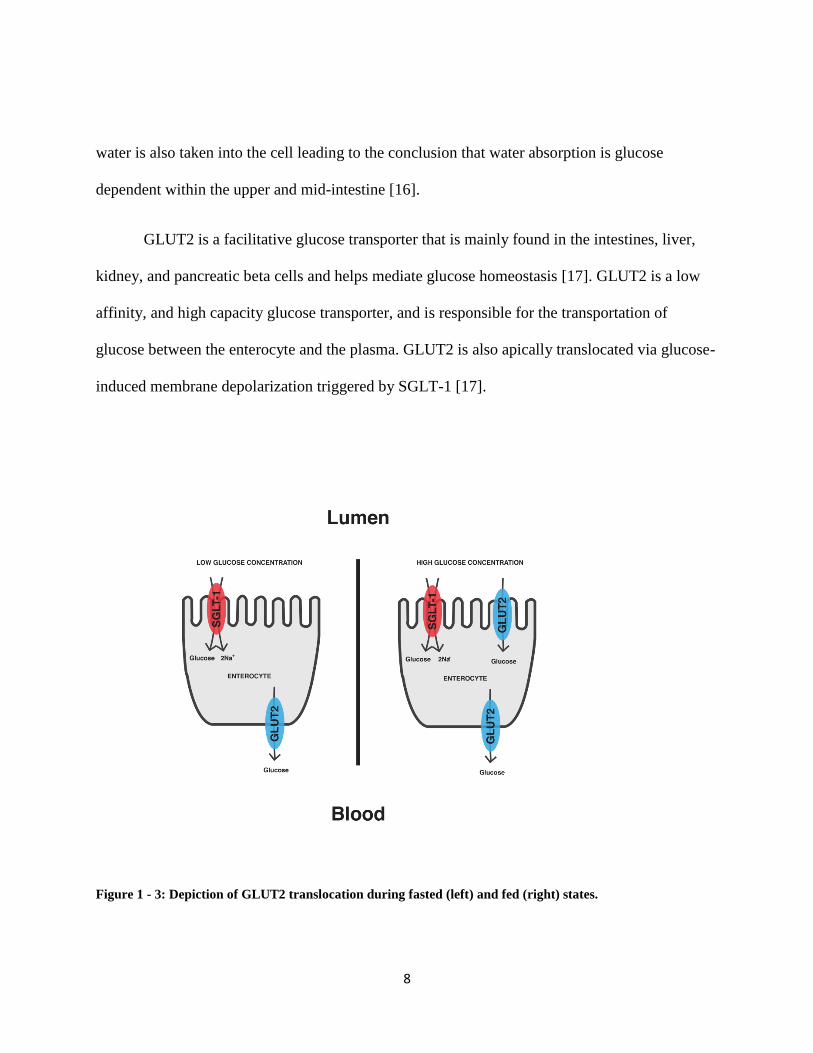
Figure 1 - 3: Depiction of GLUT2 translocation during fasted (left) and fed (right) states.
9
The large absorptive capacity of glucose into the enterocyte suggests the presence of an
additional transporter, since SGLT-1 has low absorptive rates [18]. A study was done to confirm
GLUT2s presence in the apical membrane using phloretin, (GLUT2 inhibitor), and observing a
40% decrease in glucose absorption in rat jejunal brush border membrane [18]. It was also shown
that 30% of fructose absorption is also reduced when phloretin was infused in the intestine,
indicating that GLUT5 was not the only fructose transporter in the lumen [18]. Prior to a meal,
there is a low glucose concentration in the lumen, and SGLT-1 is the only active transporter
bringing glucose into the cell. Postprandial glucose absorption varies in the mechanism of which
GLUT2 exhibits. Due to SGLT-1s low capacity binding, saturation of SGLT-1 can take place
after a meal. To help transport glucose into the cell, GLUT2 is able to translocate to the apical
membrane of the enterocyte when activated. GLUT2 is a reversible receptor that is able to
secrete and absorb glucose in and out of the cell. When there is low intracellular glucose
concentration, GLUT2 is able to transport glucose back into the enterocyte in the absence of
glucose in the gut [16].
GLUT2 is also known to transport galactose and fructose out of the enterocyte and into
the blood plasma. However, fructose is mainly transported by GLUT5, another GLUT sugar
transporter. GLUT5 is a uniporter that mediates fructose secretion from the enterocyte. Fructose
is absorbed passively along the brush border membrane of the intestine. This occurs
independently of glucose or galactose absorption [15, 16].
10
Regulation of intestinal glucose absorption
In the gastrointestinal (GI) tract, there are 14 or more different types of enteroendocrine
cells [8]. Luminal nutrients such as carbohydrates and bitter tastants are able to stimulate
GPCRs on enteroendocrine cells of the GI tract. STRs are expressed on the enteroendocrine K-
cells and L-cells [19]. K-cells, located in the upper small intestine, secrete glucose-dependent
insulinotropic peptide (GIP). L-cells, located in the lower intestine and colon, are
enteroendocrine cells that secrete the hormones glucagon-like peptide-1 (GLP-1), GLP-2, and
peptide YY (PYY). These hormones play a role in the gut regulatory system contributing to
functions such as regulation of appetite, the incretin effect, and gut motility.
Hormonal Regulation
GIP, a 42-amino acid hormone, was formerly known as gastric inhibitory polypeptide due
to its inhibitory effect on gastric acid secretion [20]. After secretion from the K cells, it enters the
bloodstream and is rapidly degraded by dipeptidyl peptidase-4 (DPP-4). Upon cleavage by DPP-
4, GIP loses its insulinotropic effect on the pancreas, which affects the incretin response [20]. It
is secreted when glucose is present, but it is also responsive when protein and fats are ingested. It
was shown that GIP secretion is more rapid and robust when fats are ingested rather than
proteins [21].
11
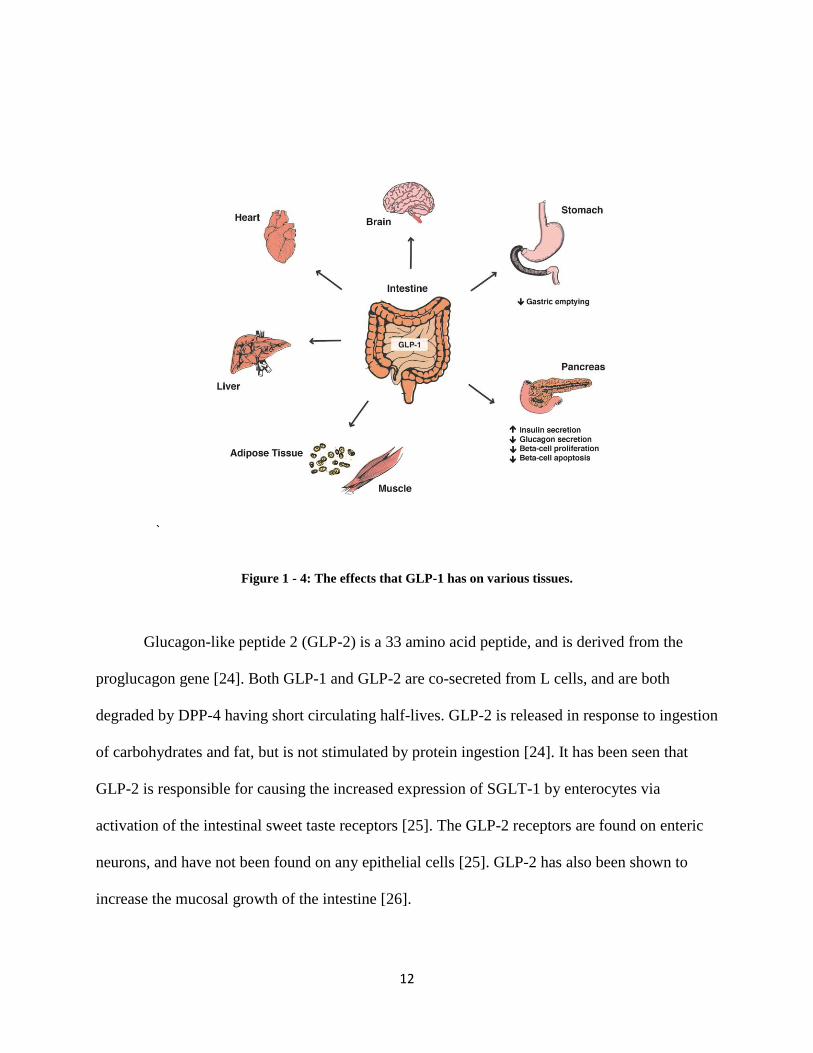
GLP-1, a 31 amino acid hormone, is encoded by the proglucagon gene, and shares 50%
homology to the glucagon hormone [22]. GLP-1 is released from the L cells of the distal ileum
and colon, and is stimulated upon nutrient ingestion. Some functions of this hormone include
stimulation of insulin secretion via the beta cells of the pancreas, deceleration of gastric
emptying, inhibition of glucagon, stimulation of somatostatin via direct contact with delta cells
of the pancreas, stimulation of beta cell proliferation, and inhibition of beta cell apoptosis [22,
23]. GLP-1 stimulates insulin release via the pancreatic beta cells, thus contributing to the
incretin effect along with GIP. GLP-1 has a biphasic response, one being an early, rapid (10-15
min) phase which is followed by a longer (15-30 min) phase [22]. The longer phase is believed
to be attributed to how long it takes for the nutrients to reach the lower intestine, allowing GLP-1
to be released upon stimulation of its enteroendocrine L cells. Similar to GIP, GLP-1 is also
inactivated by DPP-4 in less than two minutes of bioactive GLP-1 circulation [22].
12
`
Figure 1 - 4: The effects that GLP-1 has on various tissues.
Glucagon-like peptide 2 (GLP-2) is a 33 amino acid peptide, and is derived from the
proglucagon gene [24]. Both GLP-1 and GLP-2 are co-secreted from L cells, and are both
degraded by DPP-4 having short circulating half-lives. GLP-2 is released in response to ingestion
of carbohydrates and fat, but is not stimulated by protein ingestion [24]. It has been seen that
GLP-2 is responsible for causing the increased expression of SGLT-1 by enterocytes via
activation of the intestinal sweet taste receptors [25]. The GLP-2 receptors are found on enteric
neurons, and have not been found on any epithelial cells [25]. GLP-2 has also been shown to
increase the mucosal growth of the intestine [26].
13
The Incretin Effect
GLP-1 and GIP are incretin hormones that help increase insulin release from the pancreas
by acting on the pancreatic islets. Incretin hormones are known to help reduce blood glucose
levels by augmenting insulin release. The incretin effect is known as the observation that orally
ingested glucose is more effective in stimulating glucose secretion from the pancreas as opposed
to intravenously injected glucose [19]. GIP and GLP-1 bind to their receptors found on the
pancreatic beta cells, GIPR and GLP-1R, respectively [20]. These G-protein coupled receptors
activate adneylate cyclase and subsequently increasing levels of cyclic adenosine
monophosphate (cAMP) and stimulating glucose dependent insulin secretion.
Regulation of glucose absorption by STRs
STRs expressed on enteroendocrine cells are believed to be the sugar sensors of the
intestine. Margolskee et al showed that the STRs sense luminal glucose concentrations. This
causes a signaling cascade involving the STRs, alpha gustducin, and other taste signaling
elements to be activated in enteroendocrine cells, leading to the secretion of hormones such as
GLP-1 and GIP. He proposes that these hormones are responsible for the up regulation of SGLT-
1 expression on the enterocytes via a paracrine effect [7]. Mice that were knocked out for either
gustducin or T1R3 failed to increase SGLT-1 expression when fed a high carbohydrate diet [7,
27]. It has also been implicated that GLUT 2 trafficking into the apical surface of the enterocyte
is also regulated by STRs in the intestine [27]. The signaling cascade for enteroendocrine cell
14
hormone release via activation of STRs is thought to be similar to the STRs in the tongue. Sweet
tastants bind to the STR causing the G protein βγ subunit stimulation of PLCβ2 mediated
synthesis of IP3 leading to Ca+
release from intracellular stores [28]. Increased intracellular Ca+
concentrations trigger TRPM5 and subsequent hormone secretion from enteroendocrine K or L
cells. These hormones are hypothesized to act on the enteroendocrine cells and promotes up
regulation of SGLT-1 expression [29].
Overview of Study
In a previous study focused on human and mouse islet secretion of insulin, our lab found
that islets from mice with hyperglycemia or islets cultured in elevated fasting glucose conditions
in vitro exhibit a decrease in STR expression, suggesting a link between alterations in plasma
glucose and STR function [30]. The regulatory effects of ambient glucose on islet STRs led us to
consider that short term exposure to dietary sugars (i.e. high sucrose) may also alter intestinal
STRs expression and function.
It was seen that a short term high sucrose diet (HSD) down-regulates intestinal STRs and
sugar transporters (SGLT-1, GLUT2, and GLUT5). mRNA expression data indicated similar
phenotypes between the wild type mice fed a high sucrose diet and T1R2 knock-out (T1R2-KO)
mice, which showed reduced expression of intestinal STRs and sugar transporters. Glucose
absorption was compromised amongst the mice lacking normal STR expression and normal
glucose transporter expressions. This indicates that STRs regulate intestinal glucose absorption
in response to an oral glucose load.
15
CHAPTER 2: RESULTS
Intestinal Sweet Taste Receptors Are Down-Regulated in Response to Short Term High
Sucrose Diet (HSD)
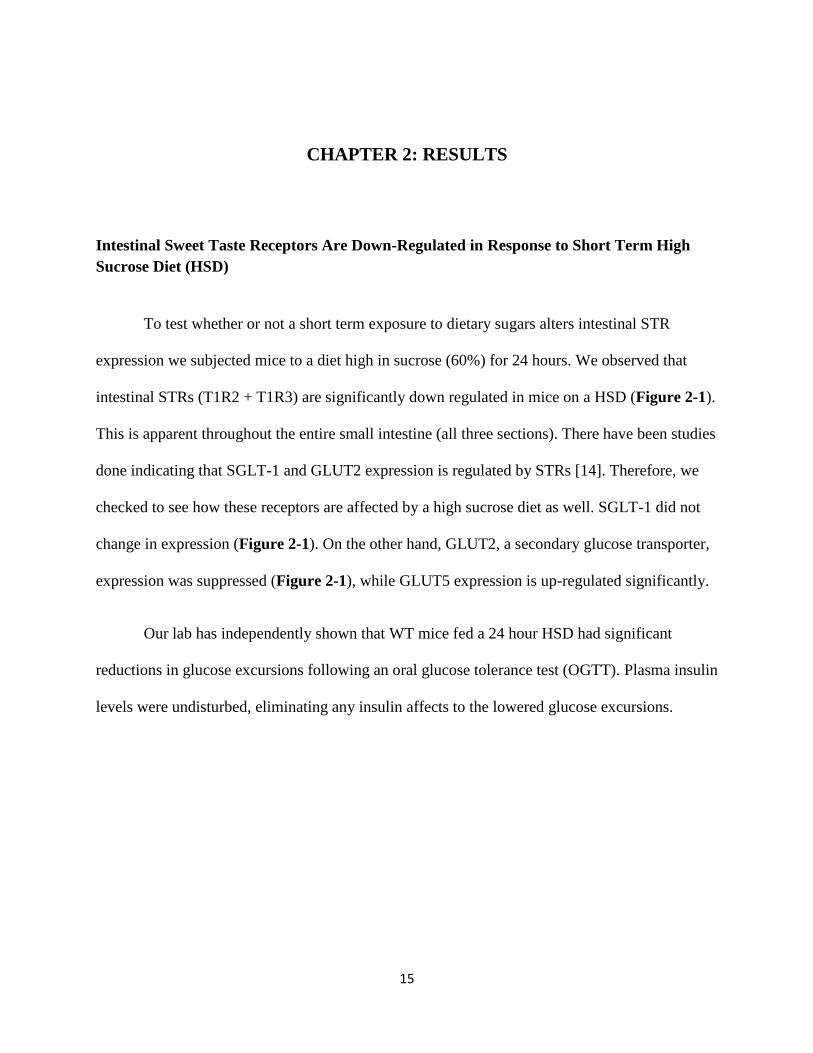
To test whether or not a short term exposure to dietary sugars alters intestinal STR
expression we subjected mice to a diet high in sucrose (60%) for 24 hours. We observed that
intestinal STRs (T1R2 + T1R3) are significantly down regulated in mice on a HSD (Figure 2-1).
This is apparent throughout the entire small intestine (all three sections). There have been studies
done indicating that SGLT-1 and GLUT2 expression is regulated by STRs [14]. Therefore, we
checked to see how these receptors are affected by a high sucrose diet as well. SGLT-1 did not
change in expression (Figure 2-1). On the other hand, GLUT2, a secondary glucose transporter,
expression was suppressed (Figure 2-1), while GLUT5 expression is up-regulated significantly.
Our lab has independently shown that WT mice fed a 24 hour HSD had significant
reductions in glucose excursions following an oral glucose tolerance test (OGTT). Plasma insulin
levels were undisturbed, eliminating any insulin affects to the lowered glucose excursions.
16
t1 r 2
0 .0
0 .5
1 .0
1 .5
Fo
ld
Ch
an
ge
D J I
* * *
t1 r 3
0 .0
0 .5
1 .0
1 .5
D J I
*** * **
s g lt1
0 .0
0 .5
1 .0
1 .5
D J I
W T - C O N W T - H S D
g lu t2
0 .0
0 .5
1 .0
1 .5
**
D J I
**
g lu t5
0 .0
0 .5
1 .0
1 .5
2 .0
2 .5
D J I
*
*
Figure 2- 1: mRNA expression of 24 hour HSD fed WT mice. Gene expression of STRs (T1R2 and T1R3),
glucose transporters (SGLT-1 and GLUT2), and fructose transporter (GLUT5) in isolated duodenum (D), jejunum
(J), and ileum (I) from WT mice in either control diet (CON; black bars) or high sucrose diet (HSD; gray bars). This
data was measured using quantitative real-time RT-PCR. Data is expressed as fold change from control diet (set at
value 1) normalized to GAPDH (n=10 mice). Student’s t-test. *p<0.05, **p<0.01, ***p<0.001.
17
T1R3 Receptor is Down-Regulated in T1R2-KO Mice in Response to Short Term High
Sucrose Diet (HSD)
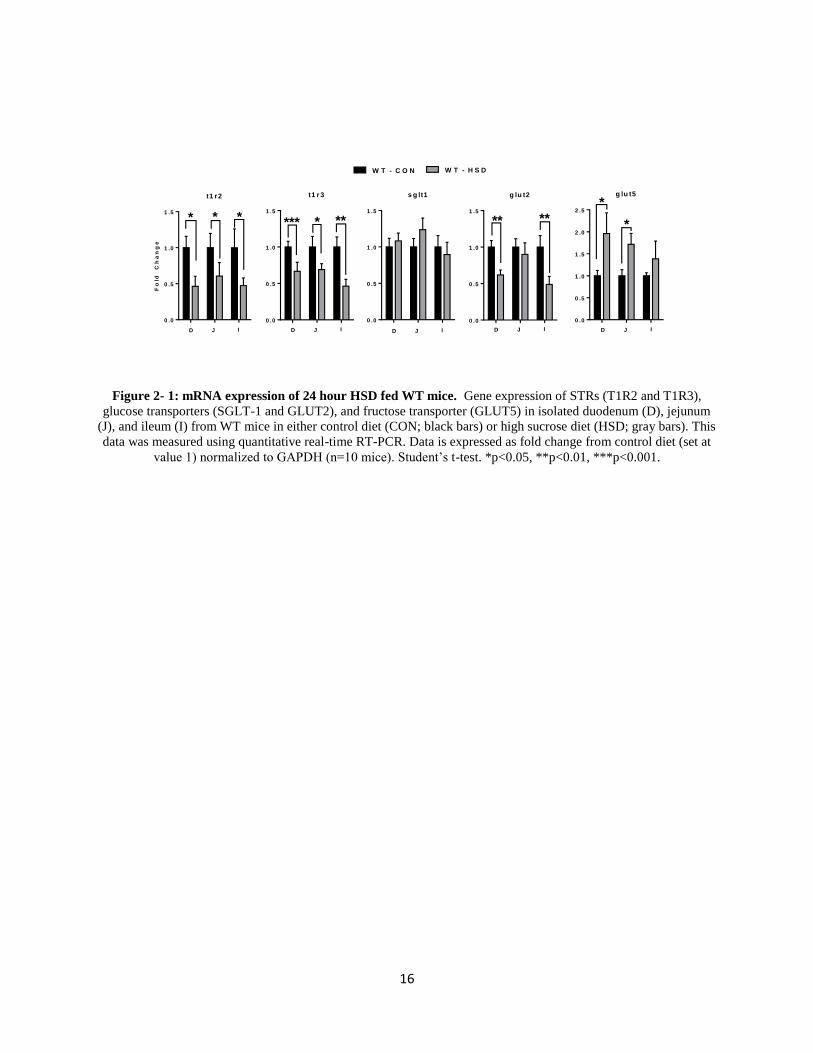
To strengthen the correlation between altered intestinal STR expression and glucose
absorption, we tested whether mice lacking taste receptor signaling also have altered glucose
absorption if fed a short term CON or HSD. In order to investigate this we collected intestine
from mice lacking STRs (T1R2-KO), and assessed their gene expression from genes involved in
glucose absorption. We noticed that T1R3 is significantly down-regulated in response to HSD
(Figure 2-2). This finding supports the STRs heterodimeric structure [6]. There were no
significant changes in glucose transporter SGLT-1, and only minor down regulation of GLUT2
expression in the duodenum (Figure 2-2). Similar to WT mice (Figure 2-1), GLUT5 expression
is significantly up regulated (Figure 2-2).
0 .0
0 .5
1 .0
1 .5
t1 r 3
mR
NA
Ex
pre
ss
ion
(A
U) ** *** ****
D J I
0 .0
0 .5
1 .0
1 .5
s g lt1
D J I
T 1 R 2 - C O N T 1 R 2 - H S D
0 .0
0 .5
1 .0
1 .5
g lu t2
*
D J I
0
1
2
3
**** **
D J I
g lu t5
Figure 2- 2: mRNA expression of 24 hour HSD fed T1R2-KO mice. Gene expression of STRs (T1R3), glucose
transporters (SGLT-1 and GLUT2), and fructose transporter (GLUT5) in isolated duodenum (D), jejunum (J), and
ileum (I) from T1R2-KO mice in either control diet (CON; black bars) or high sucrose diet (HSD; gray bars). This
data was measured using quantitative real-time RT-PCR. Data are expressed as fold change from control diet (set at
value 1) normalized to GAPDH (n=10 mice). Student’s t-test. *p<0.05, **p<0.01, ***p<0.001
18
A Short Term High Sucrose Diet (HSD) in T1R2-KO Mice Does Not Alter Plasma Glucose
Excursions during an Oral Glucose Tolerance Test (OGTT)
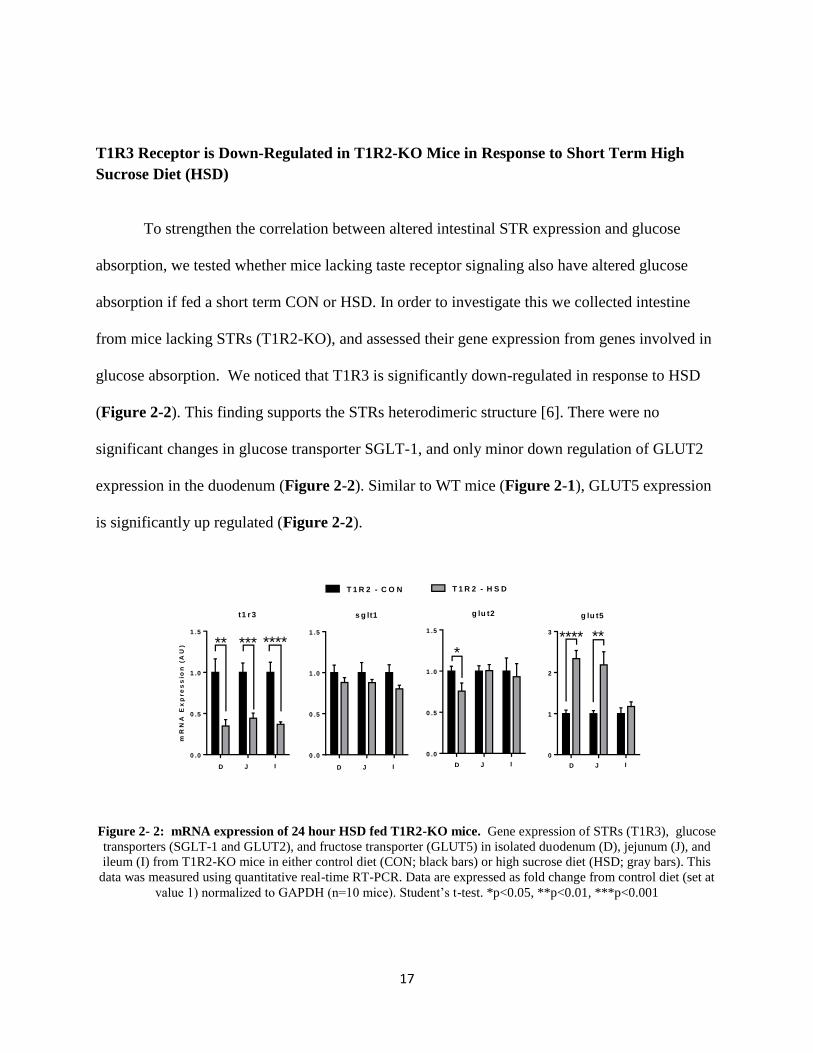
We performed an OGTT to assess plasma glucose excursions by T1R2-KO mice fed
control diet (CON) or HSD. There are no significant changes in glucose excursions between
T1R2-CON and T1R2-HSD (Figure 2-3A). This suggests that the effects of HSD in WT mice on
glucose excursions are likely mediated via mechanisms involving STR signaling. These findings
are further confirmed using OGTT area under the curve (AUC) calculations comparing WT and
T1R2-KO mice on CON and HSD. T1R2-KO mice on either diet have similar AUC during the
first 30 minutes of an OGTT to WT mice on HSD (Figure 2-3B). This suggests a HSD regulates
STR expression leading to alterations in glucose absorption. Thus, WT mice on HSD mimic the
T1R2-KO phenotypic response to glucose consumption, strengthening our hypothesis that STRs
regulate glucose absorption.
Figure 2- 3: OGTT performed on T1R2-KO mice on CON and 24 hour HSD. 2 -3 A: Plasma glucose
excursions during an OGTT (1.0 g/kg) in 5-hour fasted T1R2-KO mice fed control diet (T1R2-KO CON; black
trace) and high sucrose diet (T1R2-KO HSD; gray trace) (n=8 mice/group). 2 -3 B: Plasma glucose area under the
curve (AUC) calculated between 0-30 minutes of the OGTT WT and T1R2-KO mice fed either control diet or high
sucrose diet.

19
20
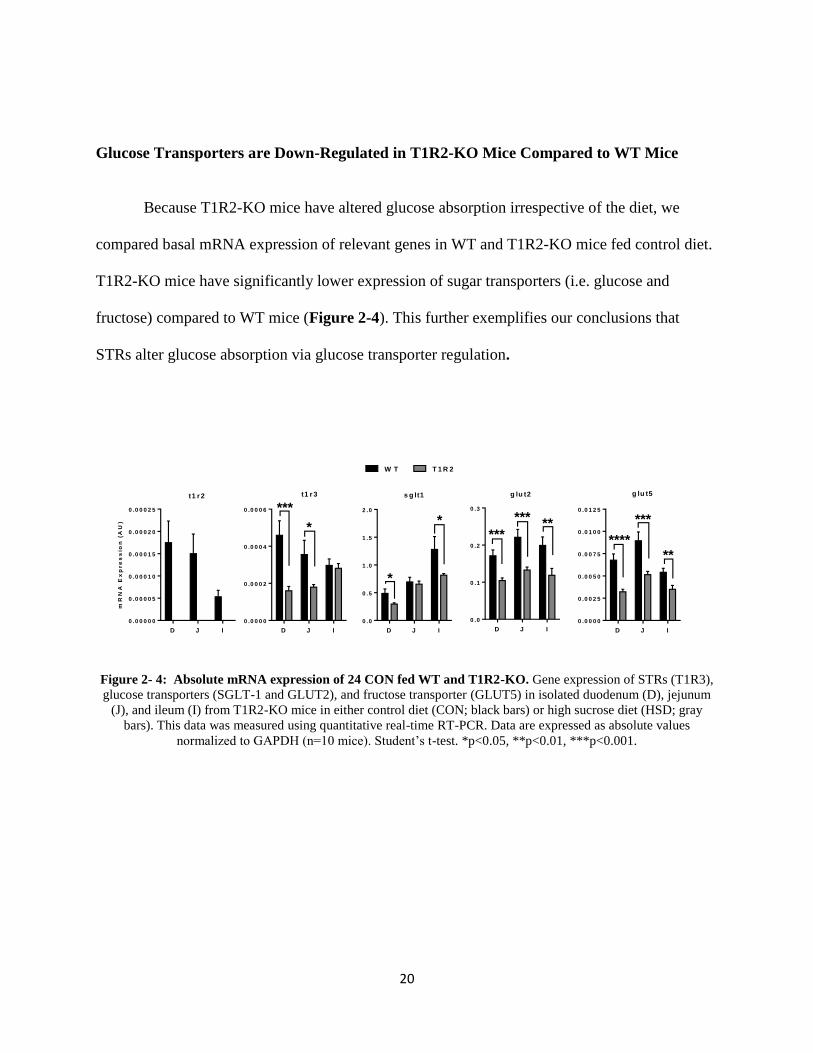
Glucose Transporters are Down-Regulated in T1R2-KO Mice Compared to WT Mice
Because T1R2-KO mice have altered glucose absorption irrespective of the diet, we
compared basal mRNA expression of relevant genes in WT and T1R2-KO mice fed control diet.
T1R2-KO mice have significantly lower expression of sugar transporters (i.e. glucose and
fructose) compared to WT mice (Figure 2-4). This further exemplifies our conclusions that
STRs alter glucose absorption via glucose transporter regulation.
D J I
0 .0 0 0 0 0
0 .0 0 0 0 5
0 .0 0 0 1 0
0 .0 0 0 1 5
0 .0 0 0 2 0
0 .0 0 0 2 5
mR
NA
Ex
pre
ss
ion
(A
U)
t1 r 2
D J I
0 .0 0 0 0
0 .0 0 0 2
0 .0 0 0 4
0 .0 0 0 6 ***
*
t1 r 3
D J I
0 .0
0 .5
1 .0
1 .5
2 .0
*
*
s g lt1
W T T 1 R 2
D J I
0 .0
0 .1
0 .2
0 .3
***
*** **
g lu t2
D J I
0 .0 0 0 0
0 .0 0 2 5
0 .0 0 5 0
0 .0 0 7 5
0 .0 1 0 0
0 .0 1 2 5
****
***
**
g lu t5
Figure 2- 4: Absolute mRNA expression of 24 CON fed WT and T1R2-KO. Gene expression of STRs (T1R3),
glucose transporters (SGLT-1 and GLUT2), and fructose transporter (GLUT5) in isolated duodenum (D), jejunum
(J), and ileum (I) from T1R2-KO mice in either control diet (CON; black bars) or high sucrose diet (HSD; gray
bars). This data was measured using quantitative real-time RT-PCR. Data are expressed as absolute values
normalized to GAPDH (n=10 mice). Student’s t-test. *p<0.05, **p<0.01, ***p<0.001.
21
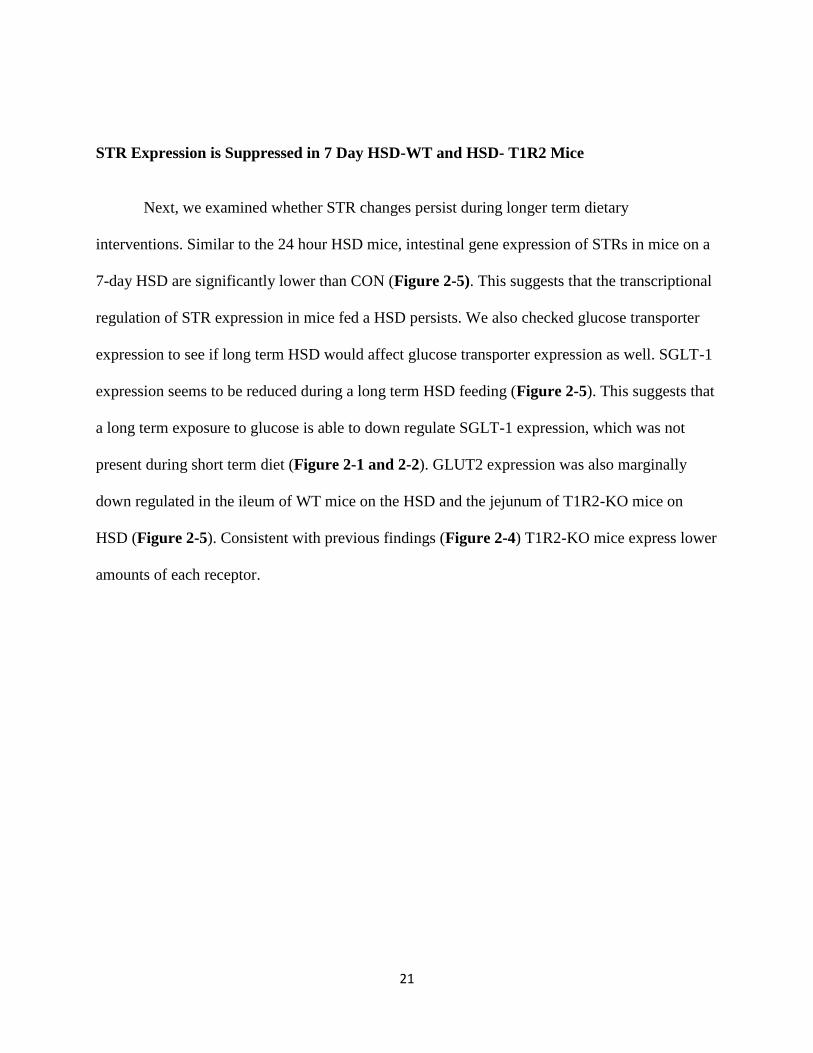
STR Expression is Suppressed in 7 Day HSD-WT and HSD- T1R2 Mice
Next, we examined whether STR changes persist during longer term dietary
interventions. Similar to the 24 hour HSD mice, intestinal gene expression of STRs in mice on a
7-day HSD are significantly lower than CON (Figure 2-5). This suggests that the transcriptional
regulation of STR expression in mice fed a HSD persists. We also checked glucose transporter
expression to see if long term HSD would affect glucose transporter expression as well. SGLT-1
expression seems to be reduced during a long term HSD feeding (Figure 2-5). This suggests that
a long term exposure to glucose is able to down regulate SGLT-1 expression, which was not
present during short term diet (Figure 2-1 and 2-2). GLUT2 expression was also marginally
down regulated in the ileum of WT mice on the HSD and the jejunum of T1R2-KO mice on
HSD (Figure 2-5). Consistent with previous findings (Figure 2-4) T1R2-KO mice express lower
amounts of each receptor.
22
0 .0 0 0 0
0 .0 0 0 1
0 .0 0 0 2
0 .0 0 0 3
0 .0 0 0 4
0 .0 0 0 5
mR
NA
Ex
pre
ss
ion
(A
U)
t1 r 2
D J I
W T W T W T
*
0 .0 0 0 0
0 .0 0 0 5
0 .0 0 1 0
0 .0 0 1 5
mR
NA
Ex
pre
ss
ion
(A
U)
t1 r 3
D J I
W T W T W TT 1 R 2 T 1 R 2 T 1 R 2
*
0.0975
0.0801
***** **
0 .0
0 .2
0 .4
0 .6
0 .8
1 .0
mR
NA
Ex
pre
ss
ion
(A
U)
D J I
W T W T W TT 1 R 2 T 1 R 2 T 1 R 2
s g lt1
**
**
0 .0
0 .1
0 .2
0 .3
0 .4
mR
NA
Ex
pre
ss
ion
(A
U)
D J I
W T W T W TT 1 R 2 T 1 R 2 T 1 R 2
g lu t2
C O N H S D (7 - d a y )
**
*
*
0 .0 0
0 .0 1
0 .0 2
0 .0 3
0 .0 4
mR
NA
Ex
pre
ss
ion
(A
U)
D J I
W T W T W TT 1 R 2 T 1 R 2 T 1 R 2
g lu t5
***
*****
Figure 2- 5: mRNA expression of 7 day HSD and CON fed WT and T1R2-KO. Gene expression of STRs and
glucose transporters in isolated duodenum (D), jejunum (J), and ileum (I) from WT and T1R2-KO mice on either
control diet (CON; black bars) or high sucrose diet (HSD; gray bars) for 7 days. This data was measured using
quantitative real-time RT-PCR. Data is expressed as fold change from control diet (set at value 1) normalized to
GAPDH (n=10 mice). Student’s t-test. *p<0.05, **p<0.01, ***p<0.001.
23
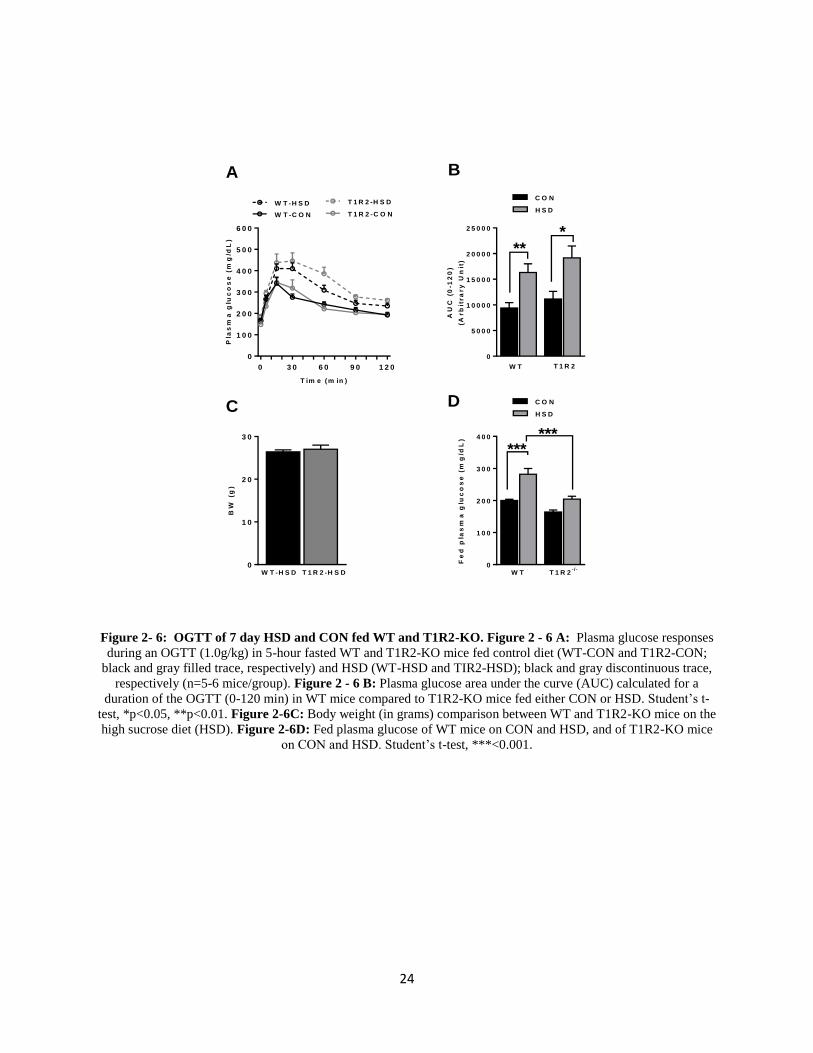
Long Term (7-Day) HSD Causes Glucose Intolerance in WT and T1R2-KO Mice
To further investigate the long term effects of a HSD we performed an OGTT on both
wild type (WT) mice, and mice lacking STRs (T1R2-KO). WT and T1R2-KO mice on HSD
have increased plasma glucose excursions indicating that a week of HSD is adequate to induce
glucose intolerance (Figure 2-6A). Plasma glucose area under curve (AUC) calculations
confirmed these findings (Figure 2-6B). No significant changes in body weight between the WT
and T1R2-KO mice on the HSD were observed (Figure 2-6C). Consistent with the OGTT data,
fed plasma glucose was elevated in WT mice on HSD, but these effects were absent in T1R2-KO
mice. (Figure 2-6D).
24
Figure 2- 6: OGTT of 7 day HSD and CON fed WT and T1R2-KO. Figure 2 - 6 A: Plasma glucose responses
during an OGTT (1.0g/kg) in 5-hour fasted WT and T1R2-KO mice fed control diet (WT-CON and T1R2-CON;
black and gray filled trace, respectively) and HSD (WT-HSD and TIR2-HSD); black and gray discontinuous trace,
respectively (n=5-6 mice/group). Figure 2 - 6 B: Plasma glucose area under the curve (AUC) calculated for a
duration of the OGTT (0-120 min) in WT mice compared to T1R2-KO mice fed either CON or HSD. Student’s t-
test, *p<0.05, **p<0.01. Figure 2-6C: Body weight (in grams) comparison between WT and T1R2-KO mice on the
high sucrose diet (HSD). Figure 2-6D: Fed plasma glucose of WT mice on CON and HSD, and of T1R2-KO mice
on CON and HSD. Student’s t-test, ***<0.001.
0
5 0 0 0
1 0 0 0 0
1 5 0 0 0
2 0 0 0 0
2 5 0 0 0
AU
C (
0-1
20
)
(Arb
itra
ry
Un
it)
W T T 1 R 2
**
C O N
H S D
*
0
1 0 0
2 0 0
3 0 0
4 0 0
Fe
d p
las
ma
glu
co
se
(m
g/d
L)
W T T 1 R 2- /-
******
C O N
H S D
0
1 0
2 0
3 0
BW
(g
)
W T -H S D T 1 R 2 -H S D
0 3 0 6 0 9 0 1 2 0
0
1 0 0
2 0 0
3 0 0
4 0 0
5 0 0
6 0 0
T im e (m in )
Pla
sm
a g
luc
os
e (
mg
/dL
)
W T -C O N
W T -H S D
T 1 R 2 -C O N
T 1 R 2 -H S D
A B
C D
25
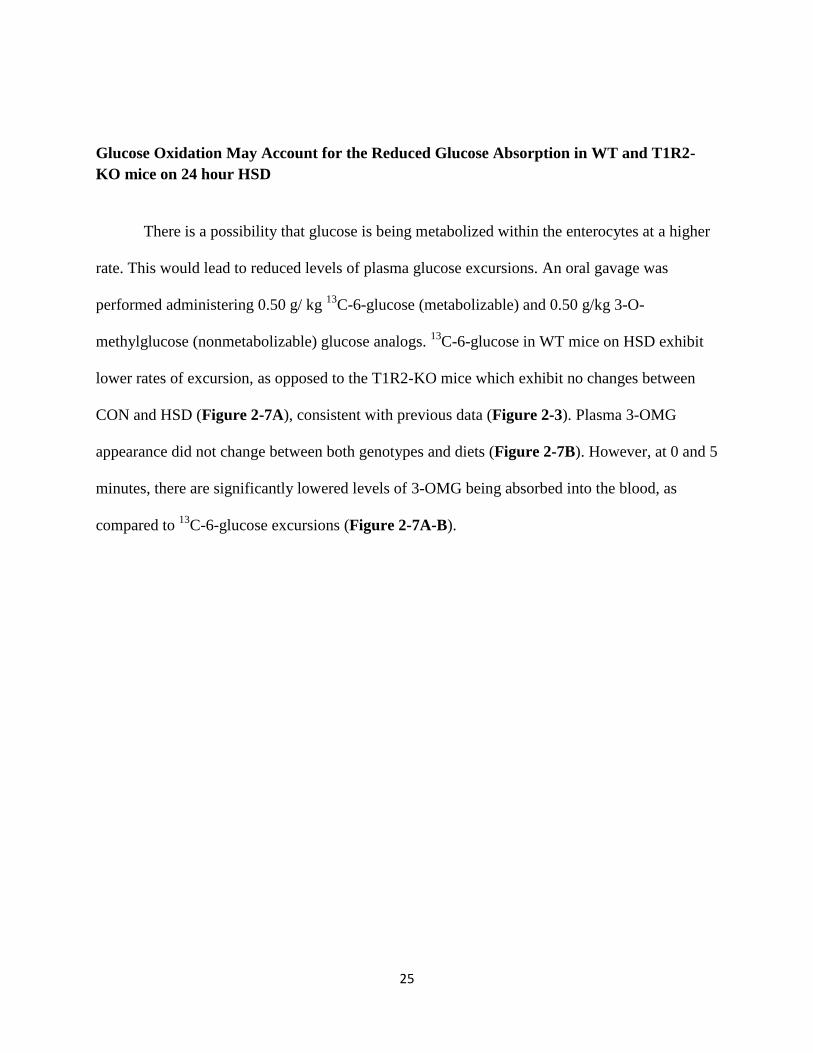
Glucose Oxidation May Account for the Reduced Glucose Absorption in WT and T1R2-
KO mice on 24 hour HSD
There is a possibility that glucose is being metabolized within the enterocytes at a higher
rate. This would lead to reduced levels of plasma glucose excursions. An oral gavage was
performed administering 0.50 g/ kg 13
C-6-glucose (metabolizable) and 0.50 g/kg 3-O-
methylglucose (nonmetabolizable) glucose analogs. 13
C-6-glucose in WT mice on HSD exhibit
lower rates of excursion, as opposed to the T1R2-KO mice which exhibit no changes between
CON and HSD (Figure 2-7A), consistent with previous data (Figure 2-3). Plasma 3-OMG
appearance did not change between both genotypes and diets (Figure 2-7B). However, at 0 and 5
minutes, there are significantly lowered levels of 3-OMG being absorbed into the blood, as
compared to 13
C-6-glucose excursions (Figure 2-7A-B).
26
0 5 1 5 3 0 0 5 1 5 3 0
0
1
2
3
4
m in u te s
13
C-6
glu
co
se
(m
M)
C O N
H S D
W T T 1 R 2
0
2 0
4 0
6 0
8 0
AU
C (
0-3
0m
in)
13C
-6 g
luc
os
e
C O N
H S D
W T T 1 R 2
0.0713
*
0 5 1 5 3 0 0 5 1 5 3 0
0
1
2
3
4
m in u te s
3-O
MG
(m
M)
C O N
H S D
W T T 1 R 2
0
2 0
4 0
6 0
8 0
AU
C (
0-3
0m
in)
3-O
MG
W T T 1 R 2
C O N
H S D
A
B
Figure 2- 7: OGTT of 24 hour CON or HSD fed WT and T1R2-KO mice using metabolizable (13C-6 glucose)
and nonmetabolizable (3-O-methyl-glucose) glucose analogs. Figure 2 - 7 A: Plasma 13C-6-glucose Figure 2 -
7 B: 3-OMG appearance during an OGTT (0.50 g/kg per analogue) in 5-hour fasted WT and T1R2-KO mice fed
control (CON-WT; black trace) or high sucrose diet (HST-WT; gray trace) (n=7-8 mice/group). AUC from 0-30
minutes is represented for each via a bar graph.
27
CHAPTER 3: MATERIALS AND METHODS
Animals and Mouse Intestine Isolation
All animal experiments were approved by the Institutional Animal Care and Use
Committee (IACUC). Mice with a homozygous deletion for the T1R2 gene (kindly provided by
Dr. Zuker and back-crossed on the C57BI/6J strain for 9 generations) were used for our T1R2-
KO cohort. We used nonlittermate WT mice (C57BI/6J) as controls. Cohorts of 6-12 mice were
placed on a 24 hour or 7 day high sucrose diet (60% sucrose D 12329, Research diets) or control
diet (60% Corn starch D12328, Research diets). Male mice (C57BI/6J or T1R2-KO) between 8-
10 weeks of age were acclimatized on the control diet for a week prior to diet switch to HSD or
continuation of control diet.
mRNA was extracted from intestinal tissue via TRIzol (Ambion, 15596018) and tested to
assess the regulation of genes involved in STR signaling and glucose absorption. Intestinal tissue
was extracted under fed conditions. Mice were euthanized via a CO2 chamber followed by
cervical dislocation. The transcription of genes involved in sugar absorption (i.e. SGLT-1,
GLUT2, GLUT5) and STR signaling (T1R2, T1R3) were assessed via quantitative real-time
PCR.
Quantitative real-time PCR
28
Total RNA from sections of the duodenum, jejunum, and ileum were isolated and was
reverse transcribed to cDNA (1.0µg) using New England BioLabs M-Mulv Reverse
Transcriptase Kit (M0253L). Quantitative PCRs were performed on an Eppendorf MasterCycler
using iQ SYBR Green from BioRad Laboratories using the protocol and primer sequences.
Oral Glucose Tolerance Tests
Oral glucose tolerance tests (OGTTs) were performed in 5-hour fasted mice to measure
plasma glucose excursions after the 24 hour or 7 day diet intervention. Administration of glucose
(1 g of glucose per 1 kg of body weight) was performed through an oral gavage and blood
glucose levels were taken at time points 0, 5, 15, 30, 60, 90, and 120 minutes. Mice gavaged with
glucose analogs were administered 1.0 g/kg of 13
C-6-glucose or, for glucose absorption analysis,
0.50 g/kg 13
C-6-glucose and 0.50 g/kg 3-O-methyl-glucose (3-OMG).
Surgical Catheterization of Mice
The Cardiometabolic Phenotyping core implanted catheters into the left common carotid
artery. They are inserted under isoflurane anesthesia using sterile surgical techniques. The free
ends of the catheters were externalized behind the head of the rodent and affixed to a silicone
cap.
29
Plasma Analysis
Blood was collected at time points 0, 5, 15, and 30 minutes during the OGTT for tracer
analysis, and 0 and 5 minutes for insulin analysis. The blood was spun down in a centrifuge at
1.5 g for 20 minutes at 4°C. Plasma (upper phase) was collected and sent to the Pharmacology
core for plasma analysis of tracers (13
C-6-glucose and 3-OMG). Insulin levels were also
quantified from plasma samples at 0 and 5 minutes by using the Mercodia, Ultra-sensitive mouse
insulin Elisa (10-1249-01) kit.
30
CHAPTER 4: DISCUSSION
Based on our data, this study can help further investigation to elucidate how intestinal
STRs regulate glucose absorption. Since homeostatic glucose absorption rates are important to
maintain proper metabolic function, it is important to note how dysregulation can play a role in
metabolic disease such as type 2 diabetes and obesity. Previous studies have shown that high-
fructose consumption has been linked to obesity and the development of adverse metabolic
effects [31]. Therefore, as the data presented here has proposed, changes in dietary carbohydrate
composition or glycaemia, frequently seen in obesity and diabetes, modulate glucose availability
and homeostasis via intestinal and pancreatic regulation of TRs and their signaling [30].
Elucidation of this pathway can help formulate treatments for those with metabolic diseases
pertaining to homeostatic glucose concentrations in the future.
In this study we tested the effects of acute (24h) and long-term (7-days) high sucrose diet
(HSD) on glucose absorption and homeostasis. Our lab has independently demonstrated that WT
mice on a 24 hour HSD exhibit reduced plasma glucose excursions during an oral glucose
tolerance test (OGTT). Our mRNA expression data performed on WT mice shows that sweet
taste receptors (T1R2 and T1R3) are significantly down regulated after being placed on the HSD.
Based on the mRNA expression data (Figure 2-1), we have hypothesized that sweet taste
receptors may be linked to reduced glucose absorption responses. HSD in T1R2-KO did not
change plasma glucose excursions during an OGTT (Figure 2-2A), further supporting the link
between glucose absorption and STR regulation. A previous study suggested that intestinal T1R2
31
signals proper regulation of glucose absorption via SGLT-1 up regulation [32]. However, our 24
hour HSD-WT expression data suggests that there is no change in SGLT-1 expression (Figure 2-
1C). We observed that the secondary glucose transporter, GLUT2, was also down-regulated
(Figure 2-1D). This has led us to believe that there may be a mechanism in which basal SGLT-1
expression is regulated by another pathway besides intestinal STRs signaling [33].
Although up regulation of SGLT-1 and GLUT2 has been reported previously with
intestinal STR signaling [14, 25], we see no significant up regulation of SGLT-1 expression in
our data. There is significant up regulation of GLUT5 in the WT mice fed HSD and the T1R2-
KO fed HSD (Figure 2-1 and 2-2), which is likely due to increase dietary fructose (sucrose is a
disaccharide of glucose and fructose monomers).
T1R2-KO mice express lower levels of the STR subunit T1R3 and sugar transporters
(SGLT-1, GLUT2 and GLUT5) suggesting that STRs regulate these receptors (Figure 2-4).
There have been studies done demonstrating STR regulation of glucose transporter SGLT-1,
concluding that STRs signal an increase in SGLT-1 expression [7, 25]. STRs stimulate
enteroendocrine hormone secretion of GLP-1, GLP-2, and GIP, which in turn helps stimulate
SGLT-1 and GLUT2 expression [18, 25]. In order to mimic these stimulatory effects, we fed
mice a diet high in carbohydrates to stimulate STRs with luminal sugars. However, we observe
no significant mRNA changes in SGLT-1 between diets. Nevertheless, T1R2-KO mice suggest
that STRs may regulate GLUT2 and GLUT5 expression, suggesting its role in glucose
absorption and homeostasis.
32
After 7 day HSD both genotypes exhibited glucose intolerance (Figure 2-6A). These
findings are similar to a study done showing that chronic HSD leads to glucose intolerance [34].
Unfortunately, glucose intolerance leads to many other pathway alterations, making it difficult to
study glucose absorption directly. However, most of the mRNA changes in each receptor persist
(Figure 2-5). Interestingly, the T1R2-KO mice exhibited a down-regulation in GLUT5
expression on a CON diet, indicating its basal expression (Figure 2-5). It has been found that
fructose binds to T1R3, possibly have a similar signaling cascade for GLUT5 [35]. This led us to
think that fructose transport may also be mediated by STRs in the intestine. T1R2-KO mice,
under fed conditions, exhibit less glucose as opposed to its WT counterparts (Figure 2-6D). This
may be due to reduced fructose transport since GLUT5 is down regulated, preventing
hyperglycemia for mice on a HSD. This led to the hypothesis that STRs may mediate GLUT5,
protecting the blood from glucose concentration imbalances. This must be investigated further.
An alternative pathway that may occur in mice lacking STR regulation is higher rates of
glucose oxidation within the enterocytes, which may account for lower glucose excursions.
Using an oral mix of equal amounts of the non-metabolizable 3-O-methylglucose and the
metabolizable 13
C-6-glucose we measured their rate of appearance in the circulation for direct
comparisons. This way we can indirectly assess the relative contributions of glucose transport
and glucose metabolism by the enterocytes. Plasma 13
C-6-glucose appearance was reduced in
WT-HSD mice and in T1R2 mice compared to WT-CON, confirming our previous OGTT data.
However, no diet or genotype differences were observed in 3-OMG excursion into the blood,
supporting the possibility that enterocytes of mice lacking STR signaling metabolize glucose at
higher rates than WT mice.
33
Limitations
There are various limitations to this study that could be addressed in the future. (i).We
did not quantify protein expression from both our WT and T1R2-KO mice on HSD. Although
mRNA expression is a good indicator of the amount of potential protein that is being made, there
may be an absence in the correlation between the mRNA expression levels compared to protein
expression levels. One reason for this is the possibility of varied post-transcriptional mechanisms
that are involved in turning mRNA into protein, therefore limiting our guarantee in protein
quantification via mRNA concentrations [36]. (ii) We were unable to look for plasma GLP-1 and
GLP-2 from collected blood samples during an OGTT and on fed mice, which may or may not
have strengthened the correlation between STR regulations on glucose absorption via hormone
stimulatory effects on glucose transporters [25]. (iii) There may also be variability in the diet
response due to the amount of food intake in CON vs HSD mice. This variation can lead to
differences in mRNA expression due to glucose load. (iv) In order to assess this hypothesis in a
more controlled environment, studies of in vitro glucose absorption would have been ideal.
Finally, (v) checking to see if the glucose not being absorbed was excreted from the body as
waste via fecal glucose content analysis.
Summary
This study examined the effects of STR dysregulation on glucose absorption from the
enterocytes to the blood. It also examined the response that a diet high in carbohydrates had on
intestinal STR regulation. From our findings we can conclude that intestinal STRs are down
regulated in response to a high sucrose diet. Along with diet induced suppression of STRs and
34
genetically ablated STR (T1R2-KO) mice, we noticed that STRs play a role in glucose regulation
into the blood. Along with data indicating lower glucose excursions, we showed lower mRNA
expression of sugar transporters responsible for glucose absorption.

35
APPENDIX A:
IACUC PROTOCOL APPROVAL FORM
36

37
APPENDIX B:
AALAS ANIMAL CARE AND USE COURSES TRANSCRIPT
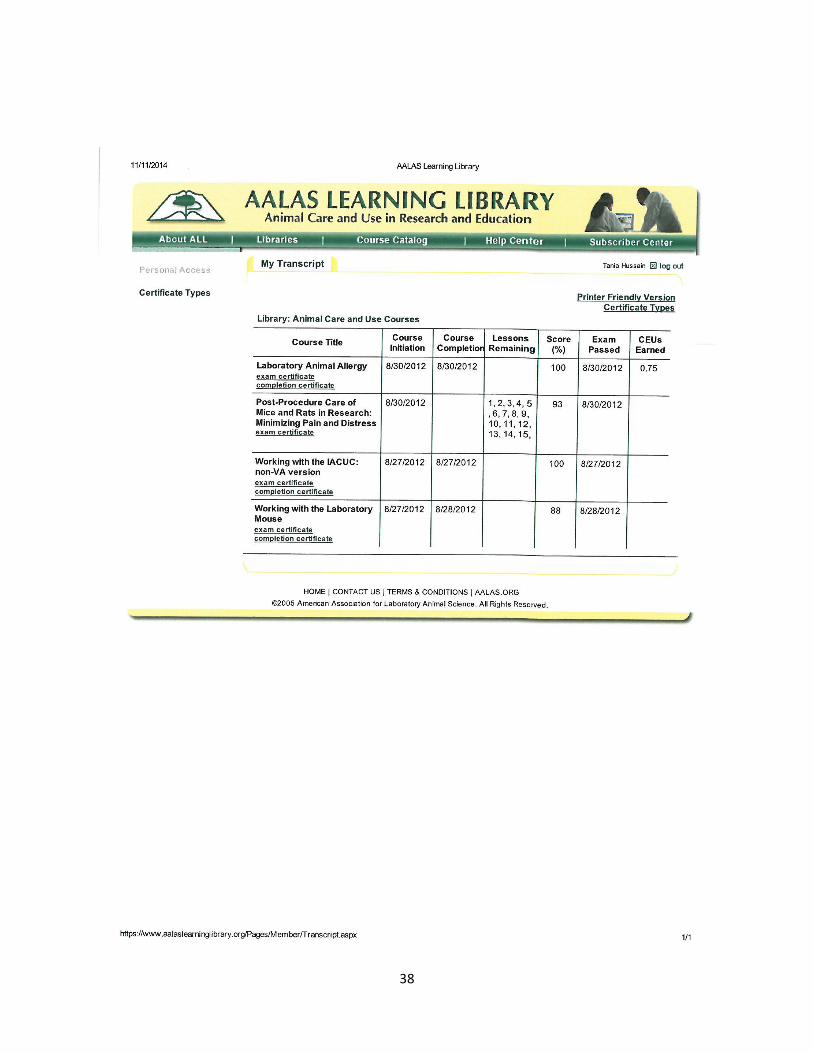
38
39
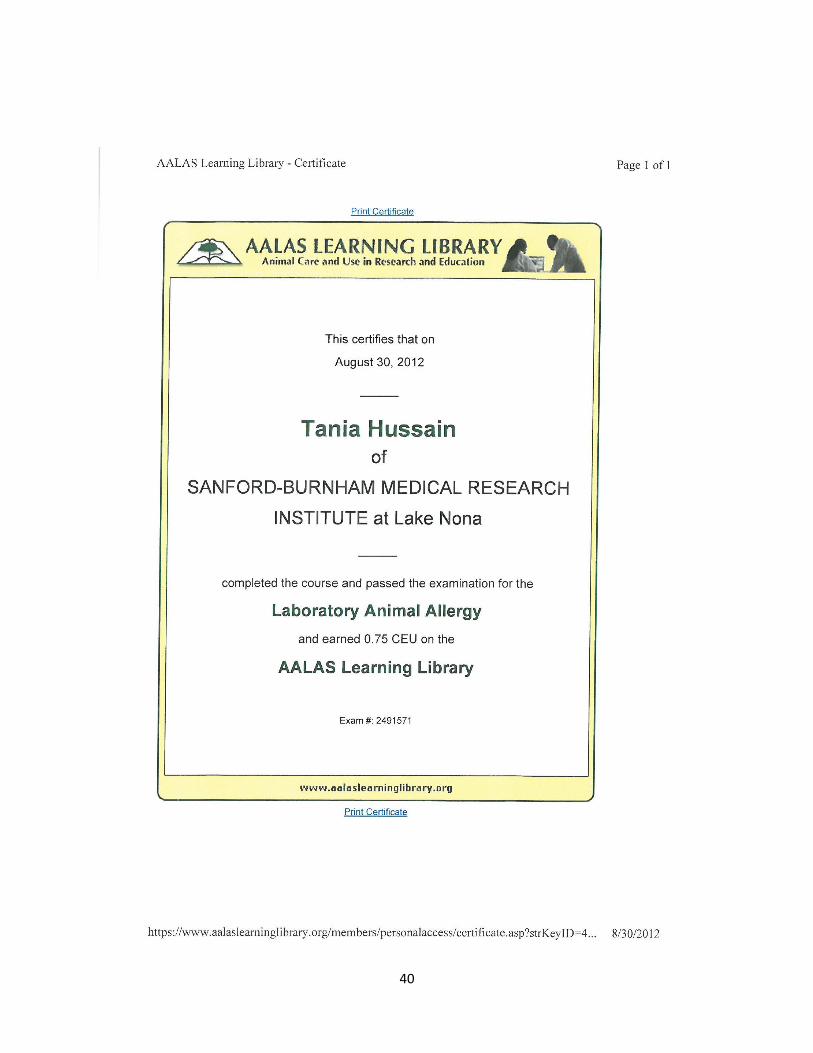
APPENDIX C:
LABORATORY ANIMAL ALLERGY COMPLETION CERTIFICATE
40
41
APPENDIX D:
POST-PROCEDURE CARE OF MICE AND RATS IN RESEARCH
COMPLETION CERTIFICATE
42

43
APPENDIX E:
WORKING WITH THE IACUC COMPLETION CERTIFICATE
44

45
APPENDIX F:
WORKING WITH THE LABORATORY MOUSE COMPLETION
CERTIFICATE
46
47
LIST OF REFERENCES
1. Reimann, F., G. Tolhurst, and Fiona M. Gribble, G-Protein-Coupled Receptors in
Intestinal Chemosensation. Cell Metabolism, 2012. 15(4): p. 421-431.
2. Behrens, M. and W. Meyerhof, Gustatory and extragustatory functions of mammalian
taste receptors. Physiology & Behavior, 2011. 105(1): p. 4-13.
3. Bachmanov, A.A. and G.K. Beauchamp, Taste receptor genes. Annual review of
nutrition, 2007. 27: p. 389.
4. Treesukosol, Y., K.R. Smith, and A.C. Spector, The functional role of the T1R family of
receptors in sweet taste and feeding. Physiology & Behavior, 2011. 105(1): p. 14-26.
5. Servant, G., et al., The sweet taste of true synergy: positive allosteric modulation of the
human sweet taste receptor. Trends in Pharmacological Sciences, 2011. 32(11): p. 631-
636.
6. Assadi-Porter, F.M., et al., Interactions between the human sweet-sensing T1R2–T1R3
receptor and sweeteners detected by saturation transfer difference NMR spectroscopy.
Biochimica et Biophysica Acta (BBA)-Biomembranes, 2010. 1798(2): p. 82-86.
7. Margolskee, R.F., et al., T1R3 and gustducin in gut sense sugars to regulate expression of
Na+-glucose cotransporter 1. Proc.Natl.Acad.Sci.U.S.A, 2007. 104(38): p. 15075-15080.
8. A Nguyen, C., Y. Akiba, and J. D Kaunitz, Recent advances in gut nutrient
chemosensing. Current medicinal chemistry, 2012. 19(1): p. 28-34.
48
9. Laffitte, A., F. Neiers, and L. Briand, Functional roles of the sweet taste receptor in oral
and extraoral tissues. Current opinion in clinical nutrition and metabolic care, 2014.
17(4): p. 379-385.
10. Kyriazis, G.A., M.M. Soundarapandian, and B. Tyrberg, Sweet taste receptor signaling in
beta cells mediates fructose-induced potentiation of glucose-stimulated insulin secretion.
Proceedings of the National Academy of Sciences, 2012. 109(8): p. E524–E532.
11. Simon, B.R., et al., Artificial Sweeteners Stimulate Adipogenesis and Suppress Lipolysis
Independently of Sweet Taste Receptors. Journal of Biological Chemistry, 2013. 288(45):
p. 32475-32489.
12. Jang, H.J., et al., Gut-expressed gustducin and taste receptors regulate secretion of
glucagon-like peptide-1. Proc.Natl.Acad.Sci.U.S.A, 2007. 104(38): p. 15069-15074.
13. Cummings, D.E. and J. Overduin, Gastrointestinal regulation of food intake. The Journal
of Clinical Investigation, 2007. 117(1): p. 13-23.
14. Mace, O.J., et al., Sweet taste receptors in rat small intestine stimulate glucose
absorption through apical GLUT2. The Journal of Physiology, 2007. 582(1): p. 379-392.
15. Kellett, G.L. and E. Brot-Laroche, Apical GLUT2: A Major Pathway of Intestinal Sugar
Absorption. Diabetes, 2005. 54(10): p. 3056-3062.
16. right, . ., .n.G. art n, and E. Turk, Intestinal absorption in health and disease—
sugars. Best Practice & Research Clinical Gastroenterology, 2003. 17(6): p. 943-956.
17. Cohen, M., et al., Live imaging of GLUT2 glucose-dependent trafficking and its
inhibition in polarized epithelial cysts. Open Biology, 2014. 4(7).
49
18. Au, A., et al., Rapid insertion of GLUT2 into the rat jejunal brush-border membrane
promoted by glucagon-like peptide 2. Biochem. J, 2002. 367: p. 247-254.
19. Kokrashvili, Z., B. Mosinger, and R.F. Margolskee, Taste signaling elements expressed
in gut enteroendocrine cells regulate nutrient-responsive secretion of gut hormones. The
American Journal of Clinical Nutrition, 2009. 90(3): p. 822S-825S.
20. Seino, Y., M. Fukushima, and D. Yabe, GIP and GLP-1, the two incretin hormones:
Similarities and differences. Journal of Diabetes Investigation, 2010. 1(1-2): p. 8-23.
21. Carr, R.D., et al., Incretin and islet hormonal responses to fat and protein ingestion in
healthy men. American Journal of Physiology-Endocrinology and Metabolism, 2008.
295(4): p. E779-E784.
22. Baggio, L.L. and D.J. Drucker, Biology of incretins: GLP-1 and GIP. Gastroenterology,
2007. 132(6): p. 2131-2157.
23. Nauck, M.A., et al., Effects of glucagon-like peptide 1 on counterregulatory hormone
responses, cognitive functions, and insulin secretion during hyperinsulinemic, stepped
hypoglycemic clamp experiments in healthy volunteers. The Journal of Clinical
Endocrinology & Metabolism, 2002. 87(3): p. 1239-1246.
24. Thulesen, J., Glucagon-like peptide 2 (GLP-2), an intestinotrophic mediator. Current
Protein and Peptide Science, 2004. 5(1): p. 51-65.
25. Shirazi-Beechey, S., et al., Glucose sensing and signalling; regulation of intestinal
glucose transport. Proceedings of the Nutrition Society, 2011. 70(02): p. 185-193.
26. Moran, A., et al., Sweet taste receptor expression in ruminant intestine and its activation
by artificial sweeteners to regulate glucose absorption. Journal of dairy science, 2014.
50
27. Egan, J.M. and R.F. Margolskee, Taste cells of the gut and gastrointestinal
chemosensation. Molecular interventions, 2008. 8(2): p. 78.
28. Rozengurt, E. and C. Sternini, Taste receptor signaling in the mammalian gut. Current
Opinion in Pharmacology, 2007. 7(6): p. 557-562.
29. Renwick, A.G. and S.V. Molinary, Sweet-taste receptors, low-energy sweeteners, glucose
absorption and insulin release. British Journal of Nutrition, 2010. 104(10): p. 1415-1420.
30. Kyriazis, G.A., et al., Sweet Taste Receptors Regulate Basal Insulin Secretion and
Contribute to Compensatory Insulin Hypersecretion During the Development of Diabetes
in Male Mice. Endocrinology, 2014. 155(6): p. 2112-2121.
31. Tappy, L. and K.-A. Lê, Metabolic effects of fructose and the worldwide increase in
obesity. Physiological reviews, 2010. 90(1): p. 23-46.
32. Young, R.L., et al., Disordered Control of Intestinal Sweet Taste Receptor Expression
and Glucose Absorption in Type 2 Diabetes. Diabetes, 2013. 62(10): p. 3532-3541.
33. Margolskee, R.F., et al., T1R3 and gustducin in gut sense sugars to regulate expression of
Na+-glucose cotransporter 1. Proceedings of the National Academy of Sciences, 2007.
104(38): p. 15075-15080.
34. Sumiyoshi, M., M. Sakanaka, and Y. Kimura, Chronic intake of high-fat and high-
sucrose diets differentially affects glucose intolerance in mice. The Journal of nutrition,
2006. 136(3): p. 582-587.
35. Depoortere, I., Taste receptors of the gut: emerging roles in health and disease. Gut,
2014. 63(1): p. 179-190.
51
36. Greenbaum, D., et al., Comparing protein abundance and mRNA expression levels on a
genomic scale. Genome Biol, 2003. 4(9): p. 117.