Embed Size (px)
Citation preview
THE ROLE OF ORGANIZATIONAL CULTURE IN THE RELATIONSHIP BETWEEN STRATEGY AND PERFORMANCE
OF COMMERCIAL BANKS IN KENYA
JOHN KIPTUID61/9109/05
1
A Research project submitted in partial fulfilment of the requirements for the award of the degree of Master of Business Administration, School of Business,
University of Nairobi.
2009.
DECLARATION
This management research project is my original work and has not been submitted for a
degree in any other university
……………………………….. ………………
Signed: Date:
This management research project has been submitted with my approval as the university
supervisor
…………………………………….. …………………………..
Signed: Date:
Prof.Peter K `Obonyo
Lecturer, Department of Business Administration
2
DEDICATION
This project is dedicated first and foremost to the almighty God whose care and blessings
I cherish. Secondly, to my parents, brothers and sisters who might have needed my
presents on several occasions but I could not avail myself. Thank you all for your support
and guidance. God bless you always.
3
ACKNOWLEDGEMENTS
I sincerely thank my supervisor, Prof. Peter K ` Obonyo, under whose able guidance
throughout the entire course of writing this research paper helped me in researching
thoroughly and developed in me an interest on research. Many thanks professor and May
God bless you abundantly.
4
TABLE OF CONTENTS
CONTENT PAGE
Declaration………………………………………………………………………………...ii
Dedication………………………………………………………………………………...iii
Acknowledgements……………………………………………………………………….iv
Table of Contents………………………………………………………………………….v
List of Tables……………………………………………………………………………..vi
Abstract…………………………………………………………………………………..vii
CHAPTER ONE: INTRODUCTION…………………………......................................1
1.1 Background……………………………………………………………………............1
1.1.1 The concept of strategy……………………………………………………………21.1.2 Organizational culture……………………………………………………………..3
5
1.1.3 Organizational performance……………………………………………….............41.1.4 Link between strategy, culture
and performance…………………………………………………………………...51.1.5 The Kenyan financial sector………………………………………………............6
1.2 Statement of the Research Problem…………………………………...........................7
1.3 Objectives of the Study………………………………..................................................9
1.4 Significance of the Study……………………………………………………………...9
CHAPTER TWO: LITERATURE REVIEW………………………………………...10
2.1 Organizational strategy………………………………………………………………102.2 Organizational culture……………………………………………..............................142.3 Organizational performance………………………………………………………….192.4 Corporate strategy, culture and performance………………………………………...23
CHAPTER THREE: RESEARCH METHODOLOGY……………………………..28
3.1 Research design…………………………………………………………...................283.2 Population……………………………………………………………………………283.3 Data collection……………………………………………………………………….283.4 Data analysis…………………………………………………………………………29
CHAPTER FOUR: DATA ANALYSIS, FINDINGS AND DISCUSSION…………30
4.1 Introduction…………………………………………………………………………..304.2 Overview of bank profiles…………………………………………………………...304.2.1 Years of Operation…………………………………………………………………304.2.2 Distribution of banks by size………………………………………………………314.2.3 Ownership………………………………………………………………………….314.3 Culture Types………………………………………………………………………324.4 Strategy Types…………………………………………………………………….....344.5 Performance………………………………………………………………………….364.6 Culture, Strategy Types and Performance…………………………………...............364.6.1 Correlation Analysis……………………………………………………………….384.6.2 Strategy Culture Types Interactions and their effect on performance…………….39
CHAPTER FIVE: CONCLUSIONS, LIMITATIONS AND RECOMMENDATIONS…………………………………………42
6
5.1 Introduction…………………………………………………………………………..425.2 Conclusions………………..…………………………………………………………425.3 Limitations and Recommendations…………………………………………………..43
REFERENCES ………………………………………………………………………….45
APPENDICES
1: Questionnaire …………………………………………………………………………51
2: List of respondent banks……………………………………........................................64
LIST OF TABLES
Table 1.1: Number of Years the Banks have been in Operation………………………...30
Table 1.2: Bank Size……………………………………………………………………..31
Table 1.3: Ownership…………………………………………………………………….31
Table 1.4: Culture Types ………………………………………………………………...32
Table 1.5: Culture Types……………………………………………………………........32
Table 1.6: Dominant Cultures............................................................................................33
Table1.7: Strategy Types Analysis schedule…………………………………………….34
Table1.8: Strategy Types………………………………………………………………...34
Table1.9: Strategy Types Frequencies…………………………………………………...35
Table2.0: Return on Investment………………………………………………………….36
Table2.1: Culture, Strategy Types, Performance, and Performance Ranking…………...36
7
Table2.2: Strategy Types Performance…………………………………………………..38
Table2.3: Correlations……………………………………………………………………39
Table2.4: StrategyCulture Interactions, Average Returns, Spread and
Frequency…………………………………………………………………….39
ABSTRACT
This management research project examines the relationship, if any, between culture,
strategy and the performance of banks. Existing studies show that most organizations
appreciate the importance of strategy to achieve business success. However, they often
disregard the role of culture with regards to strategy, yet the two factors are critical for
the success of an organization. The researcher noted that in order to study these two
factors and performance, the ideal population will be all the commercial banks operating
in Kenya and Return on investment will be the measure of performance.
The researcher had three objectives, first, to establish the relationship between culture
and performance. Secondly, the relationship between strategy and performance; and
8
finally, establish the effect of culture on relationship between strategy and performance
on Kenyan commercial banks.
The researcher carried out a survey of all the 44 banks operating in Kenya. Likert scale
questionnaires with questions framed on the basis of predesigned operational definitions
of the Schneider’s four culture types, namely, control, collaboration, cultivation and
competence; and Miles and Snow’s strategy types of defender, prospector, analyzer and
reactor, were designed, and used, in collecting primary data from the bank managers
responsible for culture and strategy. This was aimed at collecting relevant data.
Secondary data on bank performance were collected. The returns on investment were
used to rank the banks from number one to thirty one as these was the total number of
banks responded. The primary data was analyzed using correlation analysis and tabular
analysis to test the relationship between culture, strategy and performance.
The first objective of the study was established as the researcher found that control,
cultivation and competence cultures are positively correlated to performance. Secondly,
the researcher established that analyzer, defender and prospector strategies are positively
correlated to performance. The third objective was also established since the researcher
found that banks tend to perform better when they adopt prospector strategy with
cultivation culture. However, it was noted that even though strategy and culture play a
significant role in influencing performance, some other factors exist too in the banking
industry.
9

CHAPTER ONE
INTRODUCTION
1.1 Background
10
Companies have been forced by dynamic and intense competitive pressures to reevaluate
almost every aspect of their approach to conducting business (Stanley et al., 1996). These
reevaluations have in turn led to the implementation of dramatic strategic initiatives that
range from benchmarking to justintime to reengineering to total quality management.
The number of ‘’new’’ initiatives implemented in the quest for competitive advantage
during the past decade is quite extensive; however, the reality is that while often
beneficial, these diverse endeavors frequently fail to yield the requisite improvements in
firm performance.
In recent years, increasing attention has been given to how companies should respond to
the new competitive landscape. A variety of firm postures and orientations have been
suggested. These include behavioral orientations as well as corporate stances more
typical of a strategic management perspective (Ireland et al.2003). Research on
entrepreneurship has highlighted the need to explore new business opportunities through
innovation, proactive behaviors, and risktaking decisions (Covin and Slevin, 1989;
Miller; 1983). From a strategic management perspective, researchers have called
attention to the importance of building, protecting, and sustaining competitive advantage
through analysis, organizational planning, and longterm vision (Venkatraman, 1989;
Cohen and Sproull, 1996; Morgan and Strong, 2003).
Companies facing the current environmental conditions need to adopt simultaneously
postures aimed at exploring new business opportunities and behaviors intended to gain
and sustain competitive advantage (Hitt et al., 2001). Previous studies have used the
construct of strategic orientation to describe a corporate posture needed to deal with the
current challenges of the competitive landscape. However, research has focused not only
on the concept of firm’s strategic orientation but also on the implications of this
orientation for performance (Covin and Slevin, 1989; Lumpkin and Dess, 1996).
Generally, it has been argued that a firm’s strategic orientation has a positive impact on
performance. However, the idea that a strategic orientation is universally beneficial may
be overly simplistic. Many studies have acknowledged the importance of considering
11
contingent influences to model the strategic orientationperformance relationship
effectively (Covin and Slevin, 1991; Miles et al., 2000. Contingency theory suggests that
congruence or fit among key variables (external and internal) is critical for obtaining
better performance levels. This is the central focus of strategic management. This in turn
has made strategy a popular area for researchers, teachers and students of strategic
management.
1.1.1 The concept of strategy
The concepts and theories of strategy have their antecedents to military strategy. Strategy
is about winning (Grant, 1998). The economic historian Chandler(1962) first articulated
the notion of strategy in scholarly circles as ‘the determination of the basic longterm
goals and objectives of an enterprise, and the adoption of courses of action and the
allocation of resources necessary to carry out these goals’. Quinn (1980) defines strategy
as a pattern or plan that integrates an organization’s major goals, policies and action
sequences into a cohesive whole. Webster (1994) calls this the building block of strategic
management and notes that a secure foundation (strategy) is needed if the process
(strategic management) is to function properly. In this sense strategy provides the link
between where the organization is at present and where it would like to be in the future.
Mintzberg (1994) portrays strategy as a plan, a direction, a guide or course of action into
the future and as a pattern, that is, consistent in behavior over time. The management
philosopher Drucker sees strategy as an indication of the organization’s positioning for
the future, the what rather than the how. It is more important to do the right thing
(improving effectiveness) than to do things right (improving efficiency). According to
Johnson and Scholes (2002) strategy is the direction and scope of an organization over
the long term, which achieves advantage for the organization through its configuration of
resources within a changing environment and fulfills stakeholders’ expectations. Strategy
is a unifying theme that gives coherence and direction to the actions and decisions of an
individual or organization.
12
1.1.2 Organizational culture
The pattern of dynamic relationships at the organization level is culture, which explains
why organization culture is so powerful that its impact supersedes all other factors
(Kottler & Heskett, 1992). According to Pearce and Robinson (2003), organization’s
culture is the set of important assumptions (often unstated) that members of an
organization share in common. An organization’s culture is similar to an individual’s
personality, an intangible yet ever present theme that provides meaning, direction, and
the basis of action.
Studies have shown that there is a direct connection between an organization’s
performance and profits and the nature of the culture residing within that organization.
Denison (1990) states that ‘’shared meaning has a positive impact because an
organization’s members all work from a common framework of values and beliefs that
forms the basis through which they communicate. A high degree of shared meaning and a
common frame of reference can increase an organization’s capacity for coordinated
action and promote a more rapid decision process.’’ He continues to say that the theory of
corporate culture and organizational effectiveness has a direct impact on its effectiveness
and performance. Strategies, structures, and their implementation are rooted in the basic
beliefs and values of an organization and present both limits and opportunities for what
may be accomplished.
In order to survive in today’s competitive world, organizations are recognizing that they
must not only be concerned with what’s going on outside of the company, but what is
manifesting internally as well. In this regard, culture matters more today than in any
period in business history.
1.1.3 Organizational Performance
13
The international labour organization (2005) defines organization performance as ‘’the
achievement of high levels of performance, profitability and customer satisfaction by
enhancing skills and engaging the enthusiasm of employees’’. According to Laitinen
(2002), performance can be defined as the ability of an object to produce results in a
dimension determined a priori, relative to a target. He also suggests that a well organized
system of performance measurement may be the single most powerful mechanism at
management’s disposal to enhance the probability of successful strategy implementation.
Lusch and Laczniak (1989) define business performance as the total economic results of
the activities undertaken by an organization. The performance of any business
organization is affected by the strategies that the organization has chosen (Mutuku,
2005). Hunger and Wheelen( 1995) say that strategies, which are a set of managerial
decisions and actions determine the long term performance of a corporation.
Performance in an organization may take many forms depending on whom and what the
measurement is meant for. Different stakeholders require different performance
indicators to enable them make informed decisions ( Manyuru,2005).
Measures of firm performance generally include such bottomline financial indicators as
sales, profits, cash flow, return on equity, and growth (Dess and Robinson,1984).
Thompson et al., (2007) note that using financial measures alone overlooks the fact that
what enables a company achieve or deliver better financial results from its operations is
the achievement of strategic objectives that improve its competitiveness and market
strength. Nonfinancial measures include innovativeness (Goldsmith and Clutterbuck,
1984) and market standing (Saunders and Wong, 1985; Hooley and Lynch, 1985).
Nevertheless, Daily et al (2002) suggest that there is a distinct lack of consistency in what
constitutes firm performance.
Performance can, however, be viewed in a number of dimensions namely: Profitability,
Customer satisfaction, Customer retention, market share, learning and overall financial
performance.
14
1.1.4 Link between Strategy, Culture and Performance
Most organizations understand that a sound strategy is needed to achieve business
success. However, Mankins and Steele (2005) report companies realize only 63% of the
financial performance promised by their strategies. Kaplan and Norton (2005) attribute
this strategy –toperformance gap, in part, to the fact that 95% of a company’s employees
are not aware of or do not understand their company’s strategy. According to Johnson
(2004), however, 66% of corporate strategy is never implemented. This suggests that the
problem lies somewhere in the middle of this strategytoperformance gap, with a more
likely source being a lack of alignment between the strategy and the culture within the
organization. Studies have shown that there is a direct connection between an
organization’s performance and the nature of the culture residing within that
organization. Denison (1990) argues that the theory of corporate culture and
organizational effectiveness has a direct impact on its effectiveness and performance.
Strategies, structures, and their implementation are rooted in the basic beliefs and values
of an organization and present both limits and opportunities for what may be
accomplished.
However, firm’s strategic orientation also implies the adoption of some behavioral traits
aimed at the effective exploitation and sustainability of competitive advantages. Although
researchers have agreed on the positive influences of firm’s strategic orientation on
performance, they also insist on the importance of considering the moderating effects of
other variables to achieve a greater understanding of this relationship (Wiklund and
Shepherd, 2005).Firm’s behavior should include the adoption of internal systems and
procedures that facilitate the development and execution of competitive strategy to
achieve firm’s objectives (Morgan and Strong, 2003).
1.1.5 The Kenyan Banking Sector
15
The banking system in Kenya is regulated by the Central Bank of Kenya (CBK) Act
Cap.491 and the Banking Act cap 488. These Acts are intended primarily to facilitate the
development and maintenance of a sound monetary policy (GOK, 1989). The industry
comprises of financial institutions, among them commercial banks. Others are either non
bank financial institutions or mortgage finance companies.
According to the commercial banks directory (2007), Kenya has a well developed
financial sector, particularly for the region, but it is vulnerable to government influence
and inadequate supervision. It consists of 88 banks and nonbank financial institutions
(NBFIs). The NBFIs are currently being required by the central bank to convert to banks
since most NBFIs have links to commercial banks through share ownership. The large
banks have a tradition of working together rather than of aggressive competition.
However, various reform measures have been implemented recently to enhance the
growth and dynamism of the sector. The large banks that had traditionally been working
together are slowly moving away towards competition. This has led to stiff competition
forcing most financial institutions to repackage their services and products to satisfy the
needs of the customers and retain their market share. The competition is even getting
more intense with new financial service providers emerging all the time. The provision of
funds transfer service by telecommunications service providers has worsened the
situation further. This has provided customers with a wide range of options to choose
from financial services providers.
As the competition intensifies the financial institutions are out more aggressively to
capture and retain their market share. Some have redefined their business strategies while
leveraging on innovative and affordable products to capture new market segments.
Quality of service is seen more than ever as a key differentiator in the marketplace.
Strategy development and implementation has become extremely critical. In fact, as it
stands currently, the success and soundness of financial institutions depends on the
16
achievement of operational efficiency through the adoption of competitive strategies that
are well aligned to organizational culture.
Commercial banks have expanded both in numbers and in their assets. The locally
incorporated banks have increased, more so because of the deliberate government effort
to increase local ownership of financial institutions. The locally incorporated commercial
banks do not compare well with the foreign banks in their assets levels, as most of them
have less than the average assets. This has given the foreign banks leverage over the local
banks in the face of stiff competition.
1.2 Statement of the Research Problem
Most studies in the financial sector have tended to investigate firms specifically in mature
and stable industries. These studies have considered deregulated (Reger et al., 1992),
transition (Golden et al.1995), and volatile context (Tan and Litschert, 1994). In other
words, most of the studies have been carried out in the developed world and very few in
developing countries.
A few studies have examined relationship between strategy and performance. An
example is Gregory (2003) which studied the impact of formal strategic planning on
financial performance in the foodprocessing sector. Whereas the results showed that
strategic planning had positive effects on financial performance as measured by the three
year pretax return on assets, the researcher did not look at the other factors that might
have influenced this relationship. One such factor is organizational culture. In addition,
this study was done in the food processing sector, and it cannot be assumed that the
results obtained can apply equally to other sectors such as banking sector. Another study
by Blackburn (1989) researched on strategic and operational planning uncertainty, and
performance in small firms. Although his study stressed the relationship between
strategic planning and financial performance, it did not consider strategy types yet it
cannot be assumed that all types of strategy will have the same kind of relationship with
17
performance. This study was confined to small firms which obviously have different
characteristics from big firms.
In South Africa, Zambia and Zimbabwe, Frese et al (2003) carried out three different
studies in each of the countries on the psychological action strategy types as practiced by
business owners of African origin and their success levels. These studies again were
biased to entrepreneurs of African origin and were not specific to particular sectors.
There are very few studies on Kenyan firms. An example is Aosa’s (1992) study which
covers strategic planning, strategy formulation and implementation in large
manufacturing companies in Kenya. Mahinda (2002) studied the influence of culture on
Human Resource practices by manufacturing firms registered by the Kenya Association
of Manufacturers (KAM). The study was restricted to one sector and considered only the
human resource aspects of strategic management. Furthermore, the study did not compare
culture versus strategy choices and their impact on performance which is currently the
focus of this study.
As has been noted by the renowned scholars of strategy such as Mintzberg (1994),
Johnson and Scholes (2002) and Andrews (1971), strategy is sensitive to context. What
happens, for instance in the agricultural sector, is likely to differ from what happens in
the banking sector or manufacturing industry at any given time. Strategy is also process
sensitive. Research findings keep changing with time such that what happened a year ago
may not hold now.
This study therefore fills an existing research gap relating to knowledge and
understanding on the relationship between strategy, culture and performance in the
commercial banks in Kenya. Although some studies have been done on firms in various
sectors in other parts of the world, such firms are regarded as thriving in different
environmental conditions and therefore there is need to replicate such studies in the
Kenyan context. Arising from this, the study seeks to address the following question:
18
1. What is the role of organizational culture in the relationship between strategy and
firm performance?
1.3 Objectives of the study
The objectives of this study were:
i. To establish the relationship between culture and performance
ii. To establish the relationship between strategy and performance.
iii. To establish the effect of culture on the relationship between strategy and
performance.
1.4 Significance of the Study
i. To managers and strategic analysts – The study will help them understand the
influence of organizational culture on the relationship between strategy and
performance. In other words, they will understand whether there is a fit between
strategy, culture and performance in their respective organizations.
ii. To researchers and students of strategic management – The study will act as a
point of reference and further research.
19
CHAPTER TWO
LITERATURE REVIEW
2.1 Organizational Strategy
Andrews (1971) defines strategy as the pattern of objectives, purposes or goals and the
major policies and plans for achieving these goals, stated in such a way as to define what
business the company is in, or is to be in, and the kind of company it is or is to be.
Strategy is the overall plan for deploying resources to establish a favorable position
(Grant, 1998).
Strategy is how a business defines and attacks its short and longterm goals. This
involves an internal and external analysis of the firm, an understanding of the firm’s
competitive advantage and the design and execution of a strategy taking into account the
business’s strengths and competitive advantages while mitigating risks and threats. The
primary purpose of strategy is to guide management decisions toward superior
performance through establishing competitive advantage.
All organizations are faced with the challenges of strategy development; some from a
desire to grasp new opportunities, others to overcome significant problems (Johnson and
Scholes, 2002). These scholars see strategy as being concerned with the complexity
arising out of ambiguous and nonroutine situations with the organization wide rather
than operation specific implications. Strategy development involves understanding the
competitive position of the firm, making strategic choices and putting strategy into
action.
20
Thompson (1997) found that many companies have no goals at all, other than cost
reduction, or the boss hides them in his head. He notes further than in order to be
successful, organizations must be strategically aware, must understand how changes in
their competitive environment some of which they may have started, and others to
which they will have to react, are unfolding. In spite of a wide range of different models
of strategy, a company requires a strategy to make long run decisions on how to meet the
customers’ demand, how to tap new markets, how to distinguish themselves from their
competitors, how to keep relationship with their suppliers, employees and how to deal
with challenges from both inside and outside of the company.
Businesses operate in an ever dynamic environment. They adjust and adapt to
environmental dynamism through a variety of strategic orientations. Strategy, therefore,
is instrumental to the survival of the firm. As Miles and Snow (1994) indicated, firms that
match their situation to the environment can improve their performance, while those that
do not court failure. The relationship between the firm and its environment, in the
strategy – making context, has two major dimensions, Firstly, the firm’s basic mission or
scope should match its environment. Second, it should aim at having a competitive edge
over other firms that are also trying to get that match.
Strategies are formulated to adapt to, respond to, or shape the environment (Johnson and
Scholes, 1999; Mintzberg, 1994). With any significant change in the level of uncertainty,
a change in strategy is necessary to keep the organization in harmony with its
environment. Environmental uncertainty plays a central role in strategy formulation, for it
affects not only the availability of resources to the firm and the value of its competencies
and capabilities, but also customer needs and requirements, as well as the competition.
Corporate strategy can also be seen as simply how a business defines and attacks its short
and long term goals. This involves an internal and external analysis of the firm, an
understanding of the firm’s competitive advantage and the design and execution of a
21
strategy taking into account the business’s strengths and competitive advantages while
mitigating risks and threats (Musselman, 2005).
There are a number of strategy typologies and taxonomies in the strategic management
literature (See, for example, Miller and Friesen, 1978; Abell, 1980; Porter, 1980;
Chrisman, Hofer, and Boulton,1988; Segev, 1989). However, the Miles and Snow (1978),
strategic orientation typology has been accepted as a robust description of the strategic
behavior of firms trying to adapt to their uncertain environment. It reflects a broad and
holistic perspective to strategy conceptualization (Venkatraman, 1989). It is widely
adopted in strategy research (Snow and Hrebiniak,1980; Shortell and Jazac,1990;
Ramaswamy et al.1994; James and Hatten,1995).
Miles and Snow (1978) based on indepth crossindustry study of a relatively small
sample of large corporations, developed a theory that there are three superior performing
business types and all others are average or less than average. Their theory holds that in
order to be superior, there must be a clear and direct match between the organization’s
mission/values (their definition), the organization’s strategies (their basic strategy set)
and the organization’s functional strategies (their characteristics and behavior).
Miles and Snow (1978) suggest that organizations develop a systematic and identifiable
pattern of behavior toward environmental adaptation. The major elements of adaptation
and the relationships between them are conceptualized by what they call an ‘’adaptive
cycle’’ over time. The cycle embodies different business strategies representing
organizations’ response to the competitive environment. An organization’s strategy
addresses three types of problems, which represent the dimensions of the ‘’adaptive
cycle’’. The entrepreneurial, the engineering, and the administrative problems. The
entrepreneurial problem relates to how an organization orients environmental trends.
Thus, these organizations often are the creators of change and uncertainty to which their
competitors must respond.’’ (Miles and Snow, 1978, p.29). Their basic strategies include:
broad domain, in a continuous state of development; monitoring a wide range of
22
environmental conditions, trends, and events; creation of change in their industries;
growth primarily from new markets and new products; and uneven, spurtlike growth.
Miles and Snow (1978) distinguish four strategy types, namely prospectors, defenders,
analyzers and Reactors.
Prospector firms constantly seek new market opportunities and compete largely through
new productmarket innovations. Such firms consistently attempt to be the first movers in
the market with additions or changes to its products and services. Hence monitoring of
external environment and organizational flexibility is emphasized to ensure quick
responses to market changes. Planning in prospector firms tends to be broad and
organizational structures are decentralized to facilitate responsiveness to changing market
conditions. These organizations thrive in changing business environments that have an
element of unpredictability, and succeed by constantly examining the market in a quest
for new opportunities. They regularly experiment with potential responses to emerging
environmental trends. Thus, these organizations often are the creators of change and
uncertainty to which their competitors must respond. However, because of their strong
concern for product and market innovation, these organizations usually are not
completely efficient. Key executives are also likely to come from outside than inside, and
have a shorter tenure than defender’s.
Defender firms, at the other end of the strategic spectrum, operate in relatively stable
market domains and compete mainly on the basis of price, quality and service. They have
narrow product – market domains. Tight control and cost efficiencies are their focus in
order to maintain competitiveness. Consequently planning is more intensive while
organizational structures and processes are more formalized and centralized. Top
managers in defender firms are highly expert in their organization’s limited area of
operation but do not tend to search outside of their domains for new opportunities. As a
result of this narrow focus, these organizations seldom need to make major adjustments
23
in their technology, structure, or methods of operation. Instead they devote primary
attention to improving the efficiency of their existing operations.
Analyzer firms, being hybrids, combine the characteristics of both prospectors and
defenders. They operate in stable product – markets as well as selectively entering new
markets. In their stable areas, these organizations operate routinely and efficiently
through use of formalized structures and processes. In their more turbulent areas, top
managers watch their competitors closely for new ideas, and then they rapidly adopt
those that appear to be the most promising. Production and cost efficiencies are
emphasized in established businesses, while innovations are selectively adopted in new
markets, particularly in new areas with demonstrated promise. Hence, analyzers are
usually second or late movers. Consequently analyzers are organizationally more
complex, combining both centralization and decentralization characteristics to suit the
different and varying markets served.
Analyzers basic strategy include a mixture of products and markets, some stable, others
changing; successful imitation through extensive marketing surveillance; and follower of
change; and growth normally occurs through market penetration; though it may also
occur through product and market development. These companies exhibit dual
technology as a core characteristic; moderate efficiency; dominant coalition in marketing,
applied research, and production; an intensive and comprehensive planning; a matrix,
functional and product structure; difficult control and must be able to trade off efficiency
and effectiveness; a coordination that is both simple and complex; managerial focus is
dual efficiency versus past, effectiveness versus similar organizations.
Reactors are organizations in which top managers frequently perceive change and
uncertainty occurring in their organizational environments but are unable to respond
effectively. Because this type of organization lacks a consistent strategystructure
relationship, it seldom makes adjustments of any sort until forced to do so by
environmental pressures (Miles and Snow, 1978). The basic strategy common in these
24
organizations include the failure by management to articulate a viable organization’s
strategy; or management articulates an appropriate strategy, but technology, culture,
structure, and process are not linked to strategy appropriately; and / or management
adheres to a particular strategy Structure relationship that is not relevant to the
environment. Reactor firms are therefore characterized by the absence of a consistent
strategy and are usually viewed as unstable and nonviable.
2.2 Organizational Culture
Schein (1992) defines organizational culture as ‘’ a pattern of shared basic assumptions
that the group learned as it solved its problems of external adaptation and internal
integration, that has worked well enough to be considered valid and, therefore, to be
taught to new members as the correct way to perceive, think, and feel in relation to those
problems.’’ Schein also states that these assumptions ‘’ come to be taken for granted’’
because they solve the group’s problems ‘’repeatedly and reliably.’’ Additionally,
because these assumptions function unconsciously and instinctively, culture is often a
challenging concept for organizational members to not only understand but, measure, and
change (Kraut,1996).
Schein (1992) also notes that culture can be analyzed at several different levels including
artifacts, espoused values and basic underlying assumptions. Artifacts are defined as ‘’
visible organizational structures and processes’’. Examples of artifacts include dress
codes, architecture, newsletters, signs and banners. Another level of culture stated by
Schein is Espoused values. Espoused values are audible and spoken, and include goals,
sayings, philosophies, strategies and slogans. The third level described by Schein is Basic
Underlying Assumptions (BAUs). BAUs are ‘’ unconscious, takenforgranted beliefs,
perceptions, thoughts, and feelings’’. This includes assumptions that are not directly
25
observable, consequently hard to analyze and change. Similar to Schein, Daniel Denison
(1990) defines organizational culture as ‘’ underlying beliefs, values, and assumptions
held by members of the organization, and the practices and behaviors that exemplify and
reinforce them.’’
Although Schein and Denison both provide excellent formal definitions of culture, a
basic definition of culture has also been provided by Terrance Deal (Lui, personal
communication,2003) as ‘’ it’s how things get done around here’’. Just as families and
cities have a specific look and feel to them, so do organizations. This look and feel can
represent culture, as it includes images, distinct methods of doing things and how it is
perceived by others.
A recent research project plainly illustrates how culture is formed and what it does. The
research project did a study on four monkeys that were placed in a cage with a banana.
When one of the monkeys approached the banana, it received a lowintensity shock.
When shocked, the monkey drew back. When another monkey approached the banana,
the first monkey that was shocked shrieked a sound of warning. The pattern repeated
until all of the monkeys were warned and the banana remained untouched. As the study
continued, they removed and replaced monkeys into the cage. Each new monkey
attempted to retrieve the banana, but was warned by another monkey in the cage. The
cycle continued and eventually four new monkeys were in the cage, the banana remained
untouched and all of the monkeys remained shock free (Marc & Farbrother, 2003).
What this study shows is how culture is formed and is embedded in the behaviors and
actions of the organization. If you think of the monkeys as employees of an organization,
you can see a direct connection to culture and its effects on the behaviors exhibited.
Culture becomes instilled in organizations to the point where individuals do not know
how things came to be, but trust what is passed along.
26
Culture influences the behavior of all individuals and groups within an organization. It
influences most aspects of organizational life, including how decisions are made, who
makes them, how rewards are given, who is promoted, how people are treated, and how
the organization responds to its environment. Culture to an organization is what
personality is to an individual. It is that distinctive collection of beliefs, values, work
styles, and relationships that distinguish one organization from another (Roger Harrison
& Stokes, 1992).
Another excellent definition of culture has been provided by Pearce and Robinson.
According to Pearce and Robinson (2003) organization culture is the set of important
assumptions (often unstated) that members of an organization share in common. An
organization’s culture is similar to an individual’s personality an intangible yet ever
present theme that provides meaning, direction, and the basis of action. In much the same
way as personality influences the behavior of an individual, the shared assumptions
(beliefs and values) among a firm’s members influence opinions and actions within that
firm.
Thompson and Strickland (1996) define an organization’s culture as the policies,
practices, traditions, philosophical beliefs, and ways of doing things. An organization’s
culture and associated values dictate the way decisions are made, the objectives of the
organization, the type of competitive advantage sought, the organization structure and
systems of management, functional strategies and policies, attitudes towards managing
people and information systems.
Mahinda (2002) states that organizations, just like people, have personalities and
attitudes. Company attitudes are manifested in how they handle their business. They may
be a rough and ready ‘’let’s get things done type of company, or one which is rather
bureaucratic and likes to do things strictly by the book..’’ The attitudes of the companies’
employees are also part of their culture, and may have developed in response to their
treatment by the company over the years.
27
The most typical beliefs that shape organization’s culture include a belief in superior
quality and service, a belief in the importance of people as individuals, and a faith in their
ability to make a strong contribution, a belief in the importance of the details of
execution, ‘’the nuts and bolts of doing the job well’’, a belief that customers should
reign supreme, et cetera (Pearce and Robinson, 2003).
Culture in the business environment can be seen by tangible things such as the corporate
management philosophy articulated in a mission statement. Companies also create
operating principles that typically define the way a company interacts with its customers
and employees. While these things are important to put in writing, it is the more
intangible aspect of culture that sets one business apart from another. Culture establishes
and underpins; order, structure, membership criteria, conditioned for judging effective
performance, communication patterns, expectations and priorities, the nature of reward
and punishment, the nature and use of power, decision making practices, and
management practices (Schineider,1994).
The notions ‘’ organization’s culture’’ draws attention not only to what is observed in the
way an organization formally goes about its business, but also to the less obvious and
more implicit informal characteristics that influence how decisions are made in practice
and how people actually treat each other at work. It is those informal, latent and implicit
aspects of an organization that are increasingly being acknowledged as important facets
of an organization’s makeup and which profoundly influence its behavior and the well
being of staff (Walton, 1997).
Carol (1982) observed that culture, like morals, laws, and customs, shapes behavior and
is something that older generations hand down to younger ones. Hofstede (1991) linked
culture to a collective programming of minds of one group that differentiates them from
other groups. He believes that this programming is derived from one’s social culture.
28
Understanding and assessing the organization’s culture can mean the difference between
success and failure in today’s fast changing business environment (Hagberg & Heifetz,
2001). The culture of an organization operates at both conscious and unconscious levels
and it drives the organization and its action. It is somewhat like ‘‘the operating system’’
of the organization. It guides how employees think, act and feel. It is dynamic and fluid,
and it is never static. They further assert that if the organization wants to maximize its
ability to attain its strategic objectives, it must understand if the prevailing culture
supports and drives the actions necessary to achieve its strategic goals.
A shared narrative of the past lays the foundation for culture. Too often today’s
companies casually cast aside their historical roots in favor of what is in vogue. In doing
so, they often forsake the core values and beliefs that have contributed to their success.
They become rootless, sterile enterprises stalking whatever economic opportunity comes
along. How do we balance the tradition that keeps us anchored and the innovation that
keeps us current? That is one of the many dilemmas today’s corporate leaders wrestle
with. The trick is to maintain core values while attiring peripheral practices to deal with
contemporary issues (Deal & Kennedy, 2000).
While no one organization has a pure culture throughout, every successful organization
has a core culture. The core culture is central to the functioning of the organization,
forming the nuclear core for how that organization operates in order to succeed. It is
critical that this core or lead culture is aligned with the organization’s strategy and core
leadership practices. This alignment is central to any organization’s effectiveness.
Without it, focus is lost and energy wasted as people; systems and processes work at
crosspurposes with one another (Collins & Porras, 1994).
Schneider (1994) indicates that there are four core cultures: control, collaboration,
competence and cultivation. Leaders create one of these four core cultures, consciously
and / or unconsciously, from their own personal history, nature, socialization,
29
experiences, and perception of what it takes to succeed in their market place. The
following are the meanings of the four culture types:
Control: This culture is all about certainty. It fundamentally exists to ensure certainty,
predictability, safety, accuracy, and dependability. Fundamental issue in a control culture
is to preserve, grow, and ensure the wellbeing and success of the organizations per se.
The organization as a system comes first. Accordingly, the design and framework for
information and knowledge in the control culture is built essentially around the goals of
the organization, and the extent to which those goals are met. This culture is centered on
organization’s goal attainment.
Collaboration: This culture is all about synergy. It fundamentally exists to ensure unity,
close connection with the customer, intense dedication to the customer. Experiential
knowing means that the fundamental issue in a collaboration culture is the connection
between people’s experience and reality. The organization moves ahead through the
diverse collective experience of people from inside and outside the organization.
Collaboration culture people know something when diverse collective experience has
been fully utilized. This culture is centered on unique customer goal attachment.
Competence: This culture is all about distinction. It fundamentally exists to ensure the
accomplishment of unparalleled, unmatched products or services. This is the culture of
uniqueness per se, of oneofakind products or services. Conceptual systematism means
that the fundamental issue in a competence culture is the realization of conceptual, goals,
particularly superior, distinctive conceptual goals. The framework for information and
knowledge is built essentially around the conceptual system goals of the organization and
the extent to which these goals are met. This culture is centered on conceptual goal
attainment.
Cultivation: This culture is all about enrichment. It fundamentally exists to ensure the
fullest growth of the customer, fulfillment of the customer’s potential, the raising up the
30
customer. This culture is all about the further realization of ideals, values and higher
order purposes. Evolutional knowing means that the fundamental issue in the cultivation
culture is the connection between the values and ideals of the organization and the extent
to which these values and ideals are being operationalized. The key emphasis in this
culture is the connection between what is espoused and what is put into operation. This is
culture on valuecentered goal attainment.
2.3 Organizational Performance
Organizational performance comprises the actual output or results of an organization as
measured against its intended outputs (or goals and objectives). The performance of any
business organization is affected by the strategies in place within that organization
(Mutuku, 2005). Hunger and Wheelen (1995) say that strategies determine the longterm
performance of the firm. Business managers must therefore monitor customer needs and
preferences, competitors’ actions, technology development, and the performance of
internal processes, as well as the overall financial condition of the business and develop
appropriate strategies.
Performance is normally measured using standards which are usually detailed
expressions of strategic objectives. They are also the measures of acceptable performance
results. Measures used to assess organizational performance depend on the organization
and the objectives that need to be achieved. These objectives are normally established in
the strategy formulation stage of the strategy management process and they could
include: profitability, market share and cost reduction among others (Hunger and
Wheelen, 1995). Thompson et al. (2007) identified two distinct performance yardsticks.
They are those relating to financial performance and those relating to strategic
performance. Those relating to strategic performance are the outcomes that indicate if a
company is strengthening its market standing, competitive vitality and future business
prospects.
31
Conventionally an organization’s performance can be gauged using its current financial
data. However, Venkatraman and Ramanujam (1986) proposed that strategylevel
performance measurement should include both financial and operating measures.
Chakravarthy (1986) studied firms operating in the computer industry and concluded that
financial performance measures are inadequate indicators of a broader construct,
‘’excellence’’. This is partly due to the fact that financial indicators largely ignore the
interests of stakeholders other than stockholders. Chakravarthy argued that future
oriented indicators, such as investment in R&D, should also be part of the measurement
and control system. A study by Ernst and Young’s Center for Business Innovation(Daly,
1996) found that investment analysts who considered nonfinancial as well as financial
performance indicators were more accurate in their earnings estimates than those who
just used financial indicators. This suggests that a comprehensive performance evaluation
system has greater predictive validity than one that is purely financially oriented.
In view of the above, most studies on organizational performance use a variety of
financial and nonfinancial success measures. Researchers employ financial measures
such as profit (Saunders and Wong, 1985; Hooley and Lynch, 1985; Baker et al., 1988),
turnover (Frazier and Howell, 1983). Nonfinancial measures include innovativeness
(Goldsmith and Clutterback, 1984) and market standing (Saunders and Wong, 1985;
Hooley and Lynch, 1985). The most commonly used measures of corporate performance
according to Hunger and Wheelen (1985), are the rate of return on investment (ROI),
earnings per share (EPS) and rate of return on equity (ROE). A study by Manyuru (2005)
on corporate governance and performance considered turnover, net profit and market
share price (MSP) as the measures of performance.
Return on investment (ROI) is the result of dividing net income before tax by total assets.
Earnings per share (EPS) is equal to the earnings available to common stockholders
divided by the weighted average number of shares of common stock outstanding. Return
on equity (ROE) shows the relationship of net income to average stockholders equity
32
(Hermanson et. Al., 1989). Turnover is the sales or gross revenue of the company during
the financial period under review. A higher or growing turnover implies increased
volume of sales due to quantities sold or increased prices. Higher volume of sales will
most likely result from increased demand for the company’s products or services which
reflects growth of the company. Quoting Drobetz (2004), Manyuru says that data on
turnover has been used by many companies in assessing corporate performance.
However, on its own it does not reveal the level of efficiency in production and other cost
related areas.
Net profit is the realizable income net of all deposits, interest on debt or tax and it shows
how well a company has controlled its costs in the effort to maximize on shareholders
wealth. Market share price is one of the stock marketbased indicators which are
considered most appropriate or sensitive measure as they reflect the wealth generation for
shareholders.
Another commonly used but nonfinancial measure of performance is benchmarking. To
achieve best practices and to stay competitive, many companies realize that it is no longer
enough to benchmark against their own previous performance or to rely solely on
financial statistics; they must benchmark against their peer groups to gain an exceptional
understanding of their current and future levels of performance. Smart goal setting and
consistent measurement using devices such as indexes give a company that flexibility it
will surely need to survive and thrive tomorrow (Stollsteimert, 2000).
Benchmarking can first and foremost be helpful in understanding what level of
performance one can reasonably expect. From there, a company can begin to quantify the
gap between goals and current performance. Knowing where the problems are is
tantamount to solving them, and finding solutions is easier when you know where to
look. Benchmark ratios are measurable and comparable, which makes them ideally suited
for managementbyobjective incentive programs. They help keep the company focused
on the controllable aspects of a business. Success and failure can be easily evaluated.
33
Focus should be placed on improving the operational activities that directly affect cash
position, profitability, and productivity. Operational activities such as inventory accuracy,
billofmaterial accuracy, and planning and scheduling are the key drivers of
manufacturing. By understanding, quantifying, and tracking these drivers, manufacturers
stand to gain efficiencies of enormous magnitude (Stollsteimert, 2000).
Stollsteimert (2000) argues that benchmark ratios provide an objective standard by which
to measure performance. By tracking key measurements at regular intervals, busy
executives can pay closer attention to those key factors that affect the company’s bottom
line performance. At a minimum, the executive team should review progress monthly and
manage performance until goals are achieved. As with most things in business, the value
of this process grows dramatically as the appropriate attention and resources are
dedicated to it. The more times this process is executed (Benchmark, set goals, review
process, repeat), the more proficient a company becomes at realizing improved
performance.
2.4 Corporate Strategy, Culture and Performance
Studies on the link between culture and organization’s performance are a relatively recent
phenomenon. Thomas peters and Robert Waterman (1982) told managers that an
organization’s success depends on having a strong culture, and laying down a formula for
such a culture. They state that without exception, the dominance and coherence of culture
proved to be an essential quality of the excellent companies. Moreover, the stronger the
culture and the more it was directed to the marketplace, the less was the need for policy
manuals, organization charts, or detailed procedures and rules.
A company’s strategic actions typically reflect its cultural traits and managerial values. In
some cases, a company’s core beliefs and culture even dominate the choice of strategic
moves. This is because culturerelated values and beliefs become so embedded in
34
management’s strategic thinking and actions that they condition how the enterprise
responds to eternal events. Such firms a culturedriven bias about how to handle strategic
issues and what kinds of strategic moves it will consider or reject. Strong cultural
influences partly account for why companies gain reputations for strategic traits as
technological leadership, product innovation, dedication to superior craftsmanship,
proximity for financial wheeling and dealing, desire to grow rapidly by acquiring other
companies, strong peopleorientation, or unusual emphasis on customer service or total
customer satisfaction (Thompson and Strickland, 1996).
Scholars of organization’s culture have sought to find the key to unlock the mystery and
power of culture and its influence on the performance of organizations and groups.
(Barrett and Bass, 1976) observed that, most research in industrial and organization’s
psychology is done within one cultural context. This context puts constraints upon both
our theories and our practical solutions to the organization’s problems.
Lahey (2001) researched on the impact of strategic planning on organization’s
effectiveness and culture. This study never addressed the need to align culture to strategy
and how this impacts on performance. Gregory(2003) carried out a research on the
impact of formal strategic planning on financial performance in the food processing
sector. Whereas the results of the strategic planning tools used in his study revealed a
positive a positive financial performance as measured by the threeyear pretax return on
assets, he first never considered the cultural perspective on performance, and second,
took only a sectoral analysis.
Blackburn (1989) researched on the strategic and operational planning uncertainty, and
performance in small firms. This study also stressed on the relationship between strategic
planning and financial performance. Performance of a company includes the level of
satisfaction by other stakeholders customers, employees, shareholders, suppliers, the
community, the government, investors, creditors, et cetera.
35
Peters and Waterman (1982) wrote: ‘’ without exception, the dominance and coherence
of culture proved to be an essential quality of the excellent companies. Moreover, the
stronger the culture and the more it was directed toward the market place, the less need
was there for policy manuals, organizational charts, or detailed procedures and rates’’. In
these companies people way down the line and know what they are supposed to do in
most situations because the handful of guarding values is crystal clear.
However, close to Kenya, in the south and central Africa countries of south Africa,
Zambia, and Zimbabwe, Frese et al (2003) carried out three different studies on the
psychological action strategy characteristics in African business owners and success in.
This study identified four psychological strategy characteristics: Complete planning
(planning ahead and actively structuring the situation), critical point strategy(working on
and planning the most difficult and most important point first), opportunistic strategy
(proactive orientation on opportunities with little planning and deviation from any goals
when new opportunities are perceived), and reactive strategy (which implies that one
reacts to the situation; thus the owner is neither proactive nor planning). The two
underlying dimensions in this study are proactivity and planning. A reactive strategy is
not proactive and does not plan. Opportunistic strategy does not plan, but is highly
proactive in finding opportunities to be exploited. Critical point plans to a certain extent
and is proactive to a certain extent, and finally complete planning is both proactive and
planning (Frese et al, 2003).
There is enough evidence revealing that a reactive strategy is negatively related to
success. This means that those owners who react to the situation, who make decisions
only after the market or other people tell them to, who do not attempt to influence their
environment do worse in every environment. Results on planning are also relatively
similar – planning is positive in Zambia and in Zimbabwe, although in South Africa only
critical point planning is significantly related to success. The most important difference
occurs with opportunistic strategy. This strategy is only significantly and positively
related to success in South Africa but not so in the other two countries.
36
One possible interpretation is to look at cultural differences. In South Africa, there is a
higher degree of uncertainty avoidance than in the other two countries. This would
actually imply a culture misfit hypothesis. Uncertainty avoidance suggests that one
should plan to overcome anxieties related to the future. South Africa is the only country
in which a nonplanning opportunistic strategy is positively related to success. Those who
behave uncharacteristically for their culture (and do not plan, but go about things
opportunistically) are better off than those who have a fit of their strategy and their
culture (Frese et al. 2003).
Mahinda (2003) based her research on the influence of culture on Human resource
practices by manufacturing firms registered by the Kenya Association of manufacturers.
First, her research was industry specific and limited to manufacturing sector. Strategy is
process and context sensitive. Research findings in the manufacturing sector may
therefore be very different from those of other sectors such as agricultural, service, or
financial.
In line with this setback she recommended further research based on other sectors /
industries. Second, her research was limited in that it did not unearth the link, if any,
between an organization adopting strategic planning on performance. Thirdly, she
observed that a further research adding incision into culture and performance would
perhaps improve research findings. Lastly, she notes that managers risk ignoring
organization’s culture in the process of strategic decisions at their own peril. More
importantly, strategy in one industry need not be the same in the other industry. Hence,
the need to study these interindustry differences.
Kariuki (2001) carried out a research investigating the aspects of culture and their effects
on the marketing strategies in the beverage industry in Kenya. However, this study did
not address the effect of culture on strategic planning and resultant performance.
37

CHAPTER THREE
RESEARCH METHODOLOGY
3.1 Research Design
38
The research design for the study was a survey. A survey was deemed more appropriate
since this study involved relationships and comparative analysis. It was used to explore
the relationship between organizational culture, strategy and performance in the
commercial banking institutions.
3.2 Population
The population of study consisted of all the 44 (CBK list, 2008) commercial banking
institutions operating in Kenya. Given that their number is not high, a census study was
conducted. The list of the respondent banks is attached as appendix 2.
3.3 Data collection
Questionnaires with Likerttype scales were used to collect primary data. To increase the
response rate, respondents were two managers the head of planning and that of human
resources or the head of finance as were applicable. This was to ensure that the
questionnaires are answered by people who are knowledgeable on culture and / or
planning. The questionnaire was divided into four parts. Part 1 was to solicit general
information on the organizations; part 2, 3, and 4 focused on objectives I, II and III,
respectively. Part 1 and 2 were filled by the human resource managers while part 3 and 4
by the planning managers.
All the questionnaires were enclosed with addressed return stamp envelopes. This was
meant to increase the response rate. Financial performances were captured from the
secondary data. The sources were Financial Reports.
3.4 Data Analysis
39
Data collected were analyzed using descriptive statistics such as mode, mean and
frequencies. Tabular analysis using averages were used to identify the dominant cultures
and strategy types. Return on investment was used to measure performance. Correlation
analysis was used to establish the relationship between culture and performance and
between strategy and performance. The moderating effect of culture on the relationship
between strategy and performance was analyzed using tabular analysis.
CHAPTER FOUR
DATA ANALYSIS, FINDINGS AND DISCUSSION
40
4.1 Introduction
The research findings are presented and discussed in this chapter. It begins by looking at
the response rate. Profiles of the banks are then looked at in terms of how long they have
been operating in Kenya, their size and ownership. After the overview of the bank
profiles, it then looks at dominant cultures and strategies at the banks. It finally analyses
and discusses the relationship between cultures and strategies adopted by the banks and
their influence on performance.
4.2 Overview of bank profiles
4.2.1 Years of operation
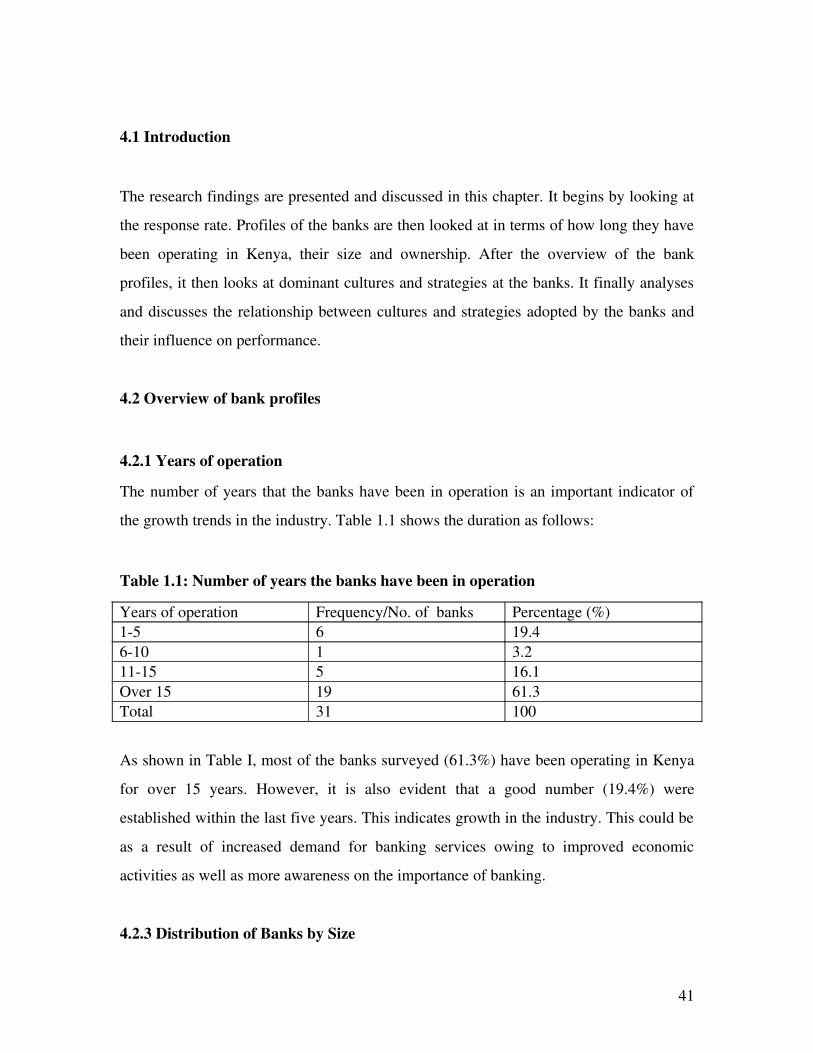
The number of years that the banks have been in operation is an important indicator of
the growth trends in the industry. Table 1.1 shows the duration as follows:
Table 1.1: Number of years the banks have been in operation
Years of operation Frequency/No. of banks Percentage (%)15 6 19.4610 1 3.21115 5 16.1Over 15 19 61.3Total 31 100
As shown in Table I, most of the banks surveyed (61.3%) have been operating in Kenya
for over 15 years. However, it is also evident that a good number (19.4%) were
established within the last five years. This indicates growth in the industry. This could be
as a result of increased demand for banking services owing to improved economic
activities as well as more awareness on the importance of banking.
4.2.3 Distribution of Banks by Size
41
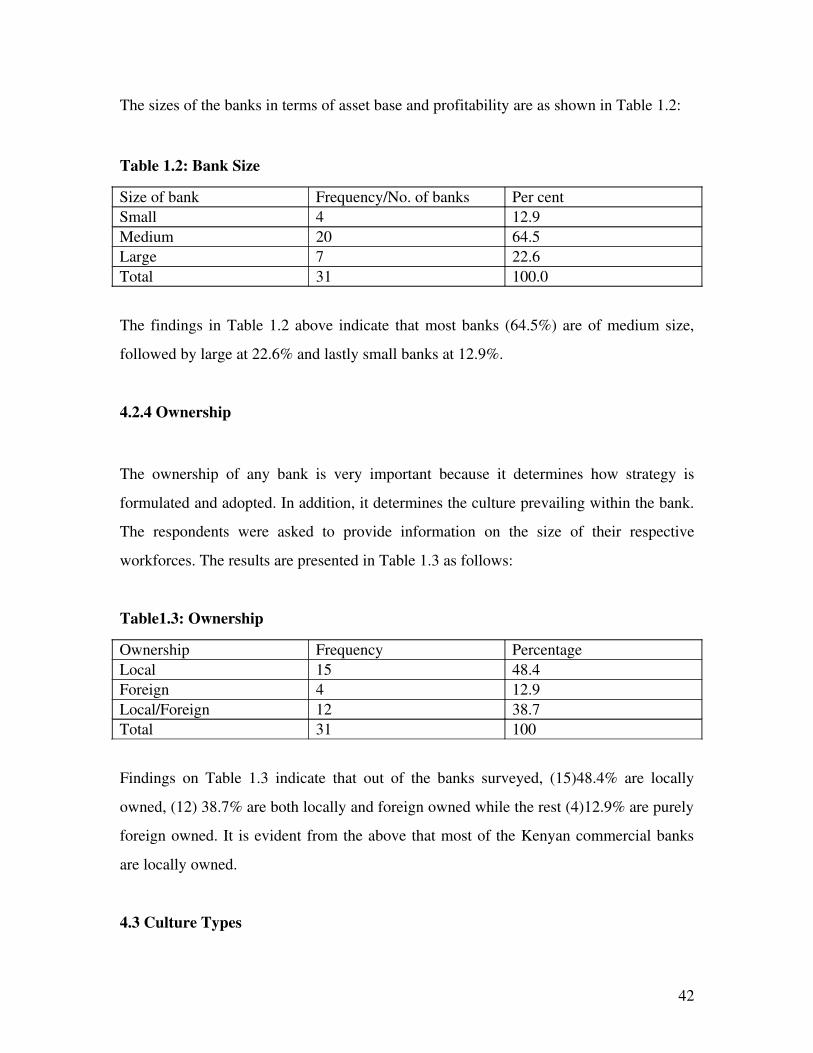
The sizes of the banks in terms of asset base and profitability are as shown in Table 1.2:
Table 1.2: Bank Size
Size of bank Frequency/No. of banks Per centSmall 4 12.9Medium 20 64.5Large 7 22.6Total 31 100.0
The findings in Table 1.2 above indicate that most banks (64.5%) are of medium size,
followed by large at 22.6% and lastly small banks at 12.9%.
4.2.4 Ownership
The ownership of any bank is very important because it determines how strategy is
formulated and adopted. In addition, it determines the culture prevailing within the bank.
The respondents were asked to provide information on the size of their respective
workforces. The results are presented in Table 1.3 as follows:
Table1.3: Ownership
Ownership Frequency PercentageLocal 15 48.4Foreign 4 12.9Local/Foreign 12 38.7Total 31 100
Findings on Table 1.3 indicate that out of the banks surveyed, (15)48.4% are locally
owned, (12) 38.7% are both locally and foreign owned while the rest (4)12.9% are purely
foreign owned. It is evident from the above that most of the Kenyan commercial banks
are locally owned.
4.3 Culture Types
42
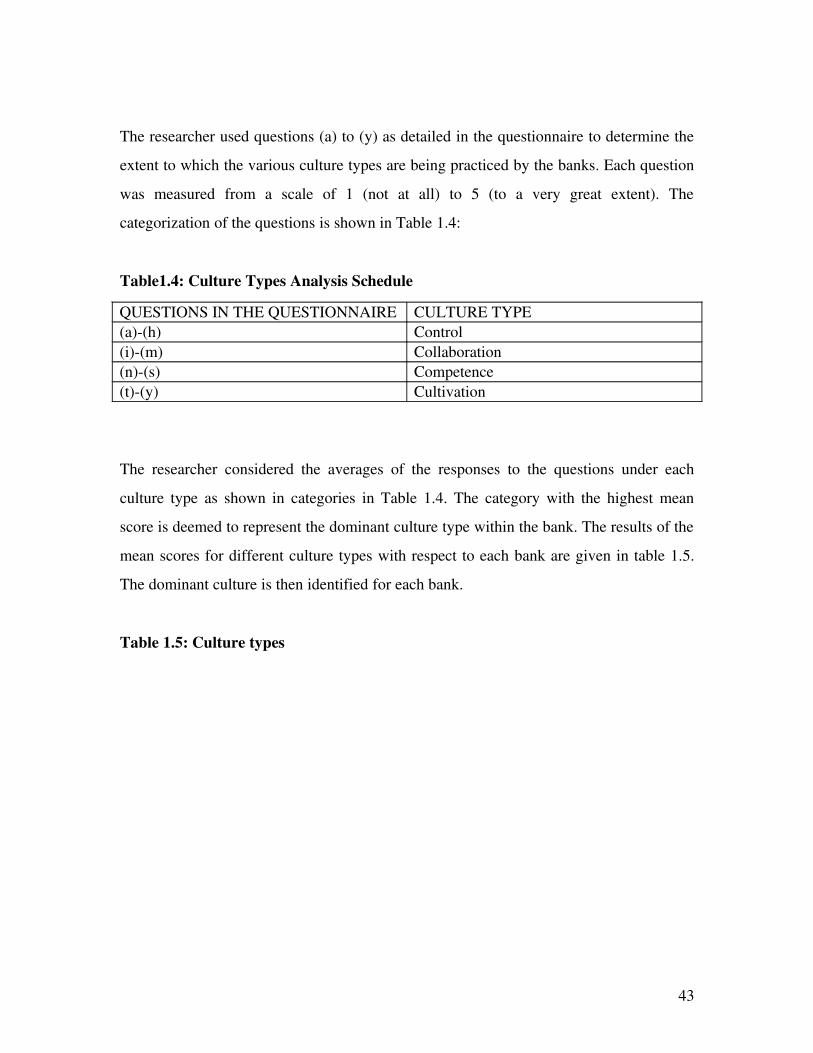
The researcher used questions (a) to (y) as detailed in the questionnaire to determine the
extent to which the various culture types are being practiced by the banks. Each question
was measured from a scale of 1 (not at all) to 5 (to a very great extent). The
categorization of the questions is shown in Table 1.4:
Table1.4: Culture Types Analysis Schedule
QUESTIONS IN THE QUESTIONNAIRE CULTURE TYPE(a)(h) Control(i)(m) Collaboration(n)(s) Competence(t)(y) Cultivation
The researcher considered the averages of the responses to the questions under each
culture type as shown in categories in Table 1.4. The category with the highest mean
score is deemed to represent the dominant culture type within the bank. The results of the
mean scores for different culture types with respect to each bank are given in table 1.5.
The dominant culture is then identified for each bank.
Table 1.5: Culture types
43
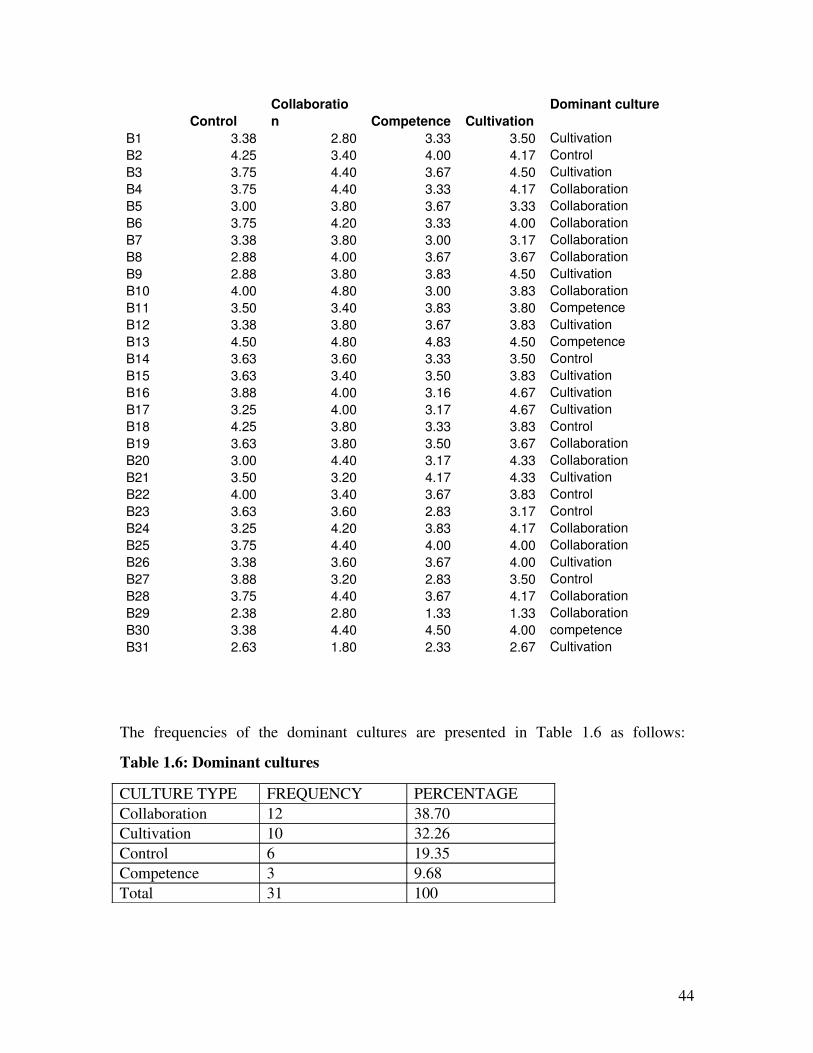
The frequencies of the dominant cultures are presented in Table 1.6 as follows:
Table 1.6: Dominant cultures
CULTURE TYPE FREQUENCY PERCENTAGECollaboration 12 38.70Cultivation 10 32.26Control 6 19.35Competence 3 9.68Total 31 100
ControlCollaboration Competence Cultivation
Dominant culture
B1 3.38 2.80 3.33 3.50 Cultivation B2 4.25 3.40 4.00 4.17 ControlB3 3.75 4.40 3.67 4.50 CultivationB4 3.75 4.40 3.33 4.17 CollaborationB5 3.00 3.80 3.67 3.33 CollaborationB6 3.75 4.20 3.33 4.00 CollaborationB7 3.38 3.80 3.00 3.17 Collaboration B8 2.88 4.00 3.67 3.67 CollaborationB9 2.88 3.80 3.83 4.50 CultivationB10 4.00 4.80 3.00 3.83 CollaborationB11 3.50 3.40 3.83 3.80 CompetenceB12 3.38 3.80 3.67 3.83 CultivationB13 4.50 4.80 4.83 4.50 CompetenceB14 3.63 3.60 3.33 3.50 ControlB15 3.63 3.40 3.50 3.83 CultivationB16 3.88 4.00 3.16 4.67 CultivationB17 3.25 4.00 3.17 4.67 CultivationB18 4.25 3.80 3.33 3.83 ControlB19 3.63 3.80 3.50 3.67 CollaborationB20 3.00 4.40 3.17 4.33 CollaborationB21 3.50 3.20 4.17 4.33 CultivationB22 4.00 3.40 3.67 3.83 ControlB23 3.63 3.60 2.83 3.17 ControlB24 3.25 4.20 3.83 4.17 CollaborationB25 3.75 4.40 4.00 4.00 CollaborationB26 3.38 3.60 3.67 4.00 CultivationB27 3.88 3.20 2.83 3.50 ControlB28 3.75 4.40 3.67 4.17 CollaborationB29 2.38 2.80 1.33 1.33 CollaborationB30 3.38 4.40 4.50 4.00 competenceB31 2.63 1.80 2.33 2.67 Cultivation
44
From Table 1.6, it is evident that twelve or 38.70 per cent of the respondent banks
practice Collaboration culture, ten or 32.26 per cent cultivation, six or 19.3 percent
control and lastly three or 9.68 per cent practice competence culture.
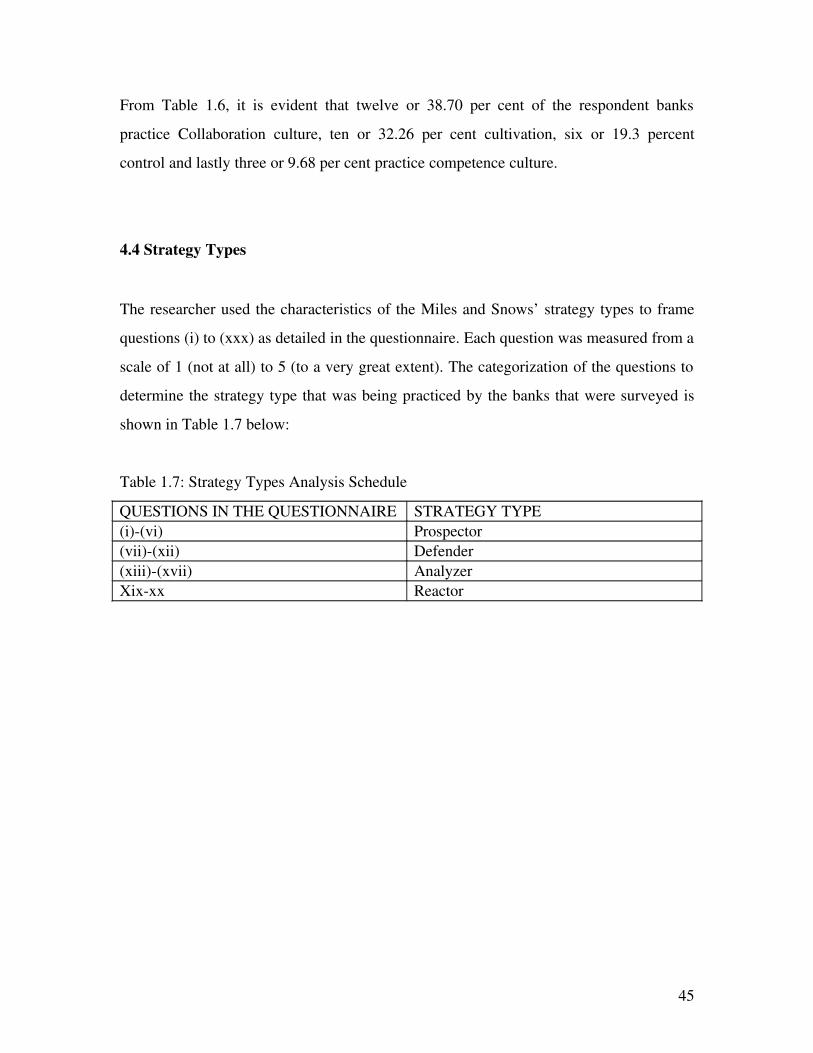
4.4 Strategy Types
The researcher used the characteristics of the Miles and Snows’ strategy types to frame
questions (i) to (xxx) as detailed in the questionnaire. Each question was measured from a
scale of 1 (not at all) to 5 (to a very great extent). The categorization of the questions to
determine the strategy type that was being practiced by the banks that were surveyed is
shown in Table 1.7 below:
Table 1.7: Strategy Types Analysis Schedule
QUESTIONS IN THE QUESTIONNAIRE STRATEGY TYPE(i)(vi) Prospector(vii)(xii) Defender(xiii)(xvii) AnalyzerXixxx Reactor
45
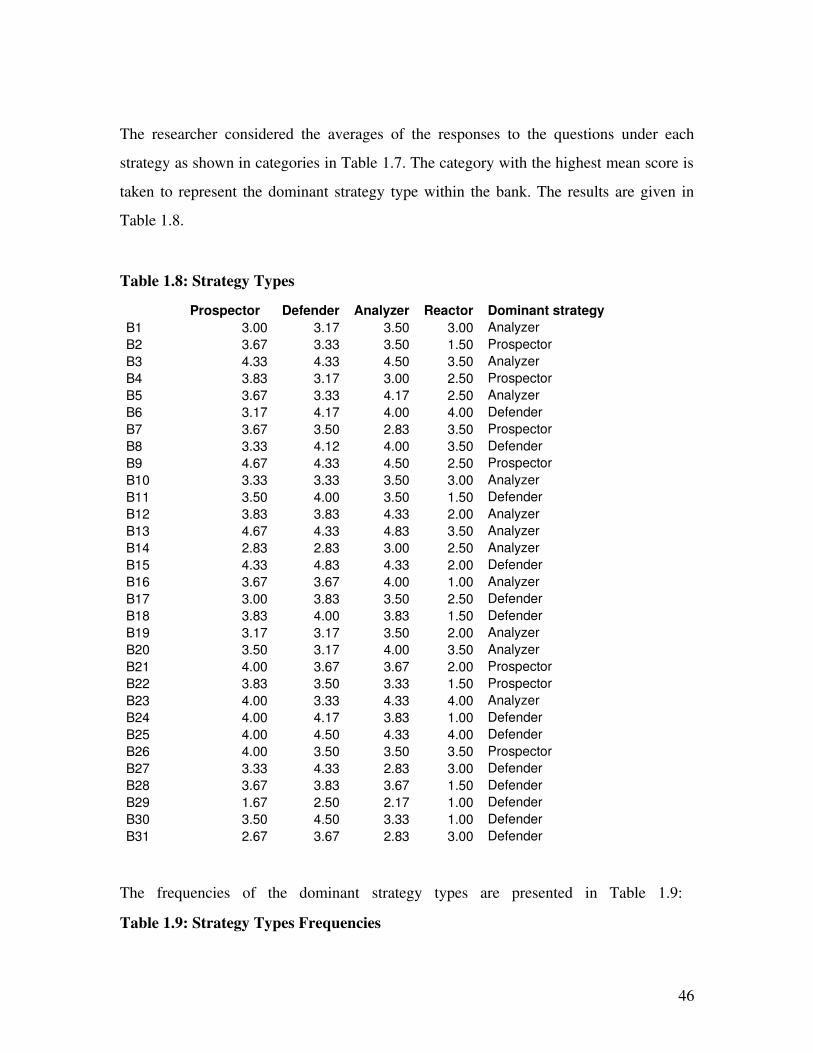
The researcher considered the averages of the responses to the questions under each
strategy as shown in categories in Table 1.7. The category with the highest mean score is
taken to represent the dominant strategy type within the bank. The results are given in
Table 1.8.
Table 1.8: Strategy Types
The frequencies of the dominant strategy types are presented in Table 1.9:
Table 1.9: Strategy Types Frequencies
Prospector Defender Analyzer Reactor Dominant strategyB1 3.00 3.17 3.50 3.00 AnalyzerB2 3.67 3.33 3.50 1.50 ProspectorB3 4.33 4.33 4.50 3.50 AnalyzerB4 3.83 3.17 3.00 2.50 ProspectorB5 3.67 3.33 4.17 2.50 AnalyzerB6 3.17 4.17 4.00 4.00 DefenderB7 3.67 3.50 2.83 3.50 ProspectorB8 3.33 4.12 4.00 3.50 DefenderB9 4.67 4.33 4.50 2.50 ProspectorB10 3.33 3.33 3.50 3.00 AnalyzerB11 3.50 4.00 3.50 1.50 DefenderB12 3.83 3.83 4.33 2.00 AnalyzerB13 4.67 4.33 4.83 3.50 AnalyzerB14 2.83 2.83 3.00 2.50 AnalyzerB15 4.33 4.83 4.33 2.00 DefenderB16 3.67 3.67 4.00 1.00 AnalyzerB17 3.00 3.83 3.50 2.50 DefenderB18 3.83 4.00 3.83 1.50 DefenderB19 3.17 3.17 3.50 2.00 AnalyzerB20 3.50 3.17 4.00 3.50 AnalyzerB21 4.00 3.67 3.67 2.00 ProspectorB22 3.83 3.50 3.33 1.50 ProspectorB23 4.00 3.33 4.33 4.00 AnalyzerB24 4.00 4.17 3.83 1.00 DefenderB25 4.00 4.50 4.33 4.00 DefenderB26 4.00 3.50 3.50 3.50 ProspectorB27 3.33 4.33 2.83 3.00 DefenderB28 3.67 3.83 3.67 1.50 DefenderB29 1.67 2.50 2.17 1.00 DefenderB30 3.50 4.50 3.33 1.00 DefenderB31 2.67 3.67 2.83 3.00 Defender
46
STRATEGY TYPE FREQUENCY PERCENTAGEDefender 13 41.90Analyzer 11 35.50Prospector 7 22.60Reactor None Total 31 100
From Table 1.9, it is evident that thirteen or 41.90 per cent of the respondent banks
practice defender strategy, eleven or 35.50 per cent Analyzer, seven or 22.60 percent
prospector and none practices reactor strategy.
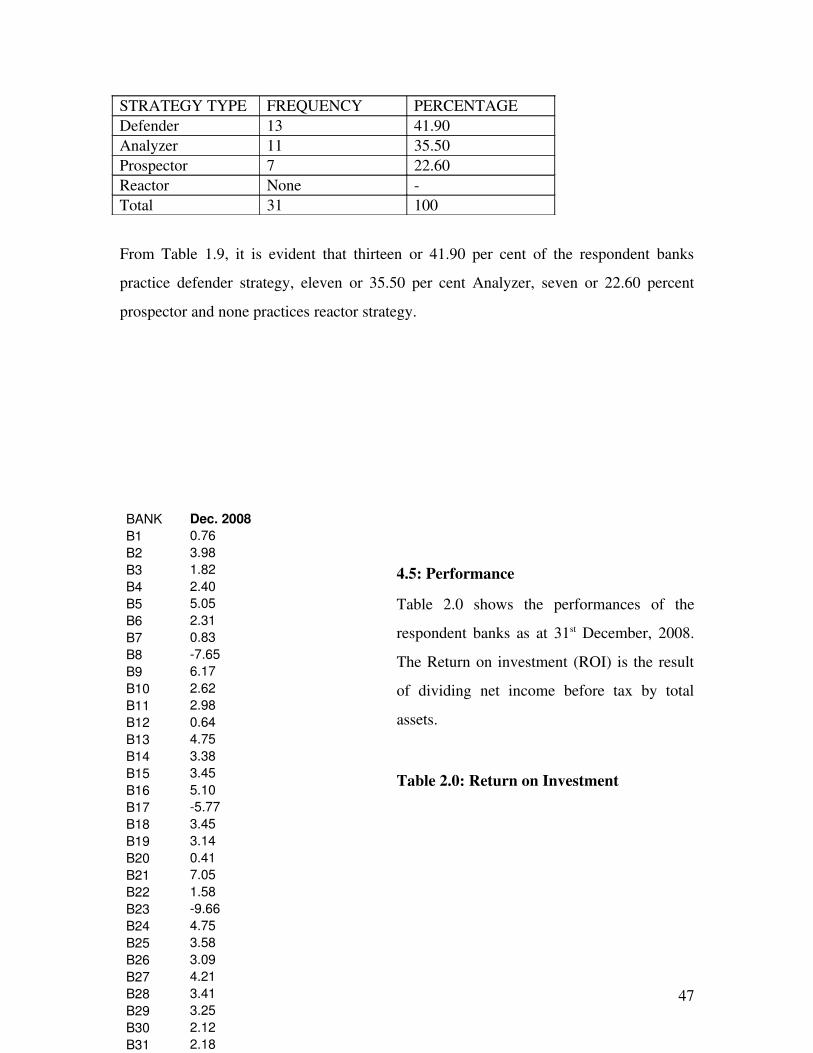
4.5: Performance
Table 2.0 shows the performances of the
respondent banks as at 31st December, 2008.
The Return on investment (ROI) is the result
of dividing net income before tax by total
assets.
Table 2.0: Return on Investment
BANK Dec. 2008B1 0.76B2 3.98B3 1.82B4 2.40B5 5.05B6 2.31B7 0.83B8 7.65B9 6.17B10 2.62B11 2.98B12 0.64B13 4.75B14 3.38B15 3.45B16 5.10B17 5.77B18 3.45B19 3.14B20 0.41B21 7.05B22 1.58B23 9.66B24 4.75B25 3.58B26 3.09B27 4.21B28 3.41B29 3.25B30 2.12B31 2.18
47
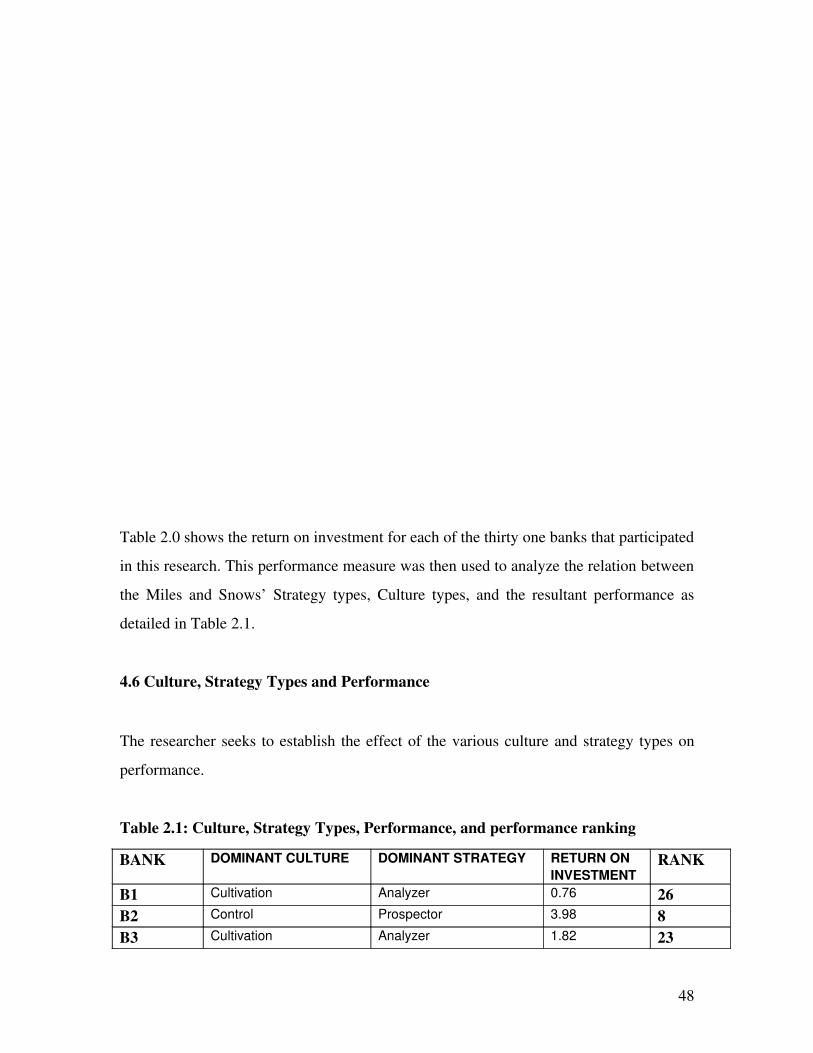
Table 2.0 shows the return on investment for each of the thirty one banks that participated
in this research. This performance measure was then used to analyze the relation between
the Miles and Snows’ Strategy types, Culture types, and the resultant performance as
detailed in Table 2.1.
4.6 Culture, Strategy Types and Performance
The researcher seeks to establish the effect of the various culture and strategy types on
performance.
Table 2.1: Culture, Strategy Types, Performance, and performance ranking
BANK DOMINANT CULTURE DOMINANT STRATEGY RETURN ON INVESTMENT
RANK
B1 Cultivation Analyzer 0.76 26B2 Control Prospector 3.98 8B3 Cultivation Analyzer 1.82 23
48
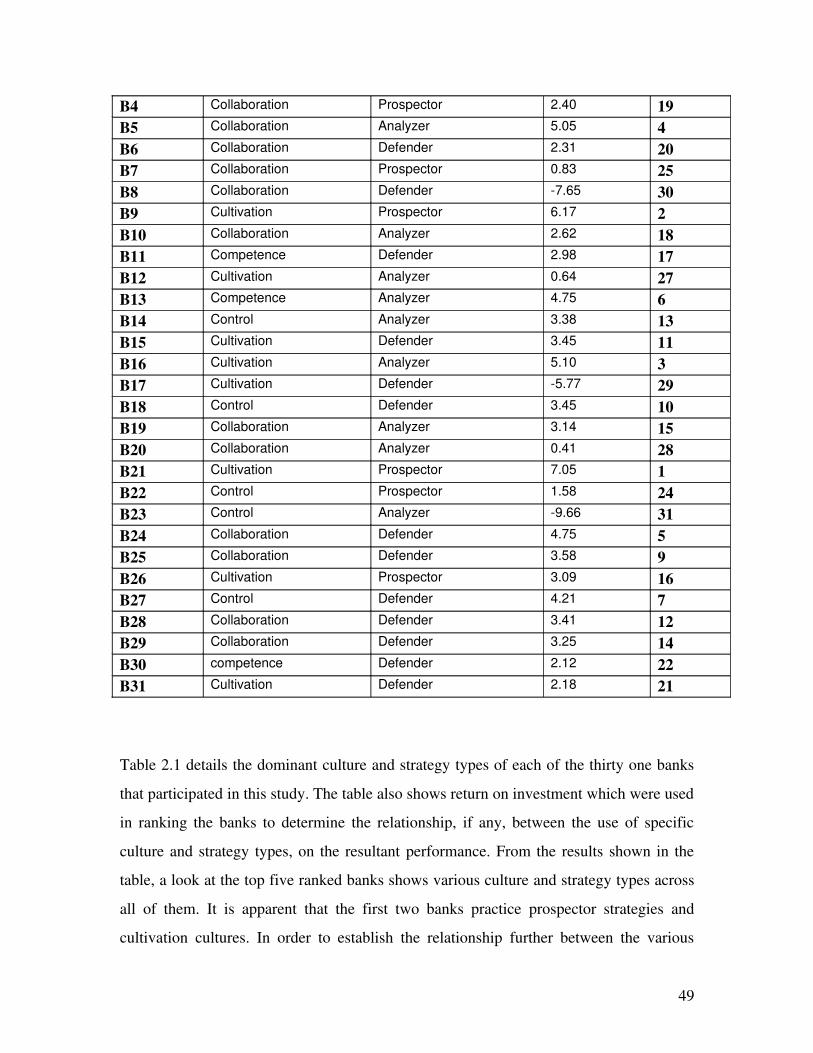
B4 Collaboration Prospector 2.40 19B5 Collaboration Analyzer 5.05 4B6 Collaboration Defender 2.31 20B7 Collaboration Prospector 0.83 25B8 Collaboration Defender 7.65 30B9 Cultivation Prospector 6.17 2B10 Collaboration Analyzer 2.62 18B11 Competence Defender 2.98 17B12 Cultivation Analyzer 0.64 27B13 Competence Analyzer 4.75 6B14 Control Analyzer 3.38 13B15 Cultivation Defender 3.45 11B16 Cultivation Analyzer 5.10 3B17 Cultivation Defender 5.77 29B18 Control Defender 3.45 10B19 Collaboration Analyzer 3.14 15B20 Collaboration Analyzer 0.41 28B21 Cultivation Prospector 7.05 1B22 Control Prospector 1.58 24B23 Control Analyzer 9.66 31B24 Collaboration Defender 4.75 5B25 Collaboration Defender 3.58 9B26 Cultivation Prospector 3.09 16B27 Control Defender 4.21 7B28 Collaboration Defender 3.41 12B29 Collaboration Defender 3.25 14B30 competence Defender 2.12 22B31 Cultivation Defender 2.18 21
Table 2.1 details the dominant culture and strategy types of each of the thirty one banks
that participated in this study. The table also shows return on investment which were used
in ranking the banks to determine the relationship, if any, between the use of specific
culture and strategy types, on the resultant performance. From the results shown in the
table, a look at the top five ranked banks shows various culture and strategy types across
all of them. It is apparent that the first two banks practice prospector strategies and
cultivation cultures. In order to establish the relationship further between the various
49
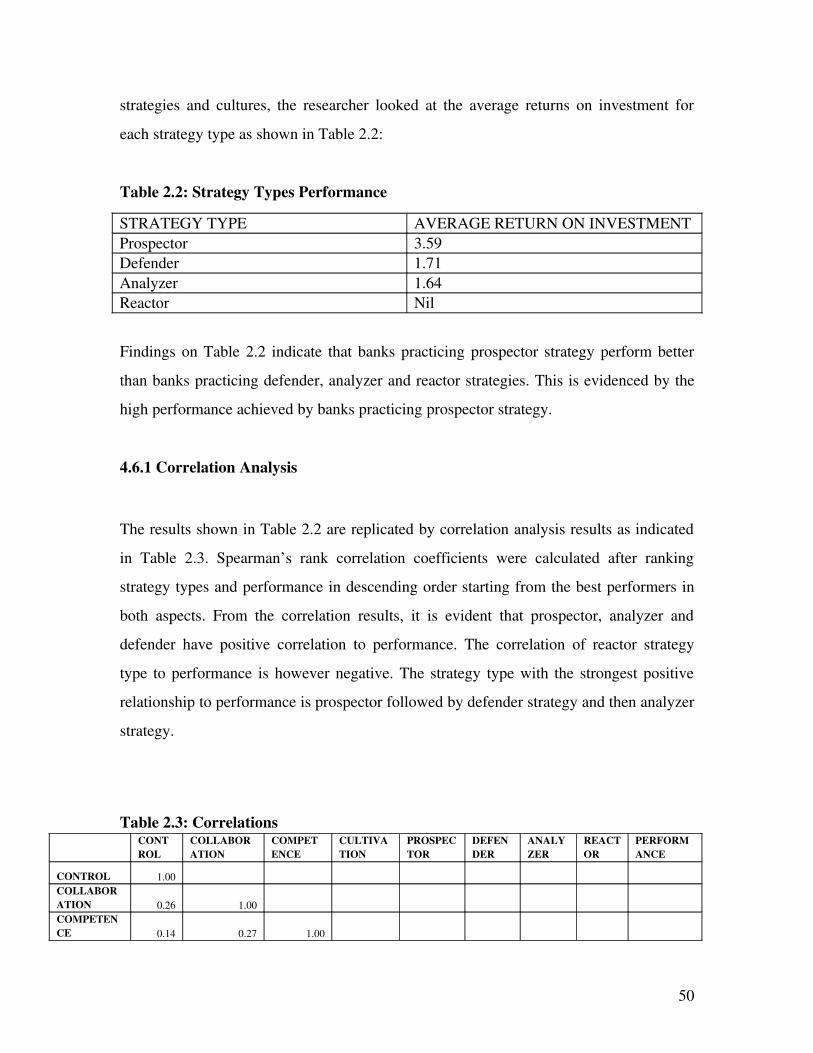
strategies and cultures, the researcher looked at the average returns on investment for
each strategy type as shown in Table 2.2:
Table 2.2: Strategy Types Performance
STRATEGY TYPE AVERAGE RETURN ON INVESTMENTProspector 3.59Defender 1.71Analyzer 1.64Reactor Nil
Findings on Table 2.2 indicate that banks practicing prospector strategy perform better
than banks practicing defender, analyzer and reactor strategies. This is evidenced by the
high performance achieved by banks practicing prospector strategy.
4.6.1 Correlation Analysis
The results shown in Table 2.2 are replicated by correlation analysis results as indicated
in Table 2.3. Spearman’s rank correlation coefficients were calculated after ranking
strategy types and performance in descending order starting from the best performers in
both aspects. From the correlation results, it is evident that prospector, analyzer and
defender have positive correlation to performance. The correlation of reactor strategy
type to performance is however negative. The strategy type with the strongest positive
relationship to performance is prospector followed by defender strategy and then analyzer
strategy.
Table 2.3: Correlations CONTROL
COLLABORATION
COMPETENCE
CULTIVATION
PROSPECTOR
DEFENDER
ANALYZER
REACTOR
PERFORMANCE
CONTROL 1.00COLLABORATION 0.26 1.00COMPETENCE 0.14 0.27 1.00
50
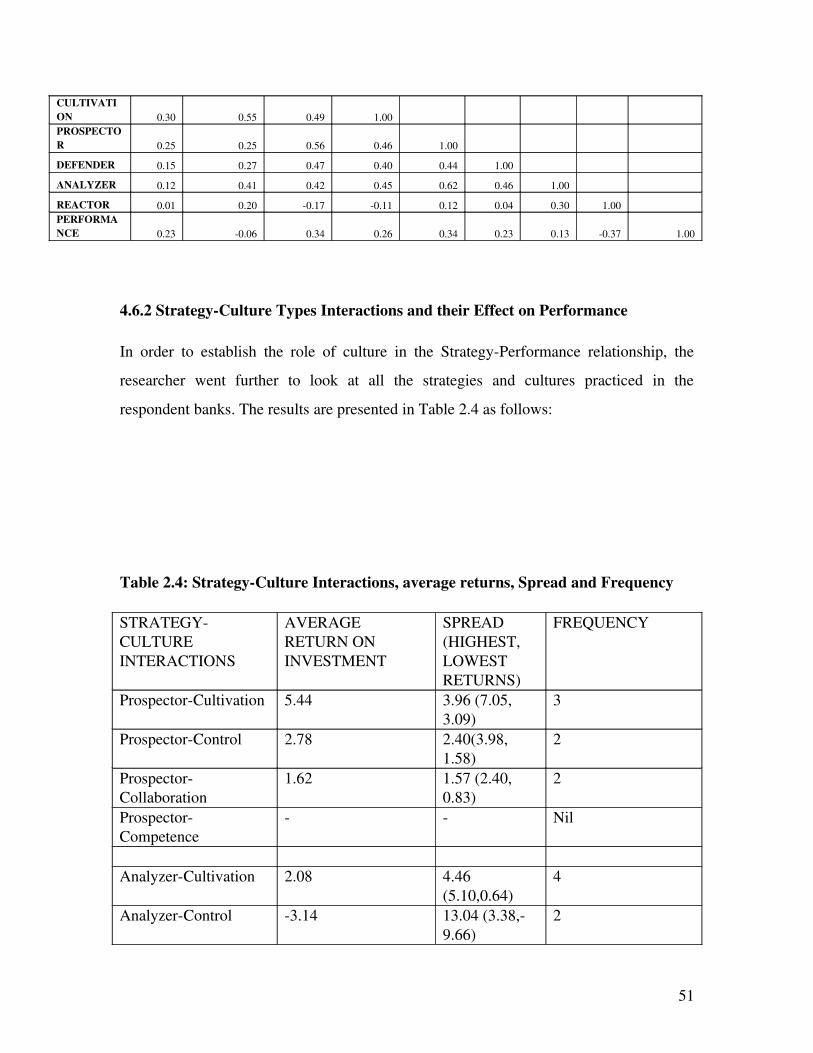
CULTIVATION 0.30 0.55 0.49 1.00PROSPECTOR 0.25 0.25 0.56 0.46 1.00
DEFENDER 0.15 0.27 0.47 0.40 0.44 1.00
ANALYZER 0.12 0.41 0.42 0.45 0.62 0.46 1.00
REACTOR 0.01 0.20 0.17 0.11 0.12 0.04 0.30 1.00PERFORMANCE 0.23 0.06 0.34 0.26 0.34 0.23 0.13 0.37 1.00
4.6.2 StrategyCulture Types Interactions and their Effect on Performance
In order to establish the role of culture in the StrategyPerformance relationship, the
researcher went further to look at all the strategies and cultures practiced in the
respondent banks. The results are presented in Table 2.4 as follows:
Table 2.4: StrategyCulture Interactions, average returns, Spread and Frequency
STRATEGYCULTURE INTERACTIONS
AVERAGE RETURN ON INVESTMENT
SPREAD (HIGHEST, LOWEST RETURNS)
FREQUENCY
ProspectorCultivation 5.44 3.96 (7.05, 3.09)
3
ProspectorControl 2.78 2.40(3.98, 1.58)
2
ProspectorCollaboration
1.62 1.57 (2.40, 0.83)
2
ProspectorCompetence
Nil
AnalyzerCultivation 2.08 4.46 (5.10,0.64)
4
AnalyzerControl 3.14 13.04 (3.38,9.66)
2
51
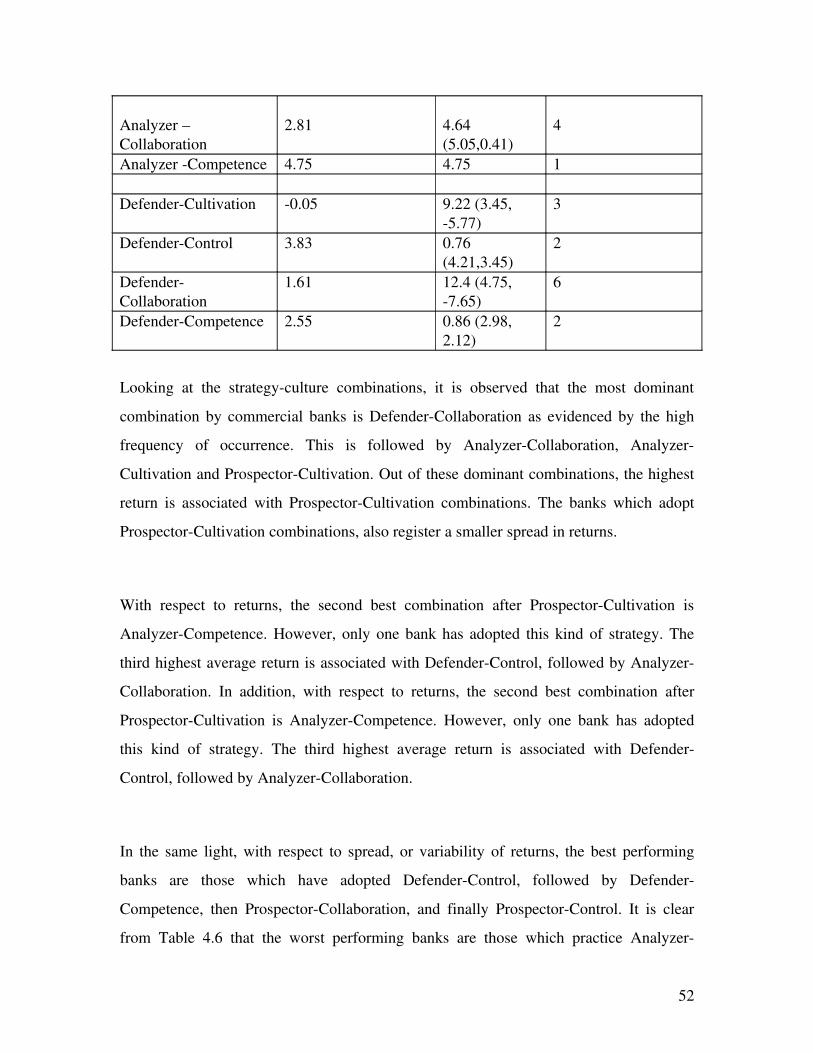
Analyzer –Collaboration
2.81 4.64 (5.05,0.41)
4
Analyzer Competence 4.75 4.75 1
DefenderCultivation 0.05 9.22 (3.45, 5.77)
3
DefenderControl 3.83 0.76 (4.21,3.45)
2
DefenderCollaboration
1.61 12.4 (4.75, 7.65)
6
DefenderCompetence 2.55 0.86 (2.98, 2.12)
2
Looking at the strategyculture combinations, it is observed that the most dominant
combination by commercial banks is DefenderCollaboration as evidenced by the high
frequency of occurrence. This is followed by AnalyzerCollaboration, Analyzer
Cultivation and ProspectorCultivation. Out of these dominant combinations, the highest
return is associated with ProspectorCultivation combinations. The banks which adopt
ProspectorCultivation combinations, also register a smaller spread in returns.
With respect to returns, the second best combination after ProspectorCultivation is
AnalyzerCompetence. However, only one bank has adopted this kind of strategy. The
third highest average return is associated with DefenderControl, followed by Analyzer
Collaboration. In addition, with respect to returns, the second best combination after
ProspectorCultivation is AnalyzerCompetence. However, only one bank has adopted
this kind of strategy. The third highest average return is associated with Defender
Control, followed by AnalyzerCollaboration.
In the same light, with respect to spread, or variability of returns, the best performing
banks are those which have adopted DefenderControl, followed by Defender
Competence, then ProspectorCollaboration, and finally ProspectorControl. It is clear
from Table 4.6 that the worst performing banks are those which practice Analyzer
52
Control, DefenderCollaboration, ProspectorCollaboration and DefenderCultivation.
Banks which practice these combinations also happen to have the highest spread in
returns except for ProspectorCollaboration.
CHAPTER FIVE
CONCLUSIONS AND RECOMMENDATIONS
5.1 Introduction
This chapter sets out first to revisit the objectives of the researcher as they were set in the
research proposal and whether they have been achieved. Second, it highlights the
drawbacks that were encountered in the research process. Finally, the researcher makes
recommendations for further research.
53
5.2 Conclusions
As was explained in chapter four, it was observed that 41.90 per cent of the 31 banks that
responded to the research survey practice defender strategy. 35.50 and 22.60 per cent
practice Analyzer and prospector strategies in that order. None practices reactor strategy.
On the other hand, 38.70 per cent practice collaboration culture. 32.26, 19.35 and 9.68
per cent practice cultivation, control and competence cultures respectively. Since 68.9 per
cent response rate was realized, this can be taken as a representative sample. Therefore,
we can comfortably address the role of organizational culture in the relationship between
strategy and bank performance from the research findings.
An analysis based on correlation analysis of the relationship between culture and
performance reveals that collaboration culture is negatively correlated to performance.
Moreover, the researcher established that control, cultivation and competence cultures are
positively correlated to performance. Hence the first objective of the research was
attained.
The second objective of the research was to establish the relationship between strategy
and performance. The researcher established that a reactor strategy is negatively
correlated to performance in Kenya’s commercial banks. In the same note, the analyzer,
defender and prospector strategies are positively correlated to performance.
The third objective of the research was to establish the effect of culture on the
relationship between strategy and performance. The researcher determined this using
tabular analysis. It led the researcher to conclude that banks which perform well are those
practicing prospector strategies and cultivation culture. In the same light, banks stand to
lose if they practice Analyzer strategy with control culture.
Even though the researcher cannot rule out other factors determining performance such as
marketing campaigns, the confidence the public have for the bank, differentiated products
54
offered et cetera, it can be concluded from the foregoing that strategy and culture play a
significant role in influencing the performance of banks in Kenya.
5.3 Limitations and Recommendations
The researcher conducted a survey of all the commercial banks operating in Kenya. He
used drop and pick method, and return by post of the questionnaires. However, it was
difficult to ensure that only the targeted respondents fill the questionnaires. In addition,
the targeted respondents were busy employees who did not have time for filling
questionnaires leading to a response rate of 68.90 per cent. A further census study aimed
at facetoface interview of the respondents would perhaps increase the response rate and
results of these findings.
Research on specific banks would perhaps be important to study indepth the culture and
strategies and any relationship with performance. This is because the researcher was not
able to interview all departmental heads to gain a much broader view of aspects of culture
as well as their valued strategies which they may not want to divulge or were not
captured by the questionnaire. Case studies in specific cultures and strategies adopted by
banks are recommended for further research.
A research using performance for a different period or over a longer time period would
be encouraged to confirm any changes in culture and strategy choices and their resultant
effect on the performance of the banks. This is because strategy is sensitive to time.
55
REFERENCES
Andrews, R.K. (1971), The Concept of Corporate Strategy. Homewood: Dow Jones
Irwin.
56
Allen, R.S. and Helms, M.M. (2006) Linking Strategic Practices and Organizational
Performance to Porter’s Generic strategies. Business Process Management Journal, 12(4),
433454.
Aosa, E. (1992) An Empirical Investigation of Aspects of strategy formulation and
implementation with large, private manufacturing companies in Kenya. Unpublished
PhD thesis, University of Strathcylde, Scotland.
Daily, C.M.; Certo, S.T; & Dalton, D.R. (2002) Executive Stock Option Repricing:
Retention and Performance Reconsidered, California Management Review, 44(4), 8
24.
Denison, D.R. (1990): Corporate Culture and Organizational Effectiveness. New
York, John Wiley & Sons.
Dess G.G., & Robinson, R.B (1984): Measuring Organizational Performance in the
absence of Objective Measures, Strategic Management Journal, Vol. No.5, 265273.
Frese, M; Krauss, S.I; Grabarkiewicz, R; Escher, S; Heers, C., Luneng, S.T., & Friedrich,
C. (2003). Towards a psychology of Firm Owners` Action processes and their
Relationships with Business success in Three African Countries. Technical Report.
Goldsmith, W. and Clutterbuck, D. (1984) in Allen, R.S. and Helms, M.M. (2006)
Linking Strategic Practices and Organizational Performance to Porter’s Generic
strategies. Business Process Management Journal, 12 (4), 433454.
Grant, R.M. (1998): Contemporary Strategy Analysis, 3rd Edition, Blackwell publishers
limited, UK.
57
Gregory A.B. (2003): Online Publication Strategic Planning and Financial
Performance in the Food Processing Sector, online publication.
Hofstede, G.H. (1992): Cultures and Organizations, Institute for Research on
Intercultural Cooperation, Mc Graw Hill Book International (UK) limited, England
Hunger, J.D. and Wheelen, T.L. (1995) Strategic Management, 5th Edition, Addison
Wesley publishing, NY, USA.
International Labour Organization (2005): Online publication
Johnson and Scholes K. (2002): Exploring Corporate Strategy, 6th Edition, Prentice
Hall, New Delhi.
Johnson, G.; Mehlin, L.; & Whittington, R. (2005): Micro Strategy and Strategizing;
Implications for Strategy Process Research, Blackwell Publishing.
Kaplan, R. and D. Norton (2005): The Office of Strategy Management, Harvard
Business Review
Kariuki, M. (2001): An Empirical Investigation into the aspects of Culture and their
influence on the Marketing Strategies in the Beverage Industry in Kenya,
Unpublished MBA Thesis, University of Nairobi, Kenya.
Kottler, J.P., and J.L. Heskett (1992): Corporate Culture and Performance. New York,
the Free Press.
Kraut, A.I. (1996): Organizational Surveys, Vol.6, Jossey Bass, San Francisco.
58
Lahey, P.R., (2001): Evaluating the Impact of Strategic Planning on Organization’s
Effectiveness and Culture, Institute for Court Management, Newfoundland, Canada.
Laitinen, E.K (2002): A Dynamic Performance Measurement System; Evidence from
Small Finnish Technology Companies, Scandinavian Journal of Management Vol.18,
6599.
Lusch, R.F. and Laczniak, G.R.(1987): The Evolving Marketing Concept,
Competitive intensity and Organizational Performance. Journal of the Academy of
Marketing Science, Vol.15, No.3,111 .
Mahinda, W. (2002): The Relationship between Organization’s Culture and Human
Resource practices in the Kenyan Manufacturing Industry, Unpublished MBA
Thesis, University of Nairobi, Kenya.
Mankins, M.C. and Steele, R (2005): Turning Great Strategy into Great Performance,
Harvard Business Review, JulyAugust, 83(7), 6473.
Manyuru, J.P. (2005): Corporate Governance and Organizational Performance; The
Companies Quoted at the NSE. Unpublished MBA project, School of Business,
University of Nairobi.
Marc, D.L., & Farbrother, S. (2003): Changing Organization Culture, One Face at a
Time. Public Management Journal, Vol.85.
Miles, et al (1978): Organization’s strategy, structure, and process, Mc GrawHill
Book company, New York
59
Miles, R.E. and Snow, C.C. (1994): Fit, Failure and the Hall of fame. The free press,
New York.
Miles, R.E., and Snow, C.C. (1978): Organization’s strategy, structure, and process,
New York, Mc GrawHill.
Miller, D., and Friesen P.H. (1978): Archetypes of strategy formulation, management
science 24: 921933
Mintzberg, H. (1973): Strategy making in three modes. California Management
Review 16, No.2: 4453.
Mintzberg, Henry (1994): The Rise and fall of Strategic Planning; Reconceiving Roles
for Planning, Plans, Planners. New York, Free Press.
Mutuku, K. (2005): The Relationship between Corporate Social Responsibility and
Financial perspective: A case of publicly quoted companies in Kenya. Unpublished
MBA Project, School of Business, University of Nairobi.
Pearce, J.A. & Robinson, R.B. (2003): Strategic Management; Formulation,
Implementation, and Control, 8th Edition, NY, McGrawHill.
Peters, T. and Waterman, R. (1982): In search of Excellence, Second Edition, Prentice
Hall, United Kingdom.
Porter, E.M. (1980): Competitive Strategy; Techniques for Analyzing industries and
Competitors, New York: The free press.
60
Quinn, J.B (1980): Strategies for Change; Logical Incrementalism, Homewood, IL,
Irwin
Ramaswamy, K., A.S. Thomas, and Litschert, R.J. (1994): Organization’s Performance
in a Regulated Environment. Strategic Management Journal 15, No.1: 6374.
Reger RK, Duhaime IM, Stimpert JL (1992): Deregulation, Strategic Choice, Risk and
Financial Performance. Strategic Management Journal, Vol.15, 6374.
Roger Harrison, P.D., & Stokes, H. (1992): Diagnosing Organizational Culture. Josey
Bass, San Francisco.
Saunders J. & Wong C. (1985): In Search of Excellence in the UK. Journal of
Marketing Management, Vol.1, No.2, 119137.
Schein, E. (1992): Organizational Culture and Leadership, 2nd Edition, JosseyBass.
Schneider, B; Gunnarson, S.K and NilesJolly, K (1994): Creating the Climate and
Culture of Success, Organizational dynamics, 23(1), 1729.
Shortell, S.M., and E.J. Jazac, (1990): Perceptual and Archival Measures of Miles and
Snow’s Strategic Types: A Comprehensive Assessment of Reliability and Validity.
Academy of Management Journal 33, No.4: 817832, 1990.
Snow, and L.G. Hrebiniak, (1980): Strategy, Distinctive Competence, and
Organization’s Performance. Administrative Science Quarterly 25: 317335.
61
Stanley M., Amaral L., Buldyrer S., Havlin S., Leschorn H., Maas P., Salinger M. and E.
Stanley(1996): Scaling Behavior in the Growth of Companies, Nature Publishing
Group
Steiner, G. (1979): Strategic planning, free press.
Stollsteimert (2000): Improving your Bottomline, online publication.
Tan, J.J. & Litschert, R.J. (1994): Environment Strategy Relationship and its
Performance Implications: An empirical study of the Chinese Electronics. Strategic
Management Journal, Vol.15, 120.
Thompson, A.A. et al (2007) Crafting and Executing Strategy, The Quest for
Competitive Advantage: Concepts and Cases, 15th Edition, New York, McGrawHill
Thompson, A.A. and Strickland, A.J. (1998) Crafting and Implementing Strategy:
Texts and Readings. 10th Edition, Irwin Mc Graw Hill.
Thompson, J.L. (1997): Strategic Management awareness and change, 3rd Edition,
Prentice Hall, United Kingdom.
Thompson Jr. A.A. and Strickland III, A.J. (1996): Strategic Management Concepts
and Cases, 9th Edition, Richard Dr. Irwin, USA.
Venkatraman, N. (1989): The Concept of Fit in Strategy; Toward Verbal and
Statistical Correspondence, Academy of Management Review, Vol.14, 423444.
Webster FE (1994): Market Driven Management, New York, John Wiley and Sons.
62
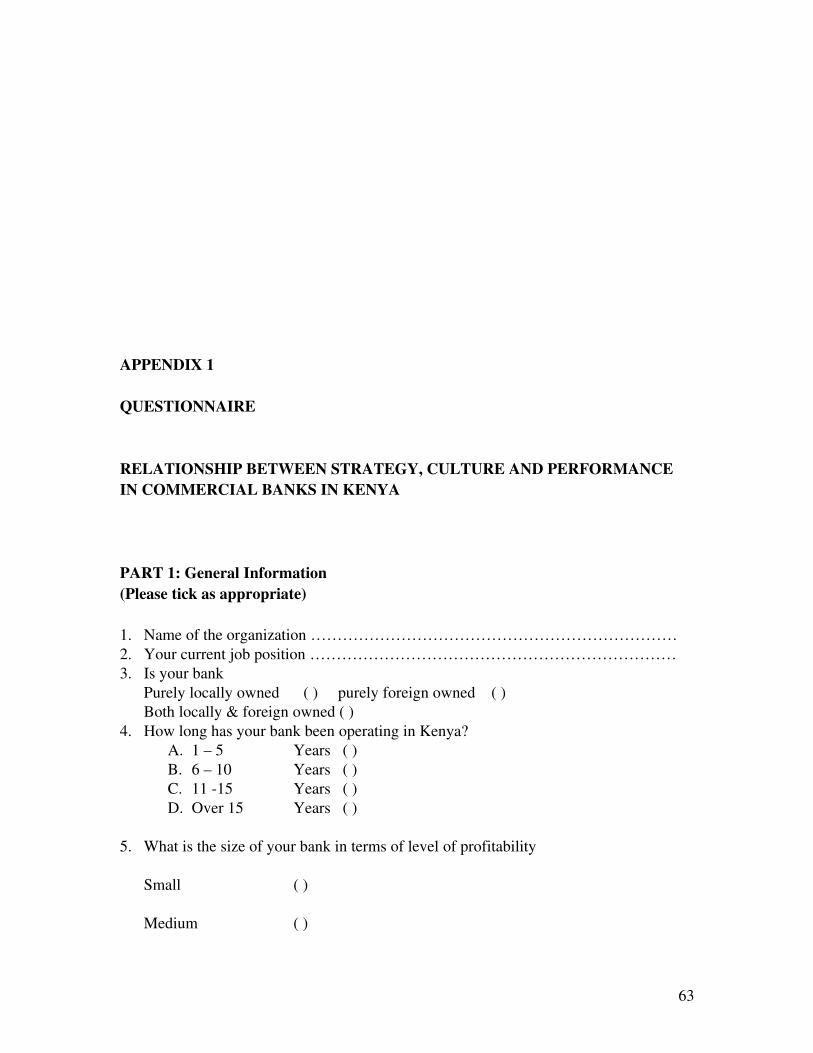
APPENDIX 1
QUESTIONNAIRE
RELATIONSHIP BETWEEN STRATEGY, CULTURE AND PERFORMANCE IN COMMERCIAL BANKS IN KENYA
PART 1: General Information(Please tick as appropriate)
1. Name of the organization ……………………………………………………………2. Your current job position ……………………………………………………………3. Is your bank
Purely locally owned ( ) purely foreign owned ( )Both locally & foreign owned ( )
4. How long has your bank been operating in Kenya?A. 1 – 5 Years ( )B. 6 – 10 Years ( )C. 11 15 Years ( )D. Over 15 Years ( )
5. What is the size of your bank in terms of level of profitability
Small ( ) Medium ( )
63
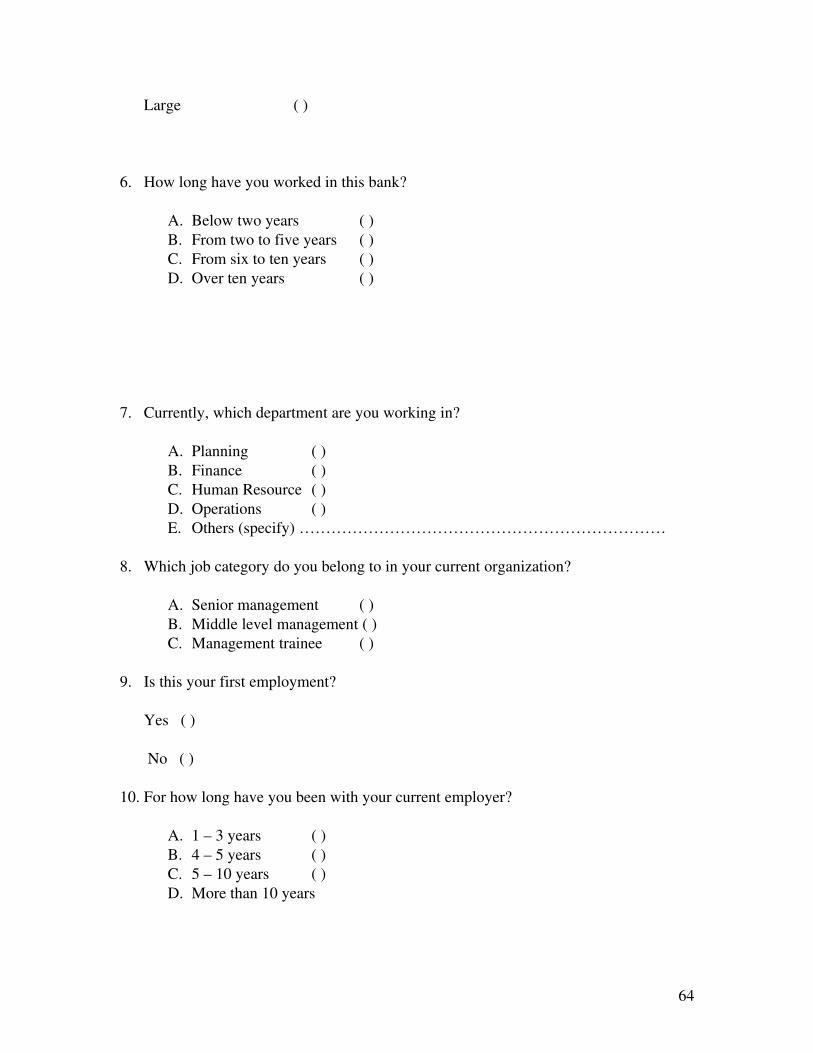
Large ( )
6. How long have you worked in this bank?
A. Below two years ( )B. From two to five years ( )C. From six to ten years ( )D. Over ten years ( )
7. Currently, which department are you working in?
A. Planning ( )B. Finance ( )C. Human Resource ( )D. Operations ( )E. Others (specify) ……………………………………………………………
8. Which job category do you belong to in your current organization?
A. Senior management ( )B. Middle level management ( )C. Management trainee ( )
9. Is this your first employment?
Yes ( )
No ( )
10. For how long have you been with your current employer?
A. 1 – 3 years ( )B. 4 – 5 years ( )C. 5 – 10 years ( )D. More than 10 years
64
PART 2: ORGANIZATIONAL CULTURE
Please rate the extent to which each of the following statements best describes your organization. The scale ranges from 1 to 5. One (1) stands for ‘’not at all’’ and five (5) ‘’ stands for ‘’ to a very great extent’’
a) Top management fundamentally ensures that certainty, predictability, safety, accuracy and dependability of this bank are attained
1. Not at all 2. To a less extent
3. To a moderate extent
4.To a great extent
5. To a very great extent
b) Everybody in this bank is cost conscious
1. Not at all 2. To a less extent
3. To a moderate extent
4.To a great extent
5. To a very great extent
65
c) Meeting times are kept punctually in this bank
1. Not at all 2. To a less extent
3. To a moderate extent
4.To a great extent
5. To a very great extent
d) Employees are told when good job is done and rewarded accordingly
1. Not at all 2. To a less extent
3. To a moderate extent
4.To a great extent
5. To a very great extent
e) I can do almost anything I want without consulting my boss
1. Not at all 2. To a less extent
3. To a moderate extent
4.To a great extent
5. To a very great extent
f) Even small matters have to be referred to someone higher up for a final answer
1. Not at all 2. To a less extent
3. To a moderate extent
4.To a great extent
5. To a very great extent
g) This bank is a good place for a person who likes to make his own decisions
1. Not at all 2. To a less extent
3. To a moderate extent
4.To a great extent
5. To a very great extent
66
h) The needs of this bank come first
1. Not at all 2. To a less extent
3. To a moderate extent
4.To a great extent
5. To a very great extent
i) This bank is extremely dedicated to the customer
1. Not at all 2. To a less extent
3. To a moderate extent
4.To a great extent
5. To a very great extent
j) Managers struggle to keep good employees in their departments
1. Not at all 2. To a less extent
3. To a moderate extent
4.To a great extent
5. To a very great extent
k) There is cooperation and trust between departments
1. Not at all 2. To a less extent
3. To a moderate extent
4.To a great extent
5. To a very great extent
l) Employees are secretive and tend to withhold information
67
1. Not at all 2. To a less extent
3. To a moderate extent
4.To a great extent
5. To a very great extent
m) This bank’s management makes every attempt to ensure unity, close connection with and intense dedication to the customer
1. Not at all 2. To a less extent
3. To a moderate extent
4.To a great extent
5. To a very great extent
n) Genuine mistakes are tolerated in this bank
1. Not at all 2. To a less extent
3. To a moderate extent
4.To a great extent
5. To a very great extent
o) Only very competent employees are retained in this bank
1. Not at all 2. To a less extent
3. To a moderate extent
4.To a great extent
5. To a very great extent
p) Job competence is the only criterion for hiring people in this bank
1. Not at all 2. To a less extent
3. To a moderate extent
4.To a great extent
5. To a very great extent
q) Results more important than relationships in this bank
68
1. Not at all 2. To a less extent
3. To a moderate extent
4.To a great extent
5. To a very great extent
r) The culture of this bank is all about excellence, uniqueness per se and of oneofakind products or services
1. Not at all 2. To a less extent
3. To a moderate extent
4.To a great extent
5. To a very great extent
s) The framework for information and knowledge at this bank is built essentially around its goals and the extent to which those goals are met
1. Not at all 2. To a less extent
3. To a moderate extent
4.To a great extent
5. To a very great extent
t) This bank’s culture mainly centers on its values and ideals and the extent to which they are adhered to
1. Not at all 2. To a less extent
3. To a moderate extent
4.To a great extent
5. To a very great extent
u) There is concern for personal problems of employees in this bank
1. Not at all 2. To a less extent
3. To a moderate extent
4.To a great extent
5. To a very great extent
v) People’s private life is their own business in this bank
69
1. Not at all 2. To a less extent
3. To a moderate extent
4.To a great extent
5. To a very great extent
w) This bank is socially responsible
1. Not at all 2. To a less extent
3. To a moderate extent
4.To a great extent
5. To a very great extent
x) A lot of emphasis is placed on meeting customer needs in this bank
1. Not at all 2. To a less extent
3. To a moderate extent
4.To a great extent
5. To a very great extent
y) This bank stays close to the customer
1. Not at all 2. To a less extent
3. To a moderate extent
4.To a great extent
5. To a very great extent
70
PART 3: STRATEGY
I. We actively develop new products
1. Not at all 2. To a less extent
3. To a moderate extent
4.To a great extent
5. To a very great extent
71
II. This bank constantly seeks new market opportunities
1. Not at all 2. To a less extent
3. To a moderate extent
4.To a great extent
5. To a very great extent
III. Short term performance is emphasized
1. Not at all 2. To a less extent
3. To a moderate extent
4.To a great extent
5. To a very great extent
IV. Future concerns are emphasized so much
1. Not at all 2. To a less extent
3. To a moderate extent
4.To a great extent
5. To a very great extent
V. In our bank, key executives usually come from outside the organization
1. Not at all 2. To a less extent
3. To a moderate extent
4.To a great extent
5. To a very great extent
VI. We make an effort to put into practice new technological practices
1. Not at all 2. To a less extent
3. To a moderate extent
4.To a great extent
5. To a very great extent
72
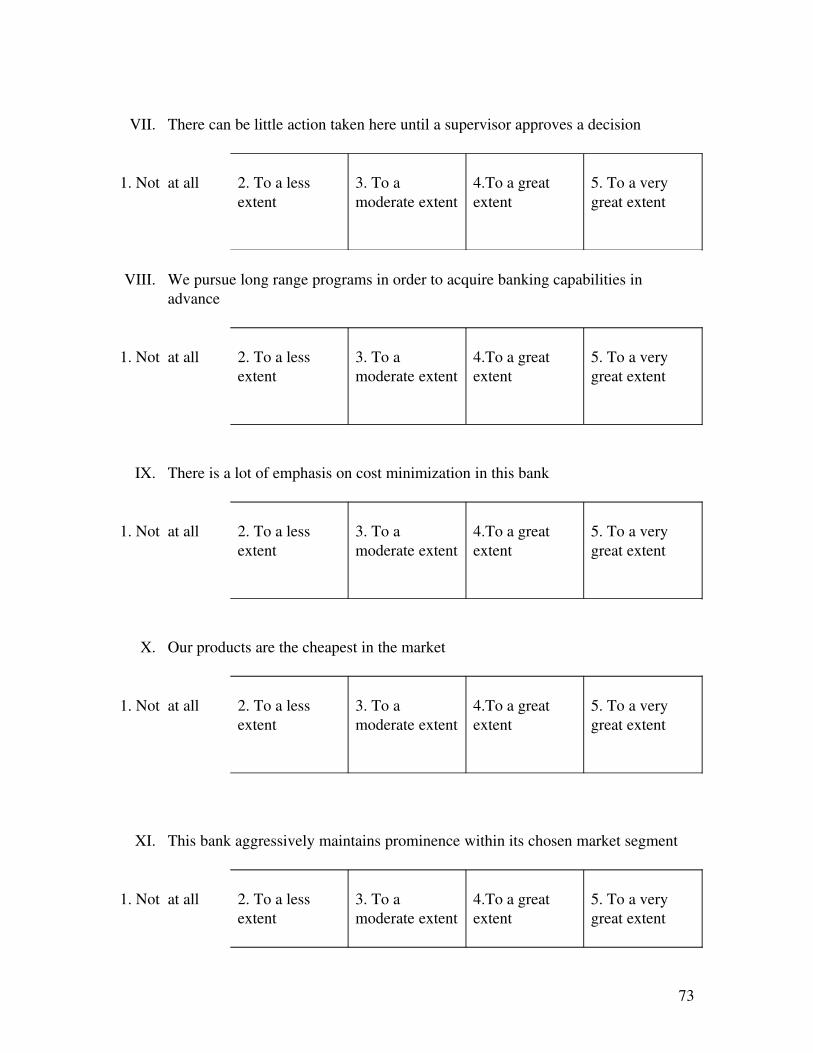
VII. There can be little action taken here until a supervisor approves a decision
1. Not at all 2. To a less extent
3. To a moderate extent
4.To a great extent
5. To a very great extent
VIII. We pursue long range programs in order to acquire banking capabilities in advance
1. Not at all 2. To a less extent
3. To a moderate extent
4.To a great extent
5. To a very great extent
IX. There is a lot of emphasis on cost minimization in this bank
1. Not at all 2. To a less extent
3. To a moderate extent
4.To a great extent
5. To a very great extent
X. Our products are the cheapest in the market
1. Not at all 2. To a less extent
3. To a moderate extent
4.To a great extent
5. To a very great extent
XI. This bank aggressively maintains prominence within its chosen market segment
1. Not at all 2. To a less extent
3. To a moderate extent
4.To a great extent
5. To a very great extent
73
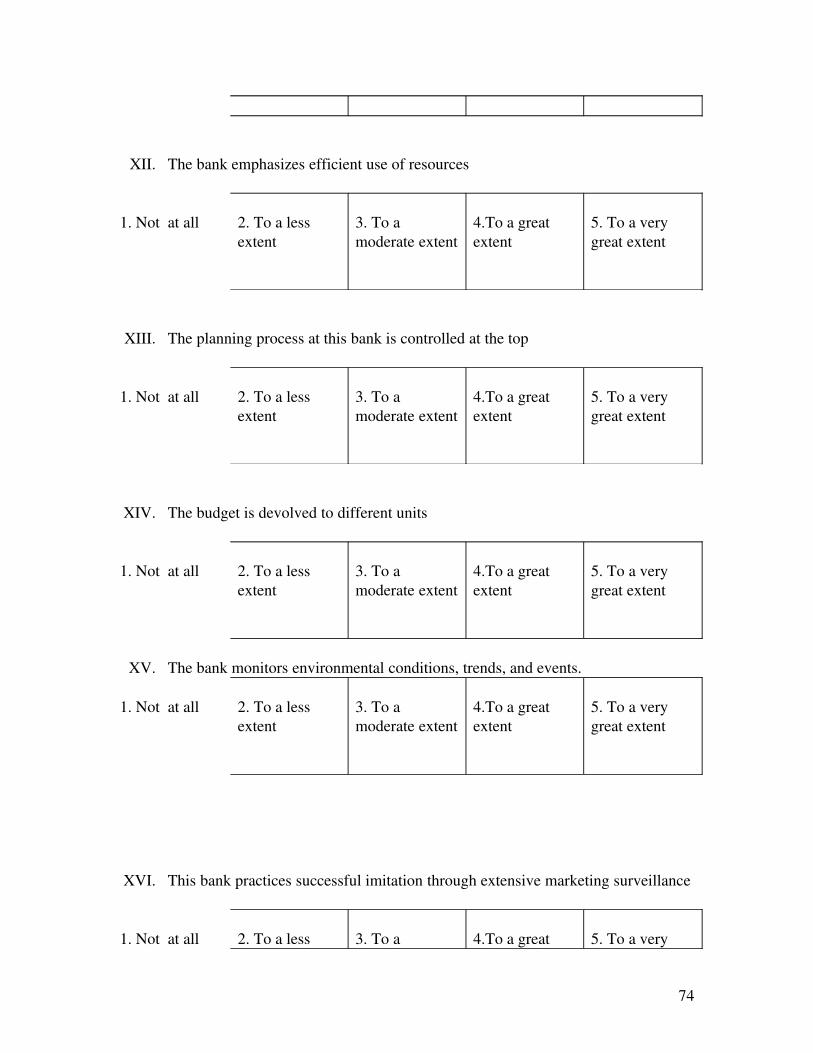
XII. The bank emphasizes efficient use of resources
1. Not at all 2. To a less extent
3. To a moderate extent
4.To a great extent
5. To a very great extent
XIII. The planning process at this bank is controlled at the top
1. Not at all 2. To a less extent
3. To a moderate extent
4.To a great extent
5. To a very great extent
XIV. The budget is devolved to different units
1. Not at all 2. To a less extent
3. To a moderate extent
4.To a great extent
5. To a very great extent
XV. The bank monitors environmental conditions, trends, and events.
1. Not at all 2. To a less extent
3. To a moderate extent
4.To a great extent
5. To a very great extent
XVI. This bank practices successful imitation through extensive marketing surveillance
1. Not at all 2. To a less 3. To a 4.To a great 5. To a very
74
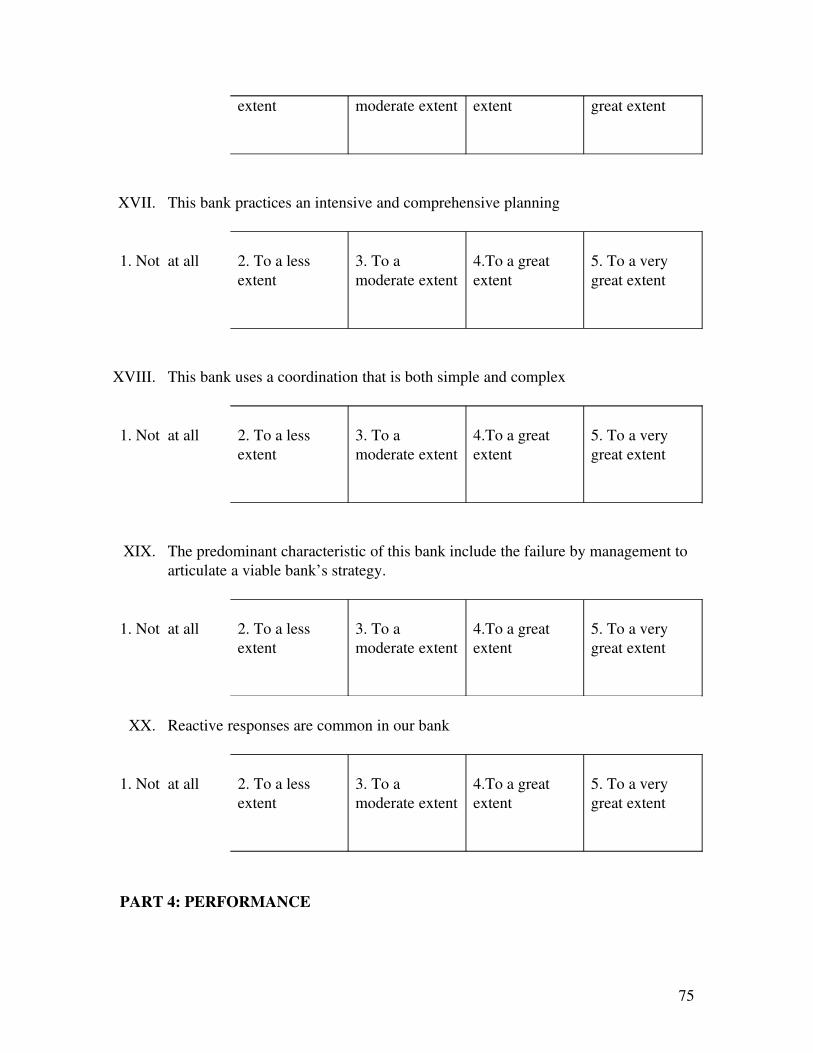
extent moderate extent extent great extent
XVII. This bank practices an intensive and comprehensive planning
1. Not at all 2. To a less extent
3. To a moderate extent
4.To a great extent
5. To a very great extent
XVIII. This bank uses a coordination that is both simple and complex
1. Not at all 2. To a less extent
3. To a moderate extent
4.To a great extent
5. To a very great extent
XIX. The predominant characteristic of this bank include the failure by management to articulate a viable bank’s strategy.
1. Not at all 2. To a less extent
3. To a moderate extent
4.To a great extent
5. To a very great extent
XX. Reactive responses are common in our bank
1. Not at all 2. To a less extent
3. To a moderate extent
4.To a great extent
5. To a very great extent
PART 4: PERFORMANCE
75
Kindly indicate the average performance of your bank in terms of annual revenues, total
costs incurred and the value of assets invested.
Average Annual Revenues (In Millions)
Below 500 (Please specify)
501 1,000
1,0011,500
1,5012,000
2,0012,500
2,5013000
Above 3001 (Please specify)
Average Annual Total Costs (In Millions)
Below 100(Please specify)
101500
5011000
10011500
15012000
20012500
Above 2,501(Please specify)
Total Assets (In Millions)
Below 500(Please specify)
5011000
10011500
15012000
20012500
2,5013000
Above 3,001(Please specify)
76
APPENDIX 2
LIST OF RESPONDENT BANKS
• Bank of Africa
• Cooperative bank
• Consolidated bank
• Chase bank
• Bank of India
• Prime bank
• Fina bank
• Gulf African bank
• Equity bank
• Development bank
• Oriental bank
• Eco bank
• Barclays bank
• Commercial bank of Africa
• Bank of Baroda
• Family bank
• KRep bank
• NIC bank
• Diamond trust bank
• Dubai bank
• Citibank
• CFC bank
• First community bank
• Standard bank
• Transnational bank
77
• Kenya commercial bank
• National bank of Kenya
• ABC bank
• Habib bank
• Giro commercial bank
• Credit bank
78