Embed Size (px)
Citation preview
The Role of Personality Temperament and Student Learning in Principles of Economics:Further EvidenceAuthor(s): Andrea L. ZiegertSource: The Journal of Economic Education, Vol. 31, No. 4 (Autumn, 2000), pp. 307-322Published by: Heldref PublicationsStable URL: http://www.jstor.org/stable/1183145Accessed: 12/05/2009 11:55
Your use of the JSTOR archive indicates your acceptance of JSTOR's Terms and Conditions of Use, available athttp://www.jstor.org/page/info/about/policies/terms.jsp. JSTOR's Terms and Conditions of Use provides, in part, that unlessyou have obtained prior permission, you may not download an entire issue of a journal or multiple copies of articles, and youmay use content in the JSTOR archive only for your personal, non-commercial use.
Please contact the publisher regarding any further use of this work. Publisher contact information may be obtained athttp://www.jstor.org/action/showPublisher?publisherCode=held.
Each copy of any part of a JSTOR transmission must contain the same copyright notice that appears on the screen or printedpage of such transmission.
JSTOR is a not-for-profit organization founded in 1995 to build trusted digital archives for scholarship. We work with thescholarly community to preserve their work and the materials they rely upon, and to build a common research platform thatpromotes the discovery and use of these resources. For more information about JSTOR, please contact [email protected].
Heldref Publications is collaborating with JSTOR to digitize, preserve and extend access to The Journal ofEconomic Education.
http://www.jstor.org
Research in Economic Education In this section, the Journal of Economic Education publishes original theo- retical and empirical studies of economic education dealing with the analy- sis and evaluation of teaching methods, learning, attitudes and interests, materials, or processes.
PETER KENNEDY, Section Editor
The Role of Personality Temperament and Student Learning in Principles of
Economics: Further Evidence
Andrea L. Ziegert
Understanding economics is a process of gathering information, making sense of information, building conceptual models, and using these models to evaluate and analyze different situations and alternatives. Jungian psychological theory suggests that different personality temperaments prefer to receive and process information differently. My hypothesis is that personality type plays an impor- tant role in a student's understanding of economics, as measured by standard measures of student performance. More precisely, given the more analytical nature of economics, some personality types may succeed in economics more readily than do others. Furthermore, faculty personality type is also important in determining the way in which economic concepts are presented. Thus if students and faculty have the same personality type, they are more likely to receive and process information in a similar fashion, which may lead to increased perfor- mance in economics courses. Understanding the ways in which different person- ality temperaments gather and process information can lead to more effective pedagogies that will benefit all economics students.
Borg and Shapiro (1996) found that student personality type is an important determinant of student performance in economics. In this article, I improve and extend their work in two important ways. I replicate Borg and Shapiro's analysis with a larger sample of students and a larger, more diverse group of faculty. I also
Andrea L. Ziegert is an associate professor of economics at Denison University (e-mail: [email protected]). The author wishes to thank members of Miami University's Department of Economics for their participation in this project and Dennis H. Sullivan and anonymous referees for their helpful comments.
Fall 2000 307
investigate the role of personality type on both a student's knowledge of eco- nomics (stock) and on learning in an economics course (flow) using alternative measures of student performance in economics.
PERSONALITY TEMPERAMENTS AND LEARNING
Preference Scales
The role of personality type in learning was developed by C. G. Jung and made operational by Isabel Briggs Myers and Katherine Briggs in the well-known Myers-Briggs (personality) Type Indicator (MBTI) (Myers 1975). Although only Borg and Shapiro (1996) have applied this information to economics courses in particular, considerable research has used the MBTI to examine the role of per- sonality in learning in general. In addition, the MBTI is frequently studied and used in business settings to improve teamwork and worker productivity. Because many economists are unaware of this research, a brief discussion of personality types and learning in an economics classroom is in order.
Myers and Briggs classified all mental activity according to four dichotomous preference scales: Introversion (I)-Extraversion (E), Sensing (S)-Intuitive (N), Thinking (T)-Feeling (F), and Judging (J)-Perceiving (P). The preference scales identify and describe an individual's preferences for relating to the world (I-E), processing information (S-N), making decisions (T-F), and lifestyle and time orientation (J-P). Each scale is a continuum: An individual can exhibit dif- ferent degrees of these personality traits. In addition, the more a person rein- forces a particular preference, or that preference is reinforced by teachers and other influential individuals, the stronger those characteristics will be in the per- son's personality. Each individual can be described by his or her personality tem- perament or type, which is composed of one preference from each of the four preference scales.
Introversion (I)-Extraversion (E)
The most misunderstood of the preference scales, introversion-extraversion does not describe an individual as either a wallflower or the life of the party. This preference scale refers to the focus of one's attention or source of energy. Indi- viduals with a preference for extraversion (E) are "outward turning" and are energized by the world outside of themselves. They are sociable, action oriented, risk takers, and have a wide variety of interests. In the classroom, extravert stu- dents respond quickly to questions and often need to talk out loud to know what they think. Extraverts can handle multiple stimuli without losing focus and gen- erally prefer talking rather than writing as a method of communication. They have a wide variety of interests. About 75 percent of the U.S. population are esti- mated to be extraverts, and the remaining 25 percent are introverts.
On the other hand, individuals who prefer introversion (I) are inward turning and find the source of their energy in the inner life of ideas and concepts. They are private, reflective, and often exhibit a depth rather than a breadth of interests.
308 JOURNAL OF ECONOMIC EDUCATION
In the classroom, students with this personality preference need time to get to know their instructors and classmates; they need time for reflection before dis- cussion and prefer one-to-one rather than group activities. If introverts are silent in class, it does not necessarily mean they are uninterested, but rather they need time to reflect upon the information and place it in context before discussing it with other students. Introverts will often express an opinion only when asked. Introverts prefer writing rather than talking as a mode of communication.
At the end of the teaching day, an extraverted professor is likely to be wound
up and energized by teaching. He or she often has difficulty unwinding and wants to talk about and process what happened in the classroom. A professor with a
preference for introversion, although often energetic in the classroom, is drained at the end of the day. Bringing out the connections in the classroom is often
exhausting, and an introverted professor needs solitude to reenergize and process what happened in class. Research suggests that nationwide, introverts outnumber extraverts on college and university faculties (Center for Application of Psycho- logical Type 1993). This may partially explain the prevalence of passive rather than active pedagogies in college classrooms, as professors teach in a manner more consistent with their own personality preferences or, perhaps, their own
experiences as students.
Sensing (S)--Intuitive (N)
The sensing-intuitive preference scale refers to the way in which an individ- ual takes in information. Approximately 75 percent of the U.S. population prefer sensing (S) and the remainder are intuitive (N). A sensing individual trusts the data and information that comes from the five senses. These students focus on details and specifics, often work sequentially, prefer experience-rooted learning, and have a practical and present orientation. In economics, these students may focus on replicating graphs drawn on the board without understanding the under-
lying concepts (i.e., they know that MC crosses ATC at a minimum, but they do not know why).
Intuitives prefer to take in information through intuition or hunches. They like the "big picture," focusing on patterns and concepts first, rather then detail. They learn from insight and enjoy learning new skills. These students like solving problems, enjoy change, and are often innovative in their thinking, although they may frequently make errors of fact. Students with an intuitive preference are like- ly to get bored with a professor who reviews problems in class that illustrate gen- eral concepts using details because they find such activities obvious and repeti- tive.
In the classroom, a sensing professor may ask students for specific examples of economic phenomena (when you go to the store, how do you decide what to buy?) and then develop a concept or theory in terms of a concrete example or stu- dent experience. On the other hand, an intuitive professor will often present a the- ory or concept first and may be frustrated when some students fail to see its rel- evance or generalization to specific facts or circumstances.
Fall 2000 309
Thinking (T)-Feeling (F)
Thinking does not imply intelligence nor does feeling imply emotion. This preference scale describes ways in which individuals evaluate information and make decisions. Thinking-feeling preferences are evenly divided among the overall population: 50 percent are thinking (T) and 50 percent are feeling (F). Thinkers tend to make decisions impersonally, making objective judgments, which emphasize analysis and place a high value on fairness. Emotions and feel- ings are important to thinkers but are valued as only one of many aspects to be considered in the decision. In the classroom, thinkers love competition and debate and try to sway others to their position. The feeling person makes deci- sions on the basis of personal values and places a high value on harmony. Their decisionmaking style is subjective and empathic. They like to give and receive affirmation. They do not like debate but prefer collaboration to competition in the classroom.' Feeling students learn best once they have developed a relationship with both their instructor and student colleagues.
Thinking versus feeling professors differ most in their approach to student evaluation. Thinkers are likely to have the grade distribution for the course on the syllabus on the first day of class. With few exceptions, applying this pre-deter- mined distribution easily sets grades. A feeling professor, on the other hand, is more likely to give more weight to individual student growth and circumstances. Potential differences in student evaluation by thinking and feeling professors may raise a new issue of fairness. If when evaluating student performance, a feel- ing professor places more emphasis on the amount of student learning during the term (value added) rather than performance relative to fixed learning objectives, then students must understand the rules for grading or the assessment may be both inaccurate and unfair.
The thinking-feeling preference scale is unique among the personality prefer- ences. It is the only preference scale that has significant differences in the distri- bution of preferences among men and women. Approximately 60 to 65 percent of women tested were classified as feeling, whereas 60 to 65 percent of men test- ed were thinking (Center for Application of Psychological Type 1993).2
Judging (J)-Perceiving (P)
The final preference scale, judging-perceiving, indicates preferences in relat- ing to the outer world: an individual's need for order, closure, openness and adaptability. This preference scale is evenly distributed among the population: 50 percent of the population are classified as perceiving (P) and the remainder are judging (J). Judging individuals prefer an orderly and structured environment. They are goal oriented and often have detailed plans for achieving their goals. When a decision is needed, they are often anxious until a decision is made-they seek closure. In the classroom, these students often complete papers and assign- ments before their due dates and are very organized in their studying. They are often upset, however, if scheduled tests or assignment deadlines are changed.
Perceiving individuals prefer a spontaneous and flexible environment. They
310 JOURNAL OF ECONOMIC EDUCATION
like to keep their options open and are often tentative in their decisionmaking: they are uncomfortable making decisions quickly and often will postpone deci- sions until the last possible moment to ensure that all possible options have been
explored. These students often pull "all-nighters" to complete required assign- ments. Imposing structure on these students may actually be counterproductive, because they require a degree of flexibility to accomplish their tasks. This pref- erence has important implications for active learning or group activities in the classroom. Combining J and P students on group projects can spell disaster unless the J students' need for structure and the P students' need for flexibility are discussed and some compromise reached.
A professor's office often betrays his or her identification on this preference scale. The judging individual's need for order often translates into orderly files and organized, clean desks: Everything has a place and everything is in its place. On the other hand, a non-P observer may consider a perceiving individual's office a disaster area: books, papers, and files are stacked everywhere, and the desk surface has not been seen since the beginning of the term. Generally, how- ever, P individuals know where things are and can operate successfully in such an environment.
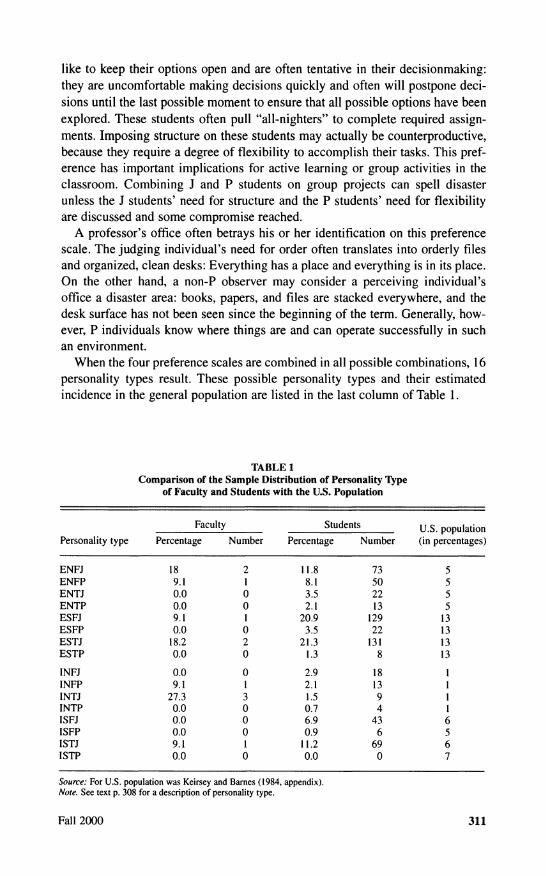
When the four preference scales are combined in all possible combinations, 16 personality types result. These possible personality types and their estimated incidence in the general population are listed in the last column of Table 1.
TABLE 1 Comparison of the Sample Distribution of Personality Type
of Faculty and Students with the U.S. Population
Faculty Students U.S. population Personality type Percentage Number Percentage Number (in percentages)
ENFJ 18 2 11.8 73 5 ENFP 9.1 1 8.1 50 5 ENTJ 0.0 0 3.5 22 5 ENTP 0.0 0 2.1 13 5 ESFJ 9.1 1 20.9 129 13 ESFP 0.0 0 3.5 22 13 ESTJ 18.2 2 21.3 131 13 ESTP 0.0 0 1.3 8 13
INFJ 0.0 0 2.9 18 1 INFP 9.1 1 2.1 13 1 INTJ 27.3 3 1.5 9 1 INTP 0.0 0 0.7 4 1 ISFJ 0.0 0 6.9 43 6 ISFP 0.0 0 0.9 6 5 ISTJ 9.1 1 11.2 69 6 ISTP 0.0 0 0.0 0 7
Source: For U.S. population was Keirsey and Barnes (1984, appendix). Note. See text p. 308 for a description of personality type.
Fall 2000 311
LEARNING THEORY, TEMPERAMENTS, AND ECONOMICS
Previous research highlights the importance of both learning and teaching styles and preferences. Research using the Grasha-Reichmann Learning Style Questionnaire (Reichmann and Grasha 1974) suggests that similarity between faculty teaching styles and student learning styles improves a student's attitude toward and success in economics (Wetzel, Potter, and O'Toole 1982; Charkins, O'Toole, and Wetzel 1985). Borg and Shapiro (1996) extend this literature by focusing on personality temperaments.3 Their results suggest that students whose personality temperaments match that of their professors earn higher grades in eco- nomics. In addition, introverted students were found to do better in principles of economics than did extraverted students. Furthermore, as noted by these authors, student grade, the dependent variable used in Borg and Shapiro's models, is not necessarily a consistent measure of performance across different principles class- es because individual professors may have different grading scales. Indeed, pro- fessors with different personality types may approach grading very differently.
Isabel Myers considered the S-N and T-F preference scales the most important factors in grouping the preferences (Myers and Myers 1991). These preferences relate directly to the learning process: the S-N preference involves the gathering of information, and the T-F preference involves decisionmaking and problem solving. Given the possible combinations of these preferences (SF, ST, NF, NT), this research hypothesizes that, ceteris paribus, the more theoretical and technical characteristics of microeconomic principles will lead NT (intuitive-thinking) stu- dents to perform better and SF (sensing-feeling) students to perform less well in principles of economics. This hypothesis has underlying gender implications: because female students have a greater probability of being an F (60 to 65 percent versus 35 to 40 percent for males) than a T; women on average are expected to perform less well than their male counterparts, all else equal.
DATA AND STUDY DESIGN
The Data
In this study, microeconomics principles were taught by full-time faculty, with Ph.D. degrees in economics, in classes of 35 or fewer students during a 15-week semester. Participation in the study was voluntary: 11 of 18 faculty members rep- resenting 27 of 36 classes of micro principles participated. Student participation was also voluntary. In all, 617 students of a possible 1,200 students participated in the study.4 Of the students in this sample, 400 students took the microeco- nomics TUCE (Test of Understanding of College Economics) (Saunders 1991) exam at the beginning of the semester (PreTUCE), and 300 students took this exam at the end of the semester (PostTUCE).5 These different relative sample sizes suggest a possible sample selection bias discussed by Becker (1997). How- ever, characteristics of participating and nonparticipating students suggest that students who participated in this project were not appreciably different from non- participants. On the other hand, participating faculty were racially more diverse
312 JOURNAL OF ECONOMIC EDUCATION
and, on average, had fewer years teaching experience than nonparticipating fac-
ulty.6 In addition, the Keirsey Sorter, a 70-question, Myers-Briggs-Type instru- ment, was administered during the semester to both students and faculty.7 Stu- dent GPA, ACT scores, cumulative credit-hours passed previous to this semester, total hours attempted during the semester of the study, and grade in microeco- nomics were also obtained from university data sources. Personality tempera- ment types for participating faculty and students are found in Table 1. Students represented 15 of the 16 temperament types, whereas the 11 faculty members represented 7 different personality types. Recall that Myers considered S-N and T-F preference scales crucial for the learning process. Distributions of the S-N and T-F preference scales for the sample of participating students and faculty suggested that over half of the faculty were T, whereas 43 percent of all students (and only 32 percent of female students) were represented by this preference. Nearly two-thirds of the faculty and only one-third of the students tested as N.
Study Design
The theoretical model used to estimate the effect of personality temperament on learning in economics is the familiar educational production function
Output = F(student abilities, student demographics, personality temperament),
where output in economics is measured alternatively as course grade (GRADE), raw score on the PostTUCE exam (PostTUCE), or the difference between Post- TUCE and PreTUCE scores (PostTUCE minus PreTUCE). Student abilities are measured by grade point average (GPA) and ACT scores. Student time available for studying microeconomic principles is proxied by number of credit hours the student was enrolled in during the semester of the study (HRSTAKEN). Student demographic variables include total credit hours earned (TOTALHOURS), sex (MALE), race (NONWHITE), and various personality temperament variables. Course attributes, as proxied by a series of faculty fixed-effects variables repre- senting 10 of 11 participating faculty, acted as shift parameters in much the same way as technology does in the more standard production function. In addition, I included several different variables to test the Borg and Shapiro (1996) hypothe- sis that students whose personality type matches that of their instructor perform better in microeconomic principles.
EMPIRICAL MODEL AND RESULTS
The empirical model is of the following form:
Output = F(GPA, ACT, HRSTAKEN, TOTALHOURS, MALE, NONWHITE, TEMPER, MATCH),
where the dependent variable is alternatively measured as
GRADE = the letter grade (A, B, C, D, F) received in economic principles, with A = 4 ..., F = 0;
Fall 2000 313
PreTUCE = score earned on the TUCE exam taken during the first week of class as measured by number of questions answered correctly;
PostTUCE = score earned on the TUCE exam taken during the last week of class as measured by number of questions answered correctly;
LEARN = PostTUCE score minus PreTUCE score.
The independent variables are measured as
GPA = student grade point average (0.00 to 4.00); ACT = score on the ACT exam or its SAT equivalent; HRSTAKEN = total credit hours taken in the semester of the study; TOTALHOURS = total credit hours passed previous to the semester of the
study; MALE = 1 if student was male; 0 if female;
NONWHITE = 1 if student was nonwhite; 0 if white;
TEMPER = dummy variables indicating the 16 temperament types; or, alternatively, various combinations of two of the four major temperament preference scales;
TEMPMATCH = 1 if student personality temperament matched that of their professor; 0 otherwise (various specifications);
PROFI-PROF10 = a series of faculty fixed-effects variables representing 10 of 11 participating faculty members.
A priori, student aptitude and abilities were predicted to have a positive impact on TUCE exam scores or course grades: students with higher GPAs and ACT scores were expected to perform better in economics. Similarly, students with more cumulative hours (TOTALHOURS) were predicted to perform better. If hours taken (HRSTAKEN) is indeed a proxy for available study time, students carrying more credit hours were predicted to earn lower grades than did students carrying fewer credit hours. As previously discussed, SF personality types were predicted to perform less well than their NT counterparts; however, students who matched their professor's personality type were expected to do better regardless of personality type.
Estimation of these models required separate estimation techniques for each of the possible proxies of student learning in economics. Ordinary least squares (OLS) was used to estimate the number of correct answers on the PreTUCE and PostTUCE exams, and an ordered probit maximum likelihood estimation tech- nique was used to estimate course grade. The sample of students used in this study did not include any ISTP personality types; thus, only 15 of the 16 tem- peraments are represented in the sample. To avoid perfect multicollinearity with the remaining types, I omitted ISTJ from the model. This temperament type was eliminated to facilitate comparison with Borg and Shapiro's empirical results. Significant negative coefficients on the remaining personality temperaments sug-
314 JOURNAL OF ECONOMIC EDUCATION
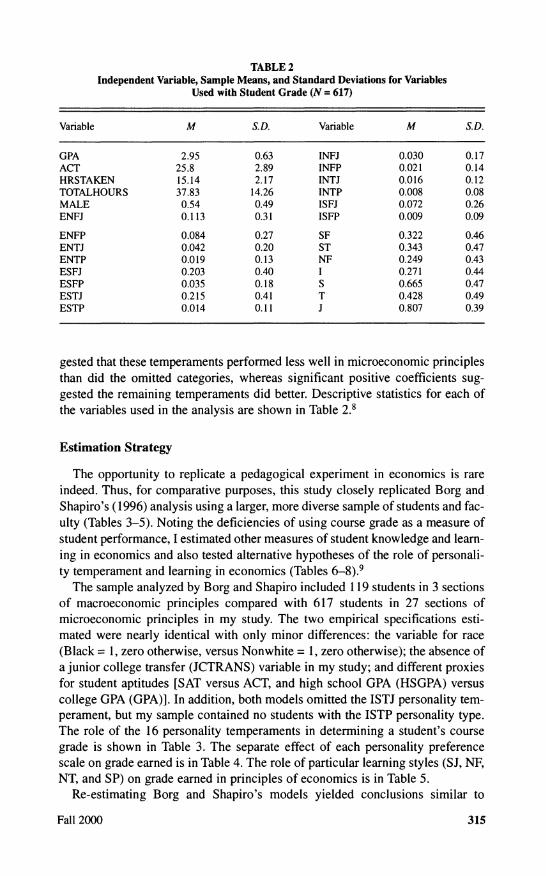
TABLE 2 Independent Variable, Sample Means, and Standard Deviations for Variables
Used with Student Grade (N = 617)
Variable M S.D. Variable M S.D.
GPA 2.95 0.63 INFJ 0.030 0.17 ACT 25.8 2.89 INFP 0.021 0.14 HRSTAKEN 15.14 2.17 INTJ 0.016 0.12 TOTALHOURS 37.83 14.26 INTP 0.008 0.08 MALE 0.54 0.49 ISFJ 0.072 0.26 ENFJ 0.113 0.31 ISFP 0.009 0.09
ENFP 0.084 0.27 SF 0.322 0.46 ENTJ 0.042 0.20 ST 0.343 0.47 ENTP 0.019 0.13 NF 0.249 0.43 ESFJ 0.203 0.40 I 0.271 0.44 ESFP 0.035 0.18 S 0.665 0.47 ESTJ 0.215 0.41 T 0.428 0.49 ESTP 0.014 0.11 J 0.807 0.39
gested that these temperaments performed less well in microeconomic principles than did the omitted categories, whereas significant positive coefficients sug- gested the remaining temperaments did better. Descriptive statistics for each of the variables used in the analysis are shown in Table 2.8
Estimation Strategy
The opportunity to replicate a pedagogical experiment in economics is rare indeed. Thus, for comparative purposes, this study closely replicated Borg and Shapiro's (1996) analysis using a larger, more diverse sample of students and fac- ulty (Tables 3-5). Noting the deficiencies of using course grade as a measure of student performance, I estimated other measures of student knowledge and learn- ing in economics and also tested alternative hypotheses of the role of personali- ty temperament and learning in economics (Tables 6-8).9
The sample analyzed by Borg and Shapiro included 119 students in 3 sections of macroeconomic principles compared with 617 students in 27 sections of microeconomic principles in my study. The two empirical specifications esti- mated were nearly identical with only minor differences: the variable for race (Black = 1, zero otherwise, versus Nonwhite = 1, zero otherwise); the absence of a junior college transfer (JCTRANS) variable in my study; and different proxies for student aptitudes [SAT versus ACT, and high school GPA (HSGPA) versus college GPA (GPA)]. In addition, both models omitted the ISTJ personality tem- perament, but my sample contained no students with the ISTP personality type. The role of the 16 personality temperaments in determining a student's course grade is shown in Table 3. The separate effect of each personality preference scale on grade earned is in Table 4. The role of particular learning styles (SJ, NF, NT, and SP) on grade earned in principles of economics is in Table 5.
Re-estimating Borg and Shapiro's models yielded conclusions similar to
Fall 2000 315
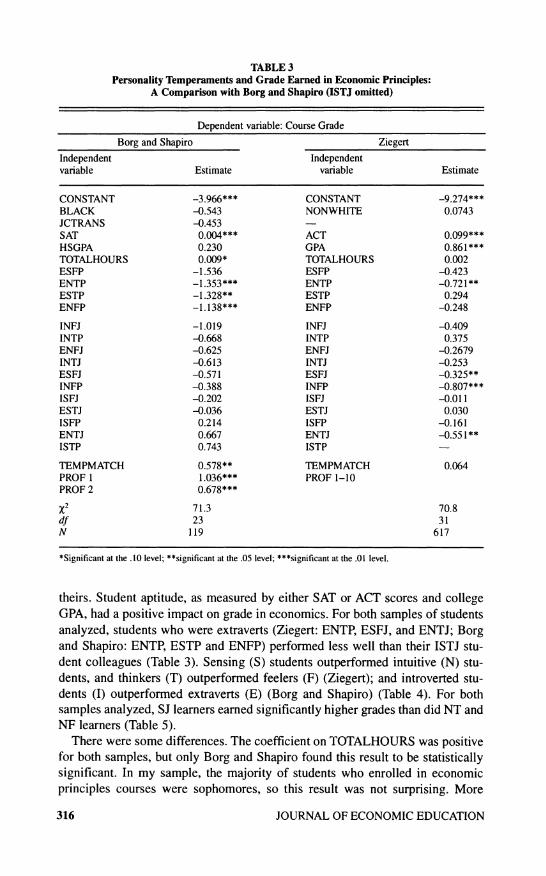
TABLE 3 Personality Temperaments and Grade Earned in Economic Principles:
A Comparison with Borg and Shapiro (ISTJ omitted)
Dependent variable: Course Grade
Borg and Shapiro Ziegert
Independent variable Estimate
Independent variable Estimate
CONSTANT -3.966*** CONSTANT -9.274*** BLACK -0.543 NONWHITE 0.0743 JCTRANS -0.453 -
SAT 0.004*** ACT 0.099*** HSGPA 0.230 GPA 0.861*** TOTALHOURS 0.009* TOTALHOURS 0.002 ESFP -1.536 ESFP -0.423 ENTP -1.353*** ENTP -0.721** ESTP -1.328** ESTP 0.294 ENFP -1.138*** ENFP -0.248
INFJ -1.019 INFJ -0.409 INTP -0.668 INTP 0.375 ENFJ -0.625 ENFJ -0.2679 INTJ -0.613 INTJ -0.253 ESFJ -0.571 ESFJ -0.325** INFP -0.388 INFP -0.807*** ISFJ -0.202 ISFJ -0.011 ESTJ -0.036 ESTJ 0.030 ISFP 0.214 ISFP -0.161 ENTJ 0.667 ENTJ -0.551"* ISTP 0.743 ISTP
TEMPMATCH 0.578** TEMPMATCH 0.064 PROF 1 1.036*** PROF 1-10 PROF 2 0.678***
X2 71.3 70.8 df 23 31 N 119 617
*Significant at the .10 level; **significant at the .05 level; ***significant at the .01 level.
theirs. Student aptitude, as measured by either SAT or ACT scores and college GPA, had a positive impact on grade in economics. For both samples of students analyzed, students who were extraverts (Ziegert: ENTP, ESFJ, and ENTJ; Borg and Shapiro: ENTP, ESTP and ENFP) performed less well than their ISTJ stu- dent colleagues (Table 3). Sensing (S) students outperformed intuitive (N) stu- dents, and thinkers (T) outperformed feelers (F) (Ziegert); and introverted stu- dents (I) outperformed extraverts (E) (Borg and Shapiro) (Table 4). For both samples analyzed, SJ learners earned significantly higher grades than did NT and NF learners (Table 5).
There were some differences. The coefficient on TOTALHOURS was positive for both samples, but only Borg and Shapiro found this result to be statistically significant. In my sample, the majority of students who enrolled in economic principles courses were sophomores, so this result was not surprising. More
316 JOURNAL OF ECONOMIC EDUCATION
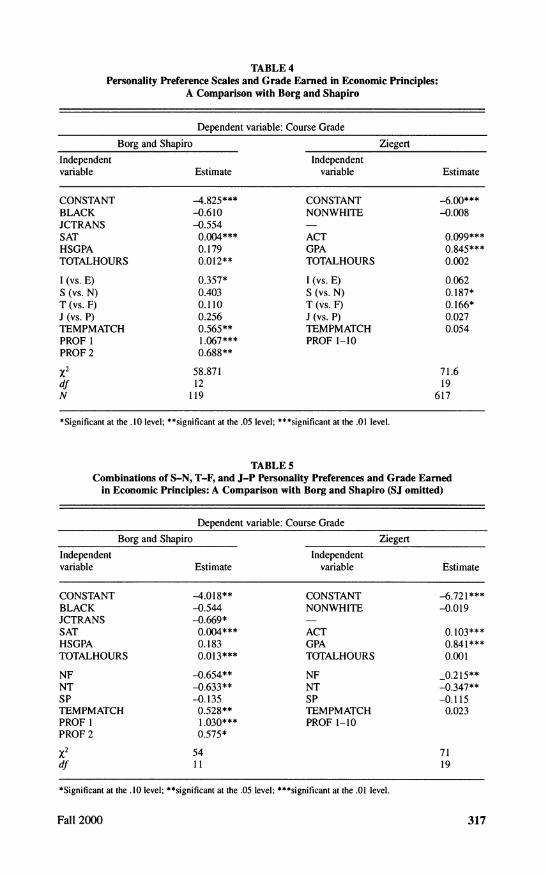
TABLE 4 Personality Preference Scales and Grade Earned in Economic Principles:
A Comparison with Borg and Shapiro
Dependent variable: Course Grade
Borg and Shapiro Ziegert
Independent variable Estimate
Independent variable Estimate
CONSTANT -4.825*** CONSTANT -6.00** BLACK -0.610 NONWHITE -0.008 JCTRANS -0.554 SAT 0.004*** ACT 0.099*** HSGPA 0.179 GPA 0.845*** TOTALHOURS 0.012** TOTALHOURS 0.002
I (vs. E) 0.357* 1 (vs. E) 0.062 S (vs. N) 0.403 S (vs. N) 0.187* T (vs. F) 0.110 T (vs. F) 0.166* J (vs. P) 0.256 J (vs. P) 0.027 TEMPMATCH 0.565** TEMPMATCH 0.054 PROF 1 1.067*** PROF 1-10 PROF 2 0.688**
X2 58.871 71.6 df 12 19 N 119 617
*Significant at the .10 level; **significant at the .05 level; ***significant at the .01 level.
TABLE 5 Combinations of S-N, T-F, and J-P Personality Preferences and Grade Earned
in Economic Principles: A Comparison with Borg and Shapiro (SJ omitted)
Dependent variable: Course Grade
Borg and Shapiro Ziegert
Independent variable Estimate
Independent variable Estimate
CONSTANT -4.018** BLACK -0.544 JCTRANS -0.669* SAT 0.004*** HSGPA 0.183 TOTALHOURS 0.013***
NF -0.654** NT -0.633** SP -0.135 TEMPMATCH 0.528** PROF 1 1.030*** PROF 2 0.575*
X2 54 df 11
CONSTANT -6.721*** NONWHITE -0.019
ACT 0.103*** GPA 0.841*** TOTALHOURS 0.001
NF 0.215** NT -0.347** SP -0.115 TEMPMATCH 0.023 PROF 1-10
71 19
*Significant at the .10 level; **significant at the .05 level; ***significant at the .01 level.
Fall 2000 317
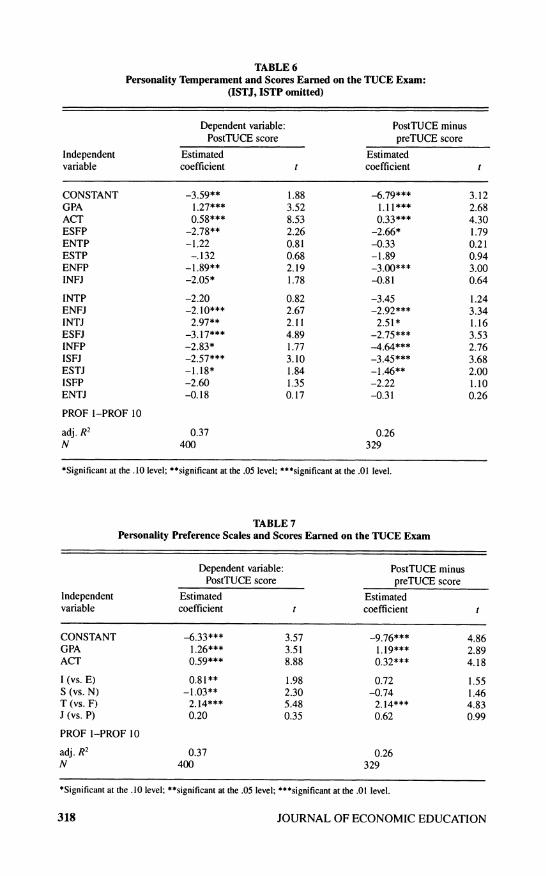
TABLE 6 Personality Temperament and Scores Earned on the TUCE Exam:
(ISTJ, ISTP omitted)
Independent variable
Dependent variable: PostTUCE score
Estimated coefficient t
PostTUCE minus preTUCE score
Estimated coefficient t
CONSTANT -3.59** 1.88 -6.79*** 3.12 GPA 1.27*** 3.52 1.11*** 2.68 ACT 0.58*** 8.53 0.33*** 4.30 ESFP -2.78** 2.26 -2.66* 1.79 ENTP -1.22 0.81 -0.33 0.21 ESTP -.132 0.68 -1.89 0.94 ENFP -1.89** 2.19 -3.00*** 3.00 INFJ -2.05* 1.78 -0.81 0.64
INTP -2.20 0.82 -3.45 1.24 ENFJ -2.10*** 2.67 -2.92*** 3.34 INTJ 2.97** 2.11 2.5 1* 1.16 ESFJ -3.17*** 4.89 -2.75*** 3.53 INFP -2.83* 1.77 -4.64** 2.76 ISFJ -2.57*** 3.10 -3.45*** 3.68 ESTJ -1.18* 1.84 -1.46** 2.00 ISFP -2.60 1.35 -2.22 1.10 ENTJ -0.18 0.17 -0.31 0.26
PROF 1-PROF 10
adj. R2 0.37 0.26 N 400 329
*Significant at the .10 level; **significant at the .05 level; ***significant at the .01 level.
TABLE 7 Personality Preference Scales and Scores Earned on the TUCE Exam
Independent variable
Dependent variable: PostTUCE score
Estimated coefficient t
PostTUCE minus preTUCE score
Estimated coefficient
CONSTANT -6.33*** 3.57 -9.76*** 4.86 GPA 1.26*** 3.51 1.19*** 2.89 ACT 0.59*** 8.88 0.32*** 4.18
I (vs. E) 0.81"** 1.98 0.72 1.55 S (vs. N) -1.03** 2.30 -0.74 1.46 T (vs. F) 2.14*** 5.48 2.14*** 4.83 J (vs. P) 0.20 0.35 0.62 0.99
PROF 1-PROF 10
adj. R' 0.37 0.26 N 400 329
*Significant at the .10 level; **significant at the .05 level; ***significant at the .01 level.
318 JOURNAL OF ECONOMIC EDUCATION
TABLE 8 Combinations of S-N and T-F Personality Preferences and Scores Earned
on the TUCE Exam (NT omitted)
Independent variable
Dependent variable: PostTUCE score
Estimated coefficient t
PostTUCE minus preTUCE score
Estimated coefficient
CONSTANT -4.05*** 2.18 -7.14*** 3.39 GPA 1.33*** 3.77 1.28*** 3.14 ACT 0.60*** 8.88 0.33*** 4.30 ST -0.98** 1.39 -1.12 1.42 SF -3.20** 4.42 -3.07*** 3.80 NF -2.29*** 3.05 -2.88*** 3.49
PROF 1-PROF 10
adj. R2 0.36 0.28 n 400 329
*Significant at the .10 level; **significant at the .05 level; ***significant at the .01 level.
important, although Borg and Shapiro found support for the hypothesis that a match between student and faculty personality type enhances performance in
principles of economics, my study did not.1o Estimations of alternative performance measures in principles of microeco-
nomics are given in Tables 6-8. The first estimation, the number of questions answered correctly on the PostTUCE exam, is a measure of a student's stock of economic knowledge at the end of the term. The second, the number of addi- tional TUCE questions answered correctly at the end of the course compared with those at the beginning (PostTUCE minus PreTUCE), is a measure of the flow of student learning during the course. The TUCE score is a more precise and consistent measure of student performance than course grade when analyzing student outcomes across various instructors because it avoids instructor-specific differences in grading. In addition, the models presented in Tables 6-8 are "test- ed down" versions of the empirical model previously developed."I Variables such as MALE, NONWHITE, HRSTAKEN, TOTALHOURS, and TEMPMATCH were excluded from these models because they were not statistically significant predictors (at the 0.10 level) of student performance in microeconomic princi- ples. I investigate the role of the 16 personality temperaments in Table 6,2 I1 look at the separate effects of each personality preference scale in Table 7, and I inves- tigate the role of the N-S and T-F personality preference scales in Table 8.13
In each of the six models estimated, student aptitudes as proxied by GPA and ACT had a significant positive effect on TUCE scores. The data in Table 6 sug- gest that eight personality types, predominately extraverts (E) and feeling (F) types (ESFP, ENFP, ENFJ, ESFJ, ESTJ, INFJ, INFP, and ISFJ) performed sig- nificantly less well on the TUCE exams than did ISTJ students, whereas INTJ students performed significantly better. All other personality temperaments did not perform significantly different on the TUCE exam than did the omitted per-
Fall 2000 319
sonality type, ISTJ. Conclusions based on the data in Table 7 support that intro- verts (I) perform better than do extraverts (E) and thinking (T) students outper- form feeling (F) students on the TUCE exams. Furthermore, intuitive students (N) perform better than do sensing students (S) on the PostTUCE exam. The data in Table 8 provide evidence that NT students outperform SF and NF students on the PostTUCE and PostTUCE-minus-PreTUCE models and also outperform ST students on the PostTUCE exam.
CONCLUSIONS
These results suggest that personality types do affect student performance in economics whether measured by course grade or by performance on the TUCE exam. Unlike previous research, I found support for the hypotheses that thinking (T) students outperform feeling (F) students on both course grades and TUCE exams. Given that men are more likely to be classified as thinkers (T) than are women, and women are more likely to be classified as feelers (F) than are men, this result has implications for the relative performance of men and women in principles of economics. After adjusting for personality preferences, the "gender gap" in economics, which historically has favored men, disappears: gender is not a statistically significant predictor of performance in economics whether mea- sured by course grade or performance on the TUCE exam.
In addition, intuitive (N) students perform better than do sensing (S) students on the TUCE exams, and sensing (S) students earn higher course grades than do intuitive (N) students. This suggests that different personality types may have dif- ferent preferred methods of testing or alternatively, course grade may not be a sufficiently precise measure of student performance to evaluate accurately the role of personality temperaments and learning in economics. To the extent that standardized tests such as the TUCE are written by economists who may have a disposition for intuition (N) rather than a sensing (S) preference,14 these instru- ments may be biased in favor of intuitive (N) students. Furthermore, the fact that intuitive students (N) outperform sensing (S) students may suggest a potential mismatch of learning and teaching styles. If the majority of students have the sensing preference and thus prefer to learn contextually, but principles of micro- economics tend to be presented "theory first," then sensing students may be at a disadvantage relative to intuitive students.
Finally, unlike previous work, this research did not find support for the hypoth- esis that matching student and faculty personality temperaments enhances stu- dent performance in economics. This difference may be partially explained by differences in the two samples of students studied. The University of North Flori- da (UNF), site of the Borg and Shapiro study is a commuter campus where eco- nomics is taught in classes of 35 to 50 students. The average SAT score of the UNF sample of students studied was 987. On the other hand, Miami University (MU) is a strictly residential campus, and economics is taught in classes of 35 or fewer students. The average SAT equivalent of the MU students sampled was 1,030-1,060. Thus, smaller class size and slightly higher aptitudes may allow students to adapt better to personality-based differences in teaching styles that
320 JOURNAL OF ECONOMIC EDUCATION
are different from their own personality preferences. Alternatively, the larger number of faculty members in this study, 11 versus 3 in Borg and Shapiro, may suggest these results are more reliable. More research is needed to further exam- ine this relationship.
Taken together these results suggest the important role that personality tem- perament plays in the learning and teaching of microeconomic principles. This result has several important implications for pedagogy in introductory classes in economics. If we want to increase learning in economics, then we need to devise ways of presenting course material that are accessible to all students regardless of how they receive and process information. At a minimum, this suggests the need for a variety of classroom pedagogies and a better understanding of the role of personality temperament in learning and teaching.
NOTES
1. Some scholars have suggested that the content of economics with its focus on competition rather than cooperation may be difficult for some individuals (Nelson 1996).
2. Research on preference type and occupation suggests that some occupations are dominated by F men and T women, that is, men who are counselors are predominantly F, whereas women who are engineers are predominantly T.
3. Borg and Shapiro (1996) make use of the Keirsey-Bates (1984) analysis of learning styles and personality temperament that focuses on four learners: Dionysian (SP), Epimethean (SJ), Promethean (NT), and Appollonian (NF).
4. By comparison, there were 3 professors and 119 students in the Borg and Shapiro study (1996). 5. None of the professors in this sample included the PreTUCE exam results in the computation of
student course grades in micro principles. Some faculty included the PostTUCE exam results in the students' grades, but the weight given these scores were not available. The differential impact of counting the PostTUCE results as a component of course grade was captured in the series of faculty fixed-effects variables (PROFI-PROFIO) included in each of the estimated models. In the models presented in Tables 3 and 4, four faculty fixed-effects variables were statistically sig- nificant relative to the omitted faculty member at a significance level of 10 percent or less; in the model presented in Table 5, three faculty fixed-effects variables were statistically significant rel- ative to the omitted faculty member at a significance level of 10 percent or less. In each model estimated, the F test of joint significance for faculty fixed-effects variables taken as a group sug- gests the coefficients on these variables are significantly different from zero at a confidence level of 0.01.
6. Comparisons of participating and nonparticipating faculty and students are available from the author upon request.
7. Tucker and Gillespie (1993) and Quinn, Lewis, and Fischer (1992) found significant concurrent validity between the MBTI and the Keirsey Sorter, which supports the use of either instrument to determine an individual's personality type.
8. Descriptive statistics for variables used in this analysis are provided for a sample of 617 students. Descriptive statistics for smaller subsamples of students used in this article (n = 329 and n = 400) were not appreciably different from the larger sample from which they were drawn and are avail- able from the author upon request.
9. In addition to the variables specified in the model, faculty fixed-effects variables were included for 10 of the 11 faculty members in an effort to control for class-specific differences. The coef- ficients and model summary statistics presented in Tables 3 through 8 reflect the inclusion of these fixed-effects variables, although these variables are not reported. In the models presented in Tables 7 and 8, only one faculty fixed-effects variable was statistically significant relative to the omitted faculty member at a significance level of 10 percent or less. In the models presented in Table 6, no faculty fixed-effects coefficients were statistically significant. However, in each model estimated, the F test of joint significance for faculty fixed-effects variables taken as a group suggested the coefficients on these variables were significantly different from zero at a confidence level of 0.01.
10. I also used alternative measures of matching in the analysis but found them to be statistically insignificant.
Fall 2000 321
11. See Kennedy (1997, ch. 5) for a discussion of testing procedures. The complete model developed in this study was estimated for both dependent variables, PostTUCE and PostTUCE minus PreTUCE. However, coefficients on MALE, NONWHITE, HRSTAKEN, TOTALHOURS, and various specifications of TEMPMATCH were not statistically significant at the .10 level of sig- nificance.
12. The different sample sizes (400 and 329 for the OLS models in Tables 6, 7, and 8 and 617 in Tables 2, 3, and 4 for the maximum likelihood models) reflect differences in data availability for the dependent variables, PostTUCE score, PreTUCE score, and course grade. The former relied on the voluntary participation of students, whereas the latter were obtained from university data sources.
13. Tested-down versions of the Borg and Shapiro (1996) model were also estimated using PostTUCE and PostTUCE minus PreTUCE as dependent variables. Model summary statistics suggest, that for the present sample of students studied, the models presented in Tables 6-8 are more robust than the model developed by Borg and Shapiro (1996). These results are available from the author upon request.
14. Recall that in this sample two-thirds of faculty were N whereas only one-third of students had the N preference.
REFERENCES
Becker, W. 1997. Teaching economics to undergraduates. Journal of Economic Literature 35 (3): 1347-73.
Borg, M. 0., and S. L. Shapiro. 1996, Personality type and student performance in principles of eco- nomics. Journal of Economic Education 27 (Winter): 3-25.
Center for Applications of Psychological Type. 1993. An assortment offacts about type in education. Gainesville, Fla.
Charkins, R. J., D. M. O'Toole, and J. N. Wetzel. 1985. Linking teacher and student learning styles with student achievement and attitudes. Journal of Economic Education 16 (Spring): 111-20.
Keirsey, D., and M. Bates. 1984. Please understand me: Character and temperament types. 5th ed. Del Mar, Calif.: Prometheus Nemesis.
Kennedy, P. 1997. A guide to econometrics. 3rd ed. Cambridge, Mass.: MIT Press. Myers, I. 1975. Manual: Myers-Briggs type indicator. Palo Alto, Calif.: Consulting Psychologists
Press. Myers, P., and K. Myers. 1991. MBTI: Introduction to type in organizational settings. Palo Alto,
Calif.: Consulting Psychologists Press. Quinn, M. T., R. J. Lewis, and K. L. Fischer. 1992. A cross-correlation of the Myers-Briggs and
Keirsey instruments. Journal of College Student Development 33 (3): 279-80. Reichmann, S., and A. F Grasha. 1974. A rational approach to developing and assessing the construct
validity of a student learning scale. Journal of Psychology 87: 213-23. Saunders, P. 1991. The third edition of the Test of Understanding in College Economics. The Jour-
nal of Economic Education 22 (Summer): 255-72. Tucker, I. E., and B. V. Gillespie. 1993. Correlations among three measures of personality type. Per-
ceptual & Motor Skills 77 (2): 650. Wetzel, J. N., W. J. Potter, and D. M. O'Toole. 1982. The influence of learning styles and teaching
styles on student attitudes and achievement in the introductory economics course: A case study. Journal of Economic Education 13 (Winter): 33-39.
322 JOURNAL OF ECONOMIC EDUCATION


![⃝[franz w seidler, dider ziegert] hitler's secret](https://img.pdfslide.net/doc/110x75/568ca9c01a28ab186d9ecd45/franz-w-seidler-dider-ziegert-hitlers-secret.jpg)