Embed Size (px)
Citation preview
The Role of Schools in Alleviating Social and Economic Disadvantage:
Students In Low Income CommunitiesWithin High Income Countries
The Role of Schools in Alleviating Social and Economic Disadvantage:
Students In Low Income CommunitiesWithin High Income Countries
Howell Wechsler, Ed.D., MPH
Diane Allensworth, PhD
Carolyn Fisher, Ed.D.
Howell Wechsler, Ed.D., MPH
Diane Allensworth, PhD
Carolyn Fisher, Ed.D.
"The findings and conclusions in this presentation are those of the authors and do not necessarily represent the views of the CDC/the Agency for Toxic Substances and Disease Registry.“ (CS111689)
Overview
Background: Health and education disparities in the U.S.
7 school health strategies for alleviating social and economic disadvantage
Background: Health and education disparities in the U.S.
7 school health strategies for alleviating social and economic disadvantage
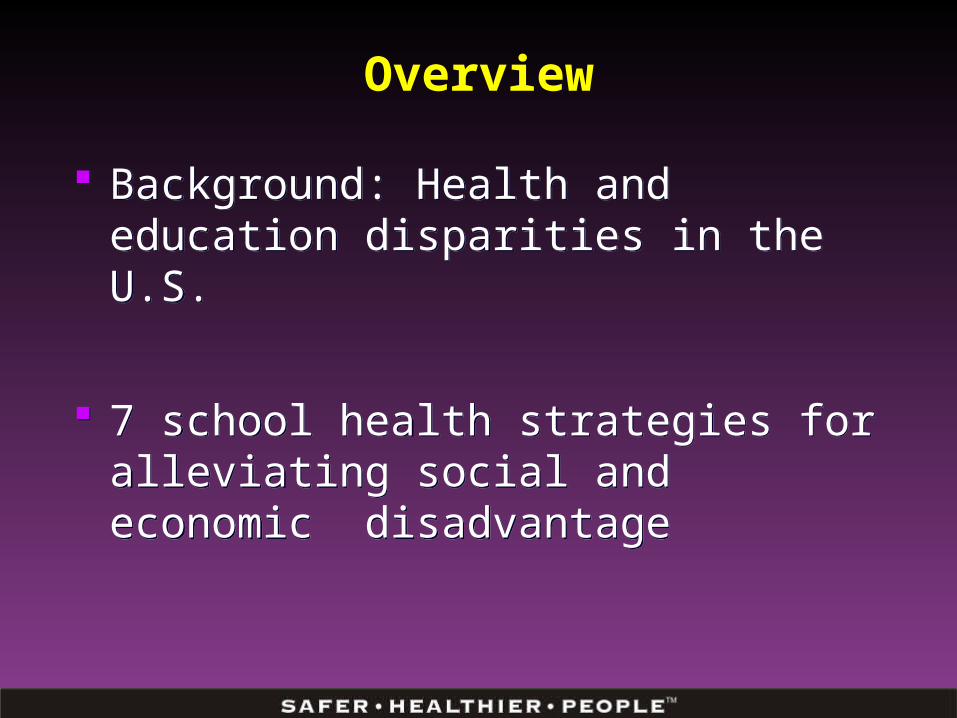
Two Overarching Goals Increase quality and
years of healthy life Eliminate health
disparities
Two Overarching Goals Increase quality and
years of healthy life Eliminate health
disparities
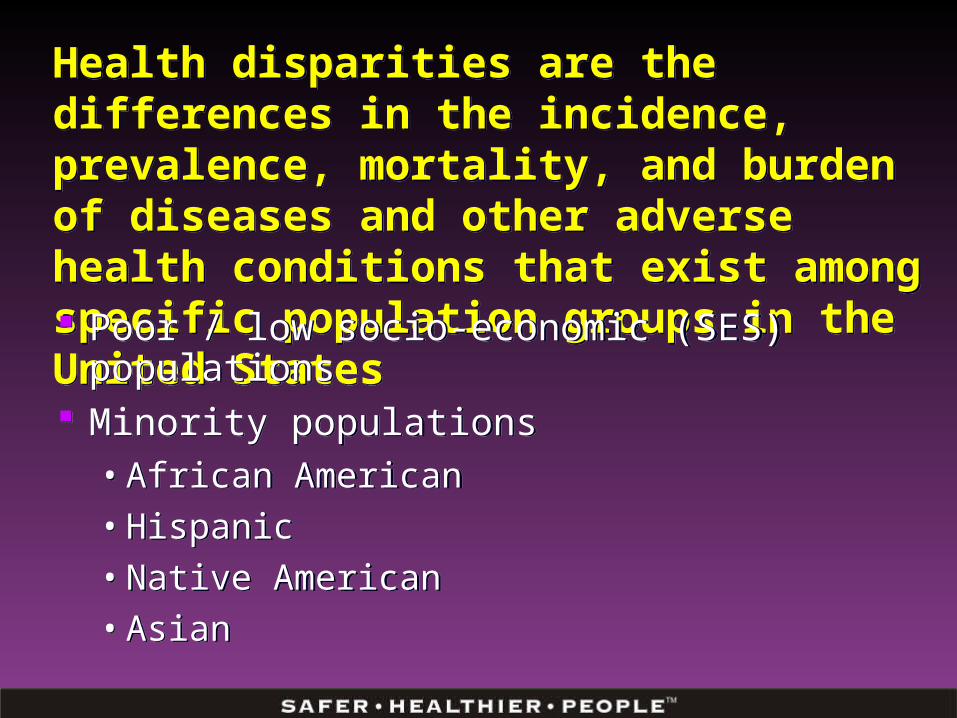
Health disparities are the differences in the incidence, prevalence, mortality, and burden of diseases and other adverse health conditions that exist among specific population groups in the United States
Health disparities are the differences in the incidence, prevalence, mortality, and burden of diseases and other adverse health conditions that exist among specific population groups in the United States Poor / low socio-economic (SES) populations Minority populations
• African American• Hispanic• Native American• Asian
Poor / low socio-economic (SES) populations Minority populations
• African American• Hispanic• Native American• Asian
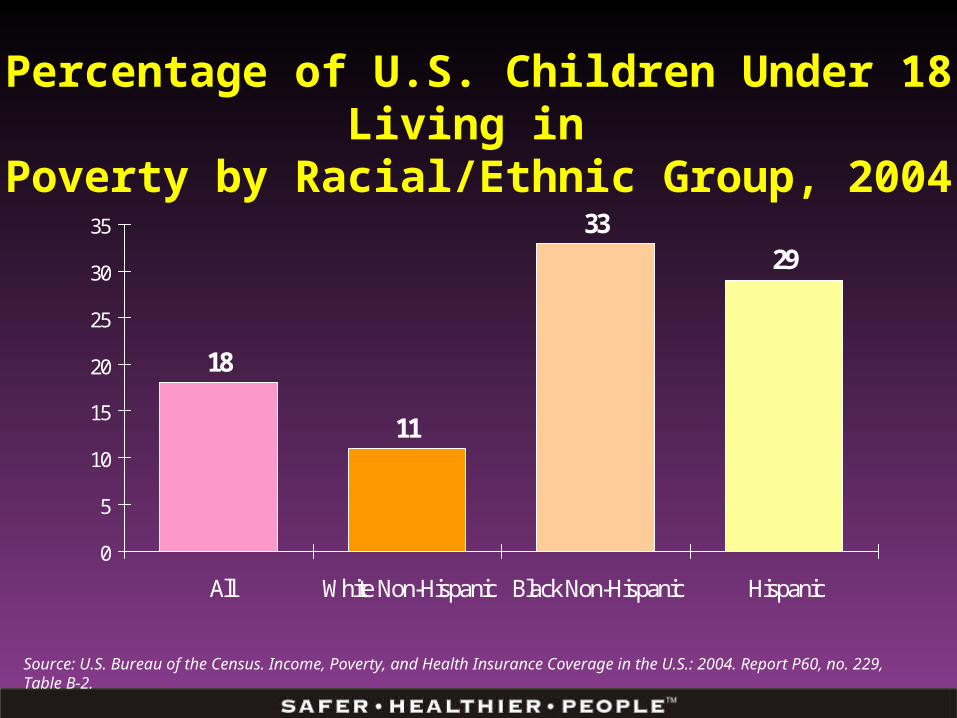
Percentage of U.S. Children Under 18 Living in Poverty by Racial/Ethnic Group, 2004
Source: U.S. Bureau of the Census. Income, Poverty, and Health Insurance Coverage in the U.S.: 2004. Report P60, no. 229, Table B-2.
11
3329
18
0
5
10
15
20
25
30
35
All White Non-Hispanic Black Non-Hispanic Hispanic
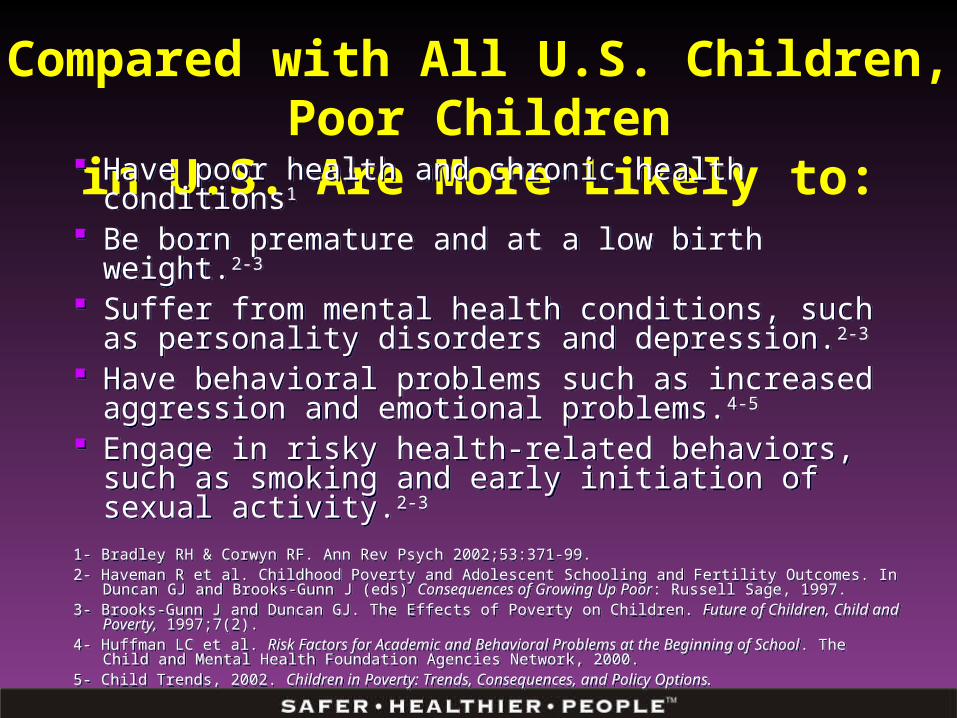
Compared with All U.S. Children, Poor Childrenin U.S. Are More Likely to:
Have poor health and chronic health conditions1
Be born premature and at a low birth weight.2-3
Suffer from mental health conditions, such as personality disorders and depression.2-3
Have behavioral problems such as increased aggression and emotional problems.4-5
Engage in risky health-related behaviors, such as smoking and early initiation of sexual activity.2-3
1- Bradley RH & Corwyn RF. Ann Rev Psych 2002;53:371-99.2- Haveman R et al. Childhood Poverty and Adolescent Schooling and Fertility Outcomes. In Duncan GJ and Brooks-
Gunn J (eds) Consequences of Growing Up Poor: Russell Sage, 1997.3- Brooks-Gunn J and Duncan GJ. The Effects of Poverty on Children. Future of Children, Child and Poverty, 1997;7(2).4- Huffman LC et al. Risk Factors for Academic and Behavioral Problems at the Beginning of School. The Child and
Mental Health Foundation Agencies Network, 2000.5- Child Trends, 2002. Children in Poverty: Trends, Consequences, and Policy Options.
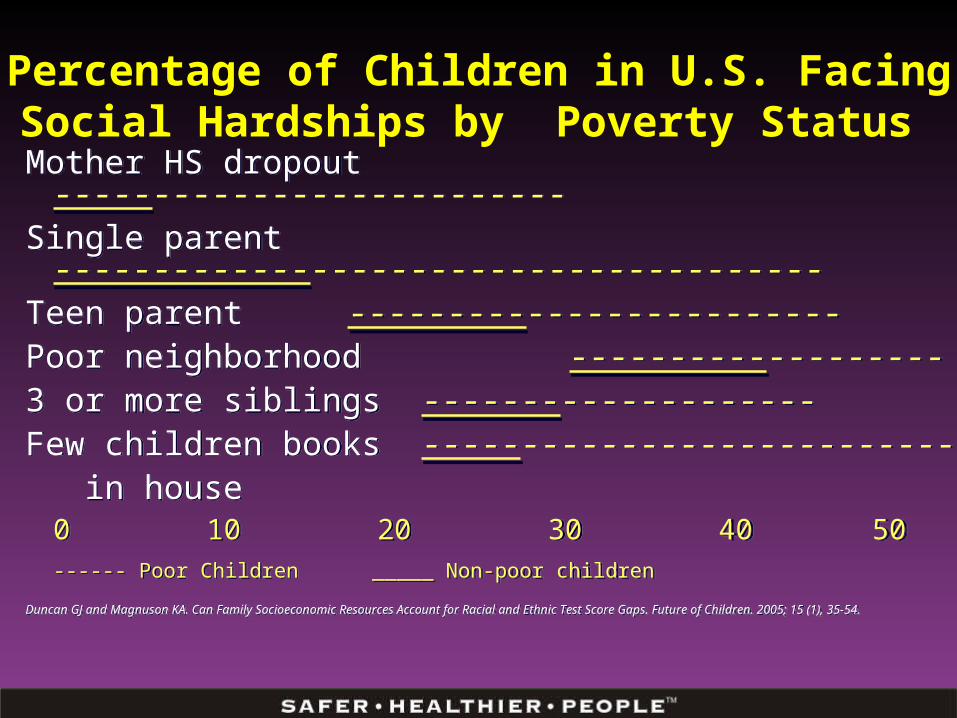
Percentage of Children in U.S. Facing Social Hardships by Poverty Status
Mother HS dropout --------------------------Single parent ---------------------------------------Teen parent -------------------------Poor neighborhood -------------------3 or more siblings --------------------Few children books --------------------------- in house
0 10 20 30 40 50------ Poor Children _____ Non-poor children
Duncan GJ and Magnuson KA. Can Family Socioeconomic Resources Account for Racial and Ethnic Test Score Gaps. Future of Children. 2005; 15 (1), 35-54.
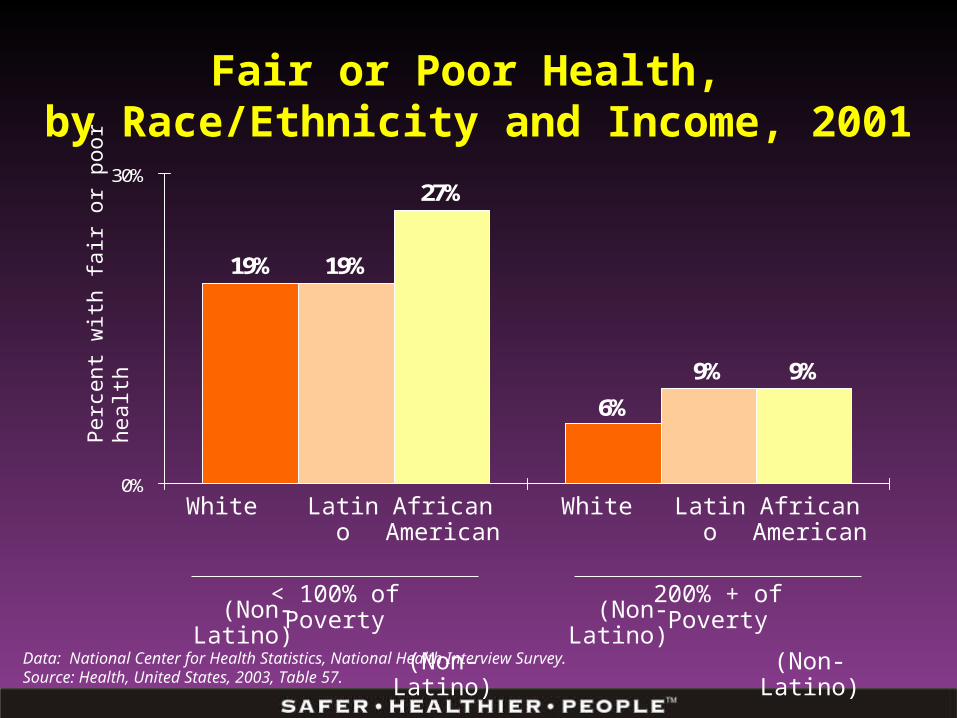
Fair or Poor Health, by Race/Ethnicity and Income, 2001
Data: National Center for Health Statistics, National Health Interview Survey.Source: Health, United States, 2003, Table 57.
19%
9%
27%
9%
6%
19%
0%
30%
< 100% of Poverty
200% + of Poverty
Perc
ent w
ith fa
ir or
poo
r hea
lth
White (Non-Latino)
Latino African American
(Non-Latino)
White (Non-Latino)
Latino African American
(Non-Latino)
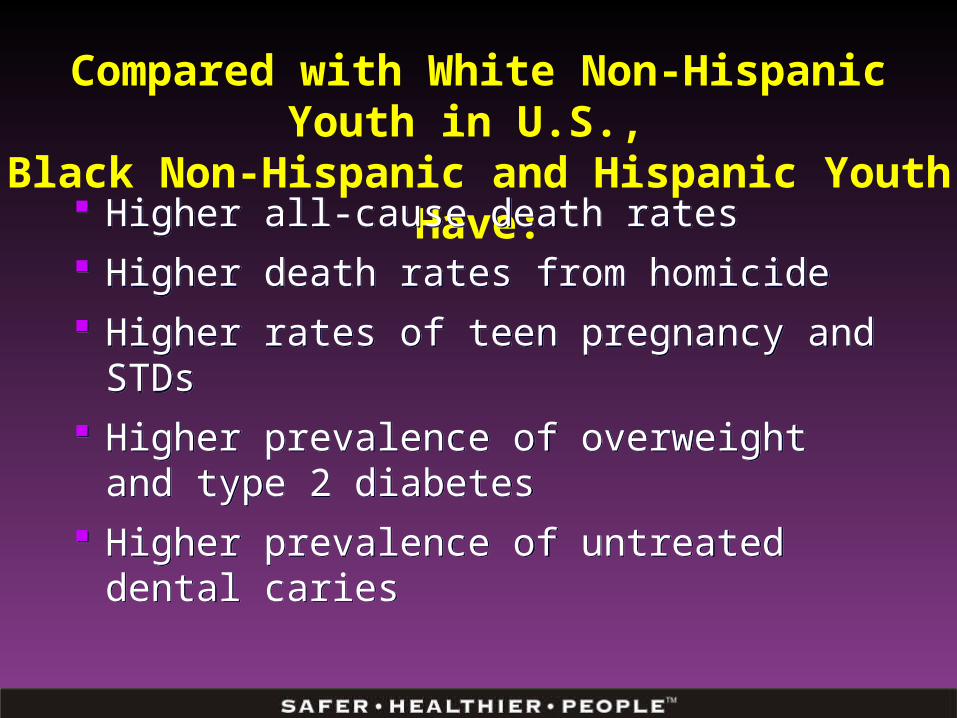
Compared with White Non-Hispanic Youth in U.S., Black Non-Hispanic and Hispanic Youth Have:
Higher all-cause death rates Higher death rates from homicide Higher rates of teen pregnancy and STDs Higher prevalence of overweight and type 2
diabetes Higher prevalence of untreated dental caries
Higher all-cause death rates Higher death rates from homicide Higher rates of teen pregnancy and STDs Higher prevalence of overweight and type 2
diabetes Higher prevalence of untreated dental caries
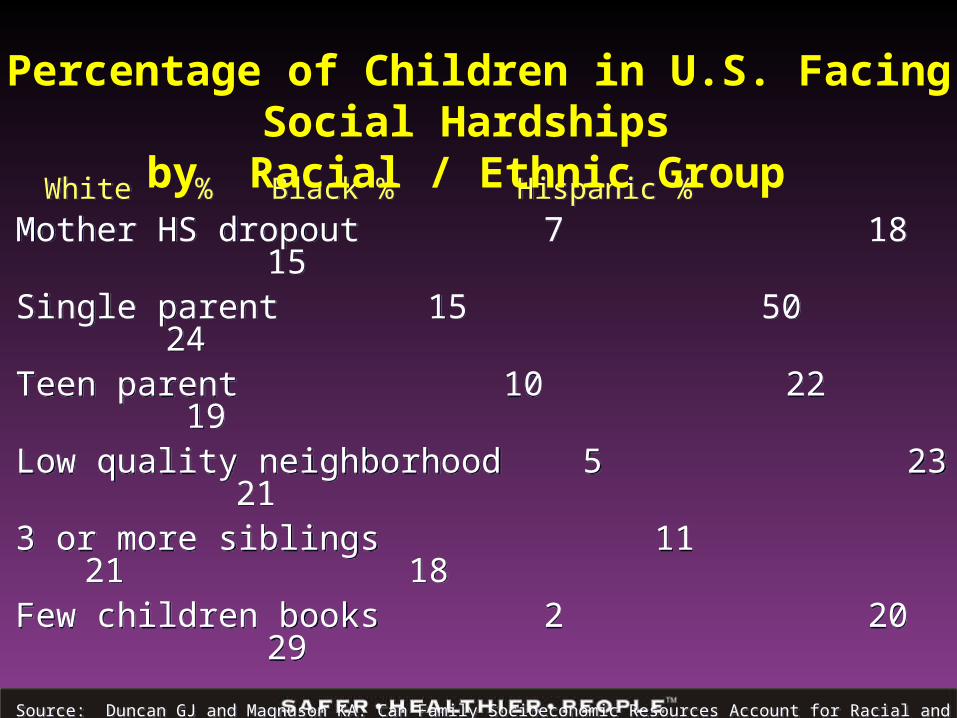
White % Black % Hispanic %Mother HS dropout 7 18 15Single parent 15 50 24Teen parent 10 22 19Low quality neighborhood 5 23 213 or more siblings 11 21 18Few children books 2 20 29
Source: Duncan GJ and Magnuson KA. Can Family Socioeconomic Resources Account for Racial and Ethnic Test Score Gaps. Future of Children. 2005; 15 (1), 35-54.
Percentage of Children in U.S. Facing Social Hardships by Racial / Ethnic Group
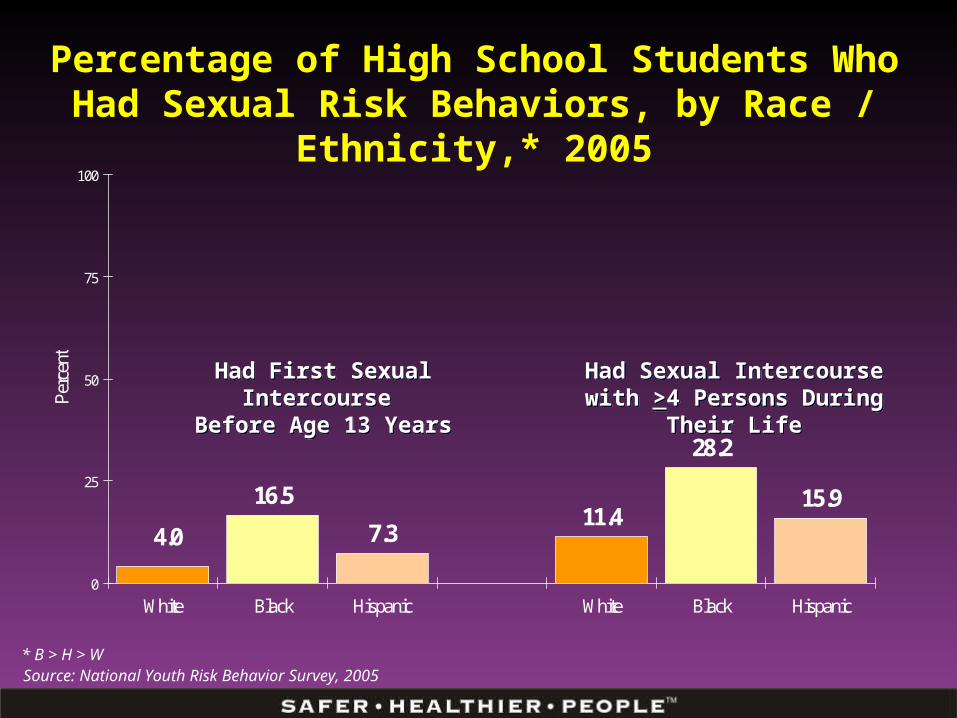
Percentage of High School Students Who Had Sexual Risk Behaviors, by Race / Ethnicity,* 2005
* B > H > WSource: National Youth Risk Behavior Survey, 2005
16.511.4
28.2
15.9
4.0 7.3
0
25
50
75
100
White Black Hispanic White Black Hispanic
Perc
ent
Had First Sexual Intercourse Before Age 13 Years
Had First Sexual Intercourse Before Age 13 Years
Had Sexual Intercourse with >4 Persons During Their LifeHad Sexual Intercourse with >4 Persons During Their Life
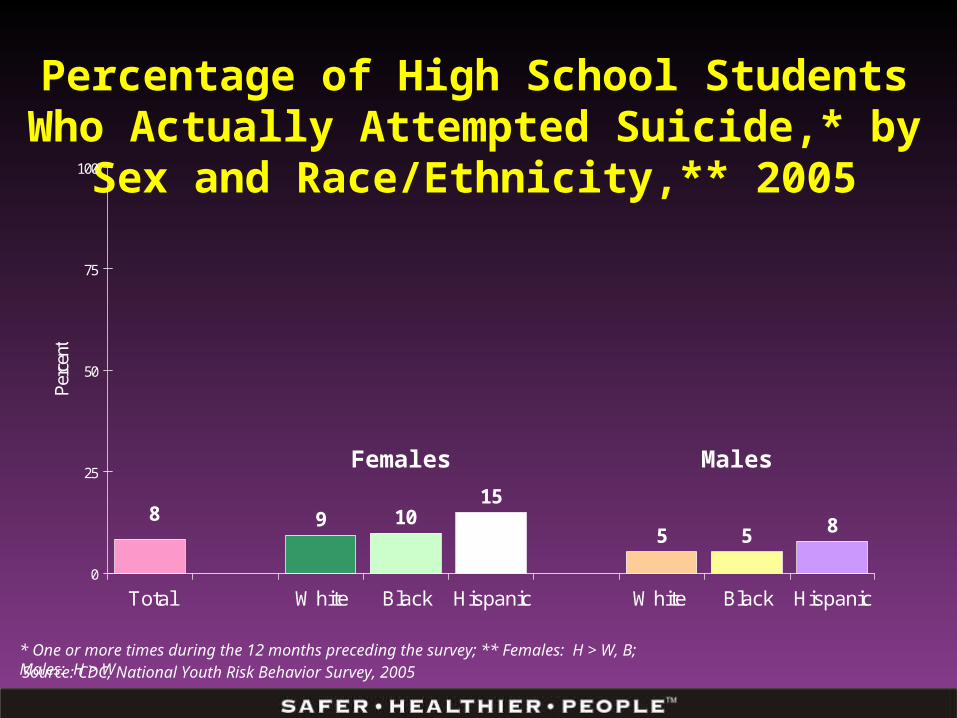
Percentage of High School Students Who Actually Attempted Suicide,* by Sex and Race/Ethnicity,** 2005
* One or more times during the 12 months preceding the survey; ** Females: H > W, B; Males: H > WSource: CDC, National Youth Risk Behavior Survey, 2005
1015
5 5 88 9
0
25
50
75
100
Total White Black Hispanic White Black Hispanic
Perc
ent
Females Males
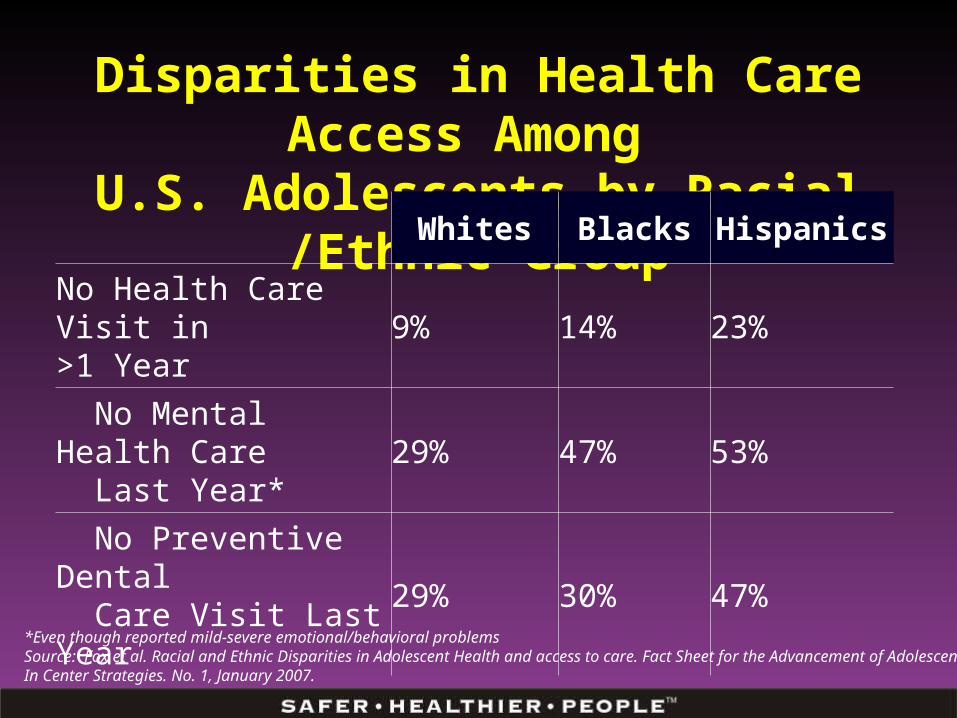
Disparities in Health Care Access Among U.S. Adolescents by Racial /Ethnic Group
Whites Blacks Hispanics
No Health Care Visit in>1 Year 9% 14% 23%
No Mental Health Care Last Year* 29% 47% 53%
No Preventive Dental Care Visit Last Year 29% 30% 47%
*Even though reported mild-severe emotional/behavioral problemsSource: Fox et al. Racial and Ethnic Disparities in Adolescent Health and access to care. Fact Sheet for the Advancement of Adolescent Health, In Center Strategies. No. 1, January 2007.
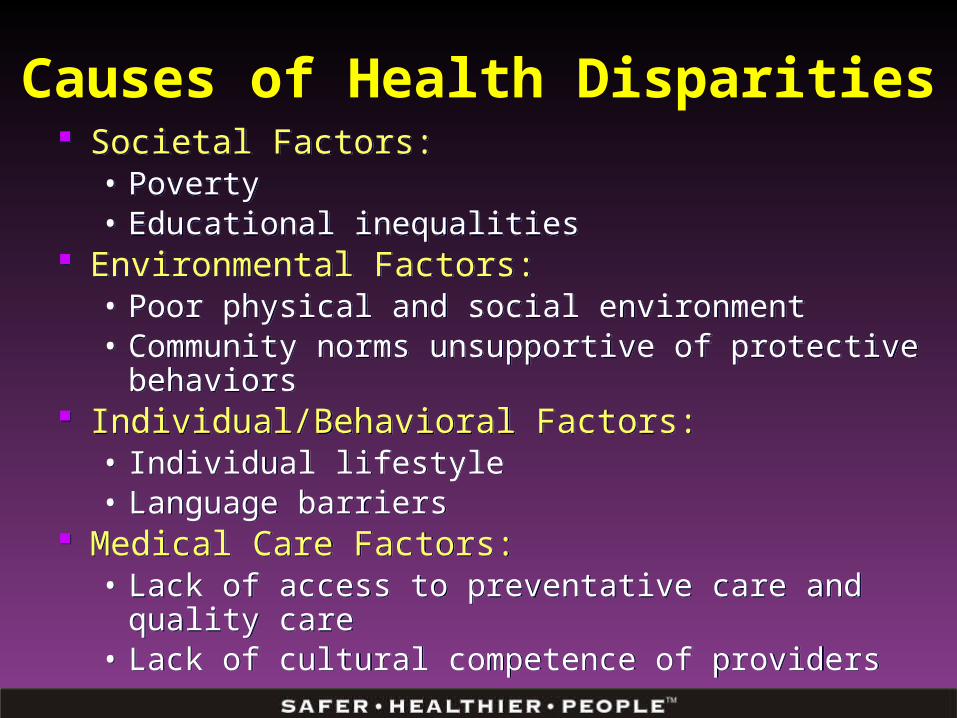
Causes of Health Disparities Societal Factors:
• Poverty• Educational inequalities
Environmental Factors:• Poor physical and social environment • Community norms unsupportive of protective behaviors
Individual/Behavioral Factors:• Individual lifestyle • Language barriers
Medical Care Factors:• Lack of access to preventative care and quality care • Lack of cultural competence of providers
Societal Factors:• Poverty• Educational inequalities
Environmental Factors:• Poor physical and social environment • Community norms unsupportive of protective behaviors
Individual/Behavioral Factors:• Individual lifestyle • Language barriers
Medical Care Factors:• Lack of access to preventative care and quality care • Lack of cultural competence of providers
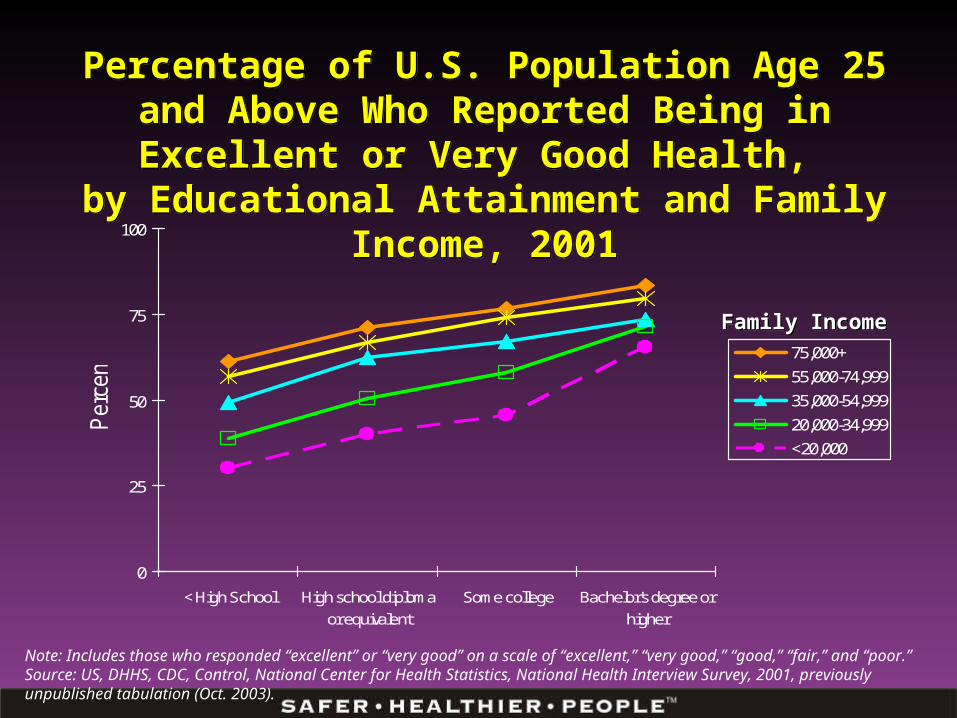
Percentage of U.S. Population Age 25 and Above Who Reported Being in Excellent or Very Good Health,
by Educational Attainment and Family Income, 2001
Percentage of U.S. Population Age 25 and Above Who Reported Being in Excellent or Very Good Health,
by Educational Attainment and Family Income, 2001
Note: Includes those who responded “excellent” or “very good” on a scale of “excellent,” “very good,” “good,” “fair,” and “poor.” Source: US, DHHS, CDC, Control, National Center for Health Statistics, National Health Interview Survey, 2001, previously unpublished tabulation (Oct. 2003).
0
25
50
75
100
< High School High school diplomaor equivalent
Some college Bachelor's degree orhigher
Per
cent
75,000+55,000-74,99935,000-54,99920,000-34,999<20,000
Family IncomeFamily Income
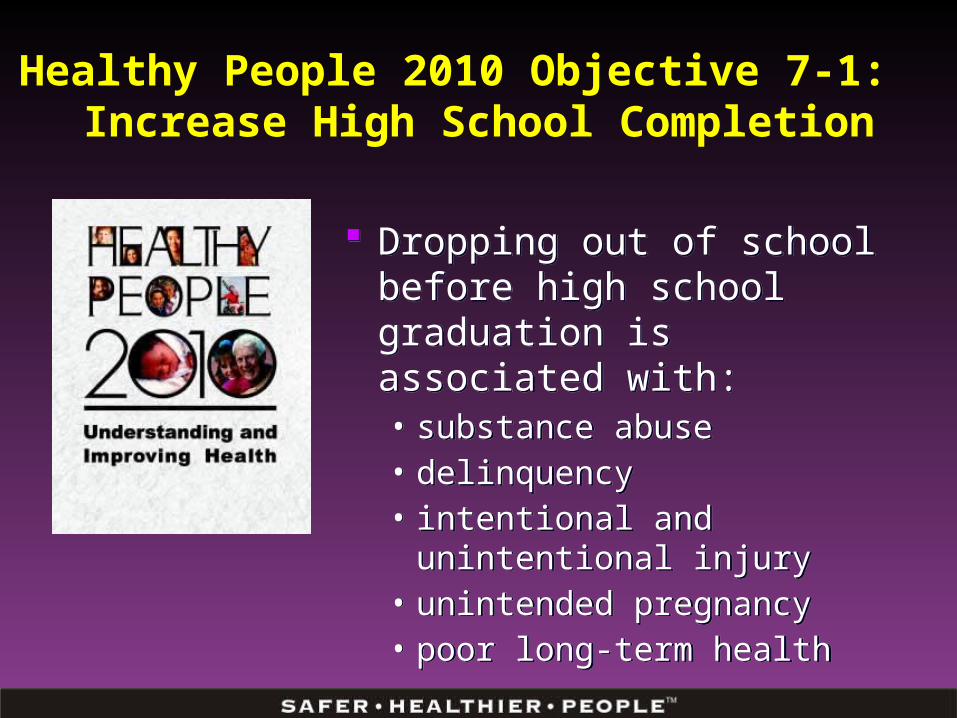
Healthy People 2010 Objective 7-1: Increase High School Completion
Dropping out of school before high school graduation is associated with:• substance abuse• delinquency• intentional and unintentional injury• unintended pregnancy • poor long-term health
Dropping out of school before high school graduation is associated with:• substance abuse• delinquency• intentional and unintentional injury• unintended pregnancy • poor long-term health
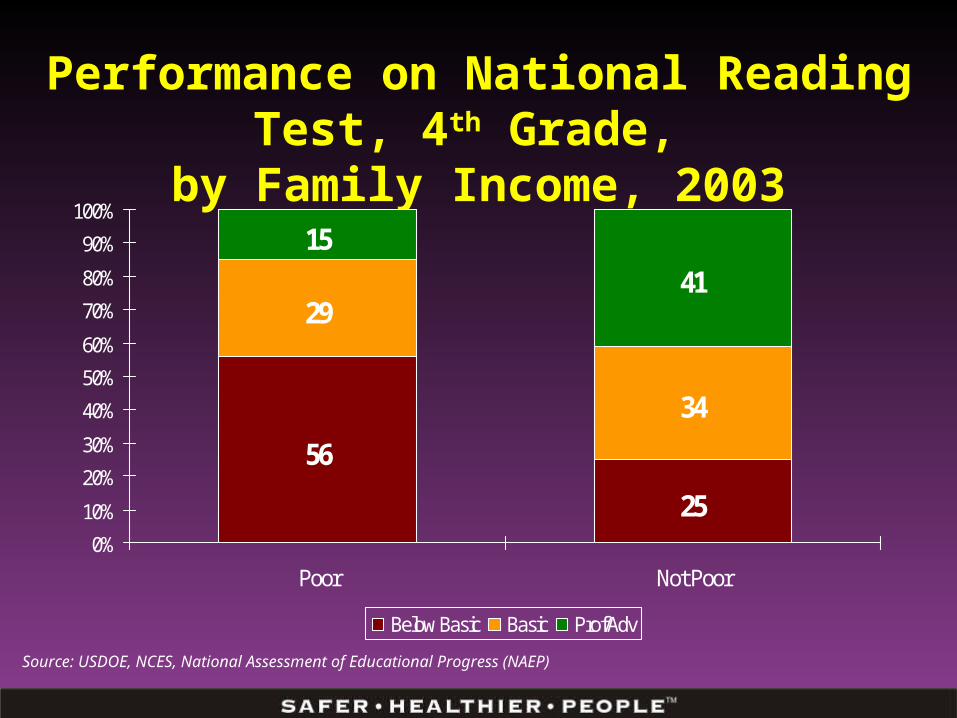
Performance on National Reading Test, 4th Grade, by Family Income, 2003
56
25
29
34
15
41
0%
10%
20%
30%
40%
50%
60%
70%
80%
90%
100%
Poor Not Poor
Below Basic Basic Prof/Adv
Source: USDOE, NCES, National Assessment of Educational Progress (NAEP)
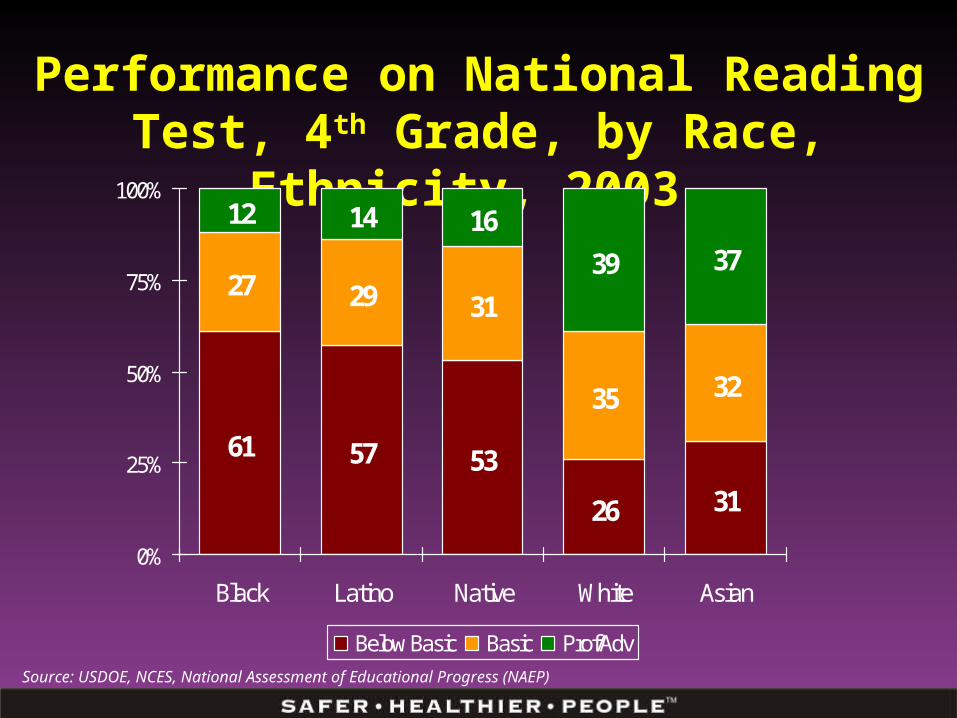
Performance on National Reading Test, 4th Grade, by Race, Ethnicity, 2003
61 57 53
26 31
27 29 31
35 32
12 14 16
39 37
0%
25%
50%
75%
100%
Black Latino Native White Asian
Below Basic Basic Prof/AdvSource: USDOE, NCES, National Assessment of Educational Progress (NAEP)
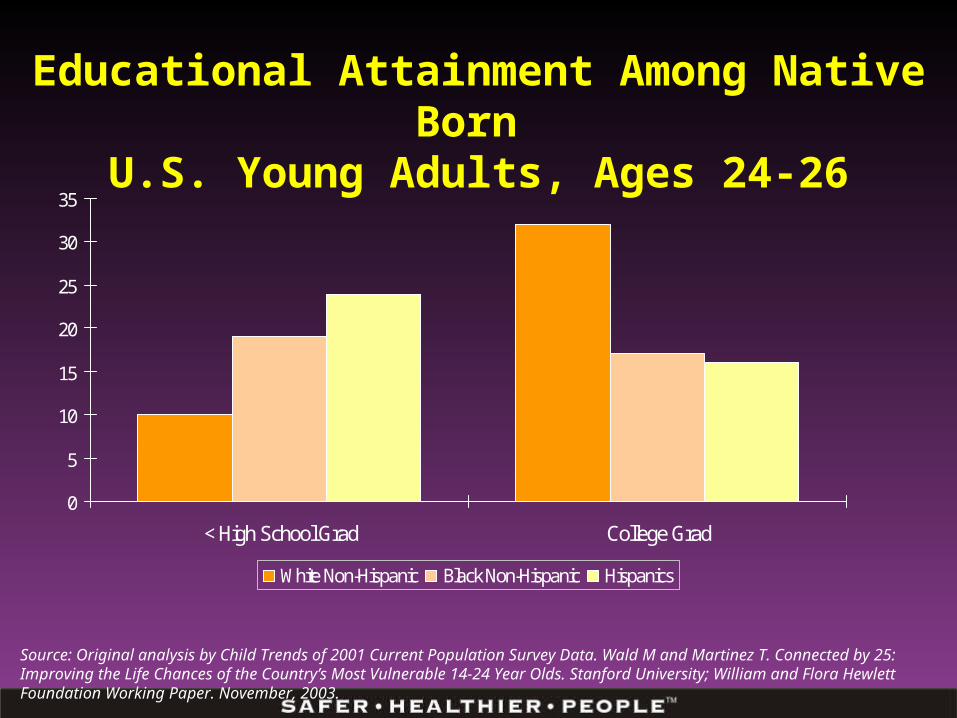
Educational Attainment Among Native Born U.S. Young Adults, Ages 24-26
0
5
10
15
20
25
30
35
< High School Grad College Grad
White Non-Hispanic Black Non-Hispanic Hispanics
Source: Original analysis by Child Trends of 2001 Current Population Survey Data. Wald M and Martinez T. Connected by 25: Improving the Life Chances of the Country’s Most Vulnerable 14-24 Year Olds. Stanford University; William and Flora Hewlett Foundation Working Paper. November, 2003.
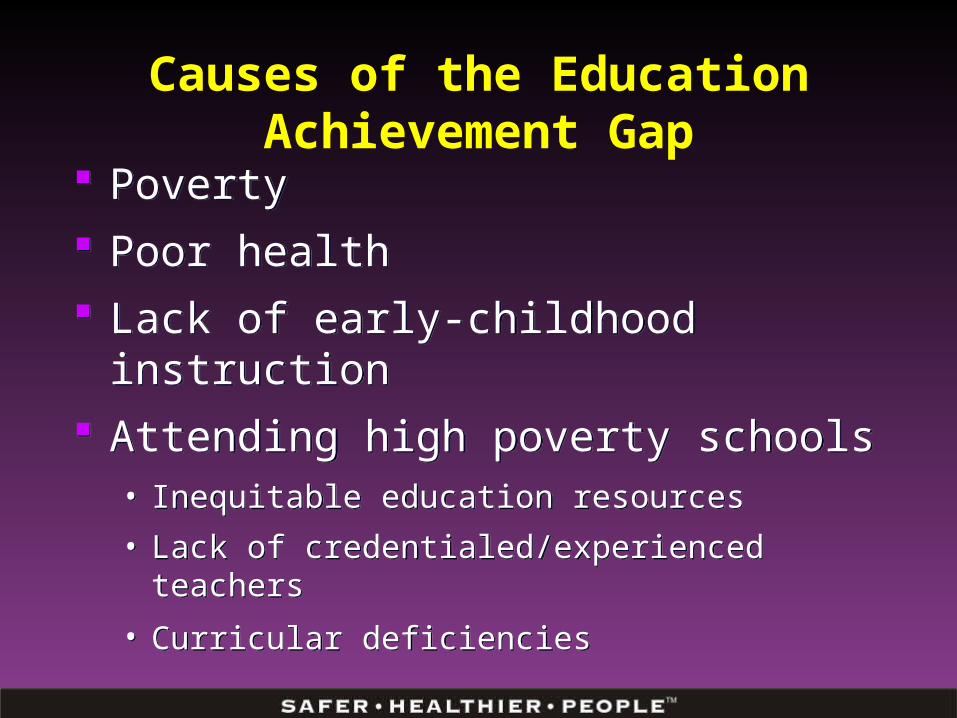
Causes of the Education Achievement Gap
Poverty Poor health Lack of early-childhood instruction Attending high poverty schools
• Inequitable education resources• Lack of credentialed/experienced teachers• Curricular deficiencies
Poverty Poor health Lack of early-childhood instruction Attending high poverty schools
• Inequitable education resources• Lack of credentialed/experienced teachers• Curricular deficiencies
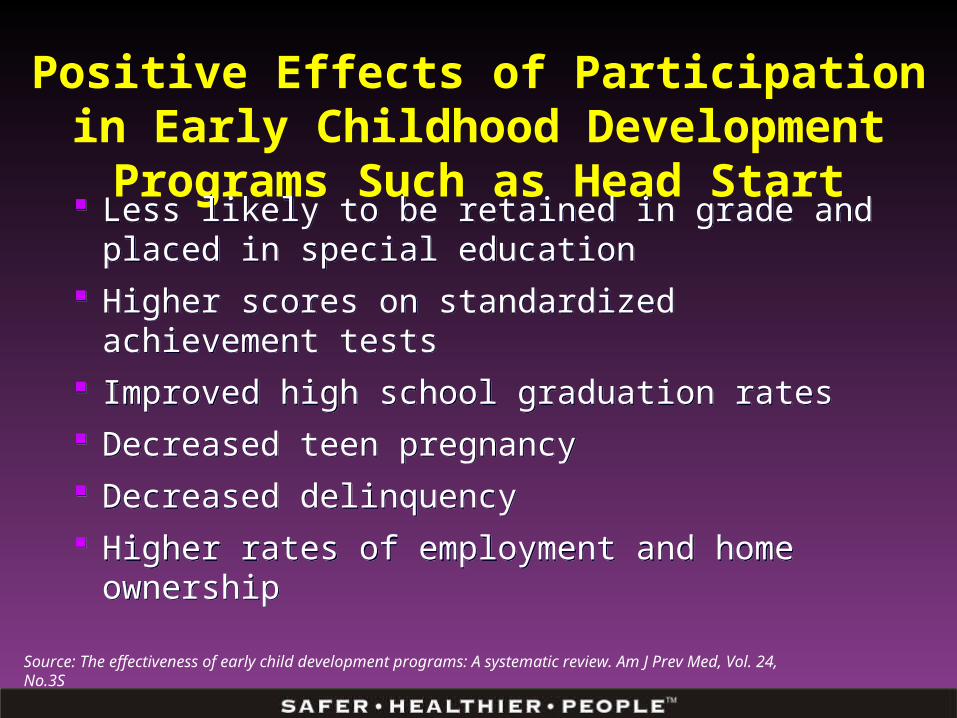
Positive Effects of Participation in Early Childhood Development Programs Such as Head Start
Less likely to be retained in grade and placed in special education
Higher scores on standardized achievement tests Improved high school graduation rates Decreased teen pregnancy Decreased delinquency Higher rates of employment and home ownership
Less likely to be retained in grade and placed in special education
Higher scores on standardized achievement tests Improved high school graduation rates Decreased teen pregnancy Decreased delinquency Higher rates of employment and home ownership
Source: The effectiveness of early child development programs: A systematic review. Am J Prev Med, Vol. 24, No.3S
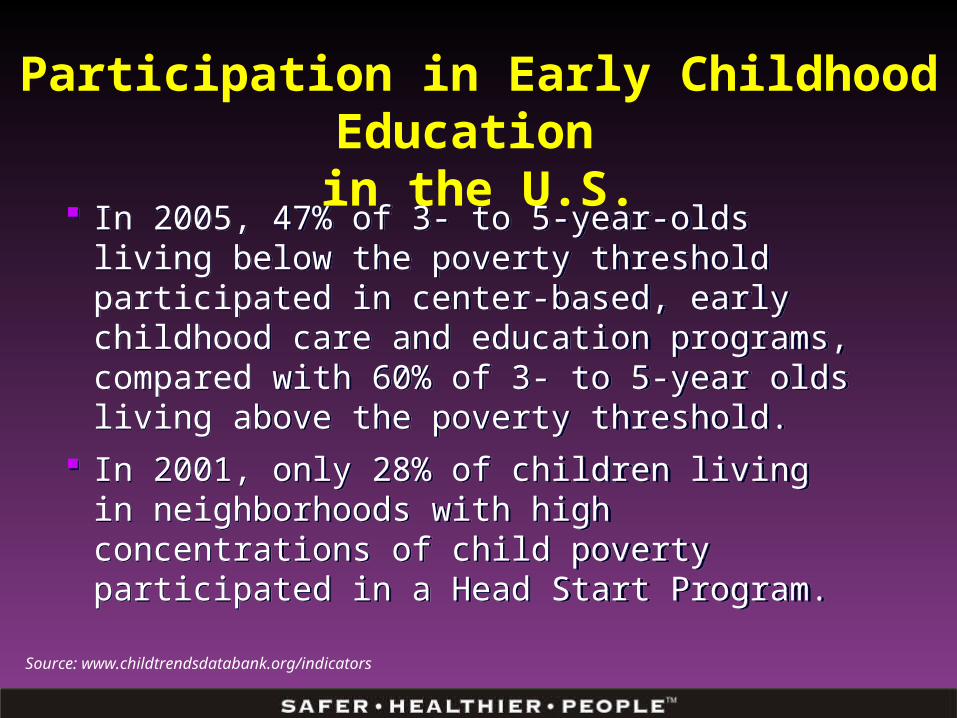
Participation in Early Childhood Education in the U.S.
In 2005, 47% of 3- to 5-year-olds living below the poverty threshold participated in center-based, early childhood care and education programs, compared with 60% of 3- to 5-year olds living above the poverty threshold.
In 2001, only 28% of children living in neighborhoods with high concentrations of child poverty participated in a Head Start Program.
Source: www.childtrendsdatabank.org/indicators
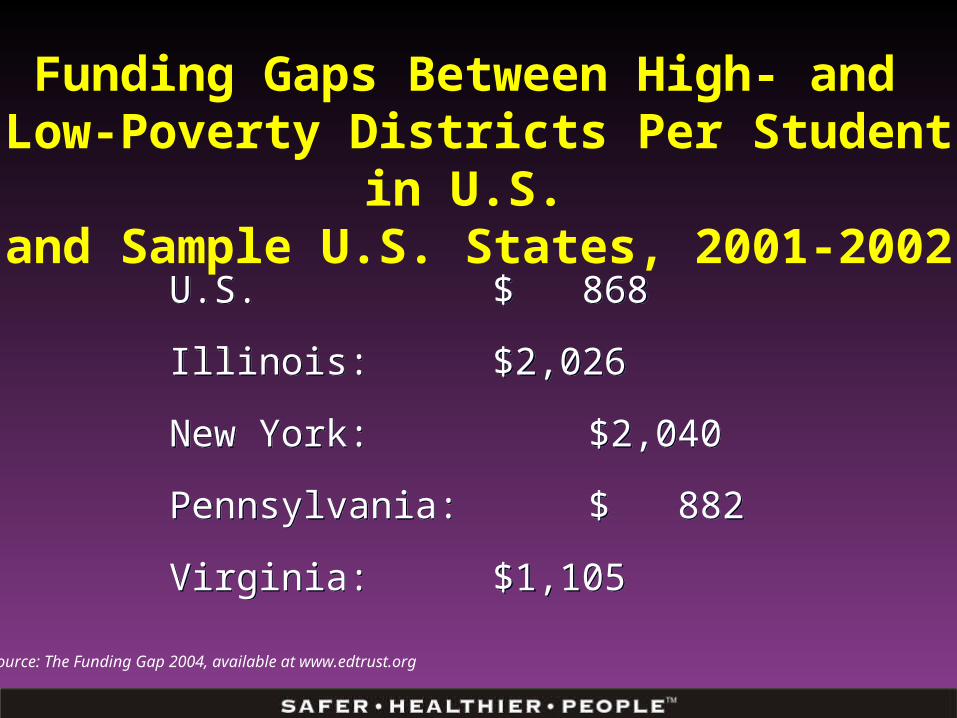
Funding Gaps Between High- and Low-Poverty Districts Per Student in U.S.
and Sample U.S. States, 2001-2002
U.S. $ 868
Illinois: $2,026
New York: $2,040
Pennsylvania: $ 882
Virginia: $1,105
U.S. $ 868
Illinois: $2,026
New York: $2,040
Pennsylvania: $ 882
Virginia: $1,105
Source: The Funding Gap 2004, available at www.edtrust.org
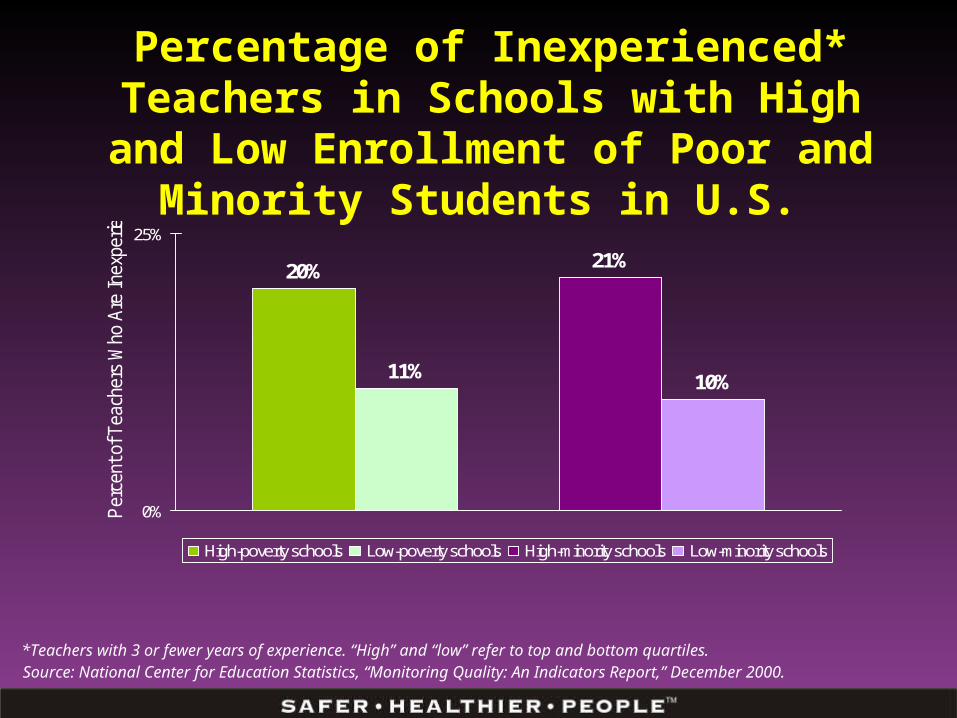
Percentage of Inexperienced* Teachers in Schools with High and Low Enrollment of Poor
and Minority Students in U.S.
20%
11%
21%
10%
0%
25%
Per
cent
of T
each
ers
Who
Are
Inex
perie
nced
High-poverty schools Low-poverty schools High-minority schools Low-minority schools
Source: National Center for Education Statistics, “Monitoring Quality: An Indicators Report,” December 2000.*Teachers with 3 or fewer years of experience. “High” and “low” refer to top and bottom quartiles.
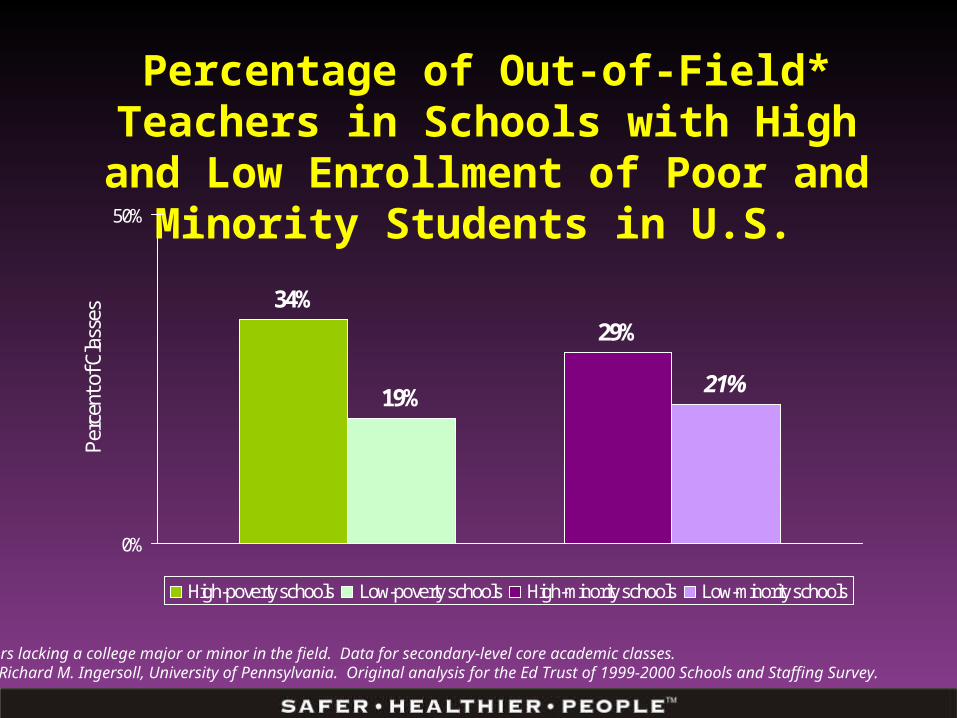
Percentage of Out-of-Field* Teachers in Schools with High and Low Enrollment of Poor
and Minority Students in U.S.
34%
19%
29%
21%
0%
50%
Perc
ent o
f Cla
sses
High-poverty schools Low-poverty schools High-minority schools Low-minority schools
*Teachers lacking a college major or minor in the field. Data for secondary-level core academic classes.Source: Richard M. Ingersoll, University of Pennsylvania. Original analysis for the Ed Trust of 1999-2000 Schools and Staffing Survey.
STRATEGY 1: Support Efforts to Reduce the Educational
Achievement Gap
STRATEGY 1: Support Efforts to Reduce the Educational
Achievement Gap
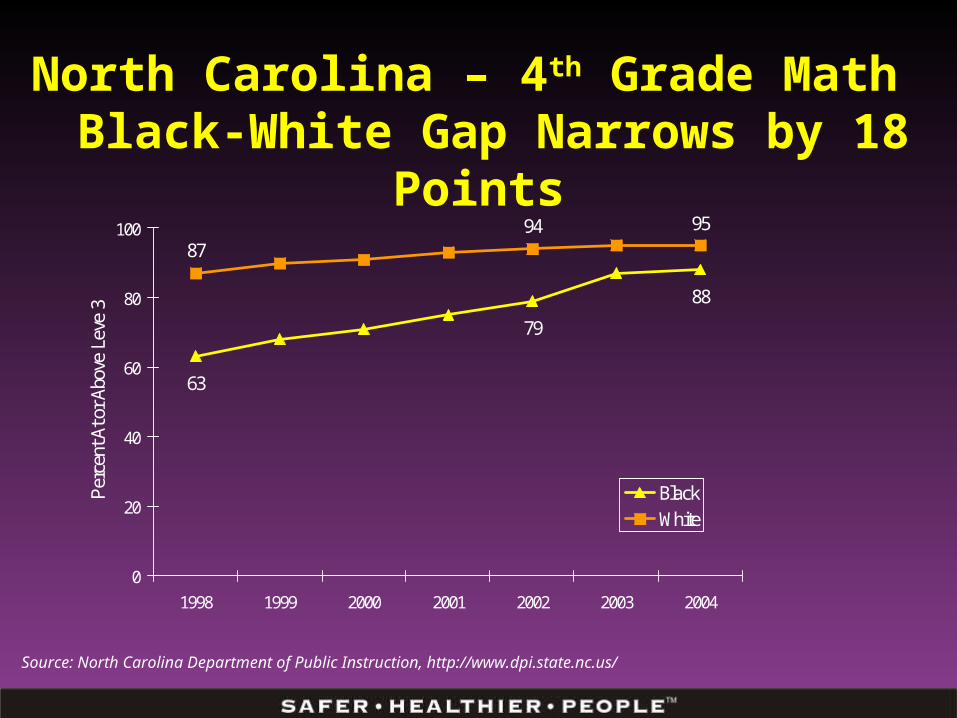
North Carolina – 4th Grade Math Black-White Gap Narrows by 18 Points
63
79
88
8794 95
0
20
40
60
80
100
1998 1999 2000 2001 2002 2003 2004
Perc
ent A
t or A
bove
Lev
e 3
BlackWhite
Source: North Carolina Department of Public Instruction, http://www.dpi.state.nc.us/
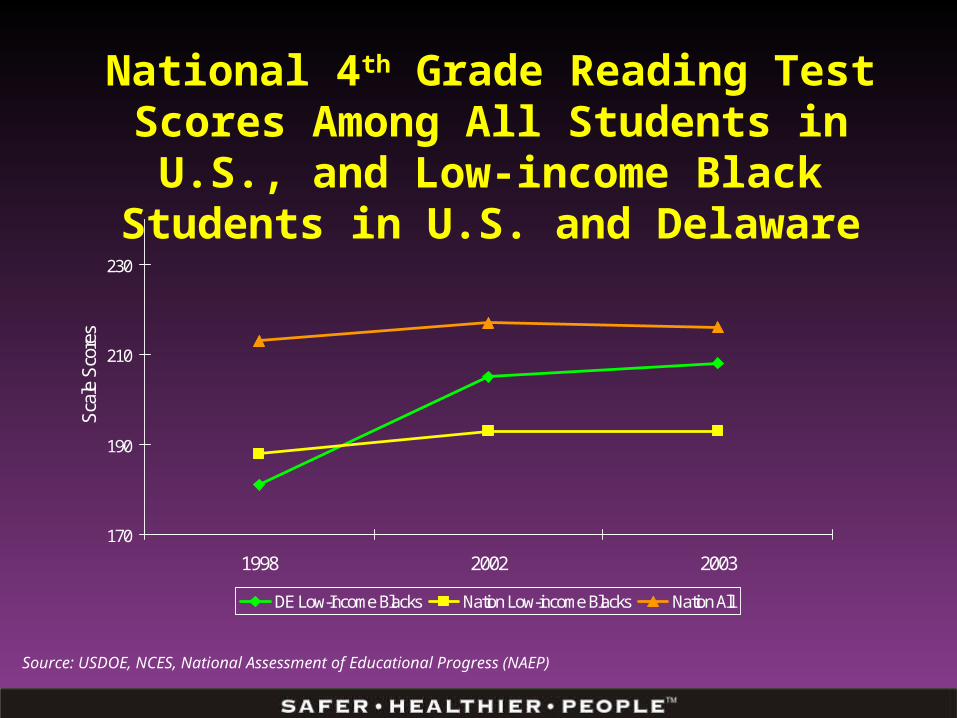
National 4th Grade Reading Test Scores Among All Students in U.S., and Low-income Black
Students in U.S. and Delaware
170
190
210
230
1998 2002 2003
Scal
e Sc
ores
DE Low-Income Blacks Nation Low-income Blacks Nation All
Source: USDOE, NCES, National Assessment of Educational Progress (NAEP)
What Can Make the Difference?
High-quality early childhood education
Rigorous, challenging curricula for all
Equitable distribution of funding and teacher talent
High-quality early childhood education
Rigorous, challenging curricula for all
Equitable distribution of funding and teacher talent
STRATEGY 2: Implement Effective School Health Programs
STRATEGY 2: Implement Effective School Health Programs
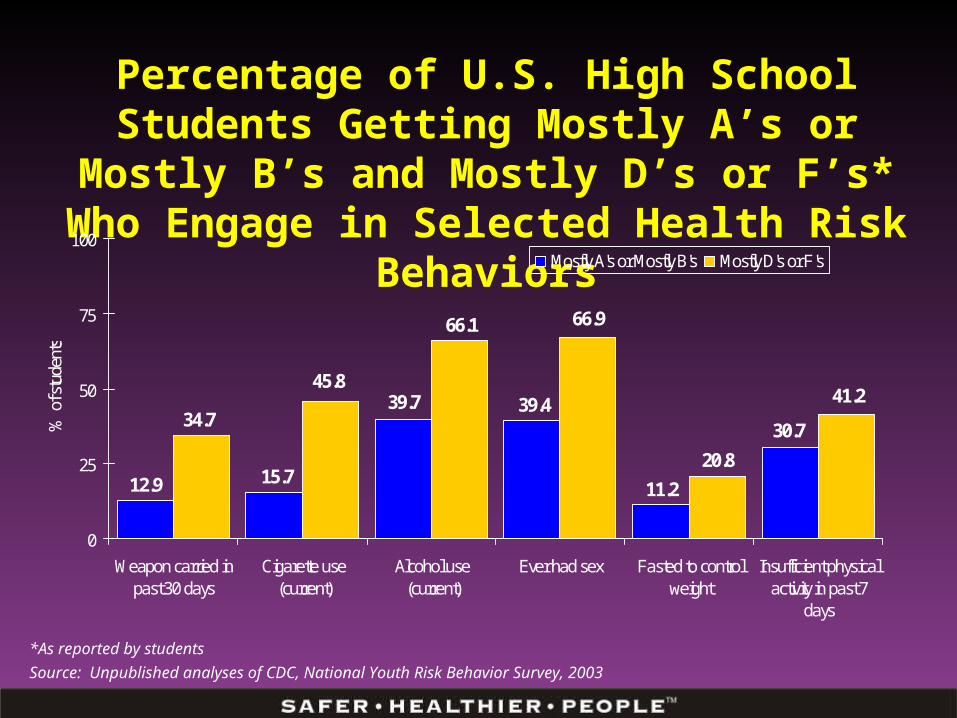
Percentage of U.S. High School Students Getting Mostly A’s or Mostly B’s and Mostly D’s or F’s*Who Engage in Selected Health Risk Behaviors
30.7
11.212.9
39.439.7
15.7
41.2
20.8
45.8
66.966.1
34.7
0
25
50
75
100
Weapon carried inpast 30 days
Cigarette use(current)
Alcohol use(current)
Ever had sex Fasted to controlweight
Insufficient physicalactivity in past 7
days
% o
f stu
dent
s
Mostly A's or Mostly B's Mostly D's or F's
Source: Unpublished analyses of CDC, National Youth Risk Behavior Survey, 2003
*As reported by students

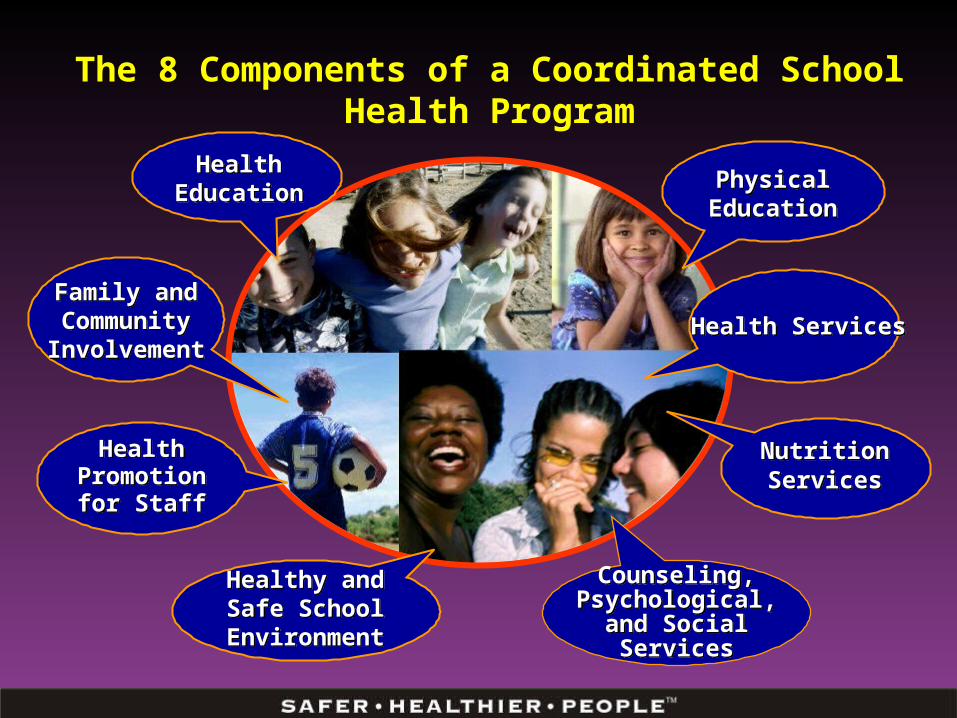
The 8 Components of a Coordinated School Health Program
Healthy and Safe School Environment
Healthy and Safe School Environment
HealthPromotion
for Staff
HealthPromotion
for Staff
Physical EducationPhysical EducationHealth EducationHealth Education
Health ServicesHealth Services
Counseling, Psychological, and
Social Services
Counseling, Psychological, and
Social Services
NutritionServicesNutritionServices
Family and Community Involvement
Family and Community Involvement
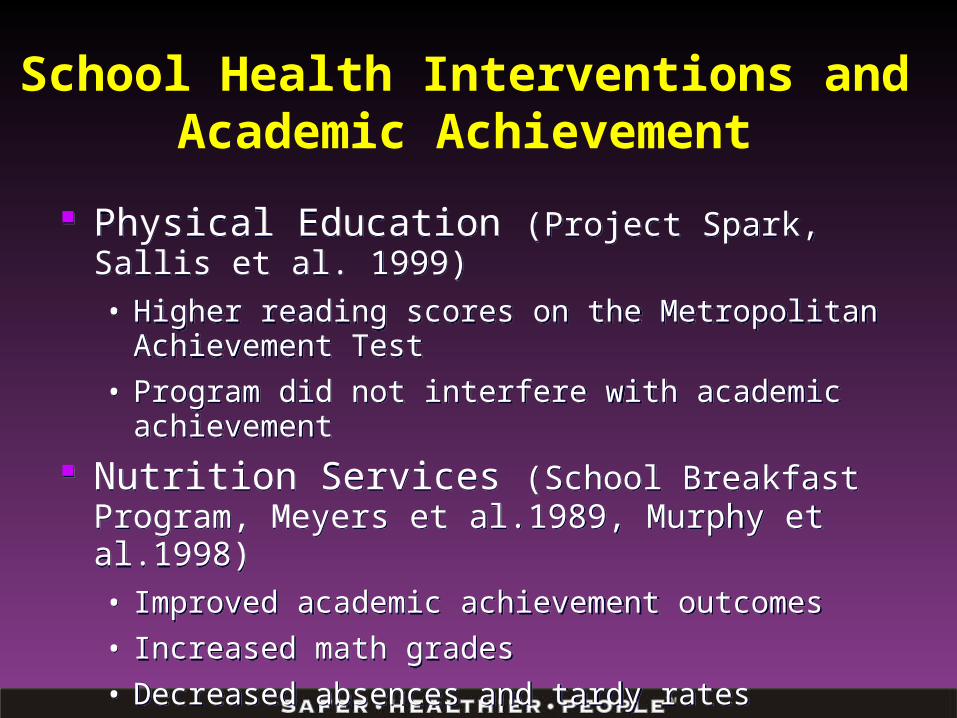
School Health Interventions and Academic Achievement
Physical Education (Project Spark, Sallis et al. 1999)• Higher reading scores on the Metropolitan Achievement Test • Program did not interfere with academic achievement
Nutrition Services (School Breakfast Program, Meyers et al.1989, Murphy et al.1998)• Improved academic achievement outcomes• Increased math grades• Decreased absences and tardy rates
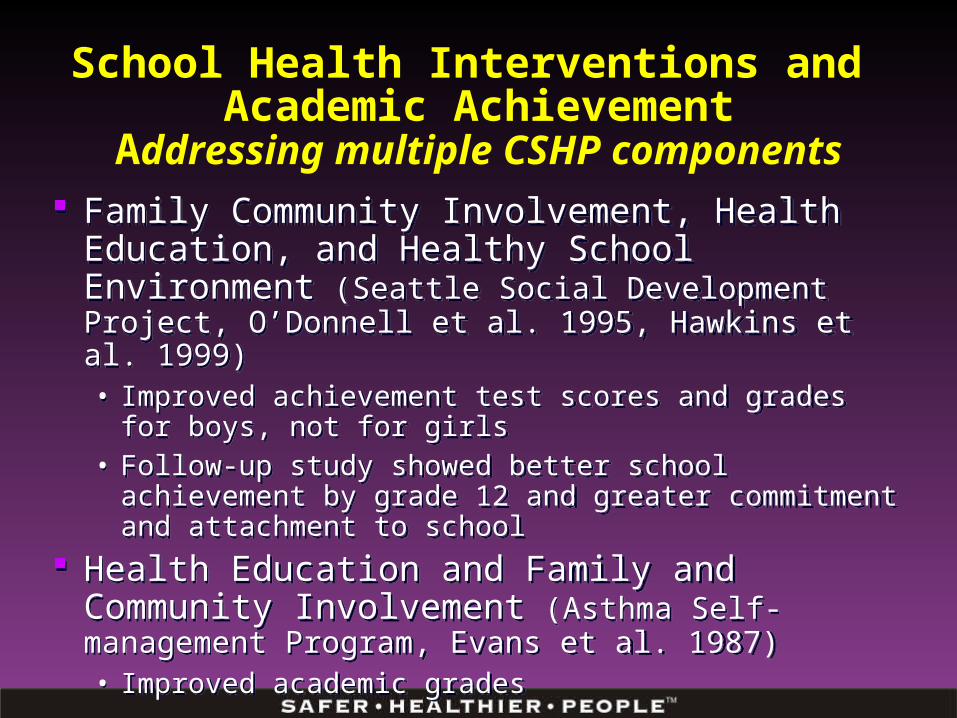
School Health Interventions and Academic Achievement
Addressing multiple CSHP components
Family Community Involvement, Health Education, and Healthy School Environment (Seattle Social Development Project, O’Donnell et al. 1995, Hawkins et al. 1999)• Improved achievement test scores and grades for boys, not for girls• Follow-up study showed better school achievement by grade 12
and greater commitment and attachment to school Health Education and Family and Community
Involvement (Asthma Self-management Program, Evans et al. 1987)• Improved academic grades
35
Making the Connection: Health
and Student Achievement
www.thesociety.org
Society of State Directors of Health, Physical Education and Recreation (SSDHPER)
© 2002 Association of State and Territorial Health Officials (ASTHO) and the Society of State Directors of Health, Physical Education and Recreation (SSDHPER)
Association of State andTerritorial Health Officials (ASTHO)
STRATEGY 3: Promote Collaboration Across the Health and
Education Sectors
STRATEGY 3: Promote Collaboration Across the Health and
Education Sectors
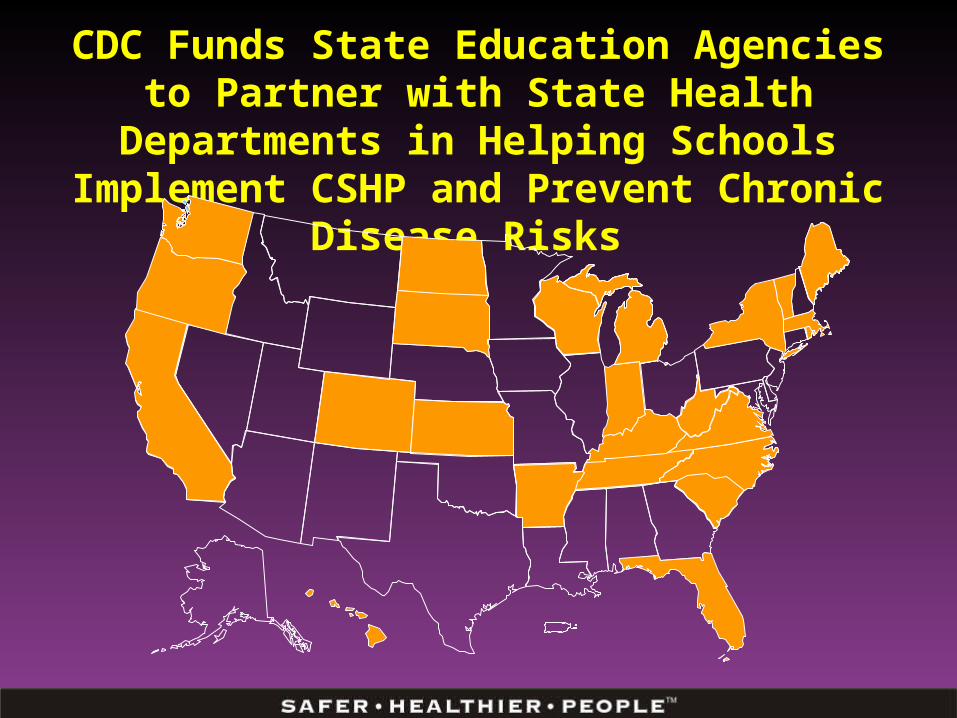
CDC Funds State Education Agencies to Partner with State Health Departments in Helping Schools
Implement CSHP and Prevent Chronic Disease Risks
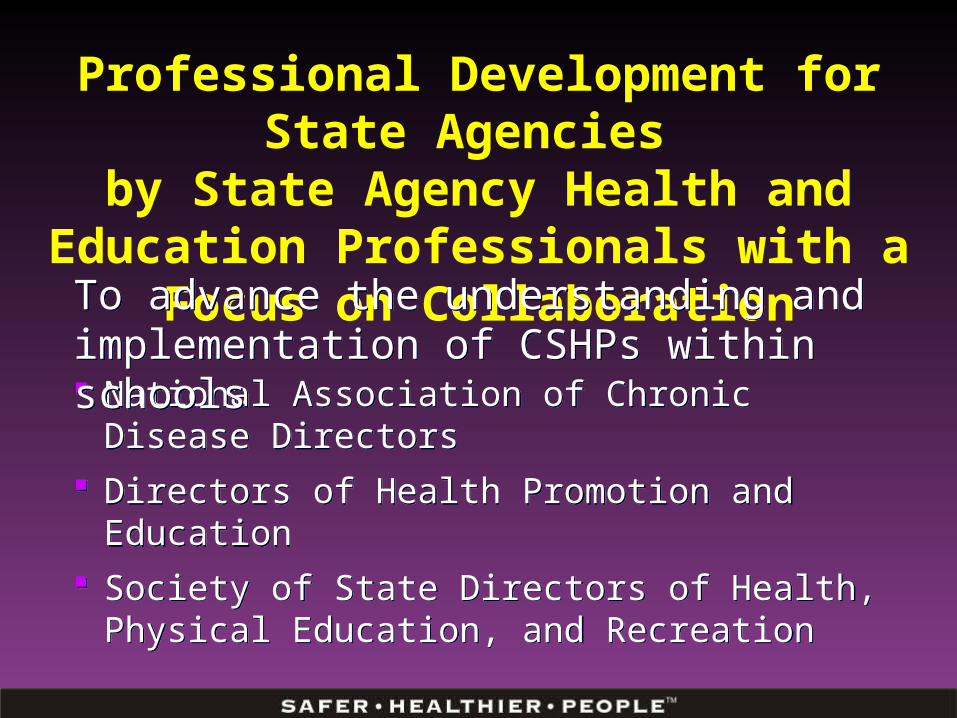
Professional Development for State Agencies by State Agency Health and Education
Professionals with a Focus on Collaboration
National Association of Chronic Disease Directors Directors of Health Promotion and Education Society of State Directors of Health, Physical
Education, and Recreation
National Association of Chronic Disease Directors Directors of Health Promotion and Education Society of State Directors of Health, Physical
Education, and Recreation
To advance the understanding and implementation of CSHPs within schoolsTo advance the understanding and implementation of CSHPs within schools
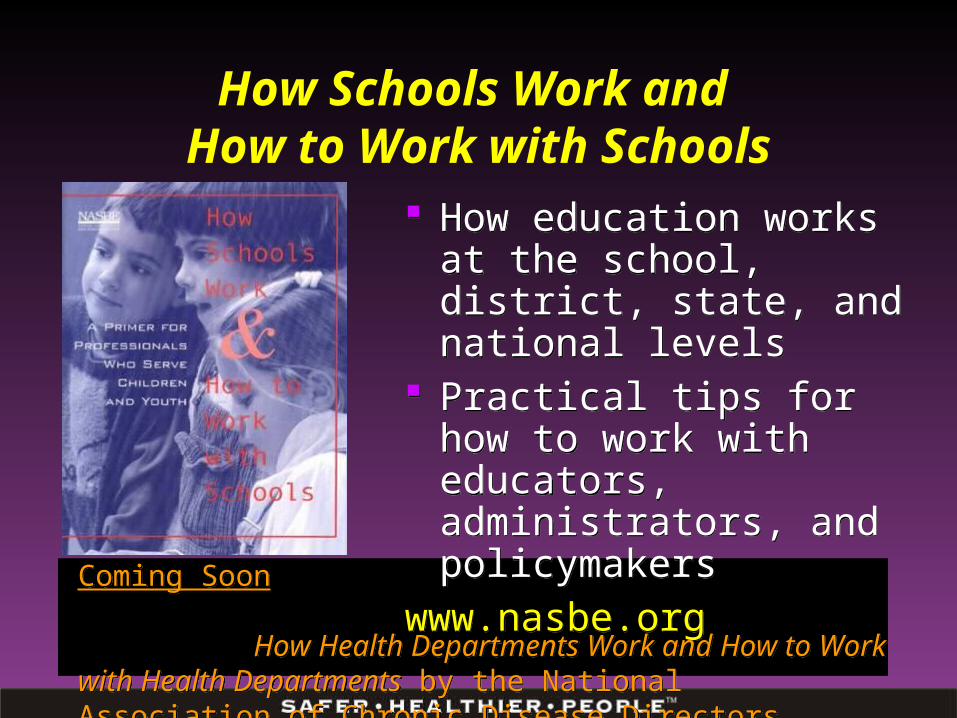
How Schools Work and How to Work with Schools
How education works at the school, district, state, and national levels
Practical tips for how to work with educators, administrators, and policymakers
www.nasbe.org
How education works at the school, district, state, and national levels
Practical tips for how to work with educators, administrators, and policymakers
www.nasbe.org
Coming Soon How Health Departments Work and How to Work with Health Departments by the National Association of Chronic Disease Directors
Coming Soon How Health Departments Work and How to Work with Health Departments by the National Association of Chronic Disease Directors
STRATEGY 4: Promote a Coordinated
Approach to School Health
STRATEGY 4: Promote a Coordinated
Approach to School Health
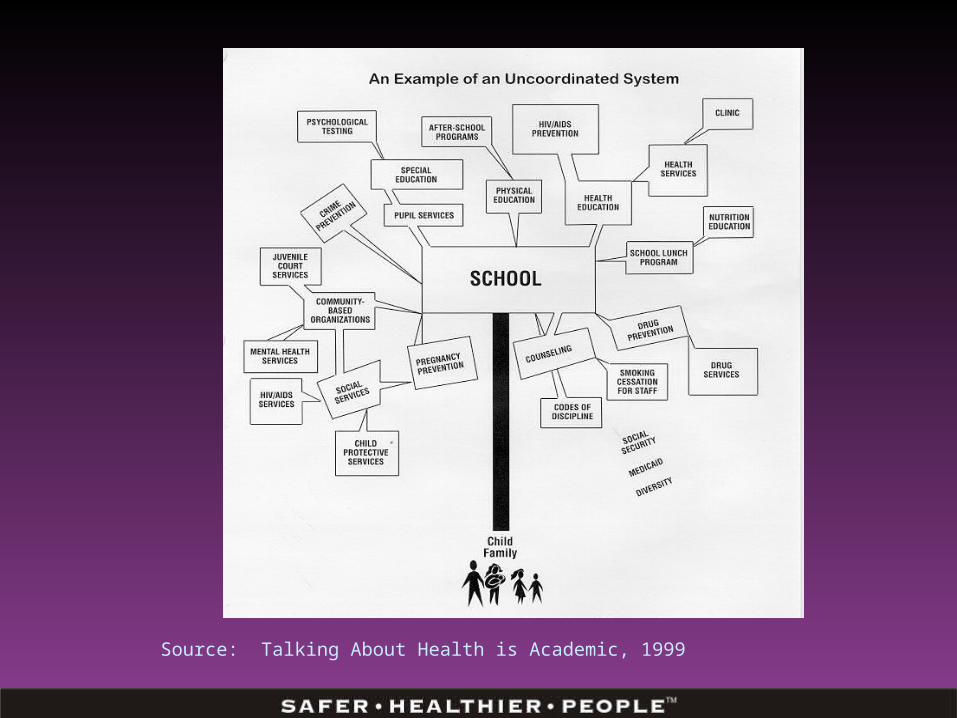
Source: Talking About Health is Academic, 1999
The 8 Components of a Coordinated School Health Program
Healthy and Safe School Environment
Healthy and Safe School Environment
HealthPromotion
for Staff
HealthPromotion
for Staff
Physical EducationPhysical EducationHealth EducationHealth Education
Health ServicesHealth Services
Counseling, Psychological, and
Social Services
Counseling, Psychological, and
Social Services
NutritionServicesNutritionServices
Family and Community Involvement
Family and Community Involvement
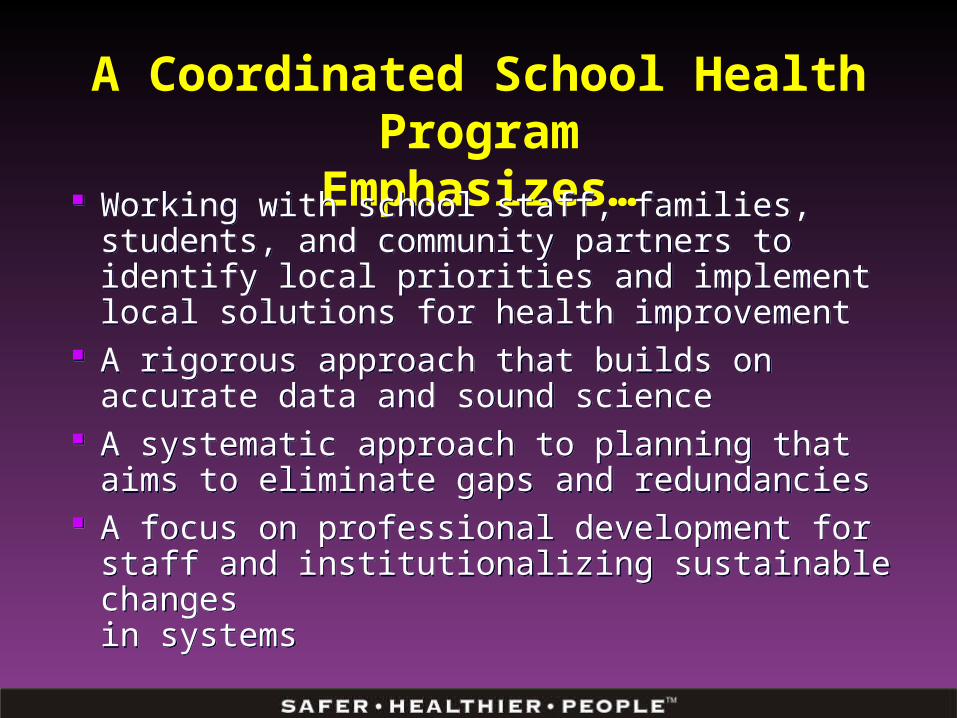
A Coordinated School Health ProgramEmphasizes…
Working with school staff, families, students, and community partners to identify local priorities and implement local solutions for health improvement
A rigorous approach that builds on accurate data and sound science
A systematic approach to planning that aims to eliminate gaps and redundancies
A focus on professional development for staff and institutionalizing sustainable changes in systems
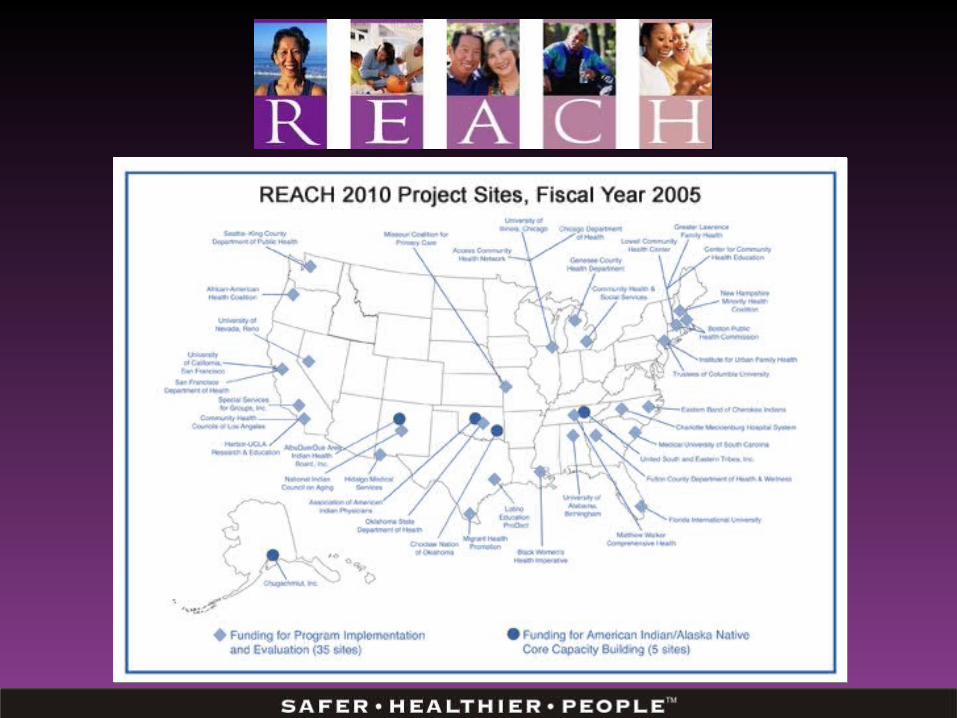
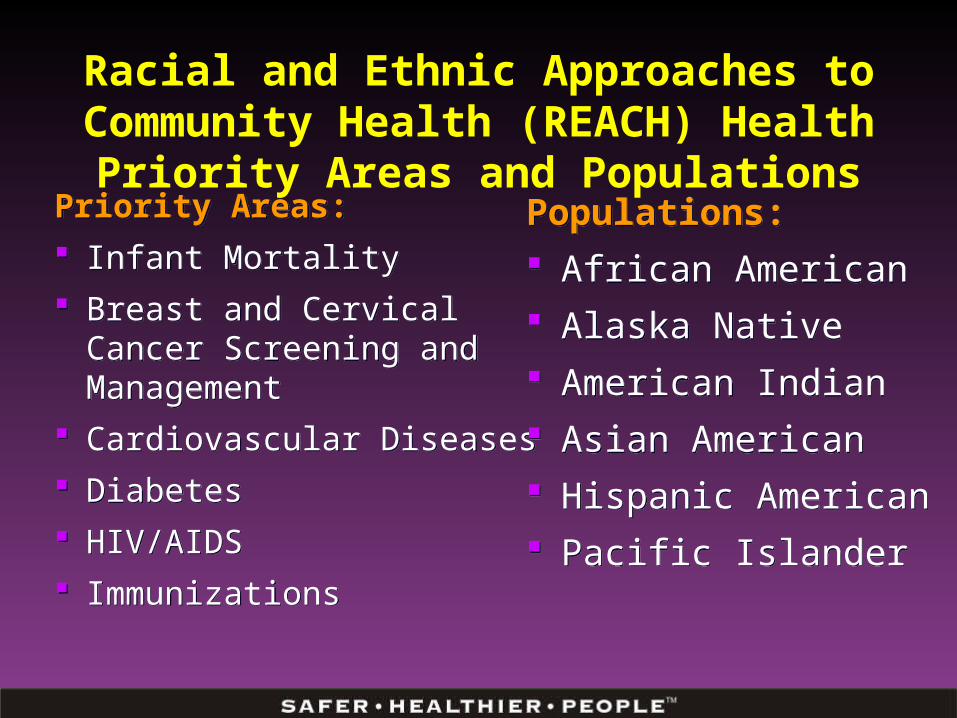
Racial and Ethnic Approaches to Community Health (REACH) Health Priority Areas and Populations
Priority Areas: Infant Mortality Breast and Cervical Cancer
Screening and Management Cardiovascular Diseases Diabetes HIV/AIDS Immunizations
Priority Areas: Infant Mortality Breast and Cervical Cancer
Screening and Management Cardiovascular Diseases Diabetes HIV/AIDS Immunizations
Populations: African American Alaska Native American Indian Asian American Hispanic American Pacific Islander
Populations: African American Alaska Native American Indian Asian American Hispanic American Pacific Islander
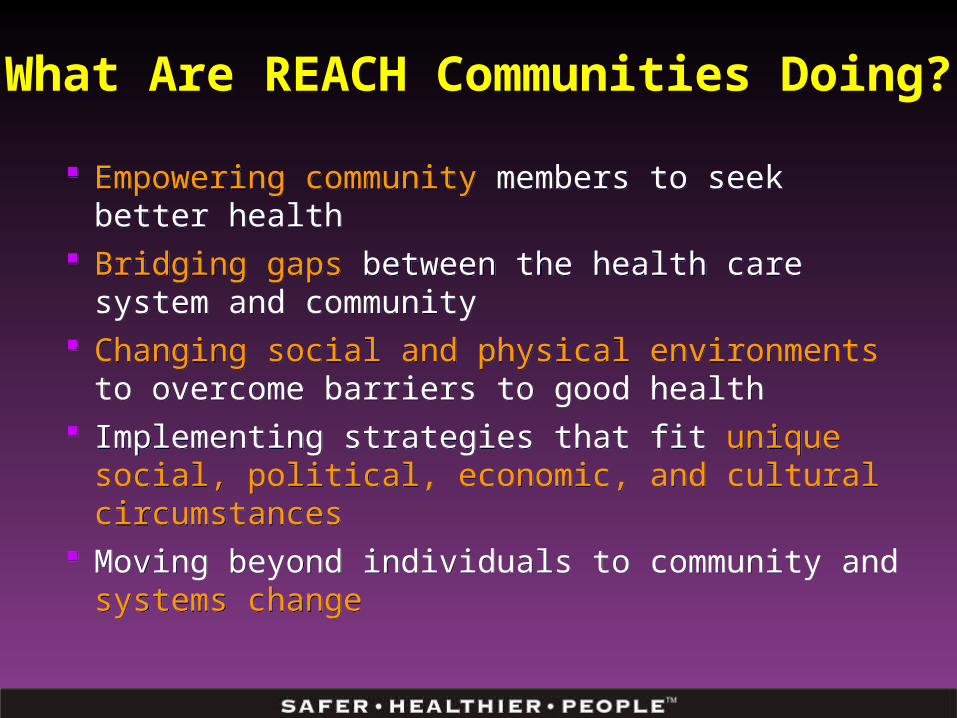
What Are REACH Communities Doing?
Empowering community members to seek better health Bridging gaps between the health care system and
community Changing social and physical environments to overcome
barriers to good health Implementing strategies that fit unique social, political,
economic, and cultural circumstances Moving beyond individuals to community and systems
change
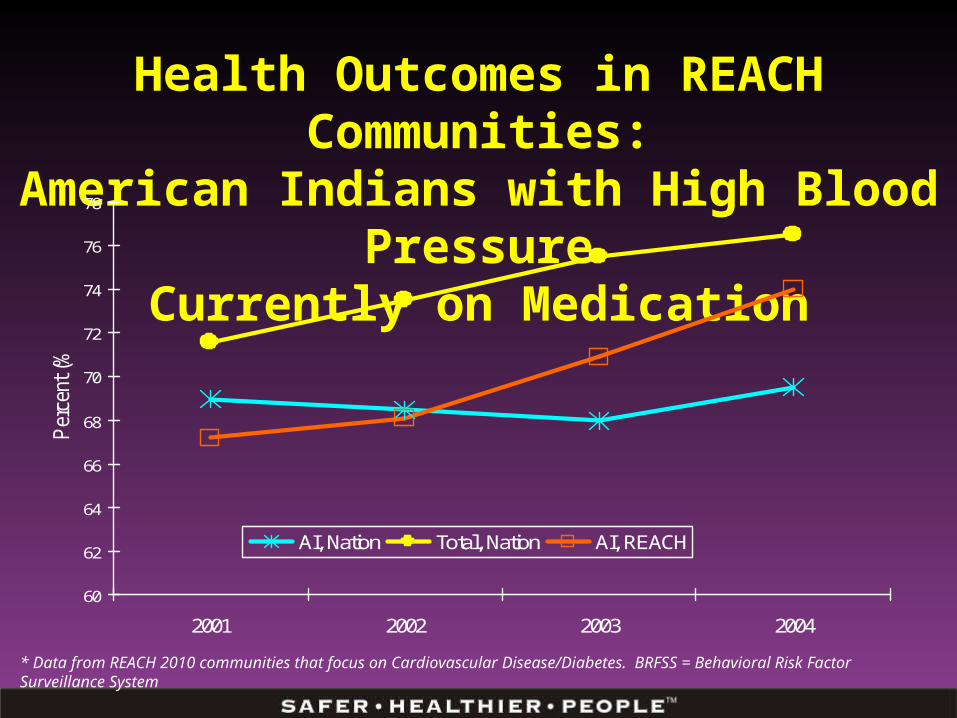
Health Outcomes in REACH Communities:American Indians with High Blood Pressure
Currently on Medication
60
62
64
66
68
70
72
74
76
78
2001 2002 2003 2004
Per
cent
(%)
AI, Nation Total, Nation AI, REACH
* Data from REACH 2010 communities that focus on Cardiovascular Disease/Diabetes. BRFSS = Behavioral Risk Factor Surveillance System
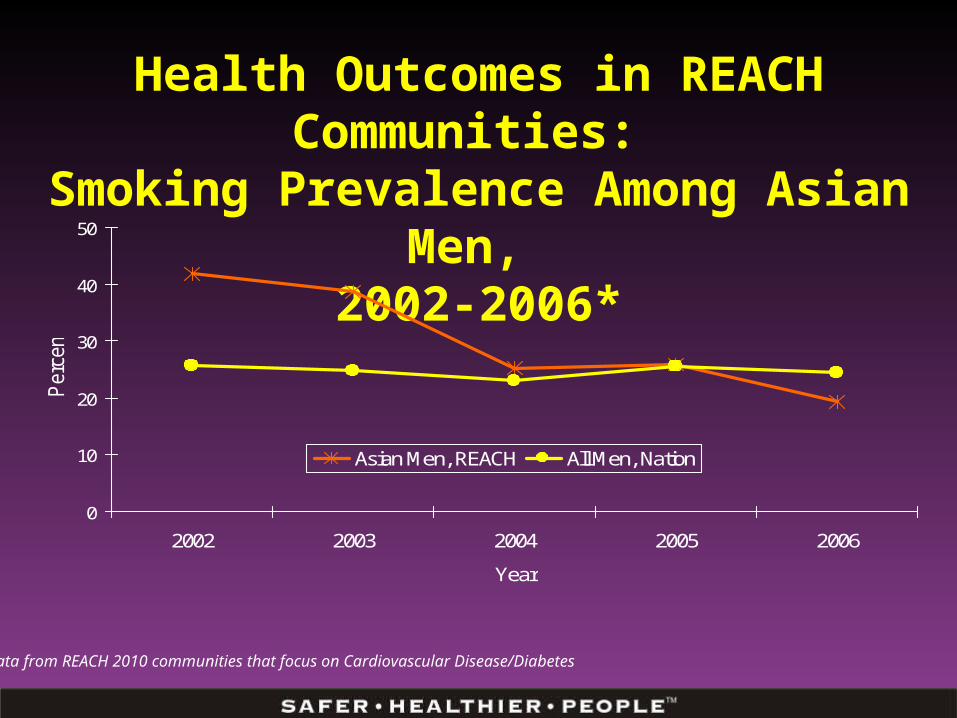
Health Outcomes in REACH Communities: Smoking Prevalence Among Asian Men,
2002-2006*
0
10
20
30
40
50
2002 2003 2004 2005 2006
Year
Per
cent
Asian Men, REACH All Men, Nation
* Data from REACH 2010 communities that focus on Cardiovascular Disease/Diabetes
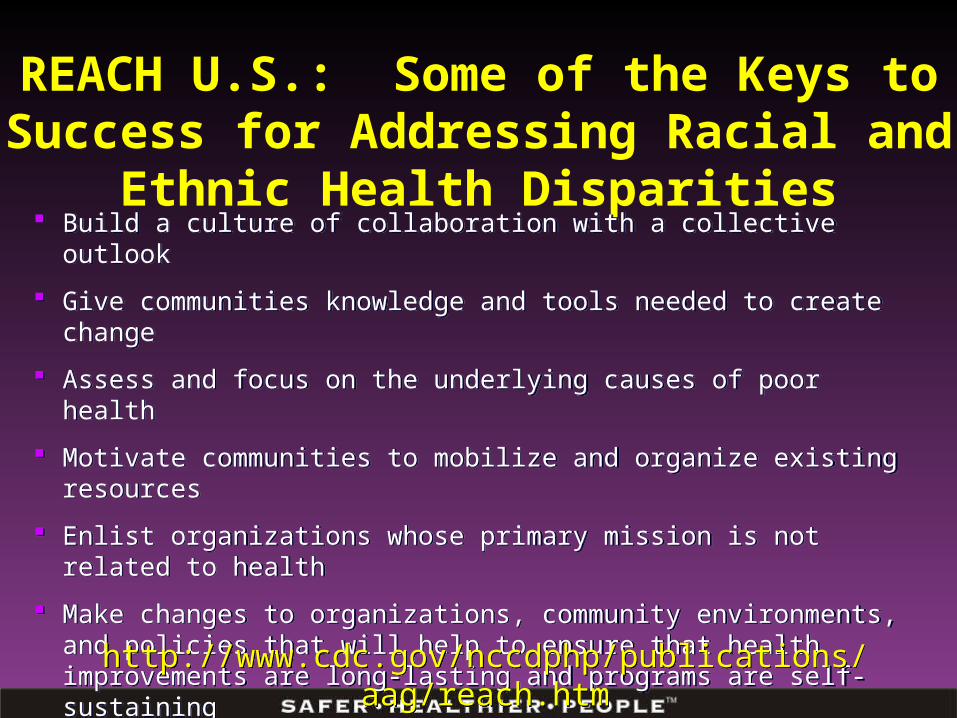
REACH U.S.: Some of the Keys to Success for Addressing Racial and Ethnic Health Disparities
Build a culture of collaboration with a collective outlook
Give communities knowledge and tools needed to create change
Assess and focus on the underlying causes of poor health
Motivate communities to mobilize and organize existing resources
Enlist organizations whose primary mission is not related to health
Make changes to organizations, community environments, and policies that will help to ensure that health improvements are long-lasting and programs are self-sustaining
http://www.cdc.gov/nccdphp/publications/aag/reach.htmhttp://www.cdc.gov/nccdphp/publications/aag/reach.htm
STRATEGY 5:Address Root Causes
STRATEGY 5:Address Root Causes
…Such as School Connectedness…Such as School Connectedness

Definition of School Connectedness
School Connectedness (n.)
The belief by students that adults and peers in the school care about their learning as well as about them as individuals.
School Connectedness (n.)
The belief by students that adults and peers in the school care about their learning as well as about them as individuals.
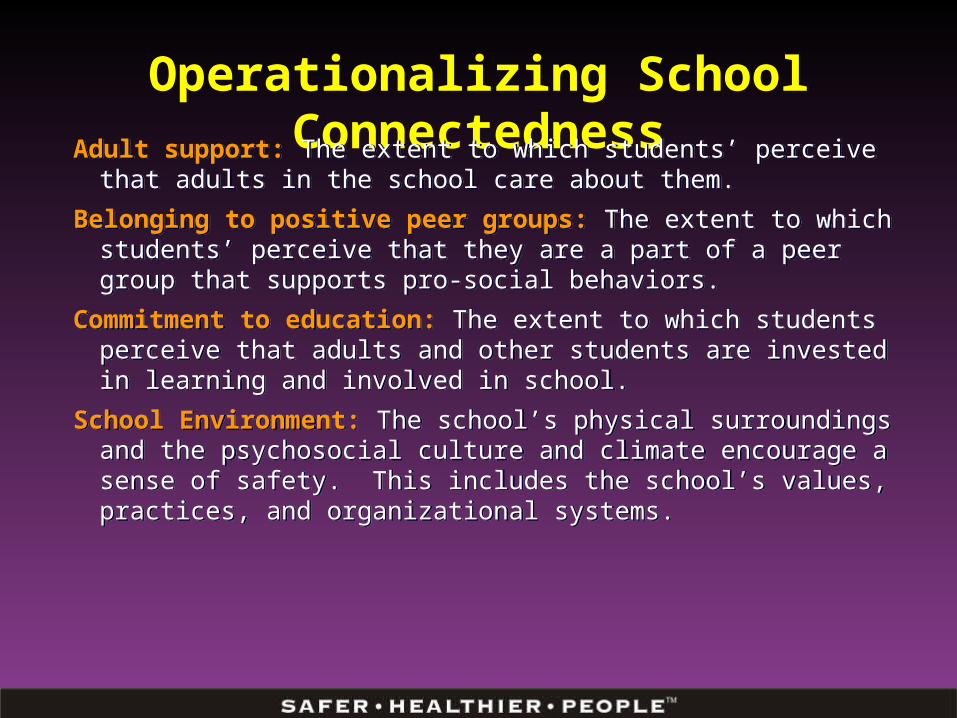
Operationalizing School Connectedness
Adult support: The extent to which students’ perceive that adults in the school care about them.
Belonging to positive peer groups: The extent to which students’ perceive that they are a part of a peer group that supports pro-social behaviors.
Commitment to education: The extent to which students perceive that adults and other students are invested in learning and involved in school.
School Environment: The school’s physical surroundings and the psychosocial culture and climate encourage a sense of safety. This includes the school’s values, practices, and organizational systems.
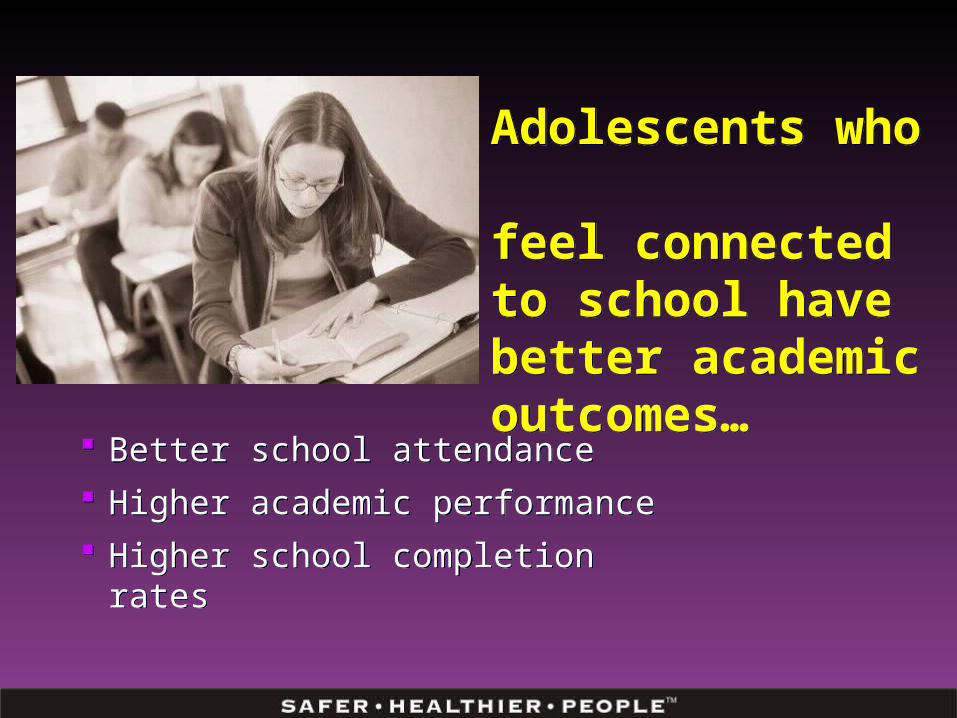
Adolescents who feel connected to school have better academic outcomes…
Adolescents who feel connected to school have better academic outcomes…
Better school attendance Higher academic performance Higher school completion rates
Better school attendance Higher academic performance Higher school completion rates
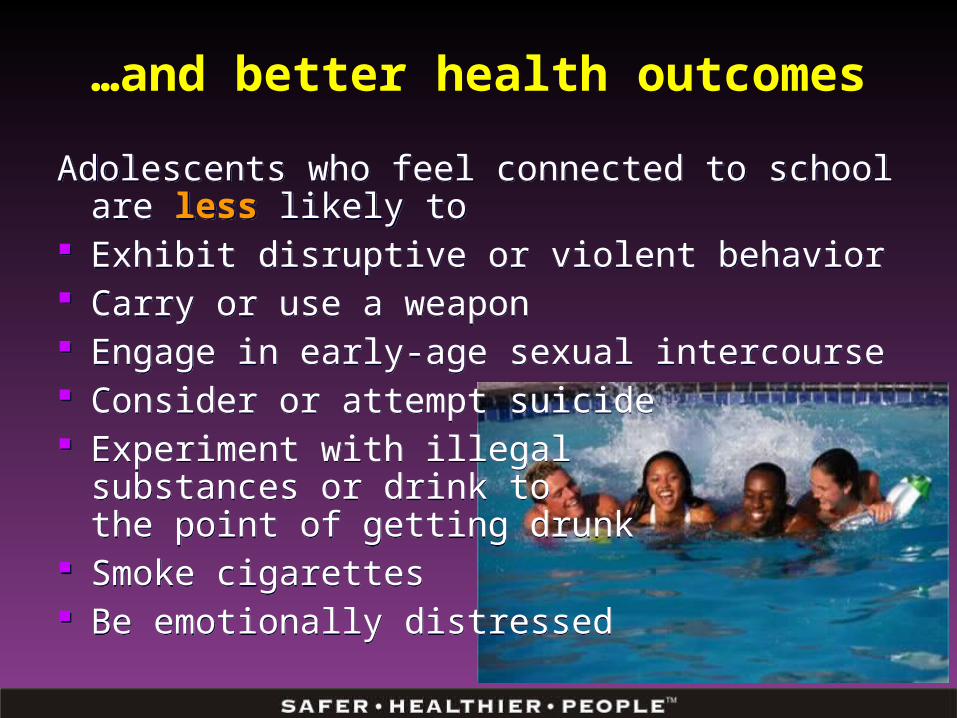
…and better health outcomes
Adolescents who feel connected to school are less likely to Exhibit disruptive or violent behavior Carry or use a weapon Engage in early-age sexual intercourse Consider or attempt suicide Experiment with illegal
substances or drink to the point of getting drunk
Smoke cigarettes Be emotionally distressed
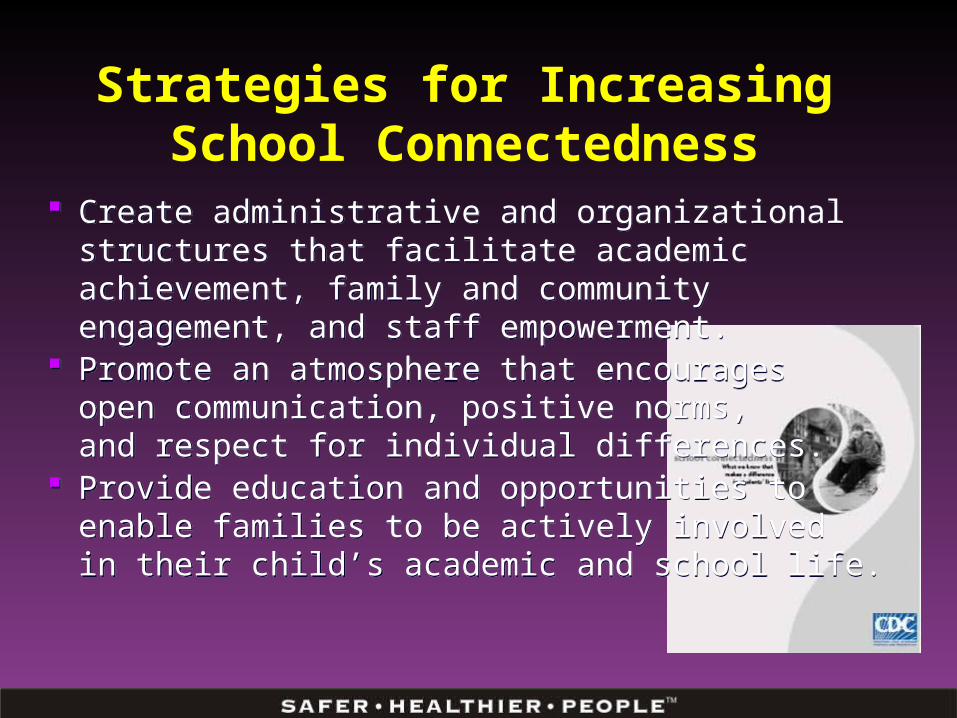
Strategies for Increasing School Connectedness
Create administrative and organizational structures that facilitate academic achievement, family and community engagement, and staff empowerment.
Promote an atmosphere that encouragesopen communication, positive norms, and respect for individual differences.
Provide education and opportunities to enable families to be actively involved in their child’s academic and school life.
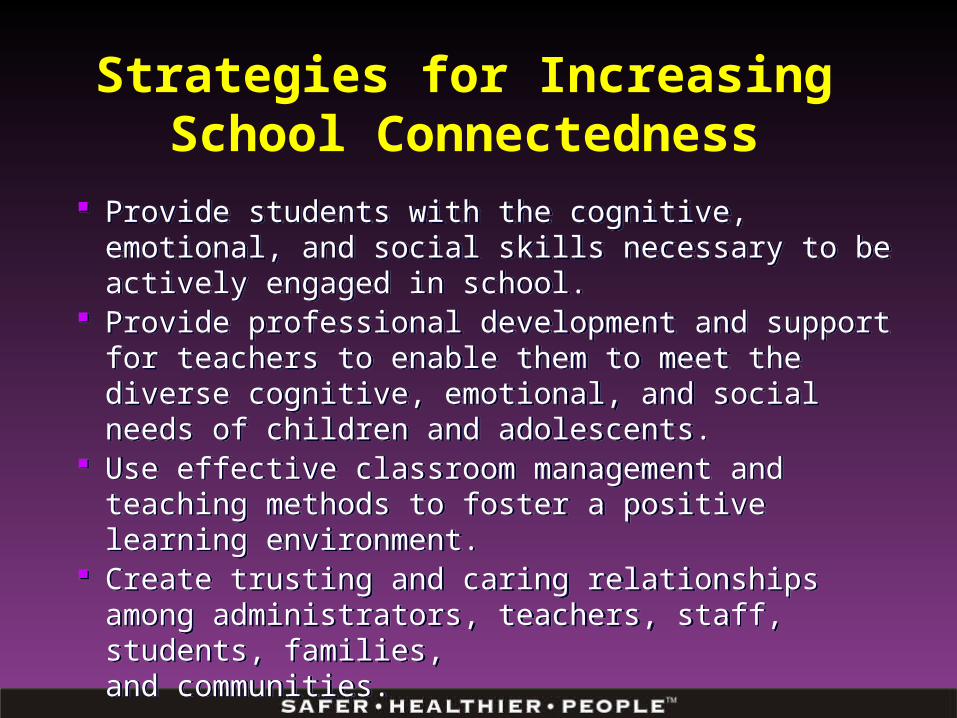
Strategies for Increasing School Connectedness
Provide students with the cognitive, emotional, and social skills necessary to be actively engaged in school.
Provide professional development and support for teachers to enable them to meet the diverse cognitive, emotional, and social needs of children and adolescents.
Use effective classroom management and teaching methods to foster a positive learning environment.
Create trusting and caring relationships among administrators, teachers, staff, students, families, and communities.
STRATEGY 6:Implement Effective
Out-of-School Time Programs
STRATEGY 6:Implement Effective
Out-of-School Time Programs
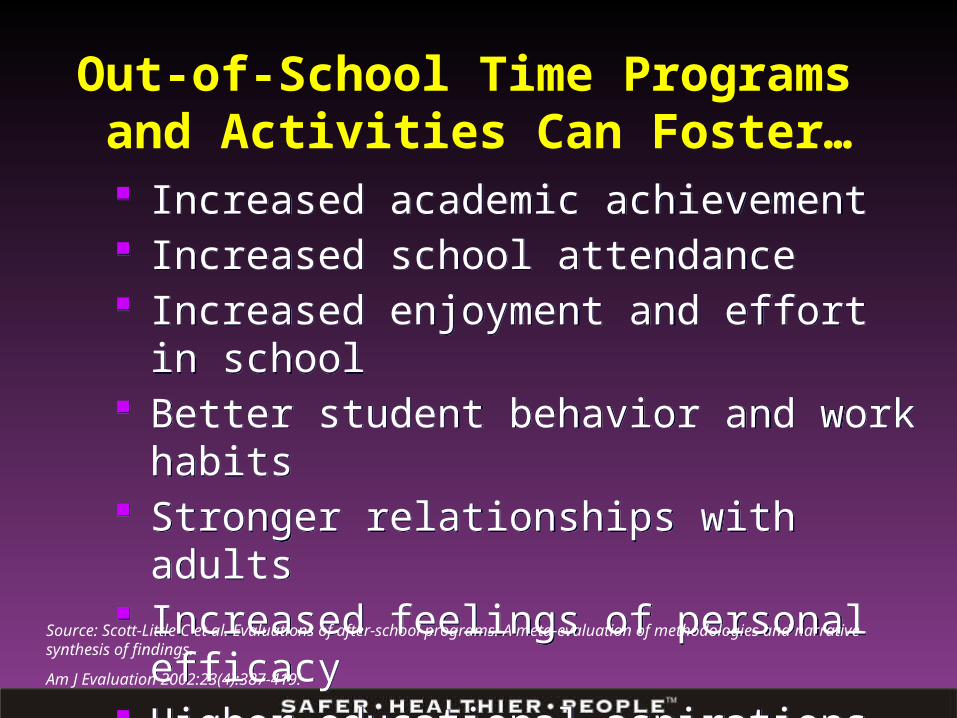
Out-of-School Time Programs and Activities Can Foster…
Increased academic achievement Increased school attendance Increased enjoyment and effort in school Better student behavior and work habits Stronger relationships with adults Increased feelings of personal efficacy Higher educational aspirations
Increased academic achievement Increased school attendance Increased enjoyment and effort in school Better student behavior and work habits Stronger relationships with adults Increased feelings of personal efficacy Higher educational aspirations
Source: Scott-Little C et al. Evaluations of after-school programs: A meta-evaluation of methodologies and narrative synthesis of findings.
Am J Evaluation 2002:23(4):387-419.
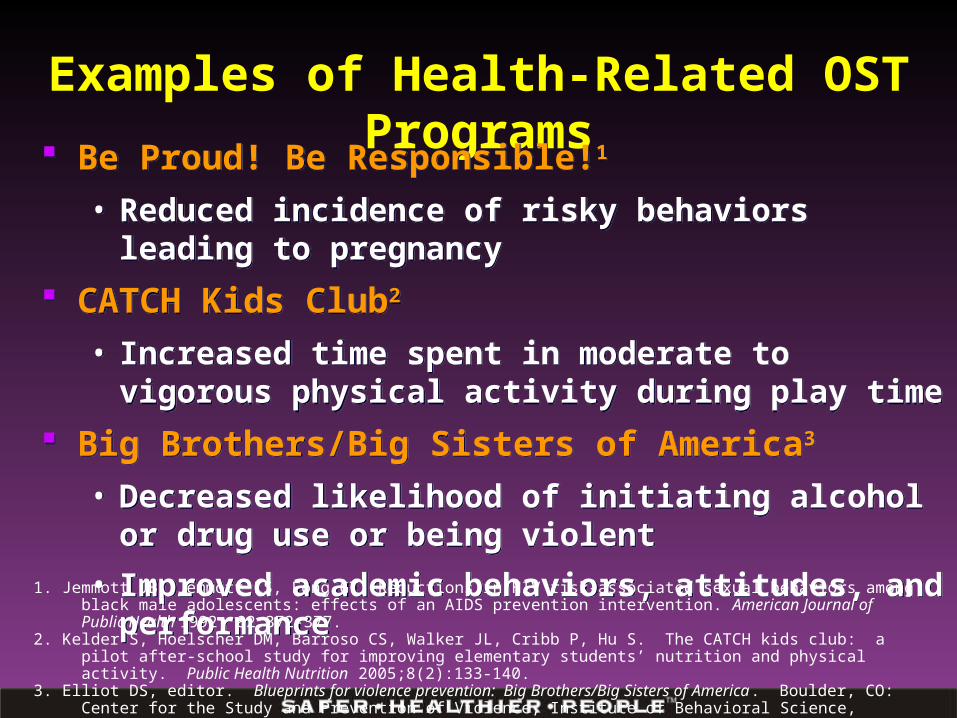
Examples of Health-Related OST Programs
Be Proud! Be Responsible!1 • Reduced incidence of risky behaviors leading to pregnancy
CATCH Kids Club2
• Increased time spent in moderate to vigorous physical activity during play time
Big Brothers/Big Sisters of America3
• Decreased likelihood of initiating alcohol or drug use or being violent
• Improved academic behaviors, attitudes, and performance
Be Proud! Be Responsible!1 • Reduced incidence of risky behaviors leading to pregnancy
CATCH Kids Club2
• Increased time spent in moderate to vigorous physical activity during play time
Big Brothers/Big Sisters of America3
• Decreased likelihood of initiating alcohol or drug use or being violent
• Improved academic behaviors, attitudes, and performance1. Jemmott JB, Jemmott LS, Fong GT. Reductions in HIV risk-associated sexual behaviors among black male adolescents: effects of an AIDS
prevention intervention. American Journal of Public Health 1992; 82:372-377. 2. Kelder S, Hoelscher DM, Barroso CS, Walker JL, Cribb P, Hu S. The CATCH kids club: a pilot after-school study for improving elementary students’
nutrition and physical activity. Public Health Nutrition 2005;8(2):133-140.3. Elliot DS, editor. Blueprints for violence prevention: Big Brothers/Big Sisters of America . Boulder, CO: Center for the Study and Prevention of
Violence, Institute of Behavioral Science, University of Colorado, 1997.
STRATEGY 7:Promote Family and
Community Involvement
STRATEGY 7:Promote Family and
Community Involvement
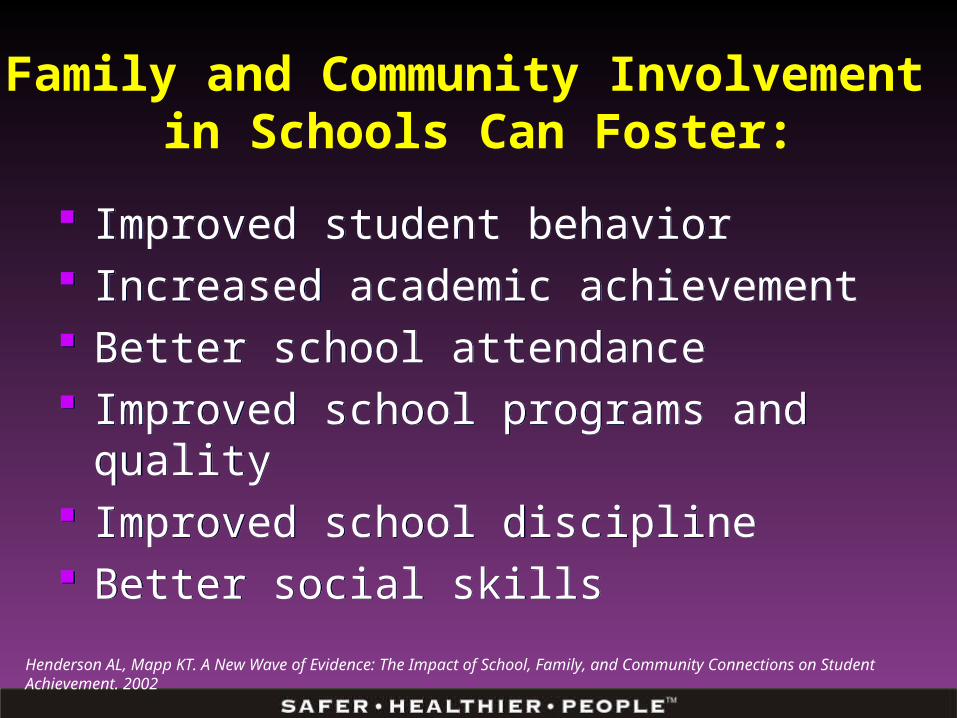
Family and Community Involvement in Schools Can Foster:
Improved student behavior Increased academic achievement Better school attendance Improved school programs and quality Improved school discipline Better social skills
Improved student behavior Increased academic achievement Better school attendance Improved school programs and quality Improved school discipline Better social skills
Henderson AL, Mapp KT. A New Wave of Evidence: The Impact of School, Family, and Community Connections on Student Achievement. 2002
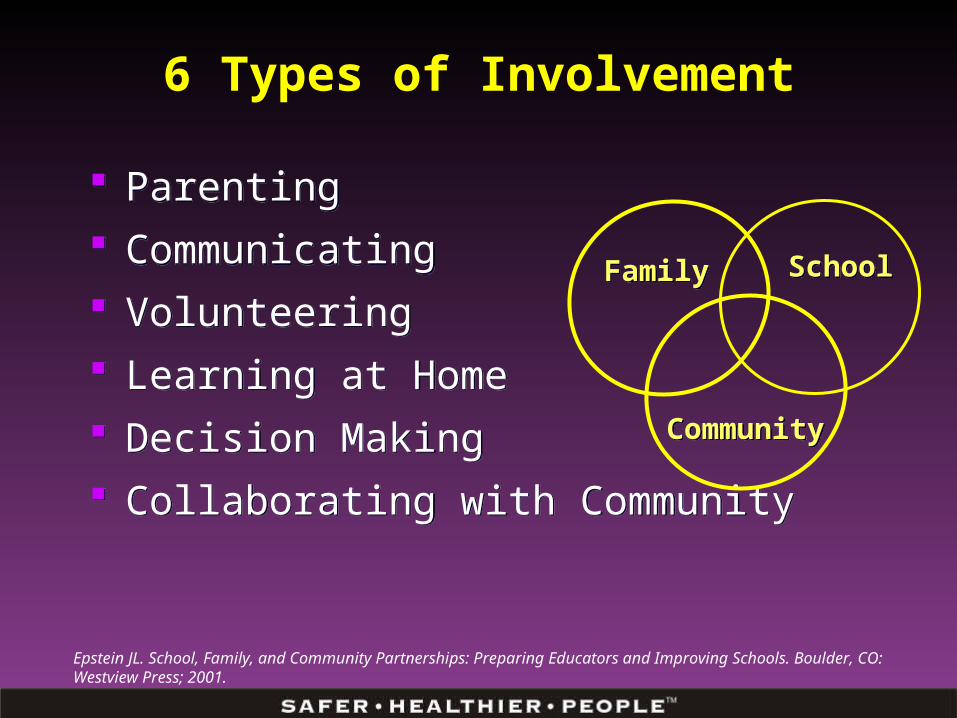
6 Types of Involvement
Parenting Communicating Volunteering Learning at Home Decision Making Collaborating with Community
Parenting Communicating Volunteering Learning at Home Decision Making Collaborating with Community
SchoolSchoolFamilyFamily
CommunityCommunity
Epstein JL. School, Family, and Community Partnerships: Preparing Educators and Improving Schools. Boulder, CO: Westview Press; 2001.
Strategies for Family and Community Involvement
1. Have a Vision and Communicate it Build strong connections between schools and
community organizations Provide families and community members with
information about how to be involved in a range of ways Make sure all understand that the responsibility for
children’s education is a collaborative enterprise
Adapted from Henderson AL, Mapp KT. A New Wave of Evidence: The Impact of School, Family, and Community Connections on Student Achievement. 2002
Strategies for Family and Community Involvement
2. Create Capacity Develop the capacity of school staff to work with
families and community members Give teachers time to plan and organize family and
community activities Create programs that will support families to guide their
children’s learning, from preschool through high school
2. Create Capacity Develop the capacity of school staff to work with
families and community members Give teachers time to plan and organize family and
community activities Create programs that will support families to guide their
children’s learning, from preschool through high school
Adapted from Henderson AL, Mapp KT. A New Wave of Evidence: The Impact of School, Family, and Community Connections on Student Achievement. 2002
Strategies for Family and Community Involvement
3. Listen, Respect, and Engage Make families and community members feel welcomed;
engage them in developing trusting and respectful relationships
Take families’ interests and needs into consideration when planning activities
Work with families to build their social and political connections
3. Listen, Respect, and Engage Make families and community members feel welcomed;
engage them in developing trusting and respectful relationships
Take families’ interests and needs into consideration when planning activities
Work with families to build their social and political connections
Source: Henderson AL, Mapp KT. A New Wave of Evidence: The Impact of School, Family, and Community Connections on Student Achievement. 2002.
Summary
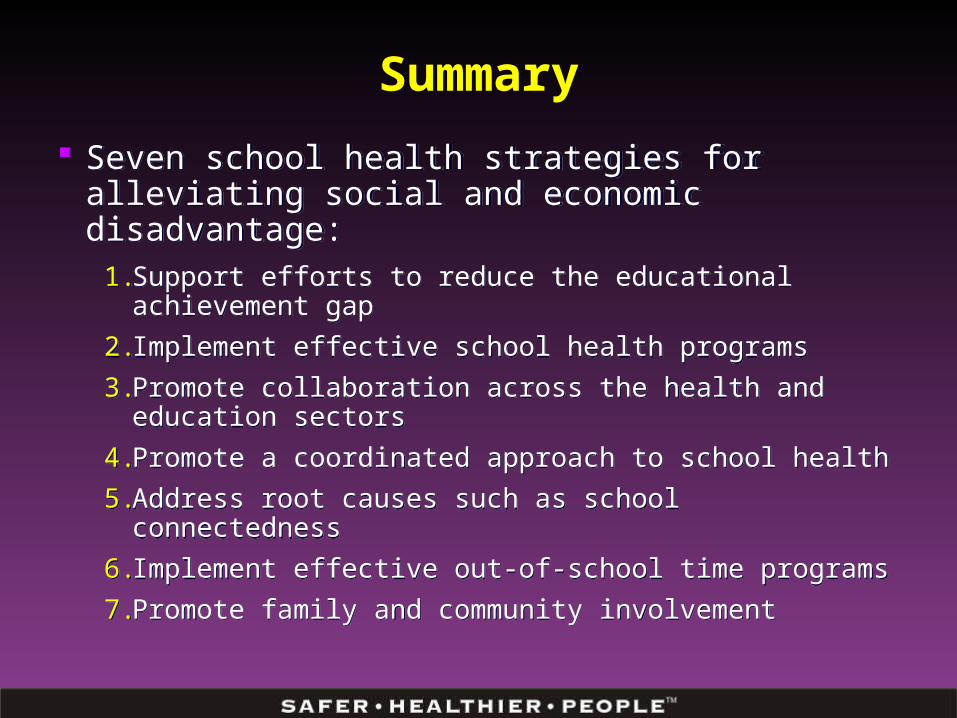
Seven school health strategies for alleviating social and economic disadvantage:
1. Support efforts to reduce the educational achievement gap
2. Implement effective school health programs
3. Promote collaboration across the health and education sectors
4. Promote a coordinated approach to school health
5. Address root causes such as school connectedness
6. Implement effective out-of-school time programs
7. Promote family and community involvement
The Role of Schools in Alleviating Social and Economic Disadvantage:
Students In Low Income CommunitiesWithin High Income Countries
The Role of Schools in Alleviating Social and Economic Disadvantage:
Students In Low Income CommunitiesWithin High Income Countries
Howell Wechsler, Ed.D., MPH
Diane Allensworth, PhD
Carolyn Fisher, Ed.D.
Howell Wechsler, Ed.D., MPH
Diane Allensworth, PhD
Carolyn Fisher, Ed.D.